

Adrenal Masses:Adrenal Masses: How Imaging Plays a Vital Role How Imaging Plays a Vital Role
in Diagnosisin DiagnosisAya Michaels, HMS IV
Dr. Gillian Lieberman
Advanced Clerkship in Radiology BIDMC
June 21, 2010

Agenda
o
Introduction to Our Patiento
Menu of Radiologic Tests
o
Differential Diagnosiso
Our Patient’s Diagnosis
o
Our Patient Revisitedo
Summary
Agenda
o
Introduction to Our Patiento
Menu of Radiologic Tests
o
Differential Diagnosiso
Our Patient’s Diagnosis
o
Our Patient Revisitedo
Summary

Introduction to Our Patient: H&P
•
HPI:–
43-year old man with 3 months intermittent palpitations and head ache. 3 wks of “chest burning.”
•
PMH:–
None
•
SHx:–
Recently immigrated from Cape Verde. No smoking/drinking/illicit drug use.
•
Hospital Course:–
Exercise MIBI done that showed normal perfusion and LVEF of 65%.
–
Thiamine deficient: CP thought to be due to high-output HF 2/2 wet beriberi.
–
CXR read as normal.

Introduction to Our Patient: Frontal CXR
On presentation 5-months later
PACS, BIDMC
2 PA Chest Radiographs. Ill-defined density in RUQ.

Introduction to Our Patient: Ultrasound
PACS, BIDMC
Transverse Section of Adrenal Mass Sagittal
Section of Adrenal Mass
Soft tissue component in periphery with similar echogenicity of liver
Hyperechoic central component with posterior shadowing
** ***
* * *

Introduction to Our Patient: Doppler Ultrasound
Doppler Ultrasound Transverse Section of Adrenal Mass
PACS, BIDMC
Hypervascular soft tissue component
Decreased blood flow in center, corresponding to calcification and necrosis

Differential for Adrenal Masses
•
Adrenal Adenoma•
Metastatic Lesion
•
Adrenal Carcinoma•
Myelolipoma
•
Pheochromocytoma•
Hematoma
•
Lymphoma •
Cyst

Introduction to Our Patient: Lab Work-Up
•
Referred to cardiology for CP and palpitations.
•
24-hour urine collection for fractionated metanephrines
and catecholamines
–
METANEPHRINES 92 26-230 UG/24 HRS–
NORMETANEPHRINES 14005
H 44-540 UG/24 HRS–
EPINEPHRINE 25
H 2-24 UG/24 HRS–
NOREPINEPHRINE 3410
H 15-100 UG/24 HRS–
DOPAMINE 592
H 52-480 UG/24 HRS
•
Very suspicious for pheochromocytoma.
Next Step…
IMAGING
Agenda
o
Introduction to Our Patiento
Menu of Radiologic Tests
o
Differential Diagnosiso
Our Patient’s Diagnosis
o
Our Patient Revisitedo
Summary
Agenda
o
Introduction to Our Patiento
Menu of Radiologic Tests
o
Differential Diagnosiso
Our Patient’s Diagnosis
o
Our Patient Revisitedo
Summary
Menu of Radiologic Tests: MRI•T1/T2 WI characteristics•Chemical Shift Imaging

MRI –
T1/T2 WI characteristics
Fat-abundant lesions will be bright on T1 WI Fluid-abundant lesions will be bright on T2 (mets, pheo)

Our Patient: T2-W Coronal MRI
PACS, BIDMC
Coronal T2-Weighted Image of Abdomen and Pelvis
Heterogenous mass withhyperintense periphery, relative to skeletal muscle and hypointensecentral region.
Hypointense regions isointenseto cortex of bone.
Fat planes are preservedbetween the mass and both the liver and kidney.
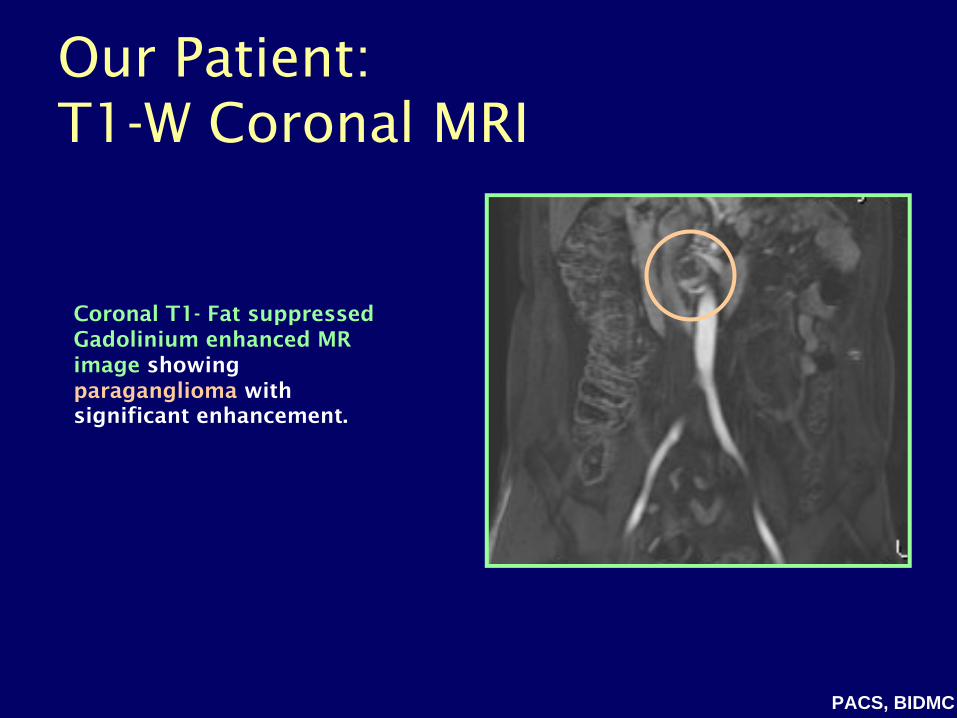
Our Patient: T1-W Coronal MRI
PACS, BIDMC
Coronal T1-
Fat suppressed Gadolinium enhanced MR image
showing
paraganglioma
with significant enhancement.

MRI: Chemical Shift Imaging
More sensitive than T1/T2 characteristicsExploits difference in behavior of lipid and water protons when subjected to magnetic field In phase - addition of signal intensities (SI) from lipid and water protons contained within the same voxelOpposed phase - destructive signal intensities Loss of SI within adrenal mass on an opposed phase image when compared with in-phase image indicates presence of intracellular lipidsIndia Ink Artifact – dark line indicative of fat-fluid interface when macroscopic fat is present
Siegelman, 2004

Our Patient: Axial T1-W In/Out-of-Phase MRI
T1-Weighted axial image of abdomen, in-phase
No change in signal intensity between in/out-of-phase images.
No India Ink artifact within mass. (Seen between mass and fat plane in out-of-phase).
PACS, BIDMC
T1-Weighted axial image of abdomen, out-of-phase

Menu of Radiologic Tests: CT
•Non-Enhanced CT•Delayed Contrast-Enhanced CT
CT: Non-Enhanced
Can detect lipid content of mass using HUFat approx -30 to -100 HU<10 HU diagnostic of adrenal adenoma
71% Sensitivity 98% Specificity
Blake, et al. AJR 2010
CT: Delayed Contrast-Enhanced
Performed in portal venous phase of enhancement (60-80 secs after start of administration)Many masses enhance early; however, can characterize mass by percentage of washout of contrast after certain period of time> 40% washout of contrast after 15 min is diagnostic of an adenomaSimilar patterns seen with gadolinium enhancement in MRI
In Our Patient, a CT scan was performed, however, for a different
complaint: abdominal pain.
Thus adrenal protocol imaging was not done. However, his scans do show some
interesting findings…

Our Patient: Coronal and Sagittal
CT
PACS, BIDMC
In bone window, attenuation within mass corresponds to that of cortical bone.
Mass bordering aorta. Corresponds to paraganglioma along sympathetic chain that runs besides aorta.
CECT, Coronal Section of Abd/Pelvis CECT, Sagittal
Section of Abd/Pelvis

Menu of Radiologic Tests: Nuclear Imaging
• MIBG (iodine-131-meta iodobenzylguanidine)

Nuclear Imaging: MIBG
NE analogWhole-body imaging after 24-72 hours after administrationIncreased uptake in pheochromocytomas and paragangliomas.
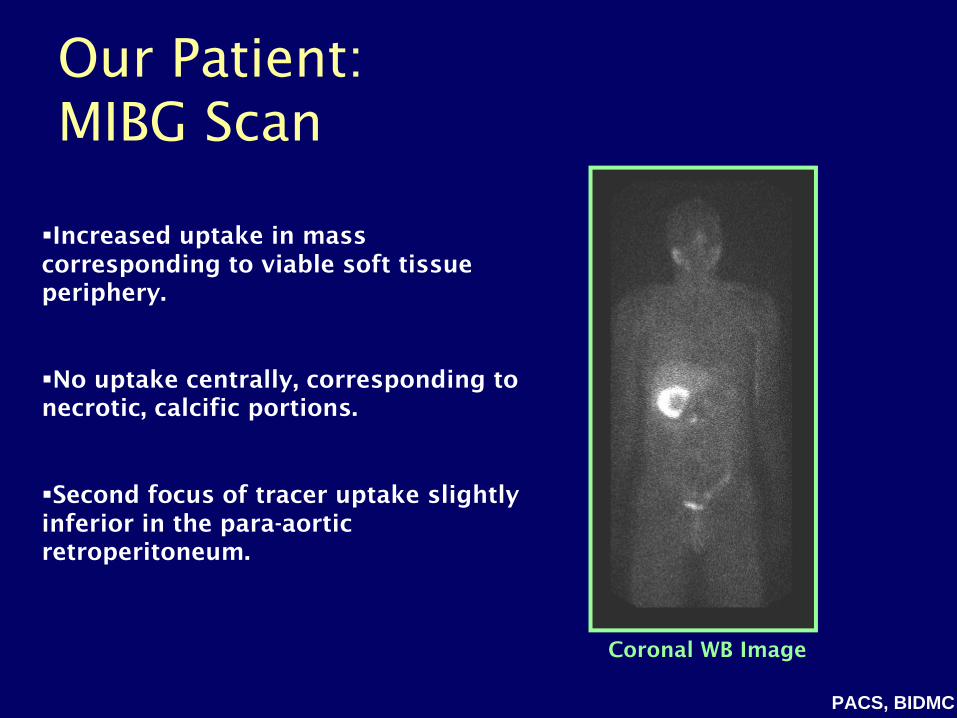
Our Patient: MIBG Scan
PACS, BIDMC
Coronal WB Image
Increased uptake in mass corresponding to viable soft tissue periphery.
No uptake centrally, corresponding to necrotic, calcific portions.
Second focus of tracer uptake slightly inferior in the para-aortic retroperitoneum.

Agenda
o
Introduction to Our Patient o
Menu of Radiologic Tests
o
Differential Diagnosiso
Our Patient’s Diagnosis
o
Our Patient Revisitedo
Summary

Agenda
o
Introduction to Our Patient o
Menu of Radiologic Tests
o
Differential Diagnosiso
Our Patient’s Diagnosis
o
Our Patient Revisitedo
Summary
While our patient had findings very indicative of pheochromocytoma, let’s discuss some other types of adrenal
masses mentioned in our first differential…
Differential Diagnosis of Adrenal Masses
•
Adrenal Adenoma
•
Metastatic Lesion
•
Adrenal Carcinoma
•
Myelolipoma

Companion Patient 1: Adrenal Adenoma on CT C-
Lesion: Small (<2cm), homogeneous, no growth, smooth margins.CT: Low attenuation on non-enhanced (<10 HU). Relative % washout >40.MRI: Loss of signal in CSI
NECT, axial image; Left Adrenal Mass -
4 HU
Mayo-Smith et al. RadioGraphics 2001
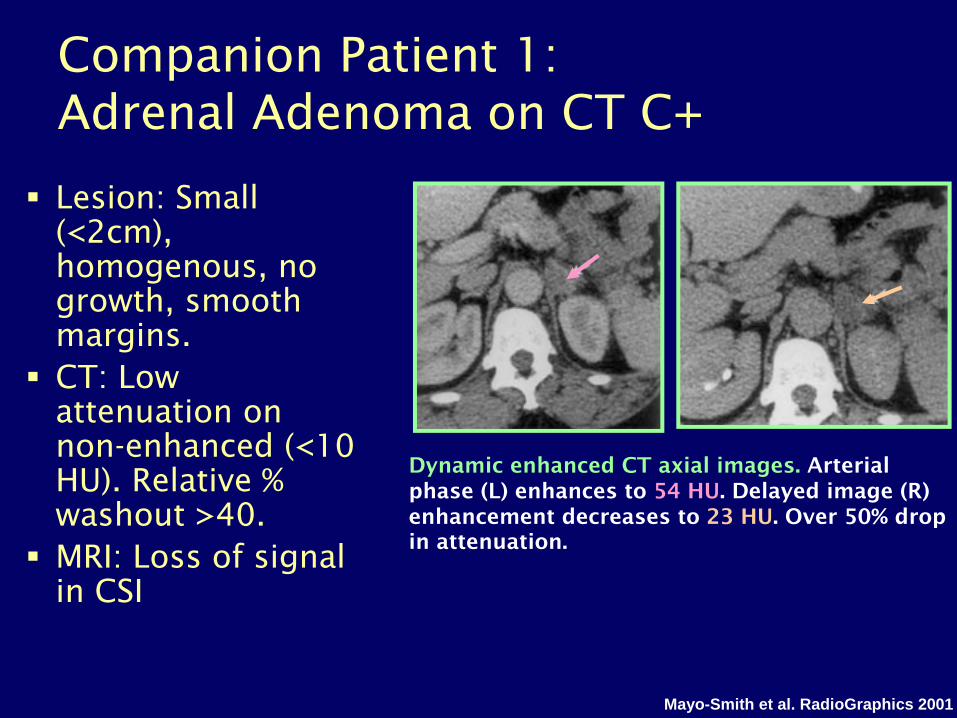
Companion Patient 1: Adrenal Adenoma on CT C+
Dynamic enhanced CT axial images.
Arterial phase (L) enhances to 54 HU. Delayed image (R) enhancement decreases to 23 HU. Over 50% drop in attenuation.
Lesion: Small (<2cm), homogenous, no growth, smooth margins.CT: Low attenuation on non-enhanced (<10 HU). Relative % washout >40.MRI: Loss of signal in CSI
Mayo-Smith et al. RadioGraphics 2001

Companion Patient 2: Adrenal Adenoma on MRI
T1-W in-phase (up)
and T1-W out-of-phase (down)
axial MR images shows
signal drop-off.
Lesion: Small (<2cm), homogenous, no growth, smooth margins.CT: Low attenuation on non-enhanced (<10 HU). Relative % washout >40.MRI: Loss of signal in CSI
Mayo-Smith et al. RadioGraphics 2001

Companion Patient 3: Metastatic Lesion on CT C+
Boland et al. Radiology 2008
CECT scan, axial image
of 5.8-cm irregular, heterogeneous R adrenal metastasis
invading the liver
Lesions: >4cm, heterogeneous, + growth, irregular borders.CT: >10 HU. Relative % Washout <40.MRI: High SI on T2 WI. No signal drop out on CSI.

Companion Patient 4: Metastatic Lesion on MRI
T1-W in-phase (up) and out-of-phase (bottom) axial MR images
of adrenal metastases. T1-W in-phase image: mass of similar SI as spleen. Unchanged SI
in out-of phase image
Lesions: >4cm, heterogeneous, + growth, irregular borders.CT: >10 HU. Relative % Washout <40.MRI: High SI on T2 WI. No signal drop out on CSI.
Boland et al. Radiology 2008

Companion Patient 5: Adrenal Cell Carcinoma on CT C+/-
Lesion: 4-10cm, heterogeneous. Can have central necrosis, hemorrhage, and calcification.CT: >10 HU. Relative % Washout <40.MRI: No signal drop out on CSI. T1 hypointense. T2 hyperintense
Axial CT scans
of R adrenal carcinoma with
central necrosis
and calcification
Unenhanced 40 HU
Delayed CECT 70 HU
Dynamic CECT 81 HU
Boland et al. Radiology 2008

Companion Patient 5: Myelolipoma
on CT C-
Blake et al. AJR, 2010
Axial CT image
showing heterogeneous mass of L adrenal containing areas of macroscopic fat with low attenuation.
Lesion: Benign, echogenic at USCT: Low attenuation (-30 to -100 HU)MRI: Hyperintenseon T1 WI. Focal areas of signal loss on out-of-phase imaging. India ink artifact surrounding macroscopic fat.
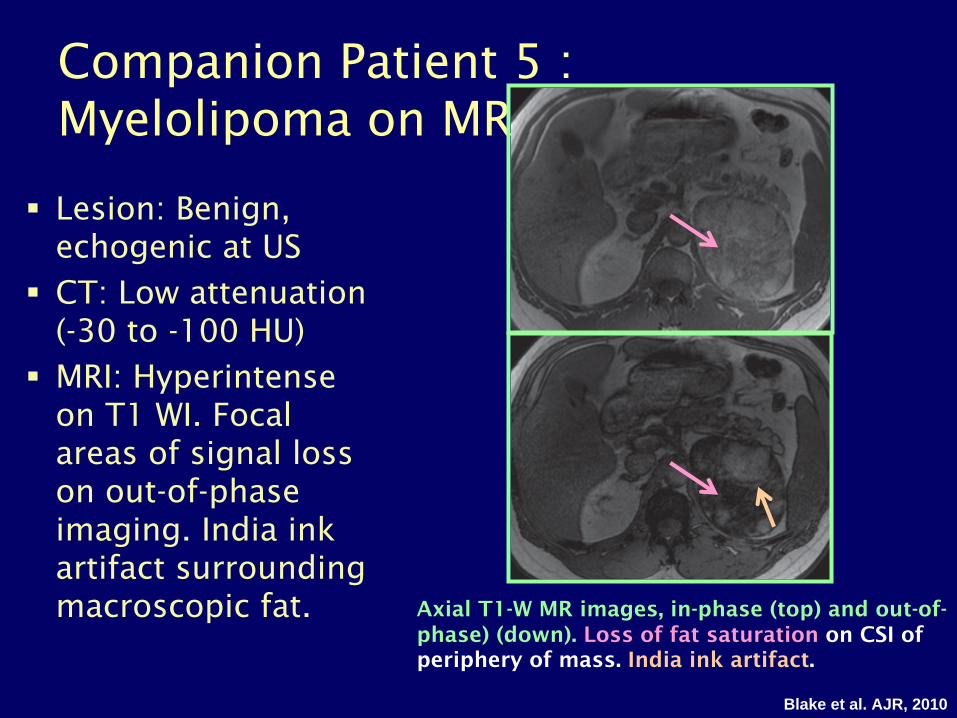
Companion Patient 5 : Myelolipoma
on MRI
Lesion: Benign, echogenic at USCT: Low attenuation (-30 to -100 HU)MRI: Hyperintenseon T1 WI. Focal areas of signal loss on out-of-phase imaging. India ink artifact surrounding macroscopic fat. Axial T1-W MR images, in-phase (top) and out-of-
phase) (down).
Loss of fat saturation
on CSI of periphery of mass. India ink artifact.
Blake et al. AJR, 2010

Agenda
o
Introduction to Our Patiento
Menu of Radiologic Tests
o
Differential Diagnosiso
Our Patient’s Diagnosis
o
Our Patient Revisitedo
Summary

Agenda
o
Introduction to Our Patiento
Menu of Radiologic Tests
o
Differential Diagnosiso
Our Patient’s Diagnosis
o
Our Patient Revisitedo
Summary

Agenda
o
Introduction to Our Patiento
Menu of Radiologic Tests
o
Differential Diagnosiso
Pheochromocytoma
o
Our Patient Revisitedo
Summary

Pheochromocytoma: Background
•
Catecholamine-secreting tumor arising from chromaffin
cells of adrenal medulla or extra-
adrenal ectopic tissue (paraganglioma)•
Clinical symptoms: Headache, Sweating, Tachycardia
•
Part of syndromes: MEN IIa/b, NF, VHL, Sturge Weber
•
Rule of 10’s•
Can be difficult to characterize on imaging
Young, NEJM 2007

Let us now discuss the typical imaging findings of
pheochromocytomas
using images from another BIDMC
patient…
Pheochromocytoma: Imaging Findings -
General Features
•
Smooth, solid, round, hypervascular•
Atypical lesions can have macroscopic fat, calcifications, hemorrhage and necrosis
•
Growth 0.5-1cm/year
Boland, Radiology 2008

Companion Patient 6: Pheochromocytoma
on CT C-
Increased attenuation (most >25 HU) on NECT.
PACS, BIDMC
Axial NECT image.
23 HU
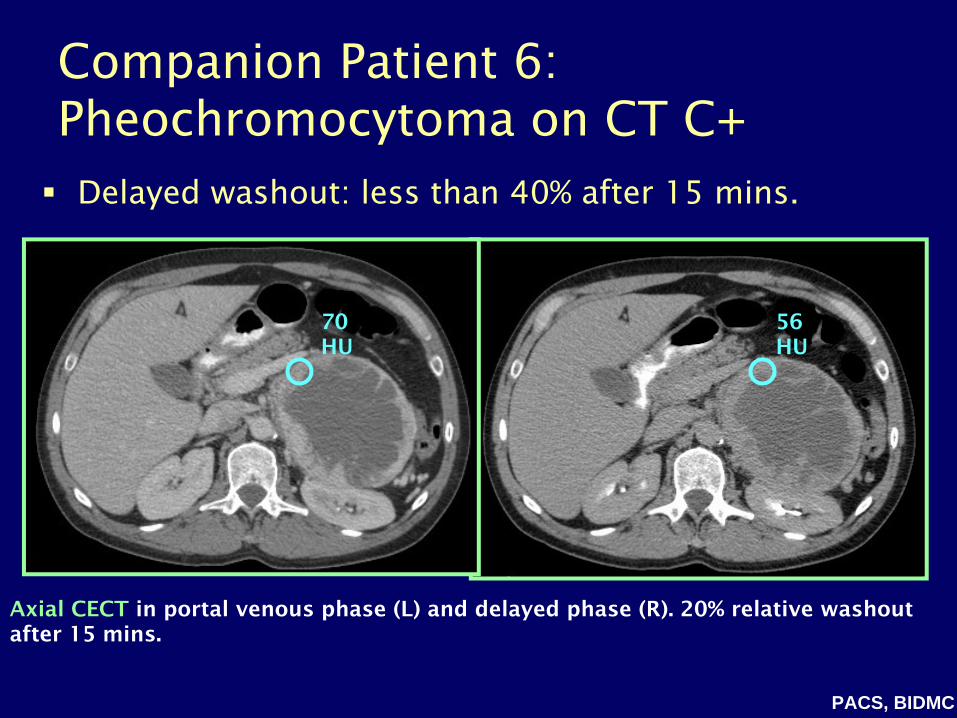
Companion Patient 6: Pheochromocytoma
on CT C+
Delayed washout: less than 40% after 15 mins.
PACS, BIDMC
Axial CECT
in portal venous phase (L) and delayed phase (R). 20% relative washout after 15 mins.
56 HU
80 HU
70 HU

Companion Patient 6: Pheochromocytoma
on MRI
Coronal T2-W MR image (L) and axial T2-W enhanced MR image (R).
Mass has heterogeneous high signal intensity on T2 WI
and
salt and pepper enhancement.
PACS, BIDMC
High SI on T2-WI – “Light-bulb sign” (70%)
“Salt and Pepper” Enhancement (pepper = tumor vessel punctate signal voids; salt = brightly enhancing background)

Companion Patient 6: Pheochromocytoma
on CSI MRI
•
No signal drop-out CSI
Axial T1 W MR in-phase (L) and out-of-phase (R) images. No loss of signal intensity. No India Ink artifact in out-of-phase image.
PACS, BIDMC

Companion Patient 6: Pheochromocytoma
on MIBG
90-100% specificity, 80-90% sensitivity.
Good for localizing / confirming pheo or to exclude metastatic lesions.
Coronal whole body image. Mass brightly enhances at outer portion.
PACS, BIDMC
Agenda
o
Introduction to Our Patiento
Menu of Radiologic Tests
o
Differential Diagnosiso
Pheochromocytoma
o
Our Patient Revisitedo
Summary

Agenda
o
Introduction to Our Patiento
Menu of Radiologic Tests
o
Differential Diagnosiso
Pheochromocytoma
o
Our Patient Revisitedo
Summary
To summarize his clinical course…

Our Patient Revisited
•
Patient had R Adrenalectomy
and excision of retroperitoneal paraganglioma
•
Pathology revealed–
Pheochromocytoma
•
9.8 cm•
Necrotic center•
Chromaffin-1 type tissue
–
Paraganglioma
•
2.5 cm•
Chromaffin-1 type tissue

Agenda
o
Introduction to Our Patient o
Menu of Radiologic Tests
o
Differential Diagnosiso
Pheochromocytoma
o
Our Patient Revisitedo
Summary
Agenda
o
Introduction to Our Patiento
Menu of Radiologic Tests
o
Differential Diagnosiso
Pheochromocytoma
o
Our Patient Revisitedo
Summary

Summary•
Imaging tests for adrenal imaging exploit 3 physiologic principles:–
1. intracellular lipid concentration –
2. perfusion differences –
3. metabolic activity
•
Imaging Recommendations:–
Helical NE + CECT–
MR and T1 CSI–
MIBG
•
DDX includes adenoma, mets, ACC, and myelolipoma
•
Pheochromocytomas–
Can vary in radiographic appearance, but typically highly enhancing on T2 WI and no loss of SI on CSI
–
Must correlate with clinical picture

ReferencesYoung WF Jr. The incidentally discovered adrenal mass. N Engl J Med 2007;356: 601-610Mayo-Smith WW, Boland GW, Noto RB, et al. State-of-the-art adrenal imaging. RadioGraphics 2001;
21:995-1012.Boland GW, Blake MA, Hahn PF, et al. Incidental Adrenal Lesions: Principals, Techniques, and
Algorithms for Imaging Characterization. Radiology 2008;249:756-775Blake MA, Kalra MK, Maher MM, et al. Pheochromocytoma: An Imaging Chameleon. RadioGraphics
2004;24:S87-S99.Blake MA, Cronin CG, Boland GW. Adrenal Imaging. AJR 2010;194:1450-1460.Meyer-Rochow GY, Schembri GPO, Benn DE. The Utility of MIGB SPECT/CT for the Diagnosis of
Pheochromocytoma. Ann Surg Oncol 2010;17;392-400.Siegelman E. Body MRI. Saunders: ed.1 Dec 2004. Favia G, Lumachi F, Basso S, et al. Management of incidentally discovered adrenal masses and risk
of malignancy. Surgery 2000; 128:910-924.Barry MK, van Heerden JA, Farley DR, et al. Can Adrenal Incidentalomas be Safely Observed? World
J Surg 1998; 22: 599-604. Outwater EK, Siegelman ES, Radecki PD. Distinction Between Benign and Malignant Adrenal
Masses: Value of T1-Weighted Chemical-Shift MR Imaging. AJR 1995; 165: 579-583.Song JH, Chaudhry FS, Mayo-Smith WW. The Incidental Indeterminate Adrenal Mass on CT (>10HU)
in Patients Without Cancer: Is Further Imaging Necessary? Follow-up of 321 Consecutive Indeterminate Adrenal Masses. AJR 2007; 189: 1119-1123.
NIH State-of-the-Science Statement on Management of the clinically unapparent adrenal mass (“incidentaloma”). NIH Consens State Sci Statements. 2002 Feb 4-6; 19(2) 1-23.
My.statdx.com

Acknowledgements
Gillian B. Lieberman, MDMichael Powell, MDAarti Sekhar, MDJohannes Roedl, MDJustin Kung, MDMaria LevantakisKapil VermaSebastian Darr


