
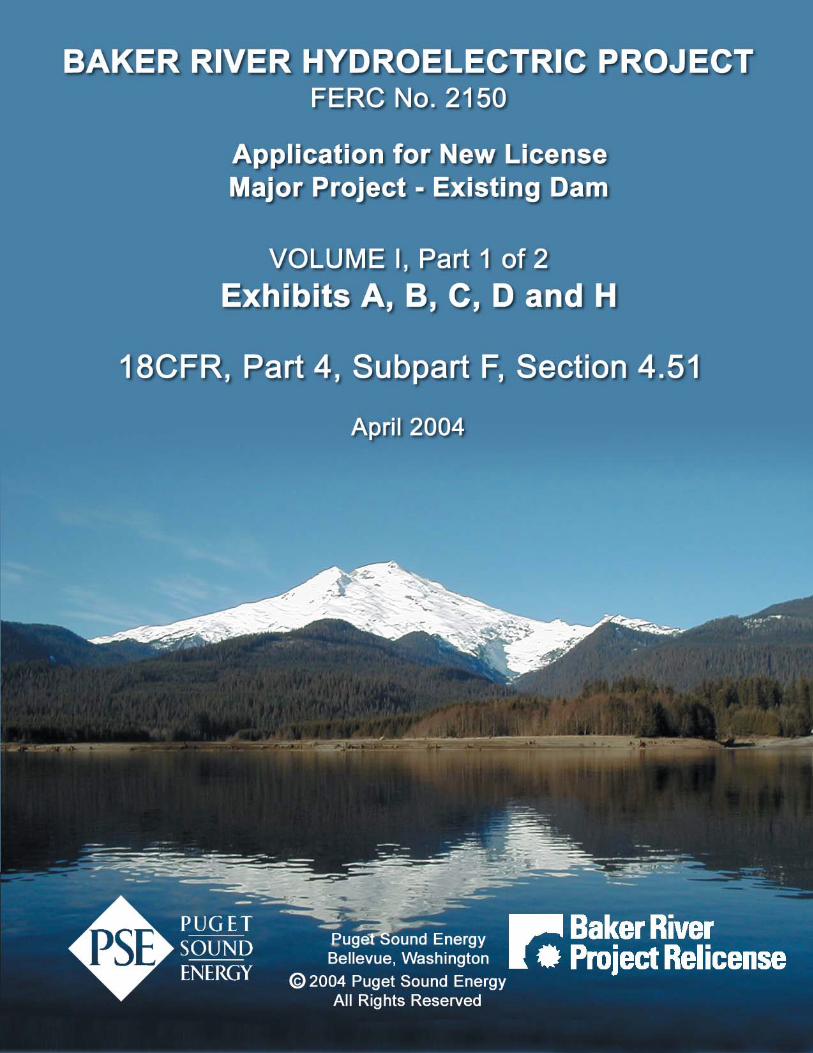

BAKER RIVER HYDROELECTRIC PROJECT
FERC No. 2150
Application for New LicenseMajor Project—Existing Dam
VOLUME I , Part 1 of 2
Exhibits A, B, C, D and H
18 CFR, Part 4, Subpart F, Section 4.51
April 2004
Puget Sound EnergyBellevue, Washington
©2004 Puget Sound EnergyAll rights reserved.

Puget Sound Energy Initial StatementBaker River Project, FERC No. 2150 iii April 2004
UNITED STATES OF AMERICABEFORE THE
FEDERAL ENERGY REGULATORY COMMISSION
PUGET SOUND ENERGYFERC Project No. 2150
APPLICATION FOR NEW LICENSE FOR MAJOR PROJECT—EXISTING DAM
18 CFR, PART 4, SUBPART F, SECTION 4.51
INITIAL STATEMENT
(1) Puget Sound Energy, Inc. (Puget or Applicant), a corporation under the laws of the stateof Washington and having its executive offices and principal place of business inBellevue, Washington, applies to the Federal Energy Regulatory Commission (FERC orCommission) for a new license for the Baker River Hydroelectric Project (Project) asdescribed in the attached exhibits. The Project is currently designated as Project No.2150. The Applicant’s existing license for the Project expires on April 30, 2006.
The following license application has been prepared in accordance with Chapter 18 of theCode of Federal Regulations (CFR) Sections 4.32, 4.34, 4.51, 16.8, and 16.10
(2) The location of the Project is:
State: WashingtonCounties: Skagit
WhatcomNearby Town: ConcreteStream: Baker River
(3) The exact name and business address of the Applicant are:
Puget Sound Energy, Inc.10885 N.E. 4th StreetBellevue, WA 98004-5591(425) 454-6363

Puget Sound Energy Initial StatementBaker River Project, FERC No. 2150 iv April 2004
The exact name and business address of each person authorized to act as agent for theApplicant in this application are:
Agent: Connie FreelandLicensing Program ManagerPuget Sound Energy, Inc.P.O. Box 97034 PSE-09SBellevue, WA 98009-9734
Applicant also requests that copies of all communications regarding the application besent to:
Kendall FisherCorporate CounselPuget Sound Energy, Inc.P.O. Box 97034 PSE-11SBellevue, WA 98009-9734
Pamela KruegerPerkins Coie LLP10885 N.E. 4th Street, Suite 700Bellevue, WA 98004-5579
(4) The Applicant is a domestic corporation organized under the laws of the state ofWashington and is not claiming preference under Section 7(a) of the Federal Power Act.
(5)(i) The statutory or regulatory requirements of the state of Washington, in which the Projectis located, that affect the Project with respect to bed and banks and to the appropriation,diversion, and use of water for power purposes, and with respect to the right to engage inthe business of developing, transmitting, and distributing power and in any other businessnecessary to accomplish the purposes of the license under the Federal Power Act, are:
• Chapter 90.03, Revised Codes of Washington, governs the appropriation, diversion,and use of water for hydropower generation.
• Sections 90.16.050, 90.16.060, and 90.16.090 of the Revised Codes of Washingtonempower the Washington Department of Ecology (WDOE) to assess a powerproduction license fee.
• Public Law 92-500, Public Law 95-217, Revised Code of Washington 90.48, andWashington Administrative Codes 173.201 and 173.225 define the requirements ofWater Quality Certification.
Chapter 80.01.040, Revised Codes of Washington, empowers the WashingtonUtilities and Transportation Commission to regulate in the public interest the rates,services, facilities, and practices of all persons engaging in the supply of any utility

Puget Sound Energy Initial StatementBaker River Project, FERC No. 2150 v April 2004
service or commodity to the public for compensation, including electricalcompanies.
(ii) Puget is an electric utility organized under the laws of the state of Washington, in goodstanding with the Washington Secretary of State’s Office, authorized to develop,transmit, and distribute power within its service territory in the state of Washington, andhas taken or plans to take the steps described below to comply with each of the citedlaws.
Puget has been authorized by the Washington State Utilities Commission, under DocketNumbers UE-011570 and UG-011571, to provide electric service under Electric Tariff Gin Island, Jefferson, Kitsap, King, Pierce, Skagit, Thurston, Whatcom, and Kittitascounties.
Puget operates the Project under water rights permits issued by the state of Washington.Lake Shannon, the reservoir for the Lower Baker Development, is operated underreservoir permits R-24, issued April 30, 1926, for 50,000 acre-feet of storage and R-44,issued May 9, 1931, for 140,000 acre-feet of storage. Baker Lake, the reservoir for theUpper Baker Development, is operated under reservoir permit R-202, issued October 13,1955, for 298,000 acre-feet of storage.
Hydroelectric water withdrawals occur under permits S-413, issued November 25, 1925,for 4,000 cubic feet per second (cfs); S-10310, issued July 16, 1956, for 4,300 cfs;S-10988, issued May 19, 1958, for 500 cfs; and S-10989, issued May 19, 1958, for2,000 cfs. In addition to these rights, Puget also has been issued water rights for fishpropagation for both Channel Creek (Upper Baker spawning beaches) and SulphurSprings (Sulphur Creek spawning beaches and rearing pond) and fordomestic/campground/irrigation at Upper Baker dam.
An entity claiming the right to use water for power development is required to pay anannual power license fee to the state of Washington. Puget currently pays this annual feeand will continue to do so while appropriating water for power generation.
Puget will request a Water Quality Certification from WDOE to cover the term of a newlicense for the Project, as required by applicable law.
(6) The owner of all existing Project facilities is:
Puget Sound Energy, Inc.10885 N.E. 4th StreetBellevue, WA 98004-5591(425) 454-6363
The following information is submitted as part of this Application for New License for MajorProject—Existing Dam for the Project pursuant to the requirements of 18 CFR § 4.32:
(7) To the best of Puget’s knowledge, no person, citizen, association of citizens, domesticcorporation, municipality, or state other than the Applicant has, or intends to maintain,any proprietary rights necessary to operate and maintain the existing Project.

Puget Sound Energy Initial StatementBaker River Project, FERC No. 2150 vi April 2004
(8)(i) The names and mailing addresses for every county in which any part of the Project islocated, and for any federal facilities that are to be used by the Project, are:
Skagit County Whatcom County700 S. Second Street 322 N. Commercial StreetMt. Vernon, WA 98273 Bellingham, WA 98225
The Project does not involve the use of any federal facility.
(ii) Approximately 130 acres of the Lower Baker Development are located within the limitsof the town of Concrete. Concrete, with a population of about 800, lies 1 mile south ofthe Lower Baker Development dam. There is no city, town, or similar local politicalsubdivision that has a population of 5,000 or more people located within 15 miles of theProject dams.
(iii) No part of the Project is located within any irrigation district, drainage district, or similarspecial purpose political subdivision. No irrigation district, drainage district, or similarspecial purpose political subdivision owns, operates, maintains, or uses any Projectfacilities.
(iv) The names and addresses of every other political subdivision in the general area of theProject, that there is reason to believe are interested in or affected by this application, are:
U.S. Army Corps of Engineers U.S. Department of AgricultureP.O. Box 3755 U.S. Forest ServiceSeattle, WA 98124-3755 1734 Federal Building
1220 S.W. 3rd AvenuePortland, OR 97204-2825
U.S. Department of the Interior U.S. Department of Commerce500 N.E. Multnomah Street NOAA FisheriesPortland, OR 97232-2036 525 N.E. Oregon Street
Portland, OR 97232-2778
Office of the Attorney General Town of ConcreteState of Washington 45672 Main StreetP.O. Box 40100 Concrete, WA 98237Olympia, WA 98504-0100
Town of Hamilton Town of Lyman584 Maple Street 8334 South MainHamilton, WA 98255 Lyman, WA 98263
City of Sedro-Woolley City of Burlington720 Murdock Street 900 E. Fairhaven AvenueSedro-Woolley, WA 98284 Burlington, WA 98233-1945
Town of La Conner City of Mount Vernon2nd & Douglas 910 Cleveland AvenueLaConner, WA 98257 Mt. Vernon, WA 98273

Puget Sound Energy Initial StatementBaker River Project, FERC No. 2150 vii April 2004
(v) The names and mailing addresses of Indian Tribes that may be affected by the Projectand that are actively involved in the relicensing process through participation in theCultural and Historical Resources Working Group or the Baker Solution Team, or thatexpress a continued interest in the relicensing activities are:
Upper Skagit Indian Tribe Sauk-Suiattle Indian Tribe25944 Community Plaza 5318 Chief Brown LaneSedro-Woolley, WA 98284 Darrington, WA 98241
Swinomish Indian Tribal CommunityP.O. Box 817LaConner, WA 98257
Puget contacted four other Tribes by letter and telephone that were thought to potentiallyhave an interest in the Project. Although this contact occurred at the initiation of therelicensing activities and these Tribes either elected not to participate in the process or didnot respond, Puget has retained them on the general Project mailing list. These Tribes are:
Lummi Nation Nlaka’Pamux Nation Tribal Council2616 Kwina Road P.O. Box 430Bellingham, WA 98226-9298 Lytton, B.C. V0K 1Z0
Nooksack Indian Tribal Council Samish NationP.O. Box 157 P.O. Box 217Deming, WA 98244 Anacortes, WA 98221
(9) The following exhibits are filed as part of this Application for New License for MajorProject—Existing Dam:
Exhibit A—Description of the Project
Exhibit B—Project Operation and Resource Utilization
Exhibit C—Construction History and Proposed Construction Schedule
Exhibit D—Original Project Costs and Financing
Exhibit E—Environmental Report1
Exhibit F—General Design Drawings2
Exhibit G—Maps of the Project2
Exhibit H—General Information
1 The environmental report is titled the Baker River Hydroelectric Project, FERC No. 2150, Applicant-Prepared Preliminary Draft Environmental Assessment and was prepared in compliance with theCommission’s regulations for an alternative licensing process under 18 CFR § 4.34(i). The Applicant-Prepared Preliminary Draft Environmental Assessment (PDEA) is submitted under separate cover.
2 The contents of these exhibits are considered non-public under Commission Order No. 630, CriticalEnergy Infrastructure Information.


Puget Sound Energy Initial StatementBaker River Project, FERC No. 2150 x April 2004
This page intentionally left blank.

Puget Sound Energy Table of ContentsBaker River Project, FERC No. 2150 xi April 2004
TABLE OF CONTENTS
LIST OF TABLES .................................................................................................................... xvii
LIST OF FIGURES ................................................................................................................... xix
ACRONYMS AND ABBREVIATIONS.................................................................................. xxi
EXHIBIT A—DESCRIPTION OF THE PROJECT ............................................................ A-1A.1 General Description and Location of the Baker River Project.............................. A-1A.2 Lower Baker River Development ......................................................................... A-1
A.2.1 Physical Composition, Dimension, and Configuration of ExistingStructures ................................................................................................ A-1A.2.1.1 Dam....................................................................................... A-1A.2.1.2 Power Intake and Pressure Tunnel........................................ A-2A.2.1.3 Powerhouse ........................................................................... A-2A.2.1.4 Fish Facilities ........................................................................ A-2
A.2.2 Lower Baker Reservoir ........................................................................... A-3A.2.3 Turbine Generator................................................................................... A-3A.2.4 Primary Transmission ............................................................................. A-4A.2.5 Appurtenant Mechanical, Electrical, and Transmission Equipment....... A-4A.2.6 Proposed New Structures and Facilities ................................................. A-4
A.2.6.1 Auxiliary Powerhouse........................................................... A-4A.2.6.2 Turbine Generator................................................................. A-4A.2.6.3 Appurtenant Mechanical, Electrical, and Transmission
Equipment ............................................................................. A-5A.3 Upper Baker River Development .......................................................................... A-5
A.3.1 Physical Composition, Dimension, and Configuration of ExistingStructures ................................................................................................ A-5A.3.1.1 Dam....................................................................................... A-5A.3.1.2 Dike....................................................................................... A-5A.3.1.3 Depression Lake and Water Recovery Pumps...................... A-5A.3.1.4 Powerhouse ........................................................................... A-6A.3.1.5 Fish Facilities ........................................................................ A-6
A.3.2 Upper Baker Reservoir ........................................................................... A-7A.3.3 Turbine Generator................................................................................... A-7A.3.4 Primary Transmission ............................................................................. A-7A.3.5 Appurtenant Mechanical, Electrical, and Transmission Equipment....... A-8A.3.6 Proposed New Structures and Facilities ................................................. A-8
A.4 Federal Lands Within the Project Boundary ......................................................... A-8

Puget Sound Energy Table of ContentsBaker River Project, FERC No. 2150 xii April 2004
Page
EXHIBIT B—PROJECT OPERATIONS AND RESOURCE UTILIZATION..................B-1B.1 Project Operations ..................................................................................................B-1
B.1.1 Plant Supervision .....................................................................................B-1B.1.2 Estimated Annual Plant Factor ................................................................B-1B.1.3 Operation During Adverse, Normal, and High Water Years...................B-1
B.2 Project Capacity and Production ............................................................................B-3B.2.1 Dependable Capacity ...............................................................................B-3B.2.2 Annual Generation ...................................................................................B-3B.2.3 Flow Data and Flow Duration Curves .....................................................B-4
B.2.3.1 Lower Baker Development ................................................... B-4B.2.3.2 Upper Baker Development ................................................... B-5
B.2.4 Reservoir Operation Curves.....................................................................B-5B.2.4.1 Lower Baker Development ................................................... B-5B.2.4.2 Upper Baker Development ................................................... B-7
B.2.5 Hydraulic Capacity ..................................................................................B-8B.2.5.1 Lower Baker Development ................................................... B-8B.2.5.2 Upper Baker Development ................................................... B-8
B.2.6 Tailwater Rating Curve............................................................................B-8B.2.6.1 Lower Baker Development ................................................... B-8B.2.6.2 Upper Baker Development ................................................... B-9
B.2.7 Power Plant Capacity versus Head Curve ...............................................B-9B.2.7.1 Lower Baker Development ................................................... B-9B.2.7.2 Upper Baker Development ................................................... B-9
B.3 Power Usage.........................................................................................................B-12B.4 Future Development .............................................................................................B-12B.5 Literature Cited ....................................................................................................B-12
Appendix B-1 Monthly Flow Duration Curves for the Lower Baker Development ...............B-13Appendix B-2 Monthly Flow Duration Curves for the Upper Baker Development................B-19
EXHIBIT C—CONSTRUCTION HISTORY AND PROPOSED CONSTRUCTIONSCHEDULE............................................................................................................................... C-1
C.1 Project History........................................................................................................C-1C.1.1 Lower Baker Development ......................................................................C-1C.1.2 Upper Baker Development ......................................................................C-1C.1.3 Transmission System ...............................................................................C-2C.1.4 Fish Facilities ...........................................................................................C-2C.1.5 Project Chronology ..................................................................................C-3
C.2 Proposed Project Developments.............................................................................C-4C.2.1 Proposed New Development....................................................................C-4
C.2.1.1 Lower Baker Development Powerhouse .............................. C-4C.2.1.2 Sockeye Salmon Hatchery and Spawning Beach ................. C-4

Puget Sound Energy Table of ContentsBaker River Project, FERC No. 2150 xiii April 2004
Page
C.2.2 Proposed Construction Schedule .............................................................C-4C.2.2.1 Lower Baker Development Powerhouse .............................. C-4C.2.2.2 Sockeye Salmon Hatchery and Spawning Beach ................. C-5
C.3 Literature Cited ......................................................................................................C-5
EXHIBIT D—PROJECT COSTS........................................................................................... D-1D.1 Original Cost of the Project................................................................................... D-1D.2 Amount Payable if the Project is Taken Over by Another Party .......................... D-1D.3 Estimated Costs for New Development ................................................................ D-2D.4 Estimated Average Annual Cost of the Project..................................................... D-2D.5 Estimated Annual Value of Project Power Based on Lowest Cost
Alternative ............................................................................................................ D-4D.6 Source and Extent of Financing and Annual Revenues Available........................ D-5D.7 Literature Cited ..................................................................................................... D-6
EXHIBIT E—ENVIRONMENTAL REPORT.......................................................................E-1
EXHIBIT F—GENERAL DESIGN DRAWINGS .................................................................F-1F.1 General Design Drawings ......................................................................................F-1F.2 Supporting Design Report ......................................................................................F-2
EXHIBIT G—MAPS OF THE PROJECT ............................................................................ G-1
EXHIBIT H—GENERAL INFORMATION......................................................................... H-1H.1 Efficiency and Reliability...................................................................................... H-1
H.1.1 Plans for Increased Capacity or Generation............................................ H-1H.1.2 Project Coordination with Other Electric Systems ................................. H-1H.1.3 Flood Control Coordination with Upstream or Downstream
Projects.................................................................................................... H-2H.2 Applicant’s Need for the Project ........................................................................... H-3
H.2.1 Costs and Availability of Alternative Sources of Power if LicenseNot Granted............................................................................................. H-4
H.2.2 Replacement Costs and Increased Costs if License Not Granted........... H-4H.2.3 Effects of Alternative Sources of Power................................................. H-5
H.2.3.1 Effects on Customers ............................................................ H-5H.2.3.2 Effects on Operating and Load Characteristics .................... H-5H.2.3.3 Effects on Communities Served............................................ H-5
H.3 Data on Cost, Need, and Availability of Alternatives........................................... H-6H.3.1 Cost of Project Power ............................................................................. H-6H.3.2 Resource Requirements .......................................................................... H-6
H.3.2.1 Capacity and Energy Requirements over the Short andLong Term ............................................................................ H-6
H.3.2.2 Existing Energy and Capacity Resources ............................. H-7

Puget Sound Energy Table of ContentsBaker River Project, FERC No. 2150 xiv April 2004
Page
H.3.2.3 Load-Resource Outlook........................................................ H-8H.3.2.4 Load Management Measures ................................................ H-9
H.3.3 Alternative New Sources of Power......................................................... H-9H.3.3.1 Least Cost Alternative to the Project .................................. H-10H.3.3.2 Power Production Costs of the Least Cost Alternative....... H-10H.3.3.3 Emissions from Replacement Resources ............................ H-12
H.3.4 Effect of Alternative Sources on Direct Providers ............................... H-12H.4 Effect on Applicant Industrial Facilities and Related Operations....................... H-13H.5 Indian Tribe Need for Electricity ........................................................................ H-13H.6 Transmission System Impacts ............................................................................. H-13
H.6.1 Redistribution of Power Flows ............................................................. H-13H.6.2 Advantages of the Applicant’s Transmission System in
Distribution of Project Power ............................................................... H-13H.6.3 Single-Line Diagram............................................................................. H-13
H.7 Plans to Modify Project Facilities or Operations ................................................ H-14H.7.1 Project Operations................................................................................. H-14H.7.2 Facilities................................................................................................ H-14
H.8 Justification for the Lack of Plans to Modify Existing Project Facilities orOperations .......................................................................................................... H-16
H.9 Applicant’s Financial and Personnel Resources ................................................. H-16H.10 Expansion Notification........................................................................................ H-16H.11 Electricity Consumption Efficiency Improvement Program............................... H-16
H.11.1 Energy Conservation and Efficiency Record and Program .................. H-16H.11.2 Compliance with Regulatory Requirements ......................................... H-18
H.12 Tribe Mailing List ............................................................................................... H-19H.13 Measures to Ensure Safe Project Management, Operation, and Maintenance.... H-20
H.13.1 Operation During Flood Conditions ..................................................... H-20H.13.2 Warning Devices for Downstream Public Safety ................................. H-20H.13.3 Proposed Changes Affecting the Emergency Action Plan ................... H-20H.13.4 Structural Safety Monitoring Devices .................................................. H-20
H.13.4.1 Upper Baker ........................................................................ H-21H.13.4.2 Lower Baker........................................................................ H-22
H.13.5 Safety Record........................................................................................ H-23H.13.5.1 Employee/Contractor Safety Program ................................ H-23H.13.5.2 Public Safety Program ........................................................ H-23
H.14 Current Operations .............................................................................................. H-24H.14.1 Supervisory Control .............................................................................. H-24H.14.2 Power Generation Operations ............................................................... H-25H.14.3 Flood Control Operations ..................................................................... H-25H.14.4 Recreation Operations........................................................................... H-27H.14.5 Fishery Management Operations .......................................................... H-27
H.15 Project History..................................................................................................... H-27H.16 Generation Lost Due to Outages ......................................................................... H-28

Puget Sound Energy Table of ContentsBaker River Project, FERC No. 2150 xv April 2004
Page
H.17 Record of Compliance......................................................................................... H-31H.18 Project Actions Affecting the Public................................................................... H-32H.19 Expense Impact from Transfer of License .......................................................... H-34H.20 Annual Fees......................................................................................................... H-34H.21 Literature Cited ................................................................................................... H-34

Puget Sound Energy Table of ContentsBaker River Project, FERC No. 2150 xvi April 2004
This page intentionally left blank.
Puget Sound Energy List of TablesBaker River Project, FERC No. 2150 xvii April 2004
LIST OF TABLES
Table A-1. Federal lands within the Baker River Project boundary ........................................ A-8Table B-1. Baker River Project dependable capacity and average annual energy
estimates..................................................................................................................B-4Table C-1. Baker River Project chronology..............................................................................C-3Table D-1. Project takeover costs ............................................................................................ D-1Table D-2. New Project development costs ($2006) for auxiliary powerhouse at Lower
Baker Development ............................................................................................... D-2Table D-3. Economic parameters............................................................................................. D-3Table D-4. Estimated average annual Project costs ($2006) ................................................... D-3Table D-5. Present value and levelized value of SCCT project costs...................................... D-4Table D-6. Present value and levelized value of CCCT project costs ..................................... D-4Table D-7. Puget Sound Energy, Inc., income statement—twelve months ended
December 31, 2002 (dollars in thousands, except for earnings per share) ............ D-5Table F-1. Baker River Project general design drawings.........................................................F-1Table H-1. New resource characteristics.................................................................................. H-9Table H-2. Baker River Project replacement cost .................................................................. H-11Table H-3. Puget’s existing electric conservation programs.................................................. H-17Table H-4. Baker River Project, employee lost time accidents/injuries 1998–2003 (year
to date) ................................................................................................................. H-23Table H-5. Public safety accidents/incidents within Baker Project boundaries..................... H-24Table H-6. Project history ...................................................................................................... H-27Table H-7. Unscheduled outages for Upper Baker Development, 1998 through 2002 ......... H-29Table H-8. Unscheduled outages at Lower Baker Development, 1998 through 2002........... H-30Table H-9. Baker River Project annual operating expenses................................................... H-34

Puget Sound Energy List of TablesBaker River Project, FERC No. 2150 xviii April 2004
This page intentionally left blank.

Puget Sound Energy List of FiguresBaker River Project, FERC No. 2150 xix April 2004
LIST OF FIGURES
Figure B-1. Reservoir (Lake Shannon) operations at the Lower Baker Developmentunder various water conditions...........................................................................B-2
Figure B-2. Reservoir (Baker Lake) operations at the Upper Baker Development undervarious water conditions.....................................................................................B-2
Figure B-3 Flow duration curve for unregulated daily average flows for Lower BakerDevelopment inflow (water years 1981 through 2002)......................................B-6
Figure B-4 Flow duration curve for unregulated daily average flows for Upper BakerDevelopment inflow (water yers 1981 through 2002) .......................................B-6
Figure B-5. Elevation vs. storage curve for Lake Shannon ...................................................B-7Figure B-6. Elevation vs. storage curve for Baker Lake .......................................................B-8Figure B-7 Tailwater rating curve for Lower Baker powerhouse ......................................B-10Figure B-8 Representative tailwater rating curve for Upper Baker powerhouse ...............B-10Figure B-9 Plant output vs. net head for Lower Baker powerhouse...................................B-11Figure B-10 Plant output vs. net head for Upper Baker powerhouse ...................................B-11Figure B-1-1 October flow duration curve for unregulated daily average flows for
Lower Baker Development inflow (water years 1981 through 2002)..............B-13Figure B-1-2 November flow duration curve for unregulated daily average flows for
Lower Baker Development inflow (water years 1981 through 2002)..............B-13Figure B-1-3 December flow duration curve for unregulated daily average flows for
Lower Baker Development inflow (water years 1981 through 2002)..............B-14Figure B-1-4 January flow duration curve for unregulated daily average flows for Lower
Baker Development inflow (water years 1981 through 2002) .........................B-14Figure B-1-5 February flow duration curve for unregulated daily average flows for
Lower Baker Development inflow (water years 1981 through 2002)..............B-15Figure B-1-6 March flow duration curve for unregulated daily average flow for Lower
Baker Development inflow (water years 1981 through 2002) .........................B-15Figure B-1-7 April flow duration curve for unregulated daily average flows for Lower
Baker Development inflow (water years 1981 through 2002) .........................B-16Figure B-1-8 May flow duration curve for unregulated daily average flows for Lower
Baker Development inflow (water years 1981 through 2002) .........................B-16Figure B-1-9 June flow duration curve for unregulated daily average flows for Lower
Baker Development inflow (water years 1981 through 2002) .........................B-17Figure B-1-10 July flow duration curve for unregulated daily average flows for Lower
Baker Development inflow (water years 1981 through 2002) .........................B-17Figure B-1-11 August flow duration curve for unregulated daily average flows for Lower
Baker Development inflow (water years 1981 through 2002) .........................B-18Figure B-1-12 September flow duration curve for unregulated daily average flows for
Lower Baker Development inflow (water years 1981 through 2002)..............B-18Figure B-2-1 October flow duration curve for unregulated daily average flows for Upper
Baker Development inflow (water years 1981 through 2002) ........................ B-19Figure B-2-2 November flow duration curve for unregulated daily average flows for
Upper Baker Development inflow (water years 1981 through 2002) ..............B-19
Puget Sound Energy List of FiguresBaker River Project, FERC No. 2150 xx April 2004
Page
Figure B-2-3 December flow duration curve for unregulated daily average flows forUpper Baker Development inflow (water years 1981 through 2002) ..............B-20
Figure B-2-4 January flow duration curve for unregulated daily average flows for UpperBaker Development inflow (water years 1981 through 2002) .........................B-20
Figure B-2-5 February flow duration curve for unregulated daily average flows forUpper Baker Development inflow (water years 1981 through2002).................................................................................................................B-21
Figure B-2-6 March flow duration curve for unregulated daily average flow for UpperBaker Development inflow (water years 1981 through 2002) .........................B-21
Figure B-2-7 April flow duration curve for unregulated daily average flows for UpperBaker Development inflow (water years 1981 through 2002) .........................B-22
Figure B-2-8 May flow duration curve for unregulated daily average flows for UpperBaker Development inflow (water years 1981 through 2002) .........................B-22
Figure B-2-9 June flow duration curve for unregulated daily average flows for UpperBaker Development inflow (water years 1981 through 2002) .........................B-23
Figure B-2-10 July flow duration curve for unregulated daily average flows for UpperBaker Development inflow (water years 1981 through 2002) .........................B-23
Figure B-2-11 August flow duration curve for unregulated daily average flows for UpperBaker Development inflow (water years 1981 through 2002) .........................B-24
Figure B-2-12 September flow duration curve for unregulated daily average flows forUpper Baker Development inflow (water years 1981 through 2002) ..............B-24

Puget Sound Energy Acronyms and AbbreviationsBaker River Project, FERC No. 2150 xxi April 2004
ACRONYMS AND ABBREVIATIONS
ACOE U.S. Army Corps of EngineersAFUDC allowance for funds used during constructionaMW average megawattApplicant Puget Sound EnergyBPA Bonneville Power AdministrationBtu British thermal unitCEII Critical Energy Infrastructure InformationCCCT gas-fired, combined-cycle combustion turbinecfs cubic feet per secondCommission Federal Energy Regulatory CommissionEAP Emergency Action PlanFERC Federal Energy Regulatory CommissionFPC Federal Power Commissiongpm gallon per minuteGWh gigawatt-hourkV kilovoltkVA kilovolt amperekW kilowattkWh kilowatt-hourMMBtu million British thermal unitsmsl mean sea levelMW megawattMWh megawatt-hourNUG non-utility generatorO&M operation and maintenancePDEA preliminary draft environmental assessmentPME protection, mitigation, and enhancementPNCA Pacific Northwest Coordination AgreementProject Baker River Hydroelectric ProjectPuget Puget Sound EnergyRM river milerpm revolutions per minuteSCCT gas-fired, simple-cycle combustion turbineSea-Tac Seattle-Tacoma International AirportUSFS U.S. Forest ServiceWDNR Washington Department of Natural ResourcesWDOE Washington Department of EcologyWDOT Washington Department of Transportation

Puget Sound Energy Acronyms and AbbreviationsBaker River Project, FERC No. 2150 xxii April 2004
This page intentionally left blank.
Puget Sound Energy Exhibit ABaker River Project, FERC No. 2150 A-1 April 2004
EXHIBIT A—DESCRIPTION OF THE PROJECT
A.1 General Description and Location of the Baker River Project
The Baker River Hydroelectric Project (Project), owned and operated by Puget SoundEnergy, Inc. (Puget or Applicant), is located on the Baker River in Skagit and Whatcomcounties, Washington, north of and partially within the Town of Concrete. The Project consistsof two developments: Lower Baker Development and Upper Baker Development.
The Lower Baker Development consists of a concrete arch dam3 1.2 river miles upstreamof the Baker River’s confluence with the Skagit River (river mile [RM] 1.2), a 7-mile-longreservoir, a power tunnel, a single-unit powerhouse at RM 0.9, a fish barrier dam and trap at RM0.6, a primary transmission line, and associated facilities. The Lower Baker Development wasconstructed between April 1924 and November 1925. The dam was raised 33 feet in 1927. In1965, a landslide destroyed the three-unit powerhouse. Turbine generator Units 1 and 2 wereabandoned as a result of the slide, and a new powerhouse structure was built for Unit 3, whichwas refurbished and reinstalled. Unit 3 returned to service in September 1968.
The Upper Baker Development consists of a concrete gravity dam at RM 9.35, an earthendike, a 9-mile-long reservoir, a two-unit powerhouse, and associated facilities. The Upper BakerDevelopment was constructed between June 1956 and October 1959.
A.2 Lower Baker River Development
A.2.1 Physical Composition, Dimension, and Configuration of ExistingStructures
A.2.1.1 Dam
Lower Baker dam is a 285-foot-high, 550-foot-long concrete thick arch dam containing125,000 cubic yards of concrete and consisting of a non-overflow section at each abutment and acentrally located spillway section. The top of the dam is at elevation 450.62 feet mean sea level(msl)4.
The spillway section contains 23 vertical slide spill gates that are each 14 feet high and9.5 feet wide. Thirteen of the spill gates are operated by motorized cable hoists; the remaining10 use a manually operated, electric-powered gate car. The spillway crest is at elevation428.62 feet msl. The spillway capacity is 40,000 cubic feet per second (cfs) at the normal fullpool elevation of 442.35 feet msl.
3 The non-overflow sections are designed to safely pass water during high-flow events.4 Unless otherwise noted, all elevations appearing in this license application are based on the North
American Vertical Datum of 1988.

Puget Sound Energy Exhibit ABaker River Project, FERC No. 2150 A-2 April 2004
A.2.1.2 Power Intake and Pressure Tunnel
A concrete intake equipped with trashracks and gatehouse is located at the dam’s leftabutment. The intake invert is at elevation 333.75 feet msl. The intake narrows to two headgate-controlled openings that are each 20 feet high and 12 feet wide. The headgate openingstransition to a 147-foot-long, 22-foot-diameter vertical shaft. The vertical shaft connects to a1,410-foot-long pressure tunnel, having a 905-foot-long, 22-foot-diameter concrete-lined sectiontransitioning to a 505-foot-long, 16-foot-diameter steel-lined section at the downstream end. Thesteel-lined section continues beyond the tunnel portal to form a steel penstock, which terminatesat a 16-foot-diameter butterfly valve located just inside the powerhouse walls.
A reinforced concrete surge tank is connected by reinforced concrete sidewalls to a20-foot-diameter, 259-foot-high surge shaft located near the downstream end of the concrete-lined section of the pressure tunnel. The surge structure is covered with a heavy reinforcedconcrete slab.
A 24-inch-diameter steel pipe connected to the penstock immediately upstream of thebutterfly valve furnishes high-head water to a 12-inch-diameter, motor-operated dispersion typevalve discharging into the powerhouse tailrace.
A.2.1.3 Powerhouse
The 90-foot-long, 66-foot-wide reinforced concrete and structural steel powerhouse islocated on the east bank of the Baker River at RM 0.9. It has a sloping roof to shed potentiallandslides and an external 210-ton bridge crane that can access all turbine generator componentsthrough two removable hatches in the powerhouse roof. The powerhouse contains a singleturbine generator unit (Unit 3), and the turbine draft tube discharges directly into the BakerRiver.
A.2.1.4 Fish Facilities
Upstream Passage Facilities
At RM 0.6 on the Baker River, a barrier dam blocks adult fish from continuing upstreamand guides them into a fish trap facility. The barrier dam is 150 feet long and 12 feet high, witha 50-foot-wide apron and foundation slab. Two 75-foot-long radial spill gates with a 2-footoperating range raise the crest elevation to 176.75 feet msl.
The fish trap facility is a concrete and steel structure consisting of an entrance vestibule,three holding ponds, and a hopper pond. Each holding pond has movable fish crowders toencourage the fish to move upstream. The third holding pond (brail pond) has a vertical crowderthat guides fish into the hopper. The hopper is lifted by crane and moved over an awaiting fishtank truck equipped with aeration and oxygen diffusers. The fish are transferred into the truckand transported to the Upper Baker reservoir and/or spawning beaches.

Puget Sound Energy Exhibit ABaker River Project, FERC No. 2150 A-3 April 2004
Downstream Passage Facilities
Downstream migrating fish are collected using a barrier net guidance system, surfacecollection attraction barge, and fish trap/sampling facility. Downstream migrants are captured,sampled for biological information, transferred to a tank trailer, and trucked to the mouth of theBaker River where they are released. According to species handling protocols, they may also bereturned to the Skagit River or taken as hatchery broodstock.
The guide net has a mesh size of 0.25 inch and extends from shore to shore about600 feet upstream of the dam. Net sections extend from the reservoir surface to approximatelythe contour of the reservoir bottom, ranging in length from 50 feet to 250 feet.
The surface collection facilities attract the downstream-migrating fish with flow createdby two 20,000 gallon-per-minute (gpm) pumps. The fish are guided over a weir into a flume,which connects to a pipeline that discharges into a trap. At the trap, a screen diverts arriving fishinto holding bins where they are counted and sampled. The fish are placed into 200-gallonhoppers, which are transported by mini-barge to shore. A crane lifts the hopper onto a truck.The fish are transported and released downstream near the mouth of the Baker River.
A.2.2 Lower Baker Reservoir
Lake Shannon reservoir is about 7 miles long and has a surface area of 2,278 acres atnormal full pool elevation 442.35 feet msl. The gross storage capacity above elevation343.75 feet msl is 146,279 acre-feet. Additional unknown dead storage lies below this elevation.The minimum generating pool elevation is 373.75 feet msl, which provides usable storage of116,770 acre-feet.
A.2.3 Turbine Generator
The Lower Baker powerhouse contains a single turbine generator unit with an authorizedinstalled capacity of 79,330 kilowatts (kW). The Francis-type vertical-shaft hydraulic turbine,upgraded in 2001, delivers 79,330 kW at best gate and 243 feet rated net head. It operates at163.6 revolutions per minute (rpm) through an operating net head range of 227 to 265 feet.
The generator is a General Electric unit that was rewound in 2001 and is rated at85,000 kW at 1.0 power factor.
Currently, the Lower Baker generating capacity is limited to 77,000 kW because oftransformer capacity.

Puget Sound Energy Exhibit ABaker River Project, FERC No. 2150 A-4 April 2004
A.2.4 Primary Transmission
The Lower Baker Development has a single 115-kilovolt (kV) primary transmission linerunning 0.142 mile from the Lower Baker powerhouse to the Baker River switching station, acomponent of Puget’s regional transmission and distribution system.5
A.2.5 Appurtenant Mechanical, Electrical, and Transmission Equipment
The main transformer is a 70,000-kilovolt ampere (kVA), 13.2/115-kV, 3-phase, 60-cycletransformer located within the powerhouse. Other appurtenant powerhouse equipment includes astation service transformer and systems for load control, raw water cooling, compressed air, fireprotection, automatic lubrication, and station heating and ventilation.
A.2.6 Proposed New Structures and Facilities
To increase operational flexibility to meet proposed minimum instream flow release andramping requirements downstream of the Project, Puget would rehabilitate the original powergenerating facilities at the Lower Baker Development that were destroyed by the 1965 landslide.The auxiliary powerhouse would include a new turbine generator attached to an existingpenstock within the concrete foundation of the original 1925 powerhouse.
A.2.6.1 Auxiliary Powerhouse
A new 153-foot-long, 50-foot-wide reinforced concrete powerhouse would beconstructed on the existing abandoned powerhouse foundation located adjacent to andimmediately north (upstream) of the existing Lower Baker Unit 3 powerhouse. The newauxiliary powerhouse would contain a new turbine/generator, a new step-up transformer, andassociated mechanical and electrical support equipment. The new powerhouse would beconnected to the existing powerhouse via an enclosed stairway. The new superstructure wouldbe 17 feet high, with two steel roof hatches for access to the turbine/generator and thetransformer. Crane rails for the existing overhead gantry crane at Unit 3 would be extendedsome 153 feet north to provide for use of the crane during installation and maintenance of thenew equipment. Access for construction, operation, and maintenance of the new facilities wouldbe provided by a new access bridge to be built adjacent to the west side of the new powerhouse.
A.2.6.2 Turbine Generator
A new 680-cfs horizontal-shaft Francis turbine and generator would be connected to oneof the existing abandoned 7-foot-diameter penstocks. The new turbine would have a stainless-steel runner diameter of 5.9 feet, rotate at 257 rpm, and produce 12 megawatts (MW) at adischarge of 600 cfs and about 12.5 MW at 680 cfs. A horizontal synchronous generator wouldbe directly connected to the turbine and provide an output voltage of 4.16 kV to the low voltageside of a step-up transformer. The new turbine configuration would include a new 84-inchbutterfly valve that would serve as a turbine guard valve. The new unit would be configured to
5 Refer to the Commission’s Order Amending License, Project No. 2150-022, issued May 21, 2002.

Puget Sound Energy Exhibit ABaker River Project, FERC No. 2150 A-5 April 2004
operate in synchronization with the existing Unit 3 and would also serve to increase the remotelycontrolled outflow capacity available during flood control operations.
A.2.6.3 Appurtenant Mechanical, Electrical, and Transmission Equipment
A 13,000-kVA step-up transformer would be located at the extreme south end of the newpowerhouse.
A.3 Upper Baker River Development
A.3.1 Physical Composition, Dimension, and Configuration of ExistingStructures
A.3.1.1 Dam
Upper Baker dam is a concrete gravity dam 312 feet high and 1,200 feet long consistingof spillway, intake, and non-overflow sections. The dam has a volume of 609,000 cubic yards ofconcrete. The top of the dam is at elevation 735.77 feet msl.
The 93-foot-wide spillway section is an integral part of the main gravity dam. Threeradial gates, each 25 feet wide and 30 feet high, control the spillway discharge. The gates areeach served by a bridge-mounted, electrically operated drum hoist of 30-ton capacity. The twointermediate reinforced concrete piers are 9 feet wide. Reinforced concrete beam bridges carry a12-foot-wide roadway over the three spillway openings. The spillway crest is at elevation697.77 feet msl. The spillway capacity is 48,000 cfs at the normal full pool elevation of 727.77feet msl.
The intake section is located at the center of the dam. The intake, with an invertelevation of 637.77 feet msl, provides two gated water passages with bell-mouthed entrances thattransition to steel penstocks 13.5 feet in diameter and 320 feet long. The fixed-wheel-type steelintake gates are 20 feet high and 16 feet wide. A 100-foot-high floating fish baffle suspendedfrom floating pontoons is located immediately upstream of the two intake openings.
The three concrete gravity non-overflow sections of the dam extend 550 feet from theright abutment to the intake section, 100 feet between the intake and spillway sections, and 350feet from the spillway section to the left abutment. Stair towers in the non-overflow sectionsnear each end of the dam provide access to the dam’s inspection gallery.
A.3.1.2 Dike
A 115-foot-high, 1,200-foot-long earth and rock-fill dam, known as West Pass dike, islocated in a depression approximately 1,500 feet north of Upper Baker dam. The 20-foot-widecrest is at elevation 737.77 feet msl. A gated road runs along the crest of the dike.
A.3.1.3 Depression Lake and Water Recovery Pumps
Depression Lake is situated in a natural depression located on the west side of West Passdike. Its southern edge is formed by a 3,000-foot-long, 22-foot-high earth-fill dike (Pumping

Puget Sound Energy Exhibit ABaker River Project, FERC No. 2150 A-6 April 2004
Pond dike) with a crest elevation of 705.77 feet msl. An overflow spillway at an approximatecrest elevation of 699 feet msl is located adjacent to the Pumping Pond dike. Depression Lakehas an approximate surface area of 44 acres and a total volume of approximately 234 acre-feet ata full pool elevation of 698.77 feet msl. Water enters Depression Lake, in part, as a result ofsubsurface leakage from Baker Lake, transmitted through native materials. A water-recoverypumping station, with two vertical propeller water-recovery pumps rated at 54,000 gpm, pumpswater from Depression Lake through a pipeline into a discharge channel leading into BakerLake. When pumps are not in operation, excess water is discharged over the spillway into adrainage channel and conduit system, and back to the Baker River downstream of the UpperBaker powerhouse.
A.3.1.4 Powerhouse
The 122-foot-long, 59-foot-wide reinforced concrete and structural steel powerhouse islocated at the base of the dam on the north side of the Baker riverbed. Access to the powerhouseis from the north side by an approach road descending the canyon and terminating in a parkingarea. An electrically powered, 50-ton capacity stiff-leg derrick is used to move material andequipment between the parking/staging area, the transformer deck, or through the service bayhatch to the generator floor staging area. The service bay and generator floor are served by atraveling 160-ton electric overhead bridge crane. The powerhouse contains two turbinegenerator units, and the turbine draft tubes discharge directly into the Baker River.
A.3.1.5 Fish Facilities
Downstream Passage Facilities
Downstream migrating fish are collected using a barrier net guidance system, surfacecollector attraction barge, and fish trap/sampling facility. Downstream migrants are captured,sampled for biological information, transferred to a tank trailer, and trucked to the mouth of theBaker River where they are released.
The guide net has a mesh size of 0.25 inch and spans the forebay. The net extends fromthe reservoir surface to approximately the contour of the reservoir bottom and has a maximumlength of 285 feet. The guide net connects to the surface collector, which is located about 130feet upstream of the dam.
The surface collection facilities attract the downstream-migrating fish with flow createdby two 34,000 gpm pumps. The fish are guided over a weir into a flume that directs them into apipe connecting to the fish trap. The 62-foot by 54-foot fish trap facility is located on theupstream face of the dam. At the trap, fish are held in four raceway channels where they arecounted and sampled. The fish are placed in hoppers, which are raised by crane to the top of thedam, and released into a 400-gallon fish tank-trailer. The fish are then transported and releaseddownstream near the mouth of the Baker River.

Puget Sound Energy Exhibit ABaker River Project, FERC No. 2150 A-7 April 2004
Sockeye Spawning Beaches
Three sockeye salmon spawning beaches (Spawning Beaches 1, 2, and 3) are locatedtogether at the northern end of Baker Lake near Channel Creek, and Spawning Beach 4 is locatedadjacent to Sulphur Creek, just west of the Upper Baker dam. The beaches are lined, shallowponds filled with graded gravel. Beneath the gravel is a series of diffusion pipes that provideupwelling spring water. A fenced perimeter provides security and prevents intrusion bypredators. Spawning Beach 1 is not functional and has not been used since 1965. SpawningBeach 2 has not operated since 1994. Spawning Beach 3 remains operational; it measures150 feet by 100 feet.
Spawning Beach 4 was constructed in 1989 to replace Spawning Beaches 1, 2, and 3,which were threatened by destruction from a shifting Baker River channel. Spawning Beach 4consists of an intake, pipeline, spawning beach measuring 200 feet by 150 feet, and access road.The designed capacity of Spawning Beach 4 is equal to the combined capacity of beaches 2and 3.
A.3.2 Upper Baker Reservoir
Baker Lake reservoir is about 9 miles long and 1 mile wide. It has a surface area of4,980 acres at normal full pool elevation 727.77 feet msl. The gross storage capacity is 274,221acre-feet. The minimum generating pool elevation is 677.77 feet msl, which provides usablestorage of 180,128 acre-feet.
A.3.3 Turbine Generator
The Upper Baker powerhouse contains two turbine generator units with a combinedauthorized installed capacity of 90,700 kW.
The turbines are Francis-type vertical-shaft units that operate at 200 rpm through anoperating head range of 240 feet to 290 feet. The Unit 1 turbine was refurbished and the runnerwas replaced in 1997. Unit 1 delivers 54,236 kW at best gate and 285 feet rated net head.
The Unit 2 turbine was repaired and the wicket gates and servo-motors refurbished in1996. Unit 2 delivers 38,300 kW at best gate and 285 feet rated net head.
The two generators are General Electric units rated at 52,400 kW at 1.0 power factor.The Unit 1 generator was rewound in 1990. The Unit 2 generator was rewound in 1989.
A.3.4 Primary Transmission
No primary transmission lines are associated with the Upper Baker Development.6
6 Refer to the Commission’s Order Amending License, Project No. 2150-022, issued May 21, 2002.

Puget Sound Energy Exhibit ABaker River Project, FERC No. 2150 A-8 April 2004
A.3.5 Appurtenant Mechanical, Electrical, and Transmission Equipment
A step-up transformer bank consisting of three 35,000-kVA, 13.2/115-kV, single-phase,60-cycle transformers is located on the transformer deck adjacent to the powerhouse. Otherappurtenant powerhouse equipment includes two station service transformers and systems forload control, compressed air, fire protection, and station heating and ventilation.
A.3.6 Proposed New Structures and Facilities
In conjunction with Puget’s proposed fish propagation and enhancement programs, Pugetwould construct a sockeye salmon hatchery and a new sockeye spawning beach. Both facilitieswould be located adjacent to the existing Spawning Beach 4, in the cleared and fenced area onthe right bank of the Baker River near the Sulphur Creek confluence, immediately downstreamof the Upper Baker dam. The sockeye hatchery facilities would include adult holding facilities,artificial incubation facilities, a small concrete hatchery building, and starter ponds. The newspawning beach would measure approximately 200 feet by 150 feet and incorporate the samegeneral technology as used in the existing Spawning Beach 4.
A.4 Federal Lands Within the Project Boundary
The Baker River Project is located within Skagit and Whatcom counties and occupies atotal of 8,500 acres within its boundary. The total land area within the Upper BakerDevelopment is 5,939 acres, with 5,131 acres lying within the U.S. Forest Service’s (USFS)Mount Baker-Snoqualmie National Forest. To the south, the Lower Baker Development (2,561acres) is located primarily on lands owned by Puget (2,430 acres). The USFS manages 76 acresat this development, the Washington State Department of Natural Resources (WDNR) manages4.6 acres, and 50.5 acres are in a mix of state and private ownership.
The location, by section, of the 5,207 acres of USFS lands within the Baker River Projectboundary is shown in table A-1. This information is also depicted in exhibit G, volume 1, part 2of this application for new license.
Table A-1. Federal lands within the Baker River Project boundary.
Location Ownership AcreageUpper Baker Development
T38N, R10E, S31 USFS 22.904582T38N, R10E, S30 USFS 13.071871T38N, R09E, S36 USFS 467.847968T38N, R09E, S35 USFS 476.766234T38N, R09E, S34 USFS 184.160621T38N, R09E, S33 USFS 152.583781T38N, R09E, S32 USFS 38.344869T38N, R09E, S26 USFS 6.440417T38N, R09E, S25 USFS 76.504231T37N, R09E, S32 USFS 17.079959T37N, R09E, S31 USFS 177.829724

Puget Sound Energy Exhibit ABaker River Project, FERC No. 2150 A-9 April 2004
Location Ownership AcreageT37N, R09E, S30 USFS 183.646362T37N, R09E, S29 USFS 154.770264T37N, R09E, S20 USFS 351.961459T37N, R09E, S19 USFS 179.226123T37N, R09E, S18 USFS 249.083318T37N, R09E, S17 USFS 281.825166T37N, R09E, S08 USFS 422.229883T37N, R09E, S07 USFS 3.173168T37N, R09E, S06 USFS 0.881925T37N, R09E, S05 USFS 424.156845T37N, R09E, S04 USFS 461.452191T37N, R09E, S03 USFS 365.431467T37N, R09E, S02, USFS 147.819152T37N, R09E, S01 USFS 18.147138T37N, R08E, S36 USFS 111.613189T37N, R08E, S25 USFS 142.250386
Lower Baker DevelopmentT37N, R08E, S36 USFS 75.535541
Puget Sound Energy Exhibit BBaker River Project, FERC No. 2150 B-1 April 2004
EXHIBIT B—PROJECT OPERATIONS AND RESOURCE UTILIZATION
B.1 Project Operations
B.1.1 Plant Supervision
The generators at Puget’s Lower Baker Development and Upper Baker Development canbe operated onsite either manually or automatically. Additionally, they can be operated remotelyby operators at Puget’s Eastside Operations Center in Redmond, Washington. For remoteoperation, the two developments and the Eastside Operations Center communicate usingmicrowave signals. Signals indicating high-bearing temperature, failure of cooling water flow,relay operations, and other automatic functions are transmitted to the Eastside Operations Centerby supervisory equipment over one of the microwave channels. In addition to controlling theunits, operators can close the intake gates and open and close the spillway gates. Althoughprimary operating control resides at the Eastside Operations Center facility, Puget onsite staffprovide oversight 8 hours per day, 7 days per week, and remain on call during the off-hours.
B.1.2 Estimated Annual Plant Factor
Operations at the Upper Baker Development directly influence Lower BakerDevelopment. Prior to the late 1970s, the Upper Baker Development provided 16,000 acre-feetof flood storage. A marked shift in Project operations occurred in 1978 after the U.S. ArmyCorps of Engineers (ACOE) sought and obtained Congressional authorization to use the UpperBaker Development as a part of federal flood control in the area. This authorization resulted inan additional 58,000 acre-feet of flood storage being provided in Baker Lake on behalf of theACOE and pursuant to the operational control of the ACOE. The new flood control regime wasfully implemented by 1981, and operations from 1981 through the present are reasonablyrepresentative of current conditions. Based on gross energy generation records (see sectionB.2.2) and net plant capability under most favorable operating conditions (71 MW at LowerBaker and 103 MW at Upper Baker), as reported on the Federal Energy Regulatory Commission(FERC or Commission) Form 1, the average annual plant factors for calendar years 1981 through2002 at the Lower Baker Development and Upper Baker Development were 59 percent and38 percent, respectively.
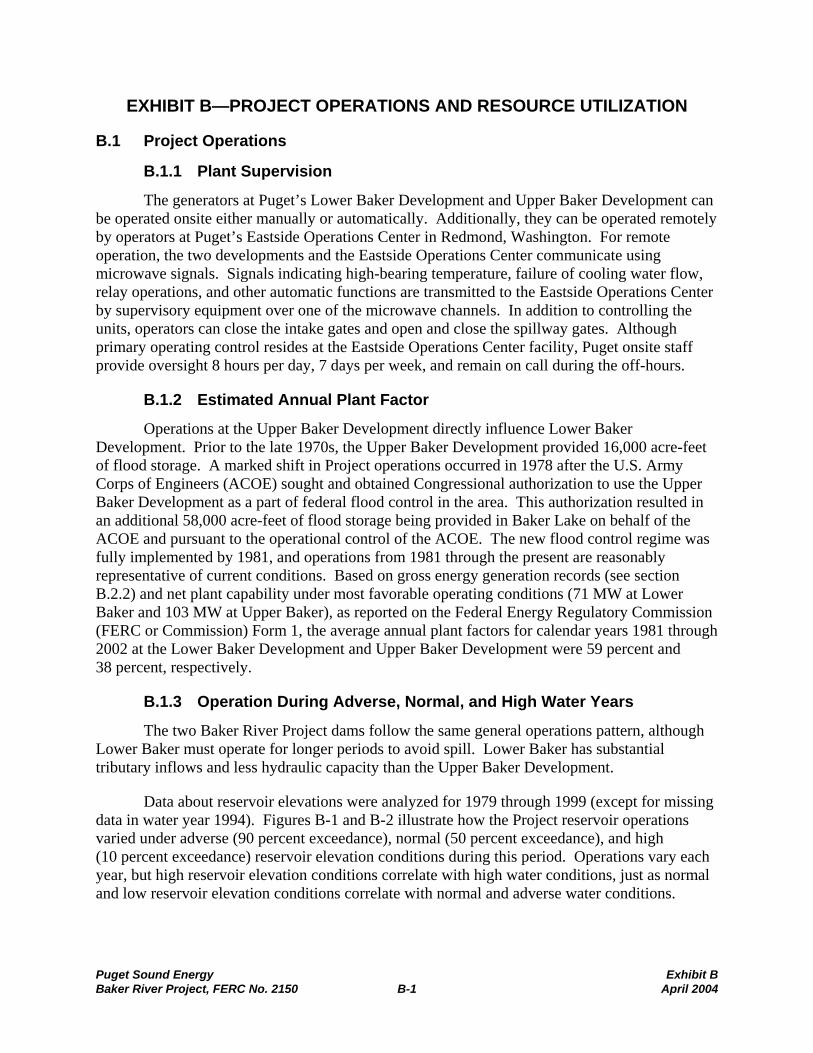
B.1.3 Operation During Adverse, Normal, and High Water Years
The two Baker River Project dams follow the same general operations pattern, althoughLower Baker must operate for longer periods to avoid spill. Lower Baker has substantialtributary inflows and less hydraulic capacity than the Upper Baker Development.
Data about reservoir elevations were analyzed for 1979 through 1999 (except for missingdata in water year 1994). Figures B-1 and B-2 illustrate how the Project reservoir operationsvaried under adverse (90 percent exceedance), normal (50 percent exceedance), and high(10 percent exceedance) reservoir elevation conditions during this period. Operations vary eachyear, but high reservoir elevation conditions correlate with high water conditions, just as normaland low reservoir elevation conditions correlate with normal and adverse water conditions.

Puget Sound Energy Exhibit BBaker River Project, FERC No. 2150 B-2 April 2004
360
370
380
390
400
410
420
430
440
450
Jan-
15
Jan-
31
Feb-
15
Feb-
28
Mar
-15
Mar
-31
Apr
-15
Apr
-30
May
-15
May
-31
Jun-
15
Jun-
30
Jul-1
5
Jul-3
1
Aug-
15
Aug-
31
Sep-
15
Sep-
30
Oct
-15
Oct
-31
Nov
-15
Nov
-30
Dec
-15
Dec
-31
Date
Res
ervo
ir Po
ol E
leva
tion
(feet
msl
)
10%
50%
90%
Figure B-1. Reservoir (Lake Shannon) operations at the Lower Baker Developmentunder various water conditions. (Source: Adapted from Puget, 2003a)
670
680
690
700
710
720
730
Jan-
15
Jan-
31
Feb-
15
Feb-
28
Mar
-15
Mar
-31
Apr-
15
Apr-
30
May
-15
May
-31
Jun-
15
Jun-
30
Jul-1
5
Jul-3
1
Aug-
15
Aug-
31
Sep-
15
Sep-
30
Oct
-15
Oct
-31
Nov
-15
Nov
-30
Dec
-15
Dec
-31
Res
ervo
ir P
ool E
leva
tion
(ft)
10%
50%
90%
Figure B-2. Reservoir (Baker Lake) operations at the Upper Baker Developmentunder various water conditions. (Source: Adapted from Puget, 2003a)

Puget Sound Energy Exhibit BBaker River Project, FERC No. 2150 B-3 April 2004
B.2 Project Capacity and Production
B.2.1 Dependable Capacity
The dependable capacity is the average output that the Project can sustain to meet peak-hour load requirements during a critical streamflow period. The daily peak hours are 6:00 a.m.to 10:00 a.m. and 5:00 p.m. to 9:00 p.m., except for Sunday, which is an off-peak day. Pugetcoordinates operation of the Baker River Project with other generating plants operated by theparties to the Pacific Northwest Coordination Agreement (PNCA). Puget, which was one of theoriginal signatories to the PNCA in 1964, has adopted the critical period used under the PNCA(September 1936 and March 1937) as the basis for the Baker River Project critical period.Because operations on the mainstem Skagit River could potentially affect dependable capacity ifcertain ramping rates are imposed, and hourly flow data are required to make such an analysis,Puget selected the most recent period similar to 1936–1937 that had hourly data for dependablecapacity analysis. The selected period was September 2000 through April 2001. Becauseadequate water and head were available from September 2000 through December 2000, theoperations during the period from January 2001 through April 20001 define the dependablecapacity of the Baker River Project.
Dependable capacity of the Baker River Project under current conditions is estimated tobe 166.61 MW.
The proposed operation includes a modified reservoir management regime and a newdownstream release regime consisting of minimum flows and ramp rates. To implement thisrelease regime, specifically the ramping limits, and to generate power with the minimum flowreleases, Puget would install a new 12.5-MW turbine generator at the Lower BakerDevelopment. Dependable capacity with the proposed auxiliary powerhouse, operating inconjunction with the proposed operation, is estimated to be 143.1 MW, a decrease of 23.5 MW.The dependable capacity decreases under the proposed operation because of two factors. First,the minimum instream flow increases from 80 cfs under Current Operations to 300 cfs under theproposed operation. Second, the proposed ramp rate requires a greater quantity of water fordownramping at the Lower Baker Development. Both of these factors result in less wateravailable for generation during the high demand hours of the critical period.
B.2.2 Annual Generation
As discussed in section B.1.2, the period of record best reflecting current conditions isfrom water year 1981 through water year 2002. A full range of flow conditions was encounteredduring this period, and long-term generation during this period is reasonably representative ofcurrent conditions.7
7 The generation data are recorded on a calendar year basis, but the 3-month water year offset would notbe expected to significantly influence average statistics over a 22-year period. The 3-month water yearoffset accounts for the difference between a water year (October 1–September 30) and a calendar year.
Puget Sound Energy Exhibit BBaker River Project, FERC No. 2150 B-4 April 2004
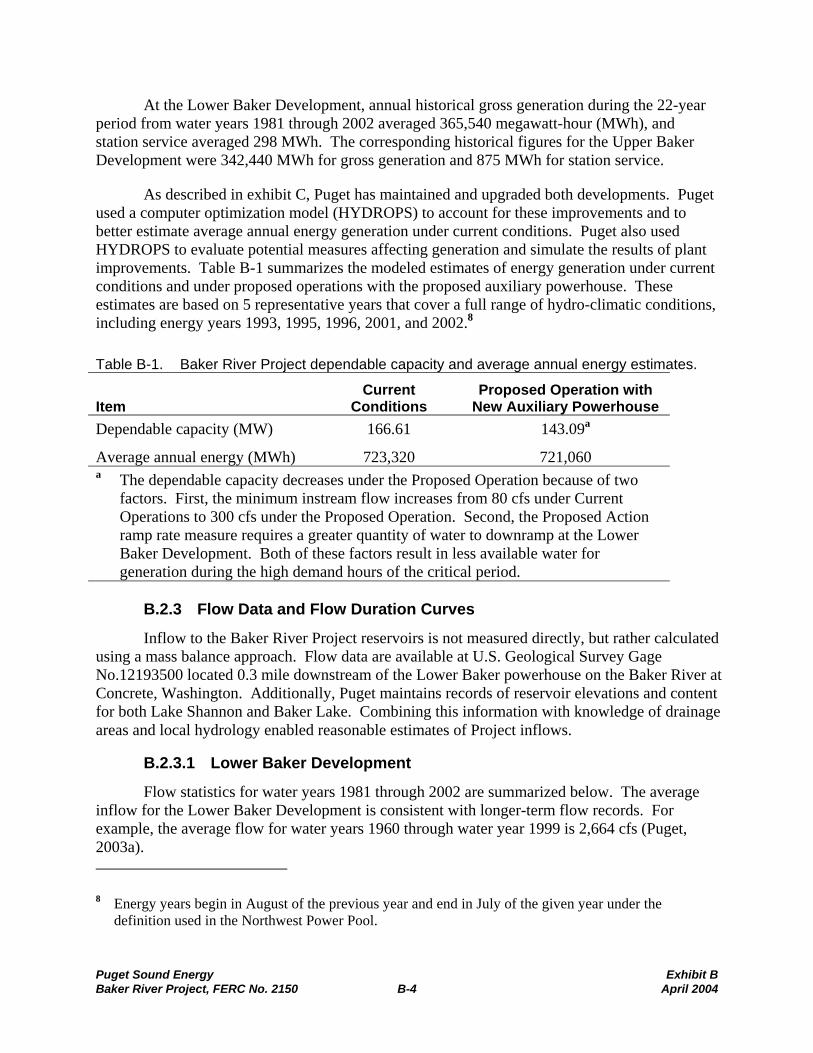
At the Lower Baker Development, annual historical gross generation during the 22-yearperiod from water years 1981 through 2002 averaged 365,540 megawatt-hour (MWh), andstation service averaged 298 MWh. The corresponding historical figures for the Upper BakerDevelopment were 342,440 MWh for gross generation and 875 MWh for station service.
As described in exhibit C, Puget has maintained and upgraded both developments. Pugetused a computer optimization model (HYDROPS) to account for these improvements and tobetter estimate average annual energy generation under current conditions. Puget also usedHYDROPS to evaluate potential measures affecting generation and simulate the results of plantimprovements. Table B-1 summarizes the modeled estimates of energy generation under currentconditions and under proposed operations with the proposed auxiliary powerhouse. Theseestimates are based on 5 representative years that cover a full range of hydro-climatic conditions,including energy years 1993, 1995, 1996, 2001, and 2002.8
Table B-1. Baker River Project dependable capacity and average annual energy estimates.
ItemCurrent
ConditionsProposed Operation with
New Auxiliary PowerhouseDependable capacity (MW) 166.61 143.09a
Average annual energy (MWh) 723,320 721,060a The dependable capacity decreases under the Proposed Operation because of two
factors. First, the minimum instream flow increases from 80 cfs under CurrentOperations to 300 cfs under the Proposed Operation. Second, the Proposed Actionramp rate measure requires a greater quantity of water to downramp at the LowerBaker Development. Both of these factors result in less available water forgeneration during the high demand hours of the critical period.
B.2.3 Flow Data and Flow Duration Curves
Inflow to the Baker River Project reservoirs is not measured directly, but rather calculatedusing a mass balance approach. Flow data are available at U.S. Geological Survey GageNo.12193500 located 0.3 mile downstream of the Lower Baker powerhouse on the Baker River atConcrete, Washington. Additionally, Puget maintains records of reservoir elevations and contentfor both Lake Shannon and Baker Lake. Combining this information with knowledge of drainageareas and local hydrology enabled reasonable estimates of Project inflows.
B.2.3.1 Lower Baker Development
Flow statistics for water years 1981 through 2002 are summarized below. The averageinflow for the Lower Baker Development is consistent with longer-term flow records. Forexample, the average flow for water years 1960 through water year 1999 is 2,664 cfs (Puget,2003a).
8 Energy years begin in August of the previous year and end in July of the given year under thedefinition used in the Northwest Power Pool.

Puget Sound Energy Exhibit BBaker River Project, FERC No. 2150 B-5 April 2004
Statistic Flow (cfs)Daily average flow 2,648Minimum daily flow 279Maximum daily flow 38,418
The annual flow duration curve for Lower Baker inflows for the period of record wateryears 1981 through 2002 is shown in figure B-3. For clarity, the curve is truncated at 20,000 cfs.As shown above, the actual maximum is 38,418 cfs, but 20,000 cfs represents the 0.19 percentexceedance flow. Monthly flow duration curves for the same period (1981–2002 water years)are provided in appendix B-1 of this exhibit.
B.2.3.2 Upper Baker Development
Flow statistics for the Upper Baker Development for water years 1981 through 2002 areshown below. The average flow during this period is consistent with longer term flow records.
Statistic Flow (cfs)Daily average flow 2,039Minimum daily flow 173Maximum daily flow 27,106
The annual flow duration curve for Upper Baker inflows for the period of record wateryears 1981 through 2002 is shown in figure B-4. For clarity, the curve is truncated at 20,000 cfs.As shown above, the actual maximum is 27,106 cfs, but 20,000 cfs represents the 0.1 percentexceedance flow. Although the flow duration curves shown in figures B-3 and B-4 are verysimilar, the 10 percent exceedance value for Upper Baker is 3,825 cfs, whereas the 10 percentexceedance for Lower Baker is 4,785 cfs. Monthly flow duration curves for the same period(1981–2002 water years) are provided in appendix B-2 of this exhibit.
B.2.4 Reservoir Operation Curves
B.2.4.1 Lower Baker Development
There is no fixed reservoir operation curve for Lake Shannon, although Lake Shannoncan be operated in coordination with Baker Lake to assist in providing increased flood controlprotection.
.

Puget Sound EnergyExhibit B
Baker R
iver Project, FERC
No. 2150
B-6
April 2004
Figure B-3. Flow duration curve for unregulated dailyaverage flows for Lower Baker Developmentinflow (water years 1981 through 2002).(Source: Puget, 2003b)
-
2,000
4,000
6,000
8,000
10,000
12,000
14,000
16,000
18,000
20,000
0% 10% 20% 30% 40% 50% 60% 70% 80% 90% 100%
Percent Exceedance
Dai
ly A
vera
ge D
isch
arge
(cfs
)
Figure B-4. Flow duration curve for unregulated dailyaverage flows for Upper Baker Developmentinflow (water years 1981 through 2002).(Source: Puget, 2003c)
-
2,000
4,000
6,000
8,000
10,000
12,000
14,000
16,000
18,000
20,000
0% 10% 20% 30% 40% 50% 60% 70% 80% 90% 100%
Percent Exceedance
Dai
ly A
vera
ge D
isch
arge
(cfs
)

Puget Sound Energy Exhibit BBaker River Project, FERC No. 2150 B-7 April 2004
Lake Shannon has a normal full pool elevation of 442.35 feet msl, which corresponds to astorage volume of 146,279 acre-feet. The minimum normal pool is 373.75 feet msl,corresponding to a storage volume of 29,509 acre-feet, resulting in an active storage capacity of116,770 acre-feet (figure B-5).
345
355
365
375
385
395
405
415
425
435
445
0 20,000 40,000 60,000 80,000 100,000 120,000 140,000 160,000
Reservoir Storage (acre-feet)
Res
ervo
ir El
evat
ion
(feet
msl
)
Elevation vs. Storage Normal Minimum Pool 373.750 fmsl Normal Maximum Pool 442.35 fmsl
Figure B-5. Elevation vs. storage curve for Lake Shannon.(Source: Puget, 2003b)
B.2.4.2 Upper Baker Development
Baker Lake is not operated on a fixed rule curve. Puget has a flood control agreementwith the ACOE (see section 3.1.2 of the Preliminary Draft Environmental Assessment [PDEA]for additional details) that specifies maximum pool elevations during flood control season.Under the agreement (consistent with Article 32 of the existing license), Puget operates theUpper Baker Development to provide 16,000 acre-feet of flood control storage space betweenNovember 1 and November 15; this requires that Baker Lake be drawn down to elevation 724.50feet msl (3.27 feet below full pool) by November 1 of each year. Additionally, the agreementspecifies that under normal operating conditions the full 74,000 acre-feet of flood control storagebe provided from November 15 to March 1; this requires that Baker Lake be drawn down toelevation 711.56 feet msl, by November 15 of each year (16.2 feet below full pool).
Baker Lake has a normal full pool elevation of 727.77 feet msl, which corresponds to astorage volume of 274,221 acre-feet. The minimum normal pool is 677.77 feet mslcorresponding to a storage volume of 94,076 acre-feet, resulting in an active storage capacity of180,128 acre-feet (figure B-6).

Puget Sound Energy Exhibit BBaker River Project, FERC No. 2150 B-8 April 2004
650
660
670
680
690
700
710
720
730
740
50,000 100,000 150,000 200,000 250,000 300,000
Reservoir Storage (acre-feet)
Res
ervo
ir El
evat
ion
(feet
abo
ve m
sl)
Elevation vs. Storage Normal Minimum Pool 677.77 fmsl Normal Maximum Pool 727.77 fmsl
Figure B-6. Elevation vs. storage curve for Baker Lake.(Source: Puget, 2003b)
B.2.5 Hydraulic Capacity
B.2.5.1 Lower Baker Development
The minimum plant hydraulic capacity at the Lower Baker Development is 600 cfs.
The maximum plant hydraulic capacity is currently limited to 4,100 cfs due totransformer limitations. Absent this limitation, the maximum hydraulic capacity would increaseto 4,700 cfs.
B.2.5.2 Upper Baker Development
The minimum and maximum plant hydraulic capacities of the Upper Baker Developmentare 800 cfs (Unit 2) and 5,100 cfs, respectively.
B.2.6 Tailwater Rating Curve
B.2.6.1 Lower Baker Development
Figure B-7 illustrates the tailwater rating curve below the Lower Baker powerhouse,excluding any backwater effects from the Skagit River. The tailwater curve was developed inconjunction with August 7, 2001, performance tests on Lower Baker Unit 3. Normally, the poolelevation behind the barrier dam located at RM 0.6 downstream of the powerhouse is 174.75 feetmsl; however, when Lower Baker powerhouse is not operating, the pool elevation is raised to176.75 feet msl, improving flow directed to the fish trap facility. There is a commensurate effect

Puget Sound Energy Exhibit BBaker River Project, FERC No. 2150 B-9 April 2004
on tailwater elevation when the pool is raised; however, because the Project is not generating, itdoes not affect plant capacity. Additionally, the Lower Baker tailwater can be affected by SkagitRiver backwater when flow at the Skagit River near Concrete gage is at or above 70,000 cfs,depending on flow in the Baker River. This Skagit River flow (70,000 cfs) is equaled orexceeded about 0.3 percent of the time.
B.2.6.2 Upper Baker Development
The tailwater of the Upper Baker Development is controlled by the reservoir pool level inLake Shannon when the reservoir is high (figure B-8). Depending on the total flow out of theUpper Baker Development, control shifts from Lake Shannon to the channel connecting LakeShannon to the Upper Baker tailwater. Normal full pool at Lake Shannon is 442.35 feet msl.The most representative tailwater for the Upper Baker Development was plotted based on a LakeShannon elevation of 431.8 feet msl. Tailwater values for flows in excess of 5,000 cfs wereextrapolated.
B.2.7 Power Plant Capacity versus Head Curve
B.2.7.1 Lower Baker Development
Figure B-9 illustrates the relationship between the output capacity of the Lower BakerDevelopment and the net head. The capacity at Lower Baker is transformer limited to 77 MW.The maximum normal head occurs when the headwater is at the normal full pool level of 442.35feet msl. Assuming the unit is operating at full gate, the tailwater would be 179.7 feet msl. Thisresults in a gross head of 262.65 feet, which when adjusted for headloss, yields a net head of257.4 feet. Under a median pool level of 431.90 feet msl, the corresponding gross head wouldbe 252.20 feet and the net head 247.00 feet. Similar computations at the minimum generatingpool of 373.75 feet msl yield a net head of 188.8 feet.
B.2.7.2 Upper Baker Development
Figure B-10 illustrates the relationship between the output capacity of the Upper BakerDevelopment and the net head. The Upper Baker plant output under most favorable operatingconditions is 103 MW. The maximum normal head occurs when the headwater is at the normalfull pool level of 727.77 feet msl. Assuming the unit is operating at full gate, the tailwater wouldtypically be 437.6 feet msl. This results in a gross head of 290.2 feet, which when adjusted forheadloss, yields a net head of 287.9 feet. Under a median pool level of 712.00 feet msl, thecorresponding gross head would be 274.40 feet and the net head would be 272.10 feet. Similarcomputations at the minimum generating pool of 677.77 feet msl yield a net head of 237.9 feet.

Puget Sound EnergyExhibit B
Baker R
iver Project, FERC
No. 2150
B-10
April 2004
175
177
179
181
183
185
187
189
191
193
0 5,000 10,000 15,000 20,000 25,000 30,000 35,000 40,000
Total Outflow (cfs)
Tailw
ater
Ele
vatio
n (fe
et m
sl)
Figure B-7. Tailwater rating curve for Lower Bakerpowerhouse.
430
435
440
445
450
455
0 5000 10000 15000 20000 25000 30000 35000 40000 45000 50000
Total Outflow (cfs)
Tailw
ater
Ele
vatio
n (fe
et m
sl)
Figure B-8. Representative tailwater rating curvefor Upper Baker powerhouse.
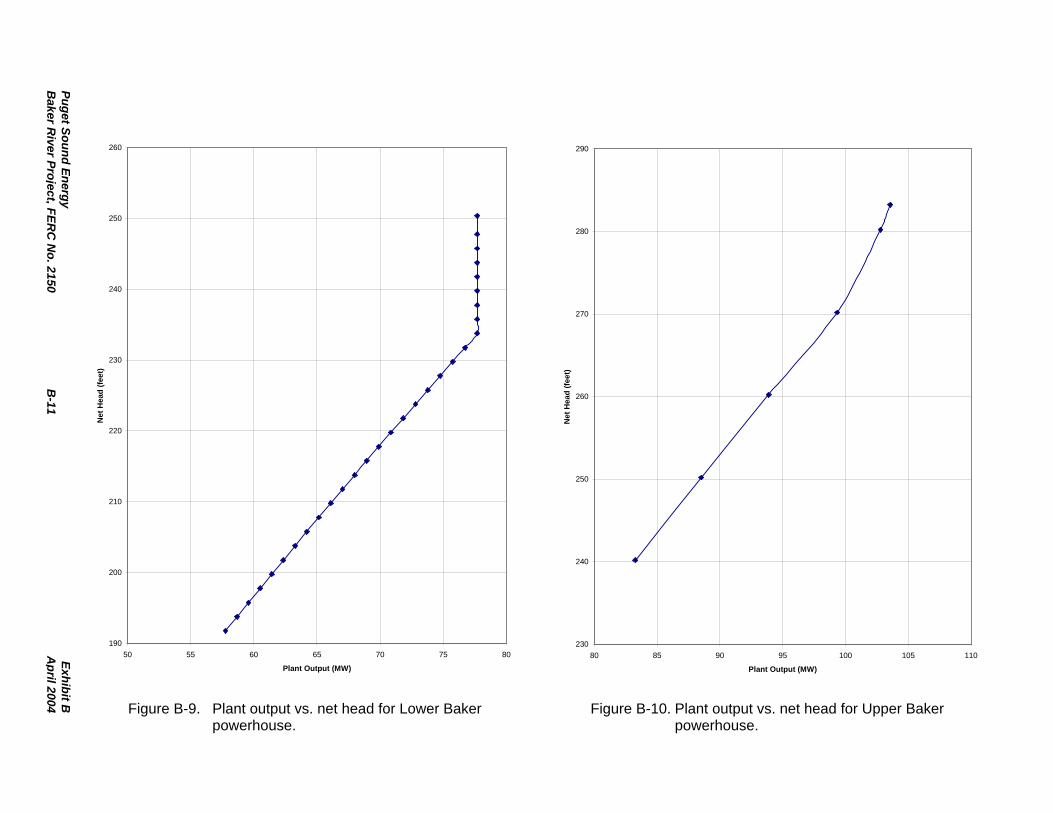
Puget Sound EnergyExhibit B
Baker R
iver Project, FERC
No. 2150
B-11
April 2004
190
200
210
220
230
240
250
260
50 55 60 65 70 75 80
Plant Output (MW)
Net
Hea
d (fe
et)
230
240
250
260
270
280
290
80 85 90 95 100 105 110
Plant Output (MW)
Net
Hea
d (fe
et)
Figure B-9. Plant output vs. net head for Lower Bakerpowerhouse.
Figure B-10. Plant output vs. net head for Upper Bakerpowerhouse.

Puget Sound Energy Exhibit BBaker River Project, FERC No. 2150 B-12 April 2004
B.3 Power Usage
Puget generally uses output from the Baker River Project to meet system load. A portionof the Project output is used to meet station service requirements as described in section B.2.2.
B.4 Future Development
Puget proposes to install a new 680-cfs horizontal-shaft Francis turbine and generator atthe Lower Baker Development for the purpose of providing increased operational flexibility tomeet minimum instream release and ramping requirements (refer to section A.2.6). The new unitwould produce 12.5 MW under maximum flow conditions. With the new unit added, theminimum and maximum hydraulic capacities of the Lower Baker Development would be 200 cfsand 4,780 cfs, respectively. Minimum instream flows downstream of the Project would be 300cfs, of which approximately 245 cfs would be discharged via the new turbine. The effect offuture development on generation and dependable capacity is described in section B.2.2. Theaddition of the new turbine generator would also increase the remotely controlled outflowcapacity available during flood control operations.
B.5 Literature Cited
Puget (Puget Sound Energy). 2003a. Baker River Hydroelectric Project (FERC No. 2150):Hydrology and geomorphology of the Baker and Lower Skagit rivers. Part 1, Study A-24. Prepared for Puget Sound Energy, Bellevue, WA. Prepared by R2 ResourceConsultants, Inc., Redmond, WA. March 2003.
Puget. 2003b. Baker River Project Relicense, Master No. 1 CD of data containing: Baker Riverdaily flow record unregulated condition 1975 to 2002 (adjusted for reservoir storage-elevation changes); reservoir storage-elevation relationships; dam schematics; datumconversion table; and Upper and Lower Baker daily reservoir levels 1975 to 2002. Part 1of 2. Prepared by R2 Resource Consultants, Inc., Redmond, WA. Prepared for PugetSound Energy, Bellevue, WA. June 12, 2003.
Puget. 2003c. Master No. 2 CD of data containing: Baker River daily flow record unregulatedcondition 1975 to 2002 (adjusted for reservoir storage-elevation changes); Dailysynthesized flow to Baker Lake; reservoir storage-elevation relationships; damschematics; datum conversion table; and Upper and Lower Baker daily reservoir levels1975 to 2002. Part 2 of 2. Prepared by R2 Resource Consultants, Inc., Redmond, WA.Prepared for Puget Sound Energy, Bellevue, WA. June 12, 2003.

APPENDIX B-1MONTHLY FLOW DURATION CURVES FOR THE LOWER BAKER
DEVELOPMENT

Puget Sound EnergyExhibit B
Baker R
iver Project, FERC
No. 2150
B-13
April 2004
-
2,000
4,000
6,000
8,000
10,000
12,000
14,000
16,000
18,000
20,000
0% 10% 20% 30% 40% 50% 60% 70% 80% 90% 100%
Percent Exceedence
Dai
ly A
vera
ge D
isch
arge
(cfs
)
-
2,000
4,000
6,000
8,000
10,000
12,000
14,000
16,000
18,000
20,000
22,000
24,000
26,000
28,000
30,000
32,000
34,000
36,000
38,000
40,000
42,000
0% 10% 20% 30% 40% 50% 60% 70% 80% 90% 100%
Percent ExceedenceD
aily
Ave
rage
Dis
char
ge (c
fs)
Figure B-1-1. October flow duration curve for unregulateddaily average flows for Lower BakerDevelopment inflow (water years 1981through 2002). (Source: Puget, 2003b)
Figure B-1-2. November flow duration curve forunregulated daily average flows for LowerBaker Development inflow (water years 1981through 2002). (Source: Puget, 2003b)
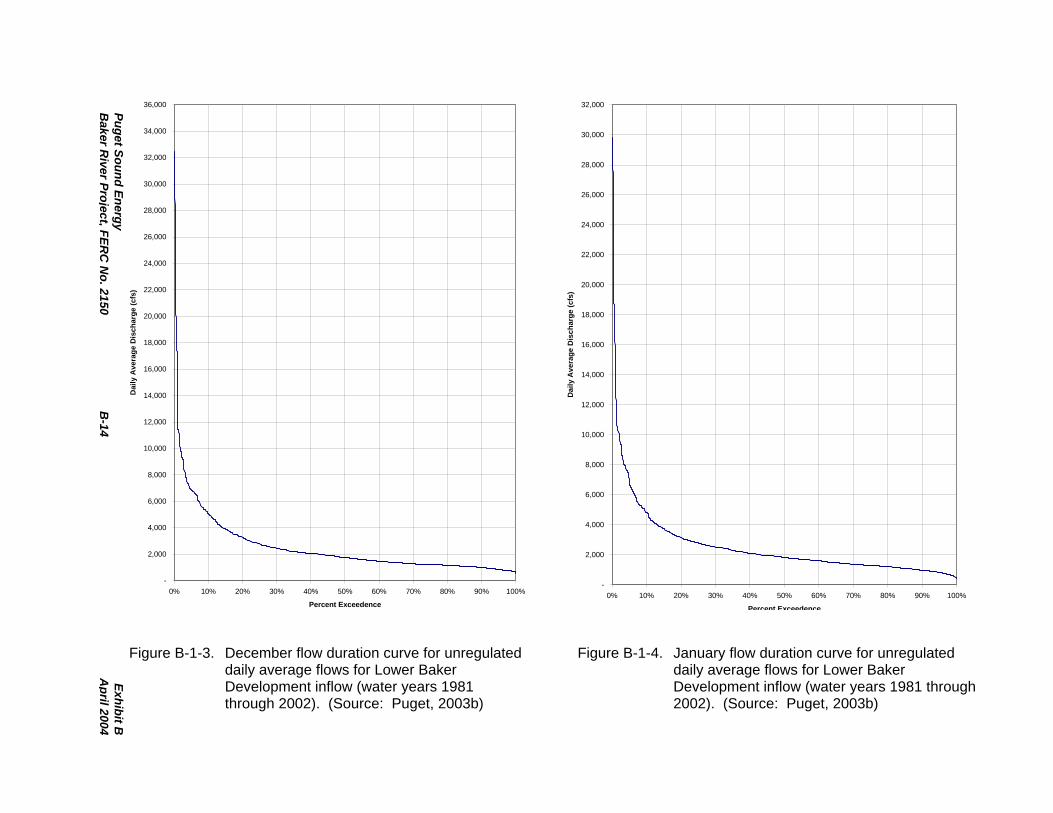
Puget Sound EnergyExhibit B
Baker R
iver Project, FERC
No. 2150
B-14
April 2004
-
2,000
4,000
6,000
8,000
10,000
12,000
14,000
16,000
18,000
20,000
22,000
24,000
26,000
28,000
30,000
32,000
34,000
36,000
0% 10% 20% 30% 40% 50% 60% 70% 80% 90% 100%
Percent Exceedence
Dai
ly A
vera
ge D
isch
arge
(cfs
)
-
2,000
4,000
6,000
8,000
10,000
12,000
14,000
16,000
18,000
20,000
22,000
24,000
26,000
28,000
30,000
32,000
0% 10% 20% 30% 40% 50% 60% 70% 80% 90% 100%
Percent Exceedence
Dai
ly A
vera
ge D
isch
arge
(cfs
)
Figure B-1-3. December flow duration curve for unregulateddaily average flows for Lower BakerDevelopment inflow (water years 1981through 2002). (Source: Puget, 2003b)
Figure B-1-4. January flow duration curve for unregulateddaily average flows for Lower BakerDevelopment inflow (water years 1981 through2002). (Source: Puget, 2003b)

Puget Sound EnergyExhibit B
Baker R
iver Project, FERC
No. 2150
B-15
April 2004
-
2,000
4,000
6,000
8,000
10,000
12,000
14,000
16,000
18,000
20,000
22,000
0% 10% 20% 30% 40% 50% 60% 70% 80% 90% 100%
Percent Exceedence
Dai
ly A
vera
ge D
isch
arge
(cfs
)
-
2,000
4,000
6,000
8,000
10,000
12,000
14,000
16,000
18,000
20,000
22,000
24,000
26,000
28,000
30,000
0% 10% 20% 30% 40% 50% 60% 70% 80% 90% 100%
Percent Exceedence
Dai
ly A
vera
ge D
isch
arge
(cfs
)
Figure B-1-5. February flow duration curve for unregulateddaily average flows for Lower BakerDevelopment inflow (water years 1981 through2002). (Source: Puget, 2003b)
Figure B-1-6. March flow duration curve for unregulateddaily average flows for Lower BakerDevelopment inflow (water years 1981through 2002). (Source: Puget, 2003b)

Puget Sound EnergyExhibit B
Baker R
iver Project, FERC
No. 2150
B-16
April 2004
-
2,000
4,000
6,000
8,000
10,000
12,000
14,000
16,000
0% 10% 20% 30% 40% 50% 60% 70% 80% 90% 100%
Percent Exceedence
Dai
ly A
vera
ge D
isch
arge
(cfs
)
-
2,000
4,000
6,000
8,000
10,000
12,000
14,000
16,000
18,000
0% 10% 20% 30% 40% 50% 60% 70% 80% 90% 100%
Percent Exceedence
Dai
ly A
vera
ge D
isch
arge
(cfs
)
Figure B-1-7. April flow duration curve for unregulated dailyaverage flows for Lower Baker Developmentinflow (water years 1981 through 2002).(Source: Puget, 2003b)
Figure B-1-8. May flow duration curve for unregulated dailyaverage flows for Lower Baker Developmentinflow (water years 1981 through 2002).(Source: Puget, 2003b)

Puget Sound EnergyExhibit B
Baker R
iver Project, FERC
No. 2150
B-17
April 2004
-
2,000
4,000
6,000
8,000
10,000
12,000
14,000
0% 10% 20% 30% 40% 50% 60% 70% 80% 90% 100%
Percent Exceedence
Dai
ly A
vera
ge D
isch
arge
(cfs
)
-
2,000
4,000
6,000
8,000
10,000
12,000
14,000
16,000
18,000
20,000
22,000
0% 10% 20% 30% 40% 50% 60% 70% 80% 90% 100%
Percent Exceedence
Dai
ly A
vera
ge D
isch
arge
(cfs
)
Figure B-1-9. June flow duration curve for unregulated dailyaverage flows for Lower Baker Developmentinflow (water years 1981 through 2002).(Source: Puget, 2003b)
Figure B-1-10. July flow duration curve for unregulated dailyaverage flows for Lower Baker Developmentinflow (water years 1981 through 2002).(Source: Puget, 2003b)

Puget Sound EnergyExhibit B
Baker R
iver Project, FERC
No. 2150
B-18
April 2004
-
2,000
4,000
6,000
8,000
10,000
12,000
0% 10% 20% 30% 40% 50% 60% 70% 80% 90% 100%
Percent Exceedence
Dai
ly A
vera
ge D
isch
arge
(cfs
)
-
2,000
4,000
6,000
8,000
10,000
0% 10% 20% 30% 40% 50% 60% 70% 80% 90% 100%
Percent Exceedence
Dai
ly A
vera
ge D
isch
arge
(cfs
)
Figure B-1-11. August flow duration curve for unregulateddaily average flows for Lower BakerDevelopment inflow (water years 1981 through2002). (Source: Puget, 2003b)
Figure B-1-12. September flow duration curve forunregulated daily average flows for LowerBaker Development inflow (water years 1981through 2002). (Source: Puget, 2003b)

APPENDIX B-2MONTHLY FLOW DURATION CURVES FOR THE UPPER BAKER
DEVELOPMENT

Puget Sound EnergyExhibit B
Baker R
iver Project, FERC
No. 2150
B-19
April 2004
-
2,000
4,000
6,000
8,000
10,000
12,000
14,000
16,000
18,000
0% 10% 20% 30% 40% 50% 60% 70% 80% 90% 100%
Percent Exceedence
Dai
ly A
vera
ge D
isch
arge
(cfs
)
-
2,000
4,000
6,000
8,000
10,000
12,000
14,000
16,000
18,000
20,000
22,000
24,000
26,000
28,000
30,000
0% 10% 20% 30% 40% 50% 60% 70% 80% 90% 100%
Percent Exceedence
Dai
ly A
vera
ge D
isch
arge
(cfs
)
Figure B-2-1. October flow duration curve for unregulateddaily average flows for Upper BakerDevelopment inflow (water years 1981 through2002). (Source: Puget, 2003b)
Figure B-2-2. November flow duration curve for unregulateddaily average flows for Upper BakerDevelopment inflow (water years 1981 through2002). (Source: Puget, 2003b)

Puget Sound EnergyExhibit B
Baker R
iver Project, FERC
No. 2150
B-20
April 2004
-
2,000
4,000
6,000
8,000
10,000
12,000
14,000
16,000
18,000
20,000
22,000
24,000
26,000
0% 10% 20% 30% 40% 50% 60% 70% 80% 90% 100%
Percent Exceedence
Dai
ly A
vera
ge D
isch
arge
(cfs
)
-
2,000
4,000
6,000
8,000
10,000
12,000
14,000
16,000
18,000
20,000
22,000
24,000
26,000
0% 10% 20% 30% 40% 50% 60% 70% 80% 90% 100%
Percent Exceedence
Dai
ly A
vera
ge D
isch
arge
(cfs
)
Figure B-2-3. December flow duration curve for unregulateddaily average flows for Upper BakerDevelopment inflow (water years 1981 through2002). (Source: Puget, 2003b)
Figure B-2-4. January flow duration curve for unregulateddaily average flows for Upper BakerDevelopment inflow (water years 1981through 2002). (Source: Puget, 2003b)

Puget Sound EnergyExhibit B
Baker R
iver Project, FERC
No. 2150
B-21
April 2004
-
2,000
4,000
6,000
8,000
10,000
12,000
14,000
16,000
0% 10% 20% 30% 40% 50% 60% 70% 80% 90% 100%
Percent Exceedence
Dai
ly A
vera
ge D
isch
arge
(cfs
)
-
2,000
4,000
6,000
8,000
10,000
12,000
14,000
16,000
18,000
0% 10% 20% 30% 40% 50% 60% 70% 80% 90% 100%
Percent Exceedence
Dai
ly A
vera
ge D
isch
arge
(cfs
)
Figure B-2-6. March flow duration curve for unregulated dailyaverage flows for Upper Baker Developmentinflow (water years 1981 through 2002).(Source: Puget, 2003b)
Figure B-2-5. February flow duration curve for unregulateddaily average flows for Upper BakerDevelopment inflow (water years 1981 through2002). (Source: Puget, 2003b)

Puget Sound EnergyExhibit B
Baker R
iver Project, FERC
No. 2150
B-22
April 2004
-
2,000
4,000
6,000
8,000
10,000
12,000
14,000
0% 10% 20% 30% 40% 50% 60% 70% 80% 90% 100%
Percent Exceedence
Dai
ly A
vera
ge D
isch
arge
(cfs
)
-
2,000
4,000
6,000
8,000
10,000
12,000
14,000
0% 10% 20% 30% 40% 50% 60% 70% 80% 90% 100%
Percent Exceedence
Dai
ly A
vera
ge D
isch
arge
(cfs
)
Figure B-2-7. April flow duration curve for unregulated dailyaverage flows for Upper Baker Developmentinflow (water years 1981 through 2002).(Source: Puget, 2003b)
Figure B-2-8. May flow duration curve for unregulated dailyaverage flows for Upper Baker Developmentinflow (water years 1981 through 2002).(Source: Puget, 2003b)

Puget Sound EnergyExhibit B
Baker R
iver Project, FERC
No. 2150
B-23
April 2004
-
2,000
4,000
6,000
8,000
10,000
12,000
0% 10% 20% 30% 40% 50% 60% 70% 80% 90% 100%
Percent Exceedence
Dai
ly A
vera
ge D
isch
arge
(cfs
)
-
2,000
4,000
6,000
8,000
10,000
12,000
14,000
16,000
18,000
0% 10% 20% 30% 40% 50% 60% 70% 80% 90% 100%
Percent Exceedence
Dai
ly A
vera
ge D
isch
arge
(cfs
)
Figure B-2-9. June flow duration curve for unregulated dailyaverage flows for Upper Baker Developmentinflow (water years 1981 through 2002).(Source: Puget, 2003b)
Figure B-2-10. July flow duration curve for unregulated dailyaverage flows for Upper Baker Developmentinflow (water years 1981 through 2002).(Source: Puget, 2003b)

Puget Sound EnergyExhibit B
Baker R
iver Project, FERC
No. 2150
B-24
April 2004
-
2,000
4,000
6,000
8,000
10,000
12,000
0% 10% 20% 30% 40% 50% 60% 70% 80% 90% 100%
Percent Exceedence
Dai
ly A
vera
ge D
isch
arge
(cfs
)
-
2,000
4,000
6,000
8,000
0% 10% 20% 30% 40% 50% 60% 70% 80% 90% 100%
Percent Exceedence
Dai
ly A
vera
ge D
isch
arge
(cfs
)
Figure B-2-11. August flow duration curve for unregulateddaily average flows for Upper BakerDevelopment inflow (water years 1981 through2002). (Source: Puget, 2003b)
Figure B-2-12. September flow duration curve for unregulateddaily average flows for Upper BakerDevelopment inflow (water years 1981 through2002). (Source: Puget, 2003b)

Puget Sound Energy Exhibit CBaker River Project, FERC No. 2150 C-1 April 2004
EXHIBIT C—CONSTRUCTION HISTORY ANDPROPOSED CONSTRUCTION SCHEDULE
C.1 Project History
C.1.1 Lower Baker Development
Puget Sound Traction, Light & Power Company was formed in 1912 as a subsidiary ofStone & Webster Service Corporation. In 1917, Stone & Webster announced plans to build ahydroelectric dam on the Baker River to provide electricity for the growing Puget Soundpopulation (HRA, 2000). Puget Sound Traction, Light & Power Company changed its name toPuget Sound Power & Light Company in 1920. In 1997, Puget Sound Power & Light Companymerged with Washington Natural Gas to become Puget Sound Energy and will be referred to asPuget throughout exhibit C.
In 1924, in accordance with Section 23 of the Federal Power Act, Puget filed adeclaration of intent with the Federal Power Commission (FPC) to construct the Lower BakerDevelopment. The FPC found that the proposed construction would not affect the interests ofinterstate or foreign commerce and granted Puget permission to proceed.
Construction of the Lower Baker Development began on April 15, 1924. This originaldevelopment contained two 19.75-MW generators with the provision for an additional 55-MWunit. By the time construction was complete, approximately 1,300 people were working on theProject. On April 13, 1927, the FPC issued Puget a minor part license for the occupancy of75.5 acres of United States lands within the Mt. Baker National Forest. The plant wascommissioned for service on November 19, 1925. In 1927, the dam was raised 33 feet to itsexisting height of 285 feet.
The third generating unit at the Lower Baker Development was installed in October 1960.The powerhouse was subsequently destroyed in an earth slide in May 1965. The powerhousewas rebuilt but Units 1 and 2 were abandoned.
In 2001, Puget rewound the Unit 3 generator and refurbished the turbine, therebyincreasing the authorized plant capacity to 79,330 kW.
C.1.2 Upper Baker Development
During World War II, the Puget Sound area again experienced an increase in populationand the development of new infrastructure. To meet the need for additional generating capacity,Puget sought authorization for the construction of a second hydroelectric project on the BakerRiver (HRA, 2000).

Puget Sound Energy Exhibit CBaker River Project, FERC No. 2150 C-2 April 2004
On June 4, 1956, the FPC issued a license authorizing construction of the Upper BakerDevelopment.9 Construction began immediately and the development went into operation inOctober 1959.
Puget rewound one generator (Unit 2) in 1989 and the second (Unit 1) in 1990. TheUnit 2 turbine was repaired and the wicket gates and servo-motor were refurbished in 1996. In1997, the Unit 1 turbine was refurbished, and the runner was replaced. The authorized capacityof the Upper Baker Development is now 90,700 kW.
C.1.3 Transmission System
There is one primary transmission line within the Baker River Project. The Lower BakerDevelopment’s power output is transmitted at 115 kV to the Baker River switching station,which is the Project’s link to the regional transmission/distribution system. This line was built aspart of the original Lower Baker Development and completed in 1925.
C.1.4 Fish Facilities
Upstream fish passage facilities consisting of a ladder and a tank that delivered the fishinto Lake Shannon were constructed at the Lower Baker Development during original Projectconstruction in 1925. These facilities were replaced with a system using an incline tramway andaerial cables in 1929. In 1957, the system was again redesigned to improve efficiency andconsists of the existing barrier dam and fish trap and holding facility located downstream of theLower Baker powerhouse.
Two artificial spawning beaches and a test beach were established at the upper end ofBaker Lake between 1957 and 1960 to provide spawning habitat for sockeye salmon. Thesebeaches were replaced by a fourth beach of equivalent size in 1990. Although the first twospawning beaches and the test beach are officially retired from service, Spawning Beach 3remains in operation as auxiliary spawning habitat.
The most recent additions to the fish passage facilities at the Baker River Projectparalleled the construction of the Upper Baker Development. An attraction barge (gulper) fordownstream migrants was placed in operation in the forebay of Lake Shannon in April 1958. Asecond barge, similar but with increased flow capacity, was installed in Baker Lake one yearlater. Over the years, a number of modifications have been made to the gulpers to improvemigration conditions, including the 1996 installation of a trapping facility for capturing andtransporting juvenile migrants.
9 The FPC’s Order Issuing License for the construction of the Upper Baker Development also served tointegrate the Lower Baker Development into the same license, thereby establishing one project.

Puget Sound Energy Exhibit CBaker River Project, FERC No. 2150 C-3 April 2004
C.1.5 Project Chronology
Table C-1 presents the chronology of construction, major maintenance, and upgrades ofthe Baker River Project.
Table C-1. Baker River Project chronology.Activity DateLower Baker Development construction 1924–1925Adult fish trap-and-transport system installed below Lower Baker dam 1926Lower Baker dam height raised 33 feet 1927Improvements made to adult fishway—inclined tramway and aerial cableway 1928Lower Baker dam juvenile migrant spillway installed 1955Upper Baker Development construction 1955–1959New adult collection trap-and-haul facility and radial gate weir built belowLower Baker powerhouse
1957
Spawning Beach 1 constructed and tested 1957Lower Baker fish attraction barge installed 1958Spawning Beach 2 constructed 1959Upper Baker fish attraction barge installed 1959Spawning Beach 1 ceased operation 1965Lower Baker powerhouse destroyed and rebuilt following a landslide 1965–1968Spawning Beach 3 constructed 1967Sulphur Creek fish facility constructed 1974Fish guide nets installed at the Upper Baker forebay 1986Upper Baker juvenile trap-and-haul capabilities installed 1987Juvenile trap and haul installed at Lower Baker due to landslide induceddamage to bypass pipeline
1989
Upper Baker Unit 2 generator rewound 1989Upper Baker Unit 1 generator rewound 1990Spawning Beach 4 constructed 1990Lower Baker pipeline repaired and operated through 1995 1991–1995New ballast tanks installed at Lower Baker juvenile collection barge 1993Spawning Beach 4 segmented into 4 isolated compartments 1995Upper Baker Unit 2 repaired 1996Updated Upper Baker juvenile collection facility installed 1996Upper Baker Unit 1 refurbished 1997Lower Baker refurbishments of penstock and generator, replacement ofturbine runner and trashracks
2001

Puget Sound Energy Exhibit CBaker River Project, FERC No. 2150 C-4 April 2004
C.2 Proposed Project Developments
C.2.1 Proposed New Development
C.2.1.1 Lower Baker Development Powerhouse
Puget is proposing to construct a new powerhouse on the site of the original Lower BakerDevelopment powerhouse that was destroyed in 1965 by a landslide. This new powerhousewould be equipped with a 680 cfs horizontal-shaft Francis turbine and generator that wouldprovide the operational flexibility needed to meet the minimum instream flow releases andramping rates being proposed through the collaborative relicensing process. A more detaileddescription of the new powerhouse structure and appurtenant equipment is included in exhibit Aat section A.2.6.
C.2.1.2 Sockeye Salmon Hatchery and Spawning Beach
In conjunction with Puget’s proposed fish propagation and enhancement programs, Pugetwould construct a sockeye salmon hatchery that would include adult holding facilities, artificialincubation facilities, a small concrete hatchery building, and fry ponding facilities. If studiesindicate that the river system can support this increased sockeye production, Puget would designand construct Spawning Beach 5 adjacent to the existing Spawning Beach 4 at the Upper BakerDevelopment.
C.2.2 Proposed Construction Schedule
C.2.2.1 Lower Baker Development Powerhouse
Initially, a permanent access bridge would be constructed to the far north end of the newpowerhouse site to provide an all-weather haul route for removal of materials and a dependablepermanent and easy access to the north side of the new powerhouse. Because of limits to access,barge mounted excavators, drilling equipment and lifting cranes would be required forexcavating pier and abutment foundations, drilling 36-inch diameter steel caissons forintermediate piers, drilling and placing rock bolts, and placing concrete abutments and pier pilecaps. After the bridge foundation supports are in place, a barge mounted heavy lift crane wouldbe used to lift the pre-cast concrete decking onto the end abutments and piers.
There is an estimated 10,000 cubic yards of debris, including loose soil, broken rock, andvegetative cover that would be removed from the area on top of and above the original Units 1and 2 powerhouse footprint. Once excavated, the debris would be loaded onto 40-ton off-roadhaulers that would transport materials to the disposal area.
With the permanent access bridge in place and the debris removed, a small- to medium-sized rubber tired crane would be driven to the abandoned units. The units would be lifted andplaced onto short lowboys or haul trucks for transport to a final disposal site or salvage area.
The concrete in the area under the original Units 1 and 2 would require limited miningand modifications. Both mechanical demolition and limited controlled blasting would be used toexpedite removal of portions of original concrete structures. Placement of new draft tube steel

Puget Sound Energy Exhibit CBaker River Project, FERC No. 2150 C-5 April 2004
embedments would require enlarging and reforming of existing draft tube configurationsextending from the centerline of the new unit to the western edge of the existing concretestructure. In addition, one or two walls from the old powerhouse would be penetrated to provideinternal permanent door access between the old and new powerhouses.
Next, the new powerhouse superstructure would be constructed and the existing gantrycrane rails extended to support new unit equipment installation, after the superstructure iscompleted.
Final design and construction of the new powerhouse would be initiated following licenseissuance. It is anticipated that the new unit would be operational in year 4 of the new licenseterm.
C.2.2.2 Sockeye Salmon Hatchery and Spawning Beach
The proposed sockeye salmon hatchery and Spawning Beach 5 would both be locatedadjacent to the existing Spawning Beach 4, in the cleared and fenced area on the right bank ofthe Baker River near the Sulphur Creek confluence, immediately downstream of the UpperBaker dam.
The hatchery facilities would be sized to support up to 3 million sockeye fry. Permittingand construction of the hatchery would occur during 2005 and 2006.
The new spawning beach would measure approximately 200 feet by 150 feet andincorporate the same general technology as used in the existing Spawning Beach 4. Permittingand construction of Spawning Beach 5 would take place between 2011 and 2012.
C.3 Literature Cited
HRA (Historical Research Associates, Inc.). 2000. Salmon on the Baker River, a history offisheries management at PSE’s Baker River Project. Prepared for Puget Sound Energy,Bellevue, WA. Prepared by Historical Research Associates, Inc., Seattle, WA. 155 p.

Puget Sound Energy Exhibit CBaker River Project, FERC No. 2150 C-6 April 2004
This page intentionally left blank.

Puget Sound Energy Exhibit DBaker River Project, FERC No. 2150 D-1 April 2004
EXHIBIT D—PROJECT COSTS
D.1 Original Cost of the Project
The Baker River Project (Project) was originally licensed in 1956. Because this is a notan initial license, no statement of original costs is necessary.
D.2 Amount Payable if the Project is Taken Over by Another Party
Under 18 CFR § 4.51(e), an estimate of the amount that would be payable if the Projectwere to be taken over under Section 14 of the Federal Power Act is required. This sectionincludes estimates of fair value, net investment, and severance damages.
The fair market value is the net investment and any reasonable severance damages.Puget has computed the fair value of the Project as shown in table D-1.
Table D-1. Project takeover costs.Cost ($2006)
Without Inflation With InflationNet Investment
Current net investment 0 0Net investment in Project relicensing 27,741,800 27,741,800
Subtotal, net investment 27,741,800 27,741,800Severance Damagesa
Cost of replacement power 526,043,100 592,189,700Baker River Project costs –92,088,400 –90,924,600
Subtotal, severance damages 433,954,700 501,265,100Takeover Costs (fair value) 461,696,500 529,006,900a Severance damages reflect a 30-year present value analysis of the cost of acquiring an
equivalent amount of power from combustion turbines after deducting the costs for hydroproduction and maintenance.
Net investment includes historical costs minus the accumulated depreciation. By thisdefinition, upon expiration of the initial license in 2006, the estimated net investment will be$27,741,800.
Severance damages are computed on the basis of the cost to Puget for replacing thepower from the Project during a 30-year license, less the Baker River Project costs that wouldnot be incurred. Replacement power includes both the energy potentially produced by theProject and the dependable capacity the Project provides to the system (see exhibit H, sectionH.3.3.2, table H-2). Puget believes that additional severance costs related to ancillary benefitsprovided by the Project would also be appropriate and would be estimated if a serious takeoverproposal emerges.
The estimated total takeover cost, or fair value, would be no less than $461,696,500without inflation and $529,006,900 with inflation (table D-1).

Puget Sound Energy Exhibit DBaker River Project, FERC No. 2150 D-2 April 2004
D.3 Estimated Costs for New Development
At the Lower Baker Development, Puget proposes to develop 12.5 MW of new capacityat an auxiliary powerhouse to be located adjacent to the existing powerhouse. The new turbinegenerator would be installed for the purpose of providing increased operational flexibility tomeet minimum instream flow release and ramping requirements. Final design and constructionwould commence following license issuance, and the new unit would likely be operational at thestart of year 4 of the term of any new license issued. The basic costs of the auxiliary powerhouseare summarized in table D-2. Additional costs associated with an allowance for funds usedduring construction (AFUDC), FERC fees, insurance costs and land use fees are included in theoverall Project cost in section D.4.
Table D-2. New Project development costs ($2006) for auxiliary powerhouse at Lower BakerDevelopment.
Without Inflation With Inflation
Type of CostPresentValue
LevelizedCosts
PresentValue
LevelizedCosts
Capital cost 15,950,900 1,104,300 15,950,900 1,396,900Operation and maintenance (O&M) 1,770,300 122,600 1,770,300 155,000
Total Cost 1,226,900 1,551,900
D.4 Estimated Average Annual Cost of the Project
Puget estimated the average annual cost of the Project over a 30-year period(2006−2035), using a base year of 2006. Average annual costs include capital costs and annualexpenses.
Puget’s weighted average cost of capital is 6.10 percent without inflation and8.76 percent with inflation (table D-3). Capital costs include the costs of future replacements;costs of the relicensing process; and the capital costs of proposed protection, mitigation, andenhancement (PME) measures (proposed conditions only). Refer to table 6-5 in the Applicant-Prepared PDEA for a listing of these measures.
The rates for taxes and insurance are shown in table D-3.
Annual expenses comprise the Project’s O&M costs, FERC fees, and the O&Massociated with proposed PME measures (proposed conditions only).
Estimated average annual costs are summarized in table D-4.
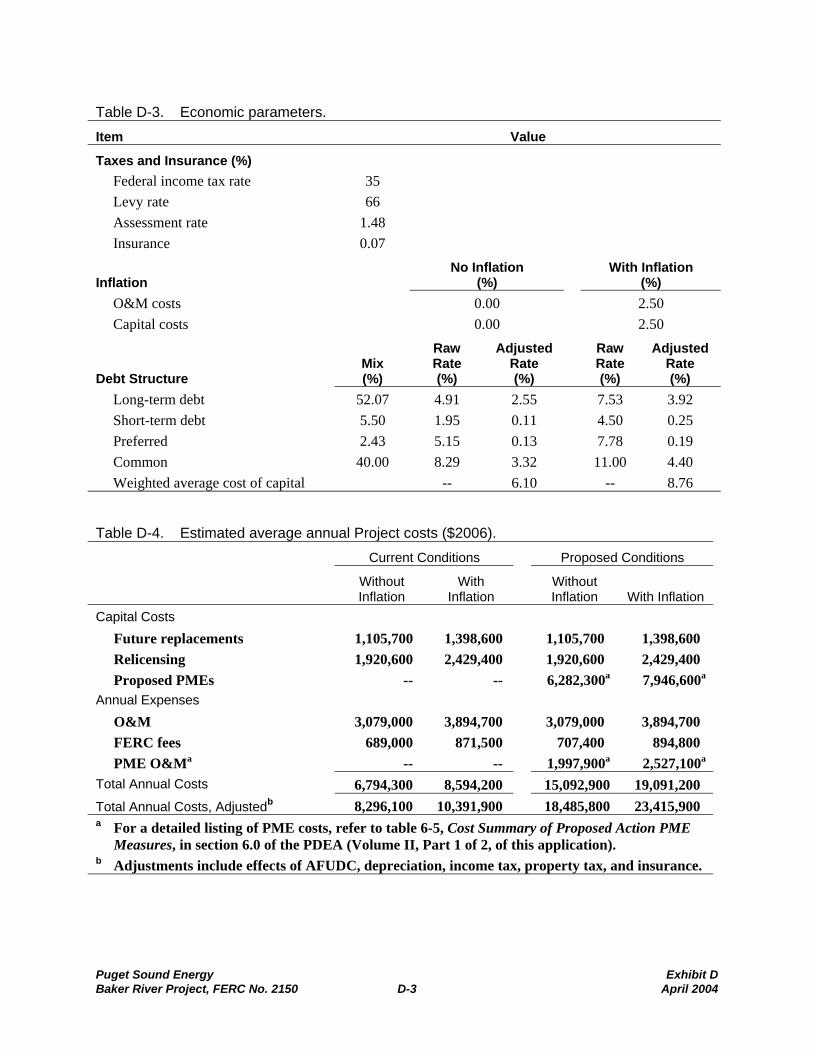
Puget Sound Energy Exhibit DBaker River Project, FERC No. 2150 D-3 April 2004
Table D-3. Economic parameters.Item Value
Taxes and Insurance (%)Federal income tax rate 35Levy rate 66Assessment rate 1.48Insurance 0.07
InflationNo Inflation
(%)With Inflation
(%)O&M costs 0.00 2.50Capital costs 0.00 2.50
Debt StructureMix(%)
RawRate(%)
AdjustedRate(%)
RawRate(%)
AdjustedRate(%)
Long-term debt 52.07 4.91 2.55 7.53 3.92Short-term debt 5.50 1.95 0.11 4.50 0.25Preferred 2.43 5.15 0.13 7.78 0.19Common 40.00 8.29 3.32 11.00 4.40Weighted average cost of capital -- 6.10 -- 8.76
Table D-4. Estimated average annual Project costs ($2006).Current Conditions Proposed Conditions
WithoutInflation
WithInflation
WithoutInflation With Inflation
Capital CostsFuture replacements 1,105,700 1,398,600 1,105,700 1,398,600Relicensing 1,920,600 2,429,400 1,920,600 2,429,400Proposed PMEs -- -- 6,282,300a 7,946,600a
Annual ExpensesO&M 3,079,000 3,894,700 3,079,000 3,894,700FERC fees 689,000 871,500 707,400 894,800PME O&Ma -- -- 1,997,900a 2,527,100a
Total Annual Costs 6,794,300 8,594,200 15,092,900 19,091,200Total Annual Costs, Adjustedb 8,296,100 10,391,900 18,485,800 23,415,900a For a detailed listing of PME costs, refer to table 6-5, Cost Summary of Proposed Action PME
Measures, in section 6.0 of the PDEA (Volume II, Part 1 of 2, of this application).b Adjustments include effects of AFUDC, depreciation, income tax, property tax, and insurance.
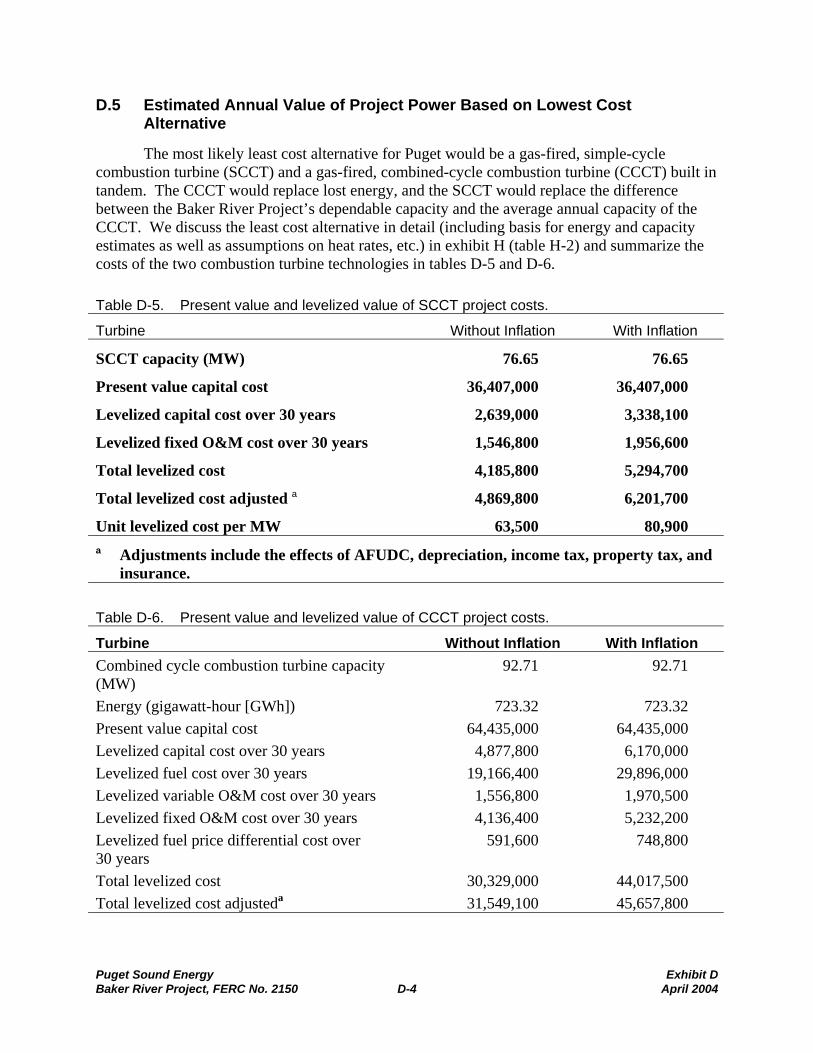
Puget Sound Energy Exhibit DBaker River Project, FERC No. 2150 D-4 April 2004
D.5 Estimated Annual Value of Project Power Based on Lowest CostAlternative
The most likely least cost alternative for Puget would be a gas-fired, simple-cyclecombustion turbine (SCCT) and a gas-fired, combined-cycle combustion turbine (CCCT) built intandem. The CCCT would replace lost energy, and the SCCT would replace the differencebetween the Baker River Project’s dependable capacity and the average annual capacity of theCCCT. We discuss the least cost alternative in detail (including basis for energy and capacityestimates as well as assumptions on heat rates, etc.) in exhibit H (table H-2) and summarize thecosts of the two combustion turbine technologies in tables D-5 and D-6.
Table D-5. Present value and levelized value of SCCT project costs.
Turbine Without Inflation With Inflation
SCCT capacity (MW) 76.65 76.65
Present value capital cost 36,407,000 36,407,000
Levelized capital cost over 30 years 2,639,000 3,338,100
Levelized fixed O&M cost over 30 years 1,546,800 1,956,600
Total levelized cost 4,185,800 5,294,700
Total levelized cost adjusted a 4,869,800 6,201,700
Unit levelized cost per MW 63,500 80,900a Adjustments include the effects of AFUDC, depreciation, income tax, property tax, and
insurance.
Table D-6. Present value and levelized value of CCCT project costs.
Turbine Without Inflation With InflationCombined cycle combustion turbine capacity(MW)
92.71 92.71
Energy (gigawatt-hour [GWh]) 723.32 723.32Present value capital cost 64,435,000 64,435,000Levelized capital cost over 30 years 4,877,800 6,170,000Levelized fuel cost over 30 years 19,166,400 29,896,000Levelized variable O&M cost over 30 years 1,556,800 1,970,500Levelized fixed O&M cost over 30 years 4,136,400 5,232,200Levelized fuel price differential cost over30 years
591,600 748,800
Total levelized cost 30,329,000 44,017,500Total levelized cost adjusteda 31,549,100 45,657,800

Puget Sound Energy Exhibit DBaker River Project, FERC No. 2150 D-5 April 2004
Turbine Without Inflation With InflationUnit levelized cost per MW 340,300 492,500Unit cost of energy ($/MWh) 43.62 63.12a Adjustments include the effects of AFUDC, depreciation, income tax, property tax, and
insurance.
D.6 Source and Extent of Financing and Annual Revenues Available
Operating revenues are available to Puget from electric energy, natural gas, and othersales (refer to table D-7). The actual financing of utility construction and operational needsdepends on the cost and availability of external funds through capital markets and financialinstitutions. Puget expects to finance any Project additions as part of its construction financingprogram, using funds from operations plus the sale of some securities. No specific Project-related financing is anticipated.
Table D-7. Puget Sound Energy, Inc., income statement—twelve months endedDecember 31, 2002 (dollars in thousands, except for earnings per share).(Source: Adapted from Puget, 2003)
Variance from 2001Actual(2002)
Actual PriorYear
(2001) $ %Operating Revenues
Electric $1,365,885 $1,865,227 –$499,342 –27Gas 697,155 815,071 –117,916 –14Other 9,753 32,476 –22,723 –70
Total Operating Revenue 2,072,793 2,712,774 –639,981 –24Operating ExpensesEnergy Costs:
Purchased electricity 645,371 918,676 273,305 30Purchased gas 405,016 537,431 132,415 25Electric generation fuel 113,538 281,405 167,867 60Residential/farm exchange credit –149,970 –75,864 74,106 –98FAS-133 unrealized (gain) loss –11,612 –11,182 430 –4
Utility O&M 286,220 265,789 –20,431 –8Other O&M 1,602 8,546 6,944 81Depreciation and amortization 215,317 208,720 –6,597 –3Conservation amortization 17,502 6,493 –11,009 –170Taxes other than income taxes 202,380 207,365 4,985 2Income taxes 52,836 76,915 24,079 31
Total Operating Expenses 1,778,200 2,424,294 646,094 27Operating Income 294,593 288,480 6,113 2Other income (net of tax) 5,215 17,053 –11,838 –69

Puget Sound Energy Exhibit DBaker River Project, FERC No. 2150 D-6 April 2004
Variance from 2001Actual(2002)
Actual PriorYear
(2001) $ %Income Before Interest Charges 299,808 305,533 –5,725 –2Interest charges 190,860 186,403 –4,457 –2Net Income Before Cumulative Effect ofAccounting Change
108,948 119,130 –10,182 –9
FAS-133 transition adjustment loss(net of tax)
-- 14,749 14,749 100
Net Income 108,948 104,381 4,567 4Less preferred stock dividendsaccruals
7,831 8,413 582 7
Income from Common Stock $101,117 $95,968 $5,149 5Puget Energy Common SharesOutstanding Weighted Avg.
88,372 86,445 1,927 2
Earnings per Share before CumulativeEffect of Accounting Change
$1.14 $1.28 –$0.14 –11
Cumulative Effect of FAS-133Accounting Change
-- –0.17 0.17 –100
Earnings per Share $1.14 $1.11 $0.03 3
D.7 Literature Cited
Puget Energy. 2003. 2002 annual report. Puget Energy, Bellevue, WA.

Puget Sound Energy Exhibit EBaker River Project, FERC No. 2150 E-1 April 2004
EXHIBIT E—ENVIRONMENTAL REPORT
Puget and the interested parties in the Baker River Project relicensing petitioned theCommission and received the Commission’s approval to use the alternative licensing process.This process has allowed Puget and the interested parties to prepare and substitute an applicant-prepared PDEA in place of the traditional exhibit E of a license application, pursuant to 18 CFR§ 4.34(i)(6)(iv). The PDEA has been filed under separate cover as part of this license application(Volume II).
As a condition of using the alternative licensing process, Puget and the interested partiesparticipating in the process developed a Communications Protocol to guide the handling anddocumentation of Project-related information. To facilitate the distribution of such informationto all interested parties and to establish a record of consultation, Puget constructed a Baker RiverProject relicensing website. This website, available at www.pse.com, provides an overview ofthe Project and of the relicensing process, as well as study plans and results, meeting schedulesand summaries, and work products and reports.

Puget Sound Energy Exhibit EBaker River Project, FERC No. 2150 E-2 April 2004
This page intentionally left blank.

Puget Sound Energy Exhibit FBaker River Project, FERC No. 2150 F-1 April 2004
EXHIBIT F—GENERAL DESIGN DRAWINGS
F.1 General Design Drawings
Note: The Federal Energy Regulatory Commission Rule RM02-40-000, Order No. 630,as amended by RM02-4-001 and PL02-1-001, Order No. 630-A, requires applicants to separatecertain information into the following categories:
• Public
• Non-Internet Public
• Critical Energy Infrastructure Information
• Privileged (other non-public)
Drawings of the general design and principal project works for the Baker River Projectare classified as Critical Energy Infrastructure Information (CEII) under Order 630. Theseexhibit F drawings are included in Volume I, Part 2 of 2 of the Application for New License andare identified as “Critical Energy Infrastructure Information.” The drawings will not be availablein the Commission’s Public Reference Room or as a public access image on the Commission’sFERRIS or eLibrary web locations, except as an indexed item. The drawings contained inexhibit F are listed in table F-1 below.
Table F-1. Baker River Project general design drawings.
Drawing Number Drawing TitleF-1 General Plan and Profile, Lower Baker Development
F-2 Plan and Detail of Gravity–Arch Dam, Lower Baker Development
F-3 Powerhouse Cross Section, Lower Baker Development
F-4 Barrier Dam and Fish Trap, Lower Baker Development
F-5 Plan and Section, Upper Baker Development (including proposedsockeye salmon hatchery and Spawning Beach 5 facilities)
F-6 Dike Plan and Section, Upper Baker Development
F-7 Powerhouse Cross Sections, Upper Baker Development
F-8 Proposed Powerhouse, Lower Baker Development
F-9 Station One-Line Diagram, Lower Baker Development
F-10 Station One-Line Diagram, Upper Baker Development (2 sheets)
Procedures for obtaining access to CEII may be found at 18 CFR § 388.113. Requestsfor access to CEII should be made in writing to the Commission’s CEII Coordinator and includethe requester’s name, title, address, telephone number and social security number; the name,

Puget Sound Energy Exhibit FBaker River Project, FERC No. 2150 F-2 April 2004
address and telephone number of the person or entity on whose behalf the information isrequested; a detailed statement explaining the particular need for and intended use of theinformation; and a statement as to the requester’s willingness to adhere to limitations on the useand disclosure of the information requested.
F.2 Supporting Design Report
Included as Puget’s Supporting Design Report is reference to the current FERC Part 12DDam Safety Report. This Part 12D Report is dated and was filed with the Commission onSeptember 10, 1999. The next Part 12D Report is to be submitted to the FERC PortlandRegional Office by August 1, 2004. Part of the document is considered non-public under theCEII. A third-party may request access to this report using the same procedures described undersection F.1.
Puget Sound Energy Exhibit GBaker River Project, FERC No. 2150 G-1 April 2004
EXHIBIT G—MAPS OF THE PROJECT
Note: The Federal Energy Regulatory Commission Rule RM02-40-000, Order No. 630,as amended by RM02-4-001 and PL02-1-001, Order No. 630-A, requires applicants to separatecertain information into the following categories:
• Public
• Non-Internet Public
• Critical Energy Infrastructure Information (CEII)
• Privileged (other non-public)
Exhibit G mapping of the Baker River Project, located in the counties of Skagit andWhatcom in the state of Washington, identifies the current Project boundary and the location ofall CEII Project features within that boundary.
Puget is proposing to modify the current Project boundary through the removal of38.5 acres of a mix of Puget (17.4 acres), WDNR (0.7 acres), Washington Department ofTransportation (WDOT) (4.8 acres), and private (15.6 acres) lands at the Lower BakerDevelopment, adjacent to and south of Washington State Highway 20. No Project facilities arelocated on these lands, nor have they been used in the past to support Project-related activities.These lands are unimproved with the exception of the 4.8 acres owned by WDOT and occupiedby State Highway 20. The remaining 0.7 acres of state land was acquired by WDOT for thehighway construction and deeded to the WDNR when it was not utilized for road surface or roadballast. A portion of the WDOT land (2.5 acres) used for State Highway 20 is assumed to beowned by the WDOT; however, no title for the land has been located to date. All affected landowners, as reflected in the Skagit County land ownership database, have been notified by mail ofthe proposed boundary adjustment. This proposed adjustment in the Project boundary is alsodepicted on the exhibit G mapping.
These exhibit G maps are included in Volume I, Part 2 of 2 of the Application for NewLicense and are identified as “Critical Energy Infrastructure Information.” The maps will not beavailable in the Commission’s Public Reference Room or as a public access image on theCommission’s FERRIS or eLibrary web locations, except as an indexed item. The description offederal lands located within the Project boundary, although depicted on the exhibit G maps, canalso be found in exhibit A, section A.4.
Procedures for obtaining access to CEII may be found at 18 CFR § 388.113. Requestsfor access to CEII should be made in writing to the Commission’s CEII Coordinator and includethe requester’s name, title, address, telephone number, and social security number; the name,address, and telephone number of the person or entity on whose behalf the information isrequested; a detailed statement explaining the particular need for and intended use of theinformation; and a statement as to the requester’s willingness to adhere to limitations on the useand disclosure of the information requested.

Puget Sound Energy Exhibit GBaker River Project, FERC No. 2150 G-2 April 2004
This page intentionally left blank.

Puget Sound Energy Exhibit HBaker River Project, FERC No. 2150 H-1 April 2004
EXHIBIT H—GENERAL INFORMATION
H.1 Efficiency and Reliability
Puget furnishes electric and gas service in a territory covering approximately 6,300square miles. Puget is sole owner of 1,101 MW of hydroelectric and natural gas/oil-firedgeneration. With other utilities, Puget additionally owns four mine-mouth coal-fired, steam-electric generating units; the Puget share of these units totals 700 MW. In combination withabout 2,776 MW of purchased power, these resources are managed by Puget to provide efficientand reliable service to its 958,000 electric customers. As of December 31, 2003, Puget had2,155 full-time employees.
Puget intends to apply its demonstrated expertise in operating and managing powergenerating resources to the efficient and reliable operation of the Baker River Project over theterm of the new license.
H.1.1 Plans for Increased Capacity or Generation
Puget has conducted a regular program of generator rewinds and turbine refurbishmentsat the Baker River Project (reference exhibit C, table C-1). As a result of work between 1989and 1997, the authorized capacity of the Upper Baker Development was increased from 85,500kW to 90,700 kW. Based on work completed in 2001, the authorized capacity of the LowerBaker Development was increased from 71,360 kW to 79,330 kW.
For the purpose of providing increased operational flexibility to meet minimum instreamflow release and ramping requirements proposed in the collaborative process, Puget wouldrehabilitate the original power generating facilities at the Lower Baker Development that weredestroyed by the 1965 landslide. The auxiliary powerhouse would include a new turbinegenerator attached to an existing penstock within the concrete foundation of the original 1925powerhouse. A new 680-cfs horizontal-shaft Francis turbine and generator would be connectedto an existing abandoned 7-foot-diameter penstock. The new turbine would produce 12.5 MW ata discharge of 680 cfs.
H.1.2 Project Coordination with Other Electric Systems
Puget operates the Baker River Project in coordination with its other power supplyresources to meet the power needs of its customers within the constraints of flood controlrestrictions at the Upper Baker Development. On a weekly basis, the demand for electricity isgenerally higher Monday through Friday than on weekends, and, on a daily basis, the demand forpower peaks during the morning (6 a.m. to 10 a.m.) and early evening (5 p.m. to 9 p.m.).Typically, the Project generates power on weekdays between 5 a.m. and 9 p.m. Depending onlake levels, inflows, weather forecasts, and system demand, the Project may not generateweeknights and on weekends.
In the Pacific Northwest, maximum power loads occur during the winter, whilemaximum unregulated power generation potential is greatest during the spring snowmelt runoffperiod. Storage projects such as the Baker River Project help adapt the natural power potential

Puget Sound Energy Exhibit HBaker River Project, FERC No. 2150 H-2 April 2004
to the shape and timing of the power demand by storing water during the spring runoff whenpower loads are relatively low and releasing stored water during the winter when it is mostneeded for generation. As a signatory to the PNCA, Puget operates the Baker River Project as anelement of the coordinated system in accordance with the provisions of that agreement. Duringthe winter period (October through March), Puget typically drafts the Project reservoirs duringthe daily and weekly peaks to provide power for meeting the higher demand. This drawdownalso serves to make room in the reservoirs to capture the spring runoff from snowmelt. Becauseof snowmelt and lower regional electricity demand during the warmer months, the reservoirs aretypically refilled to near full pool during the April-to-June period.
H.1.3 Flood Control Coordination with Upstream or Downstream Projects
There are no water resource developments upstream of the Baker River.
The ACOE coordinates flood control operations between Seattle City Light’s Ross Lakereservoir on the Upper Skagit River and the Baker River Project, with Puget’s assistance, toreduce flooding in the Lower Skagit River valley during the October-to-March flood season.Reduction of peak flow during major floods is assigned the highest reservoir regulation priority.
Article 32 of the existing FERC license specifies that Puget provide each year 16,000acre-feet of reservoir storage in Baker Lake as replacement valley storage eliminated by thedevelopment of the Project, and allowed for the ACOE to request up to a maximum of anadditional 84,000 acre-feet associated with any federally approved flood control. Following afeasibility analysis and assessment of needed additional storage, in a September 10, 1976, reportto Congress, the ACOE recommended 58,000 acre-feet flood control storage in addition to the16,000 acre-feet required by the license, for a total of 74,000 acre-feet (26,000 acre feet less thanthe 100,000 acre feet maximum allowed by Article 32).10 The ACOE recommendation wasconfirmed by Congressional authorization in 1977. The flood control operation is governed byan agreement between ACOE and Puget.
Under the agreement (and in keeping with Article 32 of the existing license), Pugetoperates the Upper Baker Development to provide 16,000 acre-feet of flood control storagespace between November 1 and November 15, and under normal operating conditions the full74,000 acre-feet of flood control storage is provided from November 15 to March 1.
During flood events when natural flow in the Skagit River is forecasted to exceed90,000 cfs at Concrete, Washington, the ACOE assumes responsibility for Baker Lake floodcontrol regulation and coordinates the Upper Baker Development operation with Seattle City
10 The ACOE, in partnership with Skagit County, is conducting a study of additional flood controlstorage potential at the Baker River Project. This initial study phase to identify and evaluate thehydrology and hydraulic impacts associated with additional flood control storage has been initiated.See ACOE’s Skagit River Flood Damage Reduction and Ecosystem Restoration Project FeasibilityStudy Project Management Plan, dated December 24, 2003, which identifies federal and non-federalfunding requirements and responsibilities for performing studies over a 12-month period, ending inDecember 2004.

Puget Sound Energy Exhibit HBaker River Project, FERC No. 2150 H-3 April 2004
Light’s Ross Lake reservoir on the Upper Skagit River to reduce the flood peak in the LowerSkagit River valley. Collectively, Baker Lake and Ross Lake reservoir control runoff from about39 percent of the Skagit River Basin. The flood control storage space is used to retain waterduring floods that can be later released as the unregulated flood flows in the Skagit River recede.
H.2 Applicant’s Need for the Project
Puget is an investor-owned utility that provides electric service to approximately 958,000residential, commercial, and industrial customers in the state of Washington. As of year-end2002, Puget’s peak electric power resources were approximately 4,577 MW, and Puget’shistorical peak load (occurring December 21, 1998) was 4,847 MW.
Puget meets the majority of its customers’ peak power needs (about 61 percent in 2002)through power purchases from multiple generating sources including various mid-Columbiapublic utility districts and non-utility generators (NUGs). Puget-controlled generating plantsprovide the remaining 39 percent of the peak demand of its customers (Puget, 2003).Hydroelectric resources account for about 17 percent of Puget’s company-controlled capacity,and the Baker River Project represents over half (about 57 percent) of Puget’s company-controlled hydroelectric resource base.
Puget’s Least Cost Plan11 identifies the Applicant’s current and projected futuregenerating capacity and production, as well as current and future loads. Puget expects its electricsales to grow (base case forecast) at an average annual rate of 1.4 percent, from 2,181 averagemegawatts (aMW) in 2002 to 2,891 aMW in 2022. This forecast is driven primarily by theaddition of new customers, and it incorporates anticipated conservation savings. Withoutconservation savings, the forecasted base case average annual growth rate would be 1.7 percent.Compared to the historical growth rate of 2.1 percent per year, the forecast is lower as a result ofa ramp-up in conservation program savings, slower growth in population and employment in thenear term, and an increasing share of multi-family residential units, which have lower use percustomer. Puget forecasts increased peak loads over time as the number of customers increases.The forecasted annual rate of growth in the peak loads (about 1.6 percent) is slightly higher thanthe growth rate in energy needs (about 1.4 percent) since residential energy load is growingfaster than non-residential, and the residential sector makes a larger contribution to peakdemands. Puget forecasts peak load to grow from 4,670 MW in 2002 to 6,384 MW in 2022.
The loss of existing resources, including the expiration of power supply and non-utilitygeneration contracts significantly affects Puget’s load-resource outlook. Puget will lose314 aMW of energy and 755 MW of capacity by 2010 because of the expiration of current powersupply contracts. Another 600 aMW of energy will be lost through the expiration of hydropowerand NUG contracts by 2012.
11 Puget’s Least Cost Plan can be accessed on the Internet at http://www.pse.com/about/supply/leastcostupdate.html.
Puget Sound Energy Exhibit HBaker River Project, FERC No. 2150 H-4 April 2004
The Baker River Project, with an installed capacity of 170.03 MW, generated an annualaverage of 708,000 (MWh), or about 81 aMW, over a 22-year period from 1981 through 2002water years. Overall, the Project accounts for about 3.7 percent of Puget’s peak power resourcesand about 2.6 percent of Puget’s average annual generation. Looking to the future, with recentturbine generator upgrades and optimized operations, Puget estimates that annual generationunder current conditions would average 723,320 MWh (see exhibit B, section B.2.2). If Pugetwere not issued a new license for the Baker River Project, Puget would be faced with replacingthis energy and capacity at current costs.
H.2.1 Costs and Availability of Alternative Sources of Power if License NotGranted
The Baker River Project operates primarily as a load-following resource (38 percentcapacity factor for Upper Baker Development and 59 percent for Lower Baker Development).Replacing the energy and capacity would be evaluated in terms of net effects on Puget’s overallelectric resource portfolio rather than on a stand-alone basis. New generating resources thatwould be considered would include a natural gas CCCT for baseload, and duct firing or SCCTfor peaking. CCCTs account for most of the new generation proposed and under development inthe Northwest. A plant design could incorporate one to three gas turbine generators (about160 MW each) in combination with a steam turbine of about 80–90 MW per turbine. A heatrecovery system captures heat from the gas turbine to create the steam for the secondary steamturbine system. Additional peaking capacity can be achieved with duct-firing when gascombustion augments the heat recovery system to create more steam energy. A new CCCTcould be located in or near Puget’s service territory. Because power from a small power plantwould be proportionately more expensive than power from a larger, efficiently sized plant, thepower replacement cost estimates are based on the unit costs for constructing large, efficientCCCTs.
Puget routinely evaluates the feasibility of adding system generation and capacity from afull range of reasonable alternative resources. As described in the Least Cost Plan, Puget has awide variety of available electric resource opportunities to balance its load-resource outlook.These alternatives include conservation, renewable and thermal generating resources, and otheroptions such as demand-response programs, fuel conversions, distributed generation, andconservation voltage reduction (refer to section H.3.3 for additional discussion).
H.2.2 Replacement Costs and Increased Costs if License Not Granted
The current estimate of the 30-year annual levelized cost of owning and operating theBaker River Project, starting in 2006, is $8,296,100 without inflation and $10,391,900 withinflation (see section D.4, table D-4).
The estimated minimum annual cost to replace the generation and capacity of the BakerRiver Project with new gas-fired combustion turbine generation, also starting in 2006, is$36,418,900 without inflation and $51,859,500 with inflation (see section H.3.3.2).

Puget Sound Energy Exhibit HBaker River Project, FERC No. 2150 H-5 April 2004
If Puget is not granted a new license for the Baker River Project, the 30-year annuallevelized cost would increase $28,122,800 without inflation and $41,467,600 with inflation. Theequivalent present value (2006) of this annualized cost increase is $406,212,900 without inflationand $473,523,300 with inflation.
H.2.3 Effects of Alternative Sources of Power
H.2.3.1 Effects on Customers
Puget’s electric service area encompasses all or parts of Island, Jefferson, King, Kitsap,Kittitas, Pierce, Thurston, Skagit and Whatcom counties. Puget is subject to the regulatoryauthority of the Washington Utilities and Transportation Commission as to retail utility rates.
Because Puget is a regulated electric utility company, the costs of power production,procurement, and distribution are passed directly on to residential, commercial and industrialcustomers, including wholesale customers within the Puget service area, including wholesalecustomers. Any viable new generating resource equal in output and comparable in operatingcharacteristics to the Baker River Project would likely be substantially more expensive thancontinued operation of the existing Project. Therefore, under current laws and regulations,replacing the Project with a different generating resource would likely increase retail power costsacross the entire service area.
H.2.3.2 Effects on Operating and Load Characteristics
The Baker River Project is a very stable component of Puget’s generating resources andlike most hydroelectric projects can be brought on-line quickly. Puget’s hydroelectric resourceshave a lower reserve requirement (5 percent) than thermal generation (7 percent). If a newlicense were not granted for the Project, its power production would likely be replaced with newthermal generating resources that may not be as reliable, stable, or dependable as the existingProject. Loss of the Baker River Project could significantly affect Puget’s regional operating andload characteristics. Puget would need to conduct detailed load flow modeling to fully assesssuch impacts if Project retirement or license transfer were considered.
H.2.3.3 Effects on Communities Served
The Baker River Project is part of Puget’s integrated power supply system. Therefore,the communities served by the Project are the residential and business customers throughoutPuget’s service area (see section H.2.3.1). The loss of this generating resource would result inhigher power production costs associated with replacement power, and these higher costs would,under current law, be passed on to all consumers in Puget’s service area.
If the license were transferred to a different licensee, the Project’s operating costs andpower benefits would be transferred to the new licensee. This would result in a reallocation ofthe Project’s net benefits from Puget customers to the customers of the new licensee.
Puget Sound Energy Exhibit HBaker River Project, FERC No. 2150 H-6 April 2004
H.3 Data on Cost, Need, and Availability of Alternatives
H.3.1 Cost of Project Power
The power production costs of the Baker River Project consist of carrying charges andO&M expenses. Under Current Operations and with existing license terms, annual carryingcharges, including capital expense recovery, return on equity, and taxes, are $3,026,300 withoutinflation and $3,828,000 with inflation. These costs include the relicensing-related costsincurred to date and anticipated through the issuance of a new license. Current annual O&Mexpenses including FERC fees are $3,768,000 without inflation and $4,766,200 with inflation.Levelized annual costs over a 30-year analysis period, adjusted to include depreciation, incometax, property tax, and insurance, are $8,296,100 without inflation and $10,391,900 with inflation.Based on current average annual generation of 723,320 MWh, the current production cost is$11.47 per MWh without inflation and $14.37 per MWh with inflation.
The estimated cost of power is based on incorporating the PME measures as described inthe PDEA (refer to table 6-5). With these measures included, the annual carrying charges are$9,308,600 without inflation and $11,774,600 with inflation, and the annual O&M expenses are$5,784,300 without inflation and $7,316,600 with inflation. Levelized annual costs over a 30-year analysis period, adjusted to include depreciation, income tax, property tax, and insurance,are $18,485,800 without inflation and $23,415,900 with inflation. The average annualgeneration is 721,060 MWh, and the power production cost is $25.64 per MWh without inflationand $32.47 per MWh with inflation12. The actual cost of power from the Project would dependon the ultimate terms of a new license.
H.3.2 Resource Requirements
H.3.2.1 Capacity and Energy Requirements over the Short and Long Term
Each year, Puget develops a 20-year forecast of customers, energy sales, and peakdemands for its electric service territory. Puget uses this forecast in short-term planningactivities, as well as in various long-term planning activities such as development of the LeastCost Plan. The following summarize key assumptions and results from the Least Cost Planforecast:
• Annual real gross domestic product is anticipated to grow at 3.2 percent over theforecast period (compared to an average of 3.1 percent between 1970 and 2000);
• Employment growth in the Puget service area is anticipated to grow at an annual rateof 1.7 percent over the period (compared to 30-year historical employment growth of3.3 percent per year);
• Electric rates (in nominal dollars) are anticipated to grow between 2.4 and 2.7 percentper year over the next 20 years, resulting in declining real electric rates;
12 The estimated value of on-peak and off-peak power is shown in table 6-1 of the PDEA.

Puget Sound Energy Exhibit HBaker River Project, FERC No. 2150 H-7 April 2004
• Electric conservation savings are assumed to grow by 15 aMW per year(approximately 0.6 percent of total billed sales) for the next 10 years;
• Puget anticipates the number of electric customers to grow at an average annual rate of1.8 percent per year, to 1.35 million customers in 2022; and
• Puget’s electric sales are forecasted to grow at an average annual rate of 1.4 percentper year in the base case projection, from 2,224 aMW in 2004 to 2,891 aMW in 2022.
To determine the amount of power that needs to be generated to supply the forecastedelectric sales, the sales forecast is increased to account for transmission and distribution losses(6.4 percent of generation) and the time lag associated with the monthly billing cycle.
Puget forecasts peak load, which is defined as the hourly load expected to occur when thehourly temperature during the winter months (November through February) is 23ºF at Seattle-Tacoma International Airport (Sea-Tac). Based on historical Sea-Tac temperature data, there is a50 percent probability of the minimum hourly temperature during the winter months being 23ºFor lower. The expected peak load for the year is expected to occur in January of each year givenPuget’s customer use profiles.
H.3.2.2 Existing Energy and Capacity Resources
The Least Cost Plan (Chapter VIII) examines Puget’s existing resources for meetingcustomer demand. Puget uses a mix of conservation and efficiency, net metering, and generationsupply resources, including hydropower, coal, NUG contracts, combustion turbines, and long-term contracts with Qualifying Facilities and non-Qualifying Facilities.
Puget currently offers conservation programs that provide for efficiency savings from allcustomer classes. Puget has provided conservation services for its electricity customers since1979, saving approximately 1,908,288 MWh (net, cumulative, annual) or 281 aMW (net,cumulative load reduction) through 2002. These energy savings represent over 11 percent ofPuget’s average existing electric loads. In August 2002, Puget doubled its annual conservationtargets. Approximately 20 existing programs were expanded, and another 10 programs and pilotprojects were initiated. Refer to section H.11 for a more detailed description of conservationprograms.
Puget’s “Schedule 150” net metering customers provide an existing resource by operatingfuel cells or hydroelectric, solar, or wind power generators on their own premises. Suchgenerators operate in parallel with Puget’s transmission and distribution facilities. In total, thesecustomers represent approximately 37 kW of supply.
Hydroelectric resources include Puget-owned plants (Baker River, Snoqualmie Falls, andElectron) totaling 131 aMW (based on previous 10 years of generation) and long-term contractsfor generation from large mid-Columbia River projects (717 aMW).

Puget Sound Energy Exhibit HBaker River Project, FERC No. 2150 H-8 April 2004
Puget owns a 50-percent share in Colstrip 1 & 2 and a 25 percent share in Colstrip 3 & 4,coal-fired facilities located in Colstrip, Montana. The Puget share in these facilities totals573 aMW.
Encogen, a former NUG purchased by Puget in 1999, is a natural gas-fired cogenerationfacility located in Bellingham, Washington, with a nominal capacity of 170 MW.
Puget operates four SCCT facilities (Fredonia 1 & 2, Fredonia 3 & 4, Frederickson 1 & 2,and Whitehorn 2 & 3) with a nominal capacity of 618 MW. These plants provide importantpeaking capacity, but due to operating cost considerations, emission restrictions and ancillaryprocess limitations, they are operated on a limited basis and, therefore, do not provide baseloadenergy for Puget’s generation portfolio.
The NUG supply (498 aMW) consists of gas-fired cogeneration plants that Pugetcontracted under the Public Utilities Regulatory Policies Act of 1978 regulations. The threeplants (March Point I & II, Tenaska, and Sumas) are located in Skagit and Whatcom counties, inthe northern part of Puget’s service area.
Completing Puget’s generation portfolio are 19 long-term contracts that total 241 aMW.The fuel sources include hydroelectric, gas, and waste products.
H.3.2.3 Load-Resource Outlook
Puget’s load-resource outlook is explained in the Least Cost Plan (Chapter IX) andsummarized here. Puget anticipates its electric load to grow by 283 aMW, from 2,377 aMW in2004 to 2,660 aMW in 2013. By 2023, Puget anticipates an electric load of 3,140 aMW. Pugetexpects its winter peak to grow by 695 MW, from 4,819 MW in 2004 to 5,514 MW in 2013. By2023, Puget anticipates a winter peak of 6,490 MW (refer to section H.3.2.1).
Typically, load growth is the primary influence in a utility’s load-resource planning, butfor Puget, the primary influence is loss of existing resources. By 2010, Puget will lose 314 aMWof energy and 755 MW of capacity through the expiration of power supply contracts. By 2012,Puget will lose 102 aMW of mid-Columbia hydroelectric generation. The scheduled expirationof NUG contracts in the 2011-to-2012 period will reduce Puget’s resources by another498 aMW. Additionally, Puget’s ability to meet peaking needs will be decreased by 134 MW in2009 by the loss of the leased Whitehorn 2 and 3 combustion turbines.
Puget simulated the dispatch of its existing resources to serve the forecasted load over a20-year planning period to quantify its load-resource outlook13. For planning purposes, Pugetselected an energy adequacy standard that requires the average load be met on a monthly basis,where the greatest deficit occurs during a winter month. Based on this planning standard, Pugethas a shortage of 385 aMW in 2004, growing to 1,551 aMW by 2013. In the decade beyond
13 In its electric portfolio analysis, Puget considers a wide spectrum of planning levels for both energyand capacity. Refer to Chapter XI of the April 2003 Least Cost Plan.

Puget Sound Energy Exhibit HBaker River Project, FERC No. 2150 H-9 April 2004
2013, there is little additional loss of resource, and the gap grows more slowly, primarily becauseof gradually increasing loads. By 2023, the shortfall reaches 2,229 aMW.
With regard to meeting peak loads, Puget is currently short of capacity based on aplanning standard of a 16°F hour. The Least Cost Plan identifies a need for additional capacityof 1,403 MW in 2004, rising to 3,385 MW in 2013. By 2023, the peak capacity need rises to4,590 MW.
H.3.2.4 Load Management Measures
Puget load forecasts are inclusive of conservation and load management implementedprior to 2003. For the planning period (2004 through 2023), conservation and load managementmeasures are considered new resources.
H.3.3 Alternative New Sources of Power
Puget has a wide variety of available electric resource opportunities to balance its load-resource outlook. Conservation, renewable and thermal resources, and alternatives such asdemand-response programs, fuel conversions, distributed generation, and conservation voltagereduction offer potential opportunities. These are described in detail in the Least Cost Plan(chapter X and appendices G, H and N).
Puget recognizes the significant value of conservation in a long-term electric resourcestrategy. Puget assumes the introduction of 150 aMW of new conservation over the next 10years, and Puget has made commitments to further explore conservation and demand responseopportunities. Refer to section H.11.
In addition to conservation resources, Puget considered a broad range of generic resourcetechnologies in its Least Cost Planning Process, including CCCTs, SCCT, coal-fired steam,wind, solar, landfill gas, and geothermal. Cost and other characteristics of these resources aresummarized in table H-1. Other characteristics of the alternative resource technologies, such asequipment availability ratings, useful life, emissions, and transmission system impacts, wereconsidered in the Least Cost Planning Portfolio Analysis model (refer to Least Cost Plan,chapters XI and XII and appendix J).
Table H-1. New resource characteristics. (Source: Puget, 2003)
TechnologyCapacity
(MW)Heat Rate(Btu/kWh)
All-inCost
($/kW)Fixed O&M($/kW-yr)
VariableO&M
($/MWh)CCCT 516 6,900 645 41 5.45SCCT 168 11,700 441 19 7.85Coal 900 9,425 1,500 50 2Wind 100 0 1,003 41 1Solar 20 0 6,000 15 0.8
Puget Sound Energy Exhibit HBaker River Project, FERC No. 2150 H-10 April 2004
TechnologyCapacity
(MW)Heat Rate(Btu/kWh)
All-inCost
($/kW)Fixed O&M($/kW-yr)
VariableO&M
($/MWh)Landfill gas 5 11,100 1,240 114 1Geothermal 200 -- 2,922 86 7.9Note: kWh – Kilowatt-hour.
As a result of its electric resource portfolio modeling analysis, Puget has established agoal of serving 10 percent (266 aMW) of its customers’ energy needs by 2013 through the use ofrenewable resources. Puget’s portfolio modeling focused on wind power, firmed up by SCCTs,as the most viable near-term renewable option. Although Puget considered solar power, the highcapital cost associated with the current technology and the incompatible weather conditions ofthe Northwest make this an undesirable choice. Puget also considered biomass and geothermalresources and intends to continue to monitor market opportunities related to these technologies.
While Puget anticipates that the combination of new conservation and renewables will besufficient to address load growth over the next 10 years, Puget will need to look at a mix of othernew resources to address the portion of the load-resource gap attributable to the loss of existingresources. Puget intends to meet the rest of its needs through a diverse mix, including combined-cycle gas-fired generation in the near term and possibly coal-fired steam generation later in thedecade, seasonal power exchanges, and other market transactions.
H.3.3.1 Least Cost Alternative to the Baker River Project
Puget’s Least Cost Plan approach is to consider an integrated portfolio analysis for thevalue and timing of new resources. If an alternative to the Baker River Project’s power andcapacity was required, no single replacement resource would be assumed. Instead, integratedportfolio planning implies that all of Puget’s existing resources and loads would be evaluatedtogether to find the best mix of resources based on least cost and risk acceptability.
For this analysis, however, the alternative to the Project’s generation and capacity isassumed to be a percentage of a new, efficiently sized gas-fired turbine generating plant. Tomatch the Project’s average annual generation and peak-hour capacity, the alternative costestimate was based on producing the Project’s annual generation with a generic CCCT having a89-percent availability factor and providing the balance of the Project’s peak-hour capacity withsimple-cycle gas-fired standby generators.
H.3.3.2 Power Production Costs of the Least Cost Alternative
The estimated financial cost to replace the Baker River Project beginning in 2006 is$36,418,900 annually without inflation and $51,859,500 with inflation. These estimated costsare derived as shown in table H-2. The assumptions used in this analysis are consistent with thegeneric resource assumptions used in the portfolio analysis as reported in the Least Cost Plan,including capital costs, financing, depreciation rates, and tax rates.
Puget Sound Energy Exhibit HBaker River Project, FERC No. 2150 H-11 April 2004
Table H-2. Baker River Project replacement cost.Value
No Inflation With InflationAssumptions
Hydro reserve 5%Thermal reserve 7%Target load factor CCCT 89%Transmission line loss 1.60%Cost of CCCT per kW ($2006) 695Cost of SCCT per kW ($2006) 475Fuel cost ($/MMBtu) (first year 2006 average) 3.84Heat rate (Btu/kWh) 6,900Fixed annual O&M cost CCCT ($2006/kW) 44.62Variable annual O&M cost CCCT ($2006/MWh) 5.87Fixed annual O&M cost SCCT ($2006/kW) 20.18Inflation 0% 2.5%Discount rate 6.1% 8.76%
CapacityExisting dependable capacity (MW) 163.11Existing dependable capacity from ACOE-Bonneville PowerAdministration Exchange Agreement 3.50Total existing dependable capacity (MW) 166.61Existing dependable capacity less 2% reserve (MW) 158.28Thermal capacity equivalent including 7% reserve (MW) 169.36
EnergyLong-term average energy production, Baker only (GWh) 716.32ACOE-Bonneville Power Administration ExchangeAgreement (GWh) 7.0Total long-term energy (GWh) 723.32
Cost CalculationsBase capacity from CCCT (MW) 92.71Capital cost of CCCT ($2006) 64,435,000Levelized cost of CCCT ($2006) 4,877,800 6,170,000Supplemental dependable capacity required (MW) 76.65Capital cost of simple-cycle standby gas turbine ($2006) 36,407,000Levelized cost of simple-cycle standby gas turbine ($2006) 2,639,000 3,338,100Levelized fuel cost of CCCT ($2006) 19,166,400 29,896,000Levelized annual escalated fixed CCCT O&M over 30 years($2006) 4,136,400 5,232,200Levelized variable annual O&M cost of CCCT ($2006) 1,556,800 1,970,500

Puget Sound Energy Exhibit HBaker River Project, FERC No. 2150 H-12 April 2004
ValueNo Inflation With Inflation
Levelized fixed annual O&M cost of simple-cycle turbines($2006) 1,546,800 1,956,600Levelized fuel price differential of CCCT ($2006) 591,600 748,800Total annual cost of CCCT excluding capital ($2006) 25,451,200 37,847,500
Total CostsTotal levelized capital costs ($2006) 7,516,800 9,508,100Total levelized fuel costs ($2006) 19,166,400 29,896,000Total levelized fixed O&M ($2006) 5,683,200 7,188,800Total levelized variable O&M ($2006) 1,556,800 1,970,500Total levelized cost ($2006) 33,923,200 48,563,400Total regulated levelized cost of CCCT ($2006)a 31,549,100 45,657,800Total regulated levelized cost of SCCT ($2006)a 4,869,800 6,201,700Total regulated levelized cost ($2006)a 36,418,900 51,859,500Total regulated present value cost ($2006) a 526,043,000 592,189,700
a The total regulated levelized cost reflects the effects of AFUDC, taxes, depreciation, andinsurance.
H.3.3.3 Emissions from Replacement Resources
A key conclusion of the Least Cost Plan is that diversity of resources is important as astrategy to reduce uncertainty risk. The long-term resource strategy includes an aggressive goalfor renewable resources to meet 10 percent of Puget’s retail electric customers’ load by 2013.The strategy also includes the aggressive goal of 15 aMW per year of conservation resources.Renewable energy and conservation is projected to meet a significant portion of the need for newresources. However, considerable thermal resources will be required to meet the remainingneed. Further, any loss of existing hydro resources, such as replacing the Project, wouldnecessitate the development or acquisition of more thermal resources.
As a result, the loss of the Project would very likely result in increased air emissions fromthermal generating resources. For example, an efficient CCCT with a heat rate of 6,900 Britishthermal unit (Btu)/kWh would produce over 403 tons of CO2 per GWh. An SCCT for peakingwith a heat rate of 11,700 Btu/kWh would produce 684 tons of CO2 per GWh. Replacing theProject’s generation with a like amount of gas-fired generation could result in an increase ofapproximately 300,000 tons of CO2 emissions per year.
H.3.4 Effect of Alternative Sources on Direct Providers
Under existing contracts, the direct providers who purchase power from Puget would notbe affected by a change in Puget’s production costs. If Puget enters into future power supplycontracts with direct providers, replacing the Baker River Project with a more expensivealternative would increase the cost of power to any direct providers and their customers.

Puget Sound Energy Exhibit HBaker River Project, FERC No. 2150 H-13 April 2004
H.4 Effect on Applicant Industrial Facilities and Related Operations
Puget does not operate any industrial facilities that depend on the power production of theBaker River Project.
H.5 Indian Tribe Need for Electricity
The Applicant is not an Indian Tribe.
H.6 Transmission System Impacts
H.6.1 Redistribution of Power Flows
The greater Puget Sound area transmission system primarily distributes power to within-region loads, moving power north and south between Canada and the western United States.
System constraints are dependent on direction of power flow, temperature, Puget Soundarea generation, and system configuration.
Constraints for moving power north to south are typically encountered south of SkagitCounty. Reducing generation levels at the Baker River Project, or the loss of the Project, woulddecrease both the power flow through the system and the severity of these constraints.Constraints for moving power south to north are encountered both to the north and south ofSkagit County. Consequently, reducing or eliminating generation from the Baker River Projectwould have either a positive or negative effect, depending on the direction of power flow on thenorth-south transmission system.
Replacement power associated with loss of generation from the Baker River Projectwould likely come from a source further away from Puget’s load, thereby increasingtransmission line losses over levels presently incurred.
H.6.2 Advantages of the Applicant’s Transmission System in Distributionof Project Power
Puget’s existing Baker-Sedro-Woolley #1 and #2 lines transmit the power output fromsurrounding areas and both the Upper and Lower Baker developments along the regionaltransmission system to the switching station at Sedro-Woolley where it is distributed to loadareas. Additionally, the regional transmission system that provides power supplied by theProject links four distribution substations that serve the Hamilton, Lyman, and Concrete loads.
H.6.3 Single-Line Diagram
See figures F-9 and F-10 (exhibit F) for detailed one-line diagrams of the existingfacilities.

Puget Sound Energy Exhibit HBaker River Project, FERC No. 2150 H-14 April 2004
H.7 Plans to Modify Project Facilities or Operations
Puget proposes to modify Project operations to achieve an improved balance amongresource objectives. To accomplish these operational changes, Puget proposes to add anauxiliary turbine generator at the Lower Baker Development.
H.7.1 Project Operations
Reservoir stage limits would be established to support recreational, cultural, water qualityand aquatic resource values, while also accommodating human health and safety, floodprotection, power generation, and operational constraints (refer to tables 3-1 and 3-2 in thePDEA).
In addition to managing reservoir levels, Puget proposes to control releases from theProject to satisfy minimum instream flow and ramping objectives:
• Puget would release a minimum of 300 cfs year-round from the Baker River Projectas measured at the Baker River at Concrete gage.
• Puget would limit maximum powerhouse flow at the Lower Baker Development suchthat maximum daily flow fluctuation at the Baker River at Concrete gage would notexceed 3,800 cfs except when the Lower Baker Development is spilling.
• Puget would release flow from the Project to achieve the less restrictive of two ramprate standards: (1) no greater than 650 cfs reduction per hour at the Baker River atConcrete gage (USGS No. 12193500); or (2) 6 inches per hour total reductionmeasured at the Skagit River near Concrete gage (USGS No. 12194000). Theseramping restrictions would be in effect whenever the flow, as measured at the SkagitRiver near Concrete gage, is less than or equal to 30,000 cfs. For the purpose oframping compliance, rate of change per 15-minute increment would be used.
H.7.2 Facilities
The existing Lower Baker turbine generator develops substantial vibration when runningat less than about 75 percent capacity, thereby limiting downramp flexibility. For the purpose ofproviding the capability to ramp powerhouse releases consistent with the draft release regimeand to provide minimum instream flows (see the foregoing discussion of operational changes),Puget proposes to rehabilitate the original power generating facilities at the Lower BakerDevelopment that were destroyed by the 1965 landslide. The new 153-foot-long by 50-foot-wide reinforced concrete auxiliary powerhouse would include a new 680-cfs, 12.5-MW turbinegenerator attached to an existing abandoned penstock within the concrete foundation of theoriginal 1925 powerhouse located adjacent to and immediately north (upstream) of the existingLower Baker powerhouse. The new unit would be configured to operate in synchronization with

Puget Sound Energy Exhibit HBaker River Project, FERC No. 2150 H-15 April 2004
the existing Unit 3, and would be able to provide a continuous minimum 300 cfs discharge at alltimes when the penstocks are watered up and the unit is operational.14
The selected arrangement is consistent with the findings of a Baker River Project upgradeassessment conducted by Puget in support of the Baker River Project relicensing program(Raytheon, 1999). The upgrade assessment had four objectives:
1. To identify generation capacity increases accommodating future instream flows andramp rates;
2. To identify scheduling modifications that allow each development to operate at peakefficiency;
3. To improve overall operational use of the system; and
4. To develop potential upgrade and rehabilitation alternatives available within thelimits of the existing water resource.
The assessment included a review of over 30 potential upgrade alternatives. The reportdetermined that Puget effectively utilizes the Baker River Project as a generation resource.Current operations generally allow Puget to maximize on-peak generation and minimize spill.Current operations achieve approximately 99.5 percent of the available hydrologic resource.
The hydraulic capacity of the Lower Baker Development is significantly less than UpperBaker (4,200 cfs versus 5,100 cfs); therefore, additional ponding of Lake Shannon is required topass flows through the Lower Baker powerhouse. Accordingly, the assessment determined thatthe most favorable location for potential capacity increases is at the Lower Baker Development.
The assessment concluded that final selection of a turbine or release valve at LowerBaker should accommodate instream flow release and ramp rate requirements of any new licenseissued. At a minimum, the new turbine’s hydraulic capacity should match the instream releaserequirements or the release rate necessary to meet proposed ramp rate restrictions, whichever isgreater. In addition, consideration should be given to sizing the unit slightly larger than therequired instream flow release to bring the Lower Baker power plant’s hydraulic capacity closerto that of Upper Baker. However, the assessment found that installing a new unit with a capacitybeyond that necessary to meet instream flow release and ramp rate requirements would be lesseconomical than a unit that matches those requirements. The economic benefits of increasinggeneration or shifting generation into the on-peak period by installing extra capacity would notoffset the additional expense of a larger unit.
14 During maintenance of the 680 cfs turbine-generator, the minimum release would be provided via theexisting Unit 3. During any penstock dewatering, Puget would need to maintain the Lake Shannonwater level above the spill crest and use the spill gates to provide the minimum release.

Puget Sound Energy Exhibit HBaker River Project, FERC No. 2150 H-16 April 2004
H.8 Justification for the Lack of Plans to Modify Existing Project Facilities orOperations
As described above in section H.7, Puget does propose to modify Project operations andto expand facilities to accommodate operational flexibility.
H.9 Applicant’s Financial and Personnel Resources
Puget has adequate financial resources to meet its obligations under a new license for theBaker River Project. Puget’s 2,155 employees deliver electricity, natural gas, and innovativeenergy solutions to more than 1.2 million customers in Washington State. Puget’s financialinformation is available on-line in the annual report which can be accessed athttp://media.corporate-ir.net/media_files/NYS/psd/reports/PugetEnergy03AR.pdf.
H.10 Expansion Notification
Although Puget does not propose to expand the Baker River Project boundary, 38.5 acresof Puget, WDOT, WDNR, and privately-owned lands are proposed for removal from the Projectboundary at the Lower Baker Development. These lands abut or lie to the south of WashingtonState Highway 20 and are isolated from the Project. No Project facilities occupy these lands, nordo these lands support any current or proposed Project-related activities or measures. All landowners identified by the Skagit County property database and affected by this boundaryadjustment have been notified in writing of the proposal.
H.11 Electricity Consumption Efficiency Improvement Program
H.11.1 Energy Conservation and Efficiency Record and Program
Puget has provided conservation services for its electricity customers since 1979.Through 2002, the net cumulative annual savings attributable to these efforts are approximately1,908,288 MWh, or 218 aMW net cumulative load reduction, which represents over 11 percentof Puget’s average existing annual load. Since 1989, Puget has invested approximately $310million in energy efficiency measures. For most measures, energy savings occur annually for 10to 20 years; certain lighting and water heating measures may have shorter useful lives.
In August 2002, Puget doubled its annual conservation targets, expanding 20 existingprograms and initiating 10 new programs and pilot projects. Existing programs are listed intable H-3. Refer to appendix D of the Least Cost Plan for additional detail.
Puget’s programs provide for efficiency savings from all customer classes (residential,low-income, commercial and industrial). Based on best current estimates of costs and projectedsavings, these conservation programs provide a cost-effective resource.

Puget Sound Energy Exhibit HBaker River Project, FERC No. 2150 H-17 April 2004
Table H-3. Puget’s existing electric conservation programs. (Source: Puget, 2003)
Program NameConservation Programs
(September 2002–December 2003)Expected AnnualEnergy Savings
Energy Efficiency InformationServices–Personal/businessenergy profile
Energy audit surveys, analysis, and reportproviding customers with customized energyefficiency recommendations
No energy savings arecurrently credited toinformation programs
Energy Efficiency InformationServices–Personal energyadvisors
Phone representatives provide customersdirect access to Puget’s array of energy-efficiency services and programs
No energy savings arecurrently credited toinformation programs
Energy Efficiency InformationServices–Energy efficiencybrochures
Brochures on program participationguidelines and how-to-guides on energyefficiency opportunities
No energy savings arecurrently credited toinformation programs
Energy Efficiency InformationServices–On-line services
Section of Puget’s website dedicated toenergy efficiency and energy managementinformation
No energy savings arecurrently credited toinformation programs
Residential Energy EfficientLighting Program (C&RDfunding)a
Includes a retail incentive program, newconstruction and remodelers’ incentives, andcross promotional/Internet incentives
36,901 MWh (4.2 aMW);7-year resource
LED traffic signals Rebates to traffic jurisdictions installingenergy-efficient red, green, andwalk/crossing LED traffic signals
2,027 MWh (0.2 aMW);6-year resource
Small Business EnergyEfficiency Programs
Rebates for energy-efficient fluorescentlighting upgrades and conversions, lightingcontrols, programmable thermostats, andvending machine controllers
3,333 MWh (0.4 aMW);10-year resource
Commercial and IndustrialRetrofit Programs
Incentives in the form of grants tocommercial and industrial customers for cost-effective, energy-efficient upgrades
73,063 MWh (8.3 aMW);12-year resource
Commercial and IndustrialNew Construction Efficiency
Grants to commercial and industrialcustomers for cost-effective, energy-efficientbuilding components or systems
1,333 MWh (0.2 aMW);20-year resource
Large power user self-directedprogram
Incentives for eligible commercial/industrialcustomers receiving high-voltage electricalservice
20,000 MWh (2.3 aMW);12-year resource
Resource ConservationManager (RCM) Program
Assists in the implementation of low-cost/no-cost energy saving activities with buildingoccupants and facility maintenance staff
26,667 (3 aMW);3-year resource
PILOT Programs–Fuelswitching pilot
Incentives toward the cost of convertingelectric space and/or water heating equipmentto equipment fueled by natural gas
4,600 MWh (0.5 aMW);20-year resource
PILOT Programs–Residentialduct systems pilot
Participating customers received ductdiagnostic measurement services and sealingservices from certified contractors at no cost
353 MWh (<0.1 aMW);10-year resource

Puget Sound Energy Exhibit HBaker River Project, FERC No. 2150 H-18 April 2004
Program NameConservation Programs
(September 2002–December 2003)Expected AnnualEnergy Savings
Market TransformationPrograms–Northwest EnergyEfficiency Alliance
Northwest Energy Efficiency Alliance’sprimary function is market transformation forthe benefit of energy efficiency at themanufacturing and retail level
20,000 MWh (2.3 aMW);10-year resource life
Market TransformationPrograms–Local infrastructureand market transformation andresearch
Funds specific energy efficiency initiativesand/or organizations committed to energyefficiency in the marketplace
No savings are credited forthese efforts
Public Purpose Programs–Energy education 6th to 9thgrade environmentaleducation, “Powerful Choices”
Conservation school-age education programfunded by Puget along with 26 other utilities,cities, and agencies
1,773 MWh;0.2 aMW
Public Purpose Programs–Residential low-income retrofit
Funding for installation of homeweatherization measures for low-income gasand electric heat consumers
2,608 MWh;0.3 aMW
C&RD Programs–GreenPower
Customers can purchase green power directlyon their monthly energy bill at $2 per 100kWh block
34,585 “Green Tags”through December 2003 tofund 0.4 aMW renewableresources sited in thePacific Northwest
C&RD Programs–Residentialnew construction lightingfixtures
Rebates will be available for both retrofit andnew construction electric customers throughparticipating retailers
2,832 MWh (0.3 aMW);15-year resource
C&RD Programs–ResidentialEnergy Star appliance
Rebates for Energy Star clothes washers andEnergy Star dishwashers for customers whopurchase electricity from Puget
2,092 MWh (0.2 aMW);12-year resource
Energy efficient manufacturedhousing
$300 rebate to buyers of qualifying SuperGood Cents/Energy Star labeledmanufactured homes with electric heat
1,456 MWh (0.2 aMW);30-year resource
a C&RD refers to Conservation and Renewable Discount credits provided by the Bonneville PowerAdministration.
H.11.2 Compliance with Regulatory Requirements
Puget’s conservation and efficiency program is consistent with the following laws andregulatory requirements that govern such programs.
• The 1988 voter referendum to amend the state constitution to permanently allow theloaning of public funds for efficiency improvements.

Puget Sound Energy Exhibit HBaker River Project, FERC No. 2150 H-19 April 2004
• The 1991 Washington State Energy Code establishing consistent statewide standardsfor efficiency in new construction.
• The Energy Matchmakers program providing matching state capital funds for theweatherization of homes occupied by low-income citizens.
H.12 Tribe Mailing List
The Project does not occupy any Indian tribal lands. The Tribes that Puget believes mayotherwise be affected by the proposed Project are identified below.
Three Tribes have been actively involved in the Baker River Project relicensing processthrough the Cultural and Historical Working Group or the Baker Solution Team, or through aninterest in how resources affected by the Project are addressed. These Tribes are:
Upper Skagit Indian Tribe Sauk-Suiattle Indian TribeThe Honorable Marilyn Scott, Chair The Honorable Jason Joseph, ChairScott Schuyler, Cultural Policy Norma Joseph, Vice Chair25944 Community Plaza 5318 Chief Brown LaneSedro-Woolley, WA 98284 Darrington, WA 98241
Swinomish Indian Tribal CommunityThe Honorable Brian Cladoosby, ChairCharles O’Hara, Director of PlanningSenator Ray WilliamsP.O. Box 817LaConner, WA 98257
Additionally, four other Tribes were contacted by mail or telephone at the outset of therelicensing activities to encourage their participation if they were affected by the Project. TheseTribes either elected not to participate or did not respond; however, Puget continues to keep theminformed through their communications to the general Baker River Project relicense mailing list.These Tribes are:
Lummi Nation Nlaka’Pamux Nation Tribal CouncilDarrel Hillaire, Chair Bobby Pasco, ChairAl Scott Johnnie, Cultural Resources Debbie Abbott, Cultural Resources2616 Kwina Road P.O. Box 430Bellingham, WA 98226-9298 Lytton, B.C. V0K 1Z0
Nooksack Indian Tribal Council Samish NationArt George, Chair Ken Hansen, ChairP.O. Box 157 P.O. Box 217Deming, WA 98244 Anacortes, WA 98221

Puget Sound Energy Exhibit HBaker River Project, FERC No. 2150 H-20 April 2004
H.13 Measures to Ensure Safe Project Management, Operation, and Maintenance
H.13.1 Operation During Flood Conditions
Puget has an agreement with the ACOE whereby, from November 1 to March 1 (thewinter flood season), the ACOE assumes control over the operation of the Upper BakerDevelopment whenever flows in the Skagit River are forecasted to exceed 90,000 cfs atConcrete. The ACOE’s Baker River Water Control Manual provides flood control guidelines forthese flood periods (refer to section H.14.3).
Puget maintains an Emergency Action Plan (EAP) to address high water conditionsduring the spring/summer flood season (March 2 through October 31), as well as during“developing failures” and “imminent failures” that might occur at any time of the year. The EAPis developed and maintained in accordance with the Commission’s “Regulations GoverningSafety of Water Power Projects and Project Works” (18 CFR, Part 12). The EAP definesresponsibilities for the timely notification of the appropriate emergency management officialsand for providing early warning to inhabitants of the downstream river reaches in the event of anemergency occurrence at the Baker River Project.
H.13.2 Warning Devices for Downstream Public Safety
Beginning in February of 2003, Puget began installing a siren system in the town ofConcrete to provide early warning to downstream residents in the unlikely event of a dam failureor other significant Project emergency. To date, the siren itself has been installed, as well as thecommunications equipment necessary to provide remote activation from any Project location,and from the Puget Eastside Operations Center in Redmond, Washington. Installation of thedetection/activation system on the face of Lower Baker dam is complete.
Early Warning System community education efforts took place in mid-April of 2004.Plans are being made to tie the Concrete siren in with a new, second siren in the downstreamtown of Grassmere via a radio transmission unit. A third siren installation is planned for 2005 inthe Cape Horn area.
H.13.3 Proposed Changes Affecting the Emergency Action Plan
Planned Project changes having an effect on the EAP include the aforementioned EarlyWarning System, as well as inclusion by reference of the Baker Project Security Plan. This planaddresses potential Project emergencies, including dam failure, which might be precipitated byterrorist action.
H.13.4 Structural Safety Monitoring Devices
Puget has been taking measures at the Baker River Project to ensure safe management,operation, and maintenance of the main Project structures and embankments. Brief descriptionsof these existing measures are included below. In general, these measures include devices tomonitor structural movement or stress, seepage, uplift, equipment failure, or water conduitfailure. A description of the maintenance and monitoring programs used or planned inconjunction with the devices is also described.

Puget Sound Energy Exhibit HBaker River Project, FERC No. 2150 H-21 April 2004
H.13.4.1 Upper Baker
Instrumentation
Puget has been monitoring subsurface pressures and seepage flows in the foundation andabutment rock at the Upper Baker dam, as well as deflections and differential movements in theconcrete blocks of the main dam, since completion of construction. Monitoring data andobservations are reviewed and evaluated by personnel at Puget. They are also periodicallytransmitted to Puget’s independent consultant for evaluation. In addition, groundwaterconditions are routinely monitored in the lava bed area north of West Pass Dike and alongSulphur Creek.
Pressure and Flow Measurements
As a result of increased pressure measurements in foundation drain holes of the UpperBaker dam at Blocks 8 and 9, additional drain holes were provided in the area of Blocks 7through 10 to reduce higher-than-normal pressures during full-reservoir conditions. Elevensingle and multi-point piezometers were installed, and 12 new foundation drains were drilled intoBlocks 7–13, 16, 17, and 19 during the period of November 1988 to January 1989. Puget hasbeen monitoring pressure and flow in foundation drains within the dam on a monthly basis since1963. Routine plots of piezometric head data show that pressures are at acceptable levels andthat the foundation drainage system has satisfactory effectiveness. All drains and piezometersare routinely cleaned at least every 5 years.
Measurement of the water level in piezometer PD-1, located on the left abutmentdownstream of Block 21, is made semiannually. The water level varies with reservoir level andrainfall.
Puget also measures the piezometric head in observation wells in the lava beds and alongSulphur Creek semiannually. The measurements for the observation wells have been taken since1965.
Concrete Block Movements
Puget takes monthly measurements to monitor the movement of the concrete monolithsof the main dam. Joint displacement measurements at Blocks 6–7, 9–10, 16–17, 17–18, 18–19,19–20, and 20–21 are taken and evaluated. Extensometer readings at Blocks 18 and 19 are alsotaken and routinely plotted and evaluated.
Also, the taut-line within the Upper Baker gallery remains in place but is no longermonitored, as there has been no movement in several years.
West Pass and Depression Lake Dikes
Puget also routinely inspects and monitors the West Pass Dike and Depression Lakeareas. Every few years the profile of West Pass Dike is surveyed and monitored for unusualsettlements. The Depression Lake Dike is also inspected and monitored by the plant operator.

Puget Sound Energy Exhibit HBaker River Project, FERC No. 2150 H-22 April 2004
Seepage flows from Depression Lake are also measured at a weir and monitored regularly whenDepression Lake is full.
Water Conduits
Puget has installed a flow-measuring meter within the two penstocks to measure real-timeflows. This information is displayed and monitored in the operators’ room. If sudden flowvariations are detected, alarms notify the operator and/or central operations immediately.
H.13.4.2 Lower Baker
Instrumentation
Puget has been monitoring piezometric head within the abutment bedrock and seepagefrom the abutment since 1983. Also, readings are taken to monitor significant horizontalmovement of the dam. In addition, ground movements are routinely monitored in the landslideareas above the powerhouse and the westerly dam abutment.
Abutment Pressure and Seepage
The monitoring of abutment seepage includes regular visual observation by the operatorsand semiannual photo documentation of both abutments. Seepage flows are also measured atleast once a year to determine changes in seepage flow. Puget plans to continue stream-gagingto monitor abutment seepage and to establish a quantitative relationship between seepage and theLake Shannon reservoir level. Historically, this seepage has varied and gradually increased withtime. The localized seepage flow areas detected at the toe of the dam are monitored about everyfive years.
Measurements in seven piezometer holes in the left and right abutments of the LowerBaker dam have been read regularly since the completion of the 1983 grouting program. Plots ofthose readings are evaluated regularly.
Dam Movement
Puget has periodically monitored horizontal movement of the dam by transit deflectionreadings from the left abutment. The arrangement uses transit, fixed-abutment monuments, anda target on the upstream parapet face. The system is adequate to monitor significant movement.Deflection readings are evaluated regularly.
Displacement in Slide Area Above Powerhouse
Surface monuments and a slope indicator are located on the easterly slope of the bypassreach. The slope indicator is read on a monthly basis, and the positions of the surfacemonuments are recorded at six-month intervals. Evaluation of data from the slope indicator andthe surface monuments are reviewed approximately every year or two.

Puget Sound Energy Exhibit HBaker River Project, FERC No. 2150 H-23 April 2004
Slide Area Above Westerly Dam Abutment
Since 1996 Puget has been observing and monitoring the westerly and downstream areasof Lower Baker dam just above the bypass reach for landslides and slope movement. Presently,Puget operators and staff have inspected this area monthly, especially after heavy rainfall events.Aerial photos are also taken periodically in conjunction with Puget’s snow survey. In addition,an engineering geologist visits the site regularly to assess and evaluate the status of the area andprepares a report.
Water Conduits
Puget has installed a flow-measuring meter within the Lower Baker tunnel to measurereal-time flows. This information is displayed and monitored in the operators’ room. If suddenflow variations are detected, alarms notify the operator and/or central operations immediately.
H.13.5 Safety Record
H.13.5.1 Employee/Contractor Safety Program
Puget’s employees are given an initial exposure to workplace safety in new employeeorientation. In addition, they are given position-specific safety orientation prior to beginningwork in any position, whether as a new employee or as a result of a position transfer. Finally, allmandated safety training is tracked by individual, both on a corporate and departmental basis.This ensures that required training is given both initially and recurrently, as mandated by stateand federal regulation. Training includes mandated monitoring programs. Contractors workingin Puget’s employ are bound by contract to not only work safely but also, in accordance withstate and federal safety regulations, to follow all safe work practices detailed in Puget’s 2002“Employee Safety and Health Program” manual.
From 1998 through mid-2003, there have been six lost time accidents or injuries(table H-4) associated with the O&M of the Baker River Project.
Table H-4. Baker River Project, employee lost timeaccidents/injuries 1998–2003.
Year Number1998 11999 02000 22001 22002 12003 0
H.13.5.2 Public Safety Program
Puget is acutely aware of the need to address public safety at its Baker Riverdevelopments. In recognition of that need, Baker River Project personnel maintain a “PublicSafety Plan” document that addresses all potentially hazardous site features, as well as the

Puget Sound Energy Exhibit HBaker River Project, FERC No. 2150 H-24 April 2004
signage, fences, and other access accommodations designed to minimize public risk. Thisdocument is updated annually and as operational changes dictate.
Table H-5 shows the record of injuries or deaths to the public occurring within theProject boundary over the period 1979 through 2003.
Table H-5. Public safety accidents/incidents within Baker Project boundaries.
Date Classification Description Location
June 12, 1979 Fatality/drowning Canoeing accident Upper Baker
March 30, 1983 Fatality/traffic accident Body found adjacent tosubmerged vehicle
Upper Baker
May 19, 1984 Serious injury/fall Contract constructionworker fell from top of dam
Upper Baker
July 3, 1985 Fatality/accident Child playing at abandonedLone Star plant
Lower Baker
June 11, 1990 Serious injury/fall Teenager fell from side ofcliff
Lower Baker
April 25, 1996 Two fatalities/drowning Fishing/overturned boat Lower Baker
August 28, 1998 Fatality/drowning Boating accident/collisionwith a tree snag, at speed, in
the dark
Lower Baker
May 3, 2001 Body recovery Recovery of body from1996 multiple fatality;
remaining body still missing
Lower Baker
July 6, 2002 Fatality/boating accident Head-on collision betweentwo boats
Upper Baker
H.14 Current OperationsH.14.1 Supervisory Control
The generators at Puget’s Lower Baker Development and Upper Baker Development canbe operated onsite either manually or automatically. Additionally, they can be operated remotelyfrom Puget’s Eastside Operations Center in Redmond, Washington. For remote operation, thetwo developments and the Eastside Operations Center communicate using microwave signals.Signals indicating high-bearing temperature, failure of cooling water flow, relay operations, andother automatic functions are transmitted to the Eastside Operations Center by supervisoryequipment over one of the microwave channels. In addition to controlling the units, operatorscan close the intake gates and open and close the spillway gates. Although primary operatingcontrol resides at the Eastside Operations Center facility, Puget onsite staff provide oversight8 hours per day, 7 days per week, and remain on call during the off-hours.
Puget Sound Energy Exhibit HBaker River Project, FERC No. 2150 H-25 April 2004
H.14.2 Power Generation Operations
Puget operates the Baker River Project in coordination with its other power supplyresources to meet the power needs of its customers within the constraints of flood controlrestrictions at the Upper Baker Development. On a weekly basis, the demand for electricity isgenerally higher Monday through Friday than on weekends, and on a daily basis, the demand forpower peaks during the morning (6 a.m. to 10 a.m.) and early evening (5 p.m. to 9 p.m.).Typically, the Project generates power on weekdays between 5 a.m. and 9 p.m. Depending onlake levels, inflows, weather forecasts, and system demand, the Project may not generateweeknights and on weekends. During periods of high inflow, however, the Project may generatecontinuously for several days or weeks.
Electricity demand in the Northwest is relatively high from October through March.During this period, Puget typically drafts the Project reservoirs during the daily and weeklypeaks to provide power for meeting the higher demand. This drawdown also serves to makeroom in the reservoirs to capture the spring runoff from snowmelt. Because of snowmelt andlower regional electricity demand during the warmer months, the reservoirs are typically refilledto near full pool during the April-to-June period. The reservoirs traditionally remain near fullthroughout the summer to meet the higher recreation demand. There is a regional trend,however, for major Northwest power producers to sell power into high-demand markets inCalifornia and the Southwest during the summer. This trend is increasing the likelihood thatBaker Lake and Lake Shannon would be drafted during the summer to meet regional marketdemands.
H.14.3 Flood Control Operations
During flood events when natural flow in the Skagit River is forecasted to exceed90,000 cfs at Concrete, Washington, the ACOE assumes responsibility for Baker Lake floodcontrol regulation and coordinates the Upper Baker Development operation with Seattle CityLight’s Ross Lake Reservoir on the Upper Skagit River to reduce the flood peak in the LowerSkagit River valley. All flood control operations are specified in the ACOE water controlmanual (ACOE, 2000).15
Consistent with Article 32 of the existing license and under an agreement with the ACOEgoverning flood control operations, Puget operates the Upper Baker Development to provide
15 In a letter from K.L. Durham-Aguilera, Director, Civil Works and Management, NorthwesternDivision, ACOE, Portland, OR, to C. Freeland, Relicensing Program Manager, Puget, Bellevue, WA,dated January 21, 2004, the ACOE requests that: (1) full text of existing Article 32 be included in thenew license; (2) the new license specify that flood control operation be subject to flood controlguidelines in the ACOE water control manual, dated June 2000, and as may be amended; and (3) real-time access be provided to hydrologic data from the Baker River Project for the period October 1 toMarch 31 of each year in order to accomplish flood control operations. The requested data wouldconsist of the following parameters: total inflow to Baker Lake, Baker Lake forebay elevation, totaldischarge from Upper Baker dam, total inflow to Lake Shannon, Lake Shannon forebay elevation, totaldischarge from Lower Baker dam, and flow at the Skagit River near Concrete gage.

Puget Sound Energy Exhibit HBaker River Project, FERC No. 2150 H-26 April 2004
16,000 acre-feet of flood control storage between November 1 and November 15 and74,000 acre-feet from November 15 to March 1. The corresponding reservoir elevations are724.50 feet msl and 711.56 feet msl. The flood control storage space above elevation 711.56 feetmsl is reserved to the ACOE for storing floodwater during official flood control eventsdesignated by the ACOE. When the minimum flood control pool is reached on a rising floodduring an official flood control event, Puget must coordinate with the ACOE to determinewhether to begin passing inflow to maintain the required minimum flood control pool or to beginactive flood control storage.
When an official flood control event is initiated, Puget is required to establish andmaintain an Upper Baker discharge of 5,000 cfs in order to extend the available Baker Lakeflood control storage in close coordination with and based upon direction from the ACOE. If thepowerhouse is unable to release this entire discharge, any remaining amount must be releasedthrough the spillway. The ACOE seeks to limit the rate-of-rise downstream of Lower Baker damto 1 foot per hour (approximately an 8,000-cfs increase in discharge) to provide for the safety ofpeople involved in flood fighting and to protect downstream levees. Floodwater is stored inBaker Lake until the flood crests on the Skagit River at Concrete, or until higher dischargesspecified in the Special Gate Regulation Schedule are required (refer to ACOE [2000]).16
As soon as the Skagit River has peaked at Concrete, outflows at Upper Baker areincreased to pass inflow and evacuate flood storage. When flood evacuation is nearly completeand weather conditions are favorable, releases are reduced to merge with normal Project releases.
The Lower Baker Development is not required to provide any part of the 74,000 acre-feetof flood control storage required of the Baker River Project. During flood events, Puget retainscontrol of operations at Lower Baker, but is restricted by the agreement with the ACOE fromoperating in a manner that adversely affects the ACOE’s flood control operations. Specifically,Puget must avoid drafting Lake Shannon during a flood event to avoid increasing flooddischarges in the Skagit River unnecessarily, and Lower Baker must pass reservoir inflow in atimely manner to avoid interfering with the ACOE’s Upper Baker regulation plan and to avoidunnecessary storage in Lake Shannon.17
16 In dealing with the flood event of October 2003, the ACOE, in consultation with Puget, departed fromcertain operations specified in the ACOE water control manual, because the flood occurred prior to thestart of the November 1 to March 1 flood control season and standard operating procedures requiredadjustment to accommodate pre-flood control season reservoir levels and associated structural safetyissues.
17 In a letter from C. Martin, Direction/County Engineer, Skagit County Public Works Department, Mt.Vernon, WA, to M. Salas, Secretary, FERC, Washington, D.C., dated January 16, 2004, Skagit Countyargues that the current amount of flood storage provided in Baker Lake is not sufficient and must beincreased to 100,000 acre-feet. In addition, Skagit County states that about 40,000 acre-feet of floodstorage should also be provided in Lake Shannon. According to Skagit County, flood storage in LakeShannon is needed to control local inflows and to regulate flows and spills from the Upper BakerDevelopment.
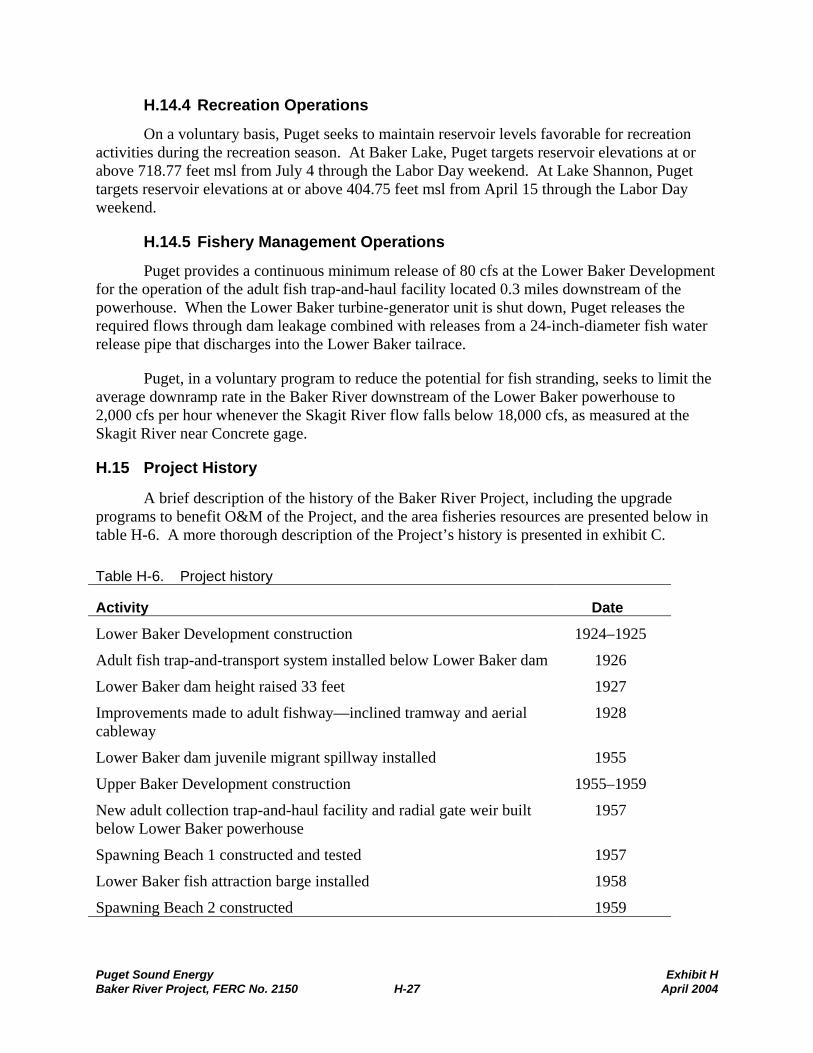
Puget Sound Energy Exhibit HBaker River Project, FERC No. 2150 H-27 April 2004
H.14.4 Recreation Operations
On a voluntary basis, Puget seeks to maintain reservoir levels favorable for recreationactivities during the recreation season. At Baker Lake, Puget targets reservoir elevations at orabove 718.77 feet msl from July 4 through the Labor Day weekend. At Lake Shannon, Pugettargets reservoir elevations at or above 404.75 feet msl from April 15 through the Labor Dayweekend.
H.14.5 Fishery Management Operations
Puget provides a continuous minimum release of 80 cfs at the Lower Baker Developmentfor the operation of the adult fish trap-and-haul facility located 0.3 miles downstream of thepowerhouse. When the Lower Baker turbine-generator unit is shut down, Puget releases therequired flows through dam leakage combined with releases from a 24-inch-diameter fish waterrelease pipe that discharges into the Lower Baker tailrace.
Puget, in a voluntary program to reduce the potential for fish stranding, seeks to limit theaverage downramp rate in the Baker River downstream of the Lower Baker powerhouse to2,000 cfs per hour whenever the Skagit River flow falls below 18,000 cfs, as measured at theSkagit River near Concrete gage.
H.15 Project History
A brief description of the history of the Baker River Project, including the upgradeprograms to benefit O&M of the Project, and the area fisheries resources are presented below intable H-6. A more thorough description of the Project’s history is presented in exhibit C.
Table H-6. Project history
Activity Date
Lower Baker Development construction 1924–1925
Adult fish trap-and-transport system installed below Lower Baker dam 1926
Lower Baker dam height raised 33 feet 1927
Improvements made to adult fishway—inclined tramway and aerialcableway
1928
Lower Baker dam juvenile migrant spillway installed 1955
Upper Baker Development construction 1955–1959
New adult collection trap-and-haul facility and radial gate weir builtbelow Lower Baker powerhouse
1957
Spawning Beach 1 constructed and tested 1957
Lower Baker fish attraction barge installed 1958
Spawning Beach 2 constructed 1959
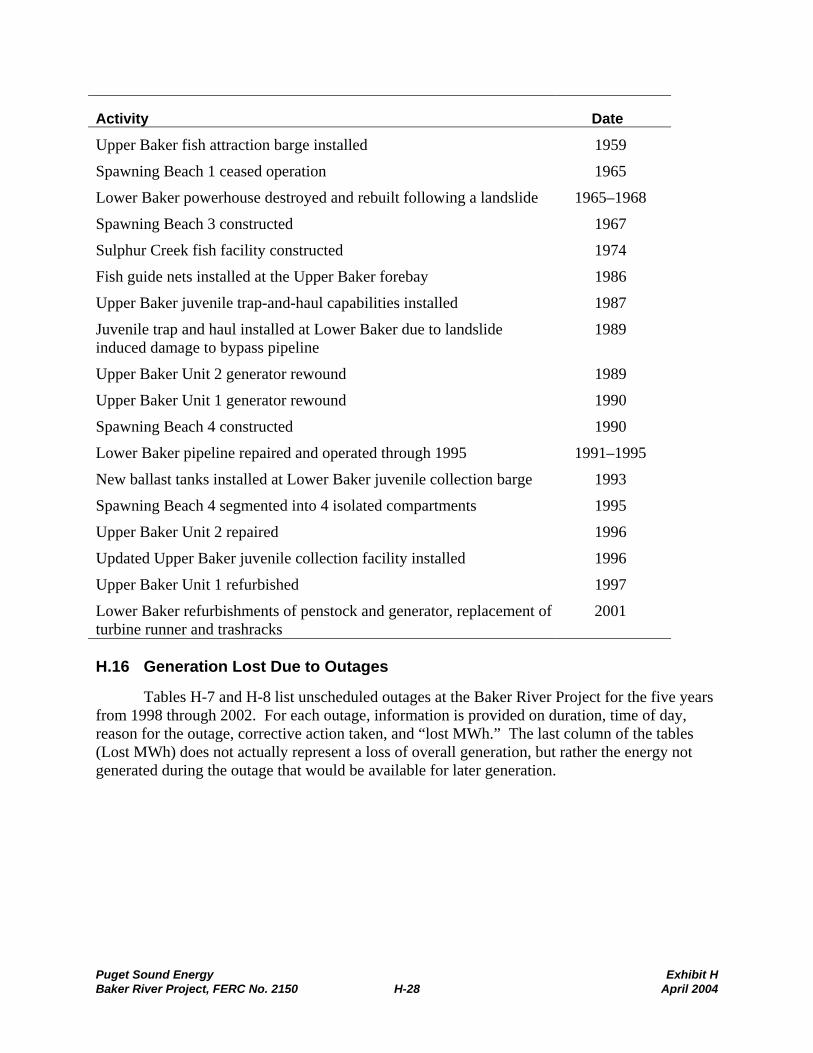
Puget Sound Energy Exhibit HBaker River Project, FERC No. 2150 H-28 April 2004
Activity Date
Upper Baker fish attraction barge installed 1959
Spawning Beach 1 ceased operation 1965
Lower Baker powerhouse destroyed and rebuilt following a landslide 1965–1968
Spawning Beach 3 constructed 1967
Sulphur Creek fish facility constructed 1974
Fish guide nets installed at the Upper Baker forebay 1986
Upper Baker juvenile trap-and-haul capabilities installed 1987
Juvenile trap and haul installed at Lower Baker due to landslideinduced damage to bypass pipeline
1989
Upper Baker Unit 2 generator rewound 1989
Upper Baker Unit 1 generator rewound 1990
Spawning Beach 4 constructed 1990
Lower Baker pipeline repaired and operated through 1995 1991–1995
New ballast tanks installed at Lower Baker juvenile collection barge 1993
Spawning Beach 4 segmented into 4 isolated compartments 1995
Upper Baker Unit 2 repaired 1996
Updated Upper Baker juvenile collection facility installed 1996
Upper Baker Unit 1 refurbished 1997
Lower Baker refurbishments of penstock and generator, replacement ofturbine runner and trashracks
2001
H.16 Generation Lost Due to Outages
Tables H-7 and H-8 list unscheduled outages at the Baker River Project for the five yearsfrom 1998 through 2002. For each outage, information is provided on duration, time of day,reason for the outage, corrective action taken, and “lost MWh.” The last column of the tables(Lost MWh) does not actually represent a loss of overall generation, but rather the energy notgenerated during the outage that would be available for later generation.

Puget Sound Energy Exhibit HBaker River Project, FERC No. 2150 H-29 April 2004
Table H-7. Unscheduled outages for Upper Baker Development, 1998 through 2002.a
Date Duration Time FrameReason for
OutageCorrective
ActionLostMWh
July 30, 1998 3 hours,55 minutes
07:10–13:05 Gov 1 would not letunit synchronize
ReprogrammedVoith
196
May 21, 1999 55 minutes 13:45–14:40 Gov 1 over speed Adjusted 46
June 13, 1999 1 hour,50 minutes
16:20–18:10 Thrust bearingalarm on panel
Checked out;found nothing
wrong
92
April 13, 2000 5 hours,40 minutes
09:30–16:10 Loss of linebetween Upper andLower Baker due to
breaker failure
Repairedbreaker
465
May 25, 2000 30 minutes 13:50–14:20 AC pump failure Switched toDC pump
25
October 2, 2000 40 minutes 06:00–06:40 Exciter breakertripped
Reset breakerand adjusted
load limit
33
October 5, 2000 7 hours,35 minutes
09:30–17:05 Broken grease linefitting on wicket
gate bushing
Replacedfitting
379
October 10, 2000 4 hours,35 minutes
04:45–9:20 Relay hung up Repaired relay 50
December 6, 2000 3 hours,35 minutes
06:10–09:45 Unit 2 high/low oilalarm
Added 10gallons of oil
179
December 6, 2000 4 hours,45 minutes
06:25–11:05 Unit 1 water leakflow meter
Replaced flowmeter
223
January 22, 2001 6 hours,55 minutes
17:05–24:00 Mechanical blockin return cable
linkage in Unit 2
Removed block 238
a No unscheduled outages were reported in 2002.

Puget Sound Energy Exhibit HBaker River Project, FERC No. 2150 H-30 April 2004
Table H-8. Unscheduled outages at Lower Baker Development, 1998 through 2002.
Date Duration Reason for Outage Corrective ActionLostMWh
June 23, 1998 7 hours,25 minutes
Unit cooling waterlow flow
Adjusted valve 519
January 17, 1999 27 minutes Generator 3 relayedoff (cause unknown)
Reset and restarted 29
January 18, 1999 27 minutes Gov. oil, high-lowlevel
Reset and restarted 29
January 29, 1999 20 minutes Generator 3 relayedoff (cause unknown)
Reset and restarted
January 20, 1999 29 minutes Stuffing box strainerpossibly plugged
Reset and restarted 31
January 21, 1999 23 minutes Generator 3 relayedoff (cause unknown)
Reset and restarted 25
January 23, 1999 35 minutes Incomplete open,turbine shut-off valve
Restarted 38
January 25, 1999 Note only Butterfly driftingproblem found
Check status daily 0
March 3, 1999 30 minutes Unit 3 relayed off Butterfly valve drift 35
August 4, 1999 2 hours,5 minutes
Breaker 171 trip, unitS/D, storm
Inspected andrestarted
146
August 31, 1999 1 hour,31 minutes
Turbine guide bearing,high temperature
Inspected, reset,and restarted
105
October 28, 1999 33 minutes Butterfly valve,incomplete open
Opened andrestarted
39
November 10, 1999 26 minutes Butterfly valve,incomplete open
Opened andrestarted
30
November 12, 1999 20 minutes Butterfly valve,incomplete open
Opened andrestarted
23
November 13, 1999 25 minutes Butterfly valve,incomplete open
Opened andrestarted
29
July 27, 2000 11 hours Generator air, hightemperature
R.T.D. problem 770
July 28, 2000 1 hour,30 minutes
Generator airtemperature, problem
continued
49 AX relaydisabled
105
December 13, 2000 10 minutes Low-penstockpressure alarm, S/D
Restarted Unit 3 12
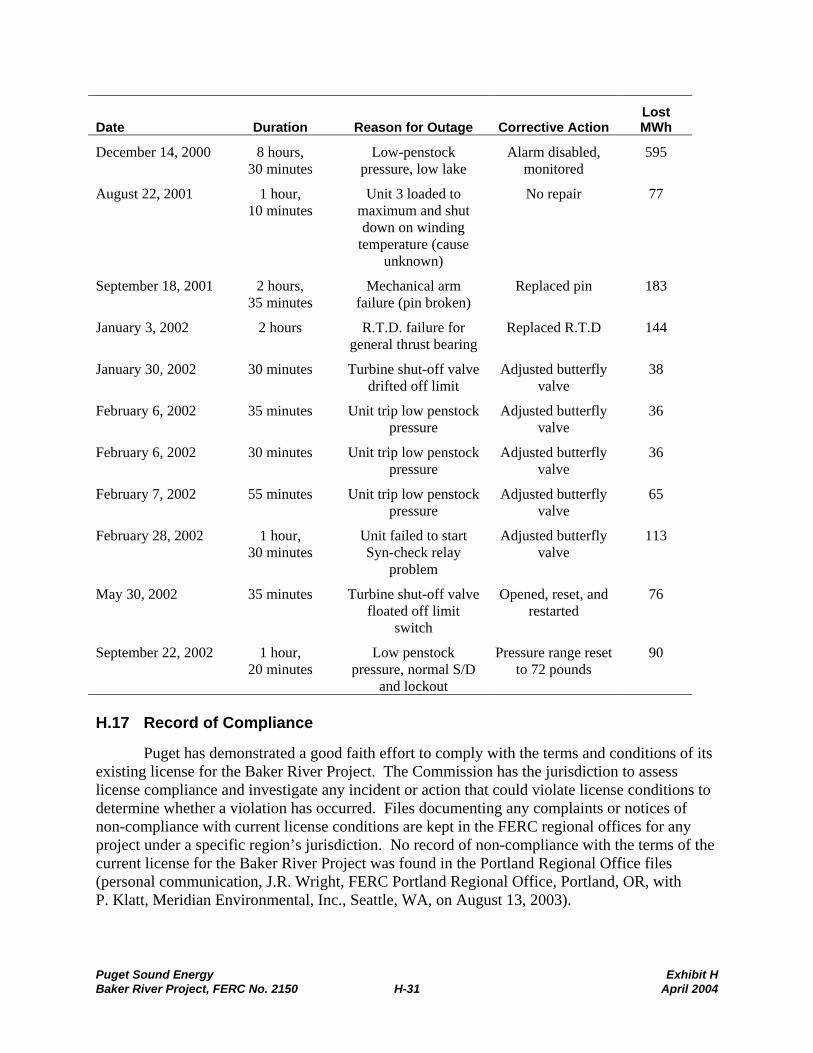
Puget Sound Energy Exhibit HBaker River Project, FERC No. 2150 H-31 April 2004
Date Duration Reason for Outage Corrective ActionLostMWh
December 14, 2000 8 hours,30 minutes
Low-penstockpressure, low lake
Alarm disabled,monitored
595
August 22, 2001 1 hour,10 minutes
Unit 3 loaded tomaximum and shutdown on winding
temperature (causeunknown)
No repair 77
September 18, 2001 2 hours,35 minutes
Mechanical armfailure (pin broken)
Replaced pin 183
January 3, 2002 2 hours R.T.D. failure forgeneral thrust bearing
Replaced R.T.D 144
January 30, 2002 30 minutes Turbine shut-off valvedrifted off limit
Adjusted butterflyvalve
38
February 6, 2002 35 minutes Unit trip low penstockpressure
Adjusted butterflyvalve
36
February 6, 2002 30 minutes Unit trip low penstockpressure
Adjusted butterflyvalve
36
February 7, 2002 55 minutes Unit trip low penstockpressure
Adjusted butterflyvalve
65
February 28, 2002 1 hour,30 minutes
Unit failed to startSyn-check relay
problem
Adjusted butterflyvalve
113
May 30, 2002 35 minutes Turbine shut-off valvefloated off limit
switch
Opened, reset, andrestarted
76
September 22, 2002 1 hour,20 minutes
Low penstockpressure, normal S/D
and lockout
Pressure range resetto 72 pounds
90
H.17 Record of Compliance
Puget has demonstrated a good faith effort to comply with the terms and conditions of itsexisting license for the Baker River Project. The Commission has the jurisdiction to assesslicense compliance and investigate any incident or action that could violate license conditions todetermine whether a violation has occurred. Files documenting any complaints or notices ofnon-compliance with current license conditions are kept in the FERC regional offices for anyproject under a specific region’s jurisdiction. No record of non-compliance with the terms of thecurrent license for the Baker River Project was found in the Portland Regional Office files(personal communication, J.R. Wright, FERC Portland Regional Office, Portland, OR, withP. Klatt, Meridian Environmental, Inc., Seattle, WA, on August 13, 2003).

Puget Sound Energy Exhibit HBaker River Project, FERC No. 2150 H-32 April 2004
The FERC Portland Regional Office conducts annual operation inspections for thepurpose of reviewing Project conditions and discussing with Puget staff any past or potentialfuture conditions that could result in a non-compliance event. Puget maintains dialogue with theFERC Portland Regional Office throughout the course of each year to ensure that theCommission is familiar with the Project operations and aware of any circumstance that couldresult in a variation from normal operating regimes. These efforts are an example of Puget’songoing commitment to compliance with its FERC licenses.
During late fall and winter of 2000–2001, western Washington, including the Projectarea, experienced drought conditions. During the drought, Puget complied with the terms of itslicense. However, information concerning Puget’s drought operations is relevant to assessmentof the aquatic resource conditions under the existing license and to development of conditions forthe new license. During the 2000–2001 drought, natural flows in the Skagit River basin droppedsignificantly. When Puget and Seattle City Light cycled each of their generators down to theirrespective minimum operating flows, salmon redds that had been established at higher flowswere exposed to air. Both Puget and Seattle City Light had limited water in their reservoirs, andSeattle City Light had additional license rule-curve constraints mandating refill of its projects’reservoirs. There was not enough water available to fully protect the redds that had spawned inthe higher stream margins prior to the drought. However, Puget, in consultation with resourceagencies and Tribal biologists, collaboratively developed a creative and effective protocol to besttake advantage of the limited water available in the Baker River Project reservoirs to protect themost redds in the Skagit River downstream of Concrete for the longest period.
By the time reservoir storage was exhausted, most of the Chinook fry had commencedtheir outmigration. After the 2000–2001 winter drought was over, Puget, in consultation withNational Oceanic and Atmospheric Administration (NOAA) Fisheries and the U.S. Fish andWildlife Service, developed and voluntarily implemented operational protocols that provide fordifferent reservoir and operational protocols depending on spawn timing and the relative wet ordry conditions present in the Skagit River basin. These operations are designed to protect themost spawners possible across a broad range of conditions, from drought to flood scour, withinthe existing operational capabilities of the Project. A coalition of environmental advocacygroups filed a lawsuit alleging the Commission and NOAA Fisheries had violated theEndangered Species Act by failing to more rigorously regulate Puget’s operations during andafter the drought. The case, Washington Trout et al. v. FERC, No. 01-71307 (9th Cir. 2001), wasdismissed as moot by the United States Court of Appeals for the Ninth Circuit. Relicensing willaddress aquatic resource issues through ongoing consultation with federal and state fish andwildlife agencies.
H.18 Project Actions Affecting the Public
Puget is a regulated electric utility company serving approximately 958,000 residential,commercial, and industrial customers in the state of Washington with clean and reliable power ata reasonable cost. The Baker River Project contributes to the stability of Puget’s power resourcesystem, and the coordinated Pacific Northwest power system, by producing approximately3.7 percent of Puget’s peak power resources. This alone significantly affects Puget’s customers,
Puget Sound Energy Exhibit HBaker River Project, FERC No. 2150 H-33 April 2004
as well as the general public, by providing a low-cost energy source and contributing to thebalance of regional power supply and demand.
In addition to operating and managing the Baker River Project to serve its customers withquality electric service at the lowest possible cost, Puget recognizes its obligation to provideadditional benefit to the local community, the natural resources, and the region at large.
Consistent with Article 32 of the existing license and the current agreement between theACOE and Puget, the ACOE can control the Baker River Project to reduce flooding in the lowerSkagit River valley through the use of 74,000 acre-feet of reservoir storage during the winterflood control season. These flood control operations provide a public benefit, primarily to thedownstream communities (e.g., of Mt. Vernon, Burlington, and Sedro-Woolley), infrastructure,and residential, agricultural, and industrial areas.
Puget operates and maintains a number of facilities that offer several types of recreationalexperiences to the public. These facilities include a public boat launch and informal campgroundon Lake Shannon; a 108-unit campground, boat launch and overlook on or near Baker Lake; aseasonal resort that operates under a special-use permit from the USFS; and a visitor center atLower Baker with an interpretive display and a fish trap viewing platform. Additionally, theUSFS has developed recreational facilities on Baker Lake to support recreational opportunitiesprovided by the Project.
The Baker River Project area supports seven species of anadromous salmonids. Cohoand sockeye salmon are the most abundant species. Chinook, pink, and chum salmon, winter-and summer-run steelhead trout and sea-run cutthroat trout comprise about 7 percent of the totalBaker River system anadromous population. Fifteen species of resident fish have also beenidentified in the Baker River system. Resident salmonid species include kokanee, rainbow trout,cutthroat trout, native char and mountain whitefish.
Puget has implemented a number of measures over the term of the existing license toprotect and enhance both the salmonid and resident fishery resources of the Baker River systemand more specifically of the Project area. These measures include upstream and downstreampassage for adult and juvenile salmonids, enhanced sockeye spawning habitat throughconstruction of spawning beaches, and the construction and operation of several productionfacilities. Although much of the focus is on the management of native anadromous stocks,resident fish play an important part in providing recreational opportunities in the basin. Between1968 and 2001, Puget and the Washington Department of Fish and Wildlife cooperativelystocked approximately 25,000 rainbow trout in the Project reservoirs annually. This voluntaryeffort by Puget benefited the public by providing a fishery in Baker Lake and Lake Shannon thatattracted thousands of anglers each summer. Recent management efforts have shifted the focusof the trout plantings from Baker Lake and Lake Shannon to Depression Lake. A detaileddescription of fishery measures undertaken by Puget over the years can be found in section 5 ofthe PDEA.
The Project reservoirs provide important overwinter habitat for 10 to 20 bald eagles and avariety of waterfowl, including trumpeter swans, Canada geese, ducks, loons, and shorebirds.

Puget Sound Energy Exhibit HBaker River Project, FERC No. 2150 H-34 April 2004
Bald eagles, osprey, ducks, geese, and shorebirds also use the lakes as their summer homes.Puget has voluntarily supplemented the natural osprey nests found around Lake Shannon withnine constructed osprey nesting platforms to provide additional safe and abundant nesting sites.
In addition to the benefits Puget provides to the area natural resources and the recreatingpublic, the Project contributes to the economies of Skagit and Whatcom counties through thepayment of property taxes and the employment of 20 full-time employees and approximately24 seasonal employees.
H.19 Expense Impact from Transfer of License
Table H-9 shows the annual ownership and operating expenses that would be reduced ifthe Project license was transferred from Puget to another party. The expenses in table H-9 arebased on levelized annual costs, both without inflation and with inflation.
Table H-9. Baker River Project annual operating expenses.Annual Expenses ($2006)
Without inflation With inflationO&M 3,683,000 4,658,700Depreciation 1,355,500 1,433,800Insurance 888,900 890,300Property taxes 1,241,100 1,246,400Subtotal 6,368,500 7,428,200Less estimated federal income taxsavings –2,229,000 –2,599,900Total annual operating expense 4,139,600 4,828,300
H.20 Annual Fees
The Project does not involve any annual fees for the use of Indian Tribe lands, because itdoes not occupy any such lands. The levelized annual FERC fees are $604,000 ($2006) withoutinflation and $764,000 with inflation.
H.21 Literature Cited
ACOE (U.S. Army Corps of Engineers). 2000. Baker River Project water control manual. U.S.Army Engineer District, Seattle, WA.
Puget (Puget Sound Energy). 2003. Least cost plan. Puget Sound Energy, Bellevue, WA.April 30, 2003.
Puget Sound Energy Exhibit HBaker River Project, FERC No. 2150 H-35 April 2004
Raytheon (Raytheon Engineers and Constructors). 1999. Baker River Project upgradeassessment report. FERC Project No. 2150. Prepared for Puget Sound Energy. Preparedby Raytheon Engineers and Constructors, Bellevue, WA. September 1999.


