System analysis & Performance Instrument
Mar. 2015
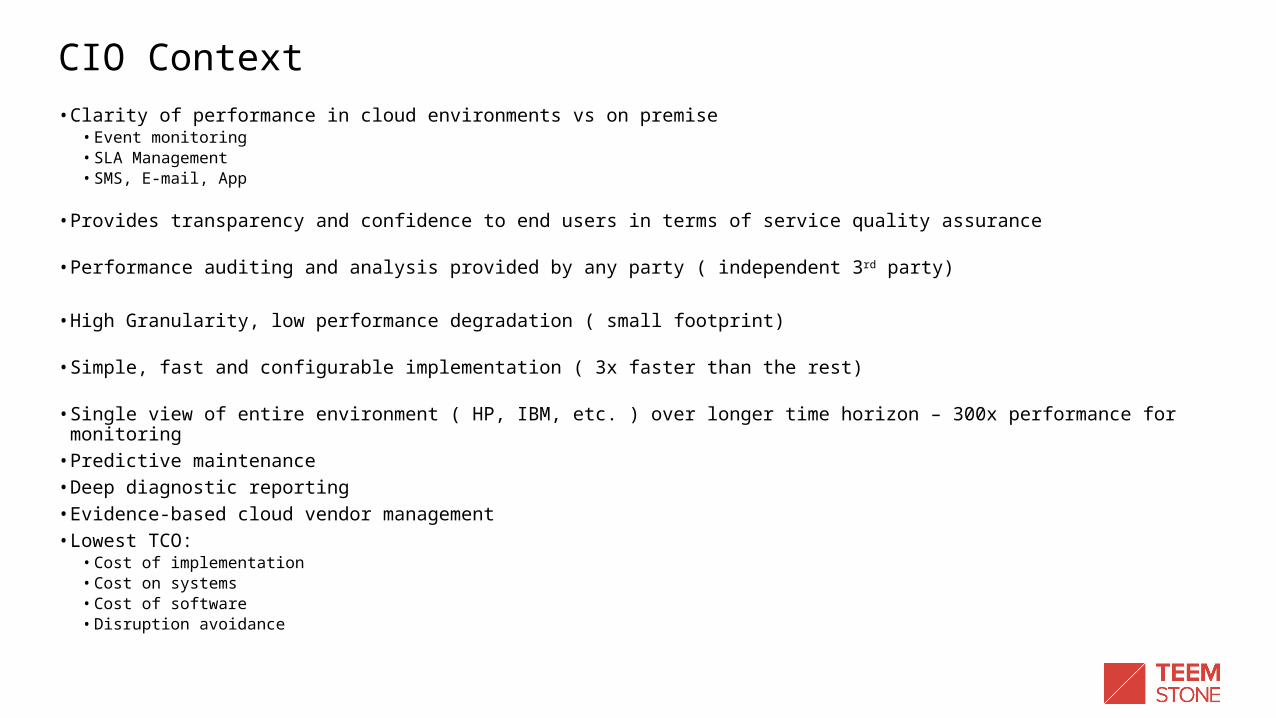
CIO Context• Clarity of performance in cloud environments vs on premise
• Event monitoring • SLA Management• SMS, E-mail, App
• Provides transparency and confidence to end users in terms of service quality assurance
• Performance auditing and analysis provided by any party ( independent 3rd party)
• High Granularity, low performance degradation ( small footprint)
• Simple, fast and configurable implementation ( 3x faster than the rest)
• Single view of entire environment ( HP, IBM, etc. ) over longer time horizon – 300x performance for monitoring• Predictive maintenance• Deep diagnostic reporting• Evidence-based cloud vendor management• Lowest TCO:
• Cost of implementation• Cost on systems• Cost of software• Disruption avoidance
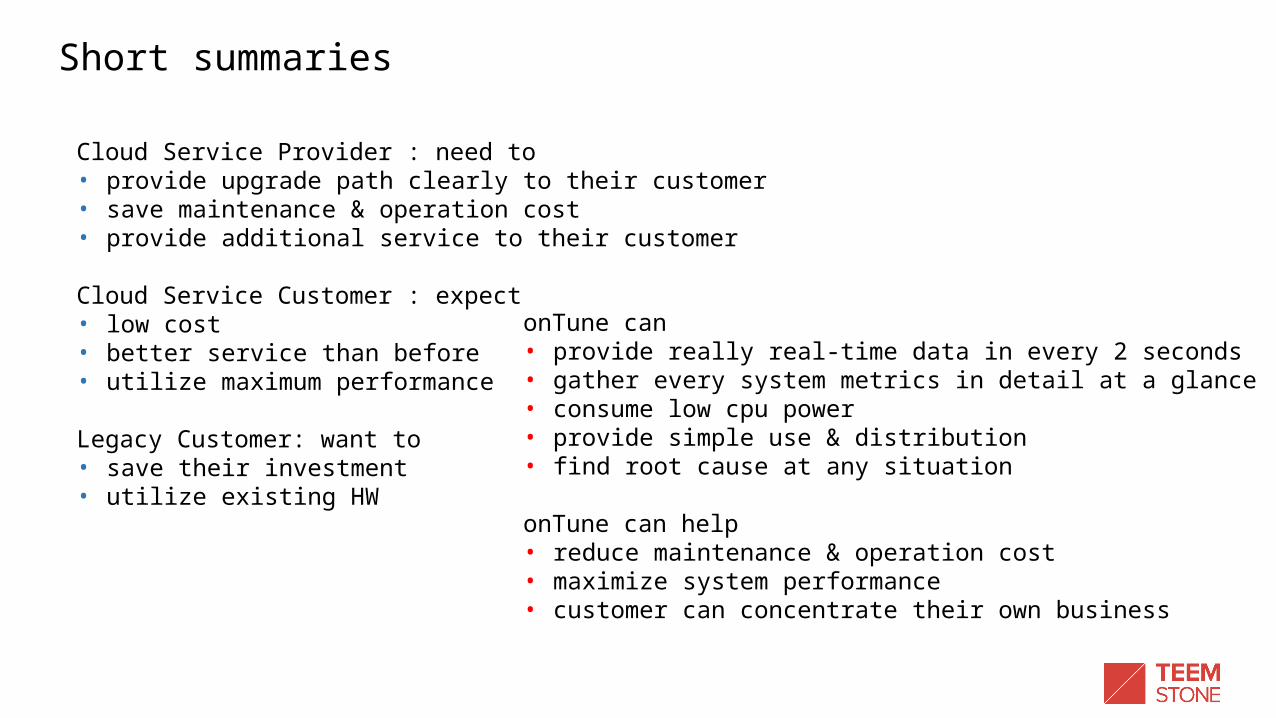
Cloud Service Provider : need to• provide upgrade path clearly to their customer• save maintenance & operation cost • provide additional service to their customer
Cloud Service Customer : expect• low cost• better service than before• utilize maximum performance
Legacy Customer: want to• save their investment• utilize existing HW
onTune can• provide really real-time data in every 2 seconds• gather every system metrics in detail at a glance• consume low cpu power• provide simple use & distribution• find root cause at any situation
onTune can help• reduce maintenance & operation cost• maximize system performance• customer can concentrate their own business
Short summaries

1 minute
10 minutes
What make a difference!
peer
2 seconds
1. provide really real-time data
10 minutes windows
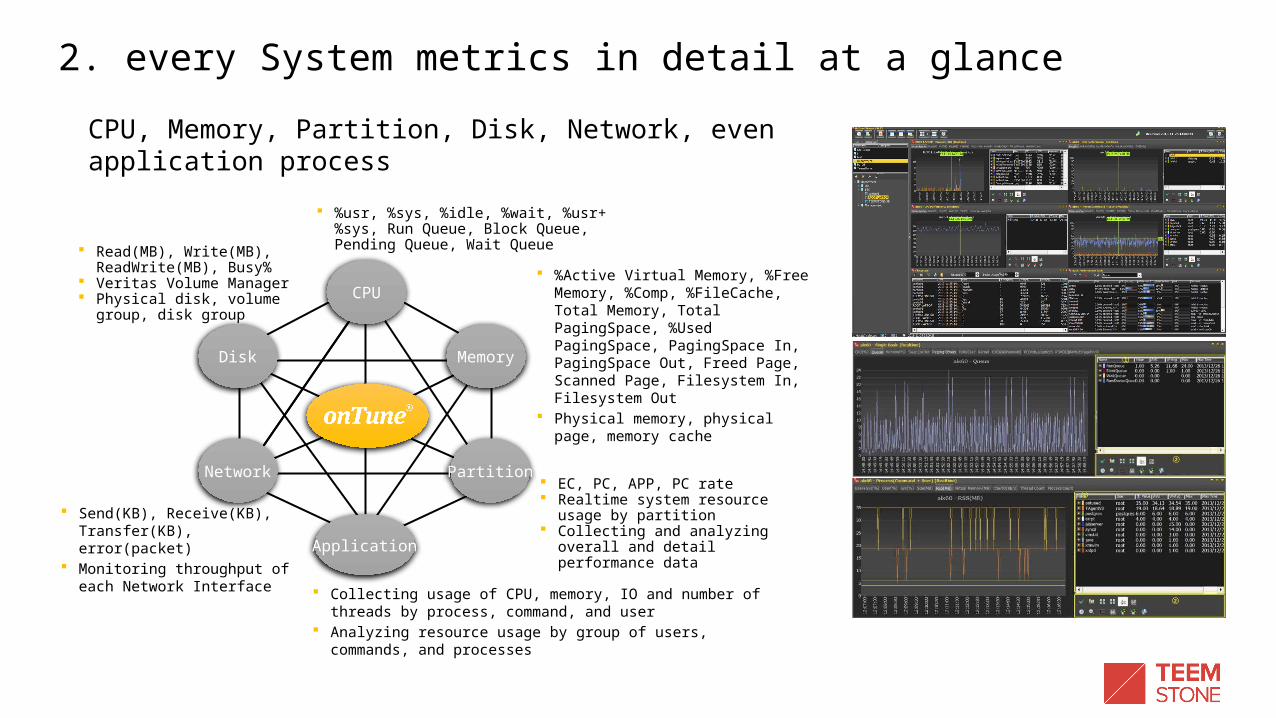
2. every System metrics in detail at a glance
CPU, Memory, Partition, Disk, Network, even appli-cation process
Read(MB), Write(MB), Read-Write(MB), Busy%
Veritas Volume Manager Physical disk, volume group,
disk group
%usr, %sys, %idle, %wait, %usr+%sys, Run Queue, Block Queue, Pend-ing Queue, Wait Queue
%Active Virtual Memory, %Free Memory, %Comp, %FileCache, To-tal Memory, Total PagingSpace, %Used PagingSpace, PagingSpace In, PagingSpace Out, Freed Page, Scanned Page, Filesystem In, Filesystem Out
Physical memory, physical page, memory cache
EC, PC, APP, PC rate Realtime system resource usage
by partition Collecting and analyzing overall
and detail performance data
Send(KB), Receive(KB), Trans-fer(KB), error(packet)
Monitoring throughput of each Network Interface
Memory
CPU
Disk
Network
Application
Partition
Collecting usage of CPU, memory, IO and number of threads by process, command, and user
Analyzing resource usage by group of users, commands, and processes
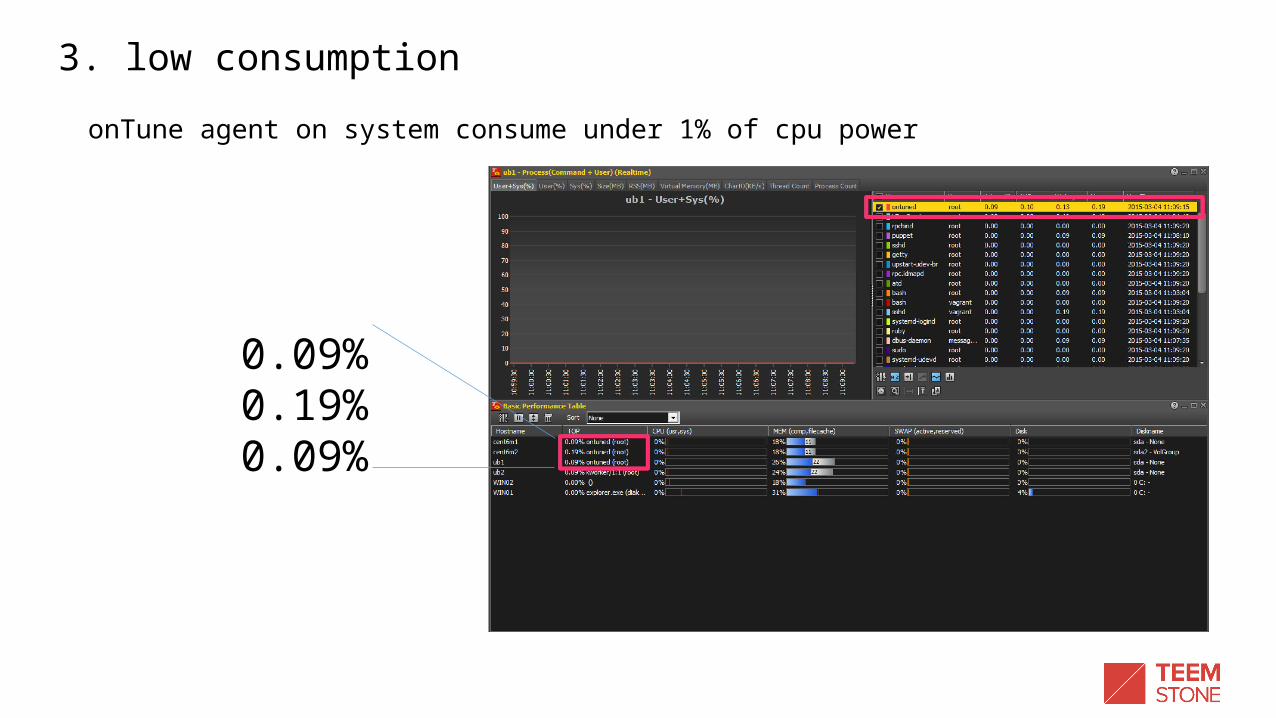
3. low consumption
onTune agent on system consume under 1% of cpu power
0.09%0.19%0.09%
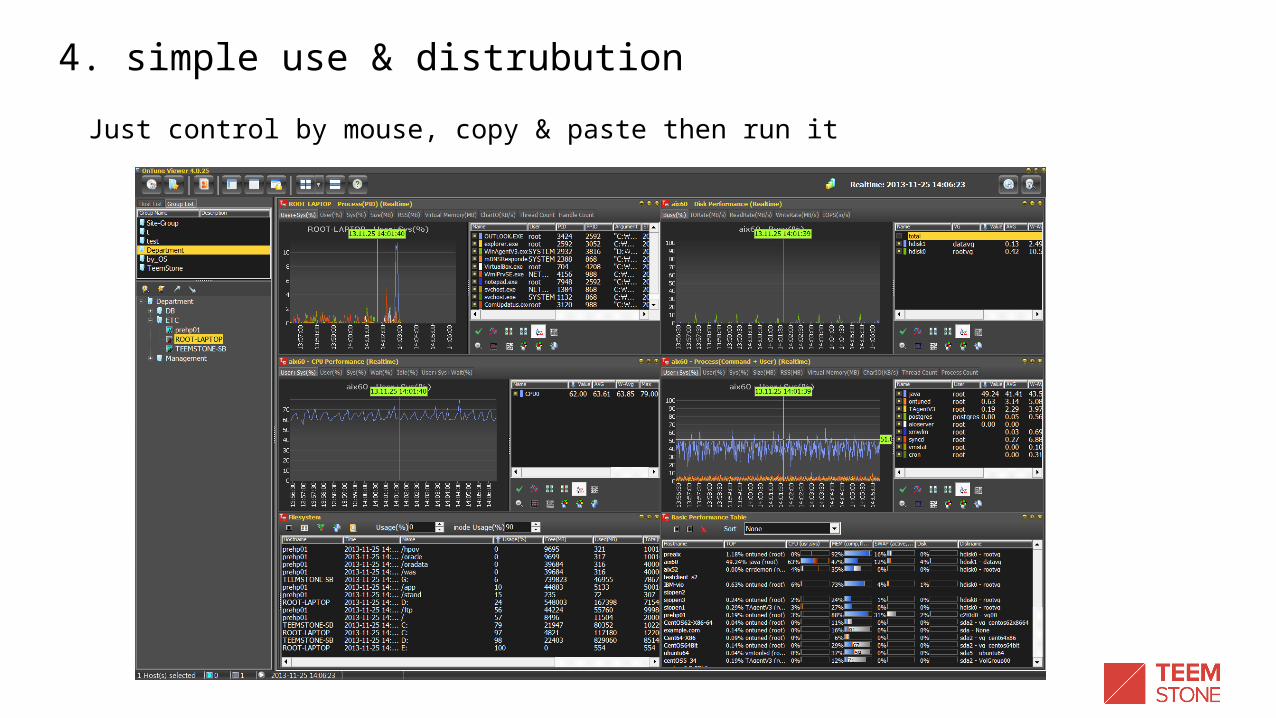
4. simple use & distrubution
Just control by mouse, copy & paste then run it

5. find root cause
onTune collects metrics of every working pro-cesses automatically
You don’t have to choose a few process Not only per process but every disk’s and
NIC’s performance informations are also col-lected
All of these are measured per every 5 sec-onds in default
You can easily find the criminal
onTune

Position of onTune
Operating System
Unix (AIX, HPUX, Solaris)Linux(Redhat, Suse, Ubuntu)Windows
Hypervisor
OS OS
Database
Java, .Net, etc
Application
DatabaseAppli-cation
…………
Vmware, MS, IBM, HP, Oracle

Customer using onTune SPI Sensitive in System Performance If someone use Virtualization, They need onTune
Many more

vs
Grains or Husks, this is the question.