

Chapter – IV
ANALYSIS OF DATA AND RESULTS OF THE STUDY
The purpose of the study was to find out the effect of Bihar
School of yoga practice and BKS Iyengar yoga practice on selected
body composition measures, physiological and biochemical variables
among middle aged men. To achieve this purpose of the study, forty
five middle aged men were randomly selected as subjects. They
were divided into three equal groups, each group consists of fifteen
subjects in which group - I underwent Bihar School of yoga practice,
group - II underwent BKS Iyengar yoga practice and group - III
acted as control group who did not participate in any special training.
The subjects were tested on selected criterion variables such as
percentage of body fat, body mass index(BMI), blood pressures
(both systolic and diastolic), resting pulse rate, breath holding time,
total cholesterol, triglycerides, high density lipoprotein and fasting
blood glucose at prior to and immediately after the training period.
The selected criterion variables such as percentage of body fat was
assessed by Deurenberg et al formula, body mass index (BMI) was
assessed by Quetelet index, systolic and diastolic blood pressure was

93
measured by using sphygmomanometer, resting pulse rate was
measured by counting the pulse beat per minute, breath holding time
was measured by holding the breath for maximum duration in
seconds after a deep inhalation, total cholesterol, triglycerides, high
density lipoprotein and fasting blood glucose were measured by
using Boehringer Mannheim Kit method. The analysis of covariance
(ANCOVA) was used to find out the significant difference if any,
among the experimental groups and control group on selected
criterion variables separately. Whenever, ‘F’ ratio for adjusted test
was found to be significant for adjusted post-test means. Scheffé S
test was followed, as a post-hoc test to determine which of the paired
mean differ significantly.
Experimenters and research workers choose several arbitrary
standards for their convenience. These arbitrary standards are called
level of significance. Most commonly used level of significance are
0.01 and 0.05 level as the level of significance to test its hypothesis.
In all the cases, 0.05 level of confidence was fixed to test the
significance, which was considered as an appropriate. Since there

94
were three groups involved in this study the Scheffẻ S test was used
as pos-hoc test.
Analysis of Data Percentage of Body Fat
The data collected prior to and after the experimental period
on percentage of body fat of Bihar School of yoga practice group,
BKS Iyengar yoga practice group and control group were analysed
and presented in Table - III.

95
Table - III
ANALYSIS OF COVARIANCE ON PERCENTAGE OF BODY FAT OF
BIHAR SCHOOL OF YOGA PRACTICE GROUP BKS IYENGAR
YOGA PRACTICE GROUP AND CONTROL GROUP
Bihar
School
of Yoga
Practice
Group
BKS
Iyengar
Yoga
Practice
Group
Control
Group SOV
Sum of
Squares df
Mean
Square
‘F’
ratio
Pre- test
Mean
S.D.
26.658
3.124
25.978
2.4139
25.9899
2.484
B:
W:
4.544
304.546
2
42
2.272
7.251
0.313
Post-test
Mean
S.D.
25.9041
2.9588
25.134
2.5312
26.582
2.4161
B:
W:
15.756
293.98
2
42
7.878
7.00
1.126
Adjusted
Post-test
Mean
25.467
25.358
26.795
B:
W:
19.152
5.977
2
41
9.576
0.146
65.691*
* Significant at .05 level of confidence.
(The table value required for significance at .05 level of confidence with df 2 and 42 and 2
and 41 were 3.21 and 3.22 respectively).
Table – III shows that the pre-test means on percentage of
body fat of Bihar School of yoga practice group, BKS Iyengar yoga
practice and control groups were 26.658 3.124, 25.978 2.4139
and 25.9899 2.484 respectively. The obtained ‘F’ ratio value of
0.313 for pre-test score of Bihar School of yoga practice group, BKS

96
Iyengar yoga practice and control groups on percentage of body fat
was less than the required table value of 3.21 for significance with df
2 and 42 at .05 level of confidence.
The post-test mean values of percentage of body fat for Bihar
School of yoga practice group, BKS Iyengar yoga practice and
control groups were 25.9041 2.9588, 25.134 2.5312 and 26.582
2.4161 respectively. The obtained ‘F’ ratio value of 1.126 for
post-test scores of Bihar School of yoga practice group, BKS Iyengar
yoga practice and control groups was less than the required table
value of 3.21 for significance with df 2 and 42 at .05 level of
confidence.
The adjusted post-test mean values of Bihar School of yoga
practice group, BKS Iyengar yoga practice and control groups were
25.467, 25.358 and 26.795 respectively. The obtained ‘F’ ratio value
of 65.691 for adjusted post-test scores of Bihar School of yoga
practice group, BKS Iyengar yoga practice and control groups was
higher than the required table value of 3.22 for significance with df 2
and 41 at .05 level of confidence.
97
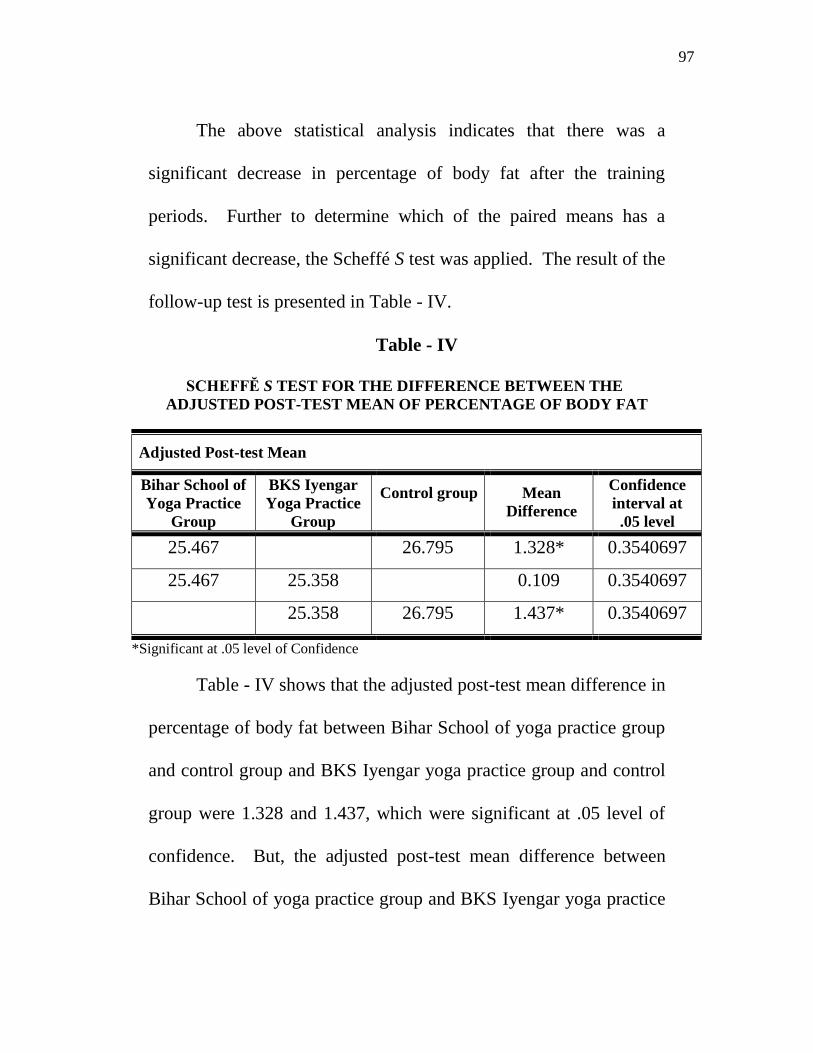
The above statistical analysis indicates that there was a
significant decrease in percentage of body fat after the training
periods. Further to determine which of the paired means has a
significant decrease, the Scheffé S test was applied. The result of the
follow-up test is presented in Table - IV.
Table - IV
SCHEFFĔ S TEST FOR THE DIFFERENCE BETWEEN THE
ADJUSTED POST-TEST MEAN OF PERCENTAGE OF BODY FAT
Adjusted Post-test Mean
Bihar School of
Yoga Practice
Group
BKS Iyengar
Yoga Practice
Group
Control group Mean
Difference
Confidence
interval at
.05 level
25.467 26.795 1.328* 0.3540697
25.467 25.358 0.109
0.3540697
25.358 26.795 1.437* 0.3540697
*Significant at .05 level of Confidence
Table - IV shows that the adjusted post-test mean difference in
percentage of body fat between Bihar School of yoga practice group
and control group and BKS Iyengar yoga practice group and control
group were 1.328 and 1.437, which were significant at .05 level of
confidence. But, the adjusted post-test mean difference between
Bihar School of yoga practice group and BKS Iyengar yoga practice

98
group was 0.109 which was insignificant. It may be concluded from
the results of the study that Bihar School of yoga practice group and
BKS Iyengar yoga practice group has significantly decrease the
percentage of body fat when compared with the control group.
The mean values on percentage of body fat of Bihar School of
yoga practice group, BKS Iyengar yoga practice and control groups
were graphically represented in figure - I.

99
24
24.5
25
25.5
26
26.5
27P
erc
en
tag
e o
f B
od
y F
at
1 2 3
Exp. Group - I Exp. Group - II Control Group
Pre-test Means Post-test Means Adj. Post-test Means
Figure – I : Bar Diagram Showing the Mean Values of Bihar School of
Yoga Practice Group (Exp. Group – I) BKS Iyengar Yoga
Practice Group (Exp. Group – II) and Control Group on
Percentage of Body Fat
100
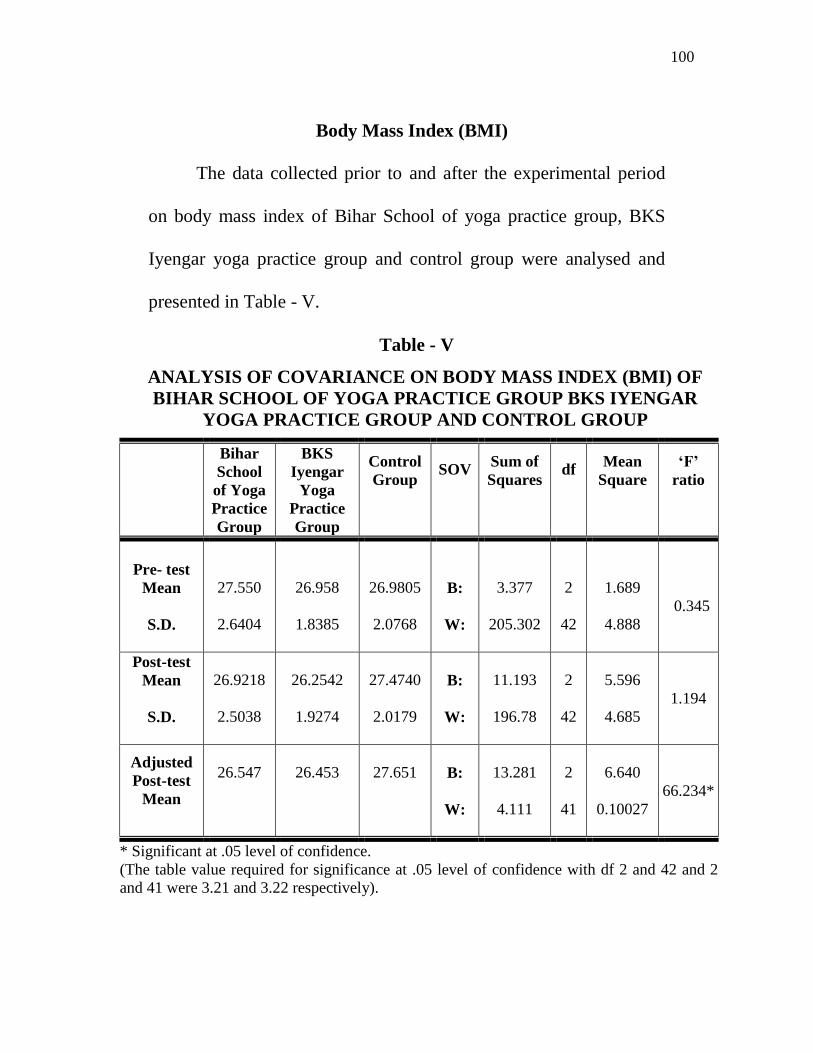
Body Mass Index (BMI)
The data collected prior to and after the experimental period
on body mass index of Bihar School of yoga practice group, BKS
Iyengar yoga practice group and control group were analysed and
presented in Table - V.
Table - V
ANALYSIS OF COVARIANCE ON BODY MASS INDEX (BMI) OF
BIHAR SCHOOL OF YOGA PRACTICE GROUP BKS IYENGAR
YOGA PRACTICE GROUP AND CONTROL GROUP
Bihar
School
of Yoga
Practice
Group
BKS
Iyengar
Yoga
Practice
Group
Control
Group SOV
Sum of
Squares df
Mean
Square
‘F’
ratio
Pre- test
Mean
S.D.
27.550
2.6404
26.958
1.8385
26.9805
2.0768
B:
W:
3.377
205.302
2
42
1.689
4.888
0.345
Post-test
Mean
S.D.
26.9218
2.5038
26.2542
1.9274
27.4740
2.0179
B:
W:
11.193
196.78
2
42
5.596
4.685
1.194
Adjusted
Post-test
Mean
26.547
26.453
27.651
B:
W:
13.281
4.111
2
41
6.640
0.10027
66.234*
* Significant at .05 level of confidence.
(The table value required for significance at .05 level of confidence with df 2 and 42 and 2
and 41 were 3.21 and 3.22 respectively).

101
Table – V shows that the pre-test means on body mass index
of Bihar School of yoga practice group, BKS Iyengar yoga practice
and control groups were 27.550 2.6404, 26.958 1.8385 and
26.9805 2.0768 respectively. The obtained ‘F’ ratio value of 0.345
for pre-test score of Bihar School of yoga practice group, BKS
Iyengar yoga practice and control groups on body mass index was
lesser than the required table value of 3.21 for significance with df 2
and 42 at .05 level of confidence.
The post-test mean values of body mass index for Bihar
School of yoga practice group, BKS Iyengar yoga practice and
control groups were 26.9218 2.5038, 26.2542 1.9274 and
27.4740 2.0179 respectively. The obtained ‘F’ ratio value of 1.194
for post-test scores of Bihar School of yoga practice group, BKS
Iyengar yoga practice and control groups was lesser than the required
table value of 3.21 for significance with df 2 and 42 at .05 level of
confidence.
The adjusted post-test mean values of Bihar School of yoga
practice group, BKS Iyengar yoga practice and control groups were
26.547, 26.453 and 27.651 respectively. The obtained ‘F’ ratio value

102
of 66.234 for adjusted post-test scores of Bihar School of yoga
practice group, BKS Iyengar yoga practice and control groups was
higher than the required table value of 3.22 for significance with df 2
and 41 at .05 level of confidence.
The above statistical analysis indicates that there was a
significant decrease in body mass index after the training periods.
Further to determine which of the paired means has a significant
decrease, the Scheffé S test was applied. The result of the follow-up
test is presented in Table - VI.
Table - VI
SCHEFFĔ S TEST FOR THE DIFFERENCE BETWEEN THE
ADJUSTED POST-TEST MEAN OF BODY MASS INDEX (BMI)
Adjusted Post-test Mean
Bihar School of
Yoga Practice
Group
BKS Iyengar
Yoga Practice
Group
Control group Mean
Difference
Confidence
interval at
.05 level
26.547 27.651 1.104* 0.295738
26.547 26.453 0.094
0.295738
26.453 27.651 1.198* 0.295738
*Significant at .05 level of Confidence
Table - VI shows that the adjusted post-test mean difference in
body mass index between Bihar School of yoga practice group and

103
control group and BKS Iyengar yoga practice group and control
group were 1.104 and 1.198, which were significant at .05 level of
confidence. But, the adjusted post-test mean difference between
Bihar School of yoga practice group and BKS Iyengar yoga practice
group was 0.094 which was insignificant. It may be concluded from
the results of the study that Bihar School of yoga practice group and
BKS Iyengar yoga practice group has significantly decrease the body
mass index when compared with the control group.
The mean values on body mass index of Bihar School of yoga
practice group, BKS Iyengar yoga practice and control groups were
graphically represented in figure - II.

104
25.5
26
26.5
27
27.5
28B
od
y M
ass In
de
x
1 2 3
Exp. Group - I Exp. Group - II Control Group
Pre-test Means Post-test Means Adj. Post-test Means
Figure – II : Bar Diagram Showing the Mean Values of Bihar School of
Yoga Practice Group (Exp. Group – I) BKS Iyengar Yoga
Practice Group (Exp. Group – II) and Control Group on Body
Mass Index (BMI)
105
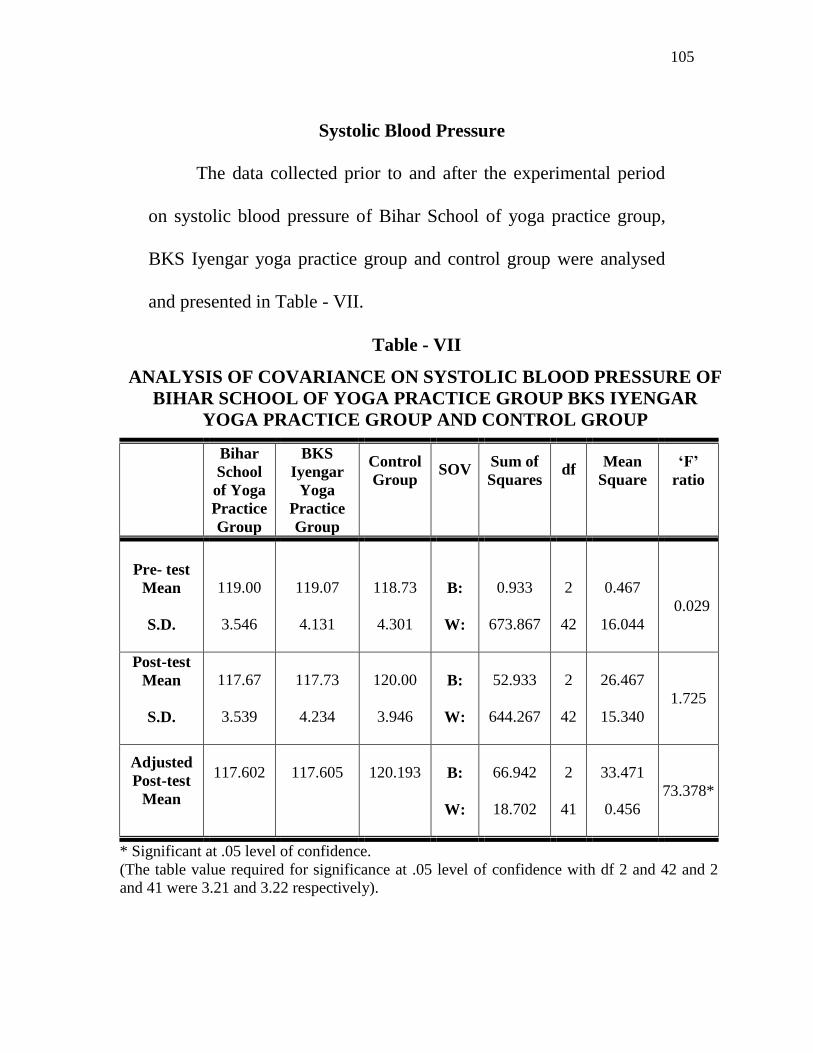
Systolic Blood Pressure
The data collected prior to and after the experimental period
on systolic blood pressure of Bihar School of yoga practice group,
BKS Iyengar yoga practice group and control group were analysed
and presented in Table - VII.
Table - VII
ANALYSIS OF COVARIANCE ON SYSTOLIC BLOOD PRESSURE OF
BIHAR SCHOOL OF YOGA PRACTICE GROUP BKS IYENGAR
YOGA PRACTICE GROUP AND CONTROL GROUP
Bihar
School
of Yoga
Practice
Group
BKS
Iyengar
Yoga
Practice
Group
Control
Group SOV
Sum of
Squares df
Mean
Square
‘F’
ratio
Pre- test
Mean
S.D.
119.00
3.546
119.07
4.131
118.73
4.301
B:
W:
0.933
673.867
2
42
0.467
16.044
0.029
Post-test
Mean
S.D.
117.67
3.539
117.73
4.234
120.00
3.946
B:
W:
52.933
644.267
2
42
26.467
15.340
1.725
Adjusted
Post-test
Mean
117.602
117.605
120.193
B:
W:
66.942
18.702
2
41
33.471
0.456
73.378*
* Significant at .05 level of confidence.
(The table value required for significance at .05 level of confidence with df 2 and 42 and 2
and 41 were 3.21 and 3.22 respectively).
106
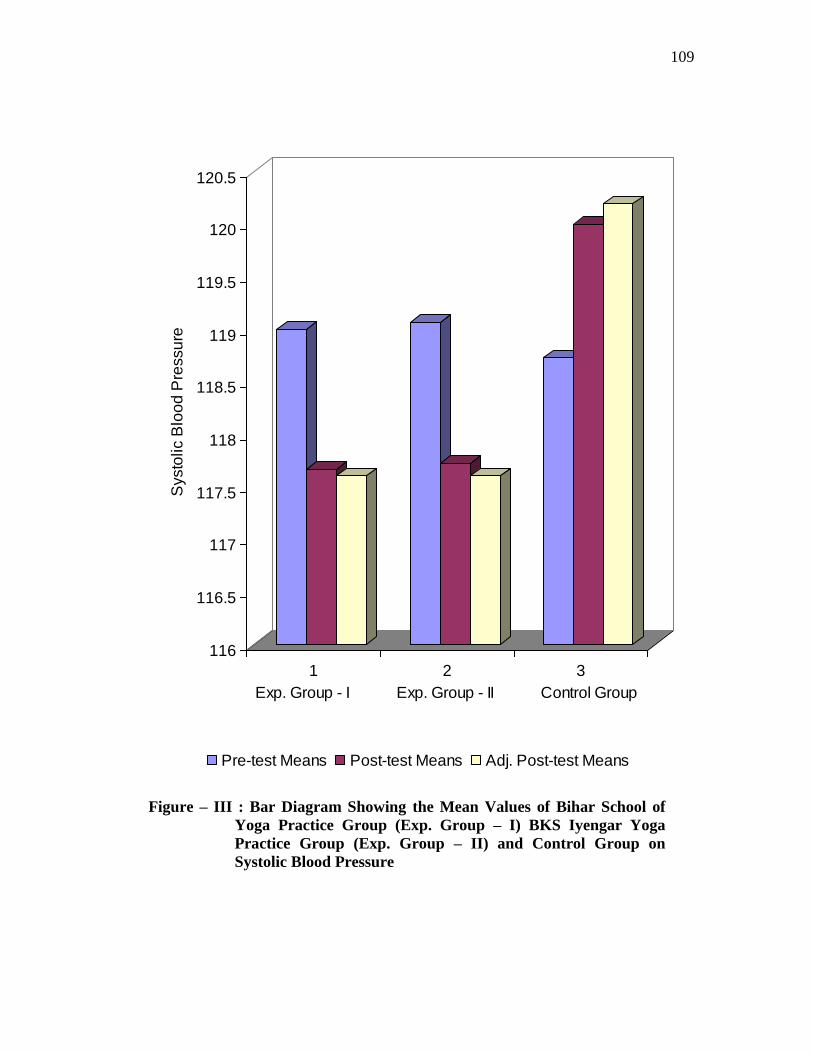
Table – VII shows that the pre-test means on systolic blood
pressure of Bihar School of yoga practice group, BKS Iyengar yoga
practice and control groups were 119.00 3.546, 119.07 4.131 and
118.73 4.301 respectively. The obtained ‘F’ ratio value of 0.029
for pre-test score of Bihar School of yoga practice group, BKS
Iyengar yoga practice and control groups on systolic blood pressure
was lesser than the required table value of 3.21 for significance with
df 2 and 42 at .05 level of confidence.
The post-test mean values of systolic blood pressure for Bihar
School of yoga practice group, BKS Iyengar yoga practice and
control groups were 117.67 3.539, 117.73 4.234 and 120.00
3.946 respectively. The obtained ‘F’ ratio value of 1.725 for post-
test scores of Bihar School of yoga practice group, BKS Iyengar
yoga practice and control groups was lesser than the required table
value of 3.21 for significance with df 2 and 42 at .05 level of
confidence.
The adjusted post-test mean values of Bihar School of yoga
practice group, BKS Iyengar yoga practice and control groups were
117.602, 117.605 and 120.193 respectively. The obtained ‘F’ ratio

107
value of 73.378 for adjusted post-test scores of Bihar School of yoga
practice group, BKS Iyengar yoga practice and control groups was
higher than the required table value of 3.22 for significance with df 2
and 41 at .05 level of confidence.
The above statistical analysis indicates that there was a
significant decrease in systolic blood pressure after the training
periods. Further to determine which of the paired means has a
significant decrease, the Scheffé S test was applied. The result of the
follow-up test is presented in Table - VIII.
Table - VIII
SCHEFFĔ S TEST FOR THE DIFFERENCE BETWEEN THE
ADJUSTED POST-TEST MEAN OF SYSTOLIC BLOOD PRESSURE
Adjusted Post-test Mean
Bihar School of
Yoga Practice
Group
BKS Iyengar
Yoga Practice
Group
Control group Mean
Difference
Confidence
interval at
.05 level
117.602 120.193 2.591* 0.6257412
117.602 117.605 0.003
0.6257412
117.605 120.193 2.588* 0.6257412
*Significant at .05 level of Confidence
Table - VIII shows that the adjusted post-test mean difference
in systolic blood pressure between Bihar School of yoga practice

108
group and control group and BKS Iyengar yoga practice group and
control group were 2.591 and 2.588, which were significant at .05
level of confidence. But, the adjusted post-test mean difference
between Bihar School of yoga practice group and BKS Iyengar yoga
practice group was 0.003 which was insignificant. It may be
concluded from the results of the study that Bihar School of yoga
practice group and BKS Iyengar yoga practice group has
significantly decrease the systolic blood pressure when compared
with the control group.
The mean values on systolic blood pressure of Bihar School of
yoga practice group, BKS Iyengar yoga practice and control groups
were graphically represented in figure - III.
109
116
116.5
117
117.5
118
118.5
119
119.5
120
120.5S
ysto
lic B
loo
d P
ressu
re
1 2 3
Exp. Group - I Exp. Group - II Control Group
Pre-test Means Post-test Means Adj. Post-test Means
Figure – III : Bar Diagram Showing the Mean Values of Bihar School of
Yoga Practice Group (Exp. Group – I) BKS Iyengar Yoga
Practice Group (Exp. Group – II) and Control Group on
Systolic Blood Pressure

110
Diastolic Blood Pressure
The data collected prior to and after the experimental period
on diastolic blood pressure of Bihar School of yoga practice group,
BKS Iyengar yoga practice group and control group were analysed
and presented in Table - IX.
Table - IX
ANALYSIS OF COVARIANCE ON DIASTOLIC BLOOD PRESSURE OF
BIHAR SCHOOL OF YOGA PRACTICE GROUP BKS IYENGAR
YOGA PRACTICE GROUP AND CONTROL GROUP
Bihar
School
of Yoga
Practice
Group
BKS
Iyengar
Yoga
Practice
Group
Control
Group SOV
Sum of
Squares df
Mean
Square
‘F’
ratio
Pre- test
Mean
S.D.
78.33
4.237
78.13
5.111
78.47
4.34
B:
W:
0.844
880.80
2
42
0.422
20.971
0.02
Post-test
Mean
S.D.
77.13
4.033
76.87
4.998
79.27
4.317
B:
W:
51.911
838.40
2
42
25.956
19.962
1.30
Adjusted
Post-test
Mean
77.112
77.038
79.116
B:
W:
41.683
16.707
2
41
20.841
0.407
51.146*
* Significant at .05 level of confidence.
(The table value required for significance at .05 level of confidence with df 2 and 42 and 2
and 41 were 3.21 and 3.22 respectively).
111
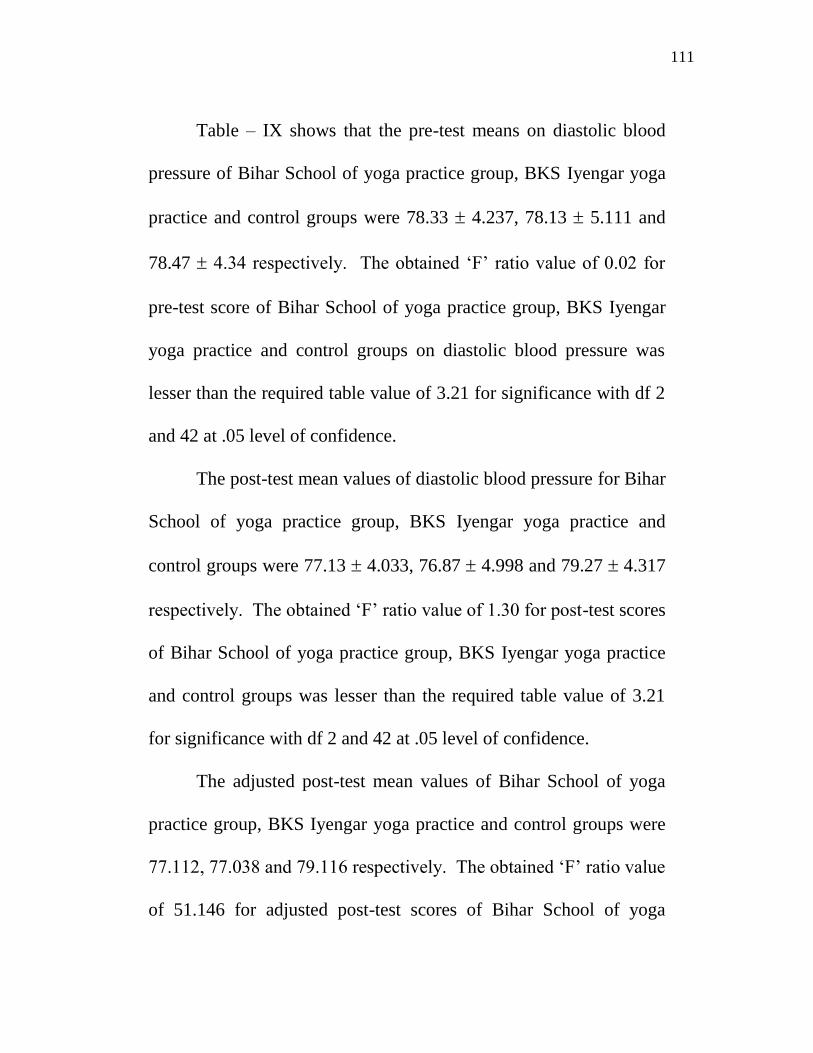
Table – IX shows that the pre-test means on diastolic blood
pressure of Bihar School of yoga practice group, BKS Iyengar yoga
practice and control groups were 78.33 4.237, 78.13 5.111 and
78.47 4.34 respectively. The obtained ‘F’ ratio value of 0.02 for
pre-test score of Bihar School of yoga practice group, BKS Iyengar
yoga practice and control groups on diastolic blood pressure was
lesser than the required table value of 3.21 for significance with df 2
and 42 at .05 level of confidence.
The post-test mean values of diastolic blood pressure for Bihar
School of yoga practice group, BKS Iyengar yoga practice and
control groups were 77.13 4.033, 76.87 4.998 and 79.27 4.317
respectively. The obtained ‘F’ ratio value of 1.30 for post-test scores
of Bihar School of yoga practice group, BKS Iyengar yoga practice
and control groups was lesser than the required table value of 3.21
for significance with df 2 and 42 at .05 level of confidence.
The adjusted post-test mean values of Bihar School of yoga
practice group, BKS Iyengar yoga practice and control groups were
77.112, 77.038 and 79.116 respectively. The obtained ‘F’ ratio value
of 51.146 for adjusted post-test scores of Bihar School of yoga

112
practice group, BKS Iyengar yoga practice and control groups was
higher than the required table value of 3.22 for significance with df 2
and 41 at .05 level of confidence.
The above statistical analysis indicates that there was a
significant decrease in diastolic blood pressure after the training
periods. Further to determine which of the paired means has a
significant decrease, the Scheffé S test was applied. The result of the
follow-up test is presented in Table - X.
Table - X
SCHEFFĔ S TEST FOR THE DIFFERENCE BETWEEN THE
ADJUSTED POST-TEST MEAN OF DIASTOLIC BLOOD PRESSURE
Adjusted Post-test Mean
Bihar School of
Yoga Practice
Group
BKS Iyengar
Yoga Practice
Group
Control group Mean
Difference
Confidence
interval at
.05 level
77.112 79.116 2.004* 0.5911661
77.112 77.038 0.074
0.5911661
77.038 79.116 2.078* 0.5911661
*Significant at .05 level of Confidence
Table - X shows that the adjusted post-test mean difference in
diastolic blood pressure between Bihar School of yoga practice
group and control group and BKS Iyengar yoga practice group and

113
control group were 2.004 and 2.078, which were significant at .05
level of confidence. But, the adjusted post-test mean difference
between Bihar School of yoga practice group and BKS Iyengar yoga
practice group was 0.074 which was insignificant. It may be
concluded from the results of the study that Bihar School of yoga
practice group and BKS Iyengar yoga practice group has
significantly decrease the diastolic blood pressure when compared
with the control group.
The mean values on diastolic blood pressure of Bihar School
of yoga practice group, BKS Iyengar yoga practice and control
groups were graphically represented in figure - IV.

114
75.5
76
76.5
77
77.5
78
78.5
79
79.5D
iasto
lic B
loo
d P
ressu
re
1 2 3
Exp. Group - I Exp. Group - II Control Group
Pre-test Means Post-test Means Adj. Post-test Means
Figure – IV : Bar Diagram Showing the Mean Values of Bihar School of
Yoga Practice Group (Exp. Group – I) BKS Iyengar Yoga
Practice Group (Exp. Group – II) and Control Group on
Diastolic Blood Pressure
115
Resting Pulse Rate
The data collected prior to and after the experimental period
on resting pulse rate of Bihar School of yoga practice group, BKS
Iyengar yoga practice group and control group were analysed and
presented in Table – XI.
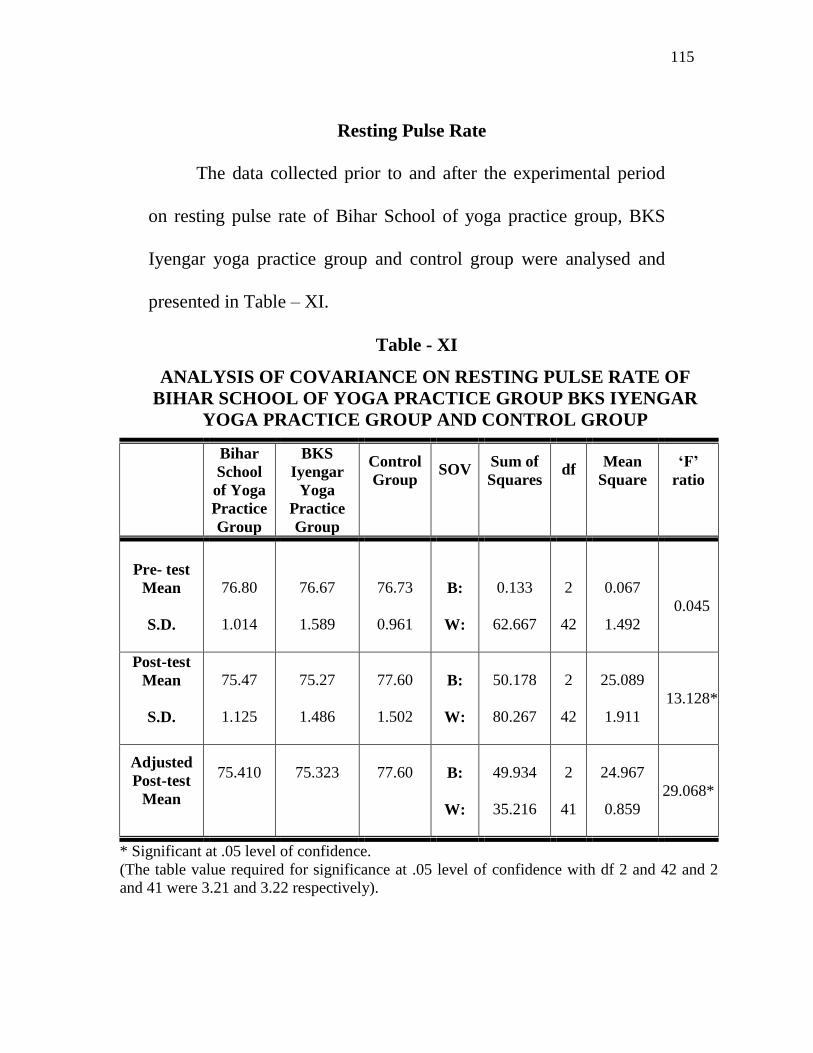
Table - XI
ANALYSIS OF COVARIANCE ON RESTING PULSE RATE OF
BIHAR SCHOOL OF YOGA PRACTICE GROUP BKS IYENGAR
YOGA PRACTICE GROUP AND CONTROL GROUP
Bihar
School
of Yoga
Practice
Group
BKS
Iyengar
Yoga
Practice
Group
Control
Group SOV
Sum of
Squares df
Mean
Square
‘F’
ratio
Pre- test
Mean
S.D.
76.80
1.014
76.67
1.589
76.73
0.961
B:
W:
0.133
62.667
2
42
0.067
1.492
0.045
Post-test
Mean
S.D.
75.47
1.125
75.27
1.486
77.60
1.502
B:
W:
50.178
80.267
2
42
25.089
1.911
13.128*
Adjusted
Post-test
Mean
75.410
75.323
77.60
B:
W:
49.934
35.216
2
41
24.967
0.859
29.068*
* Significant at .05 level of confidence.
(The table value required for significance at .05 level of confidence with df 2 and 42 and 2
and 41 were 3.21 and 3.22 respectively).

116
Table – XI shows that the pre-test means on resting pulse rate
of Bihar School of yoga practice group, BKS Iyengar yoga practice
and control groups were 76.80 1.014, 76.67 1.589 and 76.73
0.961 respectively. The obtained ‘F’ ratio value of 0.045 for pre-test
score of Bihar School of yoga practice group, BKS Iyengar yoga
practice and control groups on resting pulse rate was lesser than the
required table value of 3.21 for significance with df 2 and 42 at .05
level of confidence.
The post-test mean values of resting pulse rate for Bihar
School of yoga practice group, BKS Iyengar yoga practice and
control groups were 75.47 1.125, 75.27 1.486 and 77.60 1.502
respectively. The obtained ‘F’ ratio value of 13.128 for post-test
scores of Bihar School of yoga practice group, BKS Iyengar yoga
practice and control groups was greater than the required table value
of 3.21 for significance with df 2 and 42 at .05 level of confidence.
The adjusted post-test mean values of Bihar School of yoga
practice group, BKS Iyengar yoga practice and control groups were
75.410, 75.323 and 77.60 respectively. The obtained ‘F’ ratio value
of 29.068 for adjusted post-test scores of Bihar School of yoga

117
practice group, BKS Iyengar yoga practice and control groups was
higher than the required table value of 3.22 for significance with df 2
and 41 at .05 level of confidence.
The above statistical analysis indicates that there was a
significant decrease in resting pulse rate after the training periods.
Further to determine which of the paired means has a significant
decrease, the Scheffé S test was applied. The result of the follow-up
test is presented in Table - XII.
Table - XII
SCHEFFĔ S TEST FOR THE DIFFERENCE BETWEEN THE
ADJUSTED POST-TEST MEAN OF RESTING PULSE RATE
Adjusted Post-test Mean
Bihar School of
Yoga Practice
Group
BKS Iyengar
Yoga Practice
Group
Control group Mean
Difference
Confidence
interval at
.05 level
75.410 77.60 2.19* 0.8588333
75.410 75.323 0.087
0.8588333
75.323 77.60 2.277* 0.8588333
*Significant at .05 level of Confidence
Table - XII shows that the adjusted post-test mean difference
in resting pulse rate between Bihar School of yoga practice group
and control group and BKS Iyengar yoga practice group and control

118
group were 2.19 and 2.277, which were significant at .05 level of
confidence. But, the adjusted post-test mean difference between
Bihar School of yoga practice group and BKS Iyengar yoga practice
group was 0.087 which was insignificant. It may be concluded from
the results of the study that Bihar School of yoga practice group and
BKS Iyengar yoga practice group has significantly decrease the
resting pulse rate when compared with the control group.
The mean values on resting pulse rate of Bihar School of yoga
practice group, BKS Iyengar yoga practice and control groups were
graphically represented in figure - V.

119
74
74.5
75
75.5
76
76.5
77
77.5
78R
estin
g P
uls
e R
ate
1 2 3
Exp. Group - I Exp. Group - II Control Group
Pre-test Means Post-test Means Adj. Post-test Means
Figure – V : Bar Diagram Showing the Mean Values of Bihar School of
Yoga Practice Group (Exp. Group – I) BKS Iyengar Yoga
Practice Group (Exp. Group – II) and Control Group on
Resting Pulse Rate

120
Breath Holding Time
The data collected prior to and after the experimental period of
breath holding time on Bihar School of yoga practice group, BKS
Iyengar yoga practice group and control group were analysed and
presented in Table – XIII.
Table - XIII
ANALYSIS OF COVARIANCE ON BREATH HOLDING TIME OF
BIHAR SCHOOL OF YOGA PRACTICE GROUP BKS IYENGAR
YOGA PRACTICE GROUP AND CONTROL GROUP
Bihar
School
of Yoga
Practice
Group
BKS
Iyengar
Yoga
Practice
Group
Control
Group SOV
Sum of
Squares df
Mean
Square
‘F’
ratio
Pre- test
Mean
S.D.
30.40
2.53
30.60
1.298
30.00
2.420
B:
W:
2.80
195.20
2
42
1.40
4.648
0.301
Post-test
Mean
S.D.
32.33
2.554
32.20
1.373
30.07
2.890
B:
W:
48.533
234.667
2
42
24.267
5.587
4.343*
Adjusted
Post-test
Mean
32.265
31.927
30.409
B:
W:
29.008
29.339
2
41
14.504
0.716
20.269*
* Significant at .05 level of confidence.
(The table value required for significance at .05 level of confidence with df 2 and 42 and 2
and 41 were 3.21 and 3.22 respectively).

121
Table – XIII shows that the pre-test means on breath holding
time of Bihar School of yoga practice group, BKS Iyengar yoga
practice and control groups were 30.40 2.53, 30.60 1.298 and
30.00 2.420 respectively. The obtained ‘F’ ratio value of 0.301 for
pre-test score of Bihar School of yoga practice group, BKS Iyengar
yoga practice and control groups on breath holding time was lesser
than the required table value of 3.21 for significance with df 2 and 42
at .05 level of confidence.
The post-test mean values of breath holding time for Bihar
School of yoga practice group, BKS Iyengar yoga practice and
control groups were 32.33 2.554, 32.20 1.373 and 30.07 2.890
respectively. The obtained ‘F’ ratio value of 4.343 for post-test
scores of Bihar School of yoga practice group, BKS Iyengar yoga
practice and control groups was greater than the required table value
of 3.21 for significance with df 2 and 42 at .05 level of confidence.
The adjusted post-test mean values of Bihar School of yoga
practice group, BKS Iyengar yoga practice and control groups were
32.265, 31.927 and 30.409 respectively. The obtained ‘F’ ratio value
of 20.269 for adjusted post-test scores of Bihar School of yoga
122
practice group, BKS Iyengar yoga practice and control groups was
higher than the required table value of 3.22 for significance with df 2
and 41 at .05 level of confidence.
The above statistical analysis indicates that there was a
significant increase in breath holding time after the training periods.
Further to determine which of the paired means has a significant
increase, the Scheffé S test was applied. The result of the follow-up
test is presented in Table - XIV.
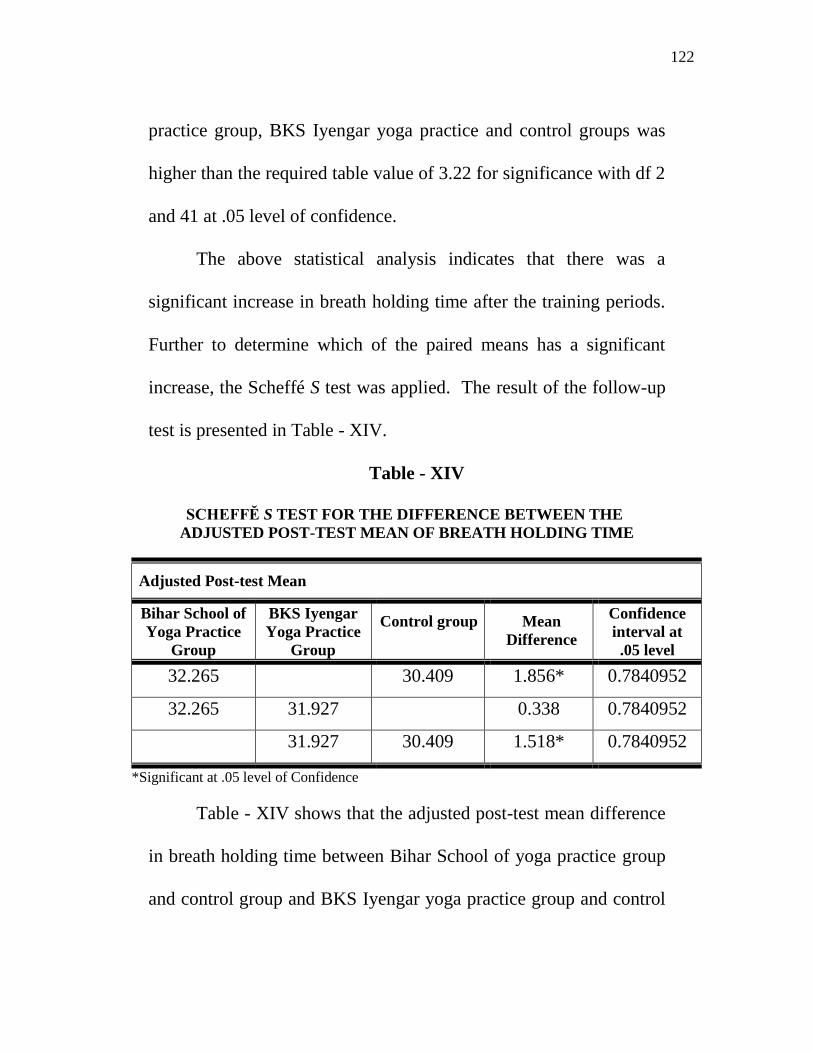
Table - XIV
SCHEFFĔ S TEST FOR THE DIFFERENCE BETWEEN THE
ADJUSTED POST-TEST MEAN OF BREATH HOLDING TIME
Adjusted Post-test Mean
Bihar School of
Yoga Practice
Group
BKS Iyengar
Yoga Practice
Group
Control group Mean
Difference
Confidence
interval at
.05 level
32.265 30.409 1.856* 0.7840952
32.265 31.927 0.338
0.7840952
31.927 30.409 1.518* 0.7840952
*Significant at .05 level of Confidence
Table - XIV shows that the adjusted post-test mean difference
in breath holding time between Bihar School of yoga practice group
and control group and BKS Iyengar yoga practice group and control

123
group were 1.856 and 1.518, which were significant at .05 level of
confidence. But, the adjusted post-test mean difference between
Bihar School of yoga practice group and BKS Iyengar yoga practice
group was 0.338 which was insignificant. It may be concluded from
the results of the study that Bihar School of yoga practice group and
BKS Iyengar yoga practice group has significantly increase the
breath holding time when compared with the control group.
The mean values on breath holding time of Bihar School of
yoga practice group, BKS Iyengar yoga practice and control groups
were graphically represented in figure - VI.

124
28.5
29
29.5
30
30.5
31
31.5
32
32.5B
rea
th H
old
ing
Tim
e
1 2 3
Exp. Group - I Exp. Group - II Control Group
Pre-test Means Post-test Means Adj. Post-test Means
Figure – VI : Bar Diagram Showing the Mean Values of Bihar School of
Yoga Practice Group (Exp. Group – I) BKS Iyengar Yoga
Practice Group (Exp. Group – II) and Control Group on
Breath Holding Time
125
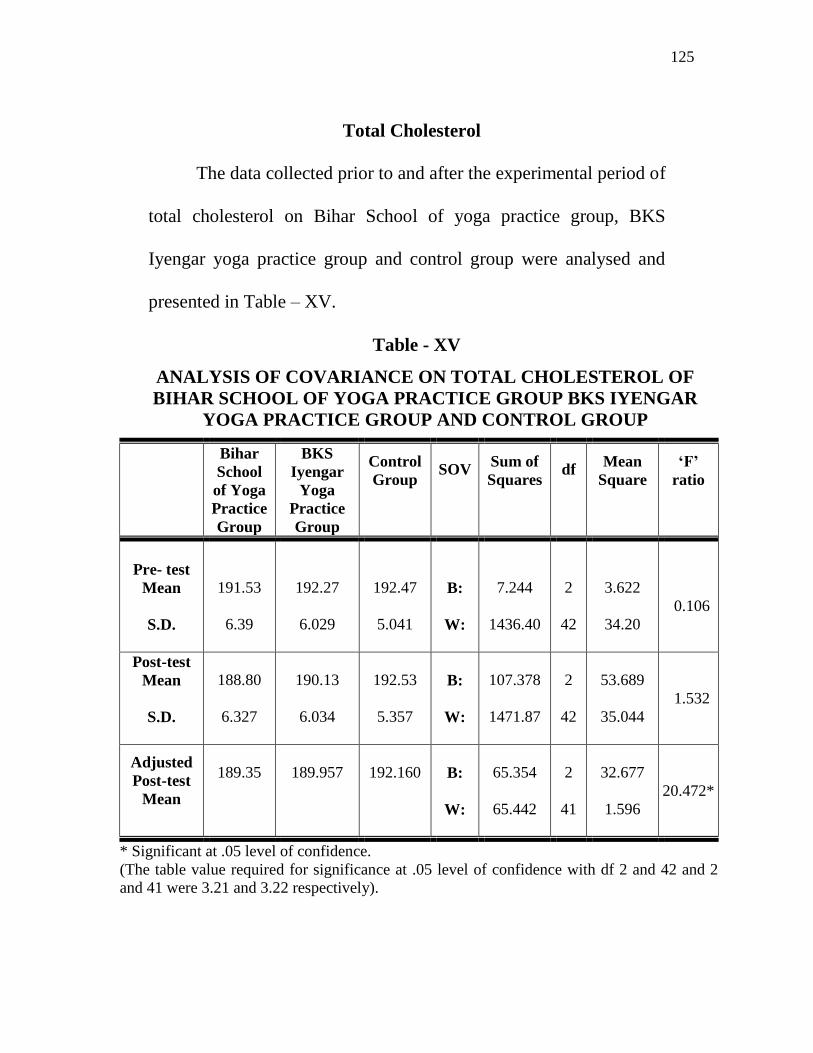
Total Cholesterol
The data collected prior to and after the experimental period of
total cholesterol on Bihar School of yoga practice group, BKS
Iyengar yoga practice group and control group were analysed and
presented in Table – XV.
Table - XV
ANALYSIS OF COVARIANCE ON TOTAL CHOLESTEROL OF
BIHAR SCHOOL OF YOGA PRACTICE GROUP BKS IYENGAR
YOGA PRACTICE GROUP AND CONTROL GROUP
Bihar
School
of Yoga
Practice
Group
BKS
Iyengar
Yoga
Practice
Group
Control
Group SOV
Sum of
Squares df
Mean
Square
‘F’
ratio
Pre- test
Mean
S.D.
191.53
6.39
192.27
6.029
192.47
5.041
B:
W:
7.244
1436.40
2
42
3.622
34.20
0.106
Post-test
Mean
S.D.
188.80
6.327
190.13
6.034
192.53
5.357
B:
W:
107.378
1471.87
2
42
53.689
35.044
1.532
Adjusted
Post-test
Mean
189.35
189.957
192.160
B:
W:
65.354
65.442
2
41
32.677
1.596
20.472*
* Significant at .05 level of confidence.
(The table value required for significance at .05 level of confidence with df 2 and 42 and 2
and 41 were 3.21 and 3.22 respectively).

126
Table – XV shows that the pre-test means on total cholesterol
of Bihar School of yoga practice group, BKS Iyengar yoga practice
and control groups were 191.53 6.39, 192.27 6.029 and 192.47
5.041 respectively. The obtained ‘F’ ratio value of 0.106 for pre-test
score of Bihar School of yoga practice group, BKS Iyengar yoga
practice and control groups on total cholesterol was lesser than the
required table value of 3.21 for significance with df 2 and 42 at .05
level of confidence.
The post-test mean values of total cholesterol for Bihar School
of yoga practice group, BKS Iyengar yoga practice and control
groups were 188.80 6.327, 190.13 6.034 and 192.53 5.357
respectively. The obtained ‘F’ ratio value of 1.532 for post-test
scores of Bihar School of yoga practice group, BKS Iyengar yoga
practice and control groups was lesser than the required table value
of 3.21 for significance with df 2 and 42 at .05 level of confidence.
The adjusted post-test mean values of Bihar School of yoga
practice group, BKS Iyengar yoga practice and control groups were
189.35, 189.957 and 192.160 respectively. The obtained ‘F’ ratio
value of 20.472 for adjusted post-test scores of Bihar School of yoga
127
practice group, BKS Iyengar yoga practice and control groups was
higher than the required table value of 3.22 for significance with df 2
and 41 at .05 level of confidence.
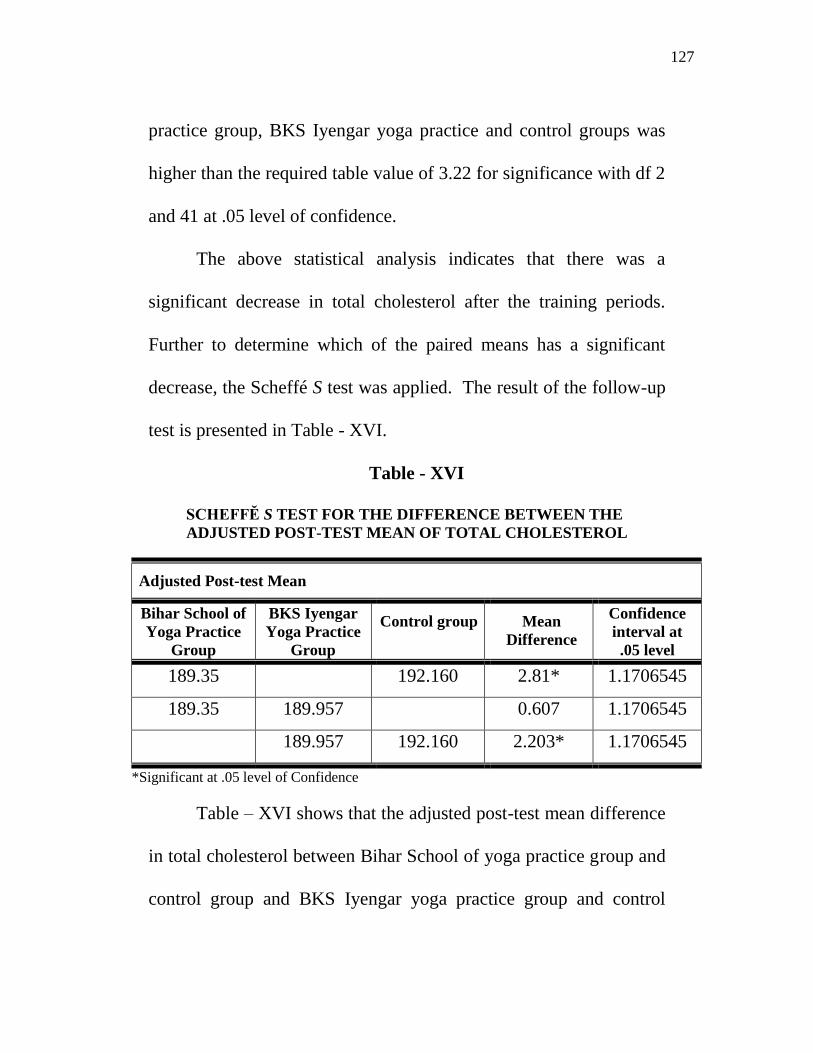
The above statistical analysis indicates that there was a
significant decrease in total cholesterol after the training periods.
Further to determine which of the paired means has a significant
decrease, the Scheffé S test was applied. The result of the follow-up
test is presented in Table - XVI.
Table - XVI
SCHEFFĔ S TEST FOR THE DIFFERENCE BETWEEN THE
ADJUSTED POST-TEST MEAN OF TOTAL CHOLESTEROL
Adjusted Post-test Mean
Bihar School of
Yoga Practice
Group
BKS Iyengar
Yoga Practice
Group
Control group Mean
Difference
Confidence
interval at
.05 level
189.35 192.160 2.81* 1.1706545
189.35 189.957 0.607
1.1706545
189.957 192.160 2.203* 1.1706545
*Significant at .05 level of Confidence
Table – XVI shows that the adjusted post-test mean difference
in total cholesterol between Bihar School of yoga practice group and
control group and BKS Iyengar yoga practice group and control
128
group were 2.81 and 2.203, which were significant at .05 level of
confidence. But, the adjusted post-test mean difference between
Bihar School of yoga practice group and BKS Iyengar yoga practice
group was 0.607 which was insignificant. It may be concluded from
the results of the study that Bihar School of yoga practice group and
BKS Iyengar yoga practice group has significantly decrease the total
cholesterol when compared with the control group.
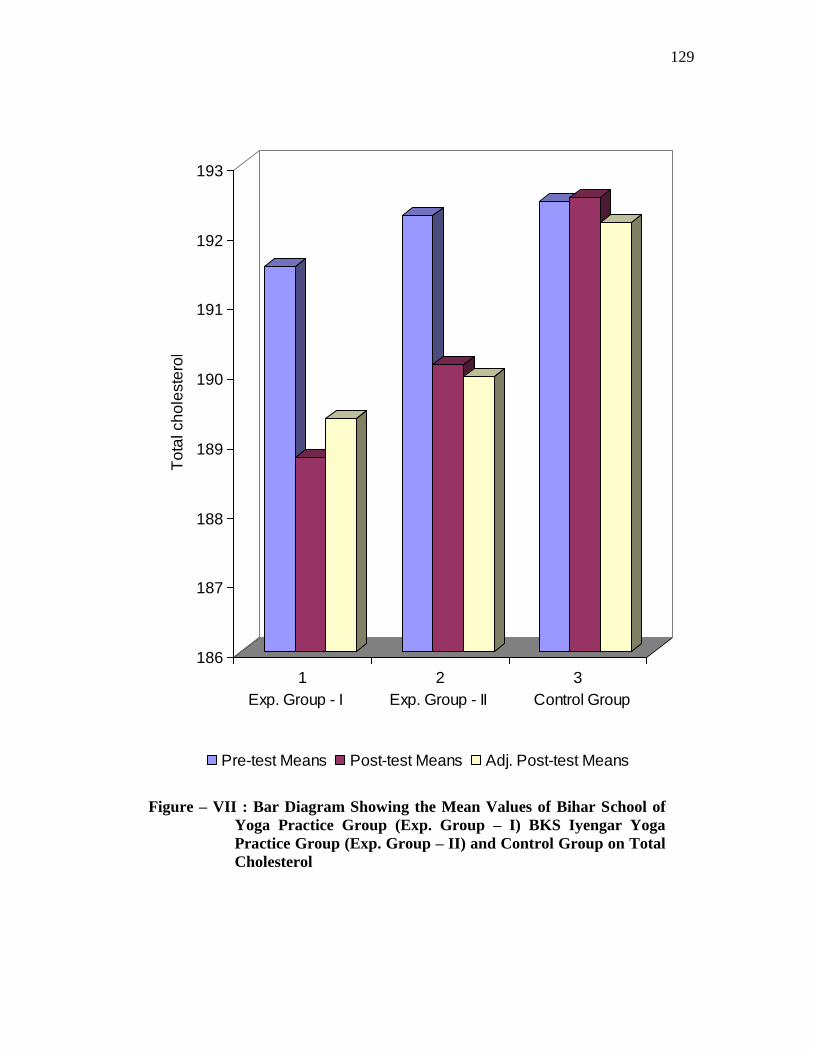
The mean values on total cholesterol of Bihar School of yoga
practice group, BKS Iyengar yoga practice and control groups were
graphically represented in figure - VII.
129
186
187
188
189
190
191
192
193T
ota
l ch
ole
ste
rol
1 2 3
Exp. Group - I Exp. Group - II Control Group
Pre-test Means Post-test Means Adj. Post-test Means
Figure – VII : Bar Diagram Showing the Mean Values of Bihar School of
Yoga Practice Group (Exp. Group – I) BKS Iyengar Yoga
Practice Group (Exp. Group – II) and Control Group on Total
Cholesterol

130
Triglycerides
The data collected prior to and after the experimental period of
triglycerides on Bihar School of yoga practice group, BKS Iyengar
yoga practice group and control group were analysed and presented
in Table – XVII.
Table - XVII
ANALYSIS OF COVARIANCE ON TRIGLYCERIDES OF
BIHAR SCHOOL OF YOGA PRACTICE GROUP BKS IYENGAR
YOGA PRACTICE GROUP AND CONTROL GROUP
Bihar
School
of Yoga
Practice
Group
BKS
Iyengar
Yoga
Practice
Group
Control
Group SOV
Sum of
Squares df
Mean
Square
‘F’
ratio
Pre- test
Mean
S.D.
133.13
4.838
133.73
3.654
131.80
4.443
B:
W:
29.378
791.067
2
42
14.689
18.835
0.780
Post-test
Mean
S.D.
131.13
4.941
131.67
3.83
132.67
4.562
B:
W:
18.178
838.40
2
42
9.089
19.923
0.455
Adjusted
Post-test
Mean
130.888
130.820
133.759
B:
W:
81.635
42.660
2
41
40.818
1.040
39.23*
* Significant at .05 level of confidence.
(The table value required for significance at .05 level of confidence with df 2 and 42 and 2
and 41 were 3.21 and 3.22 respectively).
131
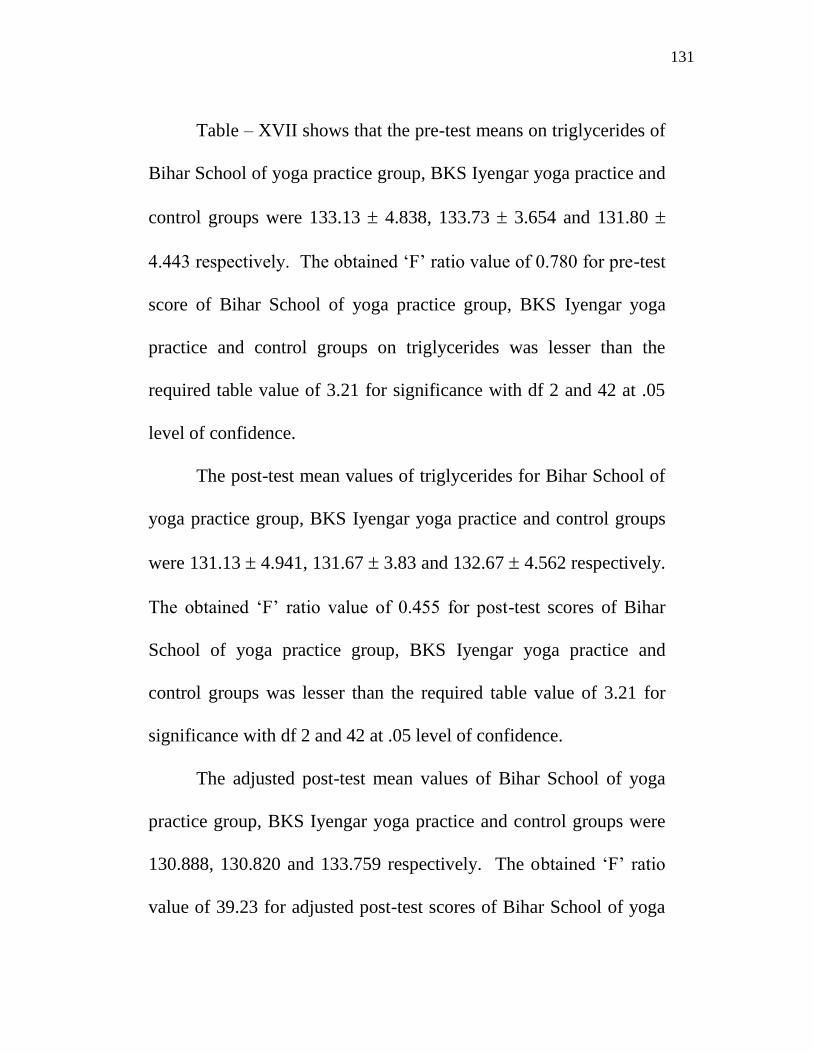
Table – XVII shows that the pre-test means on triglycerides of
Bihar School of yoga practice group, BKS Iyengar yoga practice and
control groups were 133.13 4.838, 133.73 3.654 and 131.80
4.443 respectively. The obtained ‘F’ ratio value of 0.780 for pre-test
score of Bihar School of yoga practice group, BKS Iyengar yoga
practice and control groups on triglycerides was lesser than the
required table value of 3.21 for significance with df 2 and 42 at .05
level of confidence.
The post-test mean values of triglycerides for Bihar School of
yoga practice group, BKS Iyengar yoga practice and control groups
were 131.13 4.941, 131.67 3.83 and 132.67 4.562 respectively.
The obtained ‘F’ ratio value of 0.455 for post-test scores of Bihar
School of yoga practice group, BKS Iyengar yoga practice and
control groups was lesser than the required table value of 3.21 for
significance with df 2 and 42 at .05 level of confidence.
The adjusted post-test mean values of Bihar School of yoga
practice group, BKS Iyengar yoga practice and control groups were
130.888, 130.820 and 133.759 respectively. The obtained ‘F’ ratio
value of 39.23 for adjusted post-test scores of Bihar School of yoga

132
practice group, BKS Iyengar yoga practice and control groups was
higher than the required table value of 3.22 for significance with df 2
and 41 at .05 level of confidence.
The above statistical analysis indicates that there was a
significant decrease in triglycerides after the training periods.
Further to determine which of the paired means has a significant
decrease, the Scheffé S test was applied. The result of the follow-up
test is presented in Table - XVIII.
Table - XVIII
SCHEFFĔ S TEST FOR THE DIFFERENCE BETWEEN THE
ADJUSTED POST-TEST MEAN OF TRIGLYCERIDES
Adjusted Post-test Mean
Bihar School of
Yoga Practice
Group
BKS Iyengar
Yoga Practice
Group
Control group Mean
Difference
Confidence
interval at
.05 level
130.888 133.759 2.871* 1.1706545
130.888 130.820 0.068
1.1706545
130.820 133.759 2.939* 1.1706545
*Significant at .05 level of Confidence
Table – XVIII shows that the adjusted post-test mean
difference in triglycerides between Bihar School of yoga practice
group and control group and BKS Iyengar yoga practice group and
133
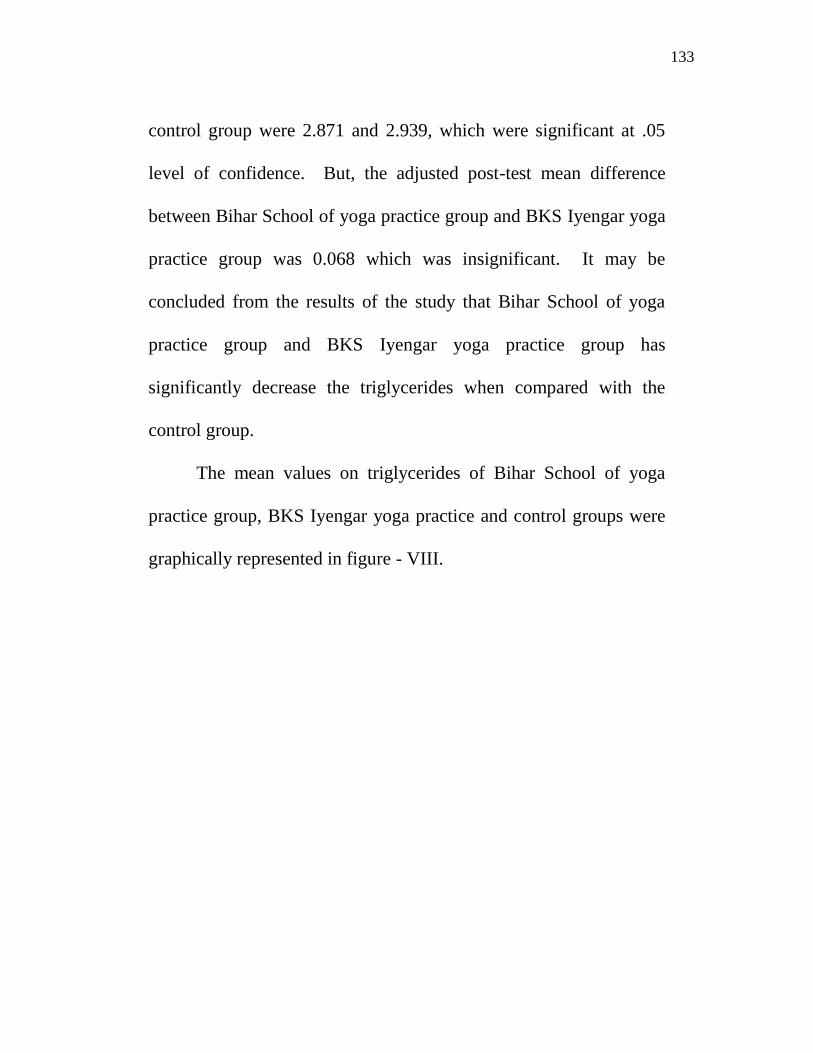
control group were 2.871 and 2.939, which were significant at .05
level of confidence. But, the adjusted post-test mean difference
between Bihar School of yoga practice group and BKS Iyengar yoga
practice group was 0.068 which was insignificant. It may be
concluded from the results of the study that Bihar School of yoga
practice group and BKS Iyengar yoga practice group has
significantly decrease the triglycerides when compared with the
control group.
The mean values on triglycerides of Bihar School of yoga
practice group, BKS Iyengar yoga practice and control groups were
graphically represented in figure - VIII.

134
129
129.5
130
130.5
131
131.5
132
132.5
133
133.5
134T
rig
lyce
rid
es
1 2 3
Exp. Group - I Exp. Group - II Control Group
Pre-test Means Post-test Means Adj. Post-test Means
Figure – VIII : Bar Diagram Showing the Mean Values of Bihar School of
Yoga Practice Group (Exp. Group – I) BKS Iyengar Yoga
Practice Group (Exp. Group – II) and Control Group on
Triglycerides

135
High Density Lipoprotein
The data collected prior to and after the experimental period of
high density lipoprotein on Bihar School of yoga practice group,
BKS Iyengar yoga practice group and control group were analysed
and presented in Table – XIX.
Table - XIX
ANALYSIS OF COVARIANCE ON HIGH DENSITY LIPOPROTEIN OF
BIHAR SCHOOL OF YOGA PRACTICE GROUP BKS IYENGAR
YOGA PRACTICE GROUP AND CONTROL GROUP
Bihar
School
of Yoga
Practice
Group
BKS
Iyengar
Yoga
Practice
Group
Control
Group SOV
Sum of
Squares df
Mean
Square
‘F’
ratio
Pre- test
Mean
S.D.
45.07
2.463
44.53
3.021
44.87
2.949
B:
W:
2.178
334.40
2
42
1.089
7.962
0.137
Post-test
Mean
S.D.
47.60
2.772
46.80
3.189
44.00
2.803
B:
W:
107.20
360.00
2
42
53.60
8.571
6.253*
Adjusted
Post-test
Mean
47.357
47.088
43.956
B:
W:
107.232
28.394
2
41
53.616
0.693
77.419*
* Significant at .05 level of confidence.
(The table value required for significance at .05 level of confidence with df 2 and 42 and 2
and 41 were 3.21 and 3.22 respectively).
136
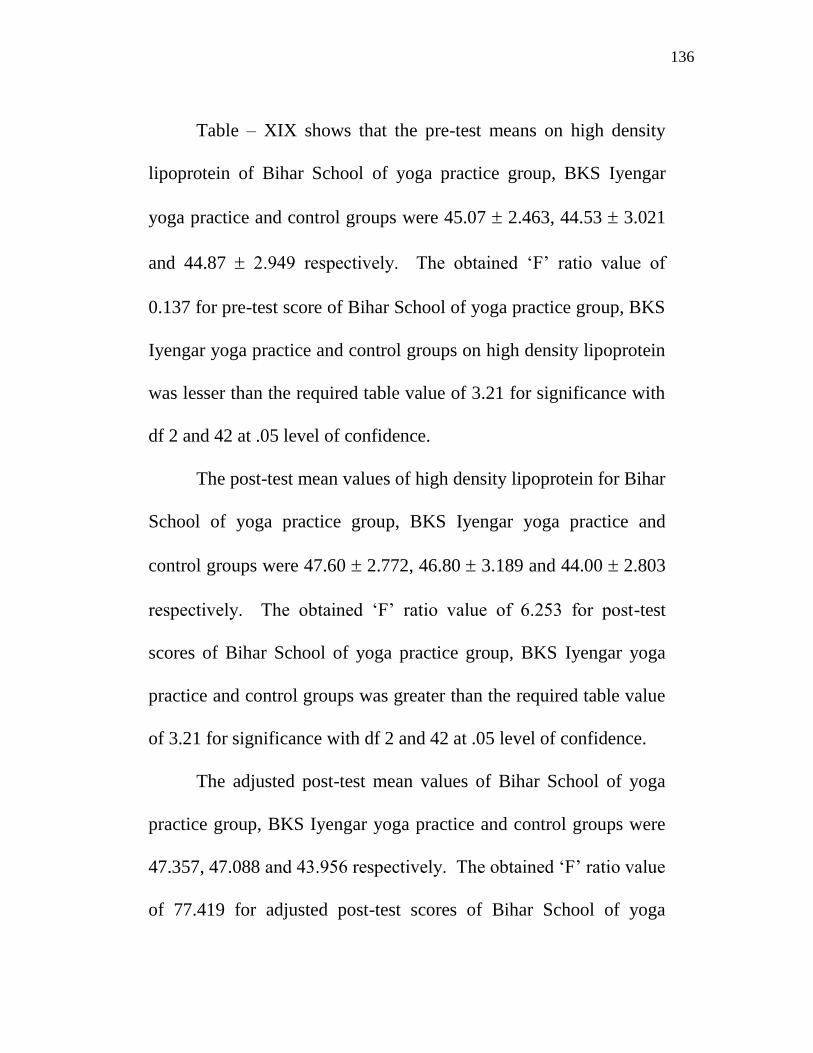
Table – XIX shows that the pre-test means on high density
lipoprotein of Bihar School of yoga practice group, BKS Iyengar
yoga practice and control groups were 45.07 2.463, 44.53 3.021
and 44.87 2.949 respectively. The obtained ‘F’ ratio value of
0.137 for pre-test score of Bihar School of yoga practice group, BKS
Iyengar yoga practice and control groups on high density lipoprotein
was lesser than the required table value of 3.21 for significance with
df 2 and 42 at .05 level of confidence.
The post-test mean values of high density lipoprotein for Bihar
School of yoga practice group, BKS Iyengar yoga practice and
control groups were 47.60 2.772, 46.80 3.189 and 44.00 2.803
respectively. The obtained ‘F’ ratio value of 6.253 for post-test
scores of Bihar School of yoga practice group, BKS Iyengar yoga
practice and control groups was greater than the required table value
of 3.21 for significance with df 2 and 42 at .05 level of confidence.
The adjusted post-test mean values of Bihar School of yoga
practice group, BKS Iyengar yoga practice and control groups were
47.357, 47.088 and 43.956 respectively. The obtained ‘F’ ratio value
of 77.419 for adjusted post-test scores of Bihar School of yoga

137
practice group, BKS Iyengar yoga practice and control groups was
higher than the required table value of 3.22 for significance with df 2
and 41 at .05 level of confidence.
The above statistical analysis indicates that there was a
significant increase in high density lipoprotein after the training
periods. Further to determine which of the paired means has a
significant increase, the Scheffé S test was applied. The result of the
follow-up test is presented in Table - XX.
Table - XX
SCHEFFĔ S TEST FOR THE DIFFERENCE BETWEEN THE
ADJUSTED POST-TEST MEAN OF HIGH DENSITY LIPOPROTEIN
Adjusted Post-test Mean
Bihar School of
Yoga Practice
Group
BKS Iyengar
Yoga Practice
Group
Control group Mean
Difference
Confidence
interval at
.05 level
47.357 43.956 3.401* 0.7713987
47.357 47.088 0.269
0.7713987
47.088 43.956 3.132* 0.7713987
*Significant at .05 level of Confidence
Table – XX shows that the adjusted post-test mean difference
in high density lipoprotein between Bihar School of yoga practice
group and control group and BKS Iyengar yoga practice group and
138
control group were 3.401 and 3.132, which were significant at .05
level of confidence. But, the adjusted post-test mean difference
between Bihar School of yoga practice group and BKS Iyengar yoga
practice group was 0.269 which was insignificant. It may be
concluded from the results of the study that Bihar School of yoga
practice group and BKS Iyengar yoga practice group has
significantly increase the high density lipoprotein when compared
with the control group.
The mean values on high density lipoprotein of Bihar School
of yoga practice group, BKS Iyengar yoga practice and control
groups were graphically represented in figure - IX.

139
42
43
44
45
46
47
48H
igh
De
nsity L
ipo
pro
tein
s
1 2 3
Exp. Group - I Exp. Group - II Control Group
Pre-test Means Post-test Means Adj. Post-test Means
Figure –IX : Bar Diagram Showing the Mean Values of Bihar School of
Yoga Practice Group (Exp. Group – I) BKS Iyengar Yoga
Practice Group (Exp. Group – II) and Control Group on High
Density Lipoprotein

140
Fasting Blood Glucose
The data collected prior to and after the experimental period of
fasting blood glucose on Bihar School of yoga practice group, BKS
Iyengar yoga practice group and control group were analysed and
presented in Table – XXI.
Table - XXI
ANALYSIS OF COVARIANCE ON FASTING BLOOD GLUCOSE OF
BIHAR SCHOOL OF YOGA PRACTICE GROUP BKS IYENGAR
YOGA PRACTICE GROUP AND CONTROL GROUP
Bihar
School
of Yoga
Practice
Group
BKS
Iyengar
Yoga
Practice
Group
Control
Group SOV
Sum of
Squares df
Mean
Square
‘F’
ratio
Pre- test
Mean
S.D.
103.47
3.226
101.60
3.795
102.13
3.226
B:
W:
27.733
493.067
2
42
13.867
11.740
1.181
Post-test
Mean
S.D.
102.33
4.254
100.13
3.583
103.80
3.668
B:
W:
102.178
621.467
2
42
51.089
14.797
3.453*
Adjusted
Post-test
Mean
101.276
100.927
104.064
B:
W:
88.631
136.764
2
41
44.315
3.336
13.285*
* Significant at .05 level of confidence.
(The table value required for significance at .05 level of confidence with df 2 and 42 and 2
and 41 were 3.21 and 3.22 respectively).

141
Table – XXI shows that the pre-test means on fasting blood
glucose of Bihar School of yoga practice group, BKS Iyengar yoga
practice and control groups were 103.47 3.226, 101.60 3.795 and
102.13 3.226 respectively. The obtained ‘F’ ratio value of 1.181
for pre-test score of Bihar School of yoga practice group, BKS
Iyengar yoga practice and control groups on fasting blood glucose
was lesser than the required table value of 3.21 for significance with
df 2 and 42 at .05 level of confidence.
The post-test mean values of fasting blood glucose for Bihar
School of yoga practice group, BKS Iyengar yoga practice and
control groups were 102.33 4.254, 100.13 3.583 and 103.80
3.668 respectively. The obtained ‘F’ ratio value of 3.453 for post-
test scores of Bihar School of yoga practice group, BKS Iyengar
yoga practice and control groups was greater than the required table
value of 3.21 for significance with df 2 and 42 at .05 level of
confidence.
The adjusted post-test mean values of Bihar School of yoga
practice group, BKS Iyengar yoga practice and control groups were
101.276, 100.927 and 104.064 respectively. The obtained ‘F’ ratio
142
value of 13.285 for adjusted post-test scores of Bihar School of yoga
practice group, BKS Iyengar yoga practice and control groups was
higher than the required table value of 3.22 for significance with df 2
and 41 at .05 level of confidence.
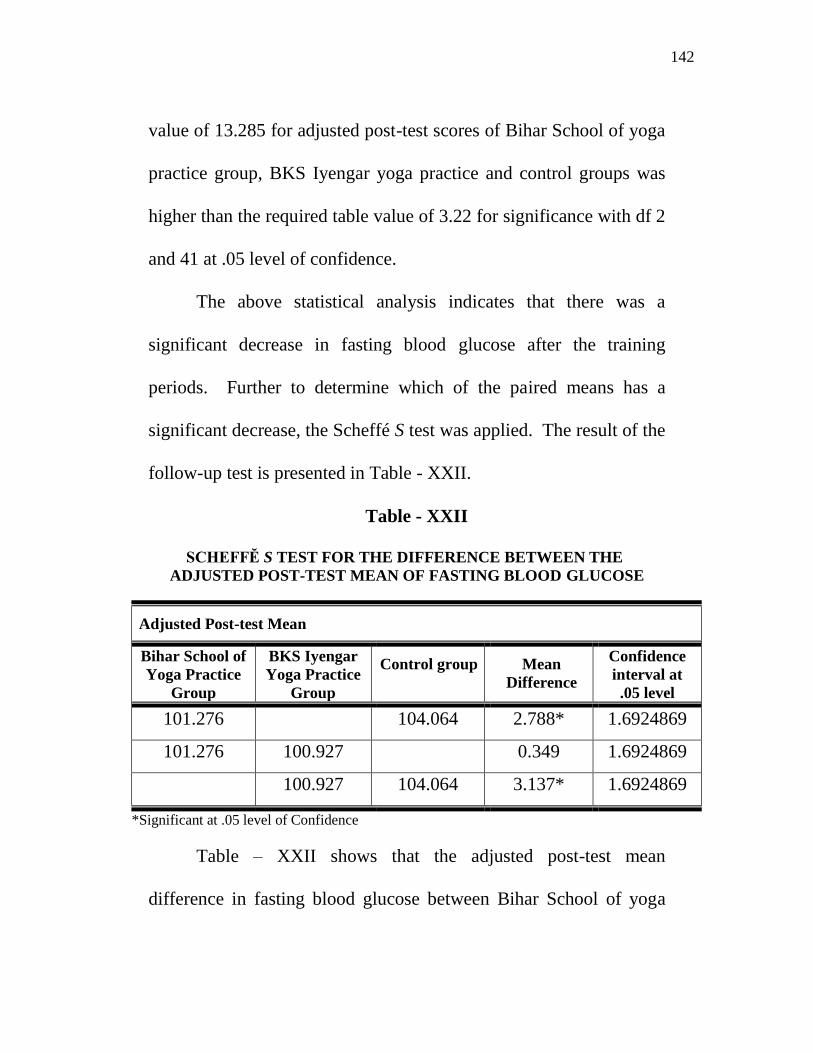
The above statistical analysis indicates that there was a
significant decrease in fasting blood glucose after the training
periods. Further to determine which of the paired means has a
significant decrease, the Scheffé S test was applied. The result of the
follow-up test is presented in Table - XXII.
Table - XXII
SCHEFFĔ S TEST FOR THE DIFFERENCE BETWEEN THE
ADJUSTED POST-TEST MEAN OF FASTING BLOOD GLUCOSE
Adjusted Post-test Mean
Bihar School of
Yoga Practice
Group
BKS Iyengar
Yoga Practice
Group
Control group Mean
Difference
Confidence
interval at
.05 level
101.276 104.064 2.788* 1.6924869
101.276 100.927 0.349
1.6924869
100.927 104.064 3.137* 1.6924869
*Significant at .05 level of Confidence
Table – XXII shows that the adjusted post-test mean
difference in fasting blood glucose between Bihar School of yoga

143
practice group and control group and BKS Iyengar yoga practice
group and control group were 2.788 and 3.137, which were
significant at .05 level of confidence. But, the adjusted post-test
mean difference between Bihar School of yoga practice group and
BKS Iyengar yoga practice group was 0.349 which was insignificant.
It may be concluded from the results of the study that Bihar School
of yoga practice group and BKS Iyengar yoga practice group has
significantly decrease the fasting blood glucose when compared with
the control group.
The mean values on fasting blood glucose of Bihar School of
yoga practice group, BKS Iyengar yoga practice and control groups
were graphically represented in figure - X.

144
98
99
100
101
102
103
104
105G
luco
se
1 2 3
Exp. Group - I Exp. Group - II Control Group
Pre-test Means Post-test Means Adj. Post-test Means
Figure – X : Bar Diagram Showing the Mean Values of Bihar School of
Yoga Practice Group (Exp. Group – I) BKS Iyengar Yoga
Practice Group (Exp. Group – II) and Control Group on
fasting blood Glucose

145
DISCUSSION ON HYPOTHESES
1. In first hypotheses it was stated that there would be
significant positive changes in percentage of body fat, body mass
index (BMI), blood pressure (both systolic and diastolic), resting
pulse rate, breath holding time, total cholesterol, triglycerides, high
density lipoprotein and fasting blood glucose for both the training
groups such as, Swami Styananda Saraswati (Bihar School) yoga
practice group and B.K.S. Iyengar yoga practice group as compared
to control group. The result of the study shows that there was a
significant positive change for both the yoga practice groups, such
as, Swami Styananda Saraswati (Bihar School) yoga practice group
and B.K.S. Iyengar yoga practice group, after their respective
training programmes. So, the researcher’s first hypothesis was
accepted.
2. In second, it was hypothesized that there would be a
significant difference in percentage of body fat, body mass index
(BMI), blood pressure (both systolic and diastolic), resting pulse
rate, breath holding time, total cholesterol, triglycerides, high density
lipoprotein and fasting blood glucose between Swami Styananda
146
Saraswati (Bihar School) yoga practice group and B.K.S. Iyengar
yoga practice group. The result of the study shows that there was no
significant difference found between the training groups such as,
Swami Styananda Saraswati (Bihar School) yoga practice group and
B.K.S. Iyengar yoga practice group, on selected criterion variables.
So, the researcher’s second hypothesis was rejected.
DISCUSSION ON FINDINGS
From the result of the study the following findings were
drawn:
The results of the study revealed that there was a significant
decrease in percentage of body fat after the Swami Styananda
Saraswati (Bihar School) yoga practice and B.K.S. Iyengar yoga
practice. The findings of Kesavachandran, Bihari and Mathur
(2009) shows that the physical activity has reduced the percentage of
body fat and Ajay, Rakesh and Ranjan (2010) found that there was
a significant reduction in body fat % after the yogic practices.
It was found from the result of the study that there was a
significant reduction in body mass index (BMI) after the two
different packages of yoga practices. Kesavachandran, Bihari and
147
Mathur (2009) and Pal et al, (2011) found that there was a
significant reduction in body mass index (BMI) after the yogic
practice period.
The result of the study shows that there was a significant
reduction in systolic and diastolic blood pressure after the respective
yogic practice periods, such as, Swami Styananda Saraswati (Bihar
School) yoga practice and B.K.S. Iyengar yoga practice. Pal et al,
(2011), Tundwala et al, (2012) and Satyanarayana et al, (2013)
found that there was a significant reduction in systolic and diastolic
blood pressure after the yogic practice.
The findings of the study show that there was a significant
reduction in resting pulse rate. Pal et al, (2011) and Satyanarayana
et al, (2013) found that there was a significant reduction in heart rate
after the yogic practice. Bharshankar et al (2003) and Rajender
Singh and Rohtash Kumar (2013) found that there was a significant
reduction in resting pulse rate after the yogic practice.
The result of the study revealed that there was a significant
increase in breath holding time after the two different yoga practices,
such as, Swami Styananda Saraswati (Bihar School) yoga practice

148
and B.K.S. Iyengar yoga practice. Rajender Singh and Rohtash
Kumar (2013) and Vyas and Dikshit (2002) found that there was a
significant improvement in breath holding time after the yoga
practice period.
The result of the study shows that there was a significant
reduction in total cholesterol, triglycerides and fasting blood glucose
and a significant increase in high density lipoprotein after the Swami
Styananda Saraswati (Bihar School) yoga practice and B.K.S.
Iyengar yoga practice. Pal et al, (2011), Tundwala (2012) and
Telles (2010) found that there was a significant decrease in total
cholesterol and triglycerides and a significant improvement in high
density lipoprotein. Dhananjai (2011) found that yoga practice
decreased significantly fasting blood glucose.
The overall results revealed that there was a significant
positive changes in percentage of body fat, body mass index (BMI),
blood pressure (both systolic and diastolic), resting pulse rate, breath
holding time, total cholesterol, triglycerides, high density lipoprotein
and fasting blood glucose. This is due to the practice of different
methods of yoga for six days per week for twelve weeks.


![DATA ANALYSIS, RESULTS AND DISCUSSIONshodhganga.inflibnet.ac.in/bitstream/10603/62097/11/11...[82] CHAPTER – IV DATA ANALYSIS, RESULTS AND DISCUSSION In this chapter obtained results](https://static.documents.pub/doc/80x56/5ec86e40997044603330e83f/data-analysis-results-and-82-chapter-a-iv-data-analysis-results-and-discussion.jpg)
