

1
1
Characteristics of participantsto ‘Start to Run’ programme
Comparison betweenmaintenance and drop out groups
Marc CLOES & Benoit PETRE
Department of Sport Sciences
University of Liege
Belgium
ICSEMIS 2012
Sport… Inspiring a Learning Legacy
Glasgow – July 19-24, 2012
IntroductionPhysical activity in Europe� % of active people (5×30 minutes of moderate PA or 3×20 minutes of vigorous PA)
0
5
10
15
20
25
30
35
40
45
50
Sweden
Fran
ce
Belgium
Spain Ita
ly
Austri
a
United
King
dom
Irelan
d
EU-15
Finla
nd
Portu
gal
Denm
ark
Luxe
mbour
g
Greec
e
German
y
Nethe
rland
s
Meu
sel (2008)
2
3
IntroductionActions against sedentariness
�In 92’, the European Council proposed a PE-Sport charter emphasizing the key position of PA in the society
�The 96’s Report of the Surgeon General (US): First strong emphasis about the need of a fight against low level of PA
�Since that time, WHO underlines many times the priority to provide to PA promotion all over the world
4
IntroductionAdoption of an active lifestyle
�At the centre of a complex context justifying a multisectorial approach
�Ecological model� Booth et al. (2000)
� Sallis et al. (2006)
� Edwards & Tsouros (2006)
3
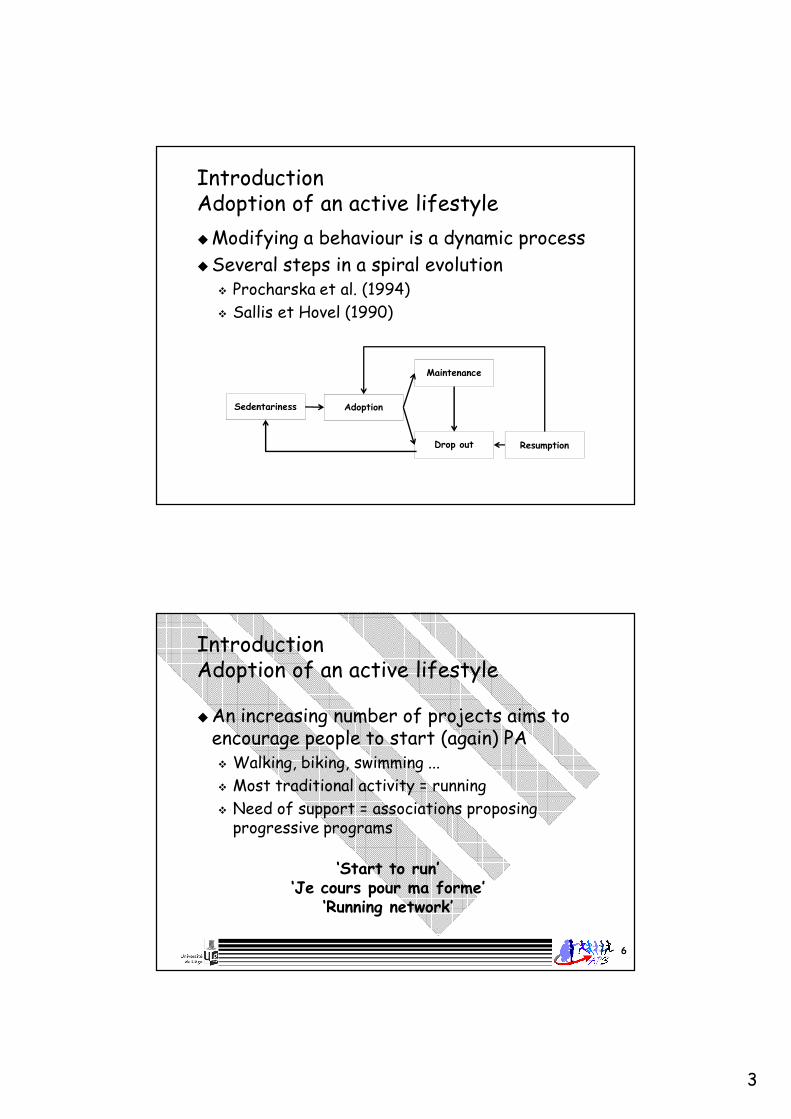
IntroductionAdoption of an active lifestyle
�Modifying a behaviour is a dynamic process
�Several steps in a spiral evolution� Procharska et al. (1994)
� Sallis et Hovel (1990)
Sedentariness Adoption
Drop out
Maintenance
Resumption
6
IntroductionAdoption of an active lifestyle
�An increasing number of projects aims to encourage people to start (again) PA� Walking, biking, swimming ...
� Most traditional activity = running
� Need of support = associations proposing progressive programs
‘Start to run’‘Je cours pour ma forme’
‘Running network’

4
Start to run
�http://sport.be.msn.com/starttorun/2009/fr/
� 10 weeks
� 1 to 3 sessions /week
�5 or 10km
�Club
�Coach
Factors that influence the success of such projects
� Scanlan et al. (1993)� Pleasure, personal involvement, expected
benefits, social support
� Vallerand & Losier (1999)� Teaching process among social factors
5
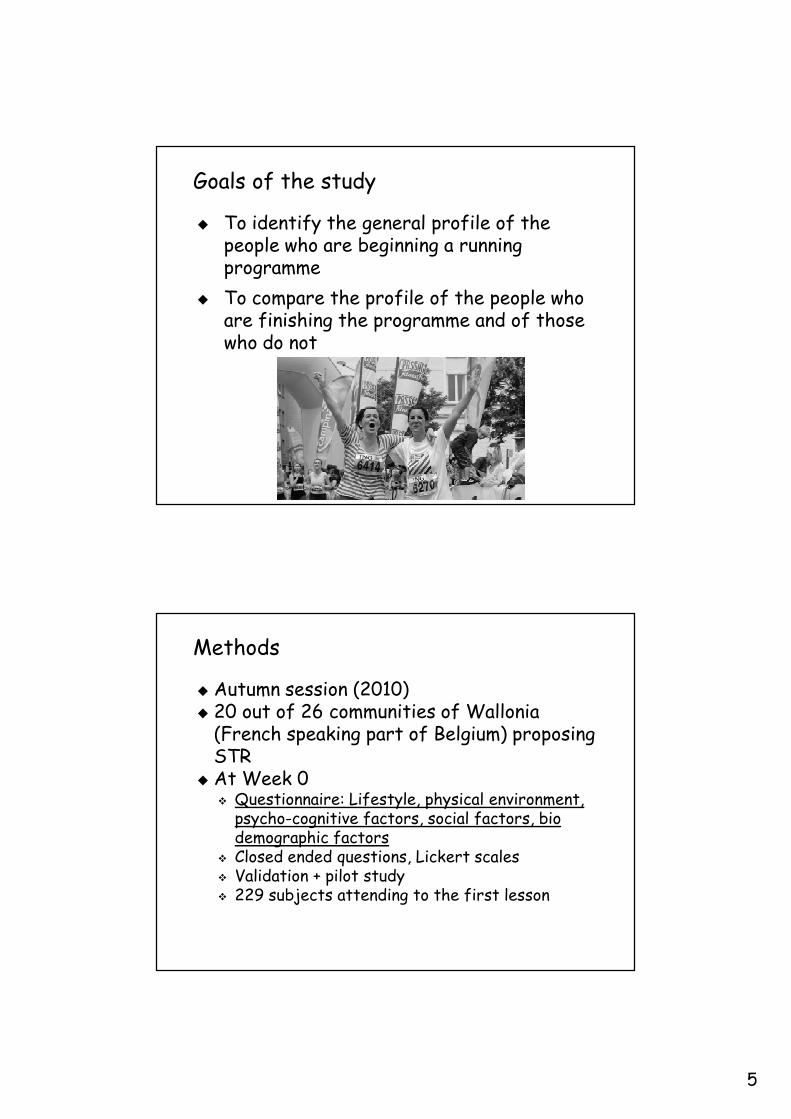
Goals of the study
� To identify the general profile of the people who are beginning a running programme
� To compare the profile of the people who are finishing the programme and of those who do not
Methods
� Autumn session (2010)� 20 out of 26 communities of Wallonia (French speaking part of Belgium) proposing STR
� At Week 0� Questionnaire: Lifestyle, physical environment,
psycho-cognitive factors, social factors, bio demographic factors
� Closed ended questions, Lickert scales� Validation + pilot study� 229 subjects attending to the first lesson

6
Methods
� At Week 10� Questionnaire� 128 maintenance� 52 drop out� 49 lost
� At Week 22� Questionnaire� 37 maintenance� 17 drop out� 74 lost
� Data processing� Statistica 8.0� t de Student
FindingsGeneral profile of the participants (Week 0)
Bio demographic factorsWoman, forty years, in couple, normal BMI, perception of high or
average income, teacher or official
Lifestyle
No smoker, drinking occasionally alcohol, good nutritional habits,
few physical activity experience, self-perception as low or no
sports, low or no experience of running
Perception of the physical environment
Fairly positive perception of their environment
Perception of the social environment
Perception of a social encouragement from friends and family,
support from friends and social contacts
Psycho-cognitive factors
Moderately high perceptions of free time and family burden, high
perceived behavioral control but perception of running as
moderately easy, high intention and positive attitude toward
running, high self-efficacy, intrinsic motivation, relatively good
perceived state of health, knowledge of health recommendations
fairly close to reality, positive beliefs about the impact of physical
activity on health, little attention to social norms
7
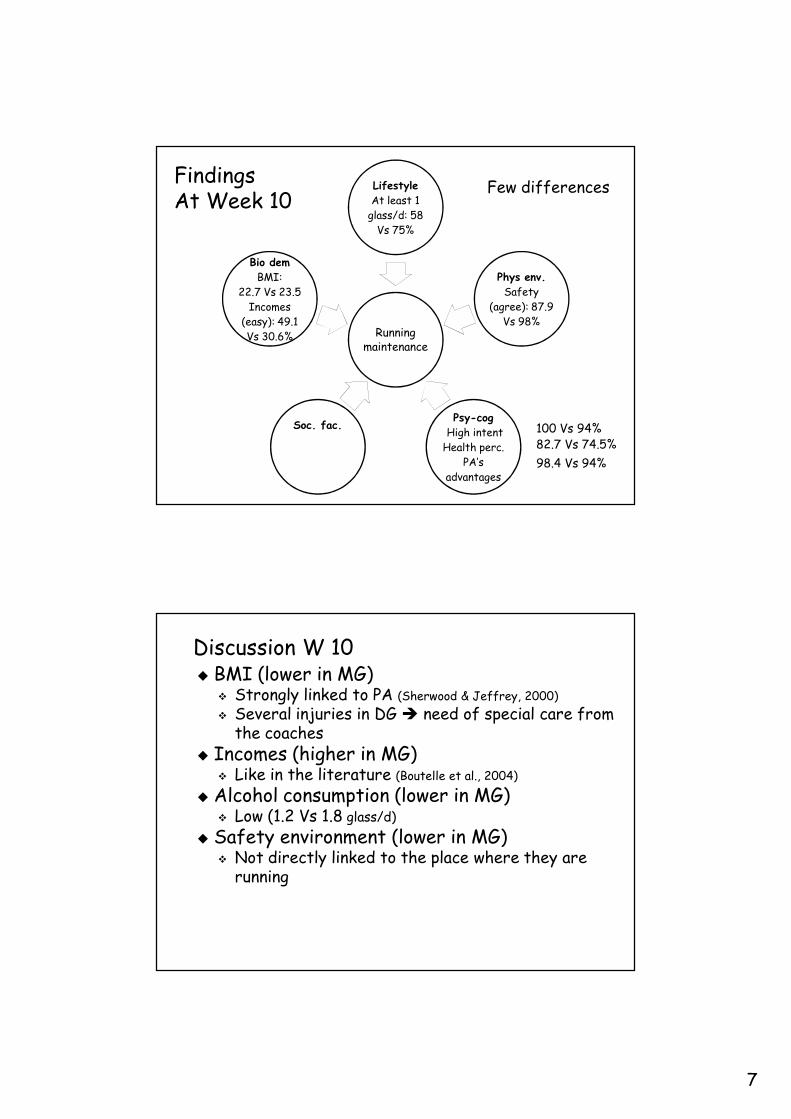
Running maintenance
Lifestyle
At least 1 glass/d: 58 Vs 75%
Phys env.
Safety (agree): 87.9
Vs 98%
Psy-cog
High intentHealth perc.
PA’s advantages
Soc. fac.
Bio dem
BMI:22.7 Vs 23.5Incomes
(easy): 49.1 Vs 30.6%
FindingsAt Week 10
100 Vs 94%82.7 Vs 74.5%
98.4 Vs 94%
Few differences
Discussion W 10� BMI (lower in MG)
� Strongly linked to PA (Sherwood & Jeffrey, 2000)� Several injuries in DG � need of special care from
the coaches� Incomes (higher in MG)
� Like in the literature (Boutelle et al., 2004)
� Alcohol consumption (lower in MG)� Low (1.2 Vs 1.8 glass/d)
� Safety environment (lower in MG)� Not directly linked to the place where they are
running
8
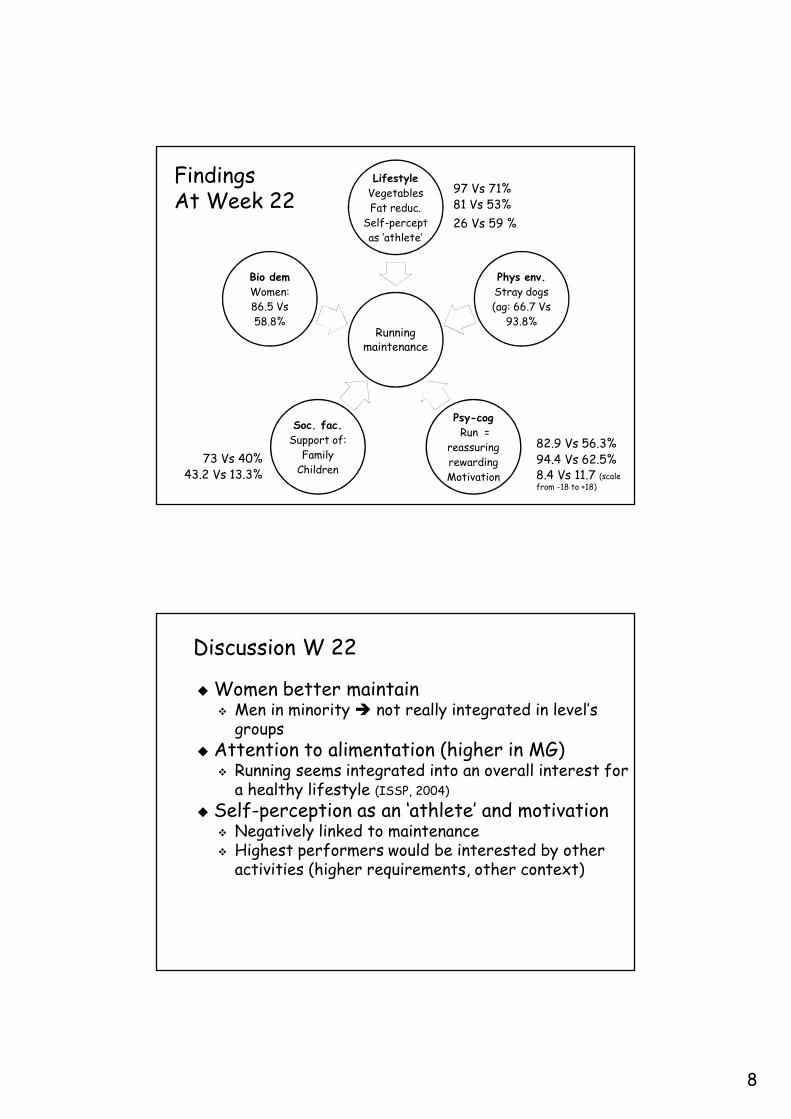
Running maintenance
Lifestyle
VegetablesFat reduc.
Self-percept as ‘athlete’
Phys env.
Stray dogs (ag: 66.7 Vs
93.8%
Psy-cog
Run = reassuringrewardingMotivation
Soc. fac.
Support of:FamilyChildren
Bio dem
Women: 86.5 Vs 58.8%
FindingsAt Week 22
82.9 Vs 56.3%94.4 Vs 62.5%8.4 Vs 11.7 (scale from -18 to +18)
97 Vs 71%81 Vs 53%
26 Vs 59 %
73 Vs 40%43.2 Vs 13.3%
Discussion W 22
� Women better maintain� Men in minority � not really integrated in level’s
groups� Attention to alimentation (higher in MG)
� Running seems integrated into an overall interest for a healthy lifestyle (ISSP, 2004)
� Self-perception as an ‘athlete’ and motivation� Negatively linked to maintenance� Highest performers would be interested by other
activities (higher requirements, other context)
9
Discussion W 22
� Social support (higher in MG)� At the end of the programme, group effect tends to
disappear � need of other supports (Litt et al., 2002)
� Representations about running (higher in MG)� Reassuring, rewarding� Role of attitude (Sallis et al. 1996)
Findings
� Limitations� 40% of the DG subjects were injured� They would have been active without this
situation� No control of the external factors (coaching
process, inter-participants’ relationships ...)� Risk of social desirability� Amount of the fees (means of 32.5€)

10
Conclusion
� Effective physical activity resumption seems to be linked to a general health climate without overestimation of one’s competences and expectations
� Instructors should improve more the participants’ safety as well as focus more on motivational aspects than on performance itself (coaches as educators and motivators)
� They should emphasize more the positive effects of PA and offer other opportunities to their participants (coaches as counsellors)
Thank you for your attention

11
Références� Booth, M.L., Owen, N., Bauman, D., Clavisi, O., & Leslie, E. (2000). Social-cognitive and perceived
environmental influences associated withphysicalactivity in older Australians, Preventive Medicine, 31 , 15–22.
� Booth, M.L., Sallis, J.F., Ritenbaugh, C., Hill, C., Birch, J.O., Frank, L.D., Himmelgreen, K., Mudd, D.A., Popkin, B.M., Rikard, K.A., Jeor, S.S, & Hays, N.P. (2000). Environmental and societal factors affect food choice and physical activity: Rationale influences and leverage points. Nutrition Review, 59, 21-39.
� Boutelle, K.N., Jeffery, R.W., & French S.A. (2004). Predictors of vigorous exercise adoption and maintenance over four years in a community sample. International Journal of Behavioral Nutrition and Physical Activity, 1, 1, 13.
� Edwards, P. & Tsouros, A. (2006). Promoting physical activity and active living urban environments. The role of local governments. Copenhague: WHO.
� Institut scientifique de santé publique (2006). Enquête de Santé par Interview Belgique 2004. Retrieved from Internet: http://www.iph.fgov.be/epidemio/epifr/crospfr/hisfr/table04.htm
� Litt, M.D, Kleppinger A., & Judge J.O. (2002). Initiation and maintenance of exercice behaviour in older women: predictors from the social learning model. Journal of Behavioral Medicine, 25, 83-97.
� Meusel D. Physical activity - Percentage of people undertaking health-enhancing physical activity, sedentariness, walking and sitting across EU-15 countries in 2002. In: EUPHIX, EUphact. Bilthoven: RIVM, <http://www.euphix.org> EUphact\ Determinants of health\ Health
� Prochaska, J.O., Norcross, J.C, & Di Clemente, C.C. (1994). Changing for Good: A Revolutionary Six-Stage Program for Overcoming Bad Habits and Moving your Life Positively Forward. New York, NY: Quill.
� Sallis, J.F., Cervero, R.B., Ascher W., et al. (2006). An ecological approach to creating active living communities. Annual Review of Public Health, 27, 297-322.

12
� Sallis J.F., Haskell W.L., Fortmann S.P., Vranizan K.M., Taylor C.B., & Solomon D.S. (1986). Predictors of adoption and maintenance of physical activity in a community sample. Preventive Medicine, 15, 331-341.
� Sallis, J.F., & Hovell, M.F. (1990). Determinants of exercise behavior. Exercise and Sport Sciences Review, 18, 1, 307-330.
� Scanlan, T. K. , Carpenter, P. J. , Schmidt, G. W. , Simons, J. P. & Keeler, B. (1993). An Introduction to the sport commitment model. Journal of Sport and Exercice Psychology, 15, 1-15.
� Sherwood N.E., & Jeffery R.W. (2000). The behavioral determinants of exercice: Implications for physical activity interventions. Annu. Rev. Nutr., 20, 21-44.
� U.S. Department of Health and Human Services. Physical Activity and Health: A Report of the Surgeon General. Atlanta, GA: U.S. Department of Health and Human Services, Centers for DiseaseControl and Prevention, National Center for Chronic Disease Prevention and Health Promotion, 1996. Consulté en novembre 2006 sur le site: http://www.cdc.gov/nccdphp/sgr/pdf/sgrfull.pdf
� Vallerand, R.J., & Losier, G. (1999). An interactive analysis of intrinsic and extrinsic motivation in sport. Journal of Applied Sport Psychology, 11, 142-169.
Running programme
Lifestyle
Tobacco, alcohol,
nutrition, PA
Phys env.
Safety, accessibility, cleanness, traffic, air quality ...
Psy-cog
Behavioural control,
attitudes, motivation,
...
Soc. fac.
Support (friends, family …)
Bio dem
BMI, age, gender,
socio econ level


