

Important disclosures appear on the last page of this report 1
Analysts
Colter Allen
Ally Disterhoft
Company Overview Cisco Systems, Inc. (CSCO), a global provider of networking
equipment and IT-based products and services, is a leader in
the communications equipment industry. With operations in
the Americas, Europe, Middle East, Africa, Asia Pacific,
Japan, and China, Cisco has established itself as an IT market
leader with a strong global presence. Cisco capped off the
2016 fiscal year with $49.20 billion in revenue and made
several key acquisitions as it continues to expand the scope of
its business. Currently, Cisco offers both product and service
offerings to enterprise, commercial, service provider, and
public sector customers. Recently, management has
announced its intent to transition to a more cloud-based
business model, which will allow Cisco to capitalize on
opportunities within its wireless, data center, collaboration,
and security spaces.
Stock Performance Highlights 52 week High $31.95
52 week Low $22.46
Beta Value 1.26
Average Daily Volume 21.50M
Share Highlights Market Capitalization $155.44B
Shares Outstanding 5.01B
Book Value per share $12.64
EPS (TTM) $2.11
P/E Ratio 12.06
Dividend Yield 3.35%
Dividend Payout Ratio 44.55%
Company Performance Highlights ROA 6.89%
ROE 17.42%
Sales $49.25B
Key Financial Ratios Current Ratio 3.16
Debt to Equity 45.05
Current Price: $31.38
Target Price Range: $34.00 - $37.00
Key Investment Highlights
Trend towards cloud computing: Industry trends
towards cloud computing, wireless technologies, security,
and Internet of Things (IoT) will likely spur growth in the
future. The cloud computing market is expected to grow
at a 19.40% compounded annual growth rate (CAGR) to
more than $141 billion by 2019.
Opportunities in Emerging Markets: India and China
continue to provide Cisco with multiple opportunities for
growth in both the near and distant future. India is
expected to be the second largest demander of
smartphones by 2017, which will drive wireless
infrastructure spending in the region.
Key acquisitions in high growth areas: Cisco acquired
12 companies in 2016, most of them into high growth
areas such as cloud service providers and data security
firms. The largest of these acquisitions was Cisco’s
$1.40B purchase of Jasper Technologies Inc., a cloud-
based software provider. Cisco has historically
experienced the highest levels of YOY growth in these
regions, and will continue to invest heavily in these areas.
Large player with high brand recognition: Cisco is the
largest company in its industry with a $155.44B market
capitalization, and has also developed strong brand
recognition since its conception in 1984. Cisco plans to
utilize this recognition, as well as its size and competitive
positioning, to its advantage as it looks to shift towards a
more cloud-based business model.
One Year Stock Performance
Source: xxiii
KRAUSE FUND RESEARCH
FALL 2016
CISCO SYSTEMS, INC. (NASDAQ: CSCO)
Recommendation: BUY
NOVEMBER 14, 2016

Important disclosures appear on the last page of this report 2
EXECUTIVE SUMMARY
We recommend a BUY rating for Cisco Systems, Inc. (CSCO)
to be considered by the Krause Fund portfolio. A plethora of
opportunities within the cloud-computing space, increasing
demand in Emerging Markets, strategic acquisitions, and
competitive advantages provided by strong brand recognition
lead us to believe that Cisco will outperform broader
expectations within the coming years. Our target price of
$34.00-$37.00 represents an upside of roughly 8.00%-18.00%.
While switching and NGN routing sales will continue to
comprise roughly half of Cisco’s overall revenue, we
anticipate high levels of growth year-over-year within its
collaboration, data center, wireless, and security product
offerings. These beliefs are accurately reflected in our
valuation models, which forecast revenues to reach all-time
highs in response to macroeconomic and industry influences,
including Verizon’s introduction of 5G technology by 2020,
increased internet penetration in India, and increased
dependence on cloud-computing abilities.
Additionally, we expect Cisco to remain a driving force
behind consolidation within the communications equipment
industry. Dating back to 1995, Cisco has spent more than
$80.00B in total to acquire more than 250 companies, while
also partnering with established companies such as Apple and
VMware (a subsidiary of Dell Technologies) xxvii. Through
acquisitions of smaller, less-established companies, Cisco will
continue to obtain valuable patents and intellectual capital,
bolstering market share and enhancing its ability to provide
the newest, most innovative products to its customers. This is
a type of behavior that Cisco has consistently demonstrated
over the past five years, and is one that we anticipate will
continue into the future.
MACROECONOMIC OUTLOOK
Capital Markets Overview
Gross Domestic Product
Real Gross Domestic Product (Real GDP) is a measure of the
value of goods and services produced in a country after
adjusting for inflation, which provides insight to economic
production and growth. Consequently, it is a strong indicator
of the health of the economy. Additionally, growth rates in
GDP and corporate profits, including corporations in the
technology industry, have historically followed similar
trajectories.
Although the economy has continued to expand since the
financial crisis, Real GDP growth has slowed. Between 1990-
2008, Real GDP grew at an average rate of approximately
3.00%. In comparison, annual growth since 2008 has remained
between 1.50%-2.50% despite quantitative easing and other
expansionary monetary policies.
We predict Real GDP growth to be 2.00% in 2016 but lower
to 1.50%-2.00% in future years. While the markets have
recovered since the financial crisis—as evidenced by the S&P
record closing on November 9th—we are hesitant to expect
significant economic growth given risks associated with the
threat of rising interest rates and political uncertainty
following the U.S. presidential election.
Source: xxiv
Employment
Unemployment rates are relevant economic indicators for
Cisco because of their effects on labor costs. As workers
become scarce, companies are often forced to raise wages or
increase spending to better attract more qualified candidates.
The national unemployment rate has continued to decrease
since its peak of 10.20% in October, 2009. Currently, the
economy is near full-employment as the unemployment rate
remains around 5.00%. With our team’s 2016 Real GDP
forecast at 2.00%, we anticipate no significant upward
movement in the unemployment rate in the short term.
However, given the trend of slowing GDP growth and risk of
future wage pressures, we anticipate the unemployment rate to
increase to 5.25%-6.00% in the long term.
Source: xxv
Exchange Rates
Cisco generates a significant portion of its revenues
overseas—consequently, it faces exposure to fluctuations in
currency exchanges when reporting its financial performance
in U.S. dollars. While Cisco hedges its international currency
risk, the company is still susceptible to large discrepancies in
currencies and the effects of an appreciating U.S. dollar.
Since 2014, the U.S. dollar has appreciated more than 18.00%
due to relatively slow growth in the global economy as
compared to the United States. The U.S. Dollar Index (DXY)
is currently trading at 95.85 and has remained stable over the
past year. Our team predicts the DXY to continue trading in
the range of 93 to 100 for the next several months due to
continued weakness in foreign economies relative to the
United States and uncertainty following political trade deals.

Important disclosures appear on the last page of this report 3
India
As internet penetration continues in India, technology
companies are gaining further access to potentially billions of
consumers. Furthermore, growth is expected to be sustained—
despite recent influxes of internet users, internet penetration in
India is still only 30.00%.
The primary driver behind the increase in internet users has
been a boom in smartphone ownership. Over the past year,
India added 118 million new mobile-data users. As
smartphones become more popular, key players within the
mobile hardware industry have made large ventures to expand
sales in the region. Thus, smartphones are now widely
available to end users and the internet is becoming more
intertwined with Indian communities.
We predict internet penetration in India to grow as smartphone
ownership increases. Smartphone purchases would be
classified as consumer spending, and considering the
correlation between consumer spending and Real GDP, our
team believes spending within the economy as a whole will
follow sales growth within the smartphone industry. Overall,
consumption in India has grown consistently year-to-year.
Aside from brief downturns in 2008 and 2012, India’s GDP
has continued growing at expansionary rates. We expect this
trend to continue as further internet penetration will contribute
to development of new industries and jobs in India’s economy.
Source: xxvi
China
With Cisco incurring large increases in product revenue
growth in China over the past five years, the Chinese economy
has the ability to largely influence the company’s financial
performance. China’s recent downturn has contributed to the
appreciation of the U.S. dollar and, consequently, dented
corporate profits for exporting-focused companies.
The development of Chinese technology corporations also
poses a threat to U.S. companies, specifically within the
technology sector. Chinese companies now directly compete
with American counterparts to innovate new products. China
is the second largest investor in research and development and
saw an 8.40% increase in R&D spending going into 2015.
Furthermore, governmental policies have strengthened
intellectual property law in China. While this protection
benefits U.S.-based companies in the space, it also allows
multi-national Chinese corporations, such as Huwaei, to
compete globally with fewer fees and less litigation. As Cisco
continues to expand its product lines and enter new industries,
our team predicts competition with Chinese corporations will
increase.
Europe
Europe’s economy and political environment will continue to
influence the U.S. macroeconomic environment. While the
European economy has recovered since 2008, uncertainty still
exists in the markets, specifically within the banking sector.
Our team predicts uncertainty to continue as the region
confronts consequences observed following the United
Kingdom’s decision to leave the European Union (Brexit). We
expect this doubt to be reflected in the form of increased
foreign exchange risk for multi-national companies.
Capital Markets Outlook
Even amidst varying levels of uncertainty, the U.S. technology
sector is still an appealing area for investors. While the
technology sector experienced a slow summer in 2016,
business activity has accelerated in the last two quarters of the
year, specifically within the mergers and acquisitions space. In
general, technology companies have historically outperformed
both the Dow and S&P 500, and are currently on pace to stay
on-trend in 2016. Overall, the technology industry has largely
been unaffected by the decline in global demand for
smartphones. Instead, industry leaders have found new growth
opportunities in cloud-focused software and storage industries.
Our team predicts sustainable growth in these industries as
end-users become more familiar with cloud products and
companies process more mass data.
Additionally, with more than 45.00% of IT spending
worldwide expected to come from large enterprises by the
year 2020, companies with strong brand recognition and
established consumer bases will be able to weather industry
uncertainty far better than emerging start-up companies xxvix. A
shift towards more assurance-based demand to assist with
potential security threats in lieu of a greater dependence on
cloud-computing functions will also benefit those technology
companies that provide diversity in their product offerings.
Currently, Cisco offers switching, routing, collaboration, data
center (including cloud services), wireless, service provider
video, and security services to its customers, making it a one-
stop shop for its consumers, as opposed to smaller, less
established competitors within the broader communications
equipment industry. We believe that this will prove
advantageous for Cisco in the coming years, despite
fluctuations in IT spending across different geographic regions
globally.
INDUSTRY ANALYSIS
Industry Description
The communications equipment industry creates the
equipment that helps people communicate, whether that be
through wired or wireless connections, and is broadly broken
up into two categories of products: Wireline and wireless.
While wireline has traditionally made up the majority of
0.00%
5.00%
10.00%
15.00%
20.00%
25.00%
30.00%
35.00%
40.00%
2006 2007 2008 2009 2010 2011 2012 2013 2014 2015 2016
Percentage of Population Using the Internet
in India

Important disclosures appear on the last page of this report 4
revenue for members of this industry, wireless products have
increased as a percentage of revenue in recent years. For
example, Cisco’s wireless product revenue as percentage of
product revenue has increased from 3.50% to 7.05% over the
past 7 yearsi. Due to consolidation, most of the large players in
the industry operate in a variety of business segments and
have a significant presence in most of them. These business
segments include broadband access, optical, PBX, routing,
switching, wireless handsets, wireless infrastructures, and
cloud computingiv.
Key Industry Drivers
Consumer Spending
With individuals and corporations make up the target
customer base for most companies that specialize in
manufacturing communication equipment, an increase in
aggregate spending has historically led to increased industry
revenuesxvii. For example, Cisco’s sales revenue has broadly
tracked personal consumption expenditures (PCE) over the
past seven years. PCE has been positive in six out the past
seven years, while Cisco’s revenues have been positive in five
of the last seven, further confirming this correlation.
Source: i, xviii
Strength of the U.S. Dollar
Any change in the value of the U.S. Dollar has the potential to
make the telecommunications networking equipment
industry’s goods more or less competitive depending on the
direction of the deviation. A strengthening of the dollar
relative to the foreign currency being compared would make a
U.S. communications equipment company’s products more
expensive relative to that foreign country’s local products. In
certain areas of the globe where Cisco has significant
competitors, such as in China, this is an especially important
driver to consider.
U.S. Dollar/Euro:
The Euro has fallen in value nearly 20.00% over the last five
years due to economic weakness in Europe and various other
political uncertaintiesxix. However, the Euro has been more
stable as of late having not moved at all YTDxix. We see more
instability in the future due to the upcoming Italian
Referendum and other political events which could continue to
weaken the value of the Euro relative to the U.S. Dollar, thus
damaging Cisco’s competitive ability in that region.
Source: xix
U.S. Dollar/Chinese Yuan:
The Dollar has appreciated against the Yuan almost 7.20%
over the last five years, with most of that appreciation
occurring over the last yearxix. Some of this is in part due to
the current economic slowdown that is being observed in
China, as well as the government’s decision to let the Yuan
fall at a pre-determined rate. For example, following the
United Kingdom’s withradawal from the European Union, the
People’s Bank of China (PBOC) allowed the Yuan to weaken
1.60% when compared to the U.S. Dollar.
Earlier in 2016, the PBOC created a system that grants it the
authority to weaken the Yuan when the U.S. Dollar
appreciates in an effort to increase Chinese exports. The
opposite can also be observed, with the PBOC having the
ability to increase the value of the Yuan when the U.S. Dollar
declinesxxvii. Due to these factors, Cisco has become slightly
disadvantaged when compared to competitors in China, such
as Huawei and ZTE. Continued strengthening of the Dollar
against the Yuan has the ability to hinder Cisco’s
competitiveness in China, and is something that should be
monitored seeing that China has been one of Cisco’s most
rapidly-growing geographic segments recently.
Source: xix
U.S. Dollar/Japanese Yen:
The Dollar has appreciated against the Yen nearly 39.00%
over the last five years, in large part due to growth concerns
with Japanxix. However, due to political uncertainty and other
factors, the Dollar has most recently weakened almost 12.00%
in 2016 when compared to the Yen. However, we do not
anticipate that this trend will continue in lieu of the recent
results of the Presidential Election. With Donald Trump as
President and Republicans controlling both the House and the
Senate, we anticipate comprehensive tax reforms and changes
in trade policy that will most certainly strengthen the U.S.
Dollar relative to the Yen.
-12.00%
-8.00%
-4.00%
0.00%
4.00%
8.00%
12.00%
2009 2010 2011 2012 2013 2014 2015
% Change in PCE vs. % Change Sales Revenue
Personal Consumption Expenditures
Cisco Systems Sales Revenue

Important disclosures appear on the last page of this report 5
Source: xix
Network Usage and Capacity
Increased network usage has the potential to spur demand for
either wired or wireless infrastructure products (or both) that
the communications equipment industry provides. From 2000-
2015, the number of internet users in the U.S. more than
doubled to nearly 284 million from only 121 million users in
2000xx. This number is expected to increase to more than
11.00% over the next five yearsxx. Also, as of May 2015,
China had more than 483 million internet users while India
and Japan each had 81 million and 73 million respectivelyxx.
Smartphone Usage and Growth
Increased usage and growth of smartphones also has the
potential to spur growth in the communications equipment
industry. Mobile phone internet usage penetration rates
reached nearly 66.00% in the U.S. during 2015xx. These rates
are expected to increase to more than 80.00% by 2021xx. In
addition, from now until 2020, global wireless smartphone
shipments are expected to increase at a CAGR of 6.00% to
more than $1.90 billion, up from $1.40 billion in 2015iv.
IT Spending
IT Spending across the globe has a direct correlation to
technology firms’ ability to generate revenue, with Cisco in
particular relying heavily on its product offerings to produce
roughly 76.00% of total revenues (as of 2016). According to a
press release issued by the International Data Corporation
(IDC), a market research and analysis firm, IT spending
worldwide is expected to grow from $2.46 trillion in 2015 to
$2.80 trillion by 2020, with Latin America and North America
headlining these gains xxvix. Furthermore, software spending on
behalf of large global enterprises is anticipated to increase
drastically at a 6.70% compounded annual growth rate, while
hardware spending (which would include Cisco’s switching
and NGN routing product offerings) is forecasted to slow xxvix.
With network software, collaborative applications, data
access, and data analytics product offerings expected to grow
at the fastest rates within overall IT spending in the coming
years, Cisco is well positioned to capitalize on these
opportunities due to a recent shift to a more cloud-based
business model.
Industry Trends
Wireless Markets
Due to limited wireline infrastructure, wireless usage in
emerging markets is expected to increase rapidly in India and
China despite an expected decrease in IT spendingiv.
Smartphone shipments to emerging markets such as China and
India are good gauges for the increased demand for wireless
infrastructure and products. India is expected to increase its
overall market share of smartphone shipments by 6.00% by
the year 2019, and will overtake the U.S. as second largest
demander of smartphones by 2017iv. China is currently the
largest demander of smartphones, holding a 27.90% market
share in shipments in 2015iv.
Cloud Computing
Companies have implemented an obvious shift towards cloud
computing as a way to reduce their capital investments in
equipment and lower maintenance-related costsiv. Cloud
computing is also scalable, which allows companies to make
payments based on the amount of data storage they need
instead of constantly upgrading internal hardwareiv. Spending
on cloud services is expected to increase from $70 billion in
2015 to $141 billion by 2019, at a growth rate equivalent to 6
times that of the overall IT market (19.40% CAGR)iv.
Internet of Things (IoT)
The Internet of things (IoT) is a phrase that describes the
connections between people and devices as well as the
connection between devices and other devices. Currently,
there are more than 10 billion devices connected to the
internet, and this number is expected to increase to more than
20 billion by the year 2020iv. This growth in devices will lead
to increased connections and is expected to drive more than
$19 trillion of value globally over the next decadeiv. While this
growth increases value, it also increases the need for security,
the final trend our team anticipates seeing in the future for the
communications equipment industry.
Security
As of March 2016, a survey of 315 U.S. companies found that
around 87.00% of them believed that data security posed a
challenge to their businessxxi. Furthermore, since 2009, the
number of global cyber security incidents has increased from
3.4 million to more than 59 million in 2015xxii. This increase
in security issues necessitates that communications equipment
companies provide products that not only serve their client’s
needs, but also provide superior protection from potential
cyber-attacks. Our team believes that the need for increased
protection against cyber-attacks is one that could drive
significant growth for the industry going forward, and is a
trend that we believe Cisco will capitalize on, as is
demonstrated in our valuation model. We will discuss this
belief more in depth in a later section of the report.
Competitive Environment
Our team has identified four major competitors to Cisco
within the communications equipment industry, including
Nokia Corporation, Palo Alto Networks, Juniper Networks,
and F5 Networks. These companies compete with Cisco in
many of the same product and service categories. Something
of importance to note when comparing these firms is that
Cisco controls a vast majority of the industry by market
capitalization, and the following metrics may therefore be a
reflection of this fact. The metrics below are ones that we feel
are the most representative of the communications equipment
industry, and apply directly to Cisco’s current business
structure.
Important disclosures appear on the last page of this report 6
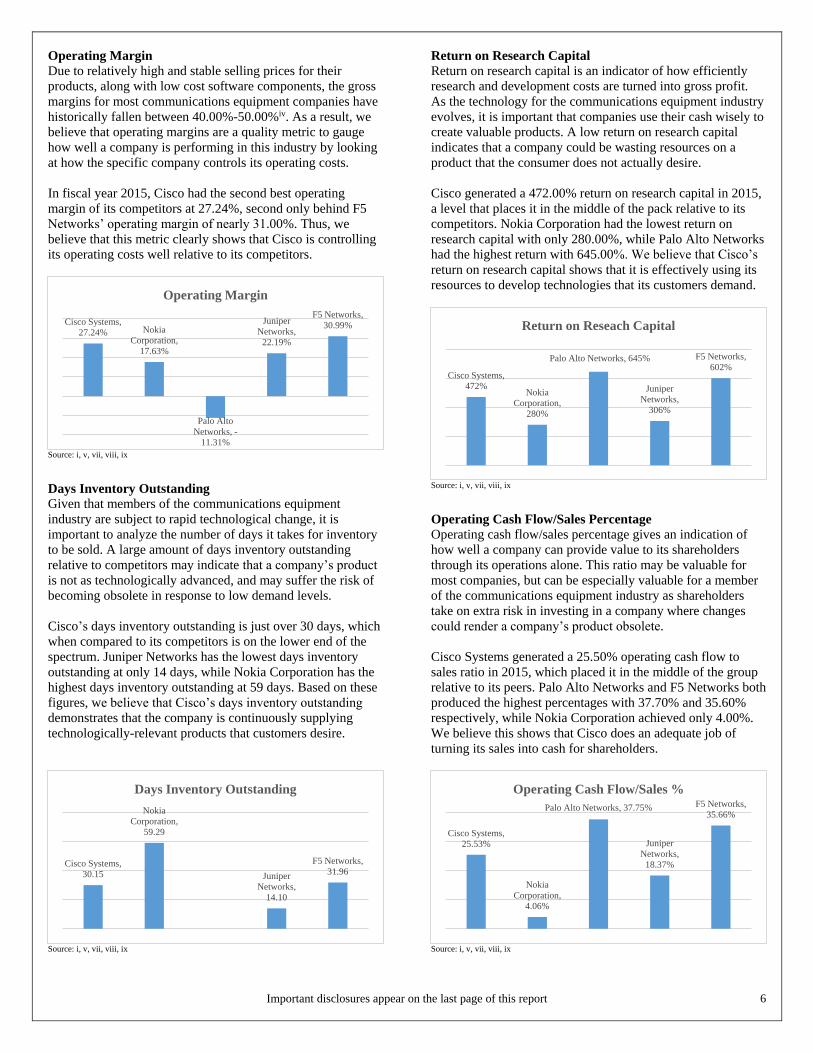
Operating Margin
Due to relatively high and stable selling prices for their
products, along with low cost software components, the gross
margins for most communications equipment companies have
historically fallen between 40.00%-50.00%iv. As a result, we
believe that operating margins are a quality metric to gauge
how well a company is performing in this industry by looking
at how the specific company controls its operating costs.
In fiscal year 2015, Cisco had the second best operating
margin of its competitors at 27.24%, second only behind F5
Networks’ operating margin of nearly 31.00%. Thus, we
believe that this metric clearly shows that Cisco is controlling
its operating costs well relative to its competitors.
Source: i, v, vii, viii, ix
Days Inventory Outstanding
Given that members of the communications equipment
industry are subject to rapid technological change, it is
important to analyze the number of days it takes for inventory
to be sold. A large amount of days inventory outstanding
relative to competitors may indicate that a company’s product
is not as technologically advanced, and may suffer the risk of
becoming obsolete in response to low demand levels.
Cisco’s days inventory outstanding is just over 30 days, which
when compared to its competitors is on the lower end of the
spectrum. Juniper Networks has the lowest days inventory
outstanding at only 14 days, while Nokia Corporation has the
highest days inventory outstanding at 59 days. Based on these
figures, we believe that Cisco’s days inventory outstanding
demonstrates that the company is continuously supplying
technologically-relevant products that customers desire.
Source: i, v, vii, viii, ix
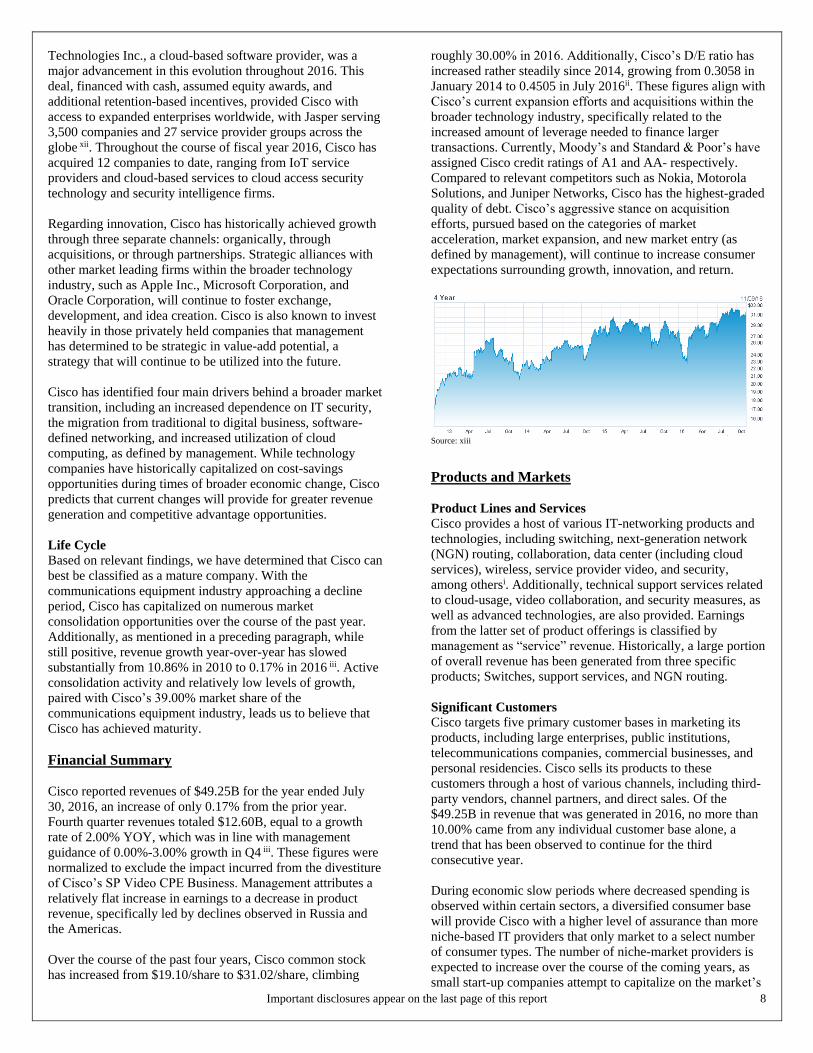
Return on Research Capital
Return on research capital is an indicator of how efficiently
research and development costs are turned into gross profit.
As the technology for the communications equipment industry
evolves, it is important that companies use their cash wisely to
create valuable products. A low return on research capital
indicates that a company could be wasting resources on a
product that the consumer does not actually desire.
Cisco generated a 472.00% return on research capital in 2015,
a level that places it in the middle of the pack relative to its
competitors. Nokia Corporation had the lowest return on
research capital with only 280.00%, while Palo Alto Networks
had the highest return with 645.00%. We believe that Cisco’s
return on research capital shows that it is effectively using its
resources to develop technologies that its customers demand.
Source: i, v, vii, viii, ix
Operating Cash Flow/Sales Percentage
Operating cash flow/sales percentage gives an indication of
how well a company can provide value to its shareholders
through its operations alone. This ratio may be valuable for
most companies, but can be especially valuable for a member
of the communications equipment industry as shareholders
take on extra risk in investing in a company where changes
could render a company’s product obsolete.
Cisco Systems generated a 25.50% operating cash flow to
sales ratio in 2015, which placed it in the middle of the group
relative to its peers. Palo Alto Networks and F5 Networks both
produced the highest percentages with 37.70% and 35.60%
respectively, while Nokia Corporation achieved only 4.00%.
We believe this shows that Cisco does an adequate job of
turning its sales into cash for shareholders.
Source: i, v, vii, viii, ix
Cisco Systems,
27.24% Nokia
Corporation,
17.63%
Palo Alto
Networks, -
11.31%
Juniper
Networks,
22.19%
F5 Networks,
30.99%
Operating Margin
Cisco Systems,
30.15
Nokia
Corporation,
59.29
Juniper
Networks,
14.10
F5 Networks,
31.96
Days Inventory Outstanding
Cisco Systems,
472%Nokia
Corporation,
280%
Palo Alto Networks, 645%
Juniper
Networks,
306%
F5 Networks,
602%
Return on Reseach Capital
Cisco Systems,
25.53%
Nokia
Corporation,
4.06%
Palo Alto Networks, 37.75%
Juniper
Networks,
18.37%
F5 Networks,
35.66%
Operating Cash Flow/Sales %

Important disclosures appear on the last page of this report 7
Porter’s Five Forces
Threat of New Entrants: Low
According to Cisco’s 2016 10-K, barriers in the
communications equipment industry are relatively low, and
new products and companies that compete with the firm are
regularly formedi. We believe, however, that since industry-
wide R&D spending is fairly high that most new entrants tend
to not have the level of capital to compete with an established
industry giant such as Cisco.
Threat of Substitution: High
The communications equipment industry is characterized by
its quickly changing technology, and as a result, any product
that is made has a chance of becoming obsolete within several
months. Therefore, a large part of being successful in this
industry is a company’s ability to quickly develop new
technologies that customers demand. We believe that while
the threat of substitution in the communications equipment
industry is high, that Cisco has been successful in providing
valuable products to customers in the past and will continue to
do so in the future.
Power of Suppliers: Low
Many members of the communications equipment industry
choose to contract out their manufacturing requirements to
other firms. However, Cisco is not currently engaged in any
long-term contracts with other firms and generally renews its
arrangements on a yearly or as-needed basisi. For this reason,
and as a result of its size, we believe that Cisco benefits from a
low power of suppliers. Suppliers are more likely to seek
Cisco for business rather than the other way around.
Power of Buyers: Moderate/Increasing
Cisco sells a majority of its products through various channel
partners, while also selling a portion of its products directly to
end usersi. As a result, channel partners can play dual roles -
Competitor and consumer. This requires Cisco to balance a
complicated relationship and has led some channel partners to
request that Cisco bear a further burden of riski. Further
change to the industry may continue to strain the relationships
that Cisco has historically developed with its channel partners.
Competitive Rivalry: Moderate
The communications equipment industry is a highly
competitive industry as technology is constantly improving
and the products that customers demand is always changing.
With that being said, Cisco enjoys the benefit of having high
brand recognition as a result of being an industry leader for
many years. Our team also believes that since Cisco is also the
largest member of its industry, it has the ability to buy-out
smaller competitors or products that it feels would enhance its
own product and service lines.
COMPANY ANALYSIS
General Overview
Business Description
Cisco Systems Inc. (CSCO) is an established global provider
of networking equipment and IT-based products and services.
Founded in December of 1984, Cisco has helped customers to
build networks and digitize information technology-based
products and services for over 30 yearsi. With operations in
the Americas, Europe, Middle East, Africa, Asia Pacific,
Japan, and China, Cisco has established itself as an IT market
leader with a strong global presence.
Source: x
While Cisco has incurred a mere 7.00% cumulative increase in
revenues over the course of the past four years, a figure that
mirrors the behaviors of its broader consumer base, a recent
shift to cloud-driven offerings will provide Cisco with large
windows of opportunity. Foreign markets including China and
India provide Cisco with strong growth openings, with 2016
revenues increasing in these countries by 22.00% and 18.00%
respectivelyi. Due to low internet penetration rates, our team
has identified these two countries as markets to capitalize on.
Additionally, although revenue growth has increased rather
slowly as of late, Cisco common stock has consistently
outperformed both the aggregate S&P500 index as well as the
S&P Information Technology index since July 2012, with
yearly returns increasing from $99.79 to $219.92 to datei.
Much of Cisco’s success relative to its peers can be attributed
to its wide range of product offerings, which we will discuss
more thoroughly in a later section of this report.
Source: x
Corporate Strategy
Cisco’s corporate strategy heavily emphasizes its ability to
provide customers with sound IT security across a host of
various platforms. Additionally, management has initiated a
transition from selling individuals products and services to a
more subscription and software-based model in the hopes of
generating more recurring forms of revenuei. This strategy
proved profitable during the fourth quarter of 2016, with
software and subscription-based deferred revenue growing
33.00% iii. Cisco’s $1.40 billion acquisition of Jasper
Important disclosures appear on the last page of this report 8
Technologies Inc., a cloud-based software provider, was a
major advancement in this evolution throughout 2016. This
deal, financed with cash, assumed equity awards, and
additional retention-based incentives, provided Cisco with
access to expanded enterprises worldwide, with Jasper serving
3,500 companies and 27 service provider groups across the
globe xii. Throughout the course of fiscal year 2016, Cisco has
acquired 12 companies to date, ranging from IoT service
providers and cloud-based services to cloud access security
technology and security intelligence firms.
Regarding innovation, Cisco has historically achieved growth
through three separate channels: organically, through
acquisitions, or through partnerships. Strategic alliances with
other market leading firms within the broader technology
industry, such as Apple Inc., Microsoft Corporation, and
Oracle Corporation, will continue to foster exchange,
development, and idea creation. Cisco is also known to invest
heavily in those privately held companies that management
has determined to be strategic in value-add potential, a
strategy that will continue to be utilized into the future.
Cisco has identified four main drivers behind a broader market
transition, including an increased dependence on IT security,
the migration from traditional to digital business, software-
defined networking, and increased utilization of cloud
computing, as defined by management. While technology
companies have historically capitalized on cost-savings
opportunities during times of broader economic change, Cisco
predicts that current changes will provide for greater revenue
generation and competitive advantage opportunities.
Life Cycle
Based on relevant findings, we have determined that Cisco can
best be classified as a mature company. With the
communications equipment industry approaching a decline
period, Cisco has capitalized on numerous market
consolidation opportunities over the course of the past year.
Additionally, as mentioned in a preceding paragraph, while
still positive, revenue growth year-over-year has slowed
substantially from 10.86% in 2010 to 0.17% in 2016 iii. Active
consolidation activity and relatively low levels of growth,
paired with Cisco’s 39.00% market share of the
communications equipment industry, leads us to believe that
Cisco has achieved maturity.
Financial Summary
Cisco reported revenues of $49.25B for the year ended July
30, 2016, an increase of only 0.17% from the prior year.
Fourth quarter revenues totaled $12.60B, equal to a growth
rate of 2.00% YOY, which was in line with management
guidance of 0.00%-3.00% growth in Q4 iii. These figures were
normalized to exclude the impact incurred from the divestiture
of Cisco’s SP Video CPE Business. Management attributes a
relatively flat increase in earnings to a decrease in product
revenue, specifically led by declines observed in Russia and
the Americas.
Over the course of the past four years, Cisco common stock
has increased from $19.10/share to $31.02/share, climbing
roughly 30.00% in 2016. Additionally, Cisco’s D/E ratio has
increased rather steadily since 2014, growing from 0.3058 in
January 2014 to 0.4505 in July 2016ii. These figures align with
Cisco’s current expansion efforts and acquisitions within the
broader technology industry, specifically related to the
increased amount of leverage needed to finance larger
transactions. Currently, Moody’s and Standard & Poor’s have
assigned Cisco credit ratings of A1 and AA- respectively.
Compared to relevant competitors such as Nokia, Motorola
Solutions, and Juniper Networks, Cisco has the highest-graded
quality of debt. Cisco’s aggressive stance on acquisition
efforts, pursued based on the categories of market
acceleration, market expansion, and new market entry (as
defined by management), will continue to increase consumer
expectations surrounding growth, innovation, and return.
Source: xiii
Products and Markets
Product Lines and Services
Cisco provides a host of various IT-networking products and
technologies, including switching, next-generation network
(NGN) routing, collaboration, data center (including cloud
services), wireless, service provider video, and security,
among othersi. Additionally, technical support services related
to cloud-usage, video collaboration, and security measures, as
well as advanced technologies, are also provided. Earnings
from the latter set of product offerings is classified by
management as “service” revenue. Historically, a large portion
of overall revenue has been generated from three specific
products; Switches, support services, and NGN routing.
Significant Customers Cisco targets five primary customer bases in marketing its
products, including large enterprises, public institutions,
telecommunications companies, commercial businesses, and
personal residencies. Cisco sells its products to these
customers through a host of various channels, including third-
party vendors, channel partners, and direct sales. Of the
$49.25B in revenue that was generated in 2016, no more than
10.00% came from any individual customer base alone, a
trend that has been observed to continue for the third
consecutive year.
During economic slow periods where decreased spending is
observed within certain sectors, a diversified consumer base
will provide Cisco with a higher level of assurance than more
niche-based IT providers that only market to a select number
of consumer types. The number of niche-market providers is
expected to increase over the course of the coming years, as
small start-up companies attempt to capitalize on the market’s

Important disclosures appear on the last page of this report 9
shift to a newer, more cloud-based business model. Cisco’s
emphasis on a decentralized customer base spread out across
multiple sub-industries, geographies, and market segments
will allow the firm to continue to thrive in varying economic
environments.
Revenue Generation
Primarily, Cisco’s $49.25B in revenue generated during 2016
stemmed from product sales, which accounted for 75.60% of
total revenue earnedi. Sales of network switches, NGN routers,
and video and collaboration products headlined these gains.
Network switching sales remained flat from 2015 to 2016, in
large part due to an uncertain economic environment that led
to a decrease in overall IT spending. While Cisco still controls
59.00% of the Ethernet switching market, this figure has
decreased from its 62.00% level in 2013, a decline that we
predict will continue into the future due to Cisco’s transition
to a more cloud-based business model.
The remaining 24.40% of 2016 revenue was generated
through service sales, a percentage that has continued to linger
between 23.00%-25.00% over the past three fiscal years. The
Americas market segment continued to drive earnings,
accounting for 59.70% of revenues, with Europe, the Middle
East, and Africa totaling 24.90%, and the Asia Pacific, Japan,
and China regions totaling 15.40%.
Source: i
Analysis of Recent Earnings Release
On July 30, 2016, Cisco filed corporate earnings of $12.60B
for Q4, a 2.00% growth year-over-year excluding the sale of
the SP Video CPE business (SP Video)iii. Additionally, Cisco
reported Q4 net income of $2.80B, a 21.00% increase from the
prior year figure. Non-GAAP earnings per share was observed
to increase substantially as well ($0.58 in Q4 2015 to $0.63 in
Q4 2016) due to both the increase in net income described
above and a decline in diluted share count. Management
expects Non-GAAP earnings per share to decrease slightly in
Q1 of 2017, falling between $0.58-$0.60 xi. Excluding the sale
of the SP Video, Cisco incurred increases in revenue, net
income, earnings per share, and gross/operating margins, with
both gross and operating margins noted as having consistently
strong performance xi.
During fiscal year 2016, Cisco also announced a restructuring
plan that will eliminate approximately 7.00% of its global
workforceiii. These changes are expected to go into effect
beginning in Q1 of 2017. Cisco estimates that it will recognize
$700 million in pre-tax charges, with all cost savings being
reinvested into specific divisions of the business, including
security, IoT, collaboration, data center, and cloud product
offerings i. Over the past five years, these product groups have
been observed to incur the highest growth rates year-over-
year, a trend that we predict will continue into the future. We
believe that Cisco’s plans to restructure operations will
provide it with the flexibility to more aggressively pursue
long-term expansion efforts and investment opportunities,
which will be key factors in garnering success in a quickly
consolidating industry.
Management did note that the technology industry proved to
be extremely volatile in 2016, with service provider and
emerging market orders decreasing 5.00% and 6.00%
respectively. These decreases follow three consecutive
quarters of robust growth. Strong performance in security,
data center, and collaboration, coupled with a transition to a
more cloud-based business model, will allow Cisco to rebound
in the midst of a rather uncertain economic environment xi.
Production and Distribution
Production
Cisco relies heavily on contract manufacturers and suppliers
for its production needs. The company’s wide variety of
manufacturers allows it to provide unique products that satisfy
each of their customers’ needs. Cisco has also not entered into
any long-term contracts with these manufacturers, which
allows the firm the ability to renew contracts and commit to
purchases on an as-needed basis. These contracts are generally
fixed contracts based on forecasted demand and are committed
to on a year-to-year basisi. Cisco’s purchase commitments for
2016 decreased by 4.00% from the prior year, but this
decrease was due largely in part to the sale of the SP Video
CPE business. Management believes that Cisco’s current
purchase commitments accurately reflect forecasted demandi.
By contracting out its manufacturing, Cisco has developed
ways to prevent inventory markdowns and waste, as well as
adapt quickly to changes in consumer demand.
Distribution
A majority of Cisco’s products and services are sold through
the company’s channel partners, which includes service
providers, systems integrators, and other distributors, while
the remainder of Cisco’s products and services are sold
directly to end usersi. A change in this distribution model has
the potential to harm Cisco’s margins. Several factors that
may contribute to a change in Cisco’s current distribution
model are as follows: Cisco’s increased competition with
channel partners, being asked to bear greater risk from channel
partners, and channel partners’ financial health and ability to
withstand economic hardshipsi. While these factors necessitate
caution, we believe that Cisco will continue to maintain
quality relationships with its channel partners and that any
changes in margin due to differences in the distribution model
will be insignificant in the long-run.

Important disclosures appear on the last page of this report 10
Competitive Environment
Cisco is a member of the communications equipment industry,
an industry that is characterized by its rapidly changing
technologies and its migration towards networking solutions
that provide advantages to clients at competitive prices. For
example, Verizon recently disclosed that it plans to introduce
5G technology as early as 2020. This form of next-generation
wireless technology will most certainly accelerate the
introduction of virtual reality, 3D video conferencing, and
other emerging wireless offerings, all of which we expect
Cisco to capitalize on through its wireless product offerings.
Cisco competes with a variety of companies in each of its
product categories as well as geographic regions, and expects
to see increased competition as it migrates to new markets and
geographic regions, particularly China where it predicts more
price-focused competitioni. Cisco also expects to incur
additional competition from a few of its own allies who have
formed strategic alliances with its competitorsi. As mentioned
previously, we have identified Nokia Corporation, Palo Alto
Networks, Juniper Networks, and F5 Networks as being
Cisco’s main competitors. It is our belief that while Cisco is
part of an extremely competitive environment, it enjoys
benefits that come from being the largest player in the
communications equipment industry with high brand
recognition.
Catalysts for Growth and Change
As the amount of people connected to the internet continues to
grow, we see an increased trend towards cloud computing,
wireless infrastructure, and software-based solutions in order
to provide the infrastructure and support for this growth. As a
result, there is a need to provide products that will satisfy
future consumer demands. Cisco places a premium on
research and development and acquisitions as a way to prepare
itself to best be able to handle these future demands.
Research and Development
Due to rapid change and various technological developments
within the industry, Cisco stresses providing new products and
services to its customers on a timely and cost effective basis.
In each of the previous three years, Cisco has spent more than
$6.00 billion on R&Di. These costs are spread out over various
product groups, but there has been an increased focus on the
following areas: Security and data center-related products,
core routing and switching products, and collaboration
productsi. We believe that Cisco’s focus on these areas and its
spending on R&D is appropriate given current industry trends
and Cisco’s relatively high return on research capital.
Acquisitions
Cisco uses acquisitions to gain access to both new
technologies and patents in order to take advantage of
potential industry trends. Over the past year, Cisco has made
12 total acquisitions, mostly in cloud and security-based
companiesi. Due to recent industry trends towards cloud
computing, software, and security, Cisco’s recent acquisitions
have been strategic in the sense that they have provided the
company with growth opportunities into new markets.
S.W.O.T Analysis
Strengths
1. Patents
In a cyclical industry that is driven by changes in both
consumer preferences and expectations/innovation, Cisco has
assumed an aggressive stance in pursuing patent opportunities.
During the 2016 fiscal year, Cisco acquired a total of $940
million in patents through acquisitions, roughly 9.50 times the
prior year’s amount. Additionally, purchased intangible assets
net of accumulated amortization increased from $2.376 billion
to $2.50 billioni. Obtaining patents has become a strategic
initiative for many technology companies, and Cisco is no
exception. Looking forward, Cisco will be able to leverage
these patents in restricting competitors and licensing the
technology to other companies for use.
2. Global Market Presence
With offices located worldwide, Cisco is already positioned to
capitalize on global market penetration opportunities as they
arise. Specifically, Cisco has initiated the process of tapping
into India and China, two countries that are expected to burst
onto the technology scene over the coming years. During
2016, Cisco’s $371 million increase in revenue from its APJC
segments was largely driven by increased sales in China, a
number that jumped 22.00% throughout the course of the year.
Management attributed a portion of this increase to the firm’s
newly-established $100 million joint venture with Inspur
Group, a Chinese information technology firm. In 2015, Cisco
announced its intent to commit $10 billion to a Chinese
investment initiative in an attempt to better connect with
potential customers by partnering with domestic, household
names. On a similar note, product revenue increased 18.00%
in Indiai. While revenues generated in the Americas and
EMEA segments decreased slightly, APJC increased 5.20% in
2016, a major turnaround from the 2.30% decrease observed
from 2014 to 2015.
3. Brand Recognition
According to a recent report issued by Interbrand, a brand
consultancy agency that ranks companies based on metrics
including financial performance, influence on consumers, and
ability to generate price premiums, Cisco is currently rated the
15th most established brand on the planet. Other companies
among the top 15 include Apple, BWM, Disney, and Amazon,
to name a few xxvii. With 25,000 offices in more than 90
countries worldwide, Cisco has established itself as a
household name within the broader technology industry.
Weaknesses
1. Service Provider Sales
With a slowdown in service provider capital expenditures
being observed over the past three fiscal years, Cisco’s
revenues have been materially harmed. Due to uncertainty in
the economy, overcapacity, regulatory developments, and
constraints on spending, many service providers are expected
to continue to cut back on spending. This should be worrisome
to management, considering that 59.50% of Cisco’s $48.70B

Important disclosures appear on the last page of this report 11
of revenue generated during 2016 consisted of switching and
router sales, products that service providers heavily requirei.
2. Low Unemployment Rates
In August of 2016, Cisco announced a restructuring plan that
is estimated to impact almost 5,500 individuals worldwide, a
number that equates to nearly 7.00% of the firm’s global
workforce. Since 2010, unemployment in the United States
has decreased rather rapidly, from 10.00% in 2010 to 4.90%
to-date xv. While Cisco has made a habit of restructuring
substantial amounts of operations in recent years, we believe
that lower unemployment figures may negatively impact
Cisco’s ability to easily acquire skilled labor.
Opportunities
As our world becomes ever more dependent on technology
and more importantly the infrastructure that provides the
foundation for that technology, we feel that Cisco has the
opportunity to benefit in several key areas moving forward.
These areas include the following: Security, Digital
Transformation, Software Defined Networking (SDN), and the
Cloud. A brief outline of these opportunities are detailed in the
following sections below:
1. Security
According to Gartner, a market research firm, the number of
devices connected to the internet is expected to increase from
6.40 billion devices in 2016 to more than 20.80 billion devices
by 2020iv. As the number of devices connected to the internet
increases, there will become a greater need for security that
can mitigate potential IT threats. Currently, opportunities
within IT security are broad, with no single company owning a
double-digit market share (Cisco currently comprises 5.00%
of the IT security market) xiv. Therefore, we believe that there
exists an enormous opportunity for Cisco to capitalize on the
growing importance of security in network infrastructures.
Source: xxii
2. Digital Transformation
Improving technologies are also changing the way that many
companies do business. A growing number of companies are
shifting towards establishing a greater online presence and
therefore need infrastructure and data solutions to help achieve
these goals. We believe that Cisco can capitalize on this
opportunity and create new revenue streams by helping
companies make the transition from traditional methods of
business to more digitized forms.
3. Software Defined Networking (SDN)
SDN, by definition, offers users the ability to converge broad
network and application services into individual, centralized
platforms, thus making network infrastructure more flexible,
programmable, and easy to use for customers. SDN is believed
to take a job that would normally require weeks or even
months to complete and turn it into a tasks that only
necessitates a few hours or daysiv. We believe that Cisco will
benefit from this shift away from traditional hardware network
infrastructure to more software-based solutions.
4. The Cloud
The cloud allows customers to avoid costly upfront
infrastructure costs and also offers scalability and flexibility
for the data that they demand. Cloud computing has gained
popularity among customers due to its “pay-as-you-go”
model. Spending on services was $70.00 billion in 2015 and is
expected to double to $141 billion by 2019. This growth is
around 6 times as much as the projected growth rate for the
overall IT sectoriv. During 2016, Cisco’s data center product
group, which includes its private and hybrid cloud offering
(Cisco ONE Enterprise Cloud Suite), accounted for roughly
9.00% of total revenues. We believe that this product offering
in particular will continue to see growth, and that Cisco has an
opportunity to extend its foothold in this niche market, based
on the characteristics described above.
Threats
Due to the highly competitive environment that Cisco operates
in, there are several threats that may harm Cisco moving
forward. These threats to Cisco’s business include the global
macroeconomic environment, industry consolidation,
disruptive technologies, and a change in the current
distribution model.
1. Global Macroeconomic Environment
Continued economic challenges in the global economy could
have an adverse effect on Cisco’s revenues. Current global
events that may negataively affect Cisco’s performance
include fallout from the United Kingdom’s “Brexit”
referendum as well as the current economic challenges that
China is facing. This uncertainty in the global environment
has the potential to threaten Cisco’s profits both domestically
and abroad.
2. Industry Consolidation
With the communications equipment industry approaching a
decline period, there has been a trend towards increased
industry consolidation, which we expect to continue into the
future. Thus, current allies may be acquired by competitors,
which could harm profits and increase the competition that
Cisco faces. Furthermore, consolidation in the service provider
industry will result in fewer customers, which increases the
threat to Cisco’s revenues should the firm lose a customer to a
competitor. Additionally, consolidation also gives individual
customers more bargaining power.

Important disclosures appear on the last page of this report 12
3. Disruptive Technologies
Disruptive technologies have the potential to harm Cisco’s
revenues as Cisco may not be able to quickly respond to
changes in technological trends. Smaller companies may also
be able to provide new technologies at better prices than
Cisco, which would adversely affect a portion of Cisco’s
earnings.
4. Change in the Current Distribution Model
Due to the current industry layout, Cisco competes with many
of its distribution channel partners, an occurrence that is
expected to remain constant as the industry continues to
consolidate. This relationship requires Cisco to both work with
and compete against some of the same companies. Should
Cisco fail to maintain one or more of these relationships, it
could lose distribution channels and realize increased levels of
competition, which would adversely affect overall revenues
and margins.
ANALYSIS OF VALUATION METHODS
Valuation Summary
Discussion of Analysis
In order to properly determine the true value of one share of
Cisco’s common stock, our team utilized various valuation
methods, including the Discounted Cash Flow & Economic
Profit models, the Dividend Discount model, and a form of
Relative Valuation that utilized both P/E and PEG ratios from
five of Cisco’s direct competitors that we deemed to be
appropriately comparable. Key assumptions related to the
preparation of these models, as well as a discussion of the
individual models themselves, are listed below:
Key Assumptions
Revenue Decomposition
Currently, Cisco generates roughly 60.00% of its total
revenues from the Americas, with the remaining 40.00% being
distributed between its EMEA (Europe, Middle East, Africa)
and APJC (Asia Pacific, Japan, China) geographic target
divisions. We anticipate American sales to continue to
comprise the majority of Cisco’s earnings, with growth
estimated to increase at a decreasing rate over the forecast
period. Additionally, we predict that revenues from the APJC
segment will follow a similar pattern, driven largely by
continual increases in product growth in China. Growth within
Cisco’s EMEA geographic segment has remained relatively
stagnant over the past five years, dictated largely by a 31.00%
decline in product sales in Russia during 2016 i. We anticipate
that this trend will continue, with EMEA spending predicted
to grow at a 3.30% CAGR through 2019, which is slower than
the overall market growth rate xxvix.
Historically, switching and NGN routing sales have comprised
the bulk of Cisco’s overall revenues, totaling 40.00% and
20.00% respectively in 2016 i. However, with Cisco’s newly-
introduced transition to a more cloud and service-based
business model certain to decrease activity within these two
product groups, we have identified four other product groups
that we anticipate will grow rather rapidly over the coming six
years: Collaboration, data center, wireless, and security.
During 2016, Cisco further enhanced its cloud operating
system, the ONE Enterprise Cloud Suite (included within the
data center product offering). Additionally, of the 12
acquisitions that the company made over the course of the past
fiscal year, seven of the companies that were acquired
provided some form of cloud or visualization
offering/platform. We anticipate that the benefits from these
enhancements and acquisitions will be experienced in Cisco’s
collaboration and data center channels.
Additionally, Verizon’s introduction of its new 5G wireless
technology will most certainly accelerate revenue growth
during 2019 and 2020 specifically, which our model reflects
with wireless revenues increasing from 4.50% to 7.00% in
these two years. Furthermore, with more and more consumers
relying on virtual infrastructure to store their information,
increased demand for security offerings is sure to be observed.
In response to a predicted increase in security-driven demand,
Cisco launched a new firewall system in March of 2016 that
attracted more than 6,000 new customers, which contributed
to the 12.71% growth in revenues that was observed in the
security space during the fiscal year. We anticipate Cisco to
continue to invest heavily in this area, a belief that is
consistent with managerial guidance.
Cost of Sales, Other Expenses
With Cisco being a rather mature company that has
prominently established itself as a market leader within the
telecommunications networking equipment sub-industry, we
do not anticipate its cost structure to change drastically over
the coming years. With that being said, we elected to forecast
both product and service COGS levels based on historical
averages taken from 2011 through 2016 (based on a
percentage of sales). Over these past five years, both product
and service COGS as a percentage of sales have not deviated
more than a few percentage points from year-to-year, with
Cisco continuing to maintain a rather rigid cost structure.
While uncertainty within the information technology space
does exist, we believe that Cisco’s long-standing commitment
to efficiency, as observed through its continual restructuring
efforts and sale of its SP Video CPE Business, will drive the
company to maintain comparable spending levels as has been
observed historically. This line of reasoning also applies to our
forecasts for both Research and Development, Sales and
Marketing, and General and Administrative expenses, where
we utilized compounded annual growth rate (CAGR) and
historical average methods of computing.
Purchased Intangibles
Historically, Cisco has maintained relatively stable amounts of
purchased intangible assets when compared to other non-
current assets due to continual consolidation efforts within the
networking equipment industry. As mentioned in a preceding
section of this report, Cisco made 12 acquisitions throughout
2016 which comprised $940M of the $2,501M in intangible
assets that were purchased during the year. Seeing that
historical purchased intangible assets have fluctuated rather
consistently between $2,000M-$3,000M, our team decided to
compute a historical average from 2007-2015 and apply this to
our model through 2023. Based on both managerial guidance

Important disclosures appear on the last page of this report 13
and past behavior, we expect Cisco to continue to aggressively
pursue acquisition opportunities to better enable the company
to serve its customers, thus maintaining current intangible
levels. When accounting for amortization of Cisco’s
purchased intangibles balance sheet account, we calculated an
average of current year amortization expense divided by prior
year net purchased intangibles for the years 2007-2016, and
then consistently applied this percentage to forecasted
purchased intangible levels throughout the forecast period. We
utilized this same method when calculating depreciation
expense for property, plant, and equipment through 2023.
Share Repurchases
Historically, Cisco has repurchased rather large amounts of its
common stock through its repurchase program, a plan that the
company’s Board of Directors implemented in September of
2001. Consistent with managerial guidance, Cisco’s board had
authorized a cumulative repurchase amount of $112 billion of
common stock, to date, with the remaining $15.40 billion
authorized repurchase amount left to be exercised (with no
termination date specified). Therefore, with no termination
date specified and no guidance pointing towards the
introduction of a new plan on the immediate horizon, we
decided to amortize the remaining $15.40 billion evenly
throughout forecast horizon and carrying value year, which
equates to $2.20 billion of repurchases per year. While smaller
than the average level of repurchases that Cisco has paid out
since the implementation of the plan, share repurchases have
in fact decreased rather drastically each year, from roughly
$10.00 billion in 2008 to $4.00 billion in 2016. Therefore, we
have deemed the $2.20 billion level to be particularly
appropriate for forecasting purposes.
Dividend Payout Ratio
Although Cisco has just recently started to issue dividends to
its shareholders, it has quickly garnered attention for its
generous payout procedures. Currently, the dividend yield on
Cisco common stock stands at 3.40%, which trumps the
average 2.15% yield that dividend-paying S&P 500 companies
pay to their shareholders. Additionally, Cisco’s dividend
payout ratio is rather high when compared to other companies
within the networking equipment industry, totaling 46.93%
during the fourth quarter and 44.55% in 2016. Being a rather
mature company, our team does not anticipate management to
deviate from these figures in future years. Thus, we have
applied a 46.20% dividend payout ratio to our model during
the forecast period, which we calculated based on a historical
average from the past three years.
Weighted Average Cost of Capital (WACC)
Discussion of Analysis
Consistent with the structure of the Capital Asset Pricing
Model, our team determined Cisco’s WACC to be 9.73% by
using a cost structure comprised of an 84.16% weight on
equity as well as an additional 15.84% weight on debt. Our
calculations are as follows:
Cost of Equity
When calculating Cisco’s cost of equity, we utilized a risk-
free rate of 2.52%, an implied equity risk premium of 6.26%,
and a beta of 1.371. The risk-free rate of 2.52% is consistent
with the current yield on a 30-year U.S. Treasury Bond. To
determine the implied equity risk premium, we elected to
utilize the 6.26% figure (trailing 12-month cash yield) that
was listed on Aswath Damodaran’s website, as we felt that
this figure best represented the average excess return (over a
risk-free investment) that a United States-based company can
earn in the current economic environment xvi. Finally, after a
careful analysis of various monthly raw beta regressions run
via the Bloomberg terminals, we determined a beta of 1.371 to
be most appropriate for Cisco’s immediate risk exposure.
Compiled, these individual figures resulted in a cost of equity
that totaled 11.10%.
Cost of Debt
When calculating Cisco’s cost of debt, we elected to use a
corporate bond that most closely-reflected the maturity of a
long-term, 30-year Treasury Bond. While Cisco does not
currently have any 30-year debt outstanding, it does hold a 24-
year bond with a yield to maturity of 3.775%, which is a
figure that we feel accurately matches our forecast horizon.
Furthermore, we determined Cisco’s marginal tax rate to be
19.55%. After multiplying the 3.775% figure by 1 minus the
marginal tax rate, we calculated Cisco’s after-tax cost of debt
to be 3.04%.
Valuation Models
Discounted Cash Flow & Economic Profit Model
In regards to our valuation analysis, we believe that the
Discounted Cash Flow model and the Economic Profit model
provided the most accurate estimates of the intrinsic value of
Cisco’s common stock. Both models computed an intrinsic
value of $34.05, which is an 8.00% premium to the current
stock price of $31.45 as of November 14th, 2016. However, we
feel that there could be even more upside (greater than 8.00%)
as our model assumes declining growth in Cisco’s largest
product segment, switching, which we feel may be a fairly
conservative estimate when compared to other valuation
models. We also assumed a steady gross margin of 61.80%
throughout the forecast period, which may also be considered
to be a conservative estimate as Cisco is shifting towards less-
costly software products. Based upon this approach, we feel
that Cisco should be classified as a BUY at its current levels.
Dividend Discount Model (DDM)
On the other hand, we believe that the Dividend Discount
Model is not the most accurate model to estimate the intrinsic
value of Cisco’s stock. The DDM yielded an intrinsic value of
$22.35, which is well below Cisco’s current stock price. We
believe that a large majority of this discrepancy can be
attributed to Cisco’s low price-to-earnings ratio in the carrying
value year. We feel that the market is underestimating the
growth potential of Cisco as it is a mature company in a
declining industry, and is not taking into account the
enormous growth potential within Cisco’s collaboration, data
center (including cloud services), wireless, and security
product offerings. Additionally, while Cisco does pay out a
modest dividend yield, it just recently began paying an actual
dividend to its shareholders in 2011. Seeing that the company
has been in operations for more than thirty years, we do not

Important disclosures appear on the last page of this report 14
believe that reliance on a model based on such a short-term
estimate (five-year history of dividend payments) would be
wise. As a result, we feel that the DDM is not an accurate
indicator of the intrinsic value of Cisco’s common stock.
Relative Valuation Model
Finally, we believe that the Relative Valuation Model is a
fairly accurate model to estimate the intrinsic value of Cisco’s
stock based on the output that it produces. We used both Price
to Earnings (P/E) and Price to Earnings Growth (PEG) ratios
as metrics to compare firms across the broader industry. The
P/E and PEG ratios gave intrinsic values of between $31.37
and $34.26, after excluding any outliers. Given that most
companies in this industry operate within many of the same
product segments, we felt this was an accurate representation
of value. It is important to note that these results only slightly
differ from the DCF’s computed intrinsic value of $34.05, thus
further validating our findings. With that being said, we also
feel that Cisco’s recent effort to differentiate itself into
emerging niches such as software and data security makes the
DCF model the most accurate methodology that should be
used when attempting to determine the intrinsic value of Cisco
common stock.
SENSITIVITY ANALYSIS
Beta vs. Risk Premium
In comparing these two metrics, our team wanted to look at
how the perceived risk of the market compared with the
correlation of Cisco’s stock to the market. Should broader
market perceptions change, and Cisco stock see a greater or
lesser risk compared with the market, this analysis could give
an idea of the effect on Cisco’s stock price. Our sensitivity
analysis yielded a stock price of between $26.70 and $46.43.
This analysis is detailed in the table listed below:
Product COGS vs. CV Growth of NOPLAT
In comparing these two metrics, our team wanted to look at
how COGS might affect the price of the stock. Since we
forecasted service revenue to increase, we would expect
COGS to potentially decrease over time. The reasoning behind
our use of this particular sensitivity table was to determine the
effect should our forecast be wrong and COGS actually
increase. Our sensitivity analysis yielded a stock price of
between $29.40 and $35.69. This analysis is detailed in the
table listed below:
CV Growth of NOPLAT vs. Inventory as a % of Sales
In comparing these two metrics, our team wanted to determine
the effect of changing inventories on the balance sheet. Within
a rapidly changing industry such as the broader technology
industry, an increase in inventories could indicate that a
company is producing obsolete technologies. Our sensitivity
analysis yielded a stock price of between $32.30 and $36.10.
This analysis is detailed in the table listed below:
Beta vs. Risk Free Rate
In comparing these two metrics, our team wanted to look at
the effect of increasing interest rates and an increase of
perceived risk by investors towards Cisco’s stock. This is
especially relevant due to the outcome of the U.S. presidential
election. Our sensitivity analysis yielded a stock price of
between $28.11 and $44.14. This analysis is detailed in the
table listed below:
WACC vs. Marginal Tax Rate
In comparing these two metrics, out team wanted to look at
the effect that taking on more debt would have on Cisco
common stock. Throughout the fiscal year 2016, Cisco made
multiple acquisitions, and if this pattern is observed to
continue into the future (as we expect), the company could see
an increased debt load and thus increased WACC. Our
sensitivity analysis yielded a stock price of between $30.82
and $37.86. This analysis is detailed in the table listed below:
Important disclosures appear on the last page of this report 15
Important Disclaimer
This report was created by students enrolled in the Applied
Equity Valuation (FIN:4250) class at the University of Iowa.
This report was originally created to offer an internal
investment recommendation for the University of Iowa Krause
Fund and its advisory board. The report also provides potential
employers and other interested parties an example of the
students’ skills, knowledge, and abilities. Members of the
Krause Fund are not registered investment advisors, brokers or
officially licensed financial professionals. The investment
advice contained in this report does not represent an offer or
solicitation to buy or sell any of the securities mentioned.
Unless otherwise noted, facts and figures included in this
report are from publicly available sources. This report is not a
complete compilation of data, and its accuracy is not
guaranteed. From time to time, the University of Iowa, its
faculty, staff, students, or the Krause Fund may hold a
financial interest in the companies mentioned in this report.

Important disclosures appear on the last page of this report 16
REFERENCES i Cisco Systems, Inc. 2016 10-K
ii “Yahoo Finance - Business Finance, Stock Market, Quotes,
News.” Yahoo Finance. Web. Oct. 06 2016.
iii Cisco Systems, Inc. “Fourth Quarter and Fiscal Year 2016
Earnings.” Cisco Investor Relations. Web. 07 Oct. 2016.
iv “S&P Capital IQ NetAdvantage.” S&P Capital IQ
NetAdvantage. N.p., 2016. Web. 03 Oct. 2016.
v Nokia 2015 10-K
vi Motorola Solutions 2015 10-K
vii Juniper Networks 2015 10-K
viii F5 Networks 2015 10-K
ix Palo Alto Networks 2016 10-K
x Cisco Systems, Inc. Annual Report (2016). Retrieved from
http://www.cisco.com/c/en/us/about/annual-reports.html
xi Cisco (2016). Q4 2016 Financial Results Conference Call.
Retrieved from
http://s2.q4cdn.com/230918913/files/doc_financials/quarterly/
Q4FY16/Q4FY16-Earnings-Call-Transcript_Final.pdf
xii Cisco (2016) Cisco Announces Intent to Acquire Jasper
Technologies, Inc. Retrieved from
https://newsroom.cisco.com/press-release-
content?type=webcontent&articleId=1741680 xiii http://www.nasdaq.com/symbol/csco/stock-
chart?intraday=off&timeframe=4y&splits=off&earnings=off&
movingaverage=None&lowerstudy=volume&comparison=off
&index=&drilldown=off xiv Kerravala, Z. (2016, August 22). Cisco well positioned to
dominate cybersecurity market. Retrieved November 09,
2016, from
http://www.networkworld.com/article/3109562/security/cisco-
well-positioned-to-dominate-cybersecurity-market.html
xv U.S. Bureau of Labor Statistics, Labor Force Statistics from
the Current Population, retrieved from
http://data.bls.gov/timeseries/LNS14000000
xvi Damadoran, Aswatch. “Implied Equity Risk Premium.”
Damodaran Online: Home Page for Aswath Damodaran.
Web. 20 Oct. 2016.
xvii IBIS World, IBIS World Industry Report 33422
Communication Equipment Manufacturing in the US,
retrieved from
http://clients1.ibisworld.com.proxy.lib.uiowa.edu/reports/us/in
dustry/default.aspx?entid=746
xviii U.S. Bureau of Economic Analysis, Personal Consumption
Expenditures by Type of Product, retrieved from
http://www.bea.gov/iTable
xix Bloomberg, USD/JPY, EUR/USD, USD/CNY, retrieved
from
https://www.bloomberg.com/markets/currencies
xx Statista, Internet Usage in the United States- Statista
Dossier, retrieved from
http://www.statista.com/study/24290/internet-usage-in-the-
united-states-statista-dossier
xxi Statista, Industry 4.0: U.S. companies’ stance on data
security as of March 2016, retrieved from
http://www.statista.com/statistics/581396/industry-4-us-
companies-who-are-concerned-about-data-security
xxii Statista, U.S. companies and cyber crime- Statista Dossier,
retrieved from
http://www.statista.com/study/12881/smb-and-cyber-crime-in-
the-united-states-statista-dossier
xxiii Yahoo Finance, CSCO vs. S&P500, retrieved from
http://finance.yahoo.com
xxiv U.S. Bureau of Economic Analysis, United States GDP
Annual Growth Rate, retrieved from
http://www.tradingeconomics.com/united-states/gdp-growth-
annual
xxv U.S. Bureau of Economic Analysis, United States
Unemployment Rate, retrieved from
http://www.tradingeconomics.com/united-
states/unemployment-rate
xxvi Statista, India Internet Users, retrieved from
http://www.internetlivestats.com/internet-users/india/
xxvii Simply Safe Dividends, Cisco (CSCO): Safe, Strong,
Dividend Growth and a 3.7% Yield, retrieved from
http://www.simplysafedividends.com/cisco-csco-dividend-
stock-analysis/
xxviii Wei, Lingling. “Brexit is Helping China Push Down the
Yuan.” The Wall Street Journal. Web. 13 Nov. 2016.
xxvix IDC, Worldwide IT Spending Will Reach…, retrieved
from
https://www.idc.com/getdoc.jsp?containerId=prUS41006516

CISCO (CSCO)Revenue Decomposition
Fiscal Years Ending July 30th 2014 2015 2016 2017E 2018E 2019E 2020E 2021E 2022E 2023CVRevenues by Geographic RegionAmericas 27781 29655 29411 31204 32853 34633 36556 38251 39763 41183
Growth YoY -3.00% 6.75% -0.82% 6.10% 5.29% 5.42% 5.55% 4.64% 3.95% 3.57%Percentage of Revenue 58.93% 60.32% 59.72% 61.00% 61.50% 62.00% 62.50% 63.00% 63.50% 64.00%
EMEA 12006 12322 12281 11765 11752 11731 11698 11536 11271 10939Growth YoY -1.67% 2.63% -0.33% -4.20% -0.11% -0.19% -0.28% -1.39% -2.29% -2.95%Percentage of Revenue 25.47% 25.06% 24.94% 23.00% 22.00% 21.00% 20.00% 19.00% 18.00% 17.00%
APJC (Asia Pacific, Japan, China) 7355 7184 7555 8185 8814 9496 10236 10929 11584 12226Growth YoY -5.19% -2.32% 5.16% 8.33% 7.69% 7.74% 7.79% 6.77% 6.00% 5.54%Percentage of Revenue 15.60% 14.61% 15.34% 16.00% 16.50% 17.00% 17.50% 18.00% 18.50% 19.00%
Total Revenue 47142 49161 49247 51154 53420 55860 58490 60715 62619 64348Growth YoY -3.01% 4.28% 0.17% 3.87% 4.43% 4.57% 4.71% 3.80% 3.13% 2.76%
Revenues by Product GroupSwitching 14056 14740 14746 14967 15117 15268 15383 15498 15614 15731
Growth YoY -4.81% 4.87% 0.04% 1.50% 1.00% 1.00% 0.75% 0.75% 0.75% 0.75%Percentage of Revenue 38.86% 39.05% 39.58% 39.06% 38.27% 37.53% 36.80% 36.24% 35.82% 35.45%
NGN Routing (Next-Generation Netowrking) 7662 7704 7408 7334 7371 7407 7444 7407 7370 7333Growth YoY -7.05% 0.55% -3.84% -1.00% 0.50% 0.50% 0.50% -0.50% -0.50% -0.50%Percentage of Revenue 21.18% 20.41% 19.89% 19.14% 18.66% 18.21% 17.81% 17.32% 16.91% 16.53%
Collaboration 3734 4004 4352 4657 4983 5232 5493 5768 5999 6179Growth YoY -5.61% 7.23% 8.69% 7.00% 7.00% 5.00% 5.00% 5.00% 4.00% 3.00%Percentage of Revenue 10.32% 10.61% 11.68% 12.15% 12.62% 12.86% 13.14% 13.49% 13.76% 13.92%
Data Center 2640 3219 3365 3634 3925 4239 4472 4718 4907 5103Growth YoY 27.29% 21.93% 4.54% 8.00% 8.00% 8.00% 5.50% 5.50% 4.00% 4.00%Percentage of Revenue 7.30% 8.53% 9.03% 9.48% 9.94% 10.42% 10.70% 11.03% 11.26% 11.50%
Wireless 2265 2542 2625 2743 2867 3067 3282 3446 3584 3709Growth YoY 1.66% 12.23% 3.27% 4.50% 4.50% 7.00% 7.00% 5.00% 4.00% 3.50%Percentage of Revenue 6.26% 6.73% 7.05% 7.16% 7.26% 7.54% 7.85% 8.06% 8.22% 8.36%
Service Provider Video 3969 3555 2424 2448 2473 2510 2547 2611 2676 2743Growth YoY -18.25% -10.43% -31.81% 1.00% 1.00% 1.50% 1.50% 2.50% 2.50% 2.50%Percentage of Revenue 10.97% 9.42% 6.51% 6.39% 6.26% 6.17% 6.10% 6.11% 6.14% 6.18%
Security 1566 1747 1969 2166 2382 2573 2779 2918 3035 3156Growth YoY 16.17% 11.56% 12.71% 10.00% 10.00% 8.00% 8.00% 5.00% 4.00% 4.00%Percentage of Revenue 4.33% 4.63% 5.29% 5.65% 6.03% 6.32% 6.65% 6.82% 6.96% 7.11%
Other 280 239 365 372 380 387 395 403 411 419Growth YoY -49.82% -14.64% 52.72% 2.00% 2.00% 2.00% 2.00% 2.00% 2.00% 2.00%
Percentage of Revenue 0.77% 0.63% 0.98% 0.97% 0.96% 0.95% 0.95% 0.94% 0.94% 0.94%Product (total) 36172 37750 37254 38322 39497 40684 41796 42769 43596 44374
Growth YoY -4.88% 4.36% -1.31% 2.87% 3.07% 3.01% 2.73% 2.33% 1.93% 1.79%Percentage of Revenue 76.73% 76.79% 75.65% 74.91% 73.94% 72.83% 71.46% 70.44% 69.62% 68.96%
Service 10970 11411 11993 12833 13923 15176 16694 17946 19023 19974Growth YoY 3.71% 4.02% 5.10% 7.00% 8.50% 9.00% 10.00% 7.50% 6.00% 5.00%Percentage of Revenue 23.27% 23.21% 24.35% 25.09% 26.06% 27.17% 28.54% 29.56% 30.38% 31.04%
Total Revenue 47142 49161 49247 51154 53420 55860 58490 60715 62619 64348Growth YoY -3.01% 4.28% 0.17% 3.87% 4.43% 4.57% 4.71% 3.80% 3.13% 2.76%

CISCO (CSCO)Balance SheetIn MillionsFiscal Years Ending July 30th 2014 2015 2016 2017E 2018E 2019E 2020E 2021E 2022E 2023CVASSETSCurrent assets:
Cash & cash equivalents 6726 6877 7631 9288 12460 15579 19298 23370 27178 31028Investments 45348 53539 58125 59272 60589 62088 63778 65675 67791 70146Accounts receivable, net of allowance for doubtful accounts 5157 5344 5847 5498 5742 6004 6287 6526 6731 6916Inventories 1591 1627 1217 1561 1609 1657 1703 1742 1776 1808Financing receivables, net 4153 4491 4272 4504 4748 5006 5278 5564 5866 6185Deferred tax assets 2808 2915 - - - - - - - -Other current assets 1331 1490 1627 1627 1627 1627 1627 1627 1627 1627
Total current assets 67114 76283 78719 81751 86775 91961 97971 104504 110969 117709Property and equipment, net 3252 3332 3506 3582 3741 3912 4096 4252 4385 4506Goodwill 24239 24469 26625 26625 26625 26625 26625 26625 26625 26625Purchased intangible assets, net 3280 2376 2501 2567 2567 2567 2567 2567 2567 2567Deferred tax assets 1700 1648 4299 4314 4329 4344 4360 4375 4390 4406Investments in privately held companies 899 897 - - - - - - - -Income tax receivable - - - - - - - - - -Financing receivables, net 3918 3858 4158 3473 3768 4107 4518 4857 5148 5406Other assets 732 618 1844 1844 1844 1844 1844 1844 1844 1844
TOTAL ASSETS 105134 113481 121652 124155 129649 135360 141980 149023 155928 163063LIABILITIESCurrent liabilities:
Short-term debt 508 3897 4160 4154 4261 4379 4511 4652 4804 4970Accounts payable 1032 1104 1056 1081 1129 1181 1237 1284 1324 1360Income taxes payable 159 62 517 206 235 256 282 301 316 328Accrued compensation 3181 3049 2951 3100 2819 2919 3253 3827 3625 3367Other current liabilities 14929 15511 16227 15021 15686 16403 17175 17828 18387 18895
Total current liabilities 19809 23623 24911 23563 24131 25138 26457 27892 28455 28920Long-term debt 20401 21457 24483 23866 24349 24887 25490 26107 26751 27433Income taxes payable 1851 1876 925 1417 1614 1761 1935 2068 2169 2250Deferred revenue 4664 5359 6317 5733 5987 6260 6555 6804 7018 7212Deferred Tax Liabilities 503 349 278 287 297 306 317 327 338 349Other long-term liabilities 1245 1110 1153 1153 1153 1153 1153 1153 1153 1153
TOTAL LIABILITIES 48473 53774 58067 56019 57530 59505 61906 64351 65883 67316EQUITYMinority interest - - - - - - - - - -Common stock & additional paid-in capital 41884 43592 44516 45872 46469 46469 46469 46469 46469 46469Retained earnings (accumulated deficit) 14093 16045 19396 22592 25978 29714 33932 38530 43903 49605Accumulated other comprehensive income (loss) 677 61 -326 -326 -326 -326 -326 -326 -326 -326
Total Cisco Systems, Inc. shareholders' equity 56654 59698 63586 68138 72120 75856 80075 84673 90045 95747Noncontrolling interests 7 9 -1 -1 -1 -1 -1 -1 -1 -1
TOTAL EQUITY 56661 59707 63585 68137 72119 75855 80074 84672 90044 95746TOTAL LIABILITIES & EQUITY 105134 113481 121652 124155 129649 135360 141980 149023 155928 163063

CISCO (CSCO)Income StatementIn MillionsFiscal Years Ending July 30th 2014 2015 2016 2017E 2018E 2019E 2020E 2021E 2022E 2023CVREVENUESRevenue - product 36172 37750 37254 38322 39497 40684 41796 42769 43596 44374Revenue - service 10970 11411 11993 12833 13923 15176 16694 17946 19023 19974
Total revenue 47142 49161 49247 51154 53420 55860 58490 60715 62619 64348COSTS AND EXPENSESCost of sales - product 13209 12935 12011 12953 13350 13751 14127 14456 14735 14999
Depreciation and Amortization 2432 2442 2150 2139 2185 2282 2387 2499 2594 2675Cost of sales - service 3732 4103 4126 4448 4826 5260 5786 6220 6593 6923
Total cost of sales 19373 19480 18287 19539 20361 21293 22300 23175 23923 24597Gross Margin 27769 29681 30960 31615 33059 34567 36190 37540 38696 39751OPERATING EXPENSESResearch & development expenses 6294 6207 6296 6500 6710 6927 7151 7382 7621 7867Sales & marketing expenses 9503 9821 9619 9900 10188 10486 10792 11106 11431 11764General & administrative expenses 1934 2040 1814 2000 2000 2000 2000 2000 2000 2000Amortization of purchased intangible assets 275 359 303 730 585 495 275 132 62 62Restructuring & other charges 418 484 268 700 300 300 300 300 300 300
Total operating expenses 18424 18911 18300 19829 19783 20207 20517 20920 21413 21993Operating Income (loss) 9345 10770 12660 11786 13276 14359 15673 16620 17283 17759Interest income 691 769 1005 1147 1318 1498 1691 1896 2117 2354Interest expense -564 -566 -676 -924 -901 -919 -939 -962 -986 -1010Other income (loss), net 243 228 -69 89 93 97 102 105 109 112
Interest & other income (loss), net 370 431 260 311 509 676 853 1039 1240 1456Income (loss) before provision for (benefit from) income taxes 9715 11201 12920 12097 13785 15035 16526 17659 18523 19215Provision for (benefit from) income taxes 1862 2220 2181 2365 2695 2939 3231 3452 3621 3756NET INCOME (LOSS) 7853 8981 10739 9732 11090 12096 13295 14207 14902 15458
Weighted average shares outstanding - basic 5234 5104 5053 5019 4989 4940 4887 4838 4794 4755Year end shares outstanding 5107 5085 5029 5,010 4,969 4,912 4,861 4,815 4,773 4,736Net income (loss) per share - diluted 1.49 1.75 2.11 1.94 2.22 2.45 2.72 2.94 3.11 3.25Cash dividends declared per common share 0.72 0.8 0.94 0.94 1.10 1.24 1.40 1.52 1.52 1.58

CISCO (CSCO)Cash Flow StatementIn MillionsFiscal Years Ending July 30th 2007 2008 2009 2010 2011 2012 2013 2014 2015 2016Cash Flows from Operating Activities
Net income (loss) 7333 8052 6134 7767 6490 8041 9983 7853 8981 10739Adjustments to reconcile net income to net cash provided by operating activities:
Depreciation, amortization & other adjustments 1413 1744 1768 2030 2486 2602 2351 2432 2442 2150Share-based compensation expense 965 1112 1231 1517 1620 1401 1120 1348 1440 1458Provision for receivables 6 34 54 44 7 50 44 79 134 -9Deferred income taxes -622 -772 -574 -477 -157 -314 -37 -678 -23 -194Excess tax benefits from share-based compensation -918 -413 -22 -211 -71 -60 -92 -118 -128 -129In-process research & development 81 3 63 - - - - - - -Losses (gains) on investments & other, net -210 -103 80 -223 -213 -31 9 -299 -258 -317
Change in operating assets and liabilities, net of effects of acquisitions and divestitures:Accounts receivable -597 171 610 -1528 298 272 -1001 340 -413 -404Inventories 61 104 187 -158 -147 -287 218 -109 -116 315Financing receivables -156 -488 -222 -387 -1534 -846 -723 -119 -634 -150Other assets -452 -361 -780 -639 275 -674 -27 33 -370 -37Accounts payable -107 62 -208 139 -28 -7 164 -23 87 -65Income taxes, net 1104 178 768 55 -156 418 -239 191 53 -300Accrued compensation 479 351 175 565 -64 -101 330 -42 7 -101Deferred revenue 1293 1812 572 1531 1028 727 598 659 1275 1219Other liabilities 431 603 61 148 245 300 196 785 75 -605
Net cash provided (used) by operating activities 10104 12089 9897 10173 10079 11491 12894 12332 12552 13570
Cash Flows from Investing Activities
Purchases of investments -20532 -22399 -41225 -48690 -37130 -41810 -36608 -36317 -43975 -46760Proceeds from sales & maturities of investments 17368 19990 32825 42997 35655 39468 32708 33853 35530 42893Acquisition of businesses, net of cash & cash equivalents acquired -3684 -398 -426 -5279 -266 -375 -6766 -2989 -326 -3161Proceeds from business divestiture - - - - - - - - - 372Purchases of investments in privately held companies -92 -101 -89 -79 -41 -380 -225 -384 -222 -256Return of investments in privately held companies - - - - - 242 209 213 288 91Acquisition of property & equipment -1251 -1268 -1005 -1008 -1174 -1126 -1160 -1275 -1227 -1146Proceeds from sales of property & equipment - - - - - - - 232 22 41Other investing activities -151 -17 -39 128 22 166 74 24 -178 -191
Net cash provided (used) by investing activities -8342 -4193 -9959 -11931 -2934 -3815 -11768 -6643 -10088 -8117
Cash Flows from Financing Activities
Issuances of common stock 5306 3117 863 3278 1831 1372 3338 1907 2016 1127Repurchases of common stock - repurchase program -7681 -10441 -3611 -7864 -6896 -4760 -2773 -9413 -4324 -3909Shares repurchased for tax withholdings on vesting of restricted stock units - - - - - - -330 -430 -502 -557Short-term borrowings, maturities less than 90 days, net - - - 41 512 -557 -20 -2 -4 -4Issuances of debt - - 3991 4944 4109 - 24 8001 4981 6978Repayments of debt - - -500 - -3113 - -16 -3276 -508 -3863Settlement of interest rate derivatives related to long-term debt - - -42 23 - - - - - -Proceeds from the termination of interest rate swaps - 432 - - - - - - - -Excess tax benefits from share-based compensation 918 413 22 211 71 60 92 118 128 129Dividends paid - - - - -658 -1501 -3310 -3758 -4086 -4750Other financing activities 126 46 -134 -12 80 -153 -5 -35 -14 150
Net cash provided (used) by financing activities -1331 -6433 589 621 -4064 -5539 -3000 -6888 -2313 -4699
Total Cash Provided (Used)
Net increase (decrease) in cash & cash equivalents 431 1463 527 -1137 3081 2137 -1874 -1199 151 754Cash & cash equivalents, beginning of fiscal year 3297 3728 5191 5718 4581 7662 9799 7925 6726 6877Cash & cash equivalents, end of fiscal year 3728 5191 5718 4581 7662 9799 7925 6726 6877 7631Cash paid for interest - 366 333 692 777 681 682 682 760 859

CISCO (CSCO)Forecasted Cash Flow StatementIn MillionsFiscal Years Ending July 30th 2017E 2018E 2019E 2020E 2021E 2022E 2023CVCash Flows from Operating Activities
Net income (loss) 9732 11090 12096 13295 14207 14902 15458Adjustments to reconcile net income to net cash provided by operating activities:
Depreciation and Amortization 2139 2185 2282 2387 2499 2594 2675Change in deferred tax assets -15 -15 -15 -15 -15 -15 -15Change in deferred tax liabilities 9 9 10 10 10 11 11Changes in working capital accounts
Accounts receivable, net of allowance for doubtful accounts 349 -244 -262 -283 -239 -205 -186Inventories -344 -48 -48 -45 -40 -34 -32Financing receivables, net -232 -244 -258 -272 -286 -302 -318Accounts payable 25 48 52 56 47 40 37Income taxes payable, current -311 29 21 25 19 15 12Accrued compensation 149 -281 99 335 574 -203 -258Other current liabilities -1206 665 717 772 653 559 508
Financing receivables, net, noncurrent 685 -295 -339 -411 -339 -291 -257Income taxes payable, noncurrent 492 198 146 175 133 101 81Deferred revenue, noncurrent -584 254 273 295 249 213 194
Net cash provided (used) by operating activities 10888 13351 14774 16323 17473 17385 17909
Cash Flows from Investing Activities
(Increase) decrease in short-term investments -1147 -1318 -1498 -1691 -1896 -2117 -2354Purchases of intangibles -66 0 0 0 0 0 0Capital expenditures -2215 -2344 -2453 -2571 -2655 -2727 -2796Net cash provided (used) by investing activities -3428 -3662 -3952 -4261 -4551 -4844 -5151
Cash Flows from Financing Activities
Proceeds from issuance (payment) of notes payable and ST debt -6 106 118 131 141 152 166Proceeds from issuance (payment) of LT debt -617 483 539 603 617 643 682Payment of dividends -4336 -5504 -6160 -6876 -7409 -7329 -7557Common stock and additional paid-in capital 1356 597 0 0 0 0 0Repurchases of common stock -2,200 -2,200 -2,200 -2,200 -2,200 -2,200 -2,200Net cash provided (used) by financing activities -5803 -6518 -7703 -8342 -8851 -8733 -8908
Net increase (decrease) in cash and cash equivalents 1657 3171 3119 3719 4072 3808 3850Cash and cash equivalents at the beginning of the year 7631 9288 12460 15579 19298 23370 27178Cash and cash equivalents at the end of the year 9288 12460 15579 19298 23370 27178 31028
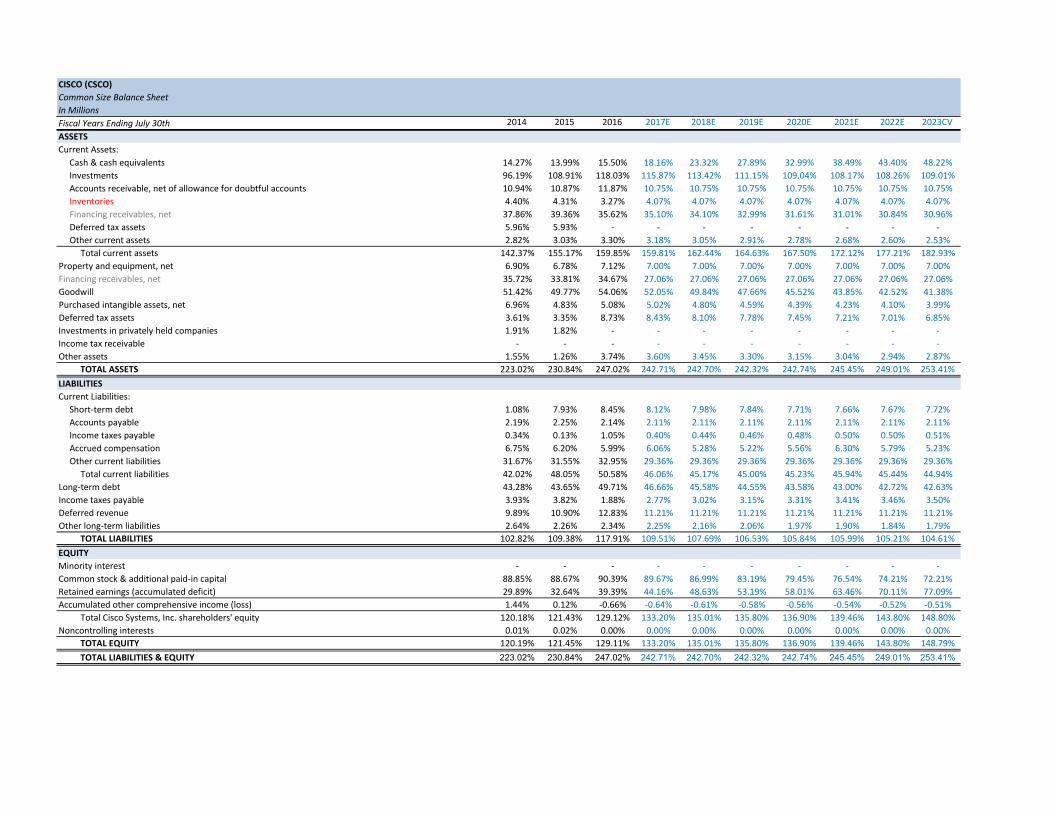
CISCO (CSCO)Common Size Balance SheetIn MillionsFiscal Years Ending July 30th 2014 2015 2016 2017E 2018E 2019E 2020E 2021E 2022E 2023CVASSETSCurrent Assets:
Cash & cash equivalents 14.27% 13.99% 15.50% 18.16% 23.32% 27.89% 32.99% 38.49% 43.40% 48.22%Investments 96.19% 108.91% 118.03% 115.87% 113.42% 111.15% 109.04% 108.17% 108.26% 109.01%Accounts receivable, net of allowance for doubtful accounts 10.94% 10.87% 11.87% 10.75% 10.75% 10.75% 10.75% 10.75% 10.75% 10.75%Inventories 4.40% 4.31% 3.27% 4.07% 4.07% 4.07% 4.07% 4.07% 4.07% 4.07%Financing receivables, net 37.86% 39.36% 35.62% 35.10% 34.10% 32.99% 31.61% 31.01% 30.84% 30.96%Deferred tax assets 5.96% 5.93% - - - - - - - -Other current assets 2.82% 3.03% 3.30% 3.18% 3.05% 2.91% 2.78% 2.68% 2.60% 2.53%
Total current assets 142.37% 155.17% 159.85% 159.81% 162.44% 164.63% 167.50% 172.12% 177.21% 182.93%Property and equipment, net 6.90% 6.78% 7.12% 7.00% 7.00% 7.00% 7.00% 7.00% 7.00% 7.00%Financing receivables, net 35.72% 33.81% 34.67% 27.06% 27.06% 27.06% 27.06% 27.06% 27.06% 27.06%Goodwill 51.42% 49.77% 54.06% 52.05% 49.84% 47.66% 45.52% 43.85% 42.52% 41.38%Purchased intangible assets, net 6.96% 4.83% 5.08% 5.02% 4.80% 4.59% 4.39% 4.23% 4.10% 3.99%Deferred tax assets 3.61% 3.35% 8.73% 8.43% 8.10% 7.78% 7.45% 7.21% 7.01% 6.85%Investments in privately held companies 1.91% 1.82% - - - - - - - -Income tax receivable - - - - - - - - - -Other assets 1.55% 1.26% 3.74% 3.60% 3.45% 3.30% 3.15% 3.04% 2.94% 2.87%
TOTAL ASSETS 223.02% 230.84% 247.02% 242.71% 242.70% 242.32% 242.74% 245.45% 249.01% 253.41%LIABILITIESCurrent Liabilities:
Short-term debt 1.08% 7.93% 8.45% 8.12% 7.98% 7.84% 7.71% 7.66% 7.67% 7.72%Accounts payable 2.19% 2.25% 2.14% 2.11% 2.11% 2.11% 2.11% 2.11% 2.11% 2.11%Income taxes payable 0.34% 0.13% 1.05% 0.40% 0.44% 0.46% 0.48% 0.50% 0.50% 0.51%Accrued compensation 6.75% 6.20% 5.99% 6.06% 5.28% 5.22% 5.56% 6.30% 5.79% 5.23%Other current liabilities 31.67% 31.55% 32.95% 29.36% 29.36% 29.36% 29.36% 29.36% 29.36% 29.36%
Total current liabilities 42.02% 48.05% 50.58% 46.06% 45.17% 45.00% 45.23% 45.94% 45.44% 44.94%Long-term debt 43.28% 43.65% 49.71% 46.66% 45.58% 44.55% 43.58% 43.00% 42.72% 42.63%Income taxes payable 3.93% 3.82% 1.88% 2.77% 3.02% 3.15% 3.31% 3.41% 3.46% 3.50%Deferred revenue 9.89% 10.90% 12.83% 11.21% 11.21% 11.21% 11.21% 11.21% 11.21% 11.21%Other long-term liabilities 2.64% 2.26% 2.34% 2.25% 2.16% 2.06% 1.97% 1.90% 1.84% 1.79%
TOTAL LIABILITIES 102.82% 109.38% 117.91% 109.51% 107.69% 106.53% 105.84% 105.99% 105.21% 104.61%EQUITYMinority interest - - - - - - - - - -Common stock & additional paid-in capital 88.85% 88.67% 90.39% 89.67% 86.99% 83.19% 79.45% 76.54% 74.21% 72.21%Retained earnings (accumulated deficit) 29.89% 32.64% 39.39% 44.16% 48.63% 53.19% 58.01% 63.46% 70.11% 77.09%Accumulated other comprehensive income (loss) 1.44% 0.12% -0.66% -0.64% -0.61% -0.58% -0.56% -0.54% -0.52% -0.51%
Total Cisco Systems, Inc. shareholders' equity 120.18% 121.43% 129.12% 133.20% 135.01% 135.80% 136.90% 139.46% 143.80% 148.80%Noncontrolling interests 0.01% 0.02% 0.00% 0.00% 0.00% 0.00% 0.00% 0.00% 0.00% 0.00%
TOTAL EQUITY 120.19% 121.45% 129.11% 133.20% 135.01% 135.80% 136.90% 139.46% 143.80% 148.79%TOTAL LIABILITIES & EQUITY 223.02% 230.84% 247.02% 242.71% 242.70% 242.32% 242.74% 245.45% 249.01% 253.41%

CISCO (CSCO)Common Size Income StatementIn MillionsFiscal Years Ending July 30th 2014 2015 2016 2017E 2018E 2019E 2020E 2021E 2022E 2023CVREVENUESRevenue - product 77% 77% 76% 75% 74% 73% 71% 70% 70% 69%Revenue - service 23% 23% 24% 25% 26% 27% 29% 30% 30% 31%
Total revenue 100% 100% 100% 100% 100% 100% 100% 100% 100% 100%COSTS AND EXPENSESCost of sales - product 36.52% 34.26% 32.24% 33.80% 33.80% 33.80% 33.80% 33.80% 33.80% 33.80%Depreciation and Amortization 5.16% 4.97% 4.37% 4.18% 4.09% 4.09% 4.08% 4.12% 4.14% 4.16%Cost of sales - service 34.02% 35.96% 34.40% 34.66% 34.66% 34.66% 34.66% 34.66% 34.66% 34.66%
Total cost of sales 41.09% 39.62% 37.13% 38.20% 38.12% 38.12% 38.13% 38.17% 38.20% 38.22%Gross Margin 58.91% 60.38% 62.87% 61.80% 61.88% 61.88% 61.87% 61.83% 61.80% 61.78%OPERATING EXPENSESResearch & development expenses 13.35% 12.63% 12.78% 12.71% 12.56% 12.40% 12.23% 12.16% 12.17% 12.23%Sales & marketing expenses 20.16% 19.98% 19.53% 19.35% 19.07% 18.77% 18.45% 18.29% 18.25% 18.28%General & administrative expenses 4.10% 4.15% 3.68% 3.91% 3.74% 3.58% 3.42% 3.29% 3.19% 3.11%Amortization of purchased intangible assets 0.58% 0.73% 0.62% 1.43% 1.10% 0.89% 0.47% 0.22% 0.10% 0.10%Restructuring & other charges 0.89% 0.98% 0.54% 1.37% 0.56% 0.54% 0.51% 0.49% 0.48% 0.47%
Total operating expenses 39.08% 38.47% 37.16% 38.76% 37.03% 36.18% 35.08% 34.46% 34.20% 34.18%Operating Income (Loss) 19.82% 21.91% 25.71% 23.04% 24.85% 25.71% 26.80% 27.37% 27.60% 27.60%Interest income 1.47% 1.56% 2.04% 2.24% 2.47% 2.68% 2.89% 3.12% 3.38% 3.66%Interest expense -1.20% -1.15% -1.37% -1.81% -1.69% -1.65% -1.61% -1.58% -1.57% -1.57%Other income (loss), net 0.52% 0.46% -0.14% 0.17% 0.17% 0.17% 0.17% 0.17% 0.17% 0.17%
Interest & other income (loss), net 0.78% 0.88% 0.53% 0.61% 0.95% 1.21% 1.46% 1.71% 1.98% 2.26%Income (Loss) Before Provision for (Benefit From) Income Taxes 20.61% 22.78% 26.24% 23.65% 25.80% 26.92% 28.25% 29.09% 29.58% 29.86%Provision for (benefit from) income taxes 3.95% 4.52% 4.43% 4.62% 5.04% 5.26% 5.52% 5.69% 5.78% 5.84%NET INCOME (LOSS) 16.66% 18.27% 21.81% 19.02% 20.76% 21.65% 22.73% 23.40% 23.80% 24.02%

CISCO (CSCO)Discounted Cash Flow (DCF) and Economic Profit (EP) Valuation Models
Key Inputs: CV Growth 2.61% CV ROIC 315.63% WACC 9.73% Cost of Equity 11.10%
Fiscal Years Ending July 30th 2017E 2018E 2019E 2020E 2021E 2022E 2023CV
DCF ModelNOPLAT 8294 9116 9900 10862 11522 11970 12283ROIC 389.66% 262.69% 258.84% 279.09% 307.41% 351.20% 315.63%Beginning Invested Capital 2128 3470 3825 3892 3748 3408 3892Ending Invested Capital 3470 3825 3892 3748 3408 3892 4459CAPEX (change in invested capital) 1342 354 67 -144 -340 483 567Free Cash Flow 6952 8762 9832 11005 11861 11487 11715Continuing Value 171141
Cash Flow to Discount 6952 8762 9832 11005 11861 11487 171141Periods to Discount 1 2 3 4 5 6 6PV of Cash Flows 6335 7277 7442 7592 7457 6582 98055
Value of Operating Assets 140740Add: Excess Cash 2374Add: ST Investments 58125Less: ST Debt -4160Less: LT Debt -24483Less: PV Operating Leases -1045Less: PV of ESOP -337Value of Equity 171214Shares Outstanding 5029Intrinsic Value of Cisco Stock $34.05
EP ModelNOPLAT 8294 9116 9900 10862 11522 11970 12283Beginning Invested Capital 2128 3470 3825 3892 3748 3408 3892Ending Invested Capital 3470 3825 3892 3748 3408 3892 4459ROIC 389.66% 262.69% 258.84% 279.09% 307.41% 351.20% 315.63%Economic Profit 8086 8779 9528 10483 11157 11639 11904Continuing Value 167250Periods to Discount 1 2 3 4 5 6 6Cash Flow to Discount 8086 8779 9528 10483 11157 11639 167250PV of Cash Flows 7370 7291 7212 7232 7014 6668 95825
PV of Economic Profit 138612Add: Beginning Invested Capital 2128Value of Operating Assets 140740Add: Excess Cash 2374Add: ST Investments 58125Less: ST Debt -4160Less: LT Debt -24483Less: PV Operating Leases -1045Less: PV of ESOP -337Value of Equity 171214Shares Outstanding 5029Intrinsic Value of Cisco Stock $34.05
Today 11/14/2016Next FYE 7/31/2017Last FYE 7/31/2016Days in FY 365 Days to FYE 106 Elapsed Fraction 0.290Adjusted Stock Price $ 34.82

CISCO (CSCO)Dividend Discount Model (DDM) or Fundamental P/E Valuation Model
Fiscal Years Ending July 30th 2017E 2018E 2019E 2020E 2021E 2022E 2023CV
EPS 1.94$ 2.22$ 2.45$ 2.72$ 2.94$ 3.11$ 3.25$ Growth -8.11% 14.64% 10.15% 11.13% 7.93% 5.85% 4.59%
Key Assumptions
CV growth 2.61% CV ROE 16.15% Cost of Equity 11.10%
Future Cash Flows
P/E Multiple (CV Year) 9.88 EPS (CV Year) 3.25$ Future Stock Price 32.11$ Dividends Per Share 0.94 1.10 1.24 1.40 1.52 1.52 1.58 Discount Period 1 2 3 4 5 6 6
Discounted Cash Flows 0.85 0.89 0.90 0.92 0.90 0.81 17.08
Intrinsic Value 22.35$ Price Adjustment 22.86$

CISCO (CSCO)Relative Valuation Models
EPS EPS Est. 5yrTicker Company Price 2017E 2018E P/E 17 P/E 18 EPS gr. PEG 17 PEG 18NOK Nokia $4.31 $0.206 $0.305 20.9 14.1 11% 192.12 129.76 MSI Motorola Solutions $80.60 $4.605 $5.039 17.5 16.0 6% 273.91 250.32 PANW Palo Alto Networks $156.45 $2.807 $3.790 55.7 41.3 21% 265.41 196.57 JNPR Juniper Networks $25.96 $1.958 $2.144 13.3 12.1 12% 106.58 97.33 FFIV F5 Networks $141.95 $7.514 $7.935 18.9 17.9 13% 149.93 141.98
Average 17.6 15.0 197.6 163.2
CSCO CISCO (CSCO) $31.37 $1.94 $2.22 16.2 14.1 0.1 186.9 163.0
Implied Value: Relative P/E (EPS16) $ 34.21 Relative P/E (EPS17) 33.41$ PEG Ratio (EPS16) 33.17$ PEG Ratio (EPS17) 31.40$

CISCO (CSCO)Weighted Average Cost of Capital (WACC) Estimation
Cost of Equity (re) Total Firm ValueRisk-free rate (30 yr Treasury bond) 2.52% Market Value of Equity 157759.73Risk Premium 6.26% Book Value of Debt 29688Beta 1.371 Total Firm Value 187447.892Cost of Equity (re) 11.10%
Cost of Debt (rd) MiscellaneousCisco 24 yr Bond YTM 3.775% Weight of Equity 84.16%Marginal Tax Rate 19.55% Weight of Debt 15.84%After-Tax Cost of Debt (rd) 3.04% Marginal Tax Rate 19.55%
Total EquityNumber of Shares Outstanding 5029 Weighted Average Cost of Capital 9.73%Price per Share 31.37$ Market Value of Equity 157760
Total DebtLT Debt 24483ST Debt 4160PV Operating Leases 1045Book Value of Debt 29688

CISCO (CSCO)Key Management RatiosFiscal Years Ending July 30th 2014 2015 2016 2017E 2018E 2019E 2020E 2021E 2022E 2023CV
Liquidity Ratios
Current Ratio (Current Assets/Current Liabilities) 3.39 3.23 3.16 3.47 3.60 3.66 3.70 3.75 3.90 4.07Quick Ratio (Current Assets - Inventories)/Current Liabilities 3.31 3.16 3.11 3.40 3.53 3.59 3.64 3.68 3.84 4.01Operating CF Ratio (Operating CF/Current Liabilities) 0.62 0.53 0.54 0.46 0.55 0.59 0.62 0.63 0.61 0.62Cash Ratio (Cash + Marketable Securities)/Current Liabilities 2.63 2.56 2.64 2.91 3.03 3.09 3.14 3.19 3.34 3.50
Activity or Asset-Management Ratios
Product Inventory Turnover (COGS/Average Inventory) 8.61 8.04 8.45 9.32 8.42 8.42 8.41 8.39 8.38 8.37Receivable Turnover (Total Revenue/Accounts Receivable) 9.14 9.20 8.42 9.30 9.30 9.30 9.30 9.30 9.30 9.30Total Asset Turnover (Total Revenue/Average Total Assets) 0.46 0.45 0.42 0.42 0.42 0.42 0.42 0.42 0.41 0.40
Financial Leverage Ratios
Debt-to-Equity Ratio (Total Liabilities/Total Shareholders Equity) 85.55% 90.06% 91.32% 82.22% 79.77% 78.45% 77.31% 76.00% 73.17% 70.31%Debt Ratio (Total Liabilities/Total Assets) 46.11% 47.39% 47.73% 45.12% 44.37% 43.96% 43.60% 43.18% 42.25% 41.28%Equity Ratio (Total Shareholders Equity/Total Assets) 53.89% 52.61% 52.27% 54.88% 55.63% 56.04% 56.40% 56.82% 57.75% 58.72%Interest Coverage Ratio (Operating Income/Interest Expense) 16.57 19.03 18.73 12.75 14.74 15.62 16.68 17.27 17.54 17.59
Profitability Ratios
Gross Margin Ratio (Total Revenue-COGS)/Total Revenue 58.91% 60.38% 62.87% 61.80% 61.88% 61.88% 61.87% 61.83% 61.80% 61.78%Operating Margin (Operating Income/Total Revenue) 19.82% 21.91% 25.71% 23.04% 24.85% 25.71% 26.80% 27.37% 27.60% 27.60%Net Profit Margin (Net Income/Total Revenue) 16.66% 18.27% 21.81% 19.02% 20.76% 21.65% 22.73% 23.40% 23.80% 24.02%Return on Assets (Net Income/Total Assets) 7.47% 7.91% 8.83% 7.84% 8.55% 8.94% 9.36% 9.53% 9.56% 9.48%Return on Equity (Net Income/Total Shareholders Equity) 13.86% 15.04% 16.89% 14.28% 15.38% 15.95% 16.60% 16.78% 16.55% 16.15%CF Margin (Net Operating CF/Total Revenue) 26.16% 25.53% 27.55% 21.28% 24.99% 26.45% 27.91% 28.78% 27.76% 27.83%
Payout Policy Ratios
Dividend Payout Ratio (Dividends per Share/EPS) 48.32% 45.71% 44.55% 48.48% 49.43% 50.64% 51.45% 51.90% 48.97% 48.69%Dividend Coverage Ratio (EPS/Dividends per Share) 2.07 2.19 2.24 2.06 2.02 1.97 1.94 1.93 2.04 2.05

Present Value of Operating Lease Obligations (2016) Present Value of Operating Lease Obligations (2015) Present Value of Operating Lease Obligations (2014) Present Value of Operating Lease Obligations (2013) Present Value of Operating Lease Obligations (2012) Present Value of Operating Lease Obligations (2011) Present Value of Operating Lease Obligations (2010) Present Value of Operating Lease Obligations (2009) Present Value of Operating Lease Obligations (2008) Present Value of Operating Lease Obligations (2007) Present Value of Operating Lease Obligations (2006)
Operating Operating Operating Operating Operating Operating Operating Operating Operating Operating OperatingFiscal Years Ending July 30th Leases Fiscal Years Ending July 30th Leases Fiscal Years Ending Leases Fiscal Years Ending Leases Fiscal Years Ending 39.12168259 Leases Fiscal Years Ending 28.78991255 Leases Fiscal Years Ending 34.09642173 Leases Fiscal Years Ending 29.98480001 Leases Fiscal Years Ending Leases Fiscal Years Ending Leases Fiscal Years Ending Leases2017 363 2016 346 2015 399 2014 367 2013 328 2012 374 2011 343 2010 345 2009 298 2008 252 2007 2332018 280 2017 254 2016 277 2015 289 2014 243 2013 259 2012 243 2011 249 2010 238 2009 204 2008 1592019 166 2018 181 2017 180 2016 150 2015 199 2014 186 2013 167 2012 177 2011 193 2010 180 2009 1212020 118 2019 99 2018 131 2017 92 2016 97 2015 153 2014 119 2013 132 2012 143 2011 156 2010 1052021 72 2020 79 2019 65 2018 68 2017 70 2016 67 2015 122 2014 103 2013 128 2012 138 2011 91Thereafter 160 Thereafter 183 Thereafter 187 Thereafter 183 Thereafter 202 Thereafter 277 Thereafter 310 Thereafter 420 Thereafter 577 Thereafter 673 Thereafter 506Total Minimum Payments 1159 Total Minimum Payments 1142 Total Minimum Payments 1239 Total Minimum Payments 1149 Total Minimum Payments 1139 Total Minimum Payments 1316 Total Minimum Payments 1304 Total Minimum Payments 1426 Total Minimum Payments 1577 Total Minimum Payments 1603 Total Minimum Payments 1215Less: Interest 114 Less: Interest 117 Less: Interest 125 Less: Interest 115 Less: Interest 121 Less: Interest 152 Less: Interest 153 Less: Interest 187 Less: Interest 233 Less: Interest 258 Less: Interest 195PV of Minimum Payments 1045 PV of Minimum Payments 1025 PV of Minimum Payments 1114 PV of Minimum Payments 1034 PV of Minimum Payments 1018 PV of Minimum Payments 1164 PV of Minimum Payments 1151 PV of Minimum Payments 1239 PV of Minimum Payments 1344 PV of Minimum Payments 1345 PV of Minimum Payments 1020
Capitalization of Operating Leases Capitalization of Operating Leases Capitalization of Operating Leases Capitalization of Operating Leases Capitalization of Operating Leases Capitalization of Operating Leases Capitalization of Operating Leases Capitalization of Operating Leases Capitalization of Operating Leases Capitalization of Operating Leases Capitalization of Operating Leases
Pre-Tax Cost of Debt 3.78% Pre-Tax Cost of Debt 3.78% Pre-Tax Cost of Debt 3.78% Pre-Tax Cost of Debt 3.78% Pre-Tax Cost of Debt 3.78% Pre-Tax Cost of Debt 3.78% Pre-Tax Cost of Debt 3.78% Pre-Tax Cost of Debt 3.78% Pre-Tax Cost of Debt 3.78% Pre-Tax Cost of Debt 3.78% Pre-Tax Cost of Debt 3.78%Number Years Implied by Year 6 Payment 2.2 Number Years Implied by Year 6 Payment 2.3 Number Years Implied by Year 6 Payment 2.9 Number Years Implied by Year 6 Payment 2.7 Number Years Implied by Year 6 2.9 Number Years Implied by Year 6 4.1 Number Years Implied by Year 6 2.5 Number Years Implied by Year 6 4.1 Number Years Implied by Year 6 4.5 Number Years Implied by Year 6 4.9 Number Years Implied by Year 6 5.6
Lease PV Lease Lease PV Lease Lease PV Lease Lease PV Lease Lease PV Lease Lease PV Lease Lease PV Lease Lease PV Lease Lease PV Lease Lease PV Lease Lease PV LeaseYear Commitment Payment Year Commitment Payment Year Commitment Payment Year Commitment Payment Year Commitment Payment Year Commitment Payment Year Commitment Payment Year Commitment Payment Year Commitment Payment Year Commitment Payment Year Commitment Payment1 363 349.8 1 346 333.4 1 399 384.5 1 367 353.6 1 328 316.1 1 374 360.4 1 343 330.5 1 345 332.5 1 298 287.2 1 252 242.8 1 233 224.52 280 260.0 2 254 235.9 2 277 257.2 2 289 268.4 2 243 225.6 2 259 240.5 2 243 225.6 2 249 231.2 2 238 221.0 2 204 189.4 2 159 147.63 166 148.5 3 181 162.0 3 180 161.1 3 150 134.2 3 199 178.1 3 186 166.4 3 167 149.4 3 177 158.4 3 193 172.7 3 180 161.1 3 121 108.34 118 101.7 4 99 85.4 4 131 113.0 4 92 79.3 4 97 83.6 4 153 131.9 4 119 102.6 4 132 113.8 4 143 123.3 4 156 134.5 4 105 90.55 72 59.8 5 79 65.6 5 65 54.0 5 68 56.5 5 70 58.2 5 67 55.7 5 122 101.4 5 103 85.6 5 128 106.4 5 138 114.7 5 91 75.66 & beyond 72 125.3 6 & beyond 79 143.0 6 & beyond 65 144.7 6 & beyond 68 142.1 6 & beyond 70 156.2 6 & beyond 67 209.5 6 & beyond 122 241.3 6 & beyond 103 317.9 6 & beyond 128 433.4 6 & beyond 138 502.1 6 & beyond 91 372.9PV of Minimum Payments 1045.2 PV of Minimum Payments 1025.3 PV of Minimum Payments 1114.4 PV of Minimum Payments 1034.1 PV of Minimum Payments 1017.8 PV of Minimum Payments 1164.4 PV of Minimum Payments 1150.9 PV of Minimum Payments 1239.4 PV of Minimum Payments 1343.9 PV of Minimum Payments 1344.6 PV of Minimum Payments 1019.5
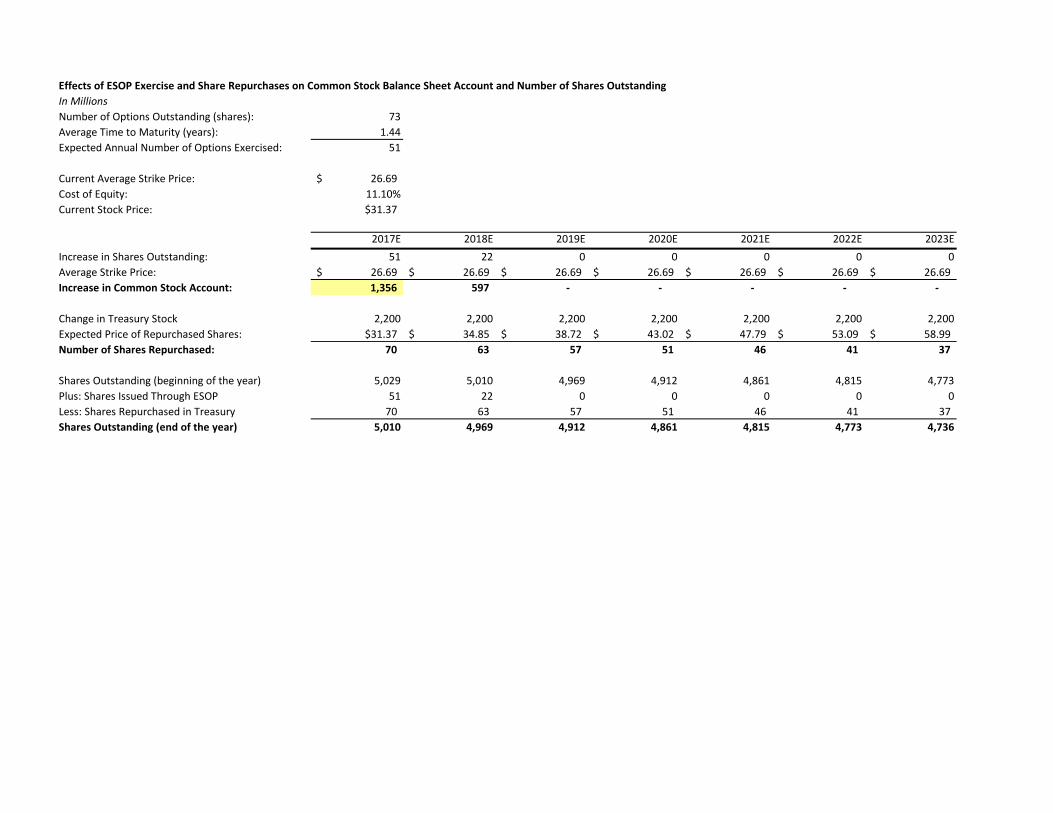
Effects of ESOP Exercise and Share Repurchases on Common Stock Balance Sheet Account and Number of Shares OutstandingIn MillionsNumber of Options Outstanding (shares): 73Average Time to Maturity (years): 1.44Expected Annual Number of Options Exercised: 51
Current Average Strike Price: 26.69$ Cost of Equity: 11.10%Current Stock Price: $31.37
2017E 2018E 2019E 2020E 2021E 2022E 2023EIncrease in Shares Outstanding: 51 22 0 0 0 0 0Average Strike Price: 26.69$ 26.69$ 26.69$ 26.69$ 26.69$ 26.69$ 26.69$ Increase in Common Stock Account: 1,356 597 - - - - -
Change in Treasury Stock 2,200 2,200 2,200 2,200 2,200 2,200 2,200Expected Price of Repurchased Shares: $31.37 34.85$ 38.72$ 43.02$ 47.79$ 53.09$ 58.99$ Number of Shares Repurchased: 70 63 57 51 46 41 37
Shares Outstanding (beginning of the year) 5,029 5,010 4,969 4,912 4,861 4,815 4,773Plus: Shares Issued Through ESOP 51 22 0 0 0 0 0Less: Shares Repurchased in Treasury 70 63 57 51 46 41 37 Shares Outstanding (end of the year) 5,010 4,969 4,912 4,861 4,815 4,773 4,736

VALUATION OF OPTIONS GRANTED IN ESOPIn Millions
Ticker Symbol CSCOCurrent Stock Price $31.37Risk Free Rate 2.52%Current Dividend Yield 3.10%Annualized St. Dev. of Stock Returns 19.52%
Average Average B-S ValueRange of Number Exercise Remaining Option of OptionsOutstanding Options of Shares Price Life (yrs) Price Granted$0.01 - 20.00 14 5.68 6.90 20.55$ 288$ $20.01 - 25.00 1 23.38 0.50 7.82$ 8$ $25.01 - 30.00 4 27.23 0.60 4.40$ 18$ $30.01 - 35.00 54 32.16 0.10 0.44$ 24$ Total 73 26.69$ 1.44 6.32$ 337$
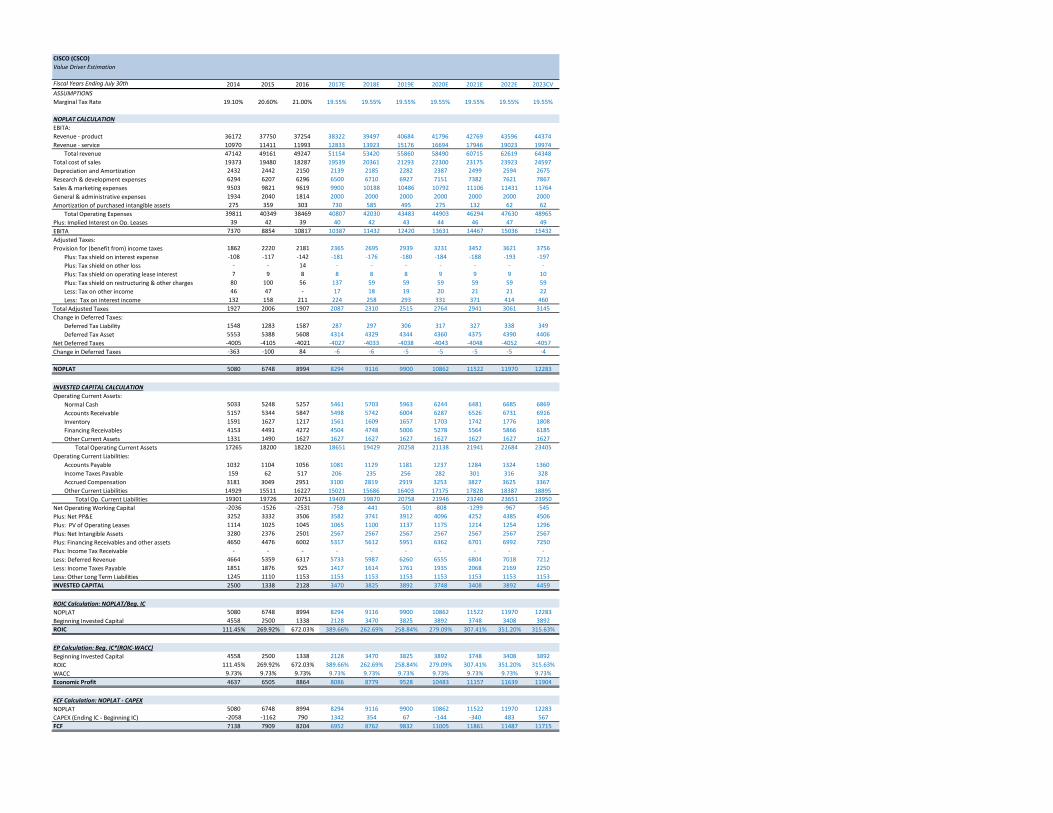
CISCO (CSCO)Value Driver Estimation
Fiscal Years Ending July 30th 2014 2015 2016 2017E 2018E 2019E 2020E 2021E 2022E 2023CVASSUMPTIONSMarginal Tax Rate 19.10% 20.60% 21.00% 19.55% 19.55% 19.55% 19.55% 19.55% 19.55% 19.55%
NOPLAT CALCULATION
EBITA:Revenue - product 36172 37750 37254 38322 39497 40684 41796 42769 43596 44374Revenue - service 10970 11411 11993 12833 13923 15176 16694 17946 19023 19974
Total revenue 47142 49161 49247 51154 53420 55860 58490 60715 62619 64348Total cost of sales 19373 19480 18287 19539 20361 21293 22300 23175 23923 24597Depreciation and Amortization 2432 2442 2150 2139 2185 2282 2387 2499 2594 2675Research & development expenses 6294 6207 6296 6500 6710 6927 7151 7382 7621 7867Sales & marketing expenses 9503 9821 9619 9900 10188 10486 10792 11106 11431 11764General & administrative expenses 1934 2040 1814 2000 2000 2000 2000 2000 2000 2000Amortization of purchased intangible assets 275 359 303 730 585 495 275 132 62 62
Total Operating Expenses 39811 40349 38469 40807 42030 43483 44903 46294 47630 48965Plus: Implied Interest on Op. Leases 39 42 39 40 42 43 44 46 47 49EBITA 7370 8854 10817 10387 11432 12420 13631 14467 15036 15432Adjusted Taxes:Provision for (benefit from) income taxes 1862 2220 2181 2365 2695 2939 3231 3452 3621 3756
Plus: Tax shield on interest expense -108 -117 -142 -181 -176 -180 -184 -188 -193 -197Plus: Tax shield on other loss - - 14 - - - - - - -Plus: Tax shield on operating lease interest 7 9 8 8 8 8 9 9 9 10Plus: Tax shield on restructuring & other charges 80 100 56 137 59 59 59 59 59 59Less: Tax on other income 46 47 - 17 18 19 20 21 21 22Less: Tax on interest income 132 158 211 224 258 293 331 371 414 460
Total Adjusted Taxes 1927 2006 1907 2087 2310 2515 2764 2941 3061 3145Change in Deferred Taxes:
Deferred Tax Liability 1548 1283 1587 287 297 306 317 327 338 349Deferred Tax Asset 5553 5388 5608 4314 4329 4344 4360 4375 4390 4406
Net Deferred Taxes -4005 -4105 -4021 -4027 -4033 -4038 -4043 -4048 -4052 -4057Change in Deferred Taxes -363 -100 84 -6 -6 -5 -5 -5 -5 -4
NOPLAT 5080 6748 8994 8294 9116 9900 10862 11522 11970 12283
INVESTED CAPITAL CALCULATION
Operating Current Assets:Normal Cash 5033 5248 5257 5461 5703 5963 6244 6481 6685 6869Accounts Receivable 5157 5344 5847 5498 5742 6004 6287 6526 6731 6916Inventory 1591 1627 1217 1561 1609 1657 1703 1742 1776 1808Financing Receivables 4153 4491 4272 4504 4748 5006 5278 5564 5866 6185Other Current Assets 1331 1490 1627 1627 1627 1627 1627 1627 1627 1627
Total Operating Current Assets 17265 18200 18220 18651 19429 20258 21138 21941 22684 23405Operating Current Liabilities:
Accounts Payable 1032 1104 1056 1081 1129 1181 1237 1284 1324 1360Income Taxes Payable 159 62 517 206 235 256 282 301 316 328Accrued Compensation 3181 3049 2951 3100 2819 2919 3253 3827 3625 3367Other Current Liabilities 14929 15511 16227 15021 15686 16403 17175 17828 18387 18895
Total Op. Current Liabilities 19301 19726 20751 19409 19870 20758 21946 23240 23651 23950Net Operating Working Capital -2036 -1526 -2531 -758 -441 -501 -808 -1299 -967 -545Plus: Net PP&E 3252 3332 3506 3582 3741 3912 4096 4252 4385 4506Plus: PV of Operating Leases 1114 1025 1045 1065 1100 1137 1175 1214 1254 1296Plus: Net Intangible Assets 3280 2376 2501 2567 2567 2567 2567 2567 2567 2567Plus: Financing Receivables and other assets 4650 4476 6002 5317 5612 5951 6362 6701 6992 7250Plus: Income Tax Receivable - - - - - - - - - -Less: Deferred Revenue 4664 5359 6317 5733 5987 6260 6555 6804 7018 7212Less: Income Taxes Payable 1851 1876 925 1417 1614 1761 1935 2068 2169 2250Less: Other Long Term Liabilities 1245 1110 1153 1153 1153 1153 1153 1153 1153 1153INVESTED CAPITAL 2500 1338 2128 3470 3825 3892 3748 3408 3892 4459
ROIC Calculation: NOPLAT/Beg. IC
NOPLAT 5080 6748 8994 8294 9116 9900 10862 11522 11970 12283Beginning Invested Capital 4558 2500 1338 2128 3470 3825 3892 3748 3408 3892ROIC 111.45% 269.92% 672.03% 389.66% 262.69% 258.84% 279.09% 307.41% 351.20% 315.63%
EP Calculation: Beg. IC*(ROIC-WACC)
Beginning Invested Capital 4558 2500 1338 2128 3470 3825 3892 3748 3408 3892ROIC 111.45% 269.92% 672.03% 389.66% 262.69% 258.84% 279.09% 307.41% 351.20% 315.63%WACC 9.73% 9.73% 9.73% 9.73% 9.73% 9.73% 9.73% 9.73% 9.73% 9.73%Economic Profit 4637 6505 8864 8086 8779 9528 10483 11157 11639 11904
FCF Calculation: NOPLAT - CAPEX
NOPLAT 5080 6748 8994 8294 9116 9900 10862 11522 11970 12283CAPEX (Ending IC - Beginning IC) -2058 -1162 790 1342 354 67 -144 -340 483 567FCF 7138 7909 8204 6952 8762 9832 11005 11861 11487 11715

Product COGS34.05$ 1.07 1.17 1.27 1.37 1.47 1.57 1.67 34.05$ 30.80% 31.80% 32.80% 33.80% 34.80% 35.80% 36.80%
5.66% 46.4243 42.8115 39.7791 37.1978 34.9743 33.0391 31.3397 1.66% 34.2101 33.4075 32.605 31.8024 30.9999 30.1974 29.39485.86% 44.9799 41.4958 38.5712 36.0815 33.9367 32.07 30.4307 1.76% 34.4404 33.6314 32.8224 32.0135 31.2045 30.3955 29.58656.06% 43.6329 40.2687 37.4445 35.0402 32.9689 31.166 29.5827 1.86% 34.6765 33.861 33.0454 32.2298 31.4143 30.5987 29.7831
Risk Premium 6.26% 42.3739 39.1217 36.3913 34.0668 32.064 30.3208 28.7899 CV Growth of NOPLAT 1.96% 34.9187 34.0964 33.2741 32.4518 31.6294 30.8071 29.98486.46% 41.1944 38.0471 35.4045 33.1546 31.2162 29.5289 28.047 2.06% 35.1673 34.338 33.5088 32.6795 31.8502 31.021 30.19176.66% 40.0873 37.0382 34.4781 32.2983 30.4202 28.7853 27.3495 2.16% 35.4224 34.586 33.7496 32.9133 32.0769 31.2405 30.40416.86% 39.046 36.0894 33.6067 31.4928 29.6714 28.0859 26.6934 2.26% 35.6844 34.8407 33.997 33.1533 32.3096 31.4659 30.6222
CV Growth of NOPLAT Beta34.05$ 2.01% 2.21% 2.41% 2.61% 2.81% 3.01% 3.21% 34.05$ 1.07 1.17 1.27 1.37 1.47 1.57 1.67
1.07% 32.8263 33.2987 33.797 34.3232 34.8799 35.4697 36.0957 2.22% 44.1354 40.5835 37.6237 35.1198 32.974 31.115 29.4892.07% 32.7392 33.2101 33.7066 34.231 34.7858 35.3736 35.9975 2.32% 43.521 40.075 37.196 34.7549 32.6593 30.8407 29.24783.07% 32.6522 33.1214 33.6162 34.1389 34.6917 35.2775 35.8993 2.42% 42.9256 39.5808 36.7793 34.3989 32.3515 30.5721 29.0114
Inventory as a % of Sales 4.07% 32.5652 33.0327 33.5259 34.0467 34.5977 35.1815 35.8011 Risk-Free Rate 2.52% 42.3483 39.1004 36.3733 34.0513 32.0506 30.3091 28.77965.07% 32.4781 32.9441 33.4355 33.9545 34.5036 35.0854 35.7028 2.62% 41.7883 38.6331 35.9775 33.7118 31.7563 30.0515 28.55226.07% 32.3911 32.8554 33.3451 33.8624 34.4095 34.9893 35.6046 2.72% 41.245 38.1785 35.5917 33.3803 31.4683 29.7991 28.32927.07% 32.304 32.7667 33.2548 33.7702 34.3155 34.8932 35.5064 2.82% 40.7174 37.7361 35.2154 33.0563 31.1865 29.5518 28.1104
Marginal Tax Rate34.05$ 16.55% 17.55% 18.55% 19.55% 20.55% 21.55% 22.55%
9.13% 37.8594 37.4745 37.0896 36.7047 36.3198 35.9349 35.54999.33% 36.8784 36.506 36.1336 35.7613 35.3889 35.0165 34.64419.53% 35.9543 35.5937 35.2331 34.8725 34.5119 34.1513 33.7907
WACC 9.73% 35.0823 34.7329 34.3834 34.0339 33.6844 33.335 32.98559.93% 34.2583 33.9193 33.5803 33.2413 32.9023 32.5633 32.2243
10.13% 33.4782 33.1492 32.8201 32.491 32.162 31.8329 31.503810.33% 32.7388 32.4192 32.0995 31.7798 31.4601 31.1404 30.8207
Beta


