
City, University of London Institutional Repository
Citation: Talas, R.H.A. (2010). The Efficient Relationship between Residual Security Risk and Security Investment for Maritime Port Facilities. (Unpublished Doctoral thesis, City University London)
This is the accepted version of the paper.
This version of the publication may differ from the final published version.
Permanent repository link: http://openaccess.city.ac.uk/8730/
Link to published version:
Copyright and reuse: City Research Online aims to make research outputs of City, University of London available to a wider audience. Copyright and Moral Rights remain with the author(s) and/or copyright holders. URLs from City Research Online may be freely distributed and linked to.
City Research Online: http://openaccess.city.ac.uk/ [email protected]
City Research Online

1
“The Efficient Relationship between Residual Security Risk and
Security Investment for Maritime Port Facilities”
Author: Risto Henrik Aleksander Talas
Submitted in pursuit of the degree of
Doctor of Philosophy
to the Faculty of Management, Cass Business School,
City University
June 2010
Re-submitted post-viva with amendments February 2011

2
Contents List of Tables ............................................................................. 5 List of Figures ............................................................................ 7 List of Charts ............................................................................. 7 Acknowledgements ...................................................................... 8 Abstract ................................................................................... 9 Keywords ................................................................................. 9 Structure of the Thesis ................................................................. 10 Chapter 1 - Introduction ............................................................... 11
1.1 Statement of the Research Problem ............................................ 11 1.2 Purpose of the Research ......................................................... 12 1.3 Rationale ......................................................................... 12 1.4 Summary of the Research ....................................................... 13
Chapter 2 - Literature Review ......................................................... 16 2.1 Port security ..................................................................... 16 2.2 Port security risk ................................................................ 18 2.3 Port security risk management .................................................. 20
2.3.1 Port security risk assessment ............................................... 20 2.3.2 Port security risk sources ................................................... 22 2.3.3 Port security risk consequences ............................................ 26 2.3.4 Port security risk drivers ................................................... 26 2.3.5 Port security vulnerability .................................................. 27 2.3.6 Port security risk mitigating strategies ..................................... 27
2.4 ISPS Code ....................................................................... 28 2.5 Maritime Transportation Security Act (MTSA) ................................ 30
2.5.1 Container Security Initiative (CSI) ........................................ 31 2.5.2 C-TPAT, Customs-Trade Partnership Against Terrorism ................ 31 2.5.3 C-TPAT and non-US Terminals ........................................... 32 2.5.4 Requirements for C-TPAT membership ................................... 32
2.6 Contemporary supply chain security initiatives ................................ 33 2.6.1 BASC, Business Alliance for Secured Commerce / (formerly: Business Anti-Smuggling Coalition) ....................................................... 33 2.6.2 PIP, Partners in Protection ................................................. 34 2.6.3 WCO Framework of Security standards to secure and facilitate global trade..................................................................................... 35 2.6.4 EU AEO, European Union Authorized Economic Operator .............. 35 2.6.5 TAPA, Transported Asset Protection Association (formerly Technology Asset Protection Association) .................................................... 36 2.6.6 StairSec ..................................................................... 37 2.6.7 Secured Export Partnership ................................................ 37 2.6.8 ISO 28000 .................................................................. 37 2.6.9 Advanced Cargo Information Requirements .............................. 40
2.7 Port Security Costs .............................................................. 45 2.8 Port Security Incident Costs .................................................... 47 2.9 Port Security Benefit-Cost Analysis ............................................ 48 2.10 Portfolio Selection Theory and Efficient Frontiers ........................... 50 2.11 Some Parallels between Portfolio Theory and Port Security Investment .... 51

3
Chapter 3 - Research Methodology ................................................... 53 3.1 Research Design ................................................................. 53
3.1.1 Epistemological and Ontological Considerations ......................... 54 3.2 Main Research Question ........................................................ 54 3.3 Units of Analysis: Representativeness .......................................... 61 3.4 Research Reliability and Construct Validity ................................... 62 3.5 Research Protocol ............................................................... 62 3.6 Ethics ............................................................................ 65
Chapter 4- Port Security Risk: A Model and its Application in Portfolio Analysis . 66 4.1 Constructing the Port Security Risk Model .................................... 66
4.1.1. Modelling Terrorism Risk Using the Poisson Distribution .............. 67 4.2 Portfolio Optimization Analysis of Port Facilities’ Security Systems ........ 71
4.2.1. Portfolio Optimization ..................................................... 71 4.2.2. The Application of Markowitz Portfolio Selection Theory .............. 72
Chapter 5 – Findings ................................................................... 80 5.1 Estimates for Physical Loss and Business Interruption from the Prescribed Security Incidents ................................................................... 81 5.2 Port Facility A ................................................................... 85 5.3 Port Facility B ................................................................... 89 5.4 Port facility C .................................................................... 93 5.5 Port facility D ................................................................... 97 5.6 Port facility E ................................................................... 101 5.7 Port Facility F .................................................................. 105 5.8 Findings Summary ............................................................. 109
5.8.1 Mean and Standard Deviation of the Security Systems .................. 109 5.8.2 Security Benefit-Cost Ratios .............................................. 109 5.8.3 Residual Risk / Expected Loss Ratios .................................... 110 5.8.4 Residual Security Risk Ex-ante and Ex-post Markowitz Portfolio Analysis.................................................................................... 111
5.9 Portfolio Optimization ......................................................... 112 5.9.1 Port Facility A ............................................................. 113 5.9.2 Port Facility B ............................................................. 114 5.9.3 Port Facility C ............................................................. 115 5.9.4 Port Facility D ............................................................. 117 5.9.5 Port Facility E ............................................................. 119 5.9.6 Port Facility F.............................................................. 121
5.10 Sensitivity Analysis ........................................................... 123 5.10.1 Sensitivity Analysis Methodology ....................................... 123 5.10.2 Sensitivity Analysis Results ............................................. 125 5.10.3 Sensitivity Analysis Discussion ......................................... 128
5.11 Results of the Portfolio Optimization ........................................ 130 5.11.1 Reducing Residual Security Risk ........................................ 130 5.11.2 Reducing Security Investment ........................................... 130 5.11.3 Reducing both Residual Security Risk and Security Investment ....... 131
5.12 Explanation for Clustering Effect ............................................ 131 5.13 Results of the Reliability Test using Cronbach’s Alpha ..................... 133
Chapter 6 – Discussion ............................................................... 135

4
6.1 Overview of the Research Findings ........................................... 135 6.2 Research Findings – Links to the Literature ................................... 136
6.2.1 Security Investment ....................................................... 136 6.2.2 Security Incident Costs .................................................... 136 6.2.3 Port Security Risk Sources ................................................ 136 6.2.4 Port Security Benefit-Cost Analysis ...................................... 136
6.3 Markowitz Portfolio Selection Approach ..................................... 137 6.4 Portfolio Optimization Approach .............................................. 137 6.5 A Comparison of the Markowitz Method and Portfolio Optimization ....... 139 6.6 Contribution .................................................................... 140 6.7 Areas for Further Research .................................................... 141
Chapter 7 - Conclusion ............................................................... 142 References ............................................................................. 145 Appendix A – ISPS Code Port Facility Security Equipment Checklist ............. 154 Appendix B - Copy of Confidential Questionnaire on Port Security ............... 166 Appendix C – Port Facilities’ Security Costs ........................................ 175 Appendix D – List of Possible Portfolio Combinations ............................. 194 Appendix E - Transcript of interview with Russell Kennedy at Lloyd’s of London, 23 April 2009. ............................................................................ 239 Appendix F – Attacks on Port Facilities 1968-2007 ................................. 242 Appendix G – Kolmogorov-Smirnov One Sided Test Critical Values Table ....... 250 Appendix H – Sensitivity Analysis Simulations: Cost Reduction and Performance Enhancement of Port Security Systems .............................................. 251
5
List of Tables Table 2.1 – Major hazard analysis tools (source: Bichou, 2009) Table 2.2 – Example Maritime Attack Characteristics (source: Parfomak and Fritelli, 2007) Table 2.3 – Summary of OECD and USCG estimates of ISPS cost compliance for ports in US$million (source: Bichou, 2004) Table 2.4 – Average port security investment and running costs in a study of 27 EU Member States (source: Dekker and Stevens, 2007) Table 2.5 – Costs of various terrorist attack scenarios (source: Farrow and Shapiro, 2009) Table 3.1 – Interview document for CSO interviews (one per port facility)
Table 4.1 – Number of worldwide maritime terrorist attacks in ports: years 1968-2007
Table 4.2 – Probabilities of a given number of attacks in a year in the maritime domain calculated using the Poisson distribution, the actual number of attacks and the expected number of attacks.
Table 4.3 – Results of the one-sample Kolmogorov-Smirnov test from SPSS
Table 4.4 – Port security simulation: estimates of the performance of the security systems
Table 4.5 – Port security simulation: estimates of the correlations of the performance of the security systems
Table 5.1 – Estimated physical loss arising from a bomb introduced by foot Table 5.2 – Estimated physical loss arising from a car bomb Table 5.3 – Estimated physical loss arising from a truck bomb Table 5.4 – Estimated loss arising from a biological agent attack on the terminal on foot Table 5.5 – Estimated loss arising from a biological agent attack on the terminal by car Table 5.6 –Port facility A estimates of physical damage, business interruption and gross expected loss Table 5.7 – Port facility A security system performances, including means and standard deviations Table 5.8 – Port facility A residual security risk calculations Table 5.9 – Port facility A security system performance correlations Table 5.10 – Port facility B estimates of physical damage, business interruption and gross expected loss Table 5.11 – Port facility B security system performances, including means and standard deviations Table 5.12 – Port facility B residual security risk calculations Table 5.13 – Port facility B security system performance correlations Table 5.14 – Port facility C estimates of physical damage, business interruption and gross expected loss Table 5.15 – Port facility C security system performances, including means and standard deviations

6
Table 5.16 – Port facility C residual security risk calculations Table 5.17 – Port facility C security system performance correlations Table 5.18 – Port facility D estimates of physical damage, business interruption and gross expected loss Table 5.19 – Port facility D security system performances, including means and standard deviations Table 5.20 – Port facility D residual security risk calculations Table 5.21 – Port facility D security system performance correlations Table 5.22 – Port facility E estimates of physical damage, business interruption and gross expected loss Table 5.23 – Port facility E security system performances, including means and standard deviations Table 5.24 –Port facility E residual security risk calculations Table 5.25 – Port facility E security system performance correlations Table 5.26 – Port facility F estimates of physical damage, business interruption and gross expected loss Table 5.27 – Port facility F security system performances, including means and standard deviations Table 5.28 –Port F residual security risk calculations Table 5.29 – Port F security system performance correlations Table 5.30 – Summary of the Port Facilities’Security Systems’ Performances Table 5.31 – Port Facilities’ Security Benefit-cost Ratios Table 5.32 – Port Facilities’ Residual Risk : Expected Loss Ratios by per type of Security Incident Table 5.33 – Summary of Ex-ante and Ex-post Markowitz Portfolio Analysis Table 5.34 - Optimal Security System Portfolio for Port Facility A Table 5.35 –Optimal and Alternative Security System Portfolios for Port Facility B Table 5.36 - Optimum and Alternative Security System Portfolios for Port Facility C (Residual Risk Reduction) Table 5.37 – Optimum and Alternative Security System Portfolios (Security Investment Reduction) for Port Facility C Table 5.38 - Optimum and Alternative Security System Portfolios (Residual Risk Reduction) for Port Facility D Table 5.39 - Optimum and Alternative Security System Portfolios for (Security Investment Reduction) Port Facility D Table 5.40 - Optimum and Alternative Security System Portfolios (Residual Risk Reduction) for Port Facility E Table 5.41 - Optimum and Alternative Security System Portfolios (Security Investment Reduction) for Port Facility E Table 5.42 - Optimum and Alternative Security System Portfolios (Residual Risk Reduction) for Port Facility F Table 5.43 - Optimum and Alternative Security System Portfolios (Security Investment Reduction) for Port Facility F Table 5.44 – Port Facility A – additional alternative portfolios ex-post the simulations Table 5.45 – Port Facility B – additional alternative portfolios ex-post the simulations Table 5.46 – Port Facility C – additional alternative portfolios ex-post the simulations Table 5.47 – Port Facility D – additional alternative portfolios ex-post the simulations Table 5.48 – Port Facility E – additional alternative portfolios ex-post the simulations Table 5.49 – Port Facility F – additional alternative portfolios ex-post the simulations

7
Table 5.50 – Cluster Analysis of Alternative Portfolios where the Security Investment is $2,946,831 or greater. Table 5.51 – Subjective assessments of Security system performance provided by the second CSO when re-interviewed on 21 October 2009 for Port Facility E and Port Facility F Table 5.52 – Correlations of security system performances for Port facility E and Port F used for calculating Cronbach’s Alpha
List of Figures Figure 2.1: ISO 28000 security management system (source: ISO 28000) Figure 5.1: Venn Diagram of Optimum Portfolios for Reduction of both Security Investment and Residual Security Risk
List of Charts Chart 4.1 – Port security simulation: the expected return – standard deviation efficient frontier for the performance of the security systems Chart 5.1 – Markowitz expected return-standard deviation efficient frontier for Port
Facility A
Chart 5.2 – Markowitz expected return-standard deviation efficient frontier for Port
Facility B
Chart 5.3 - Markowitz expected return-standard deviation efficient frontier for Port
Facility C
Chart 5.4 - Markowitz expected return-standard deviation efficient frontier for Port
Facility D
Chart 5.5 - Markowitz expected return-standard deviation efficient frontier for Port
Facility E
Chart 5.6 - Markowitz expected return-standard deviation efficient frontier for Port
Facility F
Chart 5.7: Optimum Portfolio Analysis: Port Facility A
Chart 5.8: Optimum Portfolio Analysis: Port facility B
Chart 5.9: Optimum Portfolio Analysis: Port Facility C
Chart 5.10: Optimum Portfolio Analysis: Port Facility D
Chart 5.11: Optimum Portfolio Analysis: Port facility E
Chart 5.12: Optimum Portfolio Analysis: Port Facility F
Chart 5.13 – Optimum Portfolio Analysis (Port Facility A) ex-post the sensitivity
analysis

8
Chart 6.1: An illustration of the residual security risk – security investment efficient frontier
Acknowledgements
I would like to thank my supervisors, Professor David Menachof and Professor
Mohan Sodhi for their kind patience and excellent guidance throughout this journey.
Specifically, I gratefully acknowledge Professor Sodhi’s original suggestion of
applying Markowitz (1952) theory of portfolio selection to the field of port security. I
would also like to thank Cass Business School for providing me with a bursary for the
three years of study. However, I reserve my deepest thanks for my wife Lindsay,
without whom the transition from Lloyd’s underwriter to academic would not have
been possible.
9
Abstract The research employs an adaptive cross-disciplinary research strategy in an industrial
example to address port facilities’ inability to assess whether their security systems
are efficient. The research combines a twin-pronged approach of first, adapting
Markowitz (1952) theory of portfolio selection from the field of finance to maritime
port security to examine each port facility’s security systems as a portfolio; and
secondly, through portfolio optimization to construct the optimum theoretical
portfolio of security systems drawn from a number of different port facilities owned
by Dubai Ports World. The research builds on the existing literature and proposes
new definitions of security, port security, port security risk and port security risk
management. The research also develops a model of port security risk based on
Willis et al’s (2005) definition of terrorist risk. Furthermore, the research builds on
the work of Gleason (1980) and examines terrorist attacks on ports and on shipping in
ports between 1968 and 2007 and shows, using the Kolmogorov-Smirnov test, that
they follow a Poisson distribution. The contribution which the research makes is in
terms of adapting Markowitz (1952) theory to the port security environment; and the
modelling and measurement of the impact of the introduction of new port security
technology, changes in background port security threat levels and for the planning of
port security in Greenfield sites. Furthermore, the adaptive approach of the research
is generalisable to all nodes in the supply chain and is not limited to port facilities
alone.
Keywords
Security; port security; port security risk; port security risk management; terrorism;
efficient frontier; portfolio selection theory; portfolio analysis; ISPS Code; port
facility security officer; company security officer; benefit-cost analysis; residual
security risk; expected loss.

10
Structure of the Thesis
The thesis consists of seven chapters and is structured as follows. Chapter one begins
with an introduction which contains a statement of the research problem; the purpose
and rationale behind the research; and a summary of the research. Chapter two
contains a review of the literature and is focused on port security; port security risk;
port security risk management; contemporary port security initiatives and their costs;
and portfolio theory. Chapter three describes the research strategy; and the research
design and methodology. Chapter four describes the model of port security risk and
shows how portfolio optimization and the application of Markowitz theory of
portfolio selection can be applied to port facilities’ security systems. Chapter five sets
out the empirical findings based on the theoretical models advanced in chapter four.
Chapter six contains the discussion and describes the contribution and the scope for
further research. Finally, the conclusion follows in chapter seven.

11
Chapter 1 - Introduction
1.1 Statement of the Research Problem Port facilities around the world have been subjected to international port facility and
supply chain security initiatives in the wake of the 11 September 2001 (9/11) attacks
on New York and Washington. These initiatives include, among others, the
International Maritime Organisation’s International Ship and Port Facility Security
(ISPS) Code, the United States’ Container Security Initiative (CSI) and the Customs-
Trade Partnership Against Terrorism (C-TPAT) Initiative (Peck, 2006; Bichou, 2004;
Barnes & Oloruntoba, 2005; Price, 2004; Raymond, 2006; Stasinopoulos, 2003). This
has resulted in significant investment in security systems by companies in the supply
chain (Bichou, 2004; Farrow & Shapiro, 2009) and in port facilities in particular
(Dekker & Stevens, 2007).
According to Sheffi (2001), companies in the supply chain must determine how to
balance the costs and benefits of security needs and how to do so in the most efficient
manner. Closs and McGarrell (2004) state that enhanced supply chain security is
expected with no increase in cost. According to Haubrich (2006), the substantial
investments in security made by democracies around the world after 9/11 merit closer
scrutiny given that efficiency is an increasingly important criterion by which the
success of public policy is being judged. The predominant security initiative which
internationally trading port facilities have been subjected to is the ISPS Code, which
was introduced into European Union legislation in the form of EC Regulation
725/2004 (Dekker & Stevens, 2007; Anyanova, 2007). U.S. implementation of the
ISPS Code was accomplished through the Maritime Transportation Security Act
(MTSA) 2002 (Helmick, 2008). The main provisions of the ISPS Code came into
force on 1 July 2004, eighteen months after the ISPS Code was introduced by the
IMO’s Diplomatic Conference of 12-14 December 2002 by amending the
International Convention on the Saving of Life at Sea (SOLAS) 1974 by the addition
of a new chapter XI-2. The speed with which the port and maritime security
initiatives came into force means that it is unlikely that the ports industry were able to
evaluate the benefit-costs of the various industry security solutions on offer or the
amended working practices which needed to be adopted in order to comply with the

12
provisions of the ISPS Code. Therefore, the problem which the research aims to
address is the determination by ISPS Code compliant port facilities of whether they
have been able to discover the efficient relationship between security and cost.
1.2 Purpose of the Research The purpose of the research is to discover the efficient relationship between residual
security risk and security investment for maritime port facilities. No new theory will
be generated but the research undergoes an adaptive cross-disciplinary research
approach to generate the Markowitz risk-return efficient frontier which is
generalisable to all nodes in the supply chain, not limited to maritime port facilities.
1.3 Rationale According to Stock (1997, p515), “much of logistics research has its roots in theories
borrowed from more established disciplines.” Stock (1997, p524) identifies
Markowitz theory of portfolio selection as one which could be applied to logistics
applications which include budgeting, company performance and logistics decision
making. Goankar & Viswanadham (2004) have successfully adopted Markowitz
theory to supply chain research for the purpose of managing a portfolio of suppliers,
though their strategic level deviation management model does not extend to matters of
security. The research aims to extend this cross-disciplinary research by
incorporating port facilities’ security performance and investments as inputs to the
Markowitz theory.
The research addresses part of Juttner et al’s (2003, p208) agenda for future research
in supply chain risk management by defining the risk concept and mitigating risks for
the supply chain, specifically with an emphasis on port security.
Williams et al (2008, p255) highlight the gaps in academic knowledge of supply chain
security (SCS), in particular they refer to the lack of quantitative research in the field.
Finally, Helmick (2008) concludes that much work remains to be done to create a
framework for maritime security research that is truly risk-based and that effectively
engages stakeholders.

13
1.4 Summary of the Research The research proposes to solve the problem of the inability of port facilities to assess
whether they have discovered the efficient relationship between port security residual
risk and security investment following the introduction of the ISPS Code in the wake
of the 11th September 2001 terrorist attacks on New York and Washington. The
research employs an adaptive cross-disciplinary research strategy in an industrial
example to examine the phenomenon of security in the maritime port facility
environment, framed in Juttner et al’s (2003) model of supply chain risk management.
The literature review begins by examining the origins of security and proposes new
definitions for security, port security and port security risk before conducting a review
of the literature on port security risk management; port security investments; port
security incident costs; and benefit-cost analysis.
The literature on port security risk management prompts a further investigation of risk
assessment; risk sources; risk consequences; and risk drivers. The review of port
security risk mitigating strategies introduces the key security initiatives: the ISPS
Code and the MTSA and includes other global and local relevant contemporary
security initiatives. The literature review concludes with an examination of portfolio
selection theory and efficient frontiers and draws some parallels between portfolio
theory and port security investment.
The research design describes how the main research question is broken down into
two questions which prompt a further five questions. The main research question is:
how can ISPS Code compliant port facilities discover the efficient relationship
between residual security risk and security investment? In order to tackle the main
research question, it is necessary to discover first, what is meant by an ISPS Code
compliant port facility and secondly, to assess how the efficient relationship between
residual security risk and security investment can be calculated. While the first part
involves an examination of the regulatory requirements of the ISPS Code, the second
part is addressed by asking a further five questions:
1) What are the security threats to the port facility and what are their
probabilities?
2) What are the estimated gross losses to the port facility following each
prescribed security threat?
3) What do the security systems consist of in each port facility?
14
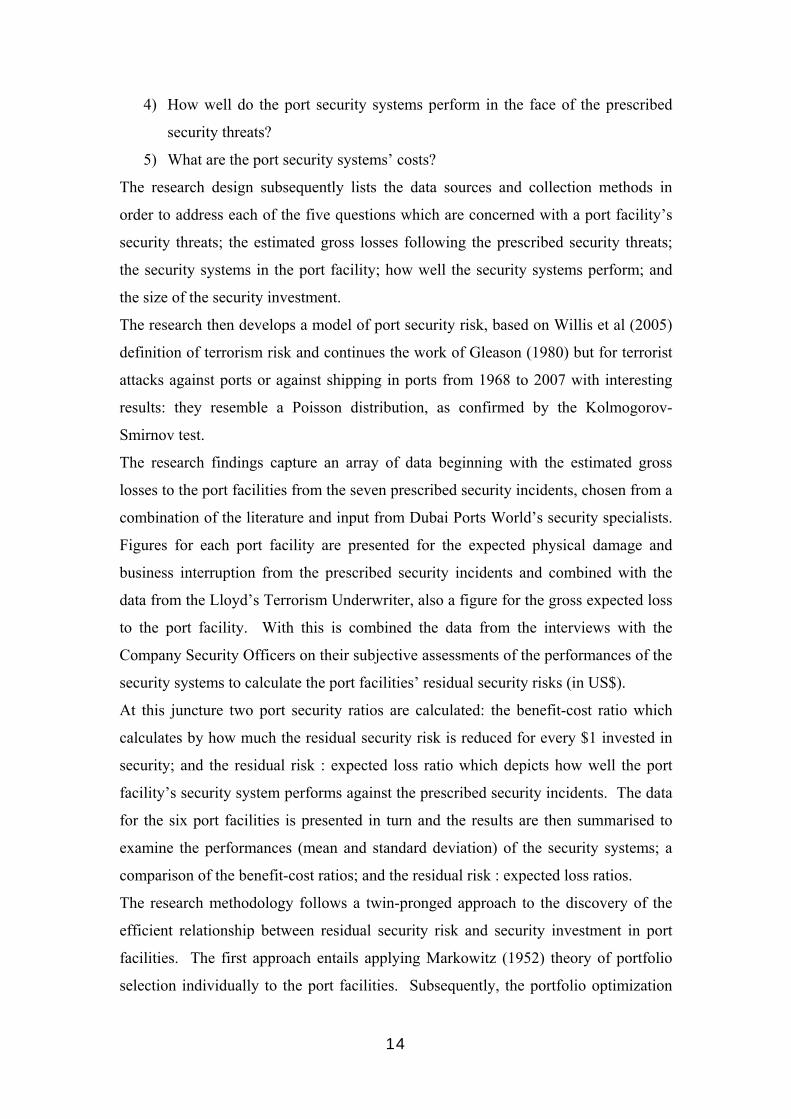
4) How well do the port security systems perform in the face of the prescribed
security threats?
5) What are the port security systems’ costs?
The research design subsequently lists the data sources and collection methods in
order to address each of the five questions which are concerned with a port facility’s
security threats; the estimated gross losses following the prescribed security threats;
the security systems in the port facility; how well the security systems perform; and
the size of the security investment.
The research then develops a model of port security risk, based on Willis et al (2005)
definition of terrorism risk and continues the work of Gleason (1980) but for terrorist
attacks against ports or against shipping in ports from 1968 to 2007 with interesting
results: they resemble a Poisson distribution, as confirmed by the Kolmogorov-
Smirnov test.
The research findings capture an array of data beginning with the estimated gross
losses to the port facilities from the seven prescribed security incidents, chosen from a
combination of the literature and input from Dubai Ports World’s security specialists.
Figures for each port facility are presented for the expected physical damage and
business interruption from the prescribed security incidents and combined with the
data from the Lloyd’s Terrorism Underwriter, also a figure for the gross expected loss
to the port facility. With this is combined the data from the interviews with the
Company Security Officers on their subjective assessments of the performances of the
security systems to calculate the port facilities’ residual security risks (in US$).
At this juncture two port security ratios are calculated: the benefit-cost ratio which
calculates by how much the residual security risk is reduced for every $1 invested in
security; and the residual risk : expected loss ratio which depicts how well the port
facility’s security system performs against the prescribed security incidents. The data
for the six port facilities is presented in turn and the results are then summarised to
examine the performances (mean and standard deviation) of the security systems; a
comparison of the benefit-cost ratios; and the residual risk : expected loss ratios.
The research methodology follows a twin-pronged approach to the discovery of the
efficient relationship between residual security risk and security investment in port
facilities. The first approach entails applying Markowitz (1952) theory of portfolio
selection individually to the port facilities. Subsequently, the portfolio optimization

15
approach employs an analysis of the performances of the 216 possible different
combinations of the three security systems across the six port facilities.
The application of the Markowitz (1952) approach shows how, for each port facility’s
portfolio of security systems, the expected performance-standard deviation efficient
frontier can be constructed and when combined with the model for port security risk,
can be used to reduce residual risk efficiently. The portfolio optimization approach is
also used to generate a solution to the relationship between residual security risk and
security investment. Subsequently, a comparison is made of how effective the two
approaches are in reducing port security risk, with some interesting results.
The main limitation in the research is that the prescribed security incidents are limited
to acts of terrorism owing to constraints on the type of data available from the Lloyd’s
Insurance Market.
The contribution of the research is four-fold. First, the research adapts Markowitz
theory from the field of finance to the field of port security. Secondly, the methods
can be employed in the development of Greenfield sites to guide a Company Security
Officer to implement a security system which best suits his/her requirements in terms
of both residual security risk and security investment and to do so efficiently.
Thirdly, the proposed introduction of new port security technology with an enhanced
performance in an existing port facility can be modelled to learn the extent to which
the residual security risk might be reduced, for a new given level of security
investment. Fourthly, a change in the background security threat to a port facility can
be quantified in terms of a change to the residual security risk.
The research was conducted over a period of three years and involved making four
visits to the offices of Dubai Ports World in Jebel Ali, UAE. The first three visits
were essential in laying the groundwork for the final visit when much of the
subjective data was collected. The security sensitive nature of much of the data
collected has resulted in the need to cloak the data and the results in this research.

16
Chapter 2 - Literature Review
The literature review begins by tracing the origin of security and proposing a new
definition of port security. The concepts of port security risk and port security risk
management are then developed and subsequently framed in Juttner et al’s (2003)
model of supply chain risk management with a discussion on port security risk
sources, risk consequences, risk drivers and risk mitigating strategies. The discussion
addresses some of the threats that ports face and their potential consequences
followed by an overview of contemporary maritime and supply chain security
initiatives with a discussion of the ISPS Code and the U.S. Maritime Transportation
Security Act (MTSA). Next, the literature review addresses the costs of
implementing the ISPS Code, the costs of potential port security incidents and
techniques for carrying out port security benefit-cost analysis. The literature review
concludes with a discussion of portfolio selection theory and draws some parallels
between port security investment and portfolio investment.
2.1 Port security
In trying to arrive at a definition of port security it is suitable to begin with some
origins of the term ‘security’ from the social science literature. The definition of
security is then considered in the context of the supply chain security literature and is
subsequently refined in order to arrive at a suitable definition of port security.
Maslow (1942) describes security as a “feeling of safety; rare feelings of threat or
danger”. Maslow (1942) includes security as a basic human need, together with
safety, in his hierarchy of needs model. Baldwin (2005) defines security as ‘the
absence of threat’ and Buzan (1991, p19) includes such definitions as ‘relative
freedom from harmful threats’ and ‘absence of threats to acquired values’.
Williams et al (2008, p258) describe how the origin of security stems from individual
level theories in sociology and psychology. Fischer and Green (2004, p21) state that
security “implies a stable, relatively predictable environment in which an individual
or group may pursue its ends without disruption or harm and without fear or
disturbance or inquiry.” Robinson’s (2008, p188) definition of security is that it
17
“implies freedom from threat” and “one’s desire not merely to be free from threat but
to feel free.”
Combining Maslow (1942), Baldwin (2005), Buzan (1991) and Robinson (2008),
security can be defined as the absence of and/or the perception of the absence of
threat. Thus an individual who is surrounded by threats but has taken steps to reduce
the threats may feel secure. Conversely, an individual who does not feel secure but
who is not surrounded by any threats is in effect secure. This concept is important
because different individuals (with the appropriate security knowledge and
experience) when questioned about the security of a port facility, may have differing
views in terms of their own perceptions as to both the threats that the port facility
faces and how effectively existing security measures address the threats.
Here it is also important to distinguish between security and security measures:
security measures are the measures (personnel, procedures and technology) required
to achieve the absence of and/or the perception of the absence of threat.
Given that ports are considered to be nodes in a supply chain network (Yap & Lam,
2004), it is necessary when developing the definition of port security to examine the
literature on supply chain security (SCS).
Williams et al (2008, p256) state that few formal definitions can be found in the
literature and draw their definition of SCS from Closs and McGarrell’s (2004, p8)
definition of SCS management. The Closs and McGarrell (2004, p8) definition is:
“the application of policies, procedures and technology to protect supply chain assets
(product, facilities, equipment, information and personnel) from theft, damage, or
terrorism and to prevent the introduction of unauthorised contraband, people or
weapons of mass destruction (WMD) into the supply chain.” In pursuit of a definition
of port security it would be easy simply to substitute ‘port’ for ‘supply chain’.
However, this would not distinguish between port security and port security
management, in the way that Williams et at (2008) do not distinguish between SCS
and SCS management. Furthermore, this would limit the definition simply to the
port’s assets and exclude cargoes and, specifically, the ship-port interface which the
ISPS Code seeks to protect. Also, the Closs and McGarrell (2004) definition is in
some ways too specific in its reference to terrorism and weapons of mass destruction
given that by naming threats they run the risk of excluding others such as sabotage or
criminal damage arising from strikes and riots by locked out workers (see Miller,
1994, p452 for a fuller description of named threats to ports covered by marine

18
insurance). The ISPS Code does not single out terrorism as a threat per se but refers
to measures which provide protection from security incidents (which include
terrorism), while the MTSA refers specifically to the threat of terrorism in the
maritime domain. This is understandable given that the MTSA was drafted in the
United States in the wake of the attacks on 9/11. However, the MTSA focus on
terrorism also potentially excludes other forms of unauthorised acts such as maritime
fraud, which is included in Regulation (EC) No. 725/2004. Furthermore, the focus on
WMD appears to be centred more on the United States, specifically in consideration
of containerised trade (Harrald et al, 2004; Gerencser et al, 2003).
Therefore, it would be appropriate to amend the named threats in the Closs and
McGarrell (2004) definition to ‘unauthorised acts’, which is wider in scope.
‘Unauthorised acts’ is chosen in preference to ‘illegal acts’ in order to avoid any
confusion arising from differing definitions of legality between jurisdictions.
The proposed definition for port security is: the absence of and/or the perception of
the absence of threat to port facility assets, cargoes and the ship-port interface from
unauthorised acts. From this, it follows that port security management is: the
application of measures (personnel, procedures and technology) to reduce the threat
and/or the perception of threat to port facility assets, cargoes and the ship-port
interface from unauthorised acts. The choice of words is significant for while it may
be preferable to try to eliminate threats rather than to reduce them, it will never be
possible to eliminate all security threats absolutely (Price, 2004, p335).
2.2 Port security risk As risk is present in all walks of daily life, it is logical that an extensive literature
exists on the subject. Whether considering individuals’ attitudes to risk and decision
making under uncertainty (Kahnemann and Tversky, 1979), or risk as a factor in
decision making (March and Shapira, 1987), the interpretation of risk varies from
person to person. Definitions of risk also vary according to the discipline in which the
discussion is framed, be it supply chain (Rao and Goldsby, 2009; Christopher, 2005;
Juttner et al, 2003; Zsidisin et al, 2004; Chopra and Sodhi, 2004), supply chain
security (Williams et al, 2008), port security (Bichou, 2004, 2009; Talas and
Menachof, 2009), terrorism (Sheffi, 2001; Woo, 2003; Raymond, 2006; Price, 2004,
19
Willis et al, 2005; Greenberg et al, 2006), sociology and psychology (Heimer, 1988)
or more established disciplines such as economics, finance or management (Juttner et
al, 2003). Rao and Goldsby (2009) present selected definitions of risk from the
literature including from Lowrance (1980) “risk is a measure of the probability and
severity of adverse effects” and Yates and Stone (1992) “risk is an inherently
subjective construct that deals with the possibility of loss.”
Definitions of risk relevant to this study can be found in Robinson (2008), March and
Shapira (1987), Bedford and Cooke (2001), Markowitz (1952), Broder (2006),
Greenberg et al (2006), Price (2004) and Willis et al (2005). Robinson (2008, p182)
describes risk from a security perspective as “the probability that harm may result
from a given threat.” March and Shapira (1987, p1404) review managerial
perspectives on risk and risk taking and define risk as “reflecting variation in the
distribution of possible outcomes, their likelihoods and their subjective values.”
Bedford and Cooke’s (1996) analysis of probabilistic risk analysis describes risk as
having two particular elements: hazard and uncertainty. Markowitz (1952, p89)
describes risk as “variance of return.” Broder (2006, p3) describes risk as “the
uncertainty of financial loss, the variations between actual and expected results or the
probability that a loss has occurred or will occur.” Greenberg et al (2006, p143) state
that terrorism risk “does not exist without existence of threat, the presence of
vulnerability and the potential for consequences.” Price (2004, p335) claims that
ports (in the context of terrorism) are actually faced with uncertainty, not risk because
uncertainty implies that while the range of events is known, the associated
probabilities of each type of event are not. To an insurance underwriter, risk can
represent not only the vessel, aircraft or property under consideration for insurance
(Broder, 2006, p3) but also the product of the probability of the occurrence of an
insured event and the financial consequences of such an event. Willis et al (2005)
describe terrorism risk as consisting of the product of threat, vulnerability and
consequence: where threat is the probability that an attack occurs; vulnerability is the
probability that an attack results in damage, given that an attack has occurred; and
consequence is the expected damage, given that an attack has occurred which resulted
in damage. Drawing on this definition and the definitions by Robinson (2008),
Broder (2006) and Bedford and Cooke (2001), the proposed definition for port
security risk is: the product of the probability of a threat to port facility assets, cargoes

20
and the ship-port interface which may give rise to a loss and the size of the financial
consequences that might follow.
2.3 Port security risk management Williams et al (2008) present a comprehensive overview and research agenda for
supply chain security. They categorise the literature into four organisational
approaches to supply chain security: an intra-organisational approach, an inter-
organisational approach, a combination of the two and an ignore approach. In the
intra-organisational approach they discuss the security processes and technology used
by companies to secure their supply chains and the scope for adopting a total quality
management (TQM) or Six Sigma philosophy. The inter-organisational approach is
focussed on organisational relationships with other supply chain members, public
entities and competitors and some key contemporary supply chain security initiatives
are listed. Furthermore, they propose an update to the Juttner et al (2003) model for
supply chain risk management by adding an additional dimension to supply chain risk
mitigating strategies which includes three of the above approaches (intra-
organisational, inter-organisational and combination) to supply chain security. As
this research is chiefly concerned with ports which have adopted the risk mitigating
strategies as set out in the ISPS Code, it is also appropriate to frame the discussion on
port security risk in Juttner et al’s (2003) original four constructs of supply chain risk
management: supply chain risk sources, risk consequences, risk drivers and risk
mitigating strategies. However, the discussion begins by considering some
methodologies for port security risk assessment.
2.3.1 Port security risk assessment Bichou (2009, p116) describes the process of risk assessment as “the assessment of
risk in terms of what can go wrong, the probability of it going wrong and the possible
consequences.” Drawing on the system safety literature he states that “the empiricist
approach is to regard accidents as random events whose frequency is influenced by
certain factors” and that under this approach the cause of an accident is a hazardous
event. Bichou (2009, p117) classifies the major hazard analysis tools as either

21
sequence dependent or independent and following either consequence or cause
analysis (see table 2.1).
Consequence analysis Cause analysis
Sequence dependent Event Tree Analysis Markov Process
Sequence independent Failure Modes and Effects
Analysis
Fault Tree Analysis
Table 2.1 – Major hazard analysis tools (source: Bichou, 2009)
Event tree analysis (ETA) and Failure Modes and Effects Analysis (FMEA) are two
forms of hazard analysis which analyse the consequences of an event, whereas Fault
Tree Analysis (FTA) and the Markov process analyse the causes of an event. Pyzdek
(2003) describes FTA as providing a graphical representation of the events that might
lead to failure. According to Bichou (2009), a shortcoming of FTA is the
assumption that the sequence of causes of an incident is not relevant and that “where
sequence does matter, Markov-chain techniques may be applied.”
Bichou and Evans (2007) describe how precursor analysis combined with other
techniques such as near-misses and probabilistic risk analysis provide an effective
framework for risk assessment and risk management in the context of maritime
security. They define ‘precursor’ as “any internal or external condition, event,
sequence, or any combination of these that precedes and ultimately leads to adverse
events.” Bichou and Evans (2007) argue that the benefits from introducing
programmes of security assessment based on precursor analysis include the
identification of previously unknown failure modes (for FMEA analysis) and the
analysis of the effectiveness of actions taken to reduce risk.
In addition to the risk assessment tools described by Bichou (2009), other industry-
specific methods exist in the security field. One seaport-specific method of risk
assessment can be found in the Navigation and Vessel Inspection Circular (NVIC)
No. 11-02 dated 13 January 2003 issued by the United States Coast Guard. Enclosure
5 (Guidance on Assessing Facility Security Measures) includes a simplified risk-
based security assessment methodology which seaports can conduct themselves in
pursuit of their compliance with the requirements of the United States Maritime
Transportation Security Act (2002).
22
Another industry-specific document which contains a methodology on risk assessment
is the International Standard ISO 28001 (2007) “Security management systems for the
supply chain — Best practices for implementing supply chain security, assessments
and plans — Requirements and guidance.”
Talas and Menachof (2009) developed a conceptual model for calculating a port
facility’s residual security risk. The conceptual model examines the following
characteristics:
the security threats that the port facility faces and their probabilities
an estimate of the economic damage to the port facility from each prescribed
security threat
the port facility’s security components and systems and their performance in
the face of the potential security incidents
the port facility’s security components’ costs.
Merrick and van Dorp (2006) describe a methodology for risk assessment in the
maritime domain by developing a probabilistic risk framework for modelling
collisions between a ferry and another vessel. In their model, the probability of a
collision depends on triggering incidents and other criteria such as situation and the
probability of the incident occurring given the situation. Merrick and van Dorp
(2006) state that to perform an assessment of the risk of an accident using the model,
each term in the probability model must be estimated. However, the complexity of
the data which must be captured in order for the model to work may to be beyond the
bounds of even the most experienced insurance underwriter and port security
specialist.
2.3.2 Port security risk sources Juttner et al (2003) describe supply chain risk sources as environmental (accidents,
socio-political actions such as terrorism), organisational (labour, production
uncertainties or IT-system uncertainties) or network-related (risks arising from
interactions from companies within the supply chain.)

23
Environmental risk sources
The environmental risks that ports face include but are not limited to acts of terrorism.
While the focus on terrorism appears to be uppermost in the literature, there are
limited references to such attacks being directed at port facilities. Examples found in
the literature include the incident in April 1996 when the Tamil Tigers launched an
attack on the port of Colombo and succeeded in damaging three vessels(Aryasinha,
2001), including one belonging to the Van Ommeren shipping line which was insured
by the author; in 2004 Jamaat al-Tawhid attacked the Khawr Al Amaya and Al Basrah
oil facilities in Iraq and in the same year suicide bombers from Hamas and the al-Aqsa
Martyr’s Brigade launched an attack in the Port of Ashdod (Greenberg et al, 2006).
However, this gap in the literature on terrorist attacks against ports is addressed in
some additional research which builds on Gleason’s (1980) research on terrorist
attacks against targets in the United States and is described in more detail in chapter
four. Nevertheless, ports also face threats of unlawful entry and activity by thieves,
smugglers and potential stowaways as well as individuals bent on destruction or the
interruption of international trade on political or ideological grounds.
Prior to 9/11 the main threats to ports were considered to be from drug smuggling and
organised crime. These threats resulted in the creation in the United States of the
Business Anti-Smuggling Coalition (BASC), which has now been superceded by the
Business Alliance for Secured Commerce, a security initiative initially aimed at
reducing the risk of legitimate cargo being used by illegal organizations for the
narcotics trade (Gutierrez et al, 2007). Nevertheless, the potential for terrorist attacks
to disrupt ports and supply chains dominates the literature post-9/11. According to
Raymond (2006, p242) ports are vulnerable to attack by terrorists: they are extensive
in size and accessible by water and land. Furthermore, their accessibility impedes the
deployment of the types of security measures that, for example, can be more readily
deployed at airports. Bichou (2004) highlights the additional security threats that
ports face due to their “close spatial interactions with large city-agglomerations and
seashore tourist attractions.” Table 2.2 lists examples of potential attack
characteristics against US maritime targets (Parfomak and Fritelli, 2007).

24
Dimensions Example Characteristics
Perpetrators • Al Qaeda and affiliates• Islamist unaffiliated • Foreign nationalists • Disgruntled employees • Others
Objectives • Mass casualties• Port facility Disruption • Trade disruption • Environmental damage
Locations • 360+ U.S. ports• 165 foreign trade partners • 9 key shipping bottlenecks
Targets • Military vessels• Cargo vessels • Fuel tankers • Ferries / cruise ships • Port facility Area populations • Ship channels • Port industrial plants • Offshore platforms
Tactics • Explosives in suicide boats• Explosives in light aircraft • Ramming with vessels • Ship-launched missiles • Harbor mines • Underwater swimmers • Unmanned submarine bombs • Exploding fuel tankers • Explosives in cargo ships • WMDs in cargo ships
Table 2.2 – Example Maritime Attack Characteristics (source: Parfomak and Fritelli, 2007)
According to Nincic (2005, p623), the Sri Lankan Liberation Tigers of Tamil Eelam
(LTTE), Hizballah, the Popular Front for the Liberation of Palestine, the Abu Sayyaf
Group, Gama al-Islamiya, the Moro Islamic Liberation Front and the IRA are all
believed to have varying levels of maritime expertise. According to Raymond (2006,
p240), the terrorist groups that are known to have a maritime capability include
“Polisario, the Abu Sayyaf Group, Palestinian groups, Al Qaeda, the Moro Islamic
Liberation Front and the Liberation Tigers of Tamil Eelam.” However, Raymond
(2006, p244) points out that “in order to be considered a threat, it is not necessary for
a terrorist group to have already carried out a maritime terrorist attack against
shipping or port facilities.”

25
With the potential for maritime terrorists to deploy a mothership with tenders, their
geographic reach is, in theory, considerably extended from their homelands’ territorial
waters. Somali pirates are reported to use this mode of transport to attack ships
hundreds of miles offshore1 and the Mumbai bombers are rumoured to have arrived
in Mumbai via inflatable boats from a highjacked fishing vessel, which was later
found adrift with the body of a man onboard. 2
Organisational risk sources
Organisational risk sources in port security stem chiefly from the security labour force
and the operational aspects of security systems, including IT-systems. Examples of
labour force risks include security guard manpower shortfalls and security guard
violations. Security guard violations cover not only on-site breaches in working
practices but include the unauthorised copying, lending or sale of security passes.
According to Raymond (2006, p243), seafarer certificates can easily be forged and
identity documents can be bought on the black market so it must follow that this can
be done onshore as well. Operational aspects of security systems include failure by
the security workforce to adhere to security procedures, failure of CCTV camera
units, intruder detection devices, scanning equipment or any IT security system.
Network-related risks
Juttner et al (2003) describe network-related risk sources as those “which arise from
interactions between organisations in the supply chain.” Network-related security
risks which ports face are those which had their origins in supply chain interactions
and can result from the failure of any company’s security systems or the exploitation
of a security weakness. For example, in the containerised trade, the possibility of the
introduction of a chemical, nuclear, biological or radiological (CNBR) device which
is detonated in a port will have considerable consequences for the port facility As well
as cause severe supply chain interruption. In the port security war game Gerencser et
al (2003) showed that a dirty bomb, a conventional explosive device used to scatter
nuclear or radiological material, found at the port of Los Angeles followed by the 1 “Piracy off the Somali Coast: Workshop commissioned by the Special Representative of the Secretary General of the United Nations to Somalia”, p19, Nairobi, 10-21 November 2008. Accessed 3/08/2009 at http://www.imcsnet.org/imcs/docs/somalia_piracy_intl_experts_report_consolidated.pdf 2 Greenberg, M. 1/12/2008 “The Terror Attacks in Mumbai: Background, Operational Uniqueness and Implications”, International Institute for Counter-Terrorism http://www.ict.org.il/NewsCommentaries/Commentaries/tabid/69/Articlsid/538/currentpage/3/Default.aspx

26
discovery of another shipped through the port of Savannah could ultimately lead to
supply chain interruptions and stock market falls which could cause up to $68 billion
in direct and indirect losses.
Other network-related risks include the use of the containerised trade to transport
stowaways or even terrorists through ports and across national boundaries, as in the
case of the suspected member of al-Qa’eda found on the quay in an Italian port in a
container converted into a mobile hotel room (Raymond, 2006, p246; OECD, 2003).
2.3.3 Port security risk consequences The consequences of port security risk events are typically negative and can be
classified as direct or indirect losses. Direct losses include physical damage to port
infrastructure. The disruption of port facility Activities resulting from direct losses
will invariably lead to indirect losses such as business interruption through supply
chain shocks, increased insurance costs and increased cost of working through the
implementation of a tougher security regime which restricts cargo movements through
the port. Details of empirical studies of port security risk consequences can be found
later in this chapter under the section ‘Port Security Incident Costs.’
2.3.4 Port security risk drivers Juttner et al (2003, p205) describe how supply chain risk drivers “impact directly on
network-related risk sources.” Supply chain risk drivers such as globalisation of
supply chains and the trend to outsourcing have their equivalents in their effect on
network-related security risks. The globalisation of terrorist and criminal networks
and the trend to outsourcing security in the supply chain act as potential port security
risk drivers. Miller and Talas (2007) state that there are approximately twenty
terrorist groups that have aligned themselves to al-Qaeda, signing up to Osama bin
Laden’s fatwa of November 2000 and in effect globalising bin Laden’s terrorist
organisation. In particular, the outsourcing of security in the supply chain can lead to
a lack of transparency of implemented security measures and with it confidence in the
third party provider of security. Security initiatives such as the ISPS Code and ISO
28000 are designed to counter this type of port security risk driver by introducing a
given set of minimum security standards in a transparent manner. The importance of

27
identifying port security risk drivers becomes clear in the examination of port security
vulnerability.
2.3.5 Port security vulnerability Juttner et al (2003) describe supply chain vulnerability as “the propensity of risk
sources and risk drivers to outweigh risk mitigating strategies, thus causing adverse
supply chain consequences.” Translating this to port security, a description of port
security vulnerability can be the propensity of port security risk sources and risk
drivers to outweigh port security risk mitigating strategies, thus causing adverse
security events. Broder (2006) defines vulnerability as “the probability of failure and
the probability of occurrence after countermeasures are implemented. It measures the
likelihood of threat and its ability to cause damage.” Willis et al (2005) describe
vulnerability in terrorist context as the probability of an attack resulting in damage
given that an attack occurs.
Considering the earlier proposed definition of port security risk, port security
vulnerability can thus be defined as the product of the probability of a security event
and the inability of a port’s security systems to prevent the occurrence of the event.
This definition is important because it forms one of the key parts of the methodology
for the calculation of a port facility’s residual security risk.
2.3.6 Port security risk mitigating strategies Pinto and Talley (2006, p268) describe the security incident cycle of ports in four
phases: prevention, detection, response and recovery. They describe prevention as
barriers that deny terror plans and events; detection provides early apprehension;
response pursues as event and mitigates its impact; and recovery involves the return to
normal operations. The port security risk mitigating strategies in this research are
concerned with the first two phases as described by Pinto and Talley (2006).
There are two key port security risk mitigating strategies which were introduced after
9/11. The main one is the ISPS Code introduced by the IMO at the Diplomatic
Conference in December 2002. The other is the Maritime Transportation Security Act
which was passed by the US Congress in November 2002 and relates to US port
facilities, or facilities in US parlance. According to Bichou (2004, p323), the ISPS
Code is “the most important global security initiative ever.” The European Union

28
equivalent of the ISPS Code is Regulation (EC) No. 725/2004, which is largely a
word-for-word reproduction of the ISPS Code. In the next section the key points of
the ISPS Code and the MTSA are addressed and there follows a brief summary of
other key supply chain security initiatives which also have a bearing on port security.
2.4 ISPS Code The ISPS Code was drawn up by the IMO’s Maritime Safety Committee and its
Maritime Security Working Group in little over a year following the adoption of
resolution A.924(22) on the review of measures and procedures to prevent acts of
terrorism which threaten the security of passengers and crews and the safety of ships,
in November 2001 (ISPS Code, 2003, p iii.) The ISPS Code was adopted on 12
December 2002 by the Conference of Contracting Governments to the International
Convention for the Safety of Life at Sea (SOLAS) 1974 when the existing chapter XI
was amended and re-identified as chapter XI-1 and a new chapter XI-2 was adopted
on special measures to enhance maritime security. Amendments were also made to
the existing SOLAS chapter V.
The ISPS Code is divided into two parts, A and B. Part A establishes the new
international framework of measures to enhance maritime security by introducing
mandatory provisions while part B provides non-compulsory guidance on the
procedures to be undertaken in order to comply with the provisions of chapter XI-2
and of Part A of the ISPS Code (Bichou, 2004.) Certain countries, such as the
European Union under EC Regulation 725/2004, have made compliance with part B
of the ISPS Code mandatory through legislation (Dekker & Stevens, 2007; Anyanova,
2007).
The objectives of the ISPS Code are to enable the prevention and detection of security
threats within an international framework; to establish roles and responsibilities; to
enable the collection and exchange of security information; to provide a methodology
for assessing security and to ensure that adequate security measures are in place. The
objectives are to be achieved by the designation of appropriate personnel on each
ship, in each port facility and in each shipping company, to prepare and to put into
effect the approved security plans.

29
The ISPS Code is applicable to vessels engaged in international trade including
passenger vessels with 12 or more berths, cargo vessels of 500 gross tonnes and over,
mobile offshore drilling units and all port facilities serving such vessels engaged in
international trade.
The ISPS Code definition of responsibilities determines the responsibilities of
Contracting Governments, ship operators and port facility operators. Contracting
Governments must identify the Designated Authority (for port facilities), set security
levels, coordinate with port facility security officers and issue and inspect
International Ship Security Certificates.
In turn, ship and port facility operators must designate the appropriate security
officers and develop and implement the security plans. In addition, each Contracting
Government (or a Recognised Security Organisation appointed by the Designated
Authority) must carry out a Port Facility Security Assessment (PFSA) which will
include the following elements (ISPS Code Part A.15.5):
Identification and evaluation of important assets and infrastructure it is
important to protect;
Identification of possible threats to the assets and infrastructure and likelihood
of their occurrence, in order to establish and prioritise security measures;
Identification, selection and prioritisation of countermeasures and procedural
changes and their level of effectiveness in reducing vulnerability; and
Identification of weaknesses, including human factors, in the infrastructure,
policies and procedures.
Each Contracting Government (or Recognised Security Organisation appointed by the
Designated Authority) must then prepare a port facility security plan (PFSP) which
addresses at least the security measures listed in ISPS Code Part A.16.3.
Against the background of the security measures described above, all port facilities
and the relevant vessel types must also operate at one of three security levels,
determined by their Contracting Government. Security level 1 is the level for which
minimum appropriate protective security measures shall be maintained at all times.
The following security-related activities in a port facility are mandated by the ISPS
Code (Part A.14) at security level 1:
Ensuring the performance of all port facility security duties

30
Controlling access to the port facility
Monitoring of the port facility, including anchoring and berthing areas
Monitoring restricted access areas to ensure that only authorised persons have
access
Supervising the handling of cargo
Supervising the handling of ship’s stores
Ensuring that security communication is readily available
At security level 2 additional protective measures, as detailed in the PFSP shall be
implemented and maintained for a period of time as a result of a heightened risk of a
security incident.
At security level 3 further specific protective measures, as detailed in the PFSP shall
be implemented and maintained for a limited period of time when a security incident
is probable or imminent, although it may not be possible to identify the specific target
(Jones, 2006, p128).
Following the approval of the PFSA and the PFSP, including any amendments, the
Statement of Compliance of a Port Facility is then issued by the Contracting
Government (ISPS Code, B.16.54) for a period not exceeding five years.
2.5 Maritime Transportation Security Act (MTSA)
The MTSA is the US equivalent of the ISPS Code and in common with its
international counterpart was implemented on 1 July 2004. It shares many
commonalities with the ISPS Code but goes much deeper into specific requirements
of securing the US maritime infrastructure (Jones, 2006, p99). The MTSA prescribes
the formation of a national maritime security plan and advisory committee; area
maritime transportation security plans and committees; vessel and (port) facility
security plans; security incident response plans; the appointment and training of
security personnel; and the development of specific sanctions against those who fail
correctly to implement the Act. In line with the ISPS Code, the MTSA also
establishes the three levels of security. Furthermore, the MTSA introduces additional
security initiatives, the most significant of which are the Container Security Initiative
(CSI) and the Customs-Trade Partnership Against Terrorsm (C-TPAT).
31
2.5.1 Container Security Initiative (CSI) The Container Security Initiative was launched in 2002 with 20 of the world’s largest
container terminals and forms part of the US Maritime Transportation Security Act.
By June 2003, 23 ports representing at least 60% of container imports to the United
States had signed CSI agreements. In 2006, 43 ports with approximately 75% of
cargo containers destined for US ports were part of the CSI scheme (Jones, 2006,
p101). By September 2007 there were 55 CSI ports worldwide and in 2009 there
were over 60 ports that were part of the scheme.
CSI addresses the threat to border security and global trade posed by the potential for
terrorist use of a maritime container to deliver a weapon. CSI proposes a security
regime to ensure all containers that pose a potential risk for terrorism are identified
and inspected at foreign ports before they are placed on vessels destined for the
United States. The United States’ Customs and Border Protection Agency (CBP) has
stationed multidisciplinary teams of U.S. officers from both CBP and Immigration
and Customs Enforcement (ICE) to work together with host foreign government
counterparts. Their mission is to target and pre-screen containers and to develop
additional investigative leads related to the terrorist threat to cargo destined to the
United States. The pre-screening of containers is assisted by the introduction in
December 2002 of the Advanced Manifest Rule, or 24 Hour Rule.
Through CSI, CBP officers work with host customs administrations to establish
security criteria for identifying high-risk containers. Those administrations use non-
intrusive inspection (NII) and radiation detection technology to screen high-risk
containers before they are shipped to US ports. CSI, a reciprocal program, offers its
participant countries the opportunity to send their customs officers to major US ports
to target ocean-going, containerized cargo to be exported to their countries. Likewise,
CBP shares information on a bilateral basis with its CSI partners. Japan and Canada
currently station their customs personnel in some US ports as part of the CSI program.
2.5.2 C-TPAT, Customs-Trade Partnership Against Terrorism3 C-TPAT is a Joint government-business initiative to build cooperative relationships
that strengthen overall supply chain and border security. Central to the security vision
of C-TPAT is the core principle of increased facilitation for legitimate business
3 URL: http://www.cbp.gov/xp/cgov/import/commercial_enforcement/ctpat/ [accessed 17 March 2009]
32
entities that are compliant traders. Only importers and carriers based in the US were
initially eligible to participate in the program and one of its main motivations is to
protect US borders from terrorist attacks occasioned by goods entering the country.
2.5.3 C-TPAT and non-US Terminals Under C-TPAT, foreign-based marine port facility authorities and terminal operators
(MPTOs) may be eligible for membership of the C-TPAT scheme but only following
an invitation from CBP to join. The terminal must handle cargo vessels departing to
the US and have a designated company officer that will be the primary cargo security
officer responsible for C-TPAT.
2.5.4 Requirements for C-TPAT membership US and Foreign-based MPTOs must conduct a comprehensive assessment of their
security practices based on C-TPAT minimum-security criteria. C-TPAT recognizes
the complexity of MPTOs and endorses the application and implementation of
security measures based upon risk. Therefore, the program allows for flexibility and
the customization of security plans based on the C-TPAT member’s business model,
the port’s geography, the commodities handled at the port facility and the terms and
conditions of the lease agreement between the marine port facility authority and the
terminal operator.
C-TPAT also recognizes the unique role and relationship between MPTOs situation
regarding terminal operators who operate as tenants within a marine port. For C-
TPAT purposes, each terminal operator must implement the C-TPAT security criteria
within the physical area and processes within the terminal operator’s area of control
and responsibility. Where a does not control a specific process or element of the
supply chain, such as a sea carrier, terminal operator or independent contractor, the
marine port facility authority should work with these business partners to seek to
ensure that pertinent security measures are in place and adhered to within the overall
port.

33
2.6 Contemporary supply chain security initiatives
The following are other contemporary supply chain security initiatives which have a
bearing on port security and will be described briefly in turn:
BASC – Business Anti-Smuggling Coalition
PIP – Partnership in Protection
WCO Framework of Standards
European Union AEO - Authorised Economic Operator
TAPA – Transported Asset Protection Association
StairSec
Secured Export Partnership
ISO 28000
Advanced Cargo Information Initiatives
2.6.1 BASC, Business Alliance for Secured Commerce / (formerly: Business Anti-Smuggling Coalition) 4 BASC is a cooperation program between the private sector and national and
international organizations, created to promote a secure global supply chain. The
main goal is to encourage within its membership the development and implementation
of voluntary steps to address the risks of narcotics and merchandise smuggling
through legitimate trade, as well as the threat of a disruption in the global economy
brought about by terrorism.
BASC procedures require a security program which consists of a number of operating
measures adopted to protect an organization, its assets, properties, employees and
customers.
Factors to consider in preparing a security program include:
Organizational security requirements
Potential of the organization to meet those requirements
The organization's vulnerability to current and future security risks
Available options to the organization to cover its security needs
4 URL: http://www.wbasco.org/english/documentos/bascstandards.pdf [accessed 17 March 2009]

34
Other important aspects that should be included in a Security Plan are:
Clear definition of security methods.
Written procedures for internal / external security notification.
Mechanisms to establish accountability in case of theft or robbery.
Handling of documents and files.
Procedures for checking lighting and perimeter fencing.
Procedures when closing facilities (doors, gates, windows, etc).
Security systems to check entry and exit of people and /or vehicles.
Procedures for handling cargo.
Defined policies for external monitoring.
Control and handling of keys and conducting periodic inventory checks.
Policies and procedures for personnel hiring.
Policies to be applied in criminal background checks.
Procedures for obtaining photographs and fingerprints of all employees.
Assignment of responsibilities of security personnel.
2.6.2 PIP, Partners in Protection5 PIP is designed to enlist the co-operation of private industry in efforts to enhance
border security, combat organized crime and terrorism, increase awareness of customs
compliance issues, and help detect and prevent contraband smuggling. This program
does not have a "certification" component as such. Companies may be refused if they
do not fulfill the requirements, but once accepted in the program they work together
with Canadian Customs to improve their supply chain security, even though they will
not get a certification as such. A PIP participant can apply for CSA (Customs Self-
Assessment program) to expedite goods into Canada.
5 URL: http://www.cbsa-asfc.gc.ca/security-securite/pip-pep/menu-eng.html [accessed 17 March 2009]
35
2.6.3 WCO Framework of Security standards to secure and facilitate global trade6 This is a framework of security standards developed by the World Customs
Organization. It intends to provide a new and consolidated platform which will
enhance world trade, ensure better security against terrorism, and increase the
contribution of Customs and trade partners to the economic and social well-being of
nations. It aims to improve the ability of customs to detect and deal with high-risk
consignments and increase efficiency in the administration of goods, thereby
expediting the clearance and release of goods. Specifically, the aims of the
Framework are the following:
• Establish standards that provide supply chain security and facilitation at a
global level to promote certainty and predictability
• Enable integrated supply chain management for all modes of transport
• Strengthen co-operation between customs administrations to improve their
capability to detect high-risk consignments
• Strengthen customs/business co-operation
• Promote the seamless movement of goods through secure international trade
supply chains
2.6.4 EU AEO, European Union Authorized Economic Operator7 This designates the status that Customs authorities from European member states
should grant to reliable traders established in the European Community. AEOs will
be able to benefit from facilitations for customs controls or simplifications for
customs rules or both, depending on the type of AEO certificate. There are three
certificate types:
Customs Simplifications. AEOs will be entitled to benefit from
simplifications provided for under the customs rules.
Security and Safety. AEOs will be entitled to benefit from facilitations of
customs controls relating to security and safety at the entry of the goods into
6 URL: http://www.wcoomd.org/home.htm [accessed 17 March 2009] 7URL: http://ec.europa.eu/taxation_customs/customs/policy_issues/customs_security/index_en.htm#auth_eco [accessed 17 March 2009]

36
the customs territory of the Community, or when the goods leave the customs
territory of the Community.
Customs Simplifications/Security and Safety. AEOs will be entitled to
benefit from both simplifications provided for under the customs rules and
from facilitations of customs controls relating to security and safety (a
combination of 1 and 2).
The main benefits of AEO status will not be realised until the requirements for pre-
arrival and pre-departure are introduced in July 2009 and the changes linked to the
Modernised Customs Code are introduced in 2010.
2.6.5 TAPA, Transported Asset Protection Association (formerly Technology Asset Protection Association8) This is an association of security professionals and related business partners from high
technology companies who have been working together to address emerging security
threats that are common to the technology industry and high-tech businesses. In
recent years TAPA has added both an Asian and an EMEA chapter to the US original.
The goals of TAPA include:
• Security of goods from theft
– in transit
– in-transit storage
– warehousing
• Specifies minimum standards for security throughout the supply chain
• Describes methods for maintaining standards
• Includes process for TAPA certification
• TAPA suppliers must:
– Have a security policy, procedures and plan
– Submit to periodic audits and certification
8 URL: http://www.tapaonline.org [accessed 17 March 2009]
37
2.6.6 StairSec9 This is a module introduced to the Swedish Customs program Stairway (originally
created to facilitate customs processes for compliant traders). This module makes it
possible to provide quality assurance for operators within the Stairway not only for
quality in their customs routines but also for the security measures they have taken to
prevent terrorists from using the operators commercial flow of goods for transporting
weapons of mass destruction.
2.6.7 Secured Export Partnership10 It is designed to protect cargo against tampering, sabotage, smuggling of terrorists or
terrorist-related goods, and other transnational crime, from the point of packing to
delivery. Exporters from New Zealand are eligible and encouraged to participate:
especially those moving goods to the US. The program emphasizes that security
measures are customizable depending on the applicant’s situation.
2.6.8 ISO 2800011 The International Standards organization has developed security standards aimed at
becoming the global supply chain security standard program. It is intended to be in
concert with and complementing the World Customs Organization’s Framework of
Security Standards and it does not attempt to cover specific Customs agency
requirements. ISO 28000 was launched in November 2005 as a publically available
specification and is now a fully-fledged ISO standard.
ISO 28000 is applicable to all sizes of organizations, from small to multinational, in
manufacturing, service, storage or transportation at any stage of the production or
supply chain that wishes to:
establish, implement, maintain and improve a security management system;
assure compliance with stated security management policy;
demonstrate such compliance to others;
9 URL: http://www.tullverket.se/en/Business/the_stairsec/ [accessed 17 March 2009] 10 URL: http://www.customs.govt.nz/exporters/Secure+Exports+Scheme.htm [accessed 17 March 2009] 11 URL: http://www.iso.org/iso/iso_catalogue/catalogue_tc/catalogue_detail.htm?csnumber=41921 [accessed 17 March 2009]

38
seek certification/registration of its security management system by an
Accredited third party Certification Body; or
make a self-determination and self-declaration of compliance with ISO 28000.
ISO 28000 is based on the format adopted by ISO 14000 owing to its risk-based
approach to management systems and is based on the Plan-Do-Check-Act
methodology:
Plan: establish the objectives and processes necessary to deliver results in
accordance with the organization’s security policy
Do: implement the processes
Check: monitor and measure processes against security policy, objectives,
targets, legal and other requirements, and report results
Act: take actions to continually improve performance of the security
management system
The supply chain security initiative “specifies the requirements for a security
management system, including those aspects critical to security assurance of the
supply chain. These aspects include, but are not limited to, financing, manufacturing,
information management and the facilities for packing, storing and transferring goods
between modes of transport facility And locations.”
ISO 28000 relies on the principle of continual improvement through management
review as shown in figure 2.1. The process begins with the setting out of the firm’s
security policy, followed by security risk assessment and planning, followed by the
implementation and operation stage with checking and corrective action leading to a
review by management and subsequent restatement of policy.

39
Figure 2.1. ISO 28000 security management system (source: ISO 28000)
The key sections in ISO 28000 are the security risk assessment process, the
operational control process and the emergency preparedness process.
The security risk assessment process set out in 4.3.1 shall “….consider the likelihood
of an event and all of its consequences which shall include physical failure threats and
risks, such as functional failure, incidental damage, malicious damage or terrorist or
criminal action….operational threats and risks etc.” The emphasis is on identifying
all of the threats to the organisation’s supply chains, not only the upstream and
downstream threats.
Section 4.4.6 ‘Operational Control’ is concerned that the organisation shall ensure that
the operations and activities listed in 4.4.6 a) to f) are carried out under specified
conditions by “evaluating any threats posed from upstream supply chain activities and
applying controls to mitigate these impacts to the organisation and other downstream
supply chain operators.”
Section 4.4.7 ‘emergency preparedness, response and security recovery’, describes
how the organisation shall “establish, implement and maintain appropriate plans and
procedures to identify the potential for, and responses to, security incidents and
emergency situations, and for preventing and mitigating the likely consequences that
can be associated with them.” The procedures are concerned with preventing and
mitigating the likely consequences from any security incidents and emergency
situations.

40
2.6.9 Advanced Cargo Information Requirements
The first mandatory advanced cargo information (ACI) requirement introduced in the
wake of September 11th was the US Customs and Border Protection Advanced
Manifest Rule, commonly known as the 24-hour Rule. The 24-hour rule requires sea
carriers and NVOCCs (Non-Vessel Operating Common Carriers) to provide the US
Customs and Border Protection Agency with detailed descriptions of the contents of
sea containers bound for the United States 24 hours before the container is loaded on
board a vessel. The rule allows US Customs officers to analyze the container content
information and identify potential terrorist threats before the US -bound container is
loaded at the foreign seaport, not after it arrives in a US port. The use of such vague
cargo descriptions as "Freight-All-Kinds", "Said-To-Contain" or "General
Merchandise," is no longer tolerated. Sea carriers and NVOCCs that violate the 24-
hour rule 2003 receive "Do-Not-Load" messages. The "Do-Not Load" message
instructs these parties not to load a specific container that has been found in violation
of the 24-hour rule. Carriers and NVOCCs that disregard these "Do Not Load"
messages (and load the cited container) are denied permission to unload this container
at any US port.
The tightened reporting requirements for containerised cargo entering the United
States as prescribed by the 24 hour rule has forced companies’ supply chains towards
greater functionality. To meet the 24 hour rule requirements, shipowners and other
NVOCCs have extended their electronic commerce technologies by developing e-
commerce portals through which their customers can communicate more easily their
shipping information and giving customers the capability to manage their shipments
by increasing visibility in their supply chains.
Since then, additional mandatory ACIs have been introduced in the United States,
Mexico, Canada, the European Union, China and Japan. They are outlined below and
the section concludes with a brief description of the United States’ intention to scan
100% of inbound containers by 2012.
Importer Security Filing “10+2 Rule”
The Importer Security Filing (ISF), commonly known as the “10+2” initiative, is a
Customs and Border Protection (CBP) regulation that requires importers and vessel

41
operating carriers to provide additional advance trade data to US CBP pursuant to
Section 203 of the SAFE Port Act of 200612. 10+2 is designed to build on the
capability of CBP’s automated targeting system (ATS) by helping to identify the
entities involved in the supply chain and their locations as well as providing more
detailed descriptions of the goods to be imported into the United States. The ten items
to be transmitted to CBP by the importer, or their authorized agents no later than 24
hours before loading at the non-US port are:
Manufacturer (or Supplier)
Seller
Buyer
Ship to Party
Container Stuffing Location
Consolidator (Stuffer)
Importer of Record/Foreign Trade Zone (FTZ) Applicant Identification
Number
Consignee Number(s)
Country of Origin
Commodity Harmonized Tariff Schedule of the United States (HTSUS)
Number
The additional two items that must be submitted by the carrier, electronically to CBP,
within 48 hours of the vessel departing from the last port, inbound US are:
Vessel Stow Plan
Container Status Messages
However, in the event of foreign cargoes remaining onboard or other transit cargoes,
only the following five items need to be transmitted 24 hours before loading in the
non-US port:
Booking Party name/address
Ship to Party
12 URL: http://www.cbp.gov/linkhandler/cgov/trade/cargo_security/carriers/security_filing/ra.ctt/ra.pdf [accessed 29 January 2010]

42
Commodity HTS-6
Foreign Port of Unlading
Place of Delivery
Mexico 24 hour rule
On 1 September 2007, Mexican Customs implemented a similar ACI system to the
United States. The information which must be transmitted to Mexican Customs at
least 24 hours before loading in the non-Mexican port is designed to be similar to that
required by CBP and is as follows13:
Name and complete address of the shipper, consignee and of the person who
shall be notified of the arrival, as stated in the bill of lading. (When the
consignee is labelled TO THE ORDER OF. the name of the Notify party must
be declared.)
Amount of the merchandise and measurement unit, if the merchandise is
carried in containers, the amount and measurement unit shall also be specified
as well for each container.
Gross weight or volume of the merchandise. If the merchandise is carried in
containers, the gross weight or volume shall be specified also for each
container.
Merchandise description, avoiding general descriptions that do not allow
proper identification of the nature of the merchandise; such as “general cargo”,
“dry cargo”, “chemicals”, “perishable items”, “bulk merchandise”, “bulk
minerals” ,“F.A.K.”.
Number, quantity and dimensions of containers.
Seal number(s) for each container. (No slashes, no hyphen, neither blank
spaces within seal number)
Type of service contracted.
In case of dangerous merchandise, state class, division and United Nations
number, as well as a telephone number for emergencies.
13 URL: http://www.hamburgsud.com/WWW/EN/Services_and_Offices/Regional_Information/Asia/Regional_Content/Microsoft_Word_-_NEW_24_HRS_REGULATION_FOR_MEXICO_sep_1_RAS.pdf [accessed 29 January 2010]
43
Canadian Advance Commercial Information
On 19 April 2004, the Canadian Border Services Agency introduced the advance
commercial information programme which is similar to the US CBP 24 hour rule.
requiring marine carriers to electronically transmit marine cargo data to the Canada
Border Services Agency (CBSA) 24 hours prior to loading cargo at a foreign port.14
European Union Pre-Arrival and Pre-Departure
As of 1 July 2009, EU authorities required importers and exporters to lodge pre-
arrival and pre-departure summary customs declarations up to 24 hours prior to
exportation or importation, depending on the method of transportation. Thus, the
European Union has become one of the few customs territories in the world requiring
not only pre-arrival declarations but also pre-departure customs declarations. The new
EU customs rules require pre-arrival and pre-departure declarations to be stored in
electronic format for at least three years. Since many multinational companies will
choose to centralise their electronic storage of these documents, they will have to
carefully evaluate the applicable EU Member State’s national legislation relating to
data protection and retention. The AEO Security and Safety Certificate and AEO
Customs and Security Certificate are aimed at lessening this burden by providing
significant benefits with regard to pre-arrival and pre-departure declarations. Non-
AEO entities have to provide pre-departure and pre-arrival declarations consisting of
additional security-related information.15
Japan Advance Cargo Information
On 1 June 2007, Japan Customs introduced their advance cargo information for both
marine and air cargoes. The required items include16:
Shipping location and destination of cargo
Marks, numbers, name and quantity of goods
Address or place of residence, name or appellation and telephone number of
consigner and consignee
14 URL: http://www.cbsa-asfc.gc.ca/prog/aci-ipec/menu-eng.html#a1 [accessed 29 January 2010] 15 URL: http://www.mwe.com/index.cfm/fuseaction/publications.nldetail/object_id/61581f82-7f64-4c88-b797-c2e63964ed1a.cfm [accessed 29 January 2010] 16 URL: http://www.customs.go.jp/english/procedures/advance2_e/index_e.htm [accessed 29 January 2010]

44
China Advance Cargo Information
From 1 January 2009, Decree No. 172 of the General Administration of Customs of
the People’s Republic of China came into force “for the purposes of regulating the
customs administration of manifests of inbound and outbound means of transport,
facilitating international trade and ensuring international trade security.” Under the
measures, operators of inbound and outbound means of transport, non-vessel
operating common carriers, freight forwarders, shipping agency companies are
obliged to submit cargo manifests to Chinese Customs 24 hours prior to the loading of
cargo.17
United States 100% Container Scanning 2012
The United States legislation “Implementing Recommendations of the 9/11
Commission Act of 2007” unilaterally introduced a 100% scanning requirement for
US-bound maritime cargo at the point of export, to be implemented by 1 July 2012.18
Pilot programmes for 100% scanning have been conducted in Southampton Container
Terminal, UK; Qasim International Container Terminal in Karachi, Pakistan; and
Cortes in the Honduras under the auspices of the Secure Freight Initiative which
derived from the Security and Accountability For Every (SAFE) Port Act of 2006.
While commentators disagree about the financial and security viability of 100%
container scanning, ports should be aware that failure to comply with the legislation
may put them at risk of being unable to export to the United States from 2012, though
the legislation does allow for a period of up to two years in which the mandatory
introduction may be delayed. Nevertheless, there is much opposition to the
introduction of the legislation, particularly from the European Union, which is
considering introducing a requirement for US ports to scan 100% of all containers
bound for Europe.
17 URL: http://english.customs.gov.cn/publish/portal191/tab3972/info162113.htm [accessed 29 January 2010] 18 URL: http://www.gao.gov/new.items/d08126t.pdf [accessed 29 January 2010]
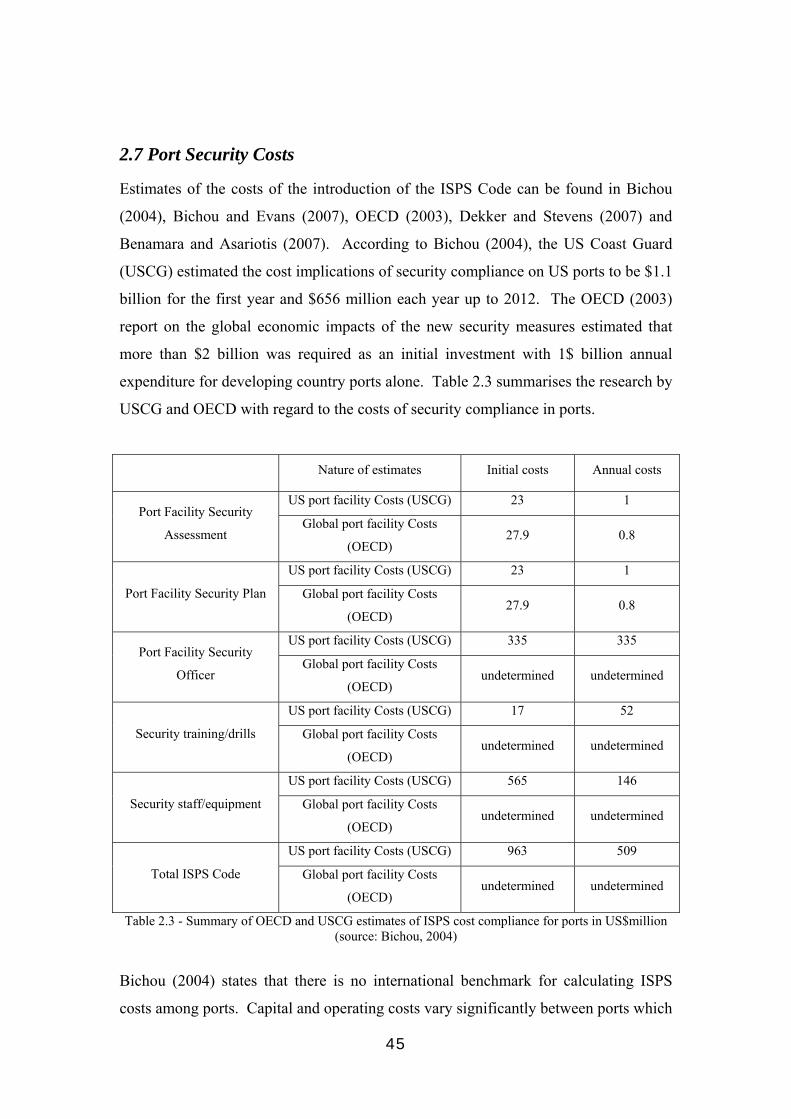
45
2.7 Port Security Costs
Estimates of the costs of the introduction of the ISPS Code can be found in Bichou
(2004), Bichou and Evans (2007), OECD (2003), Dekker and Stevens (2007) and
Benamara and Asariotis (2007). According to Bichou (2004), the US Coast Guard
(USCG) estimated the cost implications of security compliance on US ports to be $1.1
billion for the first year and $656 million each year up to 2012. The OECD (2003)
report on the global economic impacts of the new security measures estimated that
more than $2 billion was required as an initial investment with 1$ billion annual
expenditure for developing country ports alone. Table 2.3 summarises the research by
USCG and OECD with regard to the costs of security compliance in ports.
Nature of estimates Initial costs Annual costs
Port Facility Security
Assessment
US port facility Costs (USCG) 23 1
Global port facility Costs
(OECD) 27.9 0.8
Port Facility Security Plan
US port facility Costs (USCG) 23 1
Global port facility Costs
(OECD) 27.9 0.8
Port Facility Security
Officer
US port facility Costs (USCG) 335 335
Global port facility Costs
(OECD) undetermined undetermined
Security training/drills
US port facility Costs (USCG) 17 52
Global port facility Costs
(OECD) undetermined undetermined
Security staff/equipment
US port facility Costs (USCG) 565 146
Global port facility Costs
(OECD) undetermined undetermined
Total ISPS Code
US port facility Costs (USCG) 963 509
Global port facility Costs
(OECD) undetermined undetermined
Table 2.3 - Summary of OECD and USCG estimates of ISPS cost compliance for ports in US$million (source: Bichou, 2004)
Bichou (2004) states that there is no international benchmark for calculating ISPS
costs among ports. Capital and operating costs vary significantly between ports which

46
makes it difficult to construct cost analyses on average-global approximations. He
also states that security measures targeting ports differ by scope, nature and level of
compliance and that the cost of compliance will therefore vary accordingly.
Bichou and Evans (2007) include data on UK and Australian ports. They report that
in the UK, total initial costs for ISPS Code compliance for 430 port facilities was
US$26 million with annual costs at US$2.5 million. In Australia, the Australian
Government reported that total ISPS Code costs for 70 ports, in which there are a total
of 300 port facilities and for 70 Australian-flagged vessels was US$240 million
initially with annual costs of US$74 million. While it is not possible to compare
directly the figures for the UK and Australia given that the Australians include the
costs associated with ISPS Code compliance for 70 vessels in addition to the ports, the
data presented by Bichou and Evans (2007) suggests that the Australian experience is
considerably more costly than in the UK.
Dekker and Stevens (2007) carried out a survey of port facilities’ security investments
in EU Member States and EEA countries. Their results are based on a total of 27 port
facilities based in six European ports: Klaipeda, Rotterdam, Amsterdam, Lisbon,
Barcelona and Bilbao. The authors found that the average security investment per
port facility was €464,000 and the average annual running cost was €234,000. The
average security investment costs and running costs are clustered by type of port
facility and are reproduced in table 2.4.
Port Security Costs Dry
Bulk
Liquid
Bulk Ro/Ro Container Cruise
Multi-
purpose
Average investment costs
(€1000s) 253 439 101 74 430 798
Average running costs (€1000s) 177 110 69 108 260 409
Table 2.4 - Average port security investment and running costs in a study of 27 EU Member States
(source: Dekker and Stevens, 2007)
Benamara and Asariotis (2007) present the findings of the UNCTAD (2007) survey
report which surveyed 55 ports in 28 countries. They found that the average initial
cost per ISPS port facility for smaller respondent ports (with up to 10 port facilities)
amounted to US$386,000 which was more than double the amount for larger
respondent ports (US$181,000). The corresponding figures for the annual costs was

47
US$128,000 and US$81,000 for the smaller respondent ports and the larger
respondent ports respectively.
2.8 Port Security Incident Costs
Greenberg et al (2006) describe how the economic consequences of a successful
terrorist attack are likely to be large and widespread and that economic consequences
of attacks on the container shipping system would have direct and indirect effects.
The authors describe the direct effects as life and injury compensation, repair and
replacement of port infrastructure and other public property, losses of cargo and
damaged and destroyed private property. The indirect effects are a consequence of
the role of the port in the supply chain: business interruption due to delayed or
missing shipments, long term adjustments to the modified transport system,
augmented security procedures and lost revenue to the port facility And to the public
purse.
The OECD report (2003, p.19) describes how, after the attack on the tanker Limburg
off Aden in November 2002, Yemeni terminals saw container throughput plummet
from 43,000 TEU in September 2002 to 3,000 TEU in November 2002. This resulted
largely from marine war underwriters’ increased war additional premiums rising to as
much as USD 300,000 per vessel call. The Yemeni government estimated that 3,000
workers were laid off and economic losses arising from the attack were running at
USD 15,000,000 per month. The OECD Report (2003, p.20) also states that property
damage from a terrorist attack to a modern 16 hectare container terminal could be as
much as USD 32,000,000.
Farrow and Shapiro (2009) review the literature on the cost of potential terrorist
attacks in the United States. They present estimates for the overall costs of various
attack scenarios, some of which are based in ports. The authors’ findings are
reproduced in table 2.5.

48
Author Attack Cost Estimate
Gordon et al (2007) Aviation system $214 to $421 billion (not counting lives)
Rose, Oladosu, Liao (2007) Los Angeles blackout $2.8 to $20.5 billion, depending on resilience (defined by the author as ability to respond to attack)
Rosoff and Winterfeldt (2007) Dirty bomb in ports of Los Angeles/Long Beach
$130 million to $100 billion, depending on the length of the shutdown
Gordon et al (2005) Ports of Los Angeles / Long Beach
From $1.1 billion to $34 billion
Park (2008) Dirty bomb in ports of Los Angeles/Long Beach
$34 billion in import/export losses. No estimate based on lives or property lost.
Cheng, Stough and Kocornik-Mina (2006)
Power plant attack in Washington DC
$1.18 billion
Abt (2005) Bioterrorist attack From $200 billion to $3 trillion; deaths from 500,000 to 30 million
Bae, Blaine and Bassok (2005) Seattle highways From $1.2 to $1.5 billion Table 2.5 – Costs of various terrorist attack scenarios [source: Farrow and Shapiro, 2009]
While the OECD (2003) report focuses on Yemeni port terminals, the Farrow and
Shapio (2009) review extends to the host country’s economy and supply chains. In
carrying out an analysis of the potential economic losses arising from port security
incidents, it is important to distinguish between the two.
2.9 Port Security Benefit-Cost Analysis Farrow and Shapiro (2009) summarize a benefit-cost framework for investing in
security which is designed to be consistent with benefit-cost guidance from the US
Office of Management and Budget (OMB). They define benefits as expected avoided
costs which include elements of both probability and consequences. Farrow and
Shapiro (2007, p4) also state that “if a system is resilient the cost avoided may be
large with respect to several different types of attacks or types of hazards.” They refer
to a model developed by ‘Risk Management Solutions’, a private company, for
insurance companies to use to measure the risk of terrorist attacks.
Willis and LaTourette (2008) describe a probabilistic risk modelling approach in
break-even benefit-cost analysis which employs the Risk Management Solutions
methodology. They describe how terrorism risk can be expressed in terms of the
annual expected loss from damage caused by terrorist attacks and that the expected
loss accounts for the probability of that the attack will occur and the consequence of

49
the attacks. Furthermore, Willis and LaTourette (2008) state that “since terrorism risk
reflects both probability and consequence, using risk reduction as a measure of benefit
in a benefit-cost analysis captures both effects.” The authors state that the benefit of a
security regulation can be expressed in terms of the reduction in the expected loss of
damage. This principle is echoed in the calculation of residual security risk by Talas
and Menachof (2009) and is also applied in this research. Willis and LaTourette
(2008) also describe how benefit-cost analysis is the normative framework for
determining whether a regulation is efficient. They qualify their argument by stating
that a regulation is justified if the incremental cost of implementing the regulation is
exceeded by the incremental benefit generated by the regulation.
Pinto and Talley (2006) propose a framework for calculating the risk-based return on
investment (RROI) for a port’s security systems. The authors state that their approach
may be used to determine whether the expenditure on security resources is sufficient
given the corresponding reduction in risk. Pinto and Talley (2006, p281) refer to the
framework developed by Arora et al (2004, p35) which “uses a risk management
approach that integrates risk profile with actual damages and implementation costs to
determine the costs and benefits of information security solutions.” The Arora et al
(2004, p37) framework describes RROI as the ratio between the net benefit in
implementing an IT solution and the implementation cost. In particular, RROI
measures “how effectively you use resources to avoid or reduce risk. Specifically, a
positive RROI means that the dollar value of the avoided risk is greater than the
implementation cost.” Furthermore, the RROI helps to guide the company in its IT
security investment by indicating the point where further investment in IT security has
such a diminished return that “you’re better off investing the money elsewhere.”
Pinto and Talley (2006) also describe how investments should be made in port
security until the RROI falls to the minimum acceptable rate but do not elaborate on
what the minimum acceptable rate might be or how it can be assessed. Also, the
framework proposed by Pinto and Talley (2006) is unable to assess how port security
systems can be deployed efficiently. Finally, the authors make no provision for the
interpretation of RROI when certain security measures are mandated by initiatives
such as the ISPS Code.

50
2.10 Portfolio Selection Theory and Efficient Frontiers
Chopra and Sodhi (2004) describe the challenges that companies face to mitigate
supply chain risks without eroding profits. The manager’s role is similar to that of a
stock portfolio manager: achieve the highest possible profits for varying levels of risk,
and do so efficiently.
Markowitz (1952) states that a portfolio is efficient when it is impossible to obtain a
greater average return (of the stocks in the portfolio) without incurring greater
standard deviation; that it is impossible to obtain a smaller standard deviation without
giving up return on the average. Furthermore, the investor must choose one
combination of average return and standard deviation which, more than any other,
satisfies his needs and preferences with respect to risk and return. Markowitz (1952)
also states that portfolio selection can not only rely on past averages and standard
deviations (of stocks) as reasonable measures of the likely return and the uncertainty
of return in the future but that it is also possible to use the ‘probability beliefs’ of
experts as inputs to a portfolio analysis. He describes a scenario in which a
meteorologist is asked to advise on the probability belief that it will ‘rain tomorrow’
and describes how the ‘security analyst is the meteorologist of stocks and bonds’. The
security analyst in Markowitz’ (1952) example becomes the port security analyst in
this model. He also shows how an investor can compute the set of efficient portfolios
and efficient expected returns – variance (E-V) combinations by combining statistical
techniques and the judgements of experts to form reasonable probability beliefs. In
the application of Markowitz (1952) theory of portfolio selection to port security, the
theory shows that it is possible to arrange the security systems in such a way as to
obtain a certain level of expected performance of the portfolio of security systems for
a given level of risk, in this case represented by the standard deviation of the portfolio.
Markowitz (1952) theory of portfolio selection calculates how the efficient portfolio
should be structured by allocating a security investment coefficient for each security
system.
Byrne and Lee (1994) describe how the Markowitz portfolios can be connected to
generate the efficient frontier and how Markowitz Efficient Frontiers can be
calculated using Microsoft Excel Solver. The Markowitz efficient frontier “represents
the boundary of the risk/return set of asset combinations (portfolios).” The Byrne and

51
Lee (1994) process involves matrix methods for the portfolio calculations and follows
these five steps:
1) Find the maximum return portfolio and compute the risk for this
2) Find the minimum risk portfolio and compute the return for this
3) Compute the difference between the maximum and minimum risk
portfolios and divide into a sufficient number of points to produce a
reasonable graph
4) Solve the maximum return combinations for each of the subdivided risk
levels
5) Graph these returns against the risks.
2.11 Some Parallels between Portfolio Theory and Port Security Investment Some interesting parallels exist between the balancing of a portfolio of stocks and
shares and the implementation of port security measures to protect a port facility and
its operations. These parallels are set out below.
An investor buys shares in a stock in the belief that he will gain a positive return
from his investment. This is equivalent to a port security manager investing in a
security solution in the belief that it will protect his port facility and the port’s
operations against a security incident and thus lower his risk towards a particular
security incident.
An investor could invest solely in the one stock with the maximum predicted
return but instead invests in such a way as to balance his portfolio against risk and
return. Similarly, the port security manager does not invest solely in one security
solution, such as fencing, at the expense of any other security solution because he
realises that he faces more than one type of security risk. He must balance his
investments in security solutions in such a way as to counteract the threats that his
port faces until he has lowered his overall risk level to his satisfaction.
The value of a share portfolio is equivalent to the performance of a portfolio of
security solutions in a port. Certain security solutions may perform well but the
overall performance can be negatively affected by the failure of or lack of a
security solution designed to tackle a particular security incident which interrupts
port operations.

52
Stock prices react to unforeseen events. The performance of a security solution
can be tested by a security incident in the port. The security incident is equivalent
to the unforeseen event.
Stocks are correlated or uncorrelated to movements in an index: certain security
solutions have no bearing on a particular type of security incident and as such
their individual performance will be unaffected by it.
Stocks are correlated or uncorrelated to each other. Certain security solutions are
related in terms of their performance in the face of a security incident e.g. access
control and intruder detection measures. Others, such as container radiation
detectors and office smoke alarms are unrelated and their performance
uncorrelated.
The existence of these parallels lends weight to the justification for employing the
Markowitz (1952) theory of portfolio selection in determining the efficient
relationship between residual security risk and security investment for maritime port
facilities. However, the cross-disciplinary adaptation of theory from finance to port
security requires a statement of assumptions which will need to stand up to scrutiny
before the efficient relationship between residual security risk and security investment
can be calculated.

53
Chapter 3 - Research Methodology The chapter is structured as follows. First, the research design and methodology are
discussed in detail. This includes the research questions; data sources and collection
methods; and units of analysis. Secondly, the issues of research reliability and
validity are addressed. The chapter concludes with a discussion of the research
protocol.
3.1 Research Design
The research in this study has both qualitative and quantitative elements and follows
an adaptive cross-disciplinary approach of recasting Markowitz (1952) theory of
portfolio selection into maritime port security in an industry example. . The research
does not follow a case study methodology because case studies necessarily generate
new theory (Yin, 1994) and furthermore, it was felt that a case study approach would
not be suitable given the extensive literature on the different forms of theory
generation from case study research (Yin, 1994; Eisenhardt, 1989; Eisenhardt, 1991,
Eisenhardt & Graebner, 2007; Bryman, 2004; Mangan et al, 2004; Hilmola et al,
2005; Siggelkow, 2007). The objective behind the research is not the generation of
new theory about port security efficiency but is aimed at addressing some of the
problems faced by port security managers today through the cross-disciplinary
application of financial portfolio theory in the field of port security. The research
uncovers some of the parallels which exist in managing a portfolio of stocks and
shares and a portfolio of port security systems while at the same seeking to identify
the limitations and potential problems with the application of portfolio theory in a
security setting. Furthermore, the choice of the mixed methods approach of survey
questionnaires and structured interviews fits with the epistemological and ontological
considerations mentioned below. Nevertheless, one key principle of case study
research is evident in the methodology, which is the adoption of a research protocol,
as championed by Yin (1994).

54
3.1.1 Epistemological and Ontological Considerations
Research where the emphasis is on quantification in the collection and analysis of data
and entails a deductive approach to the relationship between theory and research
typically points to a positivist epistemology with an objectivist ontology (Bryman,
2004). While this research contains some quantitative elements, the lionshare of the
research is of a qualitative nature. The clue to the epistemology can be found in the
definition of port security at the end of section 2.1: “….perception of the absence of
threat.” The researcher’s role is to see the World View of the company security
officers and to interpret it from their point of view. Furthermore, according to
Bryman (2004) a phenomenologist views human behaviour as a product of how
people interpret the world in order to grasp the meaning of a person’s behaviour: the
phenomenologist attempts to see things from that person’s point of view. Given these
considerations, the epistemology can be described as interpretivist-phenomenological.
Positivism can be ruled out because much of the data on the performance of port
security systems is subjective in nature and cannot be measured with any physical
gauge. In the same vein, it is possible to eliminate realism as an epistemological
position because the perception of security cannot be discerned by the ‘effect’ of the
security measures alone.
The definition of port security also guides the ontological considerations. The
‘perception of the absence of threat’ is an interpretation of social phenomena and thus
necessarily dependent on social actors, in this case the company security officers.
The ontology is therefore constructionist. Furthermore, the interpretations cannot be
independent of social actors and thus cannot follow an objectivist ontology.
3.2 Main Research Question Recalling the statement of the research problem from the introduction, the problem
the research aims to solve is the determination by ISPS Code compliant port facilities
of whether they have been able to discover the efficient relationship between security
and investment. Considering the earlier definition of security, in order to arrive at a
quantitative measure of the threat to a port facility following the application of
security measures, it is necessary to consider the residual security risk, which can be
estimated in financial terms. From this it follows that the main research question is:
how can ISPS Code compliant port facilities discover the efficient relationship
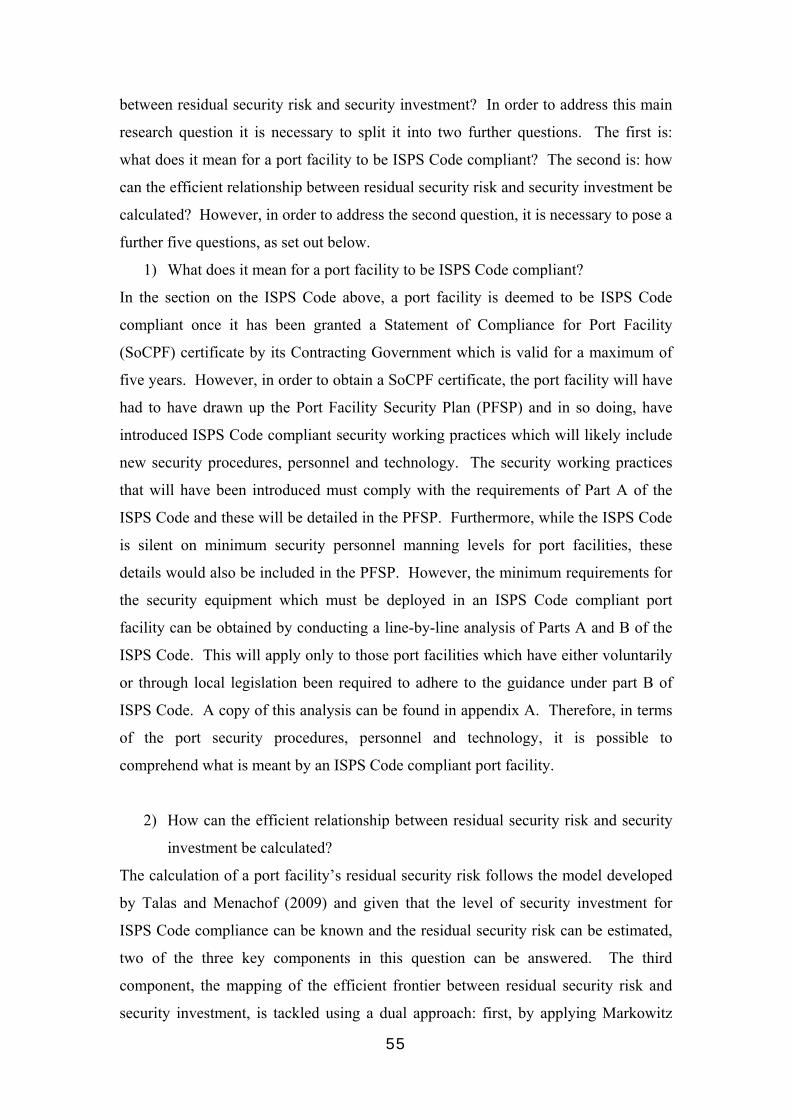
55
between residual security risk and security investment? In order to address this main
research question it is necessary to split it into two further questions. The first is:
what does it mean for a port facility to be ISPS Code compliant? The second is: how
can the efficient relationship between residual security risk and security investment be
calculated? However, in order to address the second question, it is necessary to pose a
further five questions, as set out below.
1) What does it mean for a port facility to be ISPS Code compliant?
In the section on the ISPS Code above, a port facility is deemed to be ISPS Code
compliant once it has been granted a Statement of Compliance for Port Facility
(SoCPF) certificate by its Contracting Government which is valid for a maximum of
five years. However, in order to obtain a SoCPF certificate, the port facility will have
had to have drawn up the Port Facility Security Plan (PFSP) and in so doing, have
introduced ISPS Code compliant security working practices which will likely include
new security procedures, personnel and technology. The security working practices
that will have been introduced must comply with the requirements of Part A of the
ISPS Code and these will be detailed in the PFSP. Furthermore, while the ISPS Code
is silent on minimum security personnel manning levels for port facilities, these
details would also be included in the PFSP. However, the minimum requirements for
the security equipment which must be deployed in an ISPS Code compliant port
facility can be obtained by conducting a line-by-line analysis of Parts A and B of the
ISPS Code. This will apply only to those port facilities which have either voluntarily
or through local legislation been required to adhere to the guidance under part B of
ISPS Code. A copy of this analysis can be found in appendix A. Therefore, in terms
of the port security procedures, personnel and technology, it is possible to
comprehend what is meant by an ISPS Code compliant port facility.
2) How can the efficient relationship between residual security risk and security
investment be calculated?
The calculation of a port facility’s residual security risk follows the model developed
by Talas and Menachof (2009) and given that the level of security investment for
ISPS Code compliance can be known and the residual security risk can be estimated,
two of the three key components in this question can be answered. The third
component, the mapping of the efficient frontier between residual security risk and
security investment, is tackled using a dual approach: first, by applying Markowitz

56
(1952) theory of portfolio selection to each port facility individually and secondly, by
examining the 216 possible portfolios of security systems which can be constructed
from the six port facilities. This twin pronged approach is addressed in greater detail
in chapter IV. However, in order to follow the model described in Talas and
Menachof (2009), it is necessary to address the following five questions:
1. What are the security threats to the port facility and what are their
probabilities?
2. What are the estimated gross losses to the port facility following each
prescribed security threat?
3. What do the security systems consist of in each port facility?
4. How well do the port security systems perform in the face of the prescribed
security threats?
5. What are the port security systems’ costs?
1. What are the security threats to the port facility and what are their
probabilities
Pinto and Talley (2006) describe a number of major US port security fears, which
include chemical or nuclear weapons smuggled inside containers; mines used on ships
to block shipping channels; and pirated vessels crashed into bridges or famous
landmarks. Other examples of the types of potential security incidents that a port
facility faces can be found in the Congressional Research Service Report for the
United States Congress (Parfomak and Fritelli, 2007). Furthermore, the security
threats that a given port facility faces and their probabilities are regularly considered
in the normal course of business by the specialist marine war and terrorism
underwriters in the Lloyd’s Insurance Market in London. Terrorism underwriters
regularly review the probabilities and subsequently their pricing levels of security
risks and according to Kunreuther, et.al. (1995, p338) “underwriters make pricing
decisions regularly as part of their jobs; they are expert, experienced risk evaluators.”
Furthermore, a comprehensive risk assessment is a requirement for port facilities that
are compliant with the International Organisation of Standards’ (ISO) Supply Chain
Security Standard ISO 28000. Section 4.3.1 of ISO 28000 states that: “the risk
assessment shall consider the likelihood of an event and all of its consequences.”
57
The research concentrates on seven different types of security incident. These have
been selected from examples in Pinto and Talley (2006), Parfomak and Fritelli (2007)
and from discussions with Dubai Ports World. The types of security incident are:
bomb introduced by person on foot; car bomb; truck bomb; biological agent attack on
the port facility – on foot; biological agent attack on the port facility – by vehicle;
mining of port infrastructure; and vessel attacked by suicide boat. The methodology
used to select the scenarios is based on a breach of the port facility’s security systems
from both the land and seaward entrances with varying degrees of severity with
attacks aimed at different parts of the port facility using both conventional explosives
and a biological agent.
The security scenarios for each port facility were presented to a Lloyd’s terrorism
underwriter for his pure premium rating in an interview at his desk in the underwriting
room in Lloyd’s of London. The terrorism underwriter, Russell Kennedy of BRIT
Insurance, employs a similar approach to that described in Willis and LaTourette
(2008), except that he employs the services of Exclusive Analysis, a competitor of
Risk Management Solutions in the London Insurance Market, to guide him in his
pricing of terrorism risk. The methodology which Kennedy applies for pricing a
terrorism risk in a given country is as follows. He refers to his “notional base rate”
for a terrorism risk which is 0.02% per annum. He then examines the Exclusive
Analysis risk score for terrorism for the country in question which is represented as a
number between 1 and 10 to one decimal place. This scale he has interpreted as a
logarithmic scale of base 2. In order to arrive at his country rate for a particular
terrorism risk he multiplies his base rate of 0.02% by 2 to the power of the Exclusive
Analysis risk score minus 1. He then makes a further subjective adjustment
depending on the nature of the business (‘occupancy’ in Kennedy’s parlance) of the
proposed assured. He has subdivided ‘the occupancies’ into 20 business sectors and
examples include: professional services such as banking and finance; oil and gas;
power generation; and ports and harbours. Kennedy’s methodology subsequently
yields a single country rate for a terrorism risk in a specific business sector. However,
his methodology is unable to distinguish between two different locations in the same
country and nor will it distinguish between different types of terrorism attack modus
operandi.
While Kennedy’s underwriting methodology appears to follow some logical path to
arriving at a suitable pure premium pricing level for terrorism risks, there are a

58
number of issues which need to be highlighted. First, his selection of 0.02% as a
notional base rate for an annual terrorism premium may in time be revised upwards in
the event of sustained losses on his underwriting book. Any such decision might be
driven by the higher cost of reinsurance in future years but it should also be borne in
mind that any increase in the notional base rate may also reflect a global increase in
terrorist activity. Secondly, there are limitations with seeking data from a single
underwriter but the justification for following this method is as follows. Kennedy
bases much of his terrorism premium setting on the expert opinion of Exclusive
Analysis, a respected provider of terrorism and political risk intelligence to the
Lloyd’s Insurance Market. Exclusive Analysis gather their data from in-country
specialists who feed intelligence back to the London headquarters. The London
headquarters of Exclusive Analysis in turn interpret the intelligence provided to them
by their network of contacts and subsequently feed this information to underwriters
such as Kennedy in a quantitative form. Thus the expert opinion of a number of
specialists outside of the insurance market has a direct bearing on the subjectivity
which Kennedy exhibits in his underwriting process.
Nevertheless, it is accepted that seeking the opinions of either a panel of terrorism
underwriters or more underwriters individually would have been preferable but
difficulties with access unfortunately prevented this from happening. The transcript of
the interview with Russell Kennedy is in appendix E.
2. What are the estimated gross losses to the port facility following each
prescribed security threat?
The OECD (2003) report and Farrow and Shapiro’s (2009) review of the potential
economic losses following security incidents show two of the levels at which losses
can be calculated: at the port facility level and the national level. This research aims
to capture the data at the port facility level, as per the OECD (2003) report. The
reason for this is that trying to estimate the damage to the host economy or to entire
supply chains is beyond the scope of this study.
The data source for the estimates of potential economic damage to the port facilities
following the prescribed security incidents listed above is chiefly a copy of the
schedule of one of the insured port facilities owned by Dubai Ports World. Given that
insurance limits generally reflect the values of property at risk, this can be judged to
be a valid data source. However, the data which was provided by the Director of

59
Security is limited to port facility A as this was the only data available. The seven
security scenarios were presented to the Director of Security on 24 March 2009 and
based on the port facility A insurance data and through his own professional
experience, he estimated the size of financial loss of physical damage and business
interruption for the different terrorism attacks for the terminal in port facility A only.
The full results are presented at the beginning of chapter IV.
3. What do the security systems consist of in each port facility?
The units of analysis in the research are the port security systems in each port facility.
The security systems have been classified as access control, biometrics and detection,
which in turn consist of individual security components. The access control systems
include all the physical gates, fencing and security personnel engaged in access
control procedures. The biometric systems, also described as ‘enhanced access
control systems’ range from pass cards to fingerprint scanning. The detection systems
include CCTV systems, automatic intruder alerts, radar, sonar and also the security
personnel involved in security patrols.
The security components in the port facility can be identified through the use of a
survey questionnaire completed by each of the port facilities’ Port Facility Security
Officer (PFSO). The questionnaire, a copy of which can be found in appendix B, was
compiled following a line-by-line analysis of the port security equipment and
components mandated by the ISPS Code (see appendix A).
Questions 1-4 are concerned with the details of the port, the specific port facility
owned by Dubai Ports World, the role of the respondent and the principal activity of
the port facility. Questions 5-8 are concerned with the specification and cost of the
perimeter fencing in the port facility. Questions 9-10 are concerned with the type and
cost of access control measures (excluding fencing) in the port facility. Questions 11-
14 are concerned with the types, specifications and costs of detection systems,
including lighting coverage in the port facility. Questions 15-17 are concerned with
the types and cost of biometric security systems deployed in the port facility.
Question 18 is concerned with a description of the types and coverage of security
patrols in the port facility. Question 19-21 are concerned with security
communications in the port facility. Questions 22-23 are concerned with the number,

60
location and cost of security personnel in the port facility. Questions 24-26 are
concerned with the type, location and cost of cargo security detection equipment in
the port facility. Questions 27-28 are concerned with security systems integration,
monitoring and cost in the port facility’s main control room. Questions 29-30 are
concerned with the extent and cost of crisis management systems in the port facility.
The survey questions were formulated in line with De Vaus’ (2002) principles of
question design and his key benchmarks for setting questions.
The data sources for the completed survey questionnaires are the Port Facility
Security Officers in the six port facilities.
4. How well do the port security systems perform in the face of the prescribed
security threats?
While it may appear impossible to assign a quantitative measure to the performance of
access control measures or intruder detection measures, the ISPS Code Part B 18.5
requires that “drills should be conducted every three months unless the specific
circumstances dictate otherwise. These drills should test individual elements of the
port facility security plan such as those security threats listed in paragraph 15.11.”
The performance of the individual security systems can be assessed based on a series
of key performance indicators (KPIs) that the port facility security officers (PFSOs)
report monthly to the company security officers (CSOs). They report, among other
measures, the number of security non-conformities for each security system. This
means that the CSOs are able to build a picture over time of how effectively the
security systems are operating in the port facilities for which they have responsibility.
By conducting semi-structured interviews with the company security officers (CSOs),
the intention is to collect quantitative data by asking the CSOs to interpret and
translate the KPI data into percentage performance measures for each of the three
main security systems: access control, biometrics and detection for each of the port
facilities. The quantitative responses to the interview questions are an evaluation of
how effectively each security system works to prevent the occurrence of each of the
prescribed security incidents, working completely in isolation of the other two
security systems.
5. What are the port security systems’ costs

61
The survey questionnaire described in 3 above also captures details of the investment
of each port facility’s security systems and their components. The data captured
includes both the cost of the security infrastructure from 2004 to 2007 and the running
costs of the port facility’s security systems for the 2007 year. The term ‘security
investment’ in this research combines both the cost of the security infrastructure from
2004 to 2007 and the running costs for the 2007 year. The figure for the cost of the
security infrastructure is aggregated across the years 2004 – 2007 to capture all of the
improvements made to the port facilities’ security systems in that time. This is
because the CSOs were not confident that the PFSOs would be able to provide
accurate figures for the security investments for 2004 alone, the year of the
introduction of the ISPS Code.
3.3 Units of Analysis: Representativeness The units of analysis in this research are the port facilities and the security systems in
the six port facilities owned by Dubai Ports World which have been labelled A to F.
All of the port facilities are container terminals. One of the port facilities is located in
the Americas, one in Europe and the remaining four are located in Asia. The six port
facilities presented in this research are a representative sample of the types and
locations of port facilities in the Dubai Ports World portfolio in terms of their
container throughput, geographic location and background terrorist threat, as
determined by the two company security officers The company security officers
selected the six port facilities based on the following criteria:
1) The port facilities were equally spread between developed and developing
countries;
2) The port facilities ranged from low to high in terms of their terrorism threat, in
the opinion of the company security officers;
3) The port facilities were equally spread across the various time zones in which
the parent company’s portfolio of ports are located.
While the selection of port facilities in this research is deemed to be representative, it
is acknowledged that the reader will be unable to satisfy him or herself as to the
validity of these statements given that the locations of the port facilities are not
disclosed, arising from the company’s security concerns.
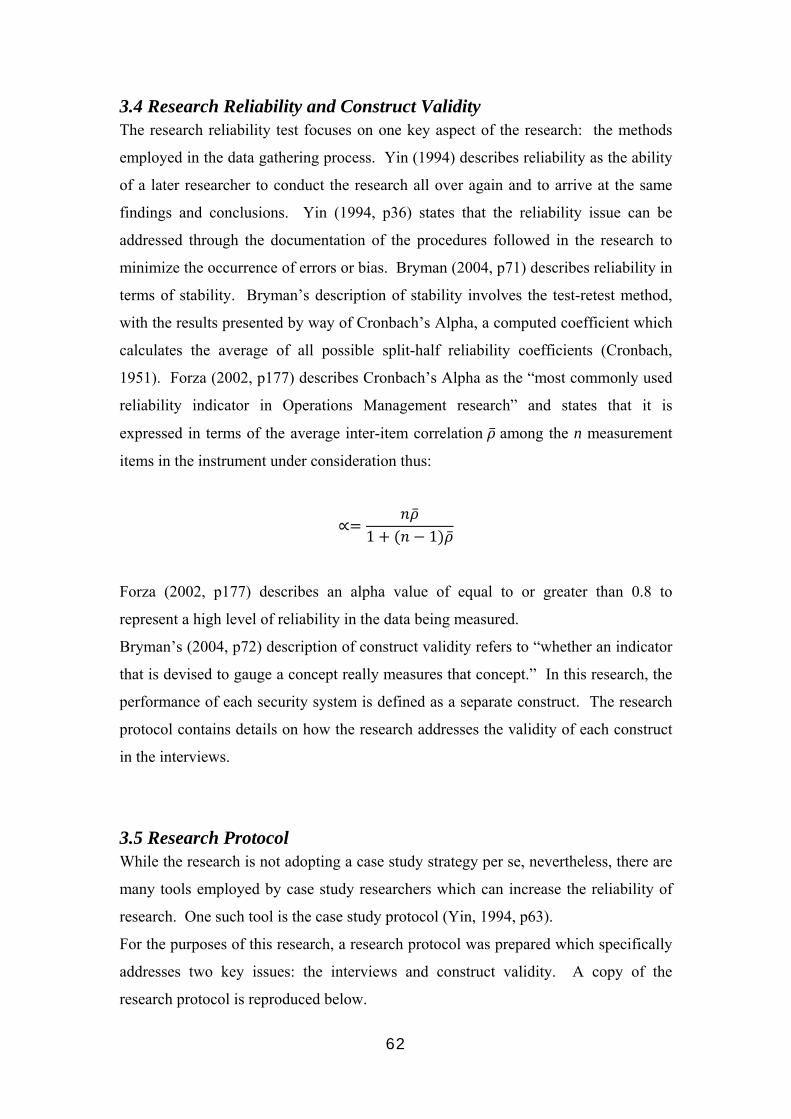
62
3.4 Research Reliability and Construct Validity The research reliability test focuses on one key aspect of the research: the methods
employed in the data gathering process. Yin (1994) describes reliability as the ability
of a later researcher to conduct the research all over again and to arrive at the same
findings and conclusions. Yin (1994, p36) states that the reliability issue can be
addressed through the documentation of the procedures followed in the research to
minimize the occurrence of errors or bias. Bryman (2004, p71) describes reliability in
terms of stability. Bryman’s description of stability involves the test-retest method,
with the results presented by way of Cronbach’s Alpha, a computed coefficient which
calculates the average of all possible split-half reliability coefficients (Cronbach,
1951). Forza (2002, p177) describes Cronbach’s Alpha as the “most commonly used
reliability indicator in Operations Management research” and states that it is
expressed in terms of the average inter-item correlation among the n measurement
items in the instrument under consideration thus:
1 1
Forza (2002, p177) describes an alpha value of equal to or greater than 0.8 to
represent a high level of reliability in the data being measured.
Bryman’s (2004, p72) description of construct validity refers to “whether an indicator
that is devised to gauge a concept really measures that concept.” In this research, the
performance of each security system is defined as a separate construct. The research
protocol contains details on how the research addresses the validity of each construct
in the interviews.
3.5 Research Protocol While the research is not adopting a case study strategy per se, nevertheless, there are
many tools employed by case study researchers which can increase the reliability of
research. One such tool is the case study protocol (Yin, 1994, p63).
For the purposes of this research, a research protocol was prepared which specifically
addresses two key issues: the interviews and construct validity. A copy of the
research protocol is reproduced below.

63
Research Protocol (Interviews & Construct Validity)
1. Procedures
a. Scheduling of field visits. Field visits were arranged to both the offices of
Dubai Ports World in Jebel Ali, United Arab Emirates and to Lloyd’s of
London. The visit to the main office in Jebel Ali was scheduled for March
2009. A two day visit to the offices of Dubai Ports World was required in
order to complete the interviews. The visit to Lloyd’s of London was
arranged for April 2009.
b. Access procedures. Access to the two Company Security Officers (CSOs)
of Dubai Ports World has been secured through the Director of Security.
Access to the Lloyd’s Terrorism Underwriter, Russell Kennedy of BRIT
Insurance, has been arranged through Nigel Miller of Miller Insurance
Services.
c. Interview documents. The interview documents required for the
interviews with the CSOs at DP World are the prepared (blank)
spreadsheets for the performance of the security systems in the face of the
prescribed security threats. One form was filled in for each port facility.
An example of this form can be found in table 3.1.
Table 3.1 - Interview document for CSO interviews (one per port facility)
These were filled out by the interviewer during the interview process in the
full view of the interviewee. It was arranged that DP World will provide
the documents regarding the size of the port facilities’ insured assets. The

64
interview with the terrorism underwriter was unstructured and required no
prior documents.
2. Persons to be interviewed. The four persons interviewed were: the two company
security officers of DP World; the Director of Security for DP World and the
Lloyd’s Underwriter, Russell Kennedy.
3. Interview questions
a. Topics. The interviews with the CSOs concentrated on their subjective
assessments of the performances of the individual port facilities’ security
systems in the face of the prescribed security threats.
The interview with the Global Head of Security concentrated on his own
subjective assessments of the expected losses due to the prescribed
terrorist attacks in the port facilities. This sought to capture his knowledge
and experience of munitions explosions in the maritime environment and
translate it into quantifiable loss estimates in US$ terms.
The interview with the Lloyd’s Underwriter sought to understand his
underwriting methodology and his subjective assessments of the
probabilities of the occurrences of the prescribed security incidents.
b. Research constructs.
The research constructs are defined as the performance of the security
systems of access control, biometrics and detection.
c. Procedure to ensure construct validity during interviews.
The procedure to ensure construct validity during the interviews is
specifically relevant to the interviews with the CSOs. In order to ensure
construct validity, it was necessary to draw to the interviewees’ attention
that the interviewees’ subjective assessments of the performance of each
security system should be considered to be independent of the other two.
This was done on three occasions in each interview: first when the
interviewee was asked to give their subjective assessments of the
performance of the access control measures; secondly when the
interviewee was asked to give their subjective assessments of the
performance of the biometrics systems; and thirdly when the interviewee

65
was asked to give their subjective assessments of the performance of the
detection systems.
3.6 Ethics The nature of the research in the security field necessarily requires a high level of trust
between researcher and researched. The researched does not want security sensitive
information about any potential weaknesses in a port facility’s security system to leak
out and to be used by criminal or terrorist interests for their own ends. They also do
not wish to share with their competitors the data on what security systems are located
in each port facility and their costs. Therefore, the identities of the port facilities
cannot be disclosed. Furthermore, it may be interesting to note that the level of trust
between researcher and researched was such that no confidentiality agreement was
ever signed or deemed necessary to be signed.
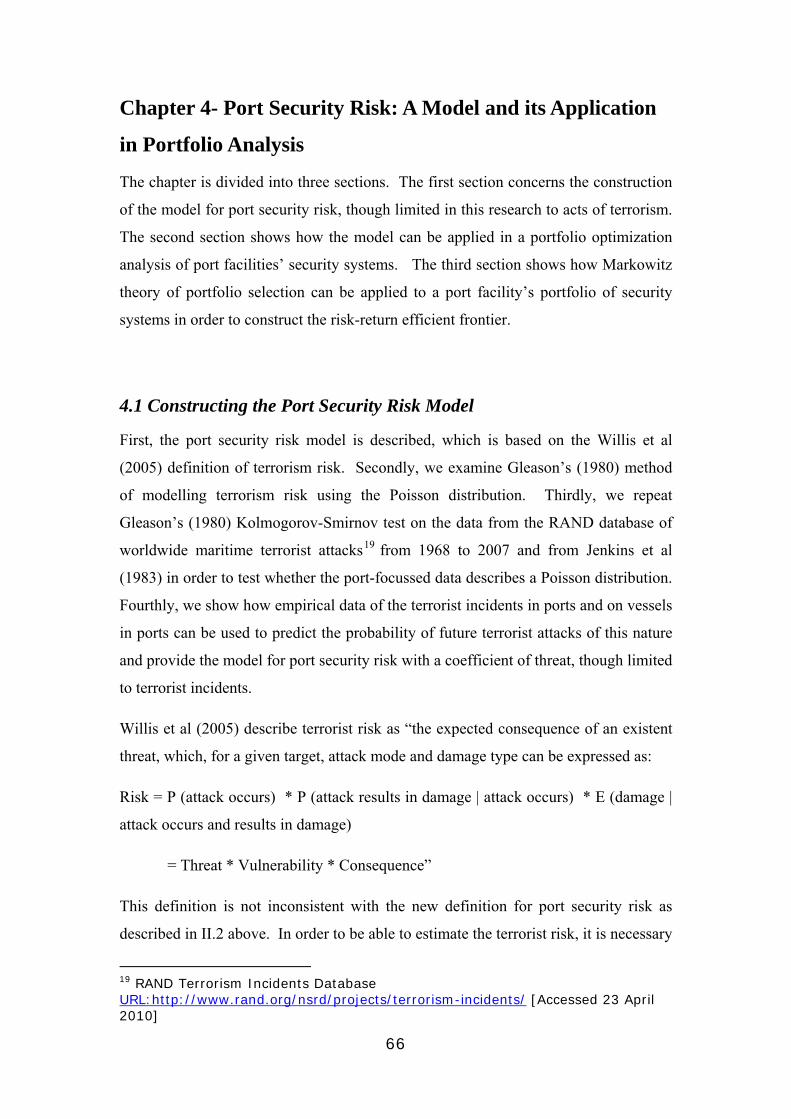
66
Chapter 4- Port Security Risk: A Model and its Application
in Portfolio Analysis
The chapter is divided into three sections. The first section concerns the construction
of the model for port security risk, though limited in this research to acts of terrorism.
The second section shows how the model can be applied in a portfolio optimization
analysis of port facilities’ security systems. The third section shows how Markowitz
theory of portfolio selection can be applied to a port facility’s portfolio of security
systems in order to construct the risk-return efficient frontier.
4.1 Constructing the Port Security Risk Model
First, the port security risk model is described, which is based on the Willis et al
(2005) definition of terrorism risk. Secondly, we examine Gleason’s (1980) method
of modelling terrorism risk using the Poisson distribution. Thirdly, we repeat
Gleason’s (1980) Kolmogorov-Smirnov test on the data from the RAND database of
worldwide maritime terrorist attacks19 from 1968 to 2007 and from Jenkins et al
(1983) in order to test whether the port-focussed data describes a Poisson distribution.
Fourthly, we show how empirical data of the terrorist incidents in ports and on vessels
in ports can be used to predict the probability of future terrorist attacks of this nature
and provide the model for port security risk with a coefficient of threat, though limited
to terrorist incidents.
Willis et al (2005) describe terrorist risk as “the expected consequence of an existent
threat, which, for a given target, attack mode and damage type can be expressed as:
Risk = P (attack occurs) * P (attack results in damage | attack occurs) * E (damage |
attack occurs and results in damage)
= Threat * Vulnerability * Consequence”
This definition is not inconsistent with the new definition for port security risk as
described in II.2 above. In order to be able to estimate the terrorist risk, it is necessary
19 RAND Terrorism Incidents Database URL:http://www.rand.org/nsrd/projects/terrorism-incidents/ [Accessed 23 April 2010]

67
to be able to estimate the probability of the threat manifesting itself in an attack, the
probability that the attack results in damage and an estimate of the expected damage
that might follow. Willis et al (2005) also state that if terrorist risks are independent,
expected damages of a specific type can be aggregated by summing across threat
types and target types.
4.1.1. Modelling Terrorism Risk Using the Poisson Distribution
Gleason (1980) modelled terrorism risk using the Poisson distribution and focused
exclusively on acts of international terrorism in the United States which occurred
between 1968 and 1974. Gleason (1980) describes the Poisson distribution as a good
model for occurrences such as terrorist events for three reasons: first, “the probability
than an event of terrorism occurs during a time interval increases with the length of
the time interval”; secondly, “the probability is almost negligible that two events of
terrorism occurs will occur in a very small time interval” and thirdly, “events of
terrorism which occur during one time interval are independent of those which occur
in any other time interval”.
The poisson distribution is described by equation 1: !
(1)
where n = number of occurrences of an event and λ = expected number of occurrences
during a given time interval.
The data in the RAND terrorism databases found in Jenkins et al (1983); Gardela and
Hoffman (1990); Gardela and Hoffman (1991); Gardela and Hoffman (1992) and the
online RAND database of terrorism incidents were analysed and only terrorist attacks
in the maritime domain were recorded. See appendix F for the complete list of
maritime terrorist attacks. These include attacks on port facilities as well as attacks on
vessels while alongside at or at anchor in any port but excludes attacks on vessels that
were not in a port or harbour. A summary of the number of terrorist attacks in each
year can be found in table 4.1. The mean, λ=1.85, represents 74 attacks over 40 years
from 1968 to 2007. Performing the calculation in equation 1, the probabilities of the
number of attacks in any given year are shown in table 4.2.
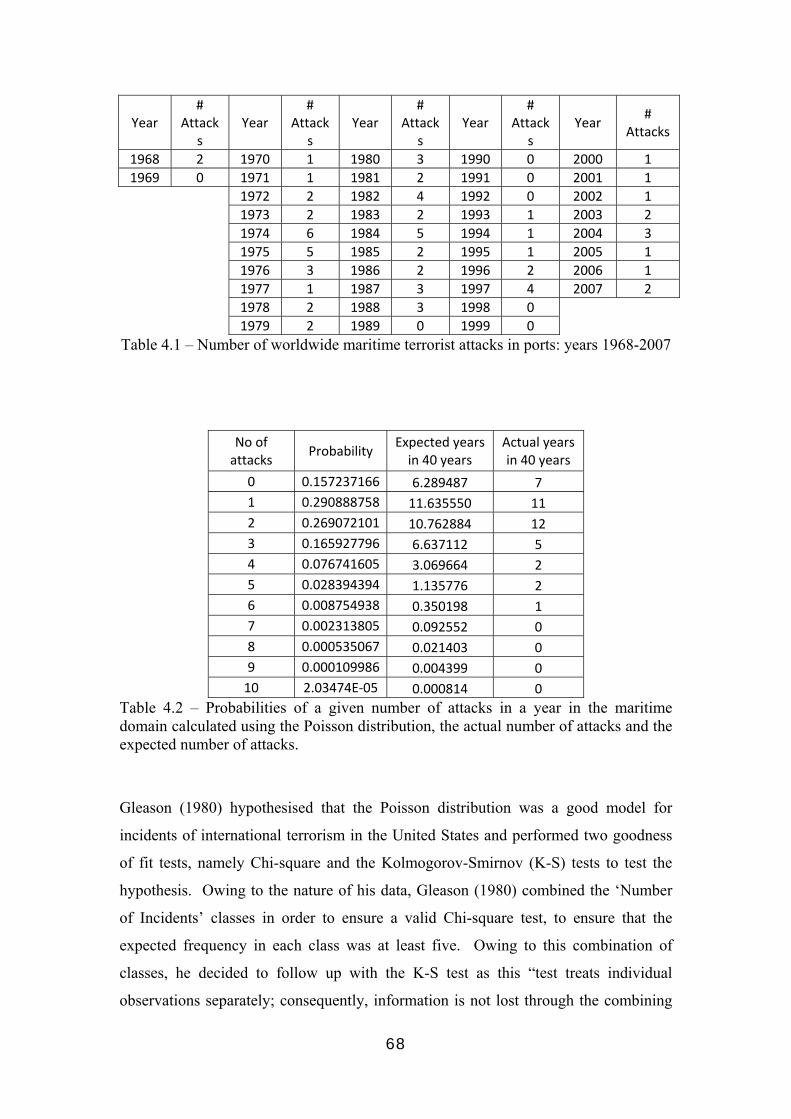
68
Year #
Attacks
Year #
Attacks
Year #
Attacks
Year #
Attacks
Year #
Attacks
1968 2 1970 1 1980 3 1990 0 2000 1 1969 0 1971 1 1981 2 1991 0 2001 1
1972 2 1982 4 1992 0 2002 1 1973 2 1983 2 1993 1 2003 2 1974 6 1984 5 1994 1 2004 3 1975 5 1985 2 1995 1 2005 1 1976 3 1986 2 1996 2 2006 1 1977 1 1987 3 1997 4 2007 2 1978 2 1988 3 1998 0
1979 2 1989 0 1999 0
Table 4.1 – Number of worldwide maritime terrorist attacks in ports: years 1968-2007
No of attacks
Probability Expected years in 40 years
Actual years in 40 years
0 0.157237166 6.289487 7
1 0.290888758 11.635550 11
2 0.269072101 10.762884 12
3 0.165927796 6.637112 5
4 0.076741605 3.069664 2
5 0.028394394 1.135776 2
6 0.008754938 0.350198 1
7 0.002313805 0.092552 0
8 0.000535067 0.021403 0
9 0.000109986 0.004399 0
10 2.03474E‐05 0.000814 0
Table 4.2 – Probabilities of a given number of attacks in a year in the maritime domain calculated using the Poisson distribution, the actual number of attacks and the expected number of attacks.
Gleason (1980) hypothesised that the Poisson distribution was a good model for
incidents of international terrorism in the United States and performed two goodness
of fit tests, namely Chi-square and the Kolmogorov-Smirnov (K-S) tests to test the
hypothesis. Owing to the nature of his data, Gleason (1980) combined the ‘Number
of Incidents’ classes in order to ensure a valid Chi-square test, to ensure that the
expected frequency in each class was at least five. Owing to this combination of
classes, he decided to follow up with the K-S test as this “test treats individual
observations separately; consequently, information is not lost through the combining

69
of categories”. The Kolmogorov-Smirnov test, specifically the one-sample K-S test,
is a non-parametric test used to compare a sample distribution with a reference
probability distribution, in this case, the Poisson distribution. Gleason (1980) showed
that the results of both the Chi-square and the K-S tests suggested that the Poisson
distribution was a good model.
Following Gleason’s (1980) example, it was decided to test the hypothesis that the
Poisson distribution is a good model for the maritime terrorism attack data contained
in column 4 of table 4.2. However, in order to apply the Chi-square test, the data
would have to be aggregated into three combinations and as this was the same
problem that Gleason (1980) had encountered with the data on terror attacks on the
United States, it was decided to apply the K-S goodness of fit test in isolation. The K-
S test rejects the null hypothesis that the sample distribution is drawn from the (in this
case) Poisson distribution if the Z-value is greater than the critical values in the one-
sample K-S test table in appendix G. The results of the K-S test performed using
SPSS are shown in table 4.3.
Table 4.3 – Results of the one-sample Kolmogorov-Smirnov test from SPSS
The Kolmogorov-Smirnov Z-value of 0.221 means that the data in column 4 of table
4.2 describes a Poisson distribution as the K-S Z-value is critical at the alpha=0.01
level. This means that the probability of future terrorist incidents in ports or on
vessels in ports can be modelled using the Poisson distribution and the data in table
4.2.
One-Sample Kolmogorov-Smirnov Test
40
1.8500
.035
.033
-.035
.221
1.000
N
MeanPoisson Parametera,b
Absolute
Positive
Negative
Most ExtremeDifferences
Kolmogorov-Smirnov Z
Asymp. Sig. (2-tailed)
VAR00001
Test distribution is Poisson.a.
Calculated from data.b.
70
The model for port security risk is based on Willis et al (2005), Gleason (1980) and
the RAND terrorism database data in table 4.2.
If jl is the loss (consequence) from an attack type j and the probability of the
occurrence of jl is )( jlp and the vulnerability of the port facility from jl is defined
as )(1 ijsp where ijs is the ability of security system i to prevent jl , then it follows
that the aggregate port security risk is jijj
n
i
m
j
lsplp
))(1()(1 1
(2)
for n security systems against m different types of security incident. Furthermore, we
can use Poisson to calculate )( jlp for any given terminal. However, this requires two
assumptions: first, that each terrorist attack is independent and secondly, that each
port facility is equally likely to be attacked.
The probability for n attacks in a given year )100( n is shown in table 4.2 and
what is required for our model is the probability of 1 or more attacks in any year.
This is calculated by summing the probabilities of n attacks where 101 n . The
probabilities of n>10 were disregarded as they are very small and unlikely to affect
the overall result.
Given that there are 4339 ports in the world20, if we were to model the probability of
one or more attacks in any year on one of those port facilities with λ=1.85, the
probability would be 0.000426355 (see equation 3).
000426355.04339
)()(
10
1
nnplp
n (3)
The resulting model for port security terrorism risk is shown in equation 4.
jij
n
i
m
j
lsptyRiskPortSecuri
))(1(000426355.01 1
(4)
20 <URL:http://www.ports.com> [Accessed 23 April 2010]
71
While this model holds for the assumption that each port is equally likely to be
attacked, it can be improved by obtaining the subjective assessment (expert opinion)
of a terrorism underwriter regarding the terrorism risks in ports in different countries
around the world.
4.2 Portfolio Optimization Analysis of Port Facilities’ Security Systems
The port facility is considered to consist of a portfolio of security systems and a
portfolio optimization exercise is performed to construct the theoretical portfolio of
security systems which performs best to reduce, in turn, security risk and cost.
4.2.1. Portfolio Optimization The parallels that exist between investing in a port facility’s security systems and a
stock portfolio as described in section 2.2 above mean that it is possible to perform
portfolio optimization to discover, for any k port facilities which consist of i security
systems, the optimum combination of the security systems drawn from any of the port
facilities which either minimise the residual risk or the security investment. In our
industry example, there are 216 possible different combinations of the six port
facilities’ three security systems which can be examined and compared to the original
portfolios of security systems in each of the six port facilities on the basis of how the
alternative portfolios reduce the residual risk for the given security investment.
The 216 possible different combinations of the six port facilities’ three security
systems are each labelled as a portfolio as follows:
• Port facility A becomes port facility 1
• Port facility B becomes port facility 2
• Port facility C becomes port facility 3
• Port facility D becomes port facility 4
• Port facility E becomes port facility 5
• Port facility F becomes port facility 6
The three security systems are defined as follows:
• Access Control - A
• Biometrics - B
• Detection - D

72
The change in the labelling is necessary to avoid a clash and potential confusion
between, say, port facility A and access control system A. Therefore, the port
facilities adopt a numerical format for the purposes of the portfolio optimization
exercise.
The portfolio of 216 possible combinations of the 6 port facilities and 3 security
systems is listed in appendix E. The main portfolios are the actual portfolios of the
port facilities themselves:
• Port facility A = A1-B1-D1 (portfolio #1)
• Port facility B = A2-B2-D2 (portfolio #44)
• Port facility C = A3-B3-D3 (portfolio #87)
• Port facility D = A4-B4-D4 (portfolio #130)
• Port facility E = A5-B5-D5 (portfolio #173)
• Port facility F = A6-B6-D6 (portfolio #216)
The performance of the security systems of each port facility’s actual portfolio of
security systems is compared with the 215 alternative portfolios and their residual
security risk is calculated using equation 2, where for each port facility, the
probability of an attack remains the same, as do the consequences of a loss, but the
vulnerability of the port facility to security risk will vary as the portfolio of security
systems vary. Furthermore, as each of the 215 alternative portfolios are modelled for
each port facility, there will be differences in cost of the 215 alternatives to the status
quo. Therefore, the analysis looks for alternative portfolios where both the residual
risk and the security investment can be reduced. The best alternative portfolios which
result in both the greatest reduction in residual security risk and the smallest security
investment are presented in the findings chapter.
4.2.2. The Application of Markowitz Portfolio Selection Theory
In this section the adoption of Markowitz theory of portfolio selection to port security
is described, beginning with the mechanics of the cross-disciplinary adoption of the
theory and concluding with a discussion of the relevant assumptions and limitations of
the adoption in practice. Markowitz theory of portfolio selection is adopted to

73
discover the portfolio of a port facility’s security systems which describe the
Markowitz risk-return efficient frontier. The risk-return equivalents in this research
are the standard deviation and expected performance of the port facility’s portfolio of
security systems. The application of Markowitz theory is subsequently applied to the
port security risk model in a simulation to identify how efficient portfolios can reduce
a port facility’s residual security risk.
The application of Markowitz theory of portfolio selection is achieved by considering
a port facility’s security systems as securities in an investment portfolio and ex-post
the application of Markowitz theory, altering the security investment strategy among
the security systems in order to maximise the portfolio’s performance (return) while
minimising the risk (in this case, standard deviation). The data that is generated
reflects the arrangement of security systems which results in a reduction in the port
facility’s residual security risk for the same investment as ex-ante the application of
Markowitz theory. However, it is necessary to point out the difference between
trading in financial assets and assets such as security systems. While Markowitz
theory was developed for the efficient investment in stocks and shares for a given
level of risk, it is necessary to recognise that there is no market for the trading in a
port facility’s security systems. In these circumstances, tradeability is not applicable
as ownership of port security systems lies with the port facility’s owners, is not
publically traded and knowledge of the subjective assessments of the performance of
security systems is not publically available. Furthermore, such a market would be
constrained by liquidity issues. Nevertheless, this does not mean that the mechanics
of portfolio selection cannot be applied in the field of port security.However, there are
some assumptions which must be made for this approach to work. The first is that the
assets in a portfolio must be sufficiently diversified, that is to say that they should not
be perfectly or too closely correlated in their performance. The second assumption is
than an increase in investment in a security system will result in an improvement in its
performance as part of a portfolio of security systems in a port facility. That is to say
that investment diverted from an underperforming security system to one which
performs favourably in comparison will result in a better performance of the portfolio
as a whole.
Another assumption is that while the probability distribution of terrorist attacks on
ports (from 1968-2007, as demonstrated earlier in this study) follows a Poisson

74
distribution, the performance of the security systems themselves in the face of terrorist
threats is not Poisson, but is normally distributed. However, it is important to
highlight that there is no evidence in this research which suggests that terrorist attacks
against non-port targets follow a Poisson distribution and that there may well be
patterns in terrorism events which cannot be explained by a Poisson distribution.
Further research needs to be done in order to shed light on potential probability
distributions of non-port terrorism.
This is not an unrealistic assumption yet it is essential for a valid application of
Markowitz theory. Furthermore, the risk-return efficient frontier in this research is
not directly concerned with the risk of a terrorist attack but with the risk (in the form
of the standard deviation) of the performance of the port facility’s security systems in
the face of the prescribed security threats. These two concepts of risk are separate and
it is important to make the distinction because we have shown that maritime terrorist
attacks on ports and on vessels in ports follow a Poisson distribution but that the
performance of security systems themselves are more likely to follow a normal
distribution.
The mechanics behind the calculation of a port facility’s residual security risk is set
out below, followed by the methodology for applying Markowitz portfolio selection
theory to the performance of the security systems:
In order to apply Markowitz (1952) theory of portfolio selection to each portfolio or
security systems, it is necessary to calculate the following for each port facility:
the expected performance of the ith security system as shown in equation 5.
(5)
the standard deviation of the performance of the ith security system
the correlations between the performances of the ith and jth security systems in
each port facility , yielding the covariances between the ith and jth security
systems in each port facililty as shown in equation 6:
(6)
The correlations between the performances of the security systems can be calculated
using standard statistical software such as in Excel or SPSS but the key is that expert
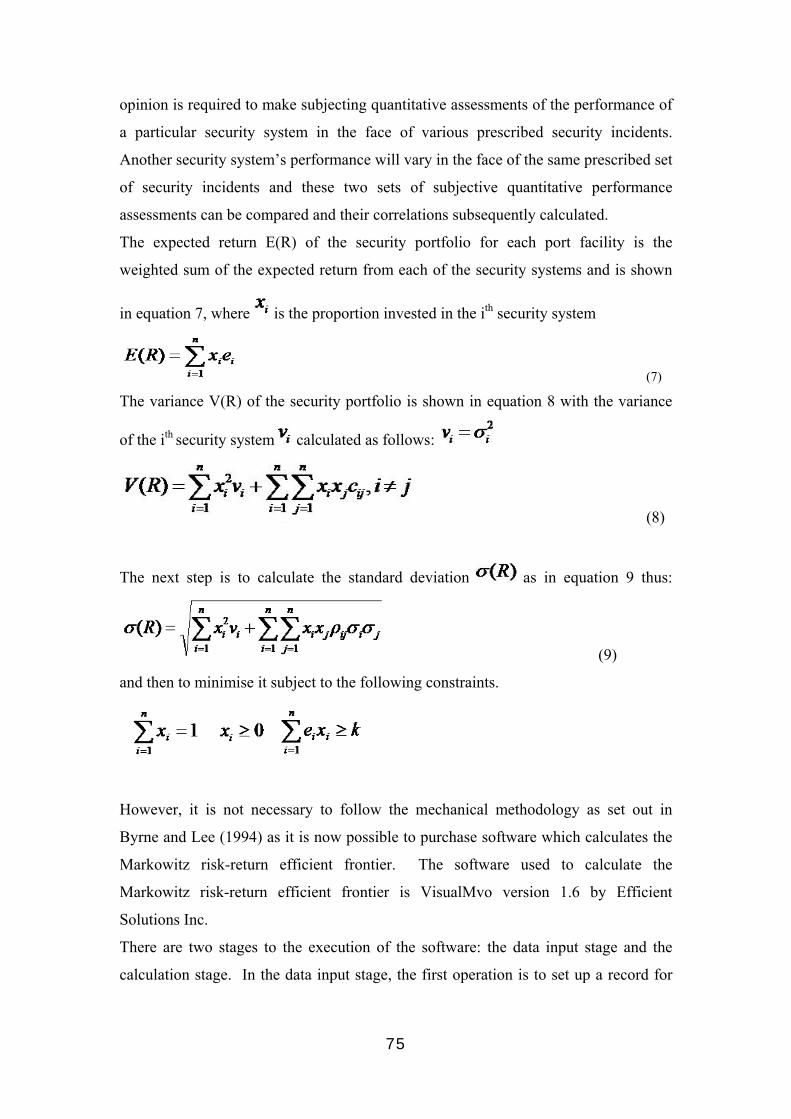
75
opinion is required to make subjecting quantitative assessments of the performance of
a particular security system in the face of various prescribed security incidents.
Another security system’s performance will vary in the face of the same prescribed set
of security incidents and these two sets of subjective quantitative performance
assessments can be compared and their correlations subsequently calculated.
The expected return E(R) of the security portfolio for each port facility is the
weighted sum of the expected return from each of the security systems and is shown
in equation 7, where is the proportion invested in the ith security system
(7)
The variance V(R) of the security portfolio is shown in equation 8 with the variance
of the ith security system calculated as follows:
(8)
The next step is to calculate the standard deviation as in equation 9 thus:
(9)
and then to minimise it subject to the following constraints.
However, it is not necessary to follow the mechanical methodology as set out in
Byrne and Lee (1994) as it is now possible to purchase software which calculates the
Markowitz risk-return efficient frontier. The software used to calculate the
Markowitz risk-return efficient frontier is VisualMvo version 1.6 by Efficient
Solutions Inc.
There are two stages to the execution of the software: the data input stage and the
calculation stage. In the data input stage, the first operation is to set up a record for

76
each of the three security systems: access control, biometrics and detection. For each
record there are five fields which require populating. They are:
1. the mean of the performance of the security system
2. the standard deviation of the performance of the security system
3. the correlation of the performance of the security system with the
performances of the other two security systems
4. A minimum constraint
5. A maximum constraint
The minimum and maximum constraints represent the constraints that are imposed on
the proportion of the overall port facility’s security investment on any one security
system. For example, if no minimum constraint is applied to any of the security
systems, the application of Markowitz theory of portfolio selection may result in the
algorithm selecting a single security system solution to secure the port facility
efficiently. Furthermore, there are two problems with a ‘no minimum’ constraint
approach. First, it is contrary to the principle of a portfolio of security systems to
counteract the prescribed security incidents by employing only one security solution.
Secondly, it would be in breach of the principles of the ISPS Code which prescribes
the application of different types of security equipment in order to comply with the
Code. In view of this, it was decided that a minimum security investment constraint
of 5% of the overall security budget for each port facility would be applied to each
security system in the application of Markowitz theory of portfolio selection.
A simulation of the port security model and the application of Markowitz theory is set
out below. Recalling equation 4, in order to calculate the security risk, it is necessary
to arrive at estimates for the performance of the security systems in the face of
prescribed security incidents. In the simulation it is assumed that there are three
security systems: access control, biometrics and detection in a given port facility. The
simulation includes one type of terrorist attack: a bomb planted in the engine room of
a container vessel moored alongside the port facility. The occurrence of the security
incident would cause the engine room and subsequently the vessel and half the
containers to catch fire and sink at the mooring. Vessel and cargo damage, wreck
removal and business interruption to the port facility is estimated to total
$100,000,000. The probability of the attack is taken to be the threat coefficient in
equation 4. Therefore, in the absence of any security systems, i.e. with the port

77
facility’s vulnerability set equal to 1, the port security risk is $100,000,000 *
0.0426355% = $42,635.50.
In order to calculate the residual security risk, estimated for the performances of the
three security systems are made. They are set out in table 4.4. Furthermore, estimates
of how the performances of the security systems are correlated are set out in table 4.5.
This is necessary in order to be able to plot the Markowitz risk-return efficient
frontier.
Security System
PerformanceStandard deviation
Access Control
80% 20%
Biometrics 60% 10% Detection 40% 8%
Table 4.4 – Port security simulation: estimates of the performance of the security systems The figures for the performances in table 4.4 represent the probability that each
security solution will, independently, prevent the occurrence of the security incident.
Taken together, these performance figures represent the port facility’s vulnerability to
attack and the higher the performance figures, the lower the vulnerability.
Table 4.5 – Port security simulation: estimates of the correlations of the performance of the security systems The data in tables 4.4 and 4.5 are used to plot the expected return-standard deviation
efficient frontier for the port facility’s security systems, as shown in chart 4.1. The
result tells us that in order to achieve the maximum return for the performance of the
security systems of 77.00%, it is necessary to tolerate a level of risk reflected in the
standard deviation of 18.49%. This is achieved by investing 90% of the port security
budget in the access control system and 5% in both the biometrics and detection
systems.
CorrelationsAccess Control
Biometrics Detection
Access Control
1 0.75 0.25
Biometrics 0.75 1 0.5Detection 0.25 0.5 1

78
However, it is also possible to achieve a much more modest level of performance in
the security systems but at lower level of risk that the systems fail to perform as they
should. The corresponding figures for performance and standard deviation are
46.12% and 7.68% respectively. This is achieved by investing 5% of the port security
budget in access control, 20.6% in biometrics and 74.4% in detection systems.
What this means in practice is that the company security officer may decide to
rearrange the security investments in order to suit his or her appetite for risk. A
higher risk security investment strategy would be allocate the majority of the security
budget to access control measures in order to benefit from a higher mean performance
while accepting the accompanying risk that the performance level has a higher
standard deviation. A lower risk security investment strategy would be one where the
majority of the security investment is directed towards detection systems and the
biometrics: while the overall performance may be less, the security officer has the
knowledge that the performance of the security systems has a lower standard
deviation. One way in which the company security officer might settle on a
particular strategy would be to evaluate the performance / cost-benefit ratios of the
two security strategies and decide accordingly at which point along the efficient
frontier should the company’s security strategy be based.
From equation 4, the port security risk when the performances of the security systems
are maximised is $9,806.17 and when the standard deviation is minimised, the
corresponding figure for the port security risk is $22,972.01.
It is important to note that these two solutions represent the extremes of the efficient
solutions which can be obtained and that all the points along the line in chart 4.1 are
efficient, each point representing a different portfolio of the three security systems
with corresponding results for expected performance and risk that the security
solutions do not perform as they should to mitigate the security threatIn the next
chapter, both the Markowitz theory of portfolio selection and the portfolio
optimization method as described above will be applied to the data gathered in the
research.
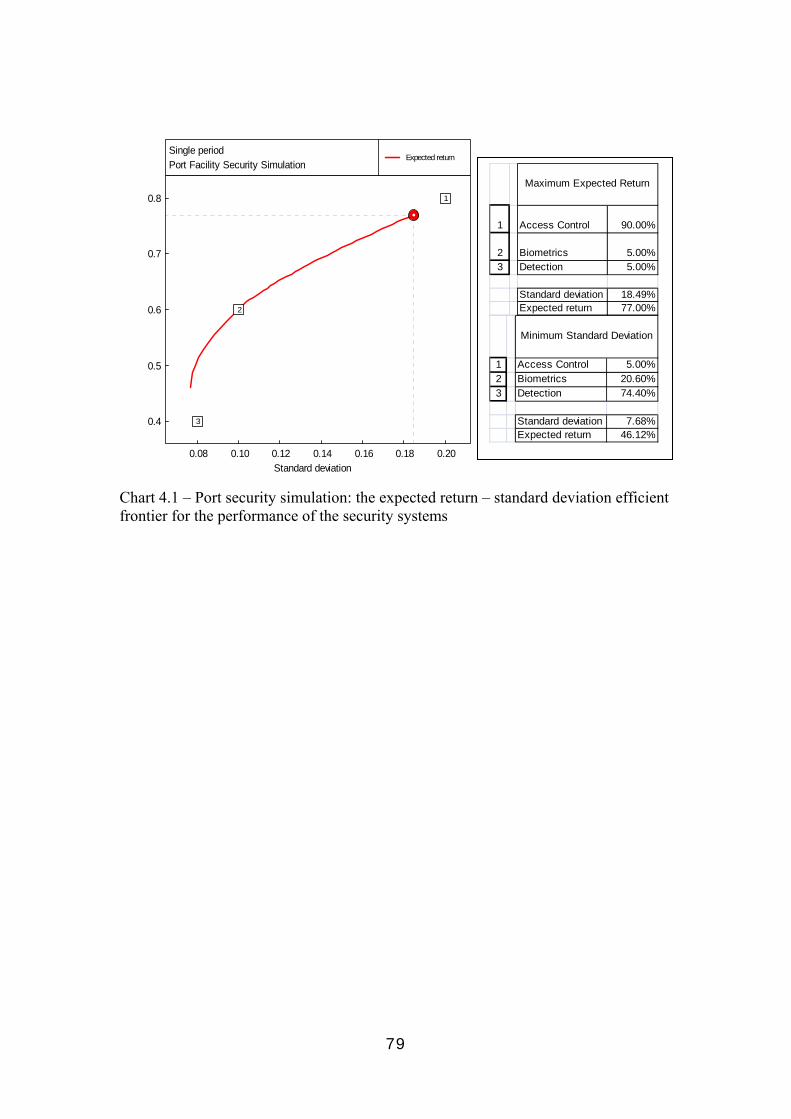
79
Chart 4.1 – Port security simulation: the expected return – standard deviation efficient frontier for the performance of the security systems
Single periodPort Facility Security Simulation
0.08 0.10 0.12 0.14 0.16 0.18 0.20
0.4
0.5
0.6
0.7
0.8
Standard deviation
Expected return
1
2
3
1 Access Control 90.00%
2 Biometrics 5.00%3 Detection 5.00%
Standard deviation 18.49%Expected return 77.00%
Maximum Expected Return
1 Access Control 5.00%2 Biometrics 20.60%3 Detection 74.40%
Standard deviation 7.68%Expected return 46.12%
Minimum Standard Deviation

80
Chapter 5 – Findings The chapter begins with the estimates for physical damage and business interruption
to Port facility A resulting from the prescribed security incidents from the interview
with the Director of Security on 24 March 2009. As has already been mentioned, the
data for the insured values of port facility Equipment and infrastructure was provided
by the Director of Security only for port facility A. Therefore, estimates of the
equivalent figures for the other terminals were extrapolated based on the quay length
and number of quay cranes in the other terminals. The data for the insured values is
not subject to any excess which may be applicable for each and every loss or in the
aggregate. This is because the use of insurance data is intended as a guide for
potential loss in US Dollar terms for each of the prescribed security incidents.
Subsequently, each port facility is presented in turn. The findings for each port
facility consist of four data tables and a chart showing the expected performance-
standard deviation efficient frontier. The first table contains the estimates of physical
damage, business interruption and the expected gross loss to the port facility
following the seven prescribed security incidents. The table includes the
underwriter’s assessment of the probability of the occurrence of the security incident.
In the first table, the expected loss of each security incident is calculated as the
product of the combined physical damage and business interruption amounts and the
probability of occurrence.
The second table shows the company security officer’s subjective assessment of the
performance of the port facility’s security systems (access control, biometrics and
detection) in the face of the prescribed security scenarios. The table includes the
means and standard deviations of the performances of each security system.
The third table shows the calculation of the port facility’s residual risk after the
application of security measures. The fourth table contains the correlations of the
performances of the port facility’s security systems. Correlations that are significant
at the 0.01 or 0.05 level are marked accordingly.
It is appropriate to mention at this juncture one key assumption, namely that security
investment diverted from an underperforming security system to one which performs
better will result in an overall improvement in the performance of the portfolio of
security systems as a whole. This is, after all, one of the key tenets of portfolio
theory.

81
Next, the portfolio optimization is performed which examines the performances of the
216 possible portfolios consisting of the three security systems across the six port
facilities. The chapter concludes with an explanation for the clustering effect
encountered in the portfolio optimization; and then presents the data gathered from a
follow-up telephone interview with the second CSO which is used to calculate
Cronbach’s measure for data reliability (Cronbach, 1951; Forza, 2002).
5.1 Estimates for Physical Loss and Business Interruption from the Prescribed Security Incidents In this section the estimates for physical loss and business interruption from the seven
different prescribed security threats are presented. For each prescribed security
incident the potential losses of physical damage and business interruption are
estimated in US$ terms and consideration is given to the likely location and severity
of each prescribed security incident within the port facility.
For the bomb introduced by person on foot, The Director of Security estimated that
the physical loss would be $5,375,000, with a breakdown by area of loss in table 5.1.
This consists chiefly of destruction of the security hut and main security gate with
replacement costs of biometric equipment and a certain amount of damage to the
CCTV systems. It also contains a figure for other unspecified infrastructure damage.
The total business interruption figure he estimated to be $10,000,000: representing
$5,000,000 from business interruption and $5,000,000 from increased direct and
indirect insurance costs.
security hut 250,000 main security gate 50,000 Biometrics 50,000 CCTV systems 25,000 Infrastructure 5,000,000 5,375,000
Table 5.1 – Estimated physical loss arising from a bomb introduced by foot
For the car bomb, he estimated that the physical loss would be $36,769,695, with a
breakdown by area of loss in table 5.2. This consists chiefly of destruction of the
security hut and main security gate with replacement costs of biometric equipment
and a certain amount of damage to the CCTV systems. It also contains a figure for
the destruction of the operations building and a figure for other unspecified
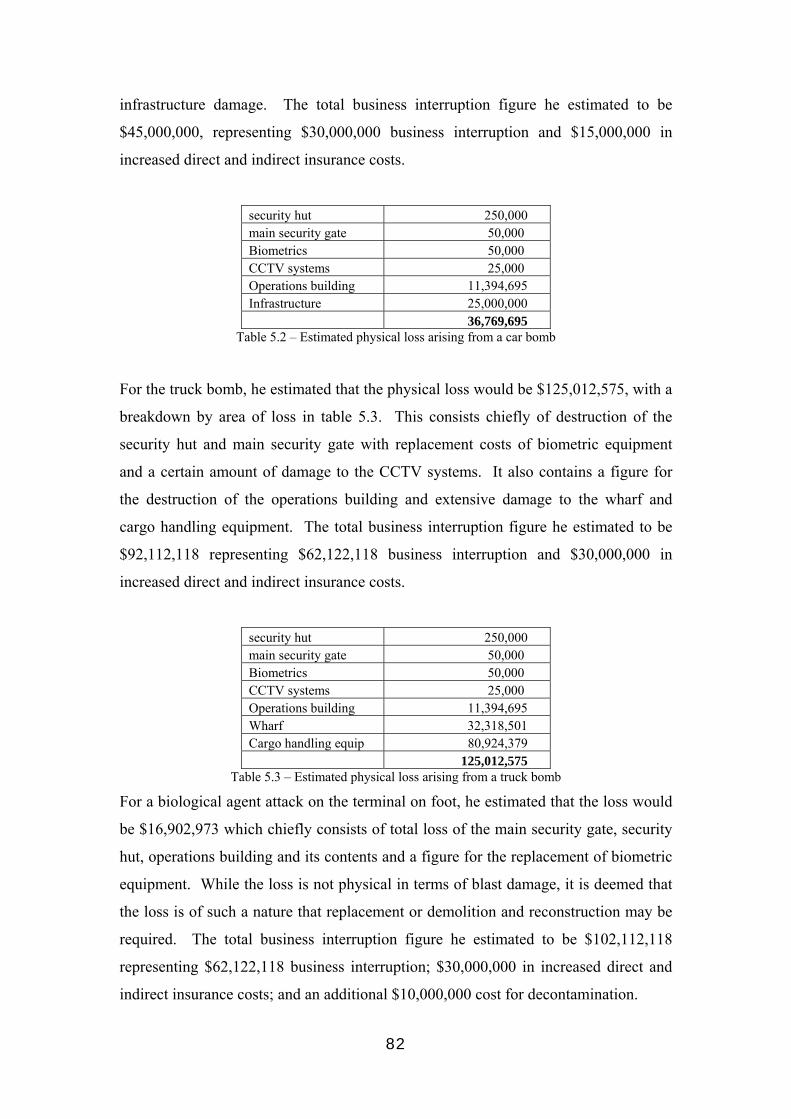
82
infrastructure damage. The total business interruption figure he estimated to be
$45,000,000, representing $30,000,000 business interruption and $15,000,000 in
increased direct and indirect insurance costs.
security hut 250,000 main security gate 50,000 Biometrics 50,000 CCTV systems 25,000 Operations building 11,394,695 Infrastructure 25,000,000 36,769,695
Table 5.2 – Estimated physical loss arising from a car bomb
For the truck bomb, he estimated that the physical loss would be $125,012,575, with a
breakdown by area of loss in table 5.3. This consists chiefly of destruction of the
security hut and main security gate with replacement costs of biometric equipment
and a certain amount of damage to the CCTV systems. It also contains a figure for
the destruction of the operations building and extensive damage to the wharf and
cargo handling equipment. The total business interruption figure he estimated to be
$92,112,118 representing $62,122,118 business interruption and $30,000,000 in
increased direct and indirect insurance costs.
security hut 250,000 main security gate 50,000 Biometrics 50,000 CCTV systems 25,000 Operations building 11,394,695 Wharf 32,318,501 Cargo handling equip 80,924,379 125,012,575
Table 5.3 – Estimated physical loss arising from a truck bomb
For a biological agent attack on the terminal on foot, he estimated that the loss would
be $16,902,973 which chiefly consists of total loss of the main security gate, security
hut, operations building and its contents and a figure for the replacement of biometric
equipment. While the loss is not physical in terms of blast damage, it is deemed that
the loss is of such a nature that replacement or demolition and reconstruction may be
required. The total business interruption figure he estimated to be $102,112,118
representing $62,122,118 business interruption; $30,000,000 in increased direct and
indirect insurance costs; and an additional $10,000,000 cost for decontamination.

83
Security hut 250,000 Main security gate 50,000 Biometrics 50,000 Building contents 5,158,278 Operations building 11,394,695 16,902,973
Table 5.4 – Estimated loss arising from a biological agent attack on the terminal on foot
For a biological agent attack on the terminal by car, he estimated that the physical
damage loss would be $87,432,657 which chiefly consists of total loss of the main
security gate, security hut, operations building and its contents and a figure for the
replacement of biometric equipment. While the loss is not physical in terms of blast
damage, it is deemed that the loss is of such a nature that replacement or demolition
and reconstruction may be required. The total business interruption figure he
estimated to be $122,112,118 representing $62,122,118 business interruption;
$30,000,000 in increased direct and indirect insurance costs; and an additional
$30,000,000 cost for decontamination.
security hut 50,000 main security gate 50,000 biometrics 50,000 Building contents 5,158,278 Wharf 1,000,000 Cargo handling equip 80,924,379 87,432,657
Table 5.5 – Estimated loss arising from a biological agent attack on the terminal by car
For the mining of port infrastructure, he estimated a physical damage loss of
$56,000,000 being $16,000,000 damage to the wharf and $40,000,000 damage to
cargo handling equipment, based on a blast radius of 300 metres. The total figure for
business interruption is $92,122,118 consisting of a business interruption loss of
$62,122,118 and increased direct and indirect insurance costs of $30,000,000.
For the vessel attacked by a suicide boat, he estimated a physical damage loss of
damage of $113,242,880 being $32,318,501 damage to the wharf and $80,924,379
damage to cargo handling equipment, effectively a total loss. The total figure for
business interruption is $122,122,118 consisting of a business interruption loss of
84
$62,122,118; increased direct and indirect insurance costs of $30,000,000; and a
wreck removal expense of $30,000,000.
While the data for the insured values of the wharfs and cargo handling equipment of
the other port facilities can be estimated through extrapolation, the figures for
business interruption are difficult to quantify. In theory it could be feasible to
extrapolate the business interruption figures based on the TEU throughput of the port
facility but as port facility charges, profit margins and other unknowns are at play, it
was felt that pure extrapolation could potentially introduce further errors into the data.
Therefore, it was decided that the figures for business interruption across all the port
facilities would remain the same as for the data for port facility A. While this is not
ideal, it is the gap in the empirical data which has necessitated this approach.

85
5.2 Port Facility A
The estimates for the physical damage, business interruption and expected gross loss
for port facility A are in table 5.6. The port facility is rated by the underwriters to
have the highest terrorist risk of all of the port facilities in this study. The probability
assigned to a possible terrorist attack on the container terminal at 0.522% is 34 times
greater than the equivalent figure for port facility B. This high figure for the
probability of a terrorist attack results in a large figure for the expected loss, in the
absence of any security measures, being $5,525,216 on an annualised basis.
Table 5.6 –Port facility A estimates of physical damage, business interruption and gross expected loss
Security Systems’ Performance
The access control measures (see table 5.7) have a mean performance of 72.86%
which is the second highest among the six terminals and a standard deviation of
15.77% which is the second lowest among the terminals. The access control measures
are also the cheapest of the six terminals, being $187,826. The biometric systems
have a mean performance of 63.57% which is the fourth highest and a standard
deviation of 43.47% which is also the fourth highest among the terminals. The
biometric systems are also the third cheapest at $33,637, compared with the other
systems. Of the detection systems, the mean performance is 68.57% which is the
second highest and the standard deviation of 12.82% is the second lowest compared
with the five other terminals. The cost of the detection systems at $261,999 are also
the second cheapest of the detection systems across the six terminals. Overall, the
access control and detection systems compare very favourably on both performance
and cost when compared with the other terminals.
Port Facility A Infrastructure Damage and Business Interruption Expected Loss
Type of Security Incident Physical damage Business interruption Total $ ProbabilityExpected LossBomb introduced by person on foot 5,375,000 10,000,000 15,375,000 0.522% 80,258 Car Bomb 36,769,695 45,000,000 81,769,695 0.522% 426,838 Truck bomb 125,012,575 92,122,118 217,134,693 0.522% 1,133,443 Biological agent attack on terminal - on foot 16,902,973 102,122,118 119,025,091 0.522% 621,311 Biological agent attack on terminal - by vehicle 87,432,657 122,122,118 209,554,775 0.522% 1,093,876 Mining of port infrastructure 56,000,000 92,122,118 148,122,118 0.522% 773,197 Vessel attacked by a suicide boat 113,242,880 122,122,118 235,364,998 0.522% 1,228,605
1,026,346,370 Total 5,357,528

86
Table 5.7 – Port facility A security system performances, including means and standard deviations
Security Performance Ratios
Two ratios are now introduced for port security: a benefit-cost ratio and a residual risk
: expected loss ratio.
The application of the security measures results in a reduction in the expected loss of
$3,444,899 to $1,912,629. Given that the overall expenditure on security is $483,462,
the residual risk reduction : security expenditure (benefit-cost) ratio is 7.13. This
means that for every $1 spent on security, the residual security risk is reduced by
$7.13.
The residual risk : expected loss ratios for the different types of security incident are
lowest for the truck bomb and the biological agent attack by vehicle at 16.7% (see
table 5.8). This means that the terminal is best placed to thwart attacks of that type
compared to the other types of security incident.
Table 5.8 –Port facility A residual security risk calculations
Port Facility A Residual Risk Calculations
Type of Security Incident Access Control Biometrics Detection Total
Residual Risk/Expected Loss
Bomb introduced by person on foot 5,351 2,675 6,688 14,714 18.3%Car Bomb 28,456 14,228 35,570 78,254 18.3%Truck bomb 56,672 56,672 75,563 188,907 16.7%Biological agent attack on terminal - on foot 41,421 20,710 51,776 113,907 18.3%Biological agent attack on terminal - by vehicle 54,694 36,463 91,156 182,313 16.7%Mining of port infrastructure 128,866 257,732 128,866 515,465 66.7%Vessel attacked by a suicide boat 204,768 409,535 204,768 819,070 66.7%
Residual Risk 520,227 798,016 594,387 1,912,629
Security Cost 187,826 33,637 261,999 483,462

87
Markowitz Portfolio Analysis
Recalling the Markowitz methodology as set out in section 4.2.1, the application of
Markowitz theory of portfolio selection requires the calculation of the expected
performance of the ith security system; the standard deviation of the performance of
the ith security system; and the correlations between the performances of the ith and jth
security systems in each port facility, which yields the covariances between them.
The correlations between the security systems are set out in table 5.9. All of them are
positive and significant at the 0.01 level.
Correlations
Access Control Biometrics Detection 1.000 0.985** 0.992** Access Control
0.985** 1.000 0.983** Biometrics 0.992** 0.983** 1.000 Detection
**Correlation significant at the 0.01 level (2-tailed) Table 5.9 – Port facility A security system performance correlations
The Markowitz efficient frontier is calculated from the data in tables 5.7 and 5.9 and
the efficient expected return-standard deviation frontier is plotted in chart 5.1. The
application of Markowitz theory yields a maximum expected return of 72.18% with a
standard deviation of 16.97%. This is based on 90% of the security spend being
invested in access control measures with 5% respectively invested in biometrics and
detection. This results in a revised figure for the residual risk of $1,490,464, which is
a reduction of $422,165.

88
Chart 5.1 – Markowitz expected return-standard deviation efficient frontier for Port
Facility A
The results of the minimum standard deviation with accompanying expected return
are 68.53% for the performance and the figure for the standard deviation is 14.46%.
This is derived by diverting 90% of the security spend on detection with only 5%
investment in both access control measures and biometrics. This results in a revised
figure for the residual risk of $1,686,014 which is a reduction of $226,615.
Single period
Port Facility A expected return-standard deviation
0.1 0.2 0.3 0.4
0.630
0.645
0.660
0.675
0.690
0.705
0.720
0.735
Standard deviation
Expected return
1
2
3
1 Access Control 90.00%2 Biometrics 5.00%3 Detection 5.00%
Standard deviation 16.97%Expected return 72.18%
Maximum Expected Return
1 Access Control 5.00%2 Biometrics 5.00%3 Detection 90.00%
Standard deviation 14.46%Expected return 68.53%
Minimum Standard Deviation

89
5.3 Port Facility B The port facility is rated by the underwriters to have the lowest terrorist risk of all of
the port facilities in this study. The probability assigned to a possible terrorist attack
on the container terminal is just 0.0152%. This low figure for the probability of a
terrorist attack results in a low figure for the expected loss, in the absence of any
security measures, being $160,888 an annualised basis. The estimates for the physical
damage, business interruption and expected gross loss for port facility B are in table
5.10.
Table 5.10 – Port facility B estimates of physical damage, business interruption and gross expected loss
The detection systems for waterborne attack scenarios are more sophisticated than in
other terminals. The company has recently installed cameras along the quay walls
which are linked to the local port authority and are used by the terminal as a security
detection measure and by the port authority to supplement their traffic management
systems. The terminal’s main concern had been the prevention of canoeists who
frequent the channel from landing at the port facility. Furthermore, the high level of
detection rates results from a reciprocal use of port authority cameras by the port
facility and also the fact that the port facility Authority will warn the terminal before
an attempt has been made to gain access to the terminal.
From the point of view of the access control measures concerning the seaward attacks
scenarios, the access control measure results of 50% reflect the presence of the
waterborne patrols by local coast guard.
Security Systems’ Performance
The access control measures (see table 5.11) have a mean performance of 76.43%
which is the highest among the six terminals and a standard deviation of 18.42%
which is the third lowest among the terminals. The cost of the access control
Port Facility B Infrastructure Damage and Business Interruption Expected Loss
Type of Security Incident Physical damage Business interruption Total $ ProbabilityExpected LossBomb introduced by person on foot 5,375,000 10,000,000 15,375,000 0.0152% 2,337 Car Bomb 36,769,695 45,000,000 81,769,695 0.0152% 12,429 Truck bomb 125,012,575 92,122,118 217,134,693 0.0152% 33,004 Biological agent attack on terminal - on foot 11,744,695 97,122,118 108,866,813 0.0152% 16,548 Biological agent attack on terminal - by vehicle 92,472,157 132,122,118 224,594,275 0.0152% 34,138 Mining of port infrastructure 113,242,880 92,122,118 205,364,998 0.0152% 31,215 Vessel attacked by a suicide boat 113,242,880 92,122,118 205,364,998 0.0152% 31,215
1,058,470,472 Total 160,888
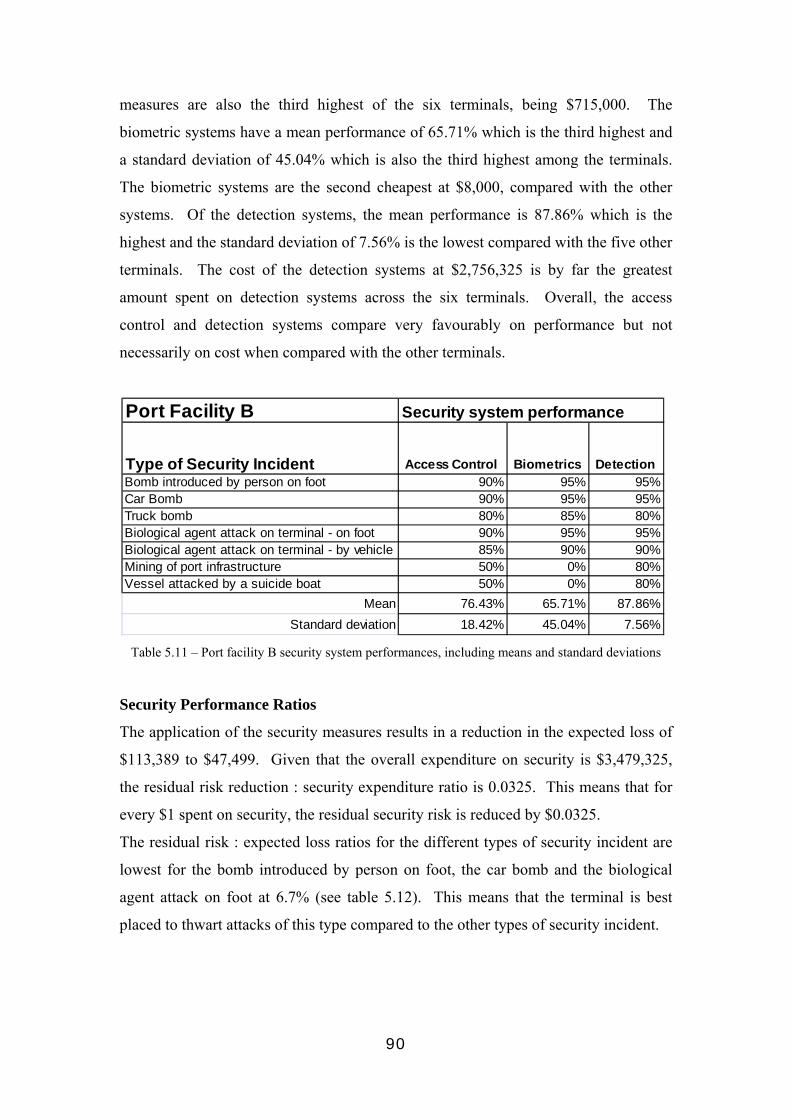
90
measures are also the third highest of the six terminals, being $715,000. The
biometric systems have a mean performance of 65.71% which is the third highest and
a standard deviation of 45.04% which is also the third highest among the terminals.
The biometric systems are the second cheapest at $8,000, compared with the other
systems. Of the detection systems, the mean performance is 87.86% which is the
highest and the standard deviation of 7.56% is the lowest compared with the five other
terminals. The cost of the detection systems at $2,756,325 is by far the greatest
amount spent on detection systems across the six terminals. Overall, the access
control and detection systems compare very favourably on performance but not
necessarily on cost when compared with the other terminals.
Table 5.11 – Port facility B security system performances, including means and standard deviations
Security Performance Ratios
The application of the security measures results in a reduction in the expected loss of
$113,389 to $47,499. Given that the overall expenditure on security is $3,479,325,
the residual risk reduction : security expenditure ratio is 0.0325. This means that for
every $1 spent on security, the residual security risk is reduced by $0.0325.
The residual risk : expected loss ratios for the different types of security incident are
lowest for the bomb introduced by person on foot, the car bomb and the biological
agent attack on foot at 6.7% (see table 5.12). This means that the terminal is best
placed to thwart attacks of this type compared to the other types of security incident.
Port Facility B Security system performance
Type of Security Incident Access Control Biometrics DetectionBomb introduced by person on foot 90% 95% 95%Car Bomb 90% 95% 95%Truck bomb 80% 85% 80%Biological agent attack on terminal - on foot 90% 95% 95%Biological agent attack on terminal - by vehicle 85% 90% 90%Mining of port infrastructure 50% 0% 80%Vessel attacked by a suicide boat 50% 0% 80%
Mean 76.43% 65.71% 87.86%
Standard deviation 18.42% 45.04% 7.56%

91
Table 5.12 –Port facility B residual security risk calculations
Markowitz Portfolio Analysis
The correlations between the security systems are set out in table 5.13. The
correlations of the performances of access control and biometrics are positive and
significant at the 0.01 level while the correlations of the performances of access
control and detection and biometrics and detection are positive and significant at the
0.05 level.
Correlations
Access Control Biometrics Detection 1.000 0.993** 0.834* Access Control
0.993** 1.000 0.764* Biometrics 0.834* 0.764* 1.000 Detection
**Correlation significant at the 0.01 level (2-tailed) *Correlation significant at the 0.05 level (2-tailed) Table 5.13 – Port facility B security system performance correlations
The Markowitz efficient frontier is calculated from the data in tables 5.11 and 5.13
and the efficient expected return-standard deviation frontier is plotted in chart 5.2.
The application of Markowitz theory yields only one solution: an expected return of
86.18% with a standard deviation of 9.5%. This is based on 90% of the security
spend being invested in detection measures with 5% respectively invested in access
control and biometrics. This results in a revised figure for the residual risk of
$22,235, which is a reduction of $25,264.
Port Facility B Residual Risk Calculations
Type of Security Incident Access Control Biometrics Detection Total
Residual Risk/Expected Loss
Bomb introduced by person on foot 78 39 39 156 6.7%Car Bomb 414 207 207 829 6.7%Truck bomb 2,200 1,650 2,200 6,051 18.3%Biological agent attack on terminal - on foot 552 276 276 1,103 6.7%Biological agent attack on terminal - by vehicle 1,707 1,138 1,138 3,983 11.7%Mining of port infrastructure 5,203 10,405 2,081 17,689 56.7%Vessel attacked by a suicide boat 5,203 10,405 2,081 17,689 56.7%
Residual Risk 15,356 24,120 8,022 47,499
Security Cost 715,000 8,000 2,756,325 3,479,325

92
Chart 5.2 – Markowitz expected return-standard deviation efficient frontier for Port
Facility B
Single period
Port Facility B (min and max s.d.)
0.0 0.1 0.2 0.3 0.4
0.7
0.8
Standard deviation
Expected return
1
2
3
A
1 Access Control 5.00%2 Biometrics 5.00%3 Detection 90.00%
Standard deviation 9.50%Expected return 86.18%
Maximum Expected Return and Minimum Standard
Deviation
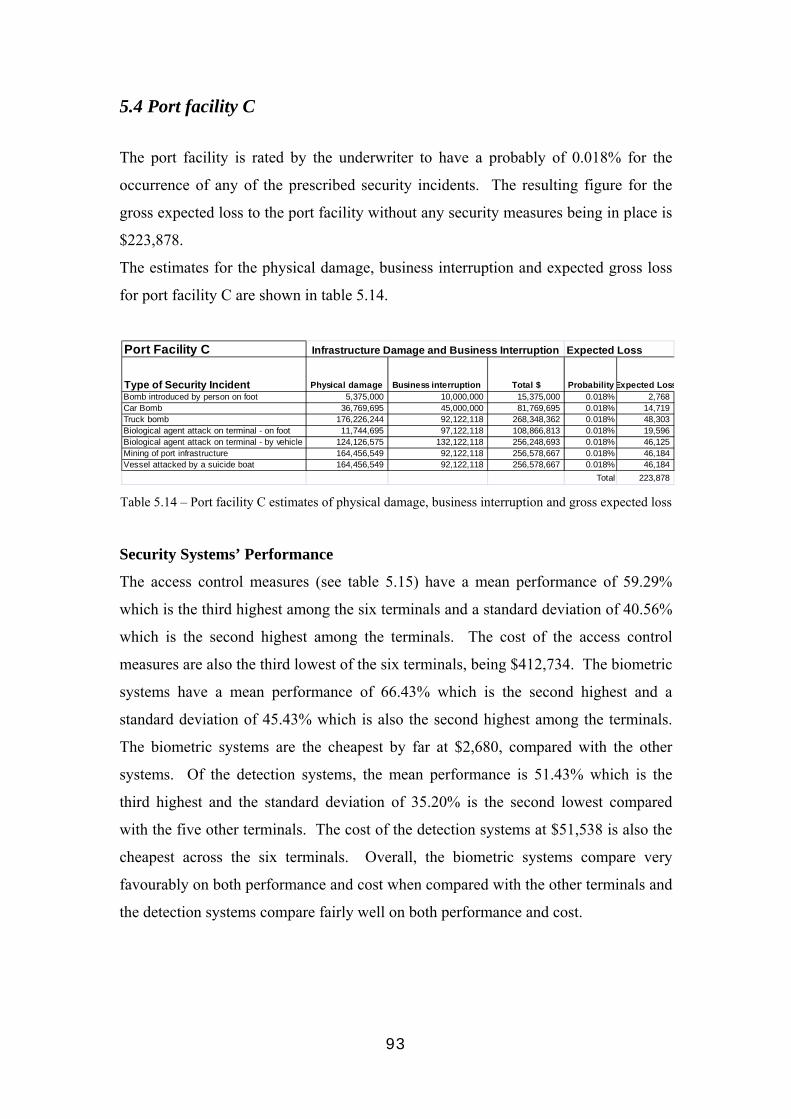
93
5.4 Port facility C
The port facility is rated by the underwriter to have a probably of 0.018% for the
occurrence of any of the prescribed security incidents. The resulting figure for the
gross expected loss to the port facility without any security measures being in place is
$223,878.
The estimates for the physical damage, business interruption and expected gross loss
for port facility C are shown in table 5.14.
Table 5.14 – Port facility C estimates of physical damage, business interruption and gross expected loss
Security Systems’ Performance
The access control measures (see table 5.15) have a mean performance of 59.29%
which is the third highest among the six terminals and a standard deviation of 40.56%
which is the second highest among the terminals. The cost of the access control
measures are also the third lowest of the six terminals, being $412,734. The biometric
systems have a mean performance of 66.43% which is the second highest and a
standard deviation of 45.43% which is also the second highest among the terminals.
The biometric systems are the cheapest by far at $2,680, compared with the other
systems. Of the detection systems, the mean performance is 51.43% which is the
third highest and the standard deviation of 35.20% is the second lowest compared
with the five other terminals. The cost of the detection systems at $51,538 is also the
cheapest across the six terminals. Overall, the biometric systems compare very
favourably on both performance and cost when compared with the other terminals and
the detection systems compare fairly well on both performance and cost.
Port Facility C Infrastructure Damage and Business Interruption Expected Loss
Type of Security Incident Physical damage Business interruption Total $ ProbabilityExpected LossBomb introduced by person on foot 5,375,000 10,000,000 15,375,000 0.018% 2,768 Car Bomb 36,769,695 45,000,000 81,769,695 0.018% 14,719 Truck bomb 176,226,244 92,122,118 268,348,362 0.018% 48,303 Biological agent attack on terminal - on foot 11,744,695 97,122,118 108,866,813 0.018% 19,596 Biological agent attack on terminal - by vehicle 124,126,575 132,122,118 256,248,693 0.018% 46,125 Mining of port infrastructure 164,456,549 92,122,118 256,578,667 0.018% 46,184 Vessel attacked by a suicide boat 164,456,549 92,122,118 256,578,667 0.018% 46,184
Total 223,878

94
Table 5.15 – Port facility C security system performances, including means and standard deviations
Security Performance Ratios
The application of the security measures results in a reduction in the expected loss of
$109,860 to $114,018. Given that the overall expenditure on security is $466,952, the
residual risk reduction : security expenditure ratio is 0.235. This means that for every
$1 spent on security, the residual security risk is reduced by $0.235.
The residual risk : expected loss ratios for the different types of security incident are
lowest for the car and the biological agent attack by vehicle at 15.0% (see table 5.16).
This means that the terminal is best placed to thwart attacks of this type compared to
the other types of security incident.
Table 5.16 – Port facility C residual security risk calculations
Markowitz Portfolio Analysis
The correlations between the security systems are set out in table 5.17. All of them
are positive and significant at the 0.01 level.
Port Facility C Security system performance
Type of Security Incident Access Control Biometrics DetectionBomb introduced by person on foot 80% 90% 70%Car Bomb 85% 95% 75%Truck bomb 85% 95% 70%Biological agent attack on terminal - on foot 80% 90% 70%Biological agent attack on terminal - by vehicle 85% 95% 75%Mining of port infrastructure 0% 0% 0%Vessel attacked by a suicide boat 0% 0% 0%
Mean 59.29% 66.43% 51.43%
Standard deviation 40.56% 45.43% 35.20%
Port Facility C Residual Risk Calculations
Type of Security Incident Access Control Biometrics Detection Total
Residual Risk/Expected Loss
Bomb introduced by person on foot 185 92 277 554 20.0%Car Bomb 736 245 1,227 2,208 15.0%Truck bomb 2,415 805 4,830 8,050 16.7%Biological agent attack on terminal - on foot 1,306 653 1,960 3,919 20.0%Biological agent attack on terminal - by vehicle 2,306 769 3,844 6,919 15.0%Mining of port infrastructure 15,395 15,395 15,395 46,184 100.0%Vessel attacked by a suicide boat 15,395 15,395 15,395 46,184 100.0%
Residual Risk 37,738 33,354 42,926 114,018
Security Cost 412,734 2,680 51,538 466,952

95
Correlations
Access Control Biometrics Detection 1.000 1.000** 0.999** Access Control
1.000** 1.000 .0999** Biometrics 0.999** 0.999** 1.000 Detection
**Correlation significant at the 0.01 level (2-tailed) Table 5.17 – Port facility C security system performance correlations
The Markowitz efficient frontier is calculated from the data in tables 5.15 and 5.17
and the efficient expected return-standard deviation frontier is plotted in chart 5.3.
The application of Markowitz theory yields a maximum expected return of 65.32%
with a standard deviation of 44.67%. This is based on 90% of the security spend
being invested in biometrics with 5% respectively invested in access control and
detection. This results in a revised figure for the residual risk of $77,641 which is a
reduction of $36,377.
Chart 5.3 - Markowitz expected return-standard deviation efficient frontier for Port
Facility C
Single period
Port Facility C expected return-standard deviation
0.36 0.38 0.40 0.42 0.44 0.46
0.51
0.54
0.57
0.60
0.63
0.66
Standard deviation
Expected return
1
2
3
1 Access Control 5.00%2 Biometrics 90.00%3 Detection 5.00%
Standard deviation 44.67%Expected return 65.32%
Maximum Expected Return
1 Access Control 5.00%2 Biometrics 5.00%3 Detection 90.00%
Standard deviation 35.98%Expected return 52.57%
Minimum Standard Deviation
96
For the Markowitz minimum standard deviation with accompanying expected return,
the figure for the expected return is 52.57% and the figure for the standard deviation
is 35.98%. This is derived by diverting 90% of the security spend on detection with
only 5% investment in both access control measures and biometrics. This results in a
revised figure for the residual risk of $106,185 which is a reduction of $7,833.
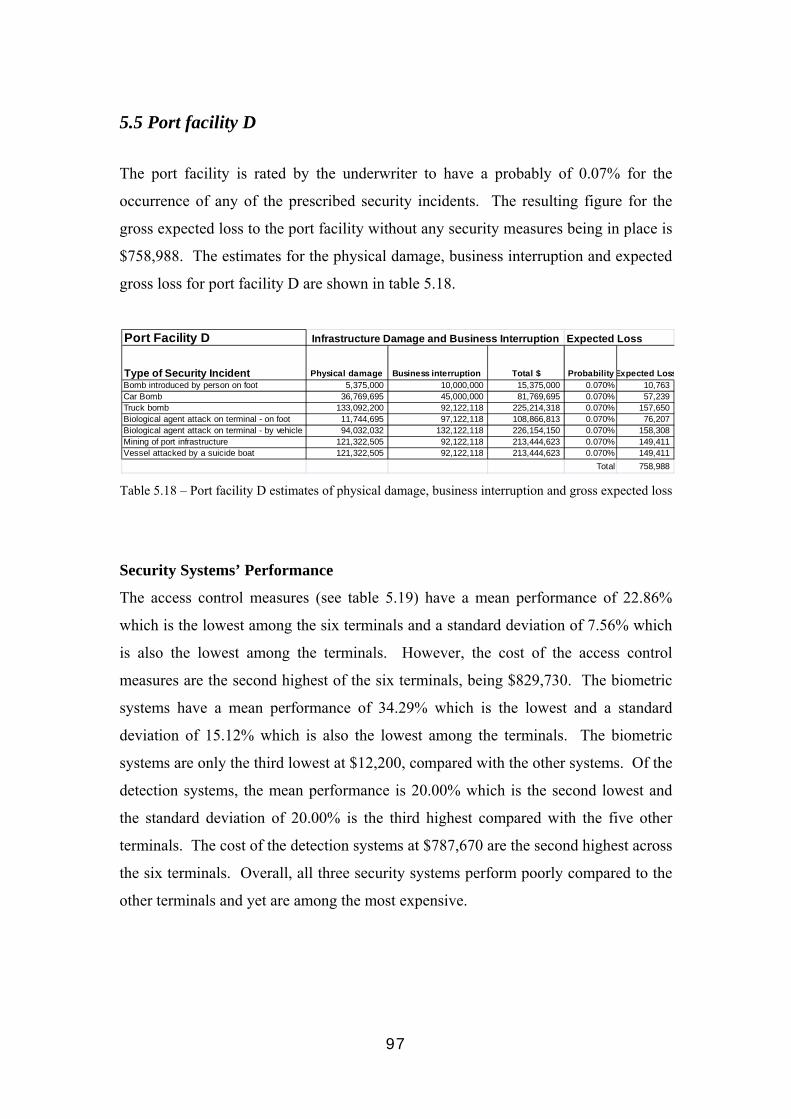
97
5.5 Port facility D
The port facility is rated by the underwriter to have a probably of 0.07% for the
occurrence of any of the prescribed security incidents. The resulting figure for the
gross expected loss to the port facility without any security measures being in place is
$758,988. The estimates for the physical damage, business interruption and expected
gross loss for port facility D are shown in table 5.18.
Table 5.18 – Port facility D estimates of physical damage, business interruption and gross expected loss
Security Systems’ Performance
The access control measures (see table 5.19) have a mean performance of 22.86%
which is the lowest among the six terminals and a standard deviation of 7.56% which
is also the lowest among the terminals. However, the cost of the access control
measures are the second highest of the six terminals, being $829,730. The biometric
systems have a mean performance of 34.29% which is the lowest and a standard
deviation of 15.12% which is also the lowest among the terminals. The biometric
systems are only the third lowest at $12,200, compared with the other systems. Of the
detection systems, the mean performance is 20.00% which is the second lowest and
the standard deviation of 20.00% is the third highest compared with the five other
terminals. The cost of the detection systems at $787,670 are the second highest across
the six terminals. Overall, all three security systems perform poorly compared to the
other terminals and yet are among the most expensive.
Port Facility D Infrastructure Damage and Business Interruption Expected Loss
Type of Security Incident Physical damage Business interruption Total $ ProbabilityExpected LossBomb introduced by person on foot 5,375,000 10,000,000 15,375,000 0.070% 10,763 Car Bomb 36,769,695 45,000,000 81,769,695 0.070% 57,239 Truck bomb 133,092,200 92,122,118 225,214,318 0.070% 157,650 Biological agent attack on terminal - on foot 11,744,695 97,122,118 108,866,813 0.070% 76,207 Biological agent attack on terminal - by vehicle 94,032,032 132,122,118 226,154,150 0.070% 158,308 Mining of port infrastructure 121,322,505 92,122,118 213,444,623 0.070% 149,411 Vessel attacked by a suicide boat 121,322,505 92,122,118 213,444,623 0.070% 149,411
Total 758,988

98
Table 5.19 – Port facility D security system performances, including means and standard deviations
Security Performance Ratios
The application of the security measures results in a reduction in the expected loss of
$183,315 to $575,673. Given that the overall expenditure on security is $1,629,600
the residual risk reduction : security expenditure ratio is 0.112. This means that for
every $1 spent on security, the residual security risk is reduced by $0.112.
The residual risk : expected loss ratios for the different types of security incident are
lowest for the bomb introduced by person on foot, the biological agent attack on foot
and the mining of the port infrastructure at 66.7% (see table 5.20). However, these
figures are much higher than for any other terminal.
Table 5.20 – Port facility D residual security risk calculations
Markowitz Portfolio Analysis
The correlations between the security systems are set out in table 5.21. The
correlation between the performances of access control and biometrics are perfectly
Port Facility D Security system performance
Type of Security Incident Access Control Biometrics DetectionBomb introduced by person on foot 20% 40% 40%Car Bomb 20% 40% 0%Truck bomb 20% 40% 0%Biological agent attack on terminal - on foot 20% 40% 40%Biological agent attack on terminal - by vehicle 20% 40% 0%Mining of port infrastructure 20% 40% 40%Vessel attacked by a suicide boat 40% 0% 20%
Mean 22.86% 34.29% 20.00%
Standard deviation 7.56% 15.12% 20.00%
Port Facility D Residual Risk Calculations
Type of Security Incident Access Control Biometrics Detection Total
Residual Risk/Expected Loss
Bomb introduced by person on foot 2,870 2,153 2,153 7,175 66.7%Car Bomb 15,264 11,448 19,080 45,791 80.0%Truck bomb 42,040 31,530 52,550 126,120 80.0%Biological agent attack on terminal - on foot 20,322 15,241 15,241 50,805 66.7%Biological agent attack on terminal - by vehicle 42,215 31,662 52,769 126,646 80.0%Mining of port infrastructure 39,843 29,882 29,882 99,607 66.7%Vessel attacked by a suicide boat 29,882 49,804 39,843 119,529 80.0%
Residual Risk 192,436 171,719 211,518 575,673
Security Cost 829,730 12,200 787,670 1,629,600

99
negative, while the correlation between access control and detection and biometrics
and detection are zero.
Correlations
Access Control Biometrics Detection 1.000 -1.000** 0.000 Access Control
-1.000** 1.000 0.000 Biometrics 0.000 0.000 1.000 Detection
**Correlation significant at the 0.01 level (2-tailed) Table 5.21 – Port facility D security system performance correlations
The Markowitz efficient frontier is calculated from the data in tables 5.19 and 5.21
and the efficient expected return-standard deviation frontier is plotted in chart 5.4.
The application of Markowitz theory yields a maximum expected return of 33.00%
with a standard deviation of 13.27%. This is based on 90% of the security spend
being invested in biometrics with 5% respectively invested in access control and
detection. This results in a revised figure for the residual risk of $508,522 which is a
reduction of $67,151.
Chart 5.4 - Markowitz expected return-standard deviation efficient frontier for Port
Facility D
Single periodPort Facility D expected return-standard deviation
0.00 0.03 0.06 0.09 0.12 0.15 0.18 0.21
0.21
0.24
0.27
0.30
0.33
Standard deviation
Expected return
1
2
3
1 Access Control 5.00%2 Biometrics 90.00%3 Detection 5.00%
Standard deviation 13.27%Expected return 33.00%
Maximum Expected Return
1 Access Control 63.33%2 Biometrics 31.67%3 Detection 5.00%
Standard deviation 1.00%Expected return 26.34%
Minimum Standard Deviation
100
For the Markowitz minimum standard deviation with accompanying expected return,
the figure for the expected return is 26.34% and the figure for the standard deviation
is 1.00%. This is derived by diverting 63.33% of the security spend on access control;
31.67% of the security spend on biometrics and 5% invested in detection. This results
in a revised figure for the residual risk of $559,071 which is a reduction of $16,602.

101
5.6 Port facility E
The port facility is rated by the underwriter to have a probably of 0.03% for the
occurrence of any of the prescribed security incidents. The resulting figure for the
gross expected loss to the port facility without any security measures being in place is
$416,525. The estimates for the physical damage, business interruption and expected
gross loss for port facility E are in table 5.22.
Table 5.22 – Port facility E estimates of physical damage, business interruption and gross expected loss
Security Systems’ Performance
The access control measures (see table 5.23) have a mean performance of 58.57%
which is the third lowest among the six terminals and a standard deviation of 35.79%
which is the third highest among the six terminals. The cost of the access control
measures are the second lowest of the six terminals, being $207,000. The biometric
systems have a mean performance of 57.14% which is the second lowest and a
standard deviation of 39.04% which is also the second lowest among the terminals.
However, the biometric systems are the second most expensive at $84.000, compared
with the other systems. Of the detection systems, the mean performance is 10.00%
which is the lowest of all and the standard deviation of 19.15% is the third lowest
compared with the five other terminals. The cost of the detection systems at $453,000
are the third highest across the six terminals. Overall, none of the three security
systems performs particularly well when compared with the peers, especially not
detection given its cost in comparison with others.
Port Facility E Infrastructure Damage and Business Interruption Expected Loss
Type of Security Incident Physical damage Business interruption Total $ ProbabilityExpected LossBomb introduced by person on foot 5,375,000 10,000,000 15,375,000 0.030% 4,613 Car Bomb 36,769,695 45,000,000 81,769,695 0.030% 24,531 Truck bomb 211,302,016 92,122,118 303,424,134 0.030% 91,027 Biological agent attack on terminal - on foot 11,744,695 97,122,118 108,866,813 0.030% 32,660 Biological agent attack on terminal - by vehicle 163,548,848 132,122,118 295,670,966 0.030% 88,701 Mining of port infrastructure 199,532,321 92,122,118 291,654,439 0.030% 87,496 Vessel attacked by a suicide boat 199,532,321 92,122,118 291,654,439 0.030% 87,496
Total 416,525

102
Table 5.23 – Port facility E security system performances, including means and standard deviations
Security Performance Ratios
The application of the security measures results in a reduction in the expected loss of
$159,390 to $257,135. Given that the overall expenditure on security is $744,000 the
residual risk reduction : security expenditure ratio is 0.214. This means that for every
$1 spent on security, the residual security risk is reduced by $0.214.
The residual risk : expected loss ratios for the different types of security incident are
lowest for the car bomb, the truck bomb and the biological agent attack by vehicle at
43.3% (see table 5.24). However, these figures do not compare favourably with the
other terminals.
Table 5.24 –Port facility E residual security risk calculations
Markowitz Portfolio Analysis
The correlations between the security systems are set out in table 5.25. The
correlation between the performance of access control and biometrics are positive and
significant at the 0.01 level. The correlation of the performances of access control
Port Facility E Security system performance
Type of Security Incident Access Control Biometrics DetectionBomb introduced by person on foot 60% 80% 0%Car Bomb 90% 80% 0%Truck bomb 90% 80% 0%Biological agent attack on terminal - on foot 60% 80% 0%Biological agent attack on terminal - by vehicle 90% 80% 0%Mining of port infrastructure 10% 0% 50%Vessel attacked by a suicide boat 10% 0% 20%
Mean 58.57% 57.14% 10.00%
Standard deviation 35.79% 39.04% 19.15%
Port Facility E Residual Risk Calculations
Type of Security Incident Access Control Biometrics Detection Total
Residual Risk/Expected Loss
Bomb introduced by person on foot 615 308 1,538 2,460 53.3%Car Bomb 818 1,635 8,177 10,630 43.3%Truck bomb 3,034 6,068 30,342 39,445 43.3%Biological agent attack on terminal - on foot 4,355 2,177 10,887 17,419 53.3%Biological agent attack on terminal - by vehicle 2,957 5,913 29,567 38,437 43.3%Mining of port infrastructure 26,249 29,165 14,583 69,997 80.0%Vessel attacked by a suicide boat 26,249 29,165 23,332 78,747 90.0%
Residual Risk 64,276 74,433 118,426 257,135
Security Cost 207,000 84,000 453,000 744,000
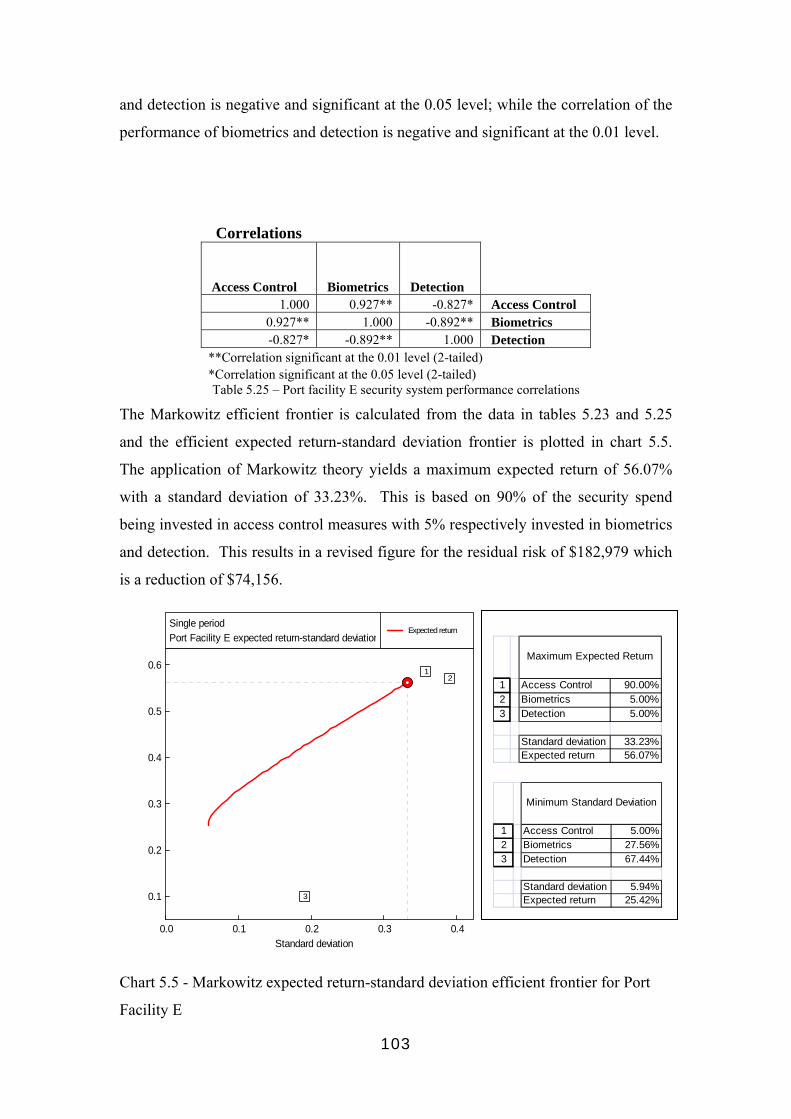
103
and detection is negative and significant at the 0.05 level; while the correlation of the
performance of biometrics and detection is negative and significant at the 0.01 level.
Correlations
Access Control Biometrics Detection 1.000 0.927** -0.827* Access Control
0.927** 1.000 -0.892** Biometrics -0.827* -0.892** 1.000 Detection
**Correlation significant at the 0.01 level (2-tailed) *Correlation significant at the 0.05 level (2-tailed) Table 5.25 – Port facility E security system performance correlations
The Markowitz efficient frontier is calculated from the data in tables 5.23 and 5.25
and the efficient expected return-standard deviation frontier is plotted in chart 5.5.
The application of Markowitz theory yields a maximum expected return of 56.07%
with a standard deviation of 33.23%. This is based on 90% of the security spend
being invested in access control measures with 5% respectively invested in biometrics
and detection. This results in a revised figure for the residual risk of $182,979 which
is a reduction of $74,156.
Chart 5.5 - Markowitz expected return-standard deviation efficient frontier for Port
Facility E
Single period
Port Facility E expected return-standard deviation
0.0 0.1 0.2 0.3 0.4
0.1
0.2
0.3
0.4
0.5
0.6
Standard deviation
Expected return
12
3
1 Access Control 90.00%2 Biometrics 5.00%3 Detection 5.00%
Standard deviation 33.23%Expected return 56.07%
Maximum Expected Return
1 Access Control 5.00%2 Biometrics 27.56%3 Detection 67.44%
Standard deviation 5.94%Expected return 25.42%
Minimum Standard Deviation

104
For the Markowitz minimum standard deviation with accompanying expected return,
the figure for the expected return is 25.42% and the figure for the standard deviation
is 5.94%. This is derived by diverting 67.44% of the security spend on detection with
27.56% investment in biometrics and 5% invested in access control. This results in a
revised figure for the residual risk of $310,644 which is an increase of $53,509. On
this occasion the application of portfolio theory has resulted in a portfolio with a
higher level of residual risk than the status quo.

105
5.7 Port Facility F
The underwriter has assigned a probably of 0.023% for the occurrence of any of the
prescribed security incidents. The resulting figure for the gross expected loss to the
port facility without any security measures being in place is $269,702. The estimates
for the physical damage, business interruption and expected gross loss for port facility
F are in table 5.26.
Table 5.26 – Port facility F estimates of physical damage, business interruption and gross expected loss
Security Systems’ Performance
The access control measures (see table 5.27) have a mean performance of 45.71%
which is the second lowest among the six port facilities and a standard deviation of
42.37% which is among the highest. The cost of the access control measures are the
highest of the six port facilities, being $1,324,312. The biometric systems have a
mean performance of 67.86% which is the highest and a standard deviation of 46.36%
which is also the highest among the terminals. The cost of the biometric systems are
also the highest at $275,600, compared with the other terminals. Of the detection
systems, the mean performance is 41.43% which is the third lowest and the standard
deviation of 40.18% is the highest compared with the five other terminals. The cost
of the detection systems at $349,777 are the third lowest across the six terminals.
Overall, the biometrics system is the best performer but also the most expensive;
access control systems do not perform particularly well and are also the most
expensive and the detection systems are average when compared to the other
terminals.
Port Facility F Infrastructure Damage and Business Interruption Expected Loss
Type of Security Incident Physical damage Business interruption Total $ ProbabilityExpected LossBomb introduced by person on foot 5,375,000 10,000,000 15,375,000 0.023% 3,536 Car Bomb 36,769,695 45,000,000 81,769,695 0.023% 18,807 Truck bomb 157,352,430 92,122,118 249,474,548 0.023% 57,379 Biological agent attack on terminal - on foot 11,744,695 97,122,118 108,866,813 0.023% 25,039 Biological agent attack on terminal - by vehicle 109,599,262 132,122,118 241,721,380 0.023% 55,596 Mining of port infrastructure 145,582,735 92,122,118 237,704,853 0.023% 54,672 Vessel attacked by a suicide boat 145,582,735 92,122,118 237,704,853 0.023% 54,672
Total 269,702

106
Table 5.27 – Port facility F security system performances, including means and standard deviations
Security Performance Ratios
The application of the security measures results in a reduction in the expected loss of
$114,163 to $155,539. Given that the overall expenditure on security is $1,949,689
the residual risk reduction : security expenditure ratio is 0.059. This means that for
every $1 spent on security, the residual security risk is reduced by $0.059.
The residual risk : expected loss ratio for the different types of security incident are
lowest for the bomb introduced by person on foot at 11.7%.
Table 5.28 –Port F residual security risk calculations
Markowitz Portfolio Analysis
The correlations between the security systems are set out in table 5.29. The
correlations of the performances of the security systems differ greatly from the other
port facilities with no significant positive or negative correlations.
Port Facility F Security system performance
Type of Security Incident Access Control Biometrics DetectionBomb introduced by person on foot 90% 95% 80%Car Bomb 90% 95% 0%Truck bomb 90% 95% 0%Biological agent attack on terminal - on foot 10% 95% 80%Biological agent attack on terminal - by vehicle 10% 95% 0%Mining of port infrastructure 0% 0% 80%Vessel attacked by a suicide boat 30% 0% 50%
Mean 45.71% 67.86% 41.43%
Standard deviation 42.37% 46.36% 40.18%
Port Facility F Residual Risk Calculations
Type of Security Incident Access Control Biometrics Detection Total
Residual Risk/Expected Loss
Bomb introduced by person on foot 118 59 236 413 11.7%Car Bomb 627 313 6,269 7,209 38.3%Truck bomb 1,913 956 19,126 21,995 38.3%Biological agent attack on terminal - on foot 7,512 417 1,669 9,598 38.3%Biological agent attack on terminal - by vehicle 16,679 927 18,532 36,137 65.0%Mining of port infrastructure 18,224 18,224 3,645 40,093 73.3%Vessel attacked by a suicide boat 12,757 18,224 9,112 40,093 73.3%
Residual Risk 57,829 39,121 58,589 155,539
Security Cost 1,324,312 275,600 349,777 1,949,689

107
Correlations
Access Control Biometrics Detection 1.000 0.495 -0.368 Access Control 0.495 1.000 -0.401 Biometrics
-0.368 -0.401 1.000 Detection Table 5.29 – Port F security system performance correlations
The Markowitz efficient frontier is calculated from the data in tables 5.27 and 5.29
and the efficient expected return-standard deviation frontier is plotted in chart 5.6.
The application of Markowitz theory yields a maximum expected return of 65.43%
with a standard deviation of 42.03%. This is based on 90% of the security spend
being invested in biometrics with 5% respectively invested in access control and
detection. This results in a revised figure for the residual risk of $93,236 which is a
reduction of $62,303.
Chart 5.6 - Markowitz expected return-standard deviation efficient frontier for Port
Facility F
Single period
Port Facility F expected return-standard deviation
0.2 0.3 0.4
0.4
0.5
0.6
Standard deviation
Expected return
1
2
3
1 Access Control 5.00%2 Biometrics 90.00%3 Detection 5.00%
Standard deviation 42.03%Expected return 65.43%
Maximum Expected Return
1 Access Control 27.52%2 Biometrics 24.18%3 Detection 48.30%
Standard deviation 20.66%Expected return 49.00%
Minimum Standard Deviation
108
For the Markowitz minimum standard deviation with accompanying expected return,
the figure for the expected return is 49.00% and the figure for the standard deviation
is 20.66%. This is derived by diverting 48.30% of the security spend on detection
with 27.52% invested in access control and 24.18% invested in biometrics. This
results in a revised figure for the residual risk of $137,548 which is a reduction of
$17,991.

109
5.8 Findings Summary A summary of the findings is presented below.
5.8.1 Mean and Standard Deviation of the Security Systems Table 5.30 contains a summary of the port facilities’ security systems’ performances.
The best performing port facility for access control is port facility B with a mean of
76.43% and with a standard deviation (s.d.) of 18.42% followed closely by port
facility A with mean of 72.86% and s.d. of 15.77% respectively. However, port
facility B’s access control system cost $715,000 whereas port facility A’s is only
$187,826. The worst performing access control system belongs to port facility D with
a mean of 22.86% and a s.d. of 7.56%.
In terms of biometrics, port facility F was the best performing with a mean of 67.86%
and a s.d. of 46.36% followed closely by both port facility C (mean 66.43% & s.d. of
45.43%) and port facility B (mean 65.71% and s.d. of 45.04%). However, the cost of
the biometrics systems varies considerably. The worst performing port facility for
biometrics was port facility D with a mean of 34.29% and a s.d. of 15.12%.
In terms of detection, port facility B was the best performing with a mean of 87.86%
and a s.d. of 7.56%. The detection systems in port facility E were worst with a mean
of only 10.00% and a s.d. of 19.15%. What is of interest is the size of the difference
in the performance of the detection systems in port facility F where the mean is
41.43% and the s.d. is 40.18% compared to port facility B given that the size of the
investment in both port facilities’ detection systems are quite similar.
Table 5.30 – Summary of the Port Facilities’Security Systems’ Performances
5.8.2 Security Benefit-Cost Ratios The findings also showed some interesting results concerning the port facilities’
security benefit-cost ratios which show by how much each port facility’s residual
mean s.d. Cost $ mean s.d. Cost $ mean s.d. Cost $A 72.86% 15.77% 187,826 63.57% 43.47% 33,637 68.57% 12.82% 261,999 B 76.43% 18.42% 715,000 65.71% 45.04% 8,000 87.86% 7.56% 2,756,325 C 59.29% 40.56% 412,734 66.43% 45.43% 2,680 51.43% 35.20% 51,538 D 22.86% 7.56% 829,730 34.29% 15.12% 12,200 20.00% 20.00% 787,670 E 58.57% 35.79% 207,000 57.14% 39.04% 84,000 10.00% 19.15% 453,000 F 45.71% 42.37% 1,324,312 67.86% 46.36% 275,600 41.43% 40.18% 1,949,689
Access Control Biometrics DetectionPort Facility
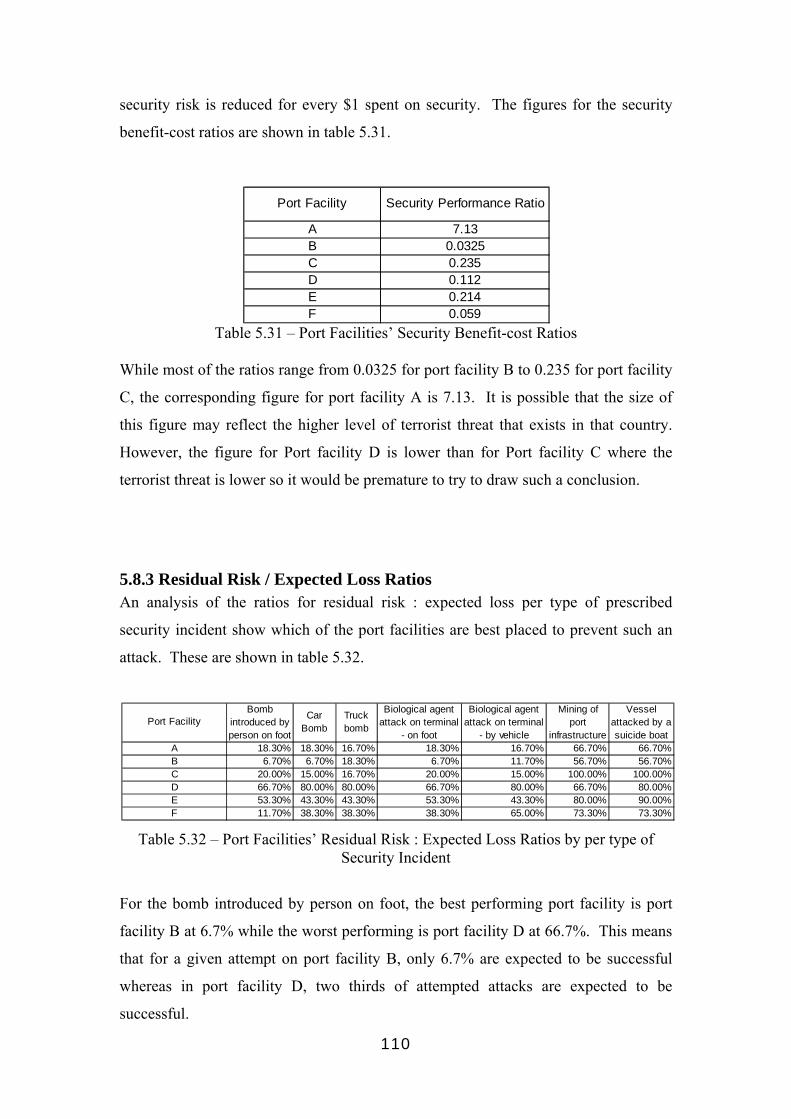
110
security risk is reduced for every $1 spent on security. The figures for the security
benefit-cost ratios are shown in table 5.31.
Table 5.31 – Port Facilities’ Security Benefit-cost Ratios
While most of the ratios range from 0.0325 for port facility B to 0.235 for port facility
C, the corresponding figure for port facility A is 7.13. It is possible that the size of
this figure may reflect the higher level of terrorist threat that exists in that country.
However, the figure for Port facility D is lower than for Port facility C where the
terrorist threat is lower so it would be premature to try to draw such a conclusion.
5.8.3 Residual Risk / Expected Loss Ratios An analysis of the ratios for residual risk : expected loss per type of prescribed
security incident show which of the port facilities are best placed to prevent such an
attack. These are shown in table 5.32.
Table 5.32 – Port Facilities’ Residual Risk : Expected Loss Ratios by per type of Security Incident
For the bomb introduced by person on foot, the best performing port facility is port
facility B at 6.7% while the worst performing is port facility D at 66.7%. This means
that for a given attempt on port facility B, only 6.7% are expected to be successful
whereas in port facility D, two thirds of attempted attacks are expected to be
successful.
A 7.13B 0.0325C 0.235D 0.112E 0.214F 0.059
Port Facility Security Performance Ratio
A 18.30% 18.30% 16.70% 18.30% 16.70% 66.70% 66.70%B 6.70% 6.70% 18.30% 6.70% 11.70% 56.70% 56.70%C 20.00% 15.00% 16.70% 20.00% 15.00% 100.00% 100.00%D 66.70% 80.00% 80.00% 66.70% 80.00% 66.70% 80.00%E 53.30% 43.30% 43.30% 53.30% 43.30% 80.00% 90.00%F 11.70% 38.30% 38.30% 38.30% 65.00% 73.30% 73.30%
Bomb introduced by person on foot
Car Bomb
Truck bomb
Biological agent attack on terminal
- on foot
Biological agent attack on terminal
- by vehicle
Mining of port
infrastructure
Vessel attacked by a suicide boat
Port Facility
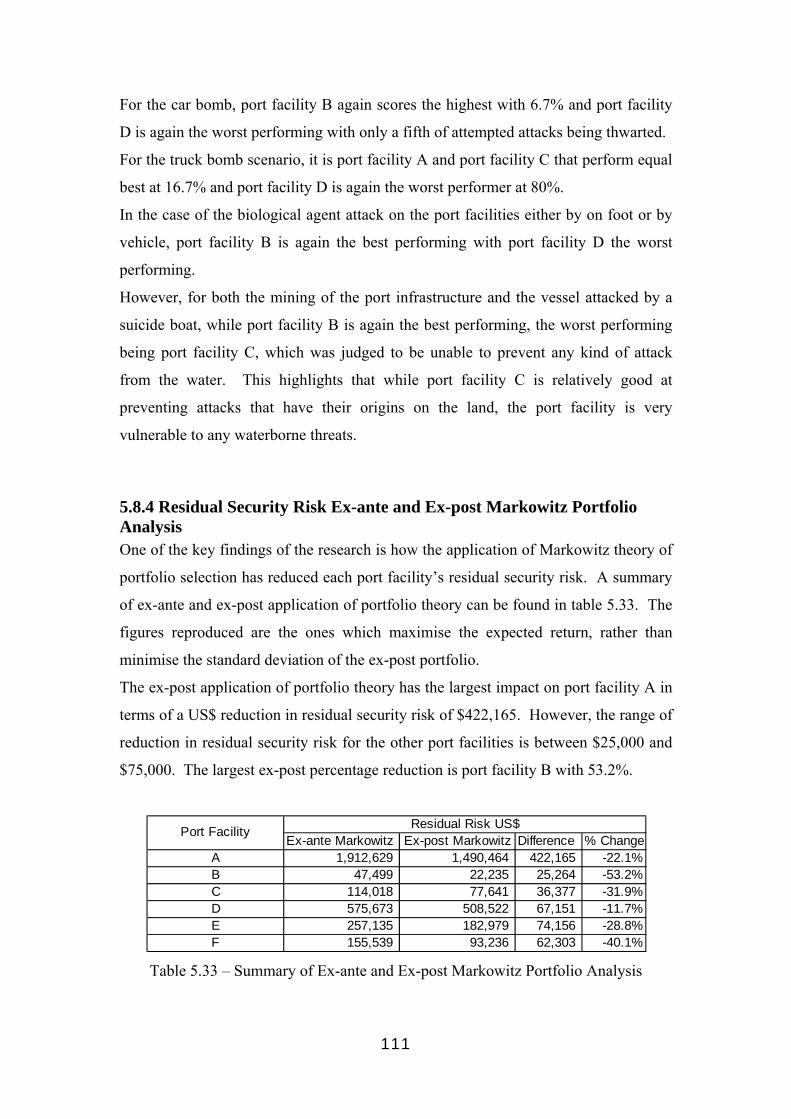
111
For the car bomb, port facility B again scores the highest with 6.7% and port facility
D is again the worst performing with only a fifth of attempted attacks being thwarted.
For the truck bomb scenario, it is port facility A and port facility C that perform equal
best at 16.7% and port facility D is again the worst performer at 80%.
In the case of the biological agent attack on the port facilities either by on foot or by
vehicle, port facility B is again the best performing with port facility D the worst
performing.
However, for both the mining of the port infrastructure and the vessel attacked by a
suicide boat, while port facility B is again the best performing, the worst performing
being port facility C, which was judged to be unable to prevent any kind of attack
from the water. This highlights that while port facility C is relatively good at
preventing attacks that have their origins on the land, the port facility is very
vulnerable to any waterborne threats.
5.8.4 Residual Security Risk Ex-ante and Ex-post Markowitz Portfolio Analysis One of the key findings of the research is how the application of Markowitz theory of
portfolio selection has reduced each port facility’s residual security risk. A summary
of ex-ante and ex-post application of portfolio theory can be found in table 5.33. The
figures reproduced are the ones which maximise the expected return, rather than
minimise the standard deviation of the ex-post portfolio.
The ex-post application of portfolio theory has the largest impact on port facility A in
terms of a US$ reduction in residual security risk of $422,165. However, the range of
reduction in residual security risk for the other port facilities is between $25,000 and
$75,000. The largest ex-post percentage reduction is port facility B with 53.2%.
Table 5.33 – Summary of Ex-ante and Ex-post Markowitz Portfolio Analysis
Ex-ante Markowitz Ex-post Markowitz Difference % ChangeA 1,912,629 1,490,464 422,165 -22.1%B 47,499 22,235 25,264 -53.2%C 114,018 77,641 36,377 -31.9%D 575,673 508,522 67,151 -11.7%E 257,135 182,979 74,156 -28.8%F 155,539 93,236 62,303 -40.1%
Residual Risk US$Port Facility

112
5.9 Portfolio Optimization
The portfolio optimization resulted in an examination of all 216 (6³) possible
portfolios constructed from the 3 security systems in each of the 6 port facilities, as
listed in appendix D. The portfolios were analysed in terms of their security
investment and their residual security risk, based on the same methodology as
described in section 2.1. An optimum portfolio is defined as one which yields either
the lowest residual security risk or the lowest security investment compared to the
status quo. An alternative portfolio is defined as one which has either a lower residual
security risk or lower security investment than the status quo.
The 216 possible portfolios were then plotted on a chart and the charts are reproduced
within the context of each port facility. In the analysis, the possible portfolio
combinations of the port facilities’ security systems which result in both a reduction in
residual security risk and security investment were selected. In some instances, there
are only a handful of alternative portfolios which have a reduction in both residual
security risk and security investment and their details are reproduced in full. In other
instances, there are many alternative portfolios of security systems which meet the
criteria. In these cases, only the top ten performing portfolios are reproduced. The
optimum and alternative portfolio combinations of security systems are presented first
on minimising residual security risk and secondly on minimising security investment.
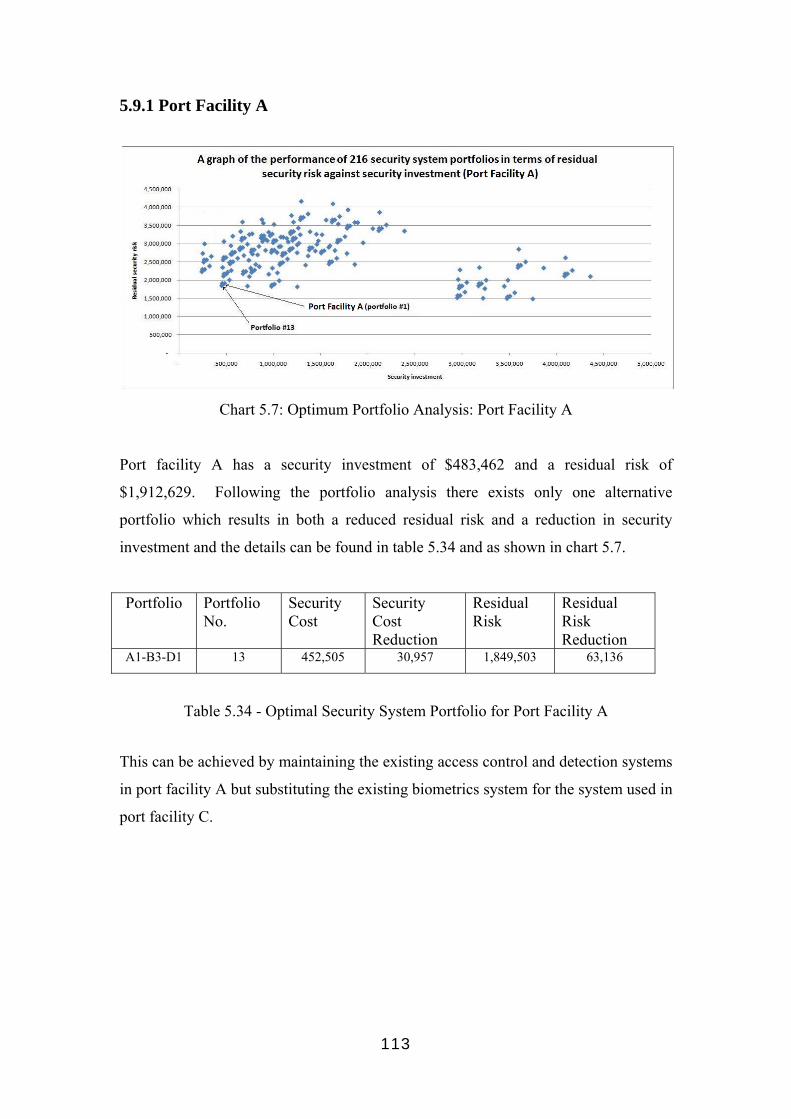
113
5.9.1 Port Facility A
Chart 5.7: Optimum Portfolio Analysis: Port Facility A
Port facility A has a security investment of $483,462 and a residual risk of
$1,912,629. Following the portfolio analysis there exists only one alternative
portfolio which results in both a reduced residual risk and a reduction in security
investment and the details can be found in table 5.34 and as shown in chart 5.7.
Portfolio Portfolio No.
Security Cost
Security Cost Reduction
Residual Risk
Residual Risk Reduction
A1-B3-D1 13 452,505 30,957 1,849,503 63,136
Table 5.34 - Optimal Security System Portfolio for Port Facility A
This can be achieved by maintaining the existing access control and detection systems
in port facility A but substituting the existing biometrics system for the system used in
port facility C.

114
5.9.2 Port Facility B
Chart 5.8: Optimum Portfolio Analysis: Port facility B
Port facility B has a security investment of $3,479,325 and a residual risk of $47,499.
Following the portfolio analysis, there are three alternative portfolios where both the
residual risk and the security investment are less than the status quo. Their details can
be found in table 5.35 and in chart 5.8.
Portfolio Portfolio No.
Security Cost
Security Cost Reduction
Residual Risk
Residual Risk Reduction
A1-B3-D2 14 2,946,831 532,494 46,638 861 A1-B6-D2 32 3,219,751 259,574 46,323 1,176 A2-B3-D2 50 3,474,005 5,320 46,144 1,355
Table 5.35 –Optimal and Alternative Security System Portfolios for Port Facility B The portfolio which minimises the residual risk is number 50, which consists of the
access control and detection systems from port facility B and the biometrics system
from port facility C. The portfolio which minimises the security investment is
number 14 which consists of the access control system from port facility A, the
biometrics system from port facility C and the detection system from port facility B.
However, it is interesting to note that all three portfolios include port facility B’s
detection system which is selected above any of the other detection systems from the
other port facilities.

115
5.9.3 Port Facility C
Chart 5.9: Optimum Portfolio Analysis: Port Facility C
Port facility C has a security investment of $466,952 and a residual risk of $114,018.
There are 10 alternative portfolios which yield reductions in residual risk and their
details can be found in table 5.36. A selection of these portfolios are also shown in
chart 5.9.
Table 5.36 - Optimum and Alternative Security System Portfolios for Port Facility C (Residual Risk Reduction)
The optimum portfolio for residual risk reduction is portfolio number 13, which
represents the access control system from port facility A, the biometrics system from
port facility C and the detection system from port facility A. The top two portfolios
Portfolio Portfolio No.
Security Cost
Security Cost Reduction
Residual Risk Residual Risk Reduction
A1-B3-D1 13 452,505 14,447 81,491 32,527
A1-B2-D1 7 457,825 9,127 84,115 29,903
A1-B3-D3 15 242,044 224,908 98,869 15,149
A1-B4-D1 19 462,025 4,927 99,070 14,948 A1-B2-D3 9 247,364 219,588 101,493 12,525 A1-B1-D3 3 273,001 193,951 101,493 12,525 A1-B5-D3 27 323,364 143,588 105,071 8,947 A5-B3-D3 159 261,218 205,734 110,611 3,407 A5-B2-D3 153 266,538 200,414 113,235 783 A5-1B-D3 147 292,175 174,777 113,235 783

116
include both the access control and detection systems from port facility A and the top
7 portfolios include the access control system from port facility A. The 10 alternative
portfolios which yield reduced security investment can be found in table 5.37.
Table 5.37 – Optimum and Alternative Security System Portfolios (Security
Investment Reduction) for Port Facility C
The optimum portfolio for reduction in security investment is portfolio number 15,
which represents the access control system from port facility A and both the
biometrics and the detection system from port facility C. It is interesting to note that
the top 7 portfolios include the detection system from port facility C.
Portfolio Portfolio No.
Security Cost
Security Cost Reduction
Residual Risk Residual Risk Reduction
A1-B3-D3 15 242,044 224,908 98,869 15,149 A1-B2-D3 9 247,364 219,588 101,493 12,525 A5-B3-D3 159 261,218 205,734 110,611 3,407 A5-B2-D3 153 266,538 200,414 113,235 783 A1-B1-D3 3 273,001 193,951 101,493 12,525 A5-1B-D3 147 292,175 174,777 113,235 783 A1-B5-D3 27 323,364 143,588 105,071 8,947
A1-B3-D1 13 452,505 14,447 81,491 32,527
A1-B2-D1 7 457,825 9,127 84,115 29,903
A1-B4-D1 19 462,025 4,927 99,070 14,948
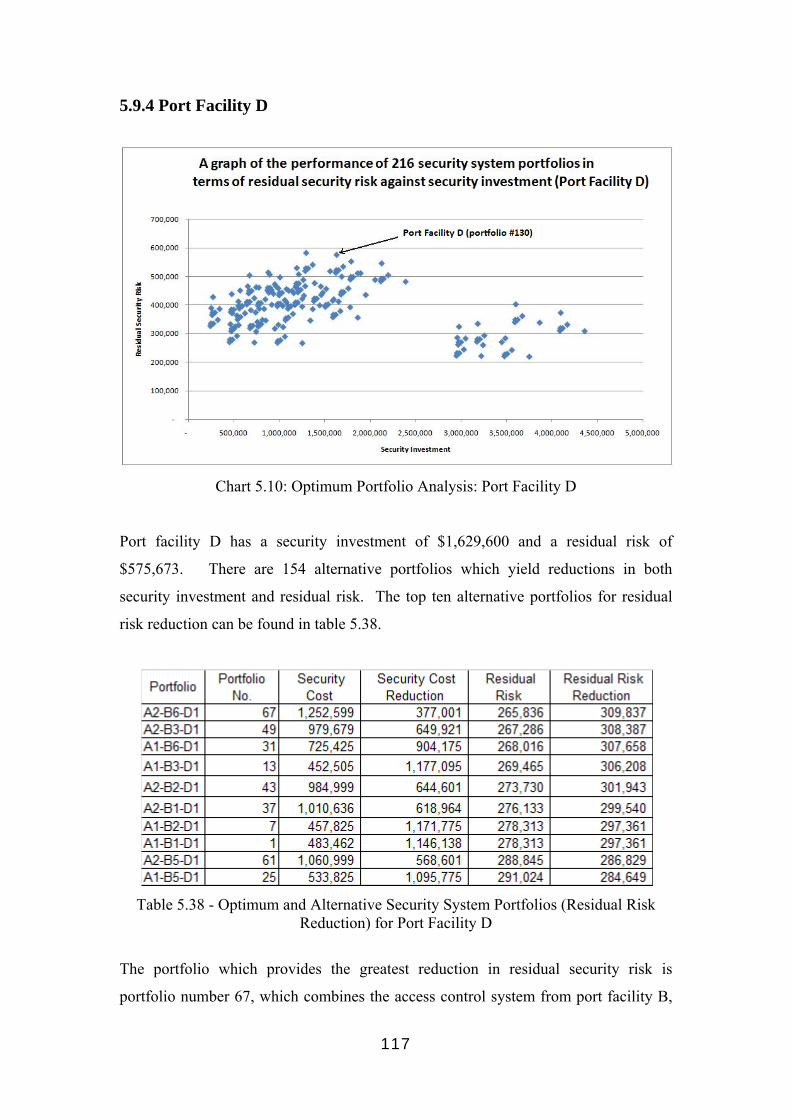
117
5.9.4 Port Facility D
Chart 5.10: Optimum Portfolio Analysis: Port Facility D
Port facility D has a security investment of $1,629,600 and a residual risk of
$575,673. There are 154 alternative portfolios which yield reductions in both
security investment and residual risk. The top ten alternative portfolios for residual
risk reduction can be found in table 5.38.
Table 5.38 - Optimum and Alternative Security System Portfolios (Residual Risk Reduction) for Port Facility D
The portfolio which provides the greatest reduction in residual security risk is
portfolio number 67, which combines the access control system from port facility B,

118
the biometrics system from port facility F and the detection system from port facility
A. It is interesting to note that the top 10 alternative portfolios for residual risk
reduction consist of the detection system from port facility A.
The top ten alternative portfolios for reduction in security investment are in table 5.39.
Table 5.39 - Optimum and Alternative Security System Portfolios for (Security Investment Reduction) Port Facility D
The portfolio which yields the greatest saving in security investment is portfolio
number 15, which consists of the access control system from port facility A and the
biometrics and detection systems from port facility C. Furthermore, all of the top 10
alternative portfolios for security investment reduction consist of the detection system
from port facility C.

119
5.9.5 Port Facility E
Chart 5.11: Optimum Portfolio Analysis: Port facility E
Port facility E has a security investment of $744,000 and a residual risk of $257,135.
There are 50 alternative portfolios which yield reductions in both security cost and
residual risk. The top ten alternative portfolios for residual risk reduction can be
found in table 5.40.
Table 5.40 - Optimum and Alternative Security System Portfolios (Residual Risk Reduction) for Port Facility E
The optimum portfolio for reduction of residual risk is portfolio number 31 which
consists of the access control system from port facility A, the biometrics system from
port facility F and the detection system from port facility A. However, it is interesting
to note that the top 5 alternative portfolios consist of both the access control and the

120
detection systems from port facility A. The top ten alternative portfolios for reduction
in security investment are in table 5.41.
Table 5.41 - Optimum and Alternative Security System Portfolios (Security Investment Reduction) for Port Facility E
The optimum portfolio is number 15 which consists of the access control system from
port facility A and both the biometrics and detection systems from port facility C. As
in previous instances , all of the top 10 alternative portfolios for security investment
reduction contain the detection system from port facility C.

121
5.9.6 Port Facility F
Chart 5.12: Optimum Portfolio Analysis: Port Facility F
Port facility F has a security investment of $1,949,689 and a residual risk of $155,539.
There are 105 alternative portfolios which yield reductions in both security cost and
residual risk. The top ten alternative portfolios for residual risk reduction can be
found in table 5.42.
Table 5.42 - Optimum and Alternative Security System Portfolios (Residual Risk Reduction) for Port Facility F
The optimum portfolio for reduction of residual risk is portfolio number 67 which
consists of the access control system from port facility B, the biometrics system from

122
port facility F and the detection system from port facility A. However, it is interesting
to note that the top 10 alternative portfolios contain the detection systems from port
facility A. The top ten optimum portfolios for reduction in security investment are in
table 5.43.
Table 5.43 - Optimum and Alternative Security System Portfolios (Security Investment Reduction) for Port Facility F
As for port facility E above, the top performing portfolio is number 15 which consists
of the access control system from port facility A and both the biometrics and detection
systems from port facility C. As in previous instances , all of the top 10 alternative
portfolios for security investment reduction contain the detection system from port
facility C.
123
5.10 Sensitivity Analysis
It is necessary to conduct a sensitivity analysis to account for the bias which is
introduced when working with a small sample. The sensitivity analysis concerns the
two dimensions of the security investment – residual security risk relationship. In
order to compensate for this bias, two simulations are conducted. The first simulation
models a 10% reduction in the cost of the individual security systems (access control,
biometrics and detection) and the second simulation models a 10% improvement in
the performance of the individual security systems, aimed at reducing residual
security risk.
Consideration was given to a third simulation to vary the underwriter’s pure premium
probability assessment of the risks of the prescribed security incidents. It is
acknowledged that the small sample of terrorism probabilities used in the research
may result in the introduction of anchoring effects into the data and that a simulation
of a 10% increase or decrease in the terrorism probabilities may serve to address this
bias. However, given that the underwriter allocated only one probability to cover all
of the prescribed security incidents in the six port facilities, rather than individual
probabilities for each threat scenario, the process of modelling different terrorism
threat probabilities for each prescribed security incident may unintentionally introduce
further errors or bias into the model. Therefore, it is decided to conduct only the
aforementioned simulations but nevertheless it is important to highlight the limitations
of working with limited terrorism probabilities from only one source.
5.10.1 Sensitivity Analysis Methodology The objective of running the two simulations is to assess the extent to which the
portfolio optimization exercise is affected, specifically in relation to how the optimum
and alternative portfolios differ for each port facility ex-post the simulations. The
methodology behind the simulations is presented in the following steps.
The first step is to revisit the breakdown in costs of the three security system
components (access control, biometrics and detection) for each of the 216 possible
portfolios. In each of the possible portfolios a simulation of a 10% reduction is
conducted in turn for each of the three security systems and a calculation is made of
the reduction of the cost of the 216 individual portfolios. For example, for portfolio
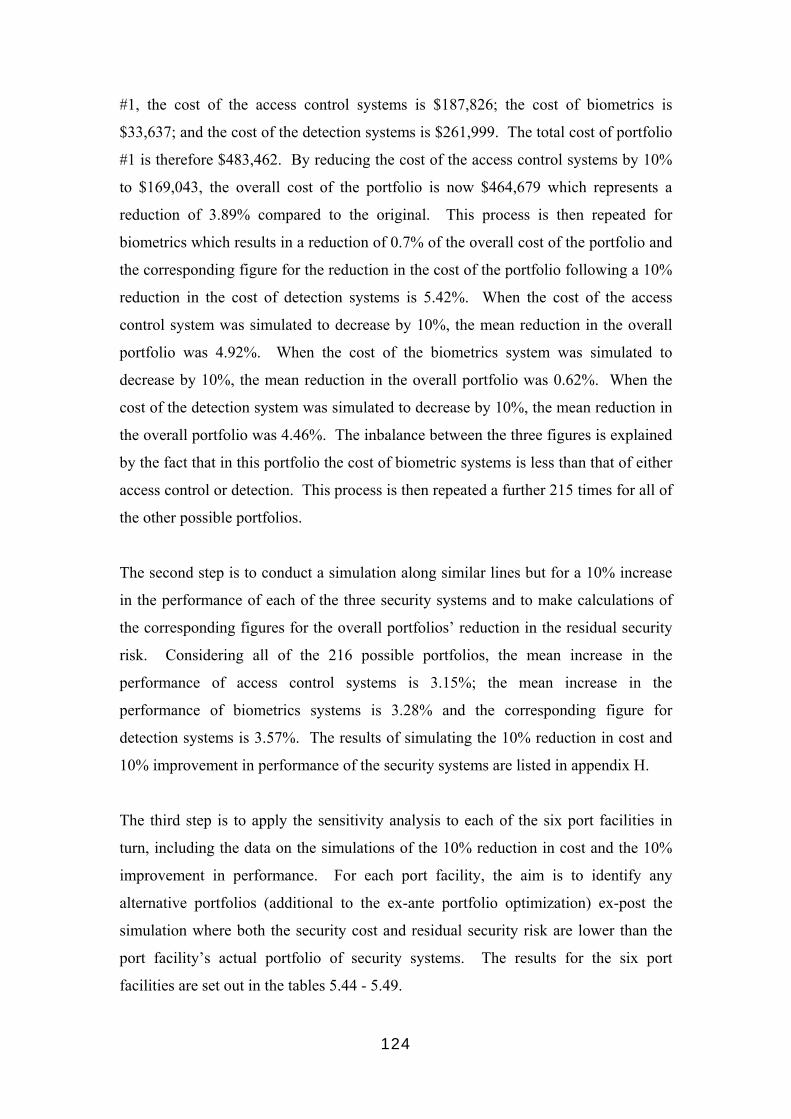
124
#1, the cost of the access control systems is $187,826; the cost of biometrics is
$33,637; and the cost of the detection systems is $261,999. The total cost of portfolio
#1 is therefore $483,462. By reducing the cost of the access control systems by 10%
to $169,043, the overall cost of the portfolio is now $464,679 which represents a
reduction of 3.89% compared to the original. This process is then repeated for
biometrics which results in a reduction of 0.7% of the overall cost of the portfolio and
the corresponding figure for the reduction in the cost of the portfolio following a 10%
reduction in the cost of detection systems is 5.42%. When the cost of the access
control system was simulated to decrease by 10%, the mean reduction in the overall
portfolio was 4.92%. When the cost of the biometrics system was simulated to
decrease by 10%, the mean reduction in the overall portfolio was 0.62%. When the
cost of the detection system was simulated to decrease by 10%, the mean reduction in
the overall portfolio was 4.46%. The inbalance between the three figures is explained
by the fact that in this portfolio the cost of biometric systems is less than that of either
access control or detection. This process is then repeated a further 215 times for all of
the other possible portfolios.
The second step is to conduct a simulation along similar lines but for a 10% increase
in the performance of each of the three security systems and to make calculations of
the corresponding figures for the overall portfolios’ reduction in the residual security
risk. Considering all of the 216 possible portfolios, the mean increase in the
performance of access control systems is 3.15%; the mean increase in the
performance of biometrics systems is 3.28% and the corresponding figure for
detection systems is 3.57%. The results of simulating the 10% reduction in cost and
10% improvement in performance of the security systems are listed in appendix H.
The third step is to apply the sensitivity analysis to each of the six port facilities in
turn, including the data on the simulations of the 10% reduction in cost and the 10%
improvement in performance. For each port facility, the aim is to identify any
alternative portfolios (additional to the ex-ante portfolio optimization) ex-post the
simulation where both the security cost and residual security risk are lower than the
port facility’s actual portfolio of security systems. The results for the six port
facilities are set out in the tables 5.44 - 5.49.

125
5.10.2 Sensitivity Analysis Results The results of the sensitivity analysis are presented below by port facility. In each
table, the portfolio shown first in bold is the actual portfolio of port security systems
for that port facility. The portfolio(s) listed below it is(are) the ex-post additional
alternative portfolios which exhibit a reduction in both security cost and residual risk
compared to the port facility’s actual portfolio.
5.10.2.1 Port Facility A
Table 5.44: Port Facility A – additional alternative portfolios ex-post the simulations
In the ex-ante portfolio optimization in section 5.9.1, only portfolio number 13
resulted in both a reduction in residual risk and a reduction in security investment
compared to portfolio 1 (port facility A). Following the sensitivity analysis, portfolio
number 7 is added as an alternative portfolio where ex-post the simulation,
combinations of security investment and residual security risk are less than those for
portfolio 1. For example, the figure for the security cost for portfolio number 7 when
access control costs are reduced by 10% is $439,042. This is less than all three of the
ex-post simulations for security costs for portfolio 1.
Furthermore, the ex-post simulation of the biometrics and detection systems of
portfolio 7 result in figures of residual security risk which are less than or equal to the
corresponding figures for portfolio 1. However, the ex-post simulation of a 10%
improvement in the performance of the access control systems in portfolio 7 results in
an overall figure for the residual security risk which is equal to the equivalent figure
for portfolio 1 but greater than portfolio 1’s ex-post simulation of a 10% improvement
in the performance of the biometrics or detection systems. This results in an ex-post
simulation overlap between portfolios 1 and 7. Where this occurs, the overlapping
portfolio figures are shown in italics.
5.10.2.2 Port Facility B
Additional alternative portfolios ex-post the simulations:
1 A1-B1-D1 483,462 1,912,629 464,679 480,098 457,262 1,860,607 1,832,828 1,853,191 7 A1-B2-D1 457,825 1,912,629 439,042 457,025 431,625 1,860,607 1,832,828 1,853,191
Ex-post simulation
security costs: access control
cost - 10%
Ex-ante simulation:
residual riskPortfolio
Ex-post simulation security costs:
detection cost - 10%
Ex-post simulation
residual risk: access control performance
+10%
Ex-post simulation
residual risk: biometrics
performance +10%
Ex-post simulation
residual risk: detection
performance +10%
Ex-post simulation
security costs: biometrics cost
- 10%
Ex-ante simulation:
security costs
Portfolio No
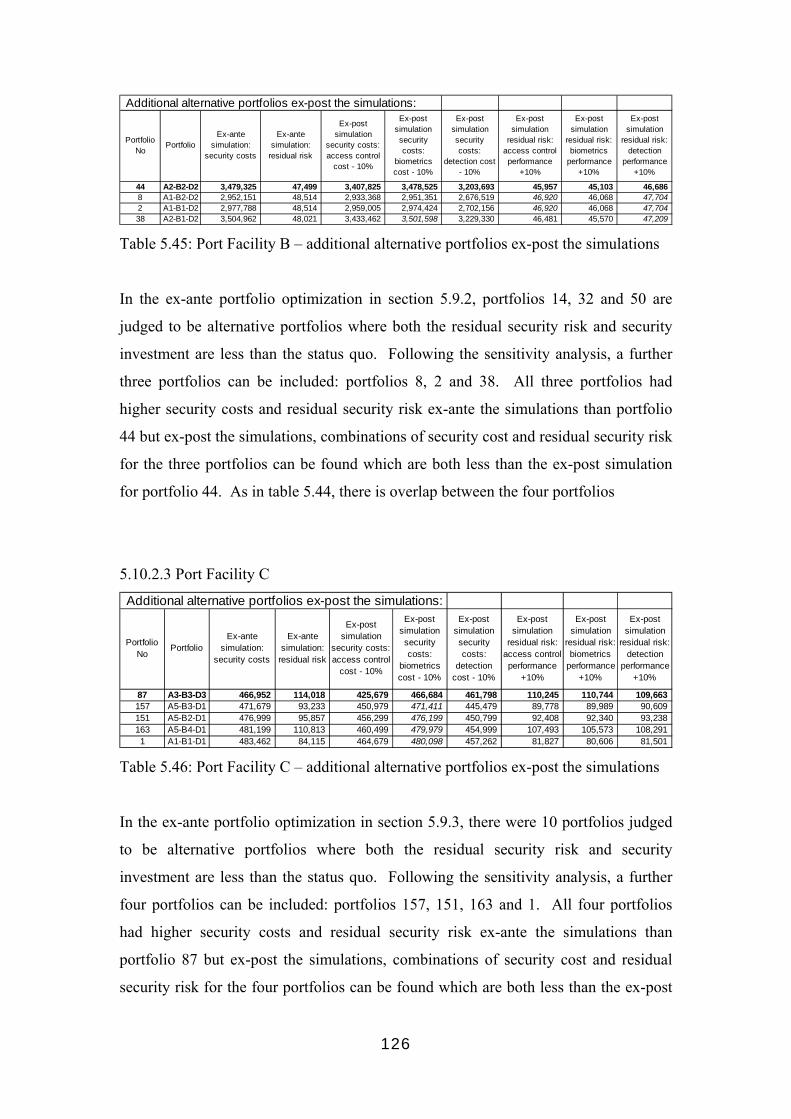
126
Table 5.45: Port Facility B – additional alternative portfolios ex-post the simulations
In the ex-ante portfolio optimization in section 5.9.2, portfolios 14, 32 and 50 are
judged to be alternative portfolios where both the residual security risk and security
investment are less than the status quo. Following the sensitivity analysis, a further
three portfolios can be included: portfolios 8, 2 and 38. All three portfolios had
higher security costs and residual security risk ex-ante the simulations than portfolio
44 but ex-post the simulations, combinations of security cost and residual security risk
for the three portfolios can be found which are both less than the ex-post simulation
for portfolio 44. As in table 5.44, there is overlap between the four portfolios
5.10.2.3 Port Facility C
Table 5.46: Port Facility C – additional alternative portfolios ex-post the simulations
In the ex-ante portfolio optimization in section 5.9.3, there were 10 portfolios judged
to be alternative portfolios where both the residual security risk and security
investment are less than the status quo. Following the sensitivity analysis, a further
four portfolios can be included: portfolios 157, 151, 163 and 1. All four portfolios
had higher security costs and residual security risk ex-ante the simulations than
portfolio 87 but ex-post the simulations, combinations of security cost and residual
security risk for the four portfolios can be found which are both less than the ex-post
Additional alternative portfolios ex-post the simulations:
44 A2-B2-D2 3,479,325 47,499 3,407,825 3,478,525 3,203,693 45,957 45,103 46,686 8 A1-B2-D2 2,952,151 48,514 2,933,368 2,951,351 2,676,519 46,920 46,068 47,704 2 A1-B1-D2 2,977,788 48,514 2,959,005 2,974,424 2,702,156 46,920 46,068 47,704 38 A2-B1-D2 3,504,962 48,021 3,433,462 3,501,598 3,229,330 46,481 45,570 47,209
Ex-post simulation
security costs: access control
cost - 10%
Ex-post simulation security costs:
biometrics cost - 10%
Ex-post simulation security costs:
detection cost - 10%
Portfolio
Ex-post simulation
residual risk: access control performance
+10%
Ex-post simulation
residual risk: biometrics
performance +10%
Ex-post simulation
residual risk: detection
performance +10%
Portfolio No
Ex-ante simulation:
security costs
Ex-ante simulation:
residual risk
Additional alternative portfolios ex-post the simulations:
87 A3-B3-D3 466,952 114,018 425,679 466,684 461,798 110,245 110,744 109,663 157 A5-B3-D1 471,679 93,233 450,979 471,411 445,479 89,778 89,989 90,609 151 A5-B2-D1 476,999 95,857 456,299 476,199 450,799 92,408 92,340 93,238 163 A5-B4-D1 481,199 110,813 460,499 479,979 454,999 107,493 105,573 108,291 1 A1-B1-D1 483,462 84,115 464,679 480,098 457,262 81,827 80,606 81,501
Ex-post simulation
security costs: access control
cost - 10%
Ex-post simulation security costs:
biometrics cost - 10%
Ex-post simulation security costs:
detection cost - 10%
Ex-post simulation
residual risk: access control performance
+10%
Ex-post simulation
residual risk: biometrics
performance +10%
Ex-post simulation
residual risk: detection
performance +10%
Portfolio No
Ex-ante simulation:
security costs
Ex-ante simulation:
residual riskPortfolio
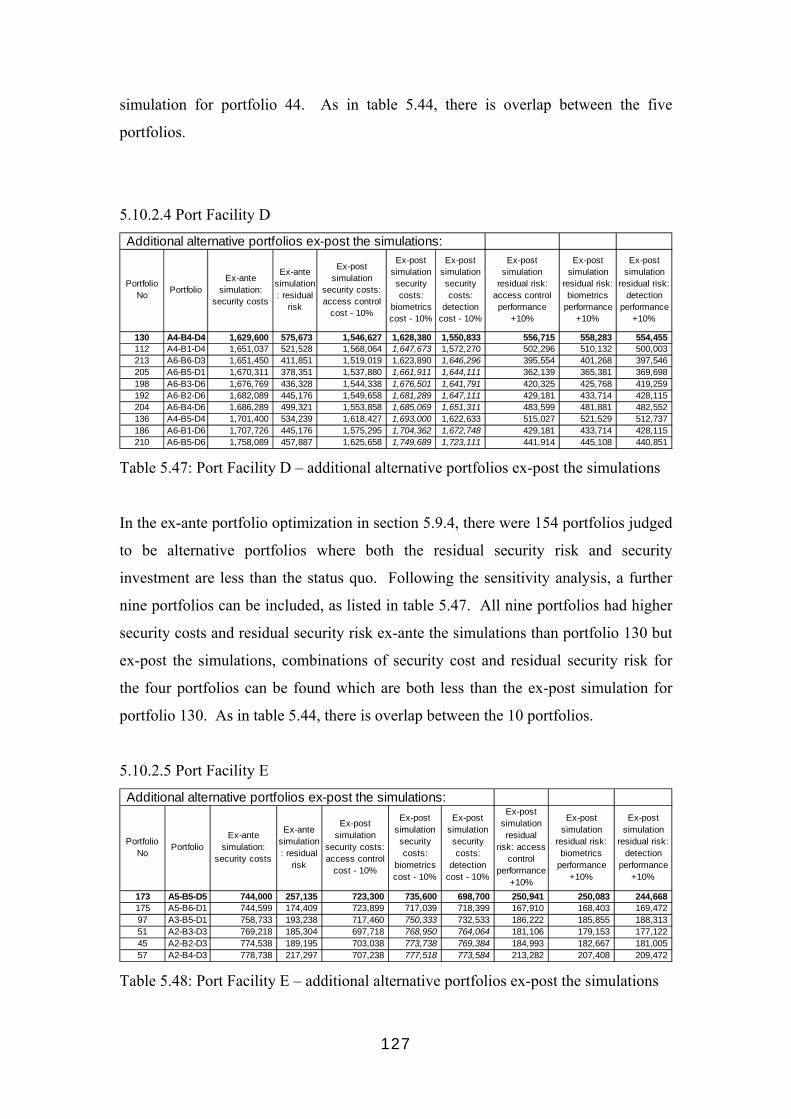
127
simulation for portfolio 44. As in table 5.44, there is overlap between the five
portfolios.
5.10.2.4 Port Facility D
Table 5.47: Port Facility D – additional alternative portfolios ex-post the simulations
In the ex-ante portfolio optimization in section 5.9.4, there were 154 portfolios judged
to be alternative portfolios where both the residual security risk and security
investment are less than the status quo. Following the sensitivity analysis, a further
nine portfolios can be included, as listed in table 5.47. All nine portfolios had higher
security costs and residual security risk ex-ante the simulations than portfolio 130 but
ex-post the simulations, combinations of security cost and residual security risk for
the four portfolios can be found which are both less than the ex-post simulation for
portfolio 130. As in table 5.44, there is overlap between the 10 portfolios.
5.10.2.5 Port Facility E
Table 5.48: Port Facility E – additional alternative portfolios ex-post the simulations
Additional alternative portfolios ex-post the simulations:
130 A4-B4-D4 1,629,600 575,673 1,546,627 1,628,380 1,550,833 556,715 558,283 554,455 112 A4-B1-D4 1,651,037 521,528 1,568,064 1,647,673 1,572,270 502,296 510,132 500,003 213 A6-B6-D3 1,651,450 411,851 1,519,019 1,623,890 1,646,296 395,554 401,268 397,546 205 A6-B5-D1 1,670,311 378,351 1,537,880 1,661,911 1,644,111 362,139 365,381 369,698 198 A6-B3-D6 1,676,769 436,328 1,544,338 1,676,501 1,641,791 420,325 425,768 419,259 192 A6-B2-D6 1,682,089 445,176 1,549,658 1,681,289 1,647,111 429,181 433,714 428,115 204 A6-B4-D6 1,686,289 499,321 1,553,858 1,685,069 1,651,311 483,599 481,881 482,552 136 A4-B5-D4 1,701,400 534,239 1,618,427 1,693,000 1,622,633 515,027 521,529 512,737 186 A6-B1-D6 1,707,726 445,176 1,575,295 1,704,362 1,672,748 429,181 433,714 428,115 210 A6-B5-D6 1,758,089 457,887 1,625,658 1,749,689 1,723,111 441,914 445,108 440,851
Ex-post simulation
residual risk: access control performance
+10%
Ex-post simulation
residual risk: biometrics
performance +10%
Ex-post simulation
residual risk: detection
performance +10%
PortfolioPortfolio
No
Ex-ante simulation:
security costs
Ex-ante simulation: residual
risk
Ex-post simulation
security costs: access control
cost - 10%
Ex-post simulation security costs:
biometrics cost - 10%
Ex-post simulation security costs:
detection cost - 10%
Additional alternative portfolios ex-post the simulations:
173 A5-B5-D5 744,000 257,135 723,300 735,600 698,700 250,941 250,083 244,668 175 A5-B6-D1 744,599 174,409 723,899 717,039 718,399 167,910 168,403 169,472 97 A3-B5-D1 758,733 193,238 717,460 750,333 732,533 186,222 185,855 188,313 51 A2-B3-D3 769,218 185,304 697,718 768,950 764,064 181,106 179,153 177,122 45 A2-B2-D3 774,538 189,195 703,038 773,738 769,384 184,993 182,667 181,005 57 A2-B4-D3 778,738 217,297 707,238 777,518 773,584 213,282 207,408 209,472
Ex-post simulation residual
risk: access control
performance +10%
Ex-post simulation
residual risk: biometrics
performance +10%
Ex-post simulation
residual risk: detection
performance +10%
PortfolioPortfolio
No
Ex-ante simulation:
security costs
Ex-ante simulation: residual
risk
Ex-post simulation
security costs: access control
cost - 10%
Ex-post simulation security costs:
biometrics cost - 10%
Ex-post simulation security costs:
detection cost - 10%

128
In the ex-ante portfolio optimization in section 5.9.5, there were 50 portfolios judged
to be alternative portfolios where both the residual security risk and security
investment are less than the status quo. Following the sensitivity analysis, a further
five portfolios can be included, as listed in table 5.48. All five portfolios had higher
security costs and residual security risk ex-ante the simulations than portfolio 173 but
ex-post the simulations, combinations of security cost and residual security risk for
the four portfolios can be found which are both less than the ex-post simulation for
portfolio 173. As in table 5.44, there is overlap between the six portfolios.
5.10.2.6 Port Facility F
Table 5.49: Port Facility F – additional alternative portfolios ex-post the simulations
In the ex-ante portfolio optimization in section 5.9.6, there were 105 portfolios judged
to be alternative portfolios where both the residual security risk and security
investment are less than the status quo. Following the sensitivity analysis, not one
portfolio can be included. Portfolio number 215 is listed in the table 5.49 to illustrate
only that it nearly qualified as an alternative portfolio in that the ex-post simulation of
10% reduction in access control costs is less than the ex-post simulation for portfolio
216 in respect of a 10% reduction in the cost of the biometrics systems.
5.10.3 Sensitivity Analysis Discussion The sensitivity analysis consisted of two simulations: a 10% reduction in security cost
of each security system and a 10% improvement in performance. The sensitivity
analysis has shown that in five out of six of the port facilities, the number of
alternative portfolios which (ex-post the simulation) resulted in both a reduction in
residual risk and a reduction in security investment compared to the status quo was
Additional alternative portfolios ex-post the simulations:
216 A6-B6-D6 1,949,689 155,539 1,817,258 1,922,129 1,914,711 149,812 151,820 149,431 215 A6-B6-D5 2,052,912 174,093 1,920,481 2,025,352 2,007,612 168,411 170,403 166,057
Ex-post simulation
residual risk: access control
performance +10%
Ex-post simulation residual
risk: biometrics
performance +10%
Ex-post simulation
residual risk: detection
performance +10%
PortfolioPortfolio
No
Ex-ante simulation:
security costs
Ex-ante simulation:
residual risk
Ex-post simulation security costs: access
control cost - 10%
Ex-post simulation security costs:
biometrics cost - 10%
Ex-post simulation security costs:
detection cost - 10%

129
five or less. In the case of port facility F, there were no alternative portfolios found
ex-post the simulation; in port facility A there was only one alternative portfolio
found ex-post the simulation; in port facility C there were four alternative portfolios
found ex-post the simulation; and in port facility E there were five alternative
portfolios found ex-post the simulation.
From this it can be inferred that the results of the original (ex-ante) portfolio
optimization exercise appear to be robust. Only in the case of port facility D were
there nine alternative portfolios identified by the simulations, but it should be borne in
mind that the nine portfolios are in addition to 154 portfolios ex-ante the simulations
where both the residual security risk and security investment .
However, the appearance of robustness of the original portfolio optimization exercise
can be affirmed by plotting the results of the portfolio optimization ex-post the
sensitivity analysis. The ex-post simulation results for port facility A are shown in
chart 5.13. When compared with chart 5.7, which represents the portfolio
optimization exercise for port facility A ex-ante the sensitivity analysis, the overall
pattern remains similar. As the clustering of the mapped points of the portfolios ex-
post the sensitivity analysis is similar for all of the port facilities, it is not necessary to
re-draw charts 5.8 to 5.12 to illustrate this.
Chart 5.13 – Optimum Portfolio Analysis (Port Facility A) ex-post the sensitivity
analysis

130
5.11 Results of the Portfolio Optimization The portfolio optimization has produced some interesting results. The results are
presented in two parts: first, the optimum and alternative portfolios which are most
successful in reducing residual security risk; and secondly, the optimum and
alternative portfolios which are most successful in reducing the security investment.
Thirdly, a Venn Diagram shows the combination of the two. Finally, an explanation
for the clustering effect found in the portfolio optimization will be made.
5.11.1 Reducing Residual Security Risk The optimum portfolio for minimising the residual risk for both port facility A and
port facility C is portfolio number 13, which consists of access control from port
facility A, biometrics from port facility C and detection system from port facility A.
The optimum portfolio for minimising the residual risk in both port facility D and port
facility F is portfolio number 67, which consists of access control from port facility B,
biometrics from port facility F and detection from port facility A. The optimum
portfolios for minimising the residual risk in port facility B and port facility E are
portfolio numbers 50 (A2-B3-D2) and 31 (A1-B6-D1) respectively. Overall, the
security systems which make up the optimum portfolios for the reduction of residual
risk across all of the port facilities consist of the following (in various combinations):
- Access control from either port facility A (A1) or port facility B (A2)
- Biometrics from either port facility C (B3) or port facility F (B6)
- Detection from either port facility A (D1) or port facility B (D2)
5.11.2 Reducing Security Investment The optimum portfolio for minimising the security investment for port facility C, port
facility D, port facility E and port facility F is portfolio number 15, which consists of
access control from port facility A and biometrics and detection from port facility C.
It is particularly interesting that one optimum portfolio of security systems is so
dominant in minimising security investment. The portfolio for minimising the
security investment in port facility A is portfolio number 13 (see above); and the
corresponding portfolio for port facility B is number 14, which consists of access
control from port facility A, biometrics from port facility C and detection from port

131
facility B. Overall, the security systems which make up the best performing portfolios
for the reduction of security investment across all of the port facilities consist of the
following (in various combinations):
- Access control from port facility A (A1)
- Biometrics from port facility C (B3)
- Detection from port facility A (D1), port facility B (D2) or port facility C (D3)
5.11.3 Reducing both Residual Security Risk and Security Investment
The security systems which are common to both the optimum portfolios for reduction
in residual security risk and security investment are A1, B3, D1 and D2 as depicted in
the intersection in the Venn Diagram in figure 5.1. They represent the access control
and detection systems from port facility A, the biometrics system from port facility C
and the detection system from port facility B.
Figure 5.1: Venn Diagram of Optimum Portfolios for Reduction of both Security Investment and Residual Security Risk
5.12 Explanation for Clustering Effect
An explanation is offered for the clustering effect highlighted by the portfolio
optimization. The clear division in the figures for the security investment between the
two clusters makes the process relatively straightforward. The left hand cluster in
charts 1 to 6 ends where the security investment is $2,387,582 (in portfolio #14) and
the right hand cluster begins where the security investment is $2,946,811 (in portfolio
#214). An examination of the portfolios where the security investment is $2,946,811
or greater yielded one common denominator: the inclusion in every alternative
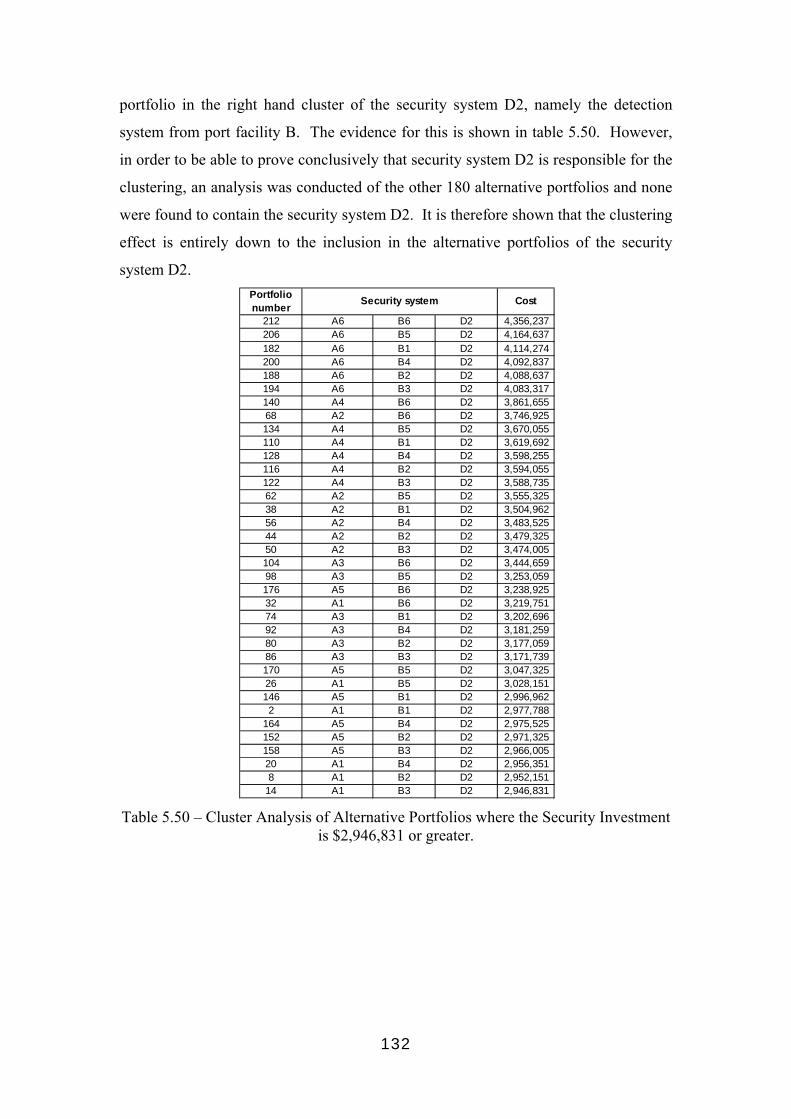
132
portfolio in the right hand cluster of the security system D2, namely the detection
system from port facility B. The evidence for this is shown in table 5.50. However,
in order to be able to prove conclusively that security system D2 is responsible for the
clustering, an analysis was conducted of the other 180 alternative portfolios and none
were found to contain the security system D2. It is therefore shown that the clustering
effect is entirely down to the inclusion in the alternative portfolios of the security
system D2.
Table 5.50 – Cluster Analysis of Alternative Portfolios where the Security Investment is $2,946,831 or greater.
Portfolio number
Cost
212 A6 B6 D2 4,356,237 206 A6 B5 D2 4,164,637 182 A6 B1 D2 4,114,274 200 A6 B4 D2 4,092,837 188 A6 B2 D2 4,088,637 194 A6 B3 D2 4,083,317 140 A4 B6 D2 3,861,655 68 A2 B6 D2 3,746,925 134 A4 B5 D2 3,670,055 110 A4 B1 D2 3,619,692 128 A4 B4 D2 3,598,255 116 A4 B2 D2 3,594,055 122 A4 B3 D2 3,588,735 62 A2 B5 D2 3,555,325 38 A2 B1 D2 3,504,962 56 A2 B4 D2 3,483,525 44 A2 B2 D2 3,479,325 50 A2 B3 D2 3,474,005 104 A3 B6 D2 3,444,659 98 A3 B5 D2 3,253,059 176 A5 B6 D2 3,238,925 32 A1 B6 D2 3,219,751 74 A3 B1 D2 3,202,696 92 A3 B4 D2 3,181,259 80 A3 B2 D2 3,177,059 86 A3 B3 D2 3,171,739 170 A5 B5 D2 3,047,325 26 A1 B5 D2 3,028,151 146 A5 B1 D2 2,996,962 2 A1 B1 D2 2,977,788
164 A5 B4 D2 2,975,525 152 A5 B2 D2 2,971,325 158 A5 B3 D2 2,966,005 20 A1 B4 D2 2,956,351 8 A1 B2 D2 2,952,151
14 A1 B3 D2 2,946,831
Security system

133
5.13 Results of the Reliability Test using Cronbach’s Alpha
The final result to be presented in this chapter is the measure of Cronbach’s Alpha as
described in section 3.4 above. In a 40 minute telephone call follow-up interview
held on 21 October 2009, the second CSO was asked to repeat the exercise of
providing his subjective assessments of the performances of the security systems for
port facilities E and F. While the CSO was aware that the telephone call would take
place, he was not made aware beforehand of the content of the call.
The results are shown in table 5.51.
Table 5.51 – Subjective assessments of Security system performance provided by the second CSO when re-interviewed on 21 October 2009 for Port Facility E and Port Facility F The subjective assessments of the performances of the security systems from the
telephone interview were compared with the data obtained in the interviews in March
2009 and the correlations are shown in table 5.52.
Table 5.52 – Correlations of security system performances for Port facility E and Port F used for calculating Cronbach’s Alpha
Port Facility EType of Security Incident Access Control Biometrics DetectionBomb introduced by person on foot 70% 80% 0%Car Bomb 100% 80% 0%Truck bomb 75% 80% 0%Biological agent attack on terminal - on foot 90% 80% 0%Biological agent attack on terminal - by vehicle 0% 0% 0%Mining of port infrastructure 0% 0% 50%
Port Facility FType of Security Incident Access Control Biometrics DetectionBomb introduced by person on foot 90% 90% 90%Car Bomb 90% 90% 0%Truck bomb 90% 90% 0%Biological agent attack on terminal - on foot 20% 90% 80%Biological agent attack on terminal - by vehicle 20% 90% 80%Mining of port infrastructure 0% 0% 80%
Security system performance
Security system performance
Cronbach's Alpha Calculation: Correlations
A5 first B5 first D5 first A6 first B6 first D6 first
A5 second 0.974
B5 second 1
D5 second 1
A6 second 0.996
B6 second 1
D6 second 0.726
134
In the follow-up telephone interview, the second CSO stated that he did not have a
copy of the data which he had given in the first interview in March 2009 but
nevertheless the results are astonishing in how closely correlated they are: they yield a
figure for Cronbach’s Alpha of 0.9912. Given that the figure for Alpha is over 0.8,
this means that the data can be considered to be very reliable (Forza, 2002, p177.)
This means that there is no need to revise the subjective assessments of the
performance of the port facilities’ security systems given by the CSOs and that the
data supplied by them in the earlier interviews is still valid for the purposes of this
research.

135
Chapter 6 – Discussion
The chapter begins with an overview of the research findings, including linking the
results to the literature. Next, the discussion compares the two approaches, the
Markowitz method and the portfolio optimization approach. Finally, the discussion
addresses the contribution which this thesis makes to academic research and makes
suggestions for areas of future research.
6.1 Overview of the Research Findings The research has focussed on the modelling of efficiency in port security systems and
has addressed the research questions introduced in section 1.4. The efficient
relationship between port security residual security risk and security investment has
been discovered through the application of Markowitz theory of portfolio selection.
Furthermore, the structured nature of the research enables direct comparisons to be
made between the security systems in the port facilities. Recalling the security
performance results in tables 5.30, 5.31 and 5.32, some interesting conclusions can be
drawn about the findings. Table 5.30 allows a direct comparison between the port
facilities as to how the security systems perform and their costs. This is useful for a
CSO to understand better where the strengths and weaknesses in the port facilities’
security systems lie.
The benefit-cost ratios in table 5.31 enable a CSO to compare how much the residual
risk is reduced in the port facilities given the security investment. This ratio can be
used to identify by how much the residual risk would reduce given the introduction of
new technology.
The residual risk : expected loss ratios in table 5.32 allow a comparison of how well
the port facilities overall security systems perform in the face of the prescribed
security threats. It is from this table that a CSO can draw some conclusions regarding
how secure the port facilities are: the lower the ratio, the higher the level of security.

136
6.2 Research Findings – Links to the Literature
The purpose of this section is to discuss the research findings in the light of the
literature. The four main areas linked to the existing literature are: security
investment; security incident costs; port security risk sources; and port security
benefit-cost analysis.
6.2.1 Security Investment The figures for security investment for Port facility A (table 5.8), Port facility C (table
5.16) and Port facility E (table 5.24) compare favourably with the average security
investments in both Dekker and Stevens (2007) and Benamara and Asariotis (2007) in
section 2.7. However, the literature only provides the average security investments
and running costs for different types of port facilities and does not include all of the
results. Therefore, it is difficult to know how the three remaining port facilities
compare.
6.2.2 Security Incident Costs The figures for the security incident costs provided by the Director of Security and
reproduced in section 5.1 appear to be on a comparable scale to the figures provided
in the OECD (2003) report in section 2.7 and focus explicitly on the port facility
rather than try to estimate the economic impact on the economy as a whole. This
addition to the literature is useful in that it provides a subjective assessment by a port
security expert on the potential losses arising from certain prescribed terrorist attacks.
6.2.3 Port Security Risk Sources The one weakness with this research has been the inability to address, in their entirety,
the port security risk sources adapted from Juttner et al (2003) as described in section
2.3.2: the research was limited to sources of terrorism risk by the limitations of the
data available. Consideration must be given to wider environmental, network-related
and organisational risk sources for future research of this nature to be of greater value.
6.2.4 Port Security Benefit-Cost Analysis The benefit-cost analysis described by Willis and LaTourette (2008) in section 2.9
refers to a regulation being justified if the incremental cost of implementing the
regulation is exceeded by the incremental benefit generated by the regulation. The
security benefit-cost ratios in table 5.31 tell us that this principle is upheld only in the

137
example of Port facility A where $1 of investment in security results in a $7.13
reduction in residual security risk. In the other five examples , the security
performance ratios are well below 1 and in the case of Port facility B it is particularly
low at 0.0325. This suggests that the ISPS Code would not qualify as a justified
regulation in the sense that Willis and LaTourette (2008) intended.
6.3 Markowitz Portfolio Selection Approach
As has been shown in Talas & Menachof (2009), a conceptual model of the
application of portfolio selection theory can be applied to port security. However, the
conceptual model in the paper and the application of Markowitz theory of portfolio
selection in this research differs in one key aspect: the conceptual model assumes that
the portfolio of security systems is sufficiently diversified for the application of
portfolio theory to work.
In this research, the very close correlations between the performances of the security
systems in three of the port facilities: A, B and C means that the application of the
Markowitz theory may lose some of its value for these port facilities, though the
application of the methodology is still valid.
However, this still begs the question: why are the performances of the security
systems so closely correlated for port facilities A, B and C?
There does not appear to be any clear answer to the question. However, the
interviews conducted with the two CSOs divide the six port facilities into two groups:
the port facilities for which the first CSO was interviewed are, coincidentally port
facilities A, B and C; while the second CSO was interviewed about port facilities D, E
and F. No firm conclusions can be drawn at this stage regarding the differences
between the subjective assessments given by the two CSOs but scope exists for
further research into this phenomenon, perhaps beginning with Tversky and
Kahneman’s (1974) work on cognitive bias and the phenomenon of anchoring.
6.4 Portfolio Optimization Approach
The portfolio optimization approach follows a robust methodology. Its application
has shown the optimum and alternative portfolios which result in both a reduction in
residual security risk and security investment. This is significant because it tells us a

138
great deal about the performance of the security systems and how to combine them in
the most efficient manner. The Venn Diagram in figure 5.1 shows the security
systems which form the optimum portfolios for reducing both residual security risk
and security investment. It is interesting to note that two of the security systems
belong to port facility A, the port facility with the highest benefit-cost ratio.
Furthermore, the distribution of optimum and alternative portfolios in charts 5.7 to
5.12 in themselves give rise to a solution of the efficient relationship between a port
facility’s residual security risk and the security investment, an illustration of which is
shown in chart 6.1. Given the existing levels of security threats to the port facilities
and the existing security systems with their associated levels of performance in view
of the security threats, the efficient frontier marks the boundary of what is achievable
in terms of the efficient relationship between residual risk and security investment and
the 216 possible portfolios lie either on the curve or to the right of the curve. This
addresses the problem the research set out to address in section 1.2.
Chart 6.1: An illustration of the residual security risk – security investment efficient frontier
As in Chopra and Sodhi (2004), it is possible to move along the curve and for the port
facility still to have an efficient relationship between residual security risk and
security investment. However, what is interesting is what causes the efficient frontier
curve to shift up and down and by how much. The curve might shift downwards if a
139
new technology were to be introduced which causes a security system to perform
better than the status quo. However, the curve might shift upwards if the background
threat level deteriorates. The key outcome of the research is that movements in and
along the efficient frontier curve are quantifiable and their significance can be
understood in financial terms. This can be particularly useful for decision makers
without a background in security who can, nonetheless appreciate the change in such
terms.
6.5 A Comparison of the Markowitz Method and Portfolio Optimization One of the outcomes of the research has been the ability to compare the ability of the
two approaches in the reduction of residual security risk in a port facility. The
Markowitz approach works by efficiently rearranging the existing security systems as
a portfolio and the portfolio optimization approach works by theoretically importing
better performing security systems from other port facilities and modelling how the
new portfolio of security systems works compared with the status quo. A comparison
of the results shows that there is no clear winner between the two approaches. For
port facility A, the Markowitz approach reduces risk by $422,165 while the portfolio
optimization approach produces a reduction in risk of only $63,136. Similarly, for
port facility B, the Markowitz approach reduces risk by $25,264 while the portfolio
optimization approach manages only a $1,355 reduction in risk. For port facility C,
the results are much closer as the Markowitz approach reduces risk by $67,151 and
the portfolio optimization approach reduces risk by $32,527.
However, for port facility D, the positions are reversed. The Markowitz approach
reduces risk by $67,151 but the portfolio optimization approach reduces risk by
$309,837 which is a considerable difference. Similarly, for port facility E, the
Markowitz approach reduces risk by $74,156 while the portfolio optimization
approach reduces risk by $104,730. Finally, the comparison of the two methods for
port facility F is similar to port facility C in that the Markowitz approach reduces risk
by $62,303 and the portfolio optimization approach reduces risk by $59,379.
In attempting an explanation for these differences, it is perhaps useful to examine the
positions of the six port facilities’ portfolios in relation to the frontier in chart 6.1.
The positions of port facilities A and B are very close to the frontier, ie their security
systems are already quite efficient and in both instances , the Markowitz approach

140
was clearly more successful in risk reduction. Considering port facilities C and F,
they can be described as being near to the frontier and in both instances , the two
approaches are comparable in their ability to reduce risk. However, what is clear is
that for port facilities D and E, which lie much further away from the efficient
frontier, the portfolio optimization approach produces the much larger reduction in
risk, compared to the Markowitz approach. Further research could be carried into
producing a definitive explanation for this phenomenon.
6.6 Contribution The use of Markowitz theory of portfolio selection and portfolio optimization to
arrive at the efficient relationship between residual security risk and security
investment for port facilities is significant on three accounts. First, the methods can
be employed in the development of Greenfield sites to guide a Company Security
Officer to implement a security system which best suits his/her requirements in terms
of both residual security risk and security investment and to do so efficiently.
Secondly, the proposed introduction of new port security technology with an
enhanced performance in an existing port facility can be modelled to learn the extent
to which the residual security risk might be reduced, for a new given level of security
investment. Thirdly, a change in the background security threat to a port facility can
be quantified in terms of a change to the residual security risk. CSOs can use this
information to help them decide on a possible course of action to address the change
in threat. Furthermore, the quantifiable nature of the measure of residual security risk
will enable executives from outside of the security department to understand the
impact of security investment generally and to enable CSOs to justify their security
spend. Fourthly, a theoretical contribution is derived through the adaptation of the
Markowitz model from the field of finance, including stock markets, to the field of
port security, in both cases with different sets of assumptions.
Finally, the research has yielded new definitions of port security and port security risk
as well as providing the tools to measure two port security ratios: the security benefit-
cost ratio which can be used when conducting a benefit-cost analysis; and the residual
risk : expected loss ratio which enables a CSO or PFSO to compare the effectiveness
of port security systems against prescribed security incidents.

141
6.7 Areas for Further Research There are a three main areas for further research. The first concerns the implications
of the cross-disciplinary application of Markowitz theory of portfolio selection and
portfolio optimization. The second area continues the work of Gleason (1980) and
examines probability distributions for terrorism which are not explained by Poisson.
The third area for further research is concerned with the use of new data sources.
Each of the three areas will be examined briefly below.
The first area for further research would be to collect empirical data on the change in
performance of a port facility’s security systems through the introduction of new
technology or working practices. Further research could also include the application
of the theory in the selection of a new security system for a Greenfield site. A further
suggestion could be an attempt to discover whether the application of the ISPS Code,
or some of the other security initiatives outlined in chapter II, can be made to be more
efficient, in line with Willis and LaTourette’s (2008) test for justified security
legislation.
The second area of further research is to continue the work in this research which
builds on Gleason’s (1980) research on the probability distributions which may
describe terrorism events. While this research has demonstrated that between 1968
and 2007, terrorist attacks against ports or against shipping in ports follows a Poission
distribution, there is no evidence to suggest that terrorist attacks against non-port
targets or other non-port maritime targets follow a Poisson distribution. Therefore,
there is scope to research terrorist attacks of both marine and non-marine locations in
order to discover the nature of the probability distributions which best describe them.
The third area of further research is the use of new sources of data. Such sources
include ISPS Code compliant port facilities which are not container terminals, or other
nodes in the supply chain such as warehouses or logistics parks which have adopted
security systems and practices which are aligned with the ISPS Code. Furthermore,
new sources of data can also include different forms of risk, not limited to terrorism
alone, such as in this research. This would serve to address the gap in the literature
described by Juttner et al (2003).

142
Chapter 7 - Conclusion
The research has focussed on the field of port security, an area of increasing interest
to academics and was based on an industry example, namely six container port
facilities owned by Dubai Ports (DP) World. The existing literature has been
examined and new definitions of security, port security, port security risk and port
security risk management have been proposed. Furthermore, a model of port security
risk has been developed, based on Willis et al’s (2005) definition of terrorist risk.
The main research question considered how ISPS Code compliant port facilities can
discover the efficient relationship between residual security risk and security
investment. In order to address the main research question, it was broken down into
two further research questions which addressed what it means for a port facility to be
ISPS Code compliant and how the efficient relationship between residual security risk
and security investment can be calculated. The latter was tackled by means of asking
a further five questions concerning security threats to port facilities; estimated gross
losses to the port facilities following prescribed security threats; the security systems
present in the port facilities; the performance of the security systems in the face of the
prescribed security threats; and the security systems’ costs. In order to tackle the
main research question, an adaptive research strategy was employed, which
combined contemporary empirical data in an industry example with a theory from the
field of finance to produce a solution to the current problem. The research
methodology employed mixed methods, which included survey questionnaires to
assess the six DP World port facilities’ security systems and costs; structured
interviews with two of DP World’s company security officers for their subjective
evaluations of the performance of the security systems; and an interview with a
Lloyd’s Underwriter of terrorism risks.
The research has intentionally not produced any new theory about port security but
has shown how company security officers can assess whether a port facility’s security
systems are efficient. This has been achieved in two ways: first, the Markowitz
approach has treated a port facility’s security systems as a portfolio in order to arrive
at an efficient solution based on the risk-return (expected performance – standard
143
deviation) efficient frontier of the performance of the port facilities’ security systems
in the face of prescribed security threats.
The second approach was a portfolio optimization approach which theoretically
constructed an optimum portfolio drawn from the security systems in the different
port facilities in order to arrive at the best solution for risk reduction for that port
facility, in much the same way as one might construct a ‘fantasy cricket team’ drawn
from the best players in a cricket league. The portfolio optimization approach
produced the efficient solution for the relationship between risk and security
investment drawn from all 216 possible combinations of security system portfolios
from among the three security systems (access control, biometrics and detection)
across the six port facilities. The issue of the use of a relatively small dataset was
addressed by conducting a sensitivity analysis using a simulation whereby the costs of
the security systems were individually reduced by 10% while at the same time the
performance of the individual security systems were individually improved by 10%.
The results of the sensitivity analysis showed that following the simulation, the initial
results of the portfolio optimization were still valid.
The main difference between the two approaches is that Markowitz method can be
applied to a port facility in isolation, whereas the portfolio optimization approach
relies on data from more than one port facility.
These two approaches were then compared and the results were mixed as to which
method was more effective in reducing port security risk, though it appears that for
those portfolios of security systems which lie closest to the efficient frontier solution,
the Markowitz approach would be best suited to reduce risk and vice versa for the
portfolios that lie furthest away from the efficient frontier.
Furthermore, the results of the research are generalizable to any ISPS Code compliant
port facility or to any other type of node in the supply chain, such as a warehouse or
logistics park, which consists of similar security systems and follows a similar
security regime as that described in the ISPS Code.
The work by Gleason (1980) was extended to include more contemporary data on
terrorist attacks on ports and on shipping in ports and these attacks were also shown to
follow a Poisson distribution. This means that it is possible to arrive at a probability
for a terrorist attack on a port or on shipping in a port in any given year, though with
two key assumptions, namely that all attacks are independent and all port facilities are
equally likely to be attacked. However, these two assumptions may be too great to

144
bear and thus it is still necessary to rely on the expert opinion of maritime terrorism
underwriters from Lloyd’s of London or other reputable underwriting establishments.
Furthermore, the research has produced two new port security ratios: the residual risk
reduction : security expenditure ratio; and the residual risk : expected loss ratio.
These ratios can be of use to port security personnel and company security officers
when evaluating their security systems. The research contribution also includes a
roadmap for developing security systems for Greenfield sites based on knowledge of
existing security systems and the modelling of changes in background security risk
and the introduction of new technology.
Finally, there is scope to extend the research in the future to include many more types
of security threat, not only including the threat from terrorists, in order to build a more
comprehensive model which will be of interest to academics and practitioners alike.

145
References Abkowitz, M.D. (2003) “Transportation Risk Management: A New Paradigm”, Proceedings of the Transportation Research Board 82nd Annual Meeting, January 11-16 ABS Consulting (2003) “Port Security Guide”, http://www.absconsulting.com/resources/Port_Security_Guide.pdf accessed 12 December 2007 Angelides, P. (2001) “The development of an efficient technique for collecting and analyzing qualitative data: the analysis of critical incidents”, Qualitative Studies in Education, Vol. 14, No. 3, 429-442 Anyanova, E (2007) “The EC and Enhancing Ship and Port Facility Security”, Journal of International Commercial Law and Technology, Vol 2, 1 Arora, A., Hall, D., Pinto, A., Ramsey, D. & Telang, R. (2004) “Measuring the Risk-Based Value of IT Security Solutions”, IEEE IT Professional 6: 35-42 Aryasinha, R. (2001) “Terrorism, the LTTE and the conflict in Sri Lanka”, Conflict, Security and Development, Vol. 1, No. 2, pp.25-50 Banomyong, R. (2005) “The impact of port facility And trade security initiatives on maritime supply-chain management”, Journal of Maritime Policy & Management, Jan-Mar 2005, vol. 32, no. 1, 3–13 Baldwin, D.A. (2005) “The Concept of Security” in Diehl, P.F. (ed.) “War”, vol. 1, pp. 1-24, London: Sage Barnes, P & Oloruntoba, R (2005) “Assurance of Security in Maritime Supply Chains: Conceptual Issues of Vulnerability and Crisis Management”, Journal of International Management 11(4) Barry, J. (2004) “Supply chain risk in an uncertain global supply chain environment”, International Journal of Physical Distribution & Logistics Management, Vol. 34 No. 9, pp. 695-697 Bedford T. & Cooke, R (2001) “Probabilistic Risk Analysis: Foundations and Methods”, Cambridge University Press Benamara, H. & Asariotis, R. (2007) “ISPS Code implementation in ports: costs and related financing” in Bichou, K., Bell, M.G.H. & Evans, A., Eds. (2007) “Risk management in port operations, logistics and supply chain security”, Informa, London Bichou, K. (2004) “The ISPS Code and The Cost of Port facility Compliance: An Initial Logistics and Supply Chain Framework for Port Security Assessment and Management”, Journal of Maritime Economics & Logistics, 6, (322–348)

146
Bichou, K. (2009) “Security and risk-based models in shipping and ports: review and critical analysis” in OECD/ITF Roundtable 144 “Terrorism and international transport: towards risk-based security policy”, OECD/ITF Transport Research Centre Bichou, K. & Evans, A. (2007) “Maritime security and regulatory risk-based models: review and critical analysis” in Bichou, K., Bell, M.G.H. & Evans, A., Eds. (2007) “Risk management in port operations, logistics and supply chain security”, Informa, London Bichou, K. & Gray, R (2004) “A logistics and supply chain management approach to port performance measurement”, Journal of Maritime Policy and Management, January-March 2004, Vol 31 no 1, pp 47-67 Billington, CJ. (2001) “Managing risks in ports” In: (ed). “Managing Risks in Shipping: A Practical Guide” The Nautical Institute: London. pp. 57–69. Broder, J. (2006) “Risk Analysis and the Security Survey”, Boston, 3rd Edition Bryman, A. (2004) “Social Research Methods”, Oxford, 2nd Edition Burke, R.J. (2005) “International terrorism and threats to security”, Journal of Disaster Prevention and Management, Vol. 14 No. 5, pp. 639-643 Buzan, Barry (1991) “People, states and fear: an agenda for international security studies in the post cold-war era”, New York: Harvester Wheatsheaf Byrne, P. & Lee, S. (1994) “Computing Markowitz Efficient Frontiers Using a Spreadsheet Optimizer”, Journal of Property Finance, Vol. 5, No.1, pp58-66 Chopra, S. & Sodhi, M.S. (2004) “Managing Risk to Avoid Supply Chain Breakdown”, MIT Sloan Management Review Christopher, M. (2005) “Logistics and Supply Chain Management”, 3rd Edition, FT Prentice Hall Clark L. & Watson D., “Constructing Validity: Basic Issues in Objective Scale Development”, Psychological Assessment. 7(3):309-319, September 1995 Clemen, R.T. and Winkler, R.L. (1999), “Combining Probability Distributions from Experts in Risk Analysis,” Risk Analysis, Volume 19, Issue 2, pp.187-203 Closs, D. & McGarrell, F. (2004) “Enhancing Security Throughout the Supply Chain”, IBM Center for the Business of Government Special Report Series, April 2004 Containerisation International (2003) “Security versus supply chain” pp. 49–53. Cremers, P and Chawla, P. (1999) “Shipboard management and safety standards” BIMCO Review, 7th Edition, 234–237.
147
Cronbach, L.J. (1951) “Coefficient Alpha and the internal structure of tests”, Psychometrika, Vol. 16, No. 4, pp 297-334 De Rugy, V. (2004) “What Does Homeland Security Spending Buy?” American Enterprise Institute for Public Policy Research working paper #107 De Vaus, D. (2002) “Surveys in Social Research” 5th Ed, London: Routledge Dekker, S. & Stevens, H. (2007) “Maritime security in the European Union – empirical findings on financial implications for port facilities”, Maritime Policy and Management, Vol. 34, No. 5, 485-499 Dorfman, R. (1993) “An introduction to benefit–cost analysis” In: Stavins, RN (ed). “Economics of the Environment” 4th Edition, Norton & Co: New York, NY. pp. 297–322 Drewry Shipping Consultants. (1998) “Cost of quality shipping: The financial implications of the current regulatory environment” London, November 1998 Easterby-Smith, M., Thorpe, R. & Lowe, A. (1991) “Management Research: an Introduction”, Sage Publications, London Eisenhardt, K. (1989) “Building Theories from Case Study Research”, Academy of Management Review, Vol. 14, No.4, pp 532-550 Eisenhardt, K. (1991) “Better stories and better constructs: the case for rigor and comparative logic”, Academy of Management Review, Vol. 16, No. 3, 620-627 Eisenhardt, K. & Graebner, M. (2007) “Theory Building from Cases: Opportunities and Challenges”, Academy of Management Journal, Vol. 50, No. 1, pp 25-32 Farrow, S. & Shapiro, S (2009) “The benefit-cost analysis of security focussed regulations”, Journal of Homeland Security and Emergency Management, Vol. 6, No. 1, Article 25 Fischer, R. J. & Green, G. (2004) “Introduction to security”, 7th ed., Boston: Butterworth Heinemann Forza, C. (2002) “Survey research in operations management: a process-based perspective”, International Journal of Operations and Production Management, Vol. 22, No. 2, pp 152-194 Fredouet, C-H. (2007) “Global Supply-Chain Securitization as Applied to Port Operations: A Knowledge-based Approach”, Journal of International Logistics and Trade, Vol 5, Number 1, pp 57-73 Gaonkar, R. & Viswanadham, N. (2004) “A conceptual and analytical framework for the managing of risks in supply chains”, Proceedings of the 2004 IEEE International Conference on Robotics and Automation, April 26-May 1, Vol. 3, pp2699-2704

148
Gardela, K. & Hoffman, B. (1990) “The RAND Chronology of International Terrorism for 1986”, RAND Corporation Gardela, K. & Hoffman, B. (1991) “The RAND Chronology of International Terrorism for 1987”, RAND Corporation Gardela, K. & Hoffman, B. (1992) “The RAND Chronology of International Terrorism for 1988”, RAND Corporation Gerencser, M., Weinberg, J. & Vincent, D. (2003) “Port Security War Game”, Booz Allen Hamilton Gill, J. (2002) “Bayesian Methods: A Social and Behavioural Sciences Approach”, Chapman & Hall/CRC Gleason, J. M.(1980) 'A Poisson model of incidents of international terrorism in the United States', Studies in Conflict & Terrorism, 4: 1, 259 — 265 Gordon, P., Moore II, J., Richardson, H. & Pan, Q. (2005) “The Economic Impact of a Terrorist Attack on the Twin Ports of Los Angeles-Long Beach”, Center for Risk and Economic Analysis of Terrorism Events report facility Draft #05-012, University of Southern California Goulielmos, A. & Anastasakos, A. (2005) “Worldwide security measures for shipping, seafarers and ports: an impact assessment of the ISPS Code”, Journal of Disaster Prevention and Management, Vol. 14 No. 4, 2005 Greenberg, M, Chalk, P, Willis, H, Khilko, I & Ortiz, D (2006) “Maritime Terrorism: Risk and Liability”, RAND Corporation Centre for Terrorism and Risk Management Policy Guerrero, H., Murray, D. & Flood, R. (2008) “A model for supply chain and vessel traffic restoration in the event of a catastrophic port facility Closure”, Journal of Transportation Security, 1:71-80 Gutierrez, X., Hintsa, J., Wieser, P. & Hameri, A-P. (2007) “Voluntary supply chain security impacts: an empirical study with BASC members companies”, World Customs Journal, Vol. 1, No. 2, pp31-48 Harrald, J. (2005) “Sea trade and security: An assessment of the post-9/11 reaction”, Journal of International Affairs, 59: 157 – 178. Harrald, J., Stevens, H.W. & vanDorp, J.R. (2004) “A framework for sustainable port security”, Journal of Homeland Security and Emergency Management , Vol. 1 (2): Article 12. Haubrich, D. (2006) “Modern Politics in an Age of Global Terrorism: New Challenges for Domestic Public Policy” Journal of Political Studies, Vol 54, 399-423
149
Haveman, J.D., & Shatz, H.J. (2006) “Financing Port Security” in Havemen, J.D. & Shatz, H.J. (Eds.) “Protecting the Nation’s Ports: Balancing Security and Cost”, Public Policy Institute of California Heimer, C. (1988) “Social structure, psychology and the estimation of risk”, Annual Review of Sociology, 14:491-519 Helmick, J.S. (2008) “Port facility and maritime security: a research perspective”, Journal of Transportation Security, 1:15-28 Hesse, H. & Charalambous, N.L. (2004) “New Security Measures for the International Shipping Community”, WMU Journal of Maritime Affairs, 2004, Vol. 3, No.2, 123–138 Hilmola, O-P., Hejazi, A. & Ojala, L. (2005) “Supply Chain Management Research Using Case Studies: A Literature Analysis”, International Journal of Integrated Supply Management, Vol. 1, No. 3 Hoaglund, R. & Gazda, W. (2007) “Assessment of Performance Measures for Security of the Maritime Transportation Network, Port Security Metrics: Proposed Measurement of Deterrence Capability”, U.S. Department of Transportation, Research Innovative Technology Administration International Maritime Organisation (2003) “International Ship and Port Facility Security (ISPS) Code”, IMO: London International Organisation for Standardisation, (2005) “ISO 28000”, Technical Committee ISO/TC8 (Ships and Marine Technology), Geneva Jenkins, B., Cordes, B., Gardela, K. & Petty, G. (1983) “A Chronology of Terrorist Attacks and Other Criminal Actions Against Maritime Targets”, RAND Corporation Jones, S. (2006) “Maritime Security: A Practical Guide”, The Nautical Institute Juttner, U. (2005) “Supply chain risk management – understanding the business requirements from a practitioner perspective”, International Journal of Logistics Management, 16, 1: 120-141 Juttner, U., Peck, H. and Christopher, M. (2003) “Supply chain risk management: outlining an agenda for future research”, International Journal of Logistics: Research and Applications, Vol. 6 No.4, pp. 199-213 Kahneman, D. & Tversky, A. (1979) “Prospect Theory: An Analysis of Decision under Risk”, Econometrica, Vol. 47, No. 2, pp. 263-292. Kunreuther, H., Meszaros, J., Hogarth, R. & Spranca, M., (1995) “Ambiguity and Underwriter Decision Processes”, Journal of Economic Behavior and Organization, Vol. 26, 337-352

150
Kunreuther, H., Hogarth, R. & Meszaros, J (1993) “Insurer ambiguity and market failure”, Journal of Risk and Uncertainty. Vol. 7, no. 1, pp. 71-87. Lafree, G. & Dugan, L. (2007) “Introducing the Global Terrorism Database”, Journal of Terrorism and Political Violence, 19:181–204 Lambert, J.H. (2007) “Risk-cost-benefit analysis for port facility Environmental security investments” in Linkov, I. et al (eds.) “Managing Critical Infrastructure Risks”, pp299-307, Springer Lee, H. and Whang, S., "Higher Supply Chain Security with Lower Cost: Lessons from Total Quality Management" (October 19, 2003). Stanford GSB Research Paper No. 1824 Lee, H.L. & Wolfe, M. (2003) “Supply chain security without tears”, Supply Chain Management Review, Vol. 7, No. 1, pp 12-21 Lewis, B., Erera, A. & White III, C. (2007) “Optimization approaches for efficient container security operations at transhipment ports”, Journal of the Transportation Research Board, Vol. 1822, pp 1-8 Lowrance, W.W. (1980) “The nature of risk”, in Schwing, R.C. and Albers, W.A. (Eds) How Safe is Safe Enough?, Plenum Press, New York Ma, S. (2002) “Economics of maritime safety and environment regulations” In: Grammenos, CT (ed). “The Handbook of Maritime Economics and Business” LLP: London. pp. 399–426 Mangan, J., Lalwani, C. & Gardner, B. (2004) “Combining quantitative and qualitative methodologies in logistics research”, International Journal of Physical Distribution and Logistics Management, Vol. 34, No. 7, pp565-578 March, J.G. & Shapira, Z. (1987) “Managerial Perspectives on Risk and Risk Taking”, Management Science, Vol. 33, No. 11, pp. 1404-1418 Markowitz, H (1952) “Portfolio Selection” The Journal of Finance, Vol. 7, No. 1, pp77-91 Martz, H. & Johnson, M. (1987) “Risk Analysis of Terrorist Attacks”, Risk Analysis Vol 7, No 1 Maslow, A.H. (1942) “The Dynamics of Psychological Security-Insecurity”, Journal of Personality, Vol. 10, Issue 4, pp. 331-334 Merrick, J.R. & van Dorp, R. (2006) “Speaking the truth about maritime risk assessment”, Risk Analysis, Vol. 26, No. 1, pp.223-237 Miller, M.D. (1994) “Marine War Risks”, Lloyd’s of London Press Ltd, 2nd Edition
151
Miller, N. & Talas, R. (2007) “War, terrorism and associated perils in marine insurance” in Marangos, H. L. (ed.) “War Risks and Terrorism”, Insurance Institute of London Research Study Group 258 Nincic, D. (2005) “The Challenge of Maritime Terrorism: Threat Identification, WMD and Regime Response” The Journal of Strategic Studies, Vol. 28, No. 4, 619-644 OECD (1996) “Competitive advantages obtained by some shipowners as a result of non-observance of applicable international rules and standards” OECD/GD 96: 1–31. OECD (2003) “Security in Maritime Transport: Risk Factors and Economic Impact”, Maritime Transport facility Committee, Directorate for Science, Technology and Industry Ouchi, F. (2004) “A Literature Review on the Use of Expert Opinion in Probabilistic Risk Analysis”, World Bank Policy Research Working Paper 3201, February 2004 Palac-McMiken, E. (2004) “Combating terrorism in the transport sector: economic costs and benefits”, Economic Analytical Unit, Australian Govt Department of Foreign Affairs and Trade Panayides, P. (2006) “Maritime Logistics and Global Supply Chains: Towards a Research Agenda”, Journal of Maritime Economics and Logistics, 8, 3-18 Parfomak, P. & Frittelli, J. (2007) “Maritime Security: Potential Terrorist Attacks and Protection Priorities”, CRS Report for Congress, 9 January 2007 Peachey, JH. (2001) “Managing risk through legislation” In: The Nautical Institute (ed). “Managing Risks in Shipping: A Practical Guide” The Nautical Institute: London. pp. 92–105. Peck, H. (2006) “Reconciling supply chain vulnerability, risk and supply chain management”, International Journal of Logistics: Research and Applications, Vol. 9, No. 2, pp. 127-142 Pinto, C.A. & Talley, W.K. (2006) “The Security Incident Cycle of Ports”, Maritime Economics & Logistics, 8 (267-286) Price, W (2004) “Reducing the Risk of Terror Events at Ports”, Review of Policy Research 21 (3), 329-349 Prokop, D. (2004) “Smart and Safe Borders: The Logistics of Inbound Cargo Security”, International Journal of Logistics Management, Vol. 15, No. 2 Pyzdek, T. (2003) “The Six Sigma Handbook”, McGraw-Hill Raymond, C.Z. (2006) “Maritime Terrorism in Southeast Asia: A Risk Assessment”, Terrorism and Political Violence, 18:2, 239-257
152
Rice, J. & Spayd, P (2005) “Investing in Supply Chain Security: Collateral Benefits”, Special Report Series, IBM Center for The Business of Government
Rao, S. & Goldsby, T.J. (2009) “Supply chain risks: a review and typology”, International Journal of Logistics Management, Vol. 20, No.1, pp97-123 Robinson, P. (2008) “Dictionary of International Security”, Polity Press: Cambridge Rosoff, H. & von Winterfeldt, D. (2005) “A Risk and Economic Analysis of Dirty Bomb Attacks on the Ports of Los Angeles and Long Beach”, Center for Risk and Economic Analysis of Terrorism Events report facility Draft #05-027 Sheffi, Y. (2001) “Supply Chain Management Under the Threat of International Terrorism”, International Journal of Logistics Management, Vol. 12, No. 2 Siggelkow, N. (2007) “Persuasion with Case Studies”, Academy of Management Journal, Vol. 50, No.1, 20-24 Stasinopoulos, D. (2003) “Maritime Security – The Need for a Global Agreement”, Maritime Economics & Logistics, Vol. 5, pp311-320 Stecke, K. & Kumar, S. (2008) “Sources of Supply Chain Disruptions, Factors that breed Vulnerability and Mitigating Strategies”, Journal of Marketing Channels, forthcoming Stock, J. (1997) “Applying Theories From Other Disciplines to Logistics”, International Journal of Physical Distribution & Logistics Management, Vol. 27, No. 9/10 Sunstein, C. (2003) “Terrorism and Probability Neglect”, Journal of Risk and Uncertainty, 26:2/3; 121-136 Talley, W. K. (1994) “Performance Indicators and Port Performance Evaluation,” Logistics and Transportation Review, 30: 339-352. Talley, W. K., (1998) “Optimum Throughput and Performance Evaluation of Marine Terminals,” Maritime Policy and Management, 15: 327-331. Talas, R. & Menachof, D. (2008) “The efficient trade off between security and cost for sea ports: a case study of an international ports company” in Lyons, A. (ed.), Logistics Research Network Conference Proceedings, University of Liverpool, 10-12 September 2008
Talas, R. & Menachof, D. (2009) “The efficient trade off between security and cost for sea ports: a conceptual model”, International Journal of Risk Assessment and Management, Vol. 13, No. 1
Tang, S. (2006) “Robust strategies for mitigating supply chain disruptions”, International Journal of Logistics: Research and Applications, Vol. 9, No. 1, pp 33–45

153
Tversky, A. & Kahneman, D (1974) “Judgment under uncertainty: Heuristics and biases”, Science, 185, 1124-1131 UNCTAD (2007) “Maritime Security: ISPS Code Implementation, Costs and Related Financing”, UNCTAD Secretariat, accessed on 3/08/2009 at http://www.unctad.org/en/docs/sdtetlb20071_en.pdf Williams, Z., Lueg, J.E. & LeMay, S.A. (2008) “Supply chain security: an overview and research agenda”, International Journal of Logistics Management, Vol. 19 No. 2, 2008 Willig, C. (2003) “Introducing Qualitative Research in Psychology: Adventures in Theory and Method”, Open University Press, Buckingham Willis, H. & LaTourette, T. (2008) “Using Probabilistic Terrorism Risk-Modelling for Regulatory Benefit-Cost Analysis: Application to the Western Hemisphere Travel Initiative in the Land Environment”, Risk Analysis 28 (2)325-339 Willis, H., Morral, A., Kelly, T. & Medby, J. (2005) “Estimating Terrorism Risks”, RAND Corporation Woo, G. (2003) “Insuring against al-Qaeda”, National Bureau of Economic Research Meeting Woolcot, H.F. (1990) “Writing Up Qualitative Research”, Newbury Park, California: Sage Yates, J.F, Stone, E.R. (1992), "The risk construct", in Yates, J.F (Eds),Risk Taking Behaviour, Wiley, New York, NY, pp.1-25. Yin, R. (1994) “Case Study Research: Design and Methods”, 2nd Ed., Sage Yap, W.Y. & Lam, J.S.(2004) “An interpretation of inter-container port relationships from the demand perspective”, Maritime Policy & Management, 31:4,337-355 Zsidisin, G.A., Ellram, L.M., Carter, J.R. & Cavinato, J.L. (2004) “An analysis of supply risk assessment techniques”, International Journal of Physical Distribution & Logistics Management, Vol. 34, No.5, pp397-413

154
Appendix A – ISPS Code Port Facility Security Equipment Checklist
ISPS Port Facility Security Equipment Checklist
ISPS Part/
Section Referenc
e
PORT FACILITY SECURITY PLAN TOPIC ISPS CATEGORY EQUIPMENT CATEGORY
EQUIPMENT REQUIRED
A.16.3.2 The plan shall address measures designed to
prevent unauthorised access to the port facility, ships at the facility & restricted areas
ACCESS TO PORT FACILITY
ACCESS CONTROL FENCING / GATES
B.16.17.1 At security level 1, the plan should establish control points for the following:restricted areas, which should be bounded by fencing or other barriers to a standard which should be approved by the Contracting Government
ACCESS TO PORT FACILITY
ACCESS CONTROL FENCING / GATES
B.16.19.2 At security level 2, the plan should establish the additional measures: limiting the number of access points to the port facility, and identifying those to be closed and the means of adequately securing them
ACCESS TO PORT FACILITY
ACCESS CONTROL FENCING / GATES
B.16.28.7 At security level 2, the plan should address: establishing and restricting access to areas adjacent to the restricted areas
ACCESS TO PORT FACILITY
ACCESS CONTROL FENCING / GATES
B.16.27.2 At security level 1, the plan should address: provision of access points controlled by security
ACCESS TO PORT FACILITY
ACCESS CONTROL GATES
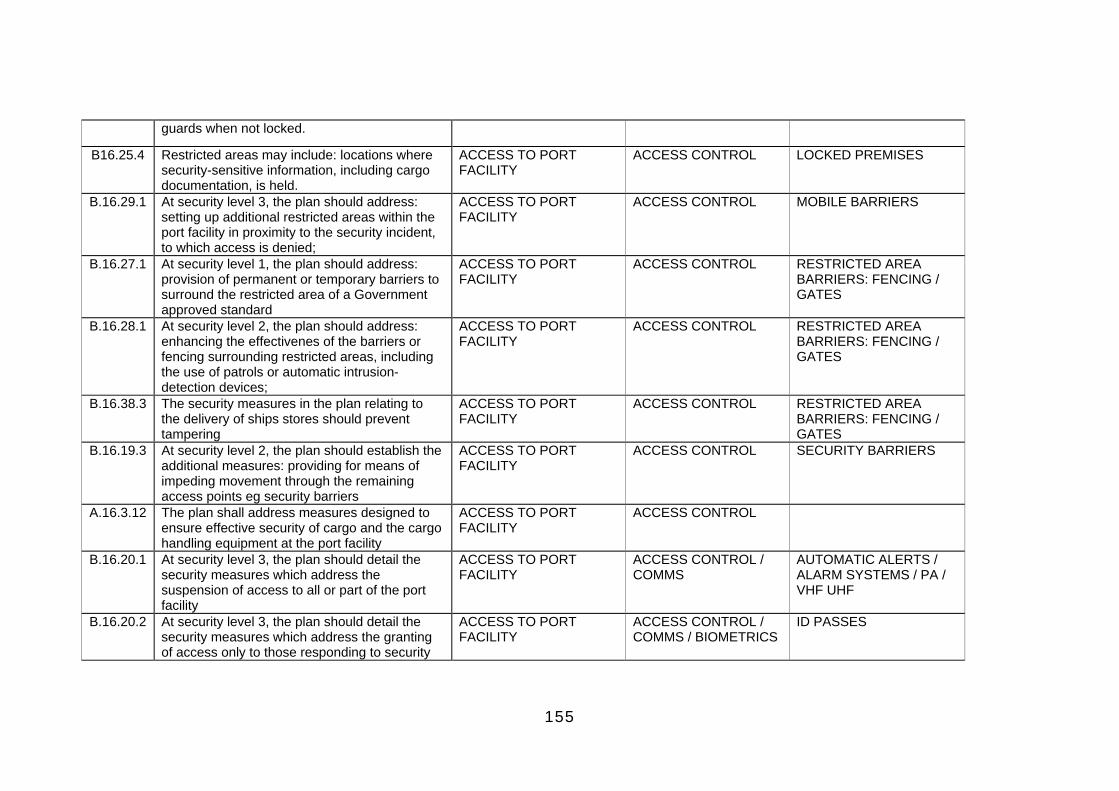
155
guards when not locked.
B16.25.4 Restricted areas may include: locations where security-sensitive information, including cargo documentation, is held.
ACCESS TO PORT FACILITY
ACCESS CONTROL LOCKED PREMISES
B.16.29.1 At security level 3, the plan should address: setting up additional restricted areas within the port facility in proximity to the security incident, to which access is denied;
ACCESS TO PORT FACILITY
ACCESS CONTROL MOBILE BARRIERS
B.16.27.1 At security level 1, the plan should address: provision of permanent or temporary barriers to surround the restricted area of a Government approved standard
ACCESS TO PORT FACILITY
ACCESS CONTROL RESTRICTED AREA BARRIERS: FENCING / GATES
B.16.28.1 At security level 2, the plan should address: enhancing the effectivenes of the barriers or fencing surrounding restricted areas, including the use of patrols or automatic intrusion-detection devices;
ACCESS TO PORT FACILITY
ACCESS CONTROL RESTRICTED AREA BARRIERS: FENCING / GATES
B.16.38.3 The security measures in the plan relating to the delivery of ships stores should prevent tampering
ACCESS TO PORT FACILITY
ACCESS CONTROL RESTRICTED AREA BARRIERS: FENCING / GATES
B.16.19.3 At security level 2, the plan should establish the additional measures: providing for means of impeding movement through the remaining access points eg security barriers
ACCESS TO PORT FACILITY
ACCESS CONTROL SECURITY BARRIERS
A.16.3.12 The plan shall address measures designed to ensure effective security of cargo and the cargo handling equipment at the port facility
ACCESS TO PORT FACILITY
ACCESS CONTROL
B.16.20.1 At security level 3, the plan should detail the security measures which address the suspension of access to all or part of the port facility
ACCESS TO PORT FACILITY
ACCESS CONTROL / COMMS
AUTOMATIC ALERTS / ALARM SYSTEMS / PA / VHF UHF
B.16.20.2 At security level 3, the plan should detail the security measures which address the granting of access only to those responding to security
ACCESS TO PORT FACILITY
ACCESS CONTROL / COMMS / BIOMETRICS
ID PASSES
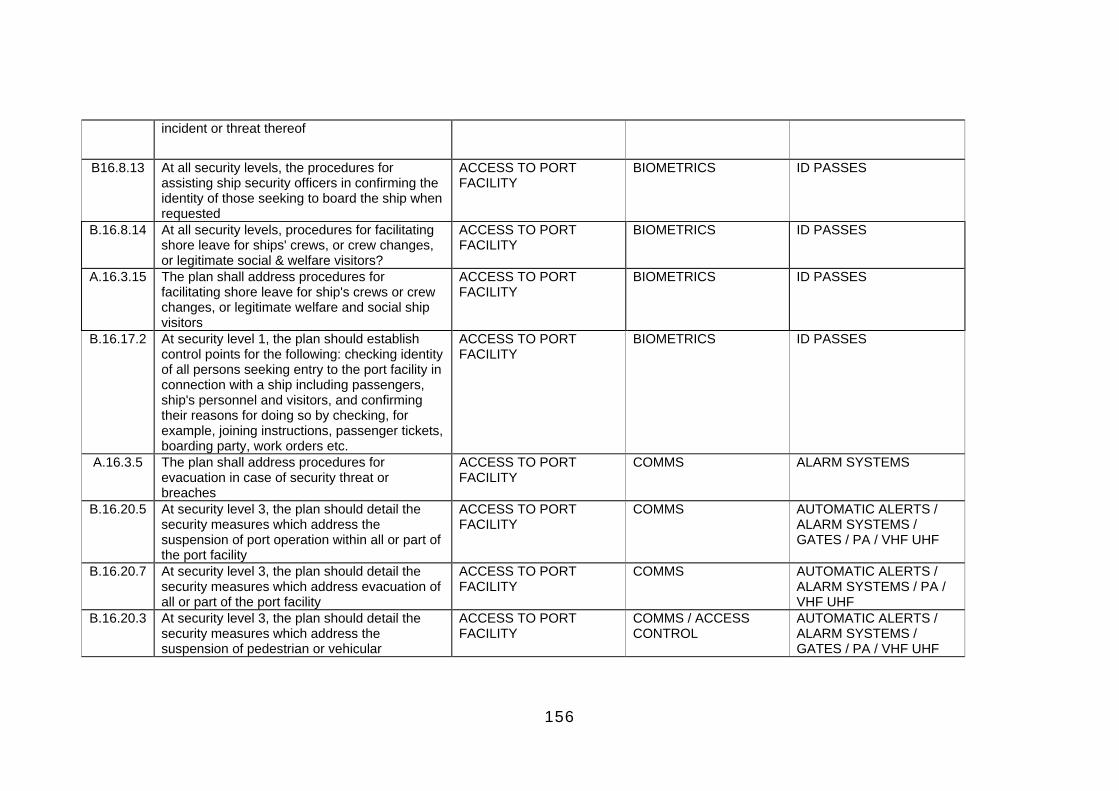
156
incident or threat thereof
B16.8.13 At all security levels, the procedures for assisting ship security officers in confirming the identity of those seeking to board the ship when requested
ACCESS TO PORT FACILITY
BIOMETRICS ID PASSES
B.16.8.14 At all security levels, procedures for facilitating shore leave for ships' crews, or crew changes, or legitimate social & welfare visitors?
ACCESS TO PORT FACILITY
BIOMETRICS ID PASSES
A.16.3.15 The plan shall address procedures for facilitating shore leave for ship's crews or crew changes, or legitimate welfare and social ship visitors
ACCESS TO PORT FACILITY
BIOMETRICS ID PASSES
B.16.17.2 At security level 1, the plan should establish control points for the following: checking identity of all persons seeking entry to the port facility in connection with a ship including passengers, ship's personnel and visitors, and confirming their reasons for doing so by checking, for example, joining instructions, passenger tickets, boarding party, work orders etc.
ACCESS TO PORT FACILITY
BIOMETRICS ID PASSES
A.16.3.5 The plan shall address procedures for evacuation in case of security threat or breaches
ACCESS TO PORT FACILITY
COMMS ALARM SYSTEMS
B.16.20.5 At security level 3, the plan should detail the security measures which address the suspension of port operation within all or part of the port facility
ACCESS TO PORT FACILITY
COMMS AUTOMATIC ALERTS / ALARM SYSTEMS / GATES / PA / VHF UHF
B.16.20.7 At security level 3, the plan should detail the security measures which address evacuation of all or part of the port facility
ACCESS TO PORT FACILITY
COMMS AUTOMATIC ALERTS / ALARM SYSTEMS / PA / VHF UHF
B.16.20.3 At security level 3, the plan should detail the security measures which address the suspension of pedestrian or vehicular
ACCESS TO PORT FACILITY
COMMS / ACCESS CONTROL
AUTOMATIC ALERTS / ALARM SYSTEMS / GATES / PA / VHF UHF

157
movement within all or part of the facility;
B.16.17.4 At security level 1, the plan should identify control points for the verification of the identity of port facility personnel and those within the port facility and their vehicles
ACCESS TO PORT FACILITY
DATA RECORDING / BIOMETRICS
ID PASSES / VEHICLE PASSES
B.16.27.6 At security level 1, the plan should address: providing automatic intrusion detection devices, surveillance equipment, or systems designed to prevent unauthorised access into or movement within restricted areas
ACCESS TO PORT FACILITY
INTRUSION DETECTION DEVICE / CCTV / ACCESS CONTROL
B.16.50 When used, automatic intrusion-detection devices should activate an audible and/or visual alarm at a location that is continuously attended or monitored
ACCESS TO PORT FACILITY
INTRUSION DETECTION DEVICES / AUDIO & VISUAL ALARMS
INTRUSION DETECTION DEVICES / AUDIO & VISUAL ALARMS
B.16.28.8 At security level 2, the plan should address: enforcing restrictions on access by unauthorised craft to the waters adjacent to ships using the port facility
ACCESS TO PORT FACILITY
PATROL VESSELS PATROL VESSELS
B.16.17.3 At security level 1, the plan should identify control points for the following: checking vehicles used by those seeking entry to the port facility in connection with a ship
ACCESS TO PORT FACILITY
SCREENING EQUIPMENT
MOBILE SCANNING EQUIPMENT
B.16.17.6 At security level 1, the plan should identify control points for the undertaking of searches of persons, personal effects, verhicles & their contents
ACCESS TO PORT FACILITY
SCREENING EQUIPMENT
MOBILE SCANNING EQUIPMENT
B.16.19.4 At security level 2, the plan should establish the additional measures: increasing the frequency of searches of persons, personal effects, and vehicles;
ACCESS TO PORT FACILITY
SCREENING EQUIPMENT
MOBILE SCANNING EQUIPMENT
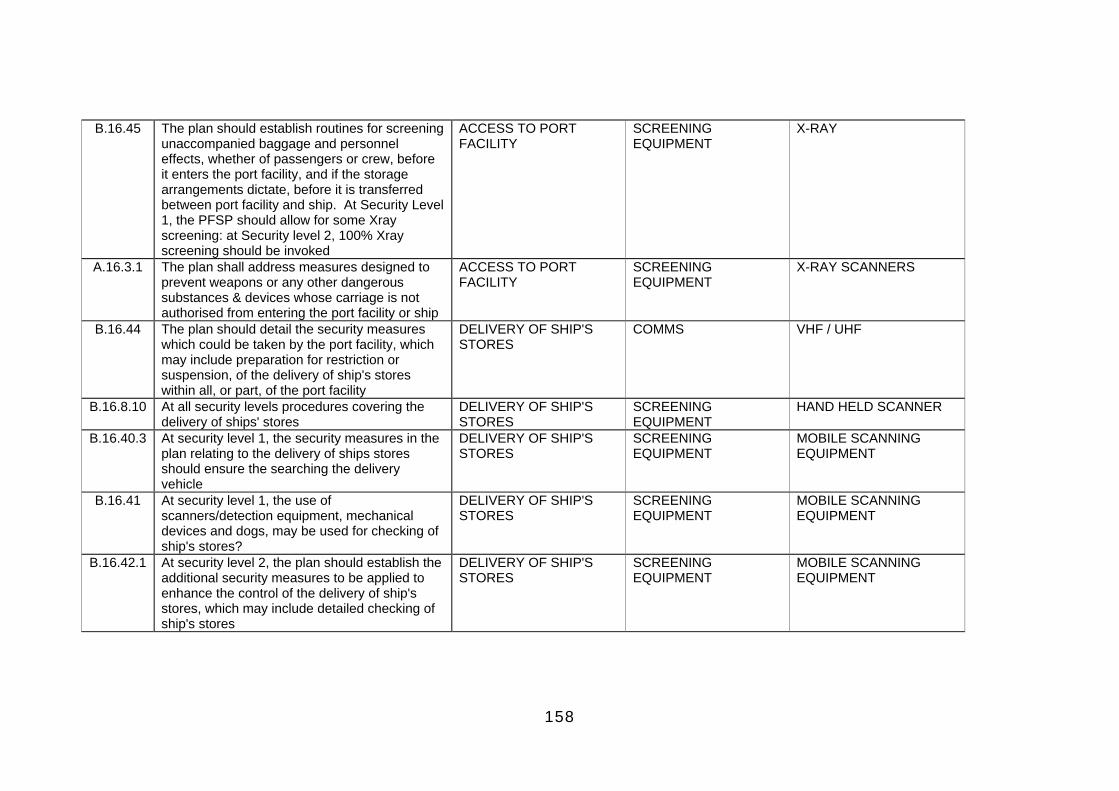
158
B.16.45 The plan should establish routines for screening unaccompanied baggage and personnel effects, whether of passengers or crew, before it enters the port facility, and if the storage arrangements dictate, before it is transferred between port facility and ship. At Security Level 1, the PFSP should allow for some Xray screening: at Security level 2, 100% Xray screening should be invoked
ACCESS TO PORT FACILITY
SCREENING EQUIPMENT
X-RAY
A.16.3.1 The plan shall address measures designed to prevent weapons or any other dangerous substances & devices whose carriage is not authorised from entering the port facility or ship
ACCESS TO PORT FACILITY
SCREENING EQUIPMENT
X-RAY SCANNERS
B.16.44 The plan should detail the security measures which could be taken by the port facility, which may include preparation for restriction or suspension, of the delivery of ship's stores within all, or part, of the port facility
DELIVERY OF SHIP'S STORES
COMMS VHF / UHF
B.16.8.10 At all security levels procedures covering the delivery of ships' stores
DELIVERY OF SHIP'S STORES
SCREENING EQUIPMENT
HAND HELD SCANNER
B.16.40.3 At security level 1, the security measures in the plan relating to the delivery of ships stores should ensure the searching the delivery vehicle
DELIVERY OF SHIP'S STORES
SCREENING EQUIPMENT
MOBILE SCANNING EQUIPMENT
B.16.41 At security level 1, the use of scanners/detection equipment, mechanical devices and dogs, may be used for checking of ship's stores?
DELIVERY OF SHIP'S STORES
SCREENING EQUIPMENT
MOBILE SCANNING EQUIPMENT
B.16.42.1 At security level 2, the plan should establish the additional security measures to be applied to enhance the control of the delivery of ship's stores, which may include detailed checking of ship's stores
DELIVERY OF SHIP'S STORES
SCREENING EQUIPMENT
MOBILE SCANNING EQUIPMENT

159
B.16.42.2 At security level 2, the plan should establish the additional security measures to be applied to enhance the control of the delivery of ship's stores, which may include detailed searches of the delivery vehicles
DELIVERY OF SHIP'S STORES
SCREENING EQUIPMENT
MOBILE SCANNING EQUIPMENT
B.16.37.1 At security level 3, the plan should detail the security measures which could be taken by the port facility in cooperation with those responding and the ships, which may include: restriction or suspension of cargo movements or operations within all or part of the facility or specific ships
HANDLING OF CARGO COMMS AUTOMATIC ALERTS / ALARMS / VHF UHF
B.16.35.4 At security level 2, the plan should establish the additional security measures to be applied during cargo handling to enhance control, which may include: increased frequency and detail in checking of seals and other methods used to prevent tampering
HANDLING OF CARGO E-SEAL INTEGRITY CHECKING EQUIPMENT
E-SEAL INTEGRITY CHECKING EQUIPMENT
B.16.32.4 At security level 1, the plan should address security measures to be applied during cargo handling which may include: checking of seals and other methods used to prevent tampering upon entering the port facility and upon storage within the port facility
HANDLING OF CARGO E-SEAL INTEGRITY CHECKING EQUIPMENT
B.16.32.3 At security level 1, the plan should address security measures to be applied during cargo handling which may include: searches of vehicles
HANDLING OF CARGO SCREENING EQUIPMENT
MOBILE SCANNING EQUIPMENT
B.16.35.3 At security level 2, the plan should establish the additional security measures to be applied during cargo handling to enhance control, which may include: intensified searches of vehicles
HANDLING OF CARGO SCREENING EQUIPMENT
MOBILE SCANNING EQUIPMENT

160
B.16.32.1 At security level 1, the plan should address security measures to be applied during cargo handling which may include: routine checking of cargo, cargo transporters and cargo storage areas within the port facility prior to and during cargo handling
HANDLING OF CARGO SCREENING EQUIPMENT
MOBILE SCANNING EQUIPMENT / X-RAY
B.16.35.1 At security level 2, the plan should establish additional security measures to be applied during cargo handling to enhance control, which may include: detailed checking of cargo, cargo transporters, and cargo storage areas within the port facility
HANDLING OF CARGO SCREENING EQUIPMENT
MOBILE SCANNING EQUIPMENT / X-RAY
B.16.48.1 The plan should stipulate that at Security Level 3, unaccompanied baggage should be subject to more extensive screening, for example x-raying it from at least two different angles
HANDLING OF UNACCOMPANIED BAGGAE
SCREENING EQUIPMENT
X-RAY
B.16.8.7 At all security levels, procedures to assess the continuing effectiveness of security measures, procedures & equipment, including identification of & response to equipment failure or malfunction;
MONITORING SECURITY OF PORT FACILITY
BACKUP SYSTEMS
B.16.51 The plan should establish procedures and equipment needed at each Security Level and the means of ensuring that monitoring equipment will be able to perform continually, including consideration of the possible effects of weather conditions or of power disruptions?
MONITORING SECURITY OF PORT FACILITY
BACKUP SYSTEMS
B.16.28.5 At security level 2, the plan should address: use of continuously monitored & recording surveillance equipment
MONITORING SECURITY OF PORT FACILITY
CCTV CCTV
B.16.54.2 For security level 3, the plan should detail the security measures which could be taken by the port facility which may include: switching on of all surveillance equipment capable of recording activities within, or adjacent to, the port facility
MONITORING SECURITY OF PORT FACILITY
CCTV CCTV

161
B.16.54.3 For security level 3, the plan should detail the security measures which could be taken by the port facility which may include: maximising the length of time such surveillance equipment can continue to record
MONITORING SECURITY OF PORT FACILITY
CCTV / DATA RECORDING
CCTV / DATA RECORDING
A.16.3.14 The plan shall address procedures for responding in case the ship security alert system of a ship at the port facility has been activated
MONITORING SECURITY OF PORT FACILITY
COMMS AUTOMATIC ALERTS / ALARM SYSTEMS / UHF VHF
A.16.3.3 The plan shall address procedures for responding to security threats or breaches of security, including provisions for maintaining critical operations of ship or ship/port interface
MONITORING SECURITY OF PORT FACILITY
COMMS AUTOMATIC ALERTS / ALARM SYSTEMS / VHF UHF
A.16.3.4 The plan shall address procedures for responding to any security instructions the contracting government may give at Security Level 3
MONITORING SECURITY OF PORT FACILITY
COMMS AUTOMATIC ALERTS / ALARM SYSTEMS / VHF UHF / PA
B.16.57 The plan should establish the procedures to be followed when, on the instructions of the Contracting Government, the PFSO requests a DoS or when a DoS is requested by a ship
MONITORING SECURITY OF PORT FACILITY
COMMS EMAIL ALERT
B.16.3.2 Links and communications arrangements with ships in port facility And other relevant authorities
MONITORING SECURITY OF PORT FACILITY
COMMS VHF / UHF
B.16.8.4 At all security levels a communications system which allows effective & continuous communication between port facility security personnel & ships & national or local security authorities
MONITORING SECURITY OF PORT FACILITY
COMMS VHF / UHF
A.16.3.7 The plan shall address procedures for interfacing with ship security activities
MONITORING SECURITY OF PORT FACILITY
COMMS VHF / UHF
B.16.20.6 At security level 3, the plan should detail the security measures which address the direction of vessel movements relating to all or part of the port facility
MONITORING SECURITY OF PORT FACILITY
COMMS VHF / UHF

162
B.16.27.7 At security level 1, the plan should address: control of the movement of vessels in the vicinity of ships using the port facility.
MONITORING SECURITY OF PORT FACILITY
COMMS VHF / UHF
B.16.56.1 The plan should establish procedures and security measures the port facility should apply when it is interfacing with a ship which has been at a port of a State which is not a Contracting Government
MONITORING SECURITY OF PORT FACILITY
COMMS VHF / UHF
B.16.56.2 The plan should establish procedures and security measures the port facility should apply when it is interfacing with a ship to which the Code does not apply
MONITORING SECURITY OF PORT FACILITY
COMMS VHF / UHF
B.16.56.3 The plan should establish procedures and security measures the port facility should apply when it is interfacing with fixed or floating platforms or mobile offshore drilling unit on location?
MONITORING SECURITY OF PORT FACILITY
COMMS VHF / UHF
B16.8.12 At all security levels, the means of alerting & obtaining waterside patrols & specialist search teams including bomb & underwater;
MONITORING SECURITY OF PORT FACILITY
COMMS / PATROL VESSELS / IED DETECTION EQUIPMENT
VHF UHF / PATROL VESSELS / IED DETECTION EQUIPMENT
A.16.7 If the plan is kept in an electronic format, it shall be protected by procedures aimed at preventing its unauthorised deletion, destruction, or amendment
MONITORING SECURITY OF PORT FACILITY
DATA RECORDING DATA PROTECTION SYSTEM
B.16.8.6 At all security levels protection of security information held in paper or electronic format
MONITORING SECURITY OF PORT FACILITY
DATA SECURITY FIRE PROOF CABINET / ENCRYPTED SOFTWARE
A.16.8 The plan shall be protected from unauthorized access or disclosure
MONITORING SECURITY OF PORT FACILITY
DATA SECURITY FIRE PROOF CABINET / ENCRYPTED SOFTWARE
A.16.3.11 The plan shall address measures to ensure the security of the information in the plan
MONITORING SECURITY OF PORT FACILITY
DATA SECURITY FIREPROOF SAFE / ENCRYPTION SOFTWARE
B.16.7 Guidance on the bearing and use of firearms (if appropriate)
MONITORING SECURITY OF PORT FACILITY
FIREARMS CABINETS FIREARMS CABINETS

163
B.16.49.3 The plan should include as means of monitoring the port facility day and night, and the ships and areas surrounding them, the following measures: automatic intrusion-detection devices and surveillance equipment
MONITORING SECURITY OF PORT FACILITY
INTRUSION DETECTION DEVICES / CCTV
INTRUSION DETECTION DEVICES / CCTV
B.16.49.1 The plan should include as means of monitoring the port facility day and night, and the ships and areas surrounding them, the following measures: lighting
MONITORING SECURITY OF PORT FACILITY
LIGHTING LIGHTING
B.16.54.1 For security level 3, the plan should detail the security measures which could be taken by the port facility which may include: switching on of all lighting within, or illuminating the vicinity of, the port facility
MONITORING SECURITY OF PORT FACILITY
LIGHTING LIGHTING
B.16.52.2 For Security Level 1, the plan should establish the security measures to be applied, which may be a combination of lighting, security guards or use of security and surveillance equipment to allow port facility security personnel to observe access points, barriers and restricted areas
MONITORING SECURITY OF PORT FACILITY
LIGHTING / CCTV LIGHTING / CCTV
B.16.53.1 For security level 2, the plan should establish the security levels to be applied for increasing the coverage and intensity of lighting and surveillance equipment, including the provision of additional lighting and surveillance coverage
MONITORING SECURITY OF PORT FACILITY
LIGHTING / CCTV LIGHTING / CCTV
B.16.52.1 For Security Level 1, the plan should establish the security measures to be applied, which may be a combination of lighting, security guards or use of security and surveillance equipment to allow port facility security personnel to observe the general port facility area, including shore and waterside accesses to it
MONITORING SECURITY OF PORT FACILITY
LIGHTING / CCTV / RADAR
LIGHTING / CCTV / RADAR
B.16.19.6 At security level 2, the plan should establish the additional measures: using patrol vessels to enhance water-side security
MONITORING SECURITY OF PORT FACILITY
PATROL VESSELS PATROL VESSELS
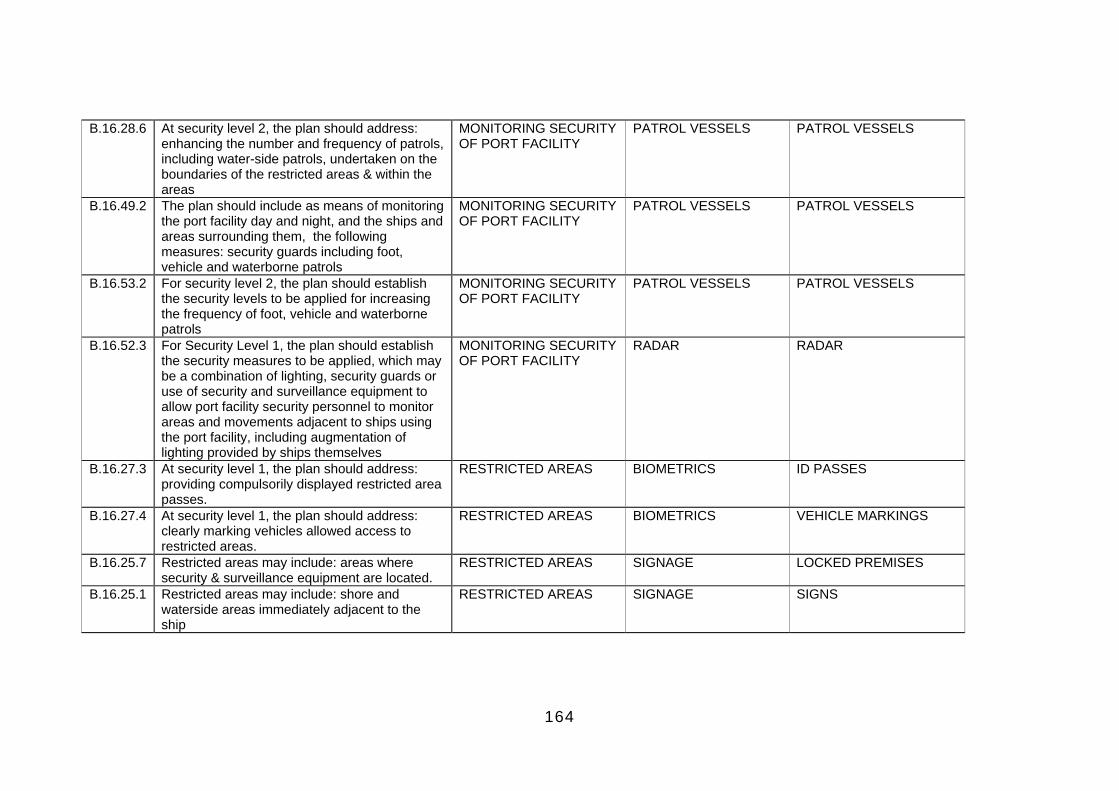
164
B.16.28.6 At security level 2, the plan should address: enhancing the number and frequency of patrols, including water-side patrols, undertaken on the boundaries of the restricted areas & within the areas
MONITORING SECURITY OF PORT FACILITY
PATROL VESSELS PATROL VESSELS
B.16.49.2 The plan should include as means of monitoring the port facility day and night, and the ships and areas surrounding them, the following measures: security guards including foot, vehicle and waterborne patrols
MONITORING SECURITY OF PORT FACILITY
PATROL VESSELS PATROL VESSELS
B.16.53.2 For security level 2, the plan should establish the security levels to be applied for increasing the frequency of foot, vehicle and waterborne patrols
MONITORING SECURITY OF PORT FACILITY
PATROL VESSELS PATROL VESSELS
B.16.52.3 For Security Level 1, the plan should establish the security measures to be applied, which may be a combination of lighting, security guards or use of security and surveillance equipment to allow port facility security personnel to monitor areas and movements adjacent to ships using the port facility, including augmentation of lighting provided by ships themselves
MONITORING SECURITY OF PORT FACILITY
RADAR RADAR
B.16.27.3 At security level 1, the plan should address: providing compulsorily displayed restricted area passes.
RESTRICTED AREAS BIOMETRICS ID PASSES
B.16.27.4 At security level 1, the plan should address: clearly marking vehicles allowed access to restricted areas.
RESTRICTED AREAS BIOMETRICS VEHICLE MARKINGS
B.16.25.7 Restricted areas may include: areas where security & surveillance equipment are located.
RESTRICTED AREAS SIGNAGE LOCKED PREMISES
B.16.25.1 Restricted areas may include: shore and waterside areas immediately adjacent to the ship
RESTRICTED AREAS SIGNAGE SIGNS

165
B.16.25.2 Restricted areas may include: embarkation and disembarkation areas, passenger and ship's personnel holding & processing areas, including search points.
RESTRICTED AREAS SIGNAGE SIGNS
B.16.25.3 Restricted areas may include: areas where loading, unloading or storage of cargo and stores is undertaken.
RESTRICTED AREAS SIGNAGE SIGNS
B.16.25.5 Restricted areas may include: areas where dangerous goods and hazardous substances are held.
RESTRICTED AREAS SIGNAGE SIGNS
B.16.25.8 Restricted areas may include: essential electrical, radio & terlecommunication, water & other utility installations.
RESTRICTED AREAS SIGNAGE SIGNS
B.16.25.9 Restricted areas may include: other locations in the port facility where access by vessels, vehicles and individuals shbould be restricted.
RESTRICTED AREAS SIGNAGE SIGNS
B16.25.6 Restricted areas may include: VTM system control rooms, aids to navigation & port facility Control buildings, including security & surveillance control rooms.
RESTRICTED AREAS SIGNAGE / SECURITY CONTROL ROOM
CONTROL SYSTEMS

166
Appendix B - Copy of Confidential Questionnaire on Port Security

167
Confidential Questionnaire on Port Security 1) Please enter the name of your Port ____________________________________________________________ 2) Please enter the name of the Port Facility ____________________________________________________________ 3) Please select your job position from the list below Port Security Officer Port Facility Security Officer Other (please specify) If you selected other please specify: ______________________________________________________________________ 4) Please select the principal activity of the port facility Container Terminal Passenger Terminal Oil / Oil Products Terminal Ro-Ro Terminal LNG / LPG Terminal Bulk Terminal General Cargo Terminal Car Terminal Other (please specify) If you selected other please specify: ______________________________________________________________________ 5) Please select the type of perimeter fencing in the port facility Chain link Expanded metal Steel pallisades Weldmesh Opaque Other (please specify) If you selected other please specify: ______________________________________________________________________ 6) Please indicate the costs of the perimeter fencing in question 5 Cost of installation ___________________________________ Annual cost of maintenance ___________________________________

168
7) What is the height of the perimeter fence at its lowest point in metres? ____________________________________________________________ 8) What is the approximate overall length of the perimeter fence? ____________________________________________________________ 9) Please select from the list the access control measures in the port facility Main security gate Main security gate guardhouse Second security gate Second security gate guardhouse Additional security gates / guardhouses Mobile security gates Mobile security barriers Other (please specify) If you selected other please specify: ______________________________________________________________________ 10) Please indicate the costs of the access control measures in question 9 Installation cost ___________________________________ Annual cost of maintenance ___________________________________ 11) Please select the types of security detection systems which are present in the port facility Perimeter intruder detection system Perimeter lighting Lighting of restricted areas Cargo handling lighting Passenger handling lighting Access routes lighting CCTV - main gate CCTV - other gates CCTV - restricted areas CCTV - perimeter CCTV - cargo handling areas CCTV - passenger handling areas CCTV - office buildings Surface radar Underwater sonar Other (please specify) If you selected other please specify: ______________________________________________________________________ 12) Please indicate the installation costs of the types of security detection systems in question 11
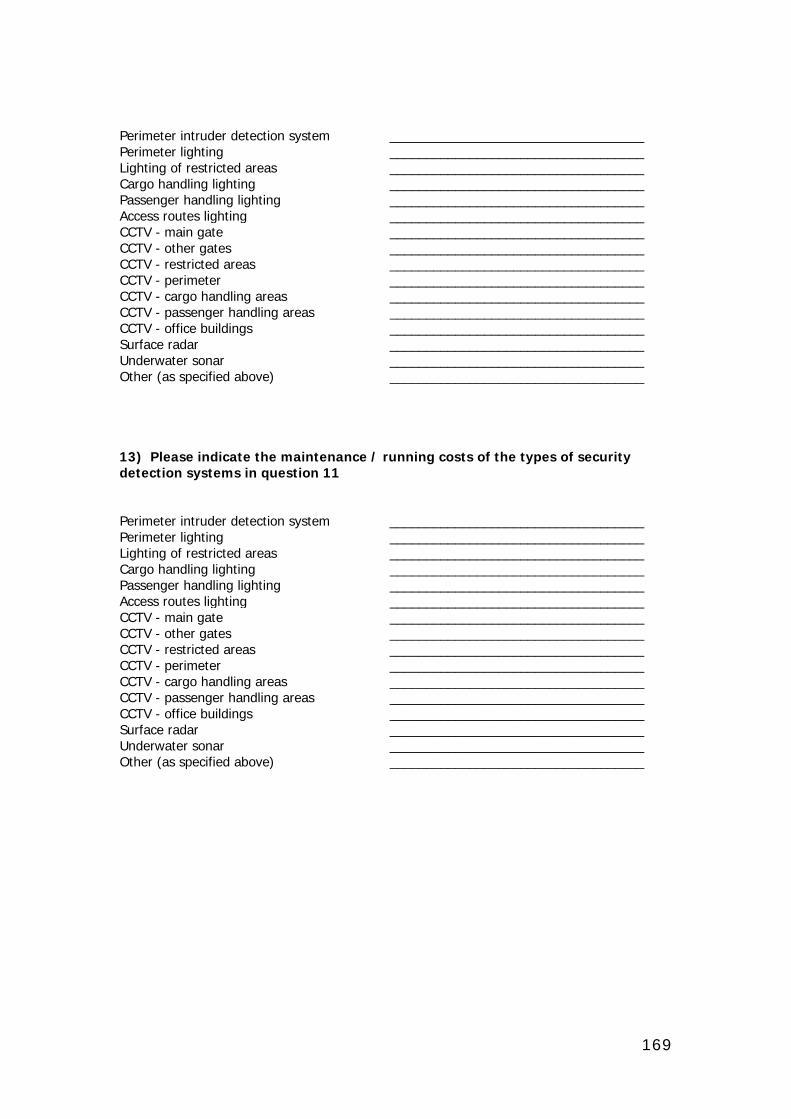
169
Perimeter intruder detection system ___________________________________ Perimeter lighting ___________________________________ Lighting of restricted areas ___________________________________ Cargo handling lighting ___________________________________ Passenger handling lighting ___________________________________ Access routes lighting ___________________________________ CCTV - main gate ___________________________________ CCTV - other gates ___________________________________ CCTV - restricted areas ___________________________________ CCTV - perimeter ___________________________________ CCTV - cargo handling areas ___________________________________ CCTV - passenger handling areas ___________________________________ CCTV - office buildings ___________________________________ Surface radar ___________________________________ Underwater sonar ___________________________________ Other (as specified above) ___________________________________ 13) Please indicate the maintenance / running costs of the types of security detection systems in question 11 Perimeter intruder detection system ___________________________________ Perimeter lighting ___________________________________ Lighting of restricted areas ___________________________________ Cargo handling lighting ___________________________________ Passenger handling lighting ___________________________________ Access routes lighting ___________________________________ CCTV - main gate ___________________________________ CCTV - other gates ___________________________________ CCTV - restricted areas ___________________________________ CCTV - perimeter ___________________________________ CCTV - cargo handling areas ___________________________________ CCTV - passenger handling areas ___________________________________ CCTV - office buildings ___________________________________ Surface radar ___________________________________ Underwater sonar ___________________________________ Other (as specified above) ___________________________________
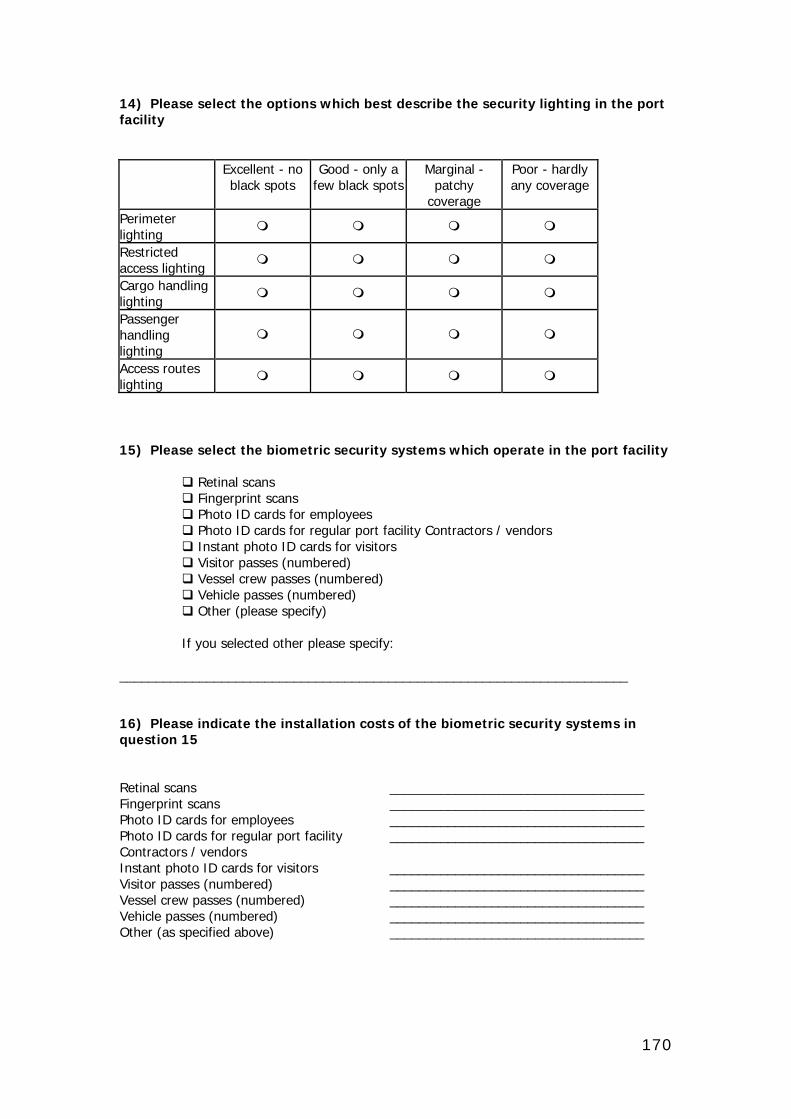
170
14) Please select the options which best describe the security lighting in the port facility Excellent - no
black spots Good - only a
few black spotsMarginal -
patchy coverage
Poor - hardly any coverage
Perimeter lighting
Restricted access lighting
Cargo handling lighting
Passenger handling lighting
Access routes lighting
15) Please select the biometric security systems which operate in the port facility Retinal scans Fingerprint scans Photo ID cards for employees Photo ID cards for regular port facility Contractors / vendors Instant photo ID cards for visitors Visitor passes (numbered) Vessel crew passes (numbered) Vehicle passes (numbered) Other (please specify) If you selected other please specify: ______________________________________________________________________ 16) Please indicate the installation costs of the biometric security systems in question 15 Retinal scans ___________________________________ Fingerprint scans ___________________________________ Photo ID cards for employees ___________________________________ Photo ID cards for regular port facility Contractors / vendors
___________________________________
Instant photo ID cards for visitors ___________________________________ Visitor passes (numbered) ___________________________________ Vessel crew passes (numbered) ___________________________________ Vehicle passes (numbered) ___________________________________ Other (as specified above) ___________________________________
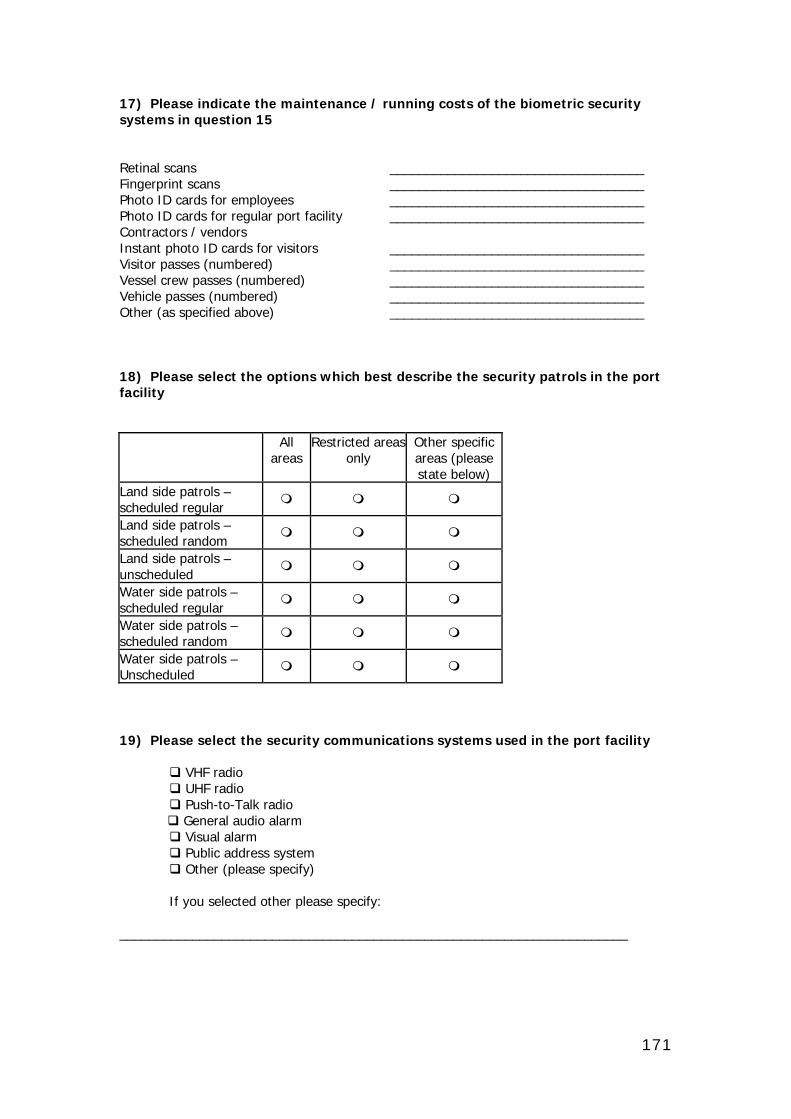
171
17) Please indicate the maintenance / running costs of the biometric security systems in question 15 Retinal scans ___________________________________ Fingerprint scans ___________________________________ Photo ID cards for employees ___________________________________ Photo ID cards for regular port facility Contractors / vendors
___________________________________
Instant photo ID cards for visitors ___________________________________ Visitor passes (numbered) ___________________________________ Vessel crew passes (numbered) ___________________________________ Vehicle passes (numbered) ___________________________________ Other (as specified above) ___________________________________ 18) Please select the options which best describe the security patrols in the port facility All
areas Restricted areas
only Other specific areas (please state below)
Land side patrols – scheduled regular
Land side patrols – scheduled random
Land side patrols – unscheduled
Water side patrols – scheduled regular
Water side patrols – scheduled random
Water side patrols – Unscheduled
19) Please select the security communications systems used in the port facility VHF radio UHF radio Push-to-Talk radio General audio alarm Visual alarm Public address system Other (please specify) If you selected other please specify: ______________________________________________________________________

172
20) Please indicate the costs of the security communications systems used in the port facility Installation cost ___________________________________ Annual cost of maintenance / running costs ___________________________________ 21) Please select the forms of security data communication in the port facility Trunk cabling (copper wire) Microwave Fibre optics Other (please specify) If you selected other please specify: ______________________________________________________________________ 22) Please list the number of security personnel employed in the port facility Number of security guards on the access gates / gatehouses
___________________________________
Number of security guards on patrols ___________________________________ Number of security personnel in the control room
___________________________________
Number of security personnel that can respond quickly to an incident
___________________________________
Other specialised security personnel ___________________________________ 23) Please indicate the average annual cost of security guards / personnel On the access gates / guardhouses ___________________________________ Patrolling ___________________________________ In the control room ___________________________________ Other specialised security personnel as specified above
___________________________________
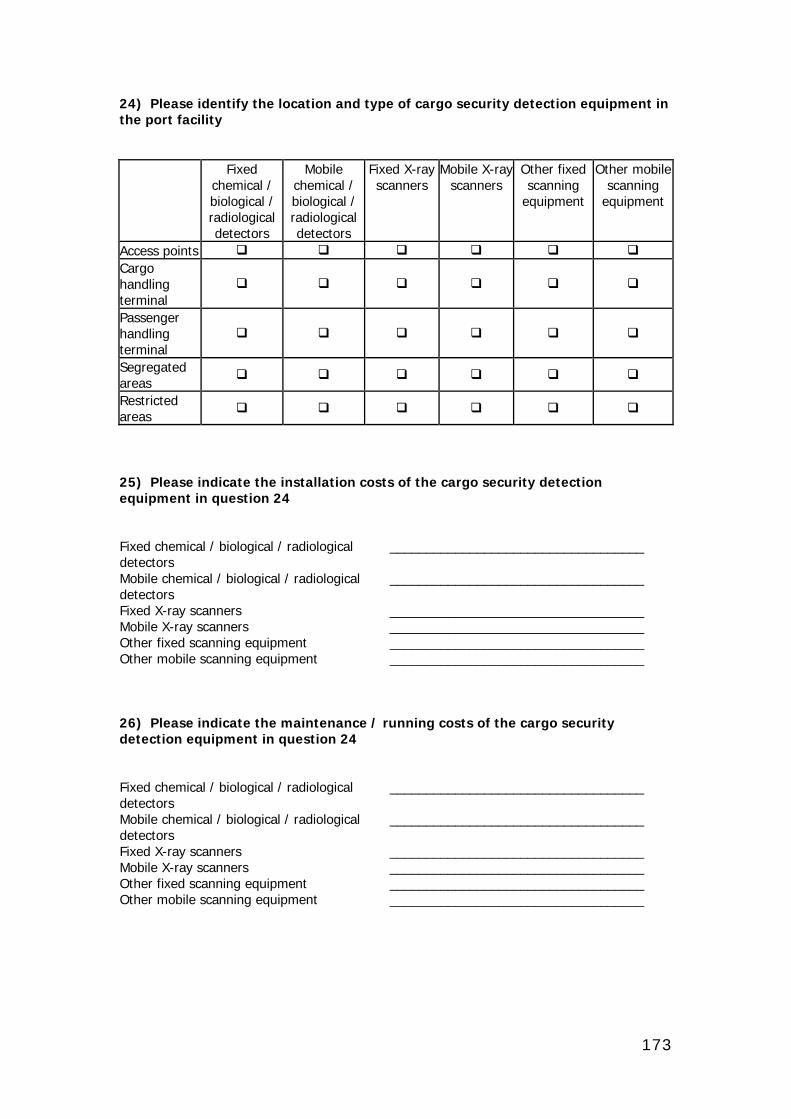
173
24) Please identify the location and type of cargo security detection equipment in the port facility Fixed
chemical / biological / radiological detectors
Mobile chemical / biological / radiological detectors
Fixed X-ray scanners
Mobile X-ray scanners
Other fixed scanning
equipment
Other mobile scanning
equipment
Access points Cargo handling terminal
Passenger handling terminal
Segregated areas
Restricted areas
25) Please indicate the installation costs of the cargo security detection equipment in question 24 Fixed chemical / biological / radiological detectors
___________________________________
Mobile chemical / biological / radiological detectors
___________________________________
Fixed X-ray scanners ___________________________________ Mobile X-ray scanners ___________________________________ Other fixed scanning equipment ___________________________________ Other mobile scanning equipment ___________________________________ 26) Please indicate the maintenance / running costs of the cargo security detection equipment in question 24 Fixed chemical / biological / radiological detectors
___________________________________
Mobile chemical / biological / radiological detectors
___________________________________
Fixed X-ray scanners ___________________________________ Mobile X-ray scanners ___________________________________ Other fixed scanning equipment ___________________________________ Other mobile scanning equipment ___________________________________

174
27) Please indicate how the individual security systems are integrated and monitored from the central control room Are the systems integrated? Are they monitored from the
security control room? Yes No Yes No
Gatehouse alarms
AIDD alarms
CCTV motion detector alarms
Restricted area alarms
Cargo handling area alarms
Passenger handling area alarms
General alarms
CBR detector alarms
Container scanner alarms
Communication systems
Security patrols
28) Please indicate an estimate for the overall cost of security systems integration ____________________________________________________________ 29) Please list the crisis management systems which exist in the port facility Specialist crisis management software Duplicate (remote) IT system Emergency power supply Other (please specify) If you selected other please specify: ______________________________________________________________________ 30) Please indicate the costs of the crisis management systems in question 29 Installation cost ___________________________________ Annual cost of maintenance / running costs ___________________________________

175
Appendix C – Port Facilities’ Security Costs Terminals’ Security System Costs – Port facility A Region Business Unit/Site Port facility A
Perimeter Fencing
Installation cost in US$
(2004 - present)
2007 Annual maintenance cost in
US$ Chain link $73,170 $1,000
Expanded metal Steel pallisades
Weldmesh Masonry/brick $34,156 $5,000
Opaque Other (Please specify)
Total $107,326 $6,000
Height of fence at lowest point (meters)
Length of fence (meters)
Comments on perimeter fencing
Perimeter on PQA channel water side is fenced (510 m) and landside is masonary
(600 + 457 = 1057 m).
Access Control
Installation cost in US$
(2004 - present)
2007 Annual maintenance cost in
US$ Main security gate $7,361 $200
Main security gate guardhouse $7,361 $200
Second security gate $7,361 $200
Second security gate guardhouse $15,950 $1,329
Additional security gates/guardhouses $4,878 $300
Mobile security gates Mobile security barriers $3,453
Other (please specify) $19,000 $4,000
Comments on access control
Total $65,364 $6,229
Identity Control
Installation cost in US$
(2004 - present)
2007 Annual maintenance costs in
US$ Retinal scans
Fingerprint scans $20,320

176
Photo ID cards for employees $3,867
Photo ID cards for regular Business Unit contractors
/ vendors $3,867
Instant photo ID cards for visitors $1,933
Visitor passes (numbered) $100 $50
Vessel crew passes (numbered)
Vehicle passes (numbered) $3,500
Other (please specify)
Comments on identity control
Total $30,087 $3,550
Security Detection
Installation cost in US$
(2004 - present)
2007 Annual maintenance costs in
US$
Perimeter intruder detection system $5,000 $1 Perimeter lighting $16,250 $4,000
Lighting of restricted areas $2,500
Cargo handling lighting $106,250 $12,500 Passenger handling
lighting Access routes lighting $3,500
CCTV - main gate $18,650 $2,700 CCTV - other gates $18,552 $2,700
CCTV - restricted areas $37,300 $4,050 CCTV - perimeter $9,325 $1,350
CCTV - cargo handling areas $9,325 $1,350
CCTV - passenger handling areas
CCTV - office buildings $3,370 Surface radar
Underwater sonar Other (please specify)
Comments on security detection
Total $224,022 $34,651
Security Communications
Installation cost in US$
(2004 - present)
2007 Annual maintenance costs in
US$ VHF radio $160 $1 UHF radio
Push-to-Talk radio

177
General audio alarm Visual alarm
Public address system $9,500 Other (please specify) $400 $100
Comments on security communications Total $10,060 $101
Please describe the shift pattern at your site
2007 Annual cost in US$
Number of security guards on the access
gates / gatehouses (included in figure for
access control) $2,907 Number of security
guards on patrols (included in figure for
detection) $1,663
Number of security personnel in the control room (included in figure
for detection) $1,663
Other specialised security personnel $2,078
Number of security personnel that can
respond quickly to an incident $6,858
Are your security personnel licenced? $100
Type of license
Does your site hold their training records? $150
Crisis Management
Installation cost in US$
(2004 - present)
2007 Annual maintenance costs in
US$
Specialist crisis management software
Duplicate (remote) IT system $90,000 $6,000
Emergency power supply $46,700 $5,000
Crisis management - Service Providers
Other (please specify)
Fixed Variable Access Control $172,690 $15,136
Biometrics $30,087 $3,550

178
Detection $224,022 $37,977

179
Terminals’ Security System Costs – Port facility B
Region Business Unit/Site Port facility B
Perimeter Fencing Installation cost in US$
(2004 - present)
2007 Annual maintenance cost in
US$ Chain link $270,000 $5,000
Expanded metal Steel pallisades
Weldmesh Masonry/brick
Opaque Other (Please specify)
Total $270,000 $5,000 Height of fence at lowest
point (meters) 3m Length of fence (meters) 1300m
Comments on perimeter fencing
Access Control Installation cost in US$
(2004 - present)
2007 Annual maintenance cost in
US$ Main security gate
$125,000 $5,000
Main security gate guardhouse
Second security gate
Second security gate guardhouse
Additional security gates/guardhouses
Mobile security gates Mobile security barriers
Other (please specify)
Comments on access control
Total $125,000 $5,000
Identity Control Installation cost in US$
(2004 - present)
2007 Annual maintenance costs in
US$ Retinal scans
Fingerprint scans
Photo ID cards for employees $7,000 $1,000
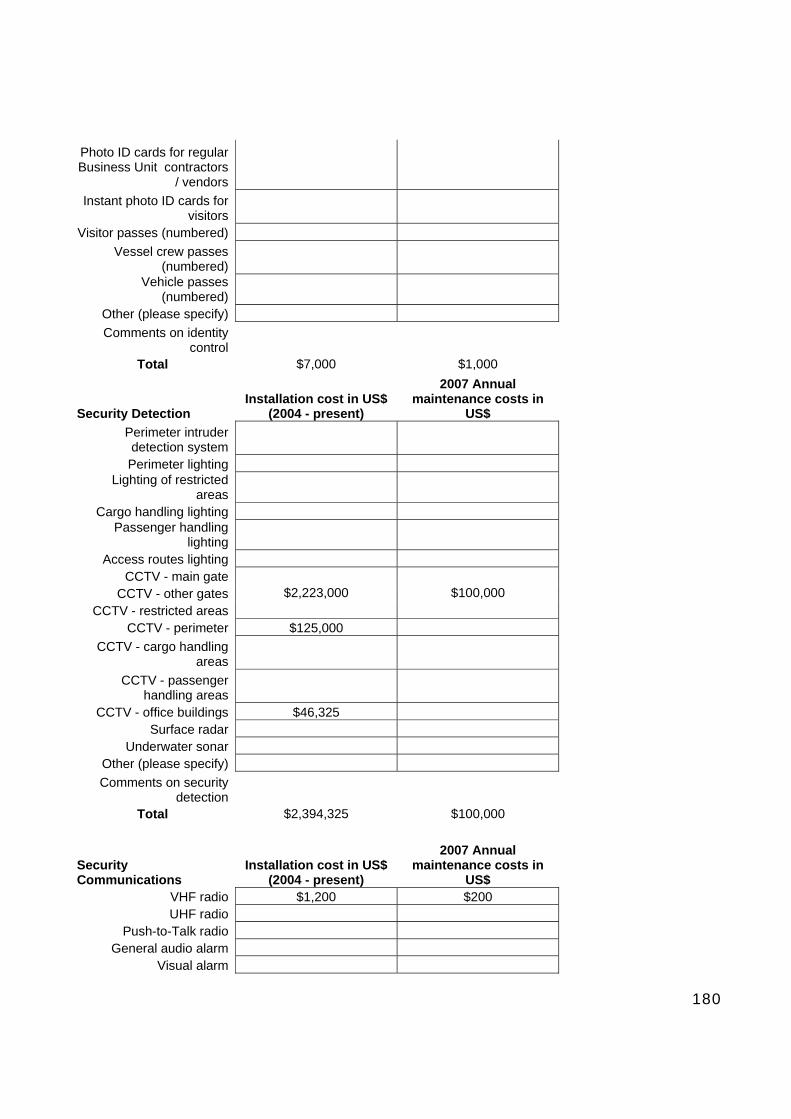
180
Photo ID cards for regular Business Unit contractors
/ vendors
Instant photo ID cards for visitors
Visitor passes (numbered)
Vessel crew passes (numbered)
Vehicle passes (numbered)
Other (please specify)
Comments on identity control
Total $7,000 $1,000
Security Detection Installation cost in US$
(2004 - present)
2007 Annual maintenance costs in
US$
Perimeter intruder detection system Perimeter lighting
Lighting of restricted areas
Cargo handling lighting Passenger handling
lighting Access routes lighting
CCTV - main gate $2,223,000 $100,000 CCTV - other gates
CCTV - restricted areas CCTV - perimeter $125,000
CCTV - cargo handling areas
CCTV - passenger handling areas
CCTV - office buildings $46,325 Surface radar
Underwater sonar Other (please specify)
Comments on security detection
Total $2,394,325 $100,000
Security Communications
Installation cost in US$ (2004 - present)
2007 Annual maintenance costs in
US$ VHF radio $1,200 $200 UHF radio
Push-to-Talk radio General audio alarm
Visual alarm
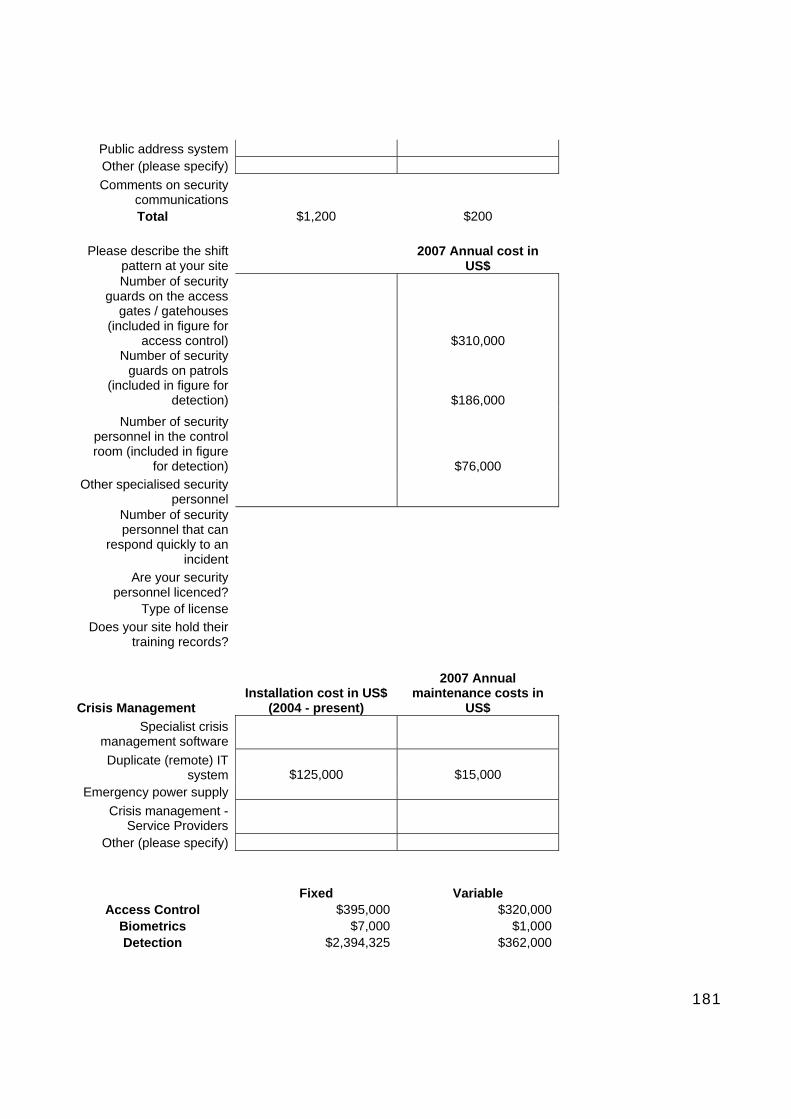
181
Public address system Other (please specify)
Comments on security communications Total $1,200 $200
Please describe the shift pattern at your site
2007 Annual cost in US$
Number of security guards on the access
gates / gatehouses (included in figure for
access control) $310,000 Number of security
guards on patrols (included in figure for
detection) $186,000
Number of security personnel in the control room (included in figure
for detection) $76,000
Other specialised security personnel
Number of security personnel that can
respond quickly to an incident
Are your security personnel licenced?
Type of license
Does your site hold their training records?
Crisis Management Installation cost in US$
(2004 - present)
2007 Annual maintenance costs in
US$
Specialist crisis management software
Duplicate (remote) IT system $125,000 $15,000
Emergency power supply
Crisis management - Service Providers
Other (please specify)
Fixed Variable Access Control $395,000 $320,000
Biometrics $7,000 $1,000Detection $2,394,325 $362,000

182
Terminals’ Security System Costs – Port facility C
Region Business Unit/Site Port facility C
Perimeter Fencing Installation cost in US$
(2004 - present)
2007 Annual maintenance cost in
US$ Chain link
Expanded metal Steel pallisades
Weldmesh $223,222 Masonry/brick
Opaque Other (Please specify)
Total $223,222 $0 Height of fence at lowest
point (meters) 2.30m Length of fence (meters) 250 metres
Comments on perimeter fencing
Access Control Installation cost in US$
(2004 - present)
2007 Annual maintenance cost in
US$ Main security gate
Main security gate guardhouse
Second security gate
Second security gate guardhouse
Additional security gates/guardhouses
Mobile security gates Mobile security barriers
Other (please specify) $12,000 $2,750
Comments on access control security car security car
Total $12,000 $2,750
Identity Control Installation cost in US$
(2004 - present)
2007 Annual maintenance costs in
US$ Retinal scans
Fingerprint scans
Photo ID cards for employees $2,480

183
Photo ID cards for regular Business Unit contractors
/ vendors
Instant photo ID cards for visitors
Visitor passes (numbered) $100
Vessel crew passes (numbered)
Vehicle passes (numbered) $100
Other (please specify)
Comments on identity control
Total $2,680 $0
Security Detection Installation cost in US$
(2004 - present)
2007 Annual maintenance costs in
US$
Perimeter intruder detection system Perimeter lighting
Lighting of restricted areas
Cargo handling lighting Passenger handling
lighting Access routes lighting
CCTV - main gate $13,000
CCTV - other gates
CCTV - restricted areas CCTV - perimeter
CCTV - cargo handling areas
CCTV - passenger handling areas
CCTV - office buildings $5,250 Surface radar
Underwater sonar Other (please specify)
Comments on security detection
Total $18,250 $0
Security Communications
Installation cost in US$ (2004 - present)
2007 Annual maintenance costs in
US$ VHF radio $150 $60 UHF radio
Push-to-Talk radio General audio alarm
Visual alarm

184
Public address system Other (please specify)
Comments on security communications Total $150 $60
Please describe the shift pattern at your site
2007 Annual cost in US$
Number of security guards on the access
gates / gatehouses (included in figure for
access control) $174,762 Number of security
guards on patrols (included in figure for
detection) $16,644
Number of security personnel in the control room (included in figure
for detection) $16,644
Other specialised security personnel $17,116
Number of security personnel that can
respond quickly to an incident
Are your security personnel licenced?
Type of license
Does your site hold their training records?
Crisis Management Installation cost in US$
(2004 - present)
2007 Annual maintenance costs in
US$
Specialist crisis management software
Duplicate (remote) IT system $115,000 $14,000
Emergency power supply $20,710
Crisis management - Service Providers
Other (please specify)
Fixed Variable Access Control $235,222 $177,512
Biometrics $2,680 $0Detection $18,250 $33,288

185
Terminals’ Security System Costs – Port facility D Region Business Unit/Site Port facility D
Perimeter Fencing
Installation cost in US$ (2004 -
present)
2007 Annual maintenance cost
in US$ Chain link $209,840
Expanded metal Steel pallisades
Weldmesh Masonry/brick
Opaque Other (Please specify)
Total $209,840 $0 Height of fence at lowest
point (meters) Length of fence (meters)
Comments on perimeter fencing
Access Control
Installation cost in US$ (2004 -
present)
2007 Annual maintenance cost
in US$ Main security gate
$369,890 $10,000 Main security gate guardhouse
Second security gate
Second security gate guardhouse
Additional security gates/guardhouses
Mobile security gates Mobile security barriers
Other (please specify)
Comments on access control
Total $369,890 $10,000
Identity Control
Installation cost in US$ (2004 -
present)
2007 Annual maintenance costs in US$
Retinal scans Fingerprint scans $10,000 $1,000
Photo ID cards for employees $1,200
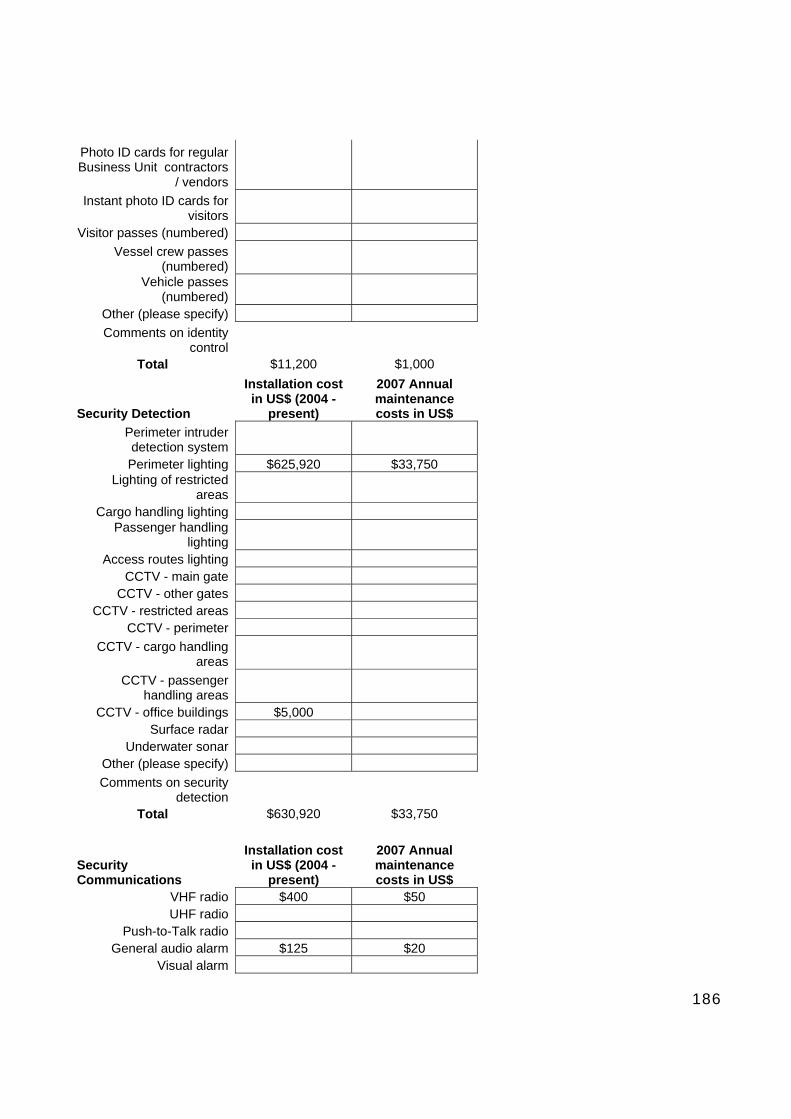
186
Photo ID cards for regular Business Unit contractors
/ vendors
Instant photo ID cards for visitors
Visitor passes (numbered)
Vessel crew passes (numbered)
Vehicle passes (numbered)
Other (please specify)
Comments on identity control
Total $11,200 $1,000
Security Detection
Installation cost in US$ (2004 -
present)
2007 Annual maintenance costs in US$
Perimeter intruder detection system Perimeter lighting $625,920 $33,750
Lighting of restricted areas
Cargo handling lighting Passenger handling
lighting Access routes lighting
CCTV - main gate CCTV - other gates
CCTV - restricted areas CCTV - perimeter
CCTV - cargo handling areas
CCTV - passenger handling areas
CCTV - office buildings $5,000 Surface radar
Underwater sonar Other (please specify)
Comments on security detection
Total $630,920 $33,750
Security Communications
Installation cost in US$ (2004 -
present)
2007 Annual maintenance costs in US$
VHF radio $400 $50 UHF radio
Push-to-Talk radio General audio alarm $125 $20
Visual alarm

187
Public address system $2,200 $100 Other (please specify)
Comments on security communications Total $2,725 $170
Please describe the shift
pattern at your site 2007 Annual cost
in US$ Number of security
guards on the access gates / gatehouses
(included in figure for access control) $240,000
Number of security guards on patrols
(included in figure for detection)
$123,000 Number of security
personnel in the control room (included in figure
for detection)
Other specialised security personnel
Number of security personnel that can
respond quickly to an incident
Are your security personnel licenced?
Type of license Does your site hold their
training records?
Crisis Management
Installation cost in US$ (2004 -
present)
2007 Annual maintenance costs in US$
Specialist crisis management software
Duplicate (remote) IT system $97,715
Emergency power supply $670,000 $36,000
Crisis management - Service Providers
Other (please specify)
Fixed Variable Access Control $579,730 $250,000
Biometrics $11,200 $1,000Detection $630,920 $156,750
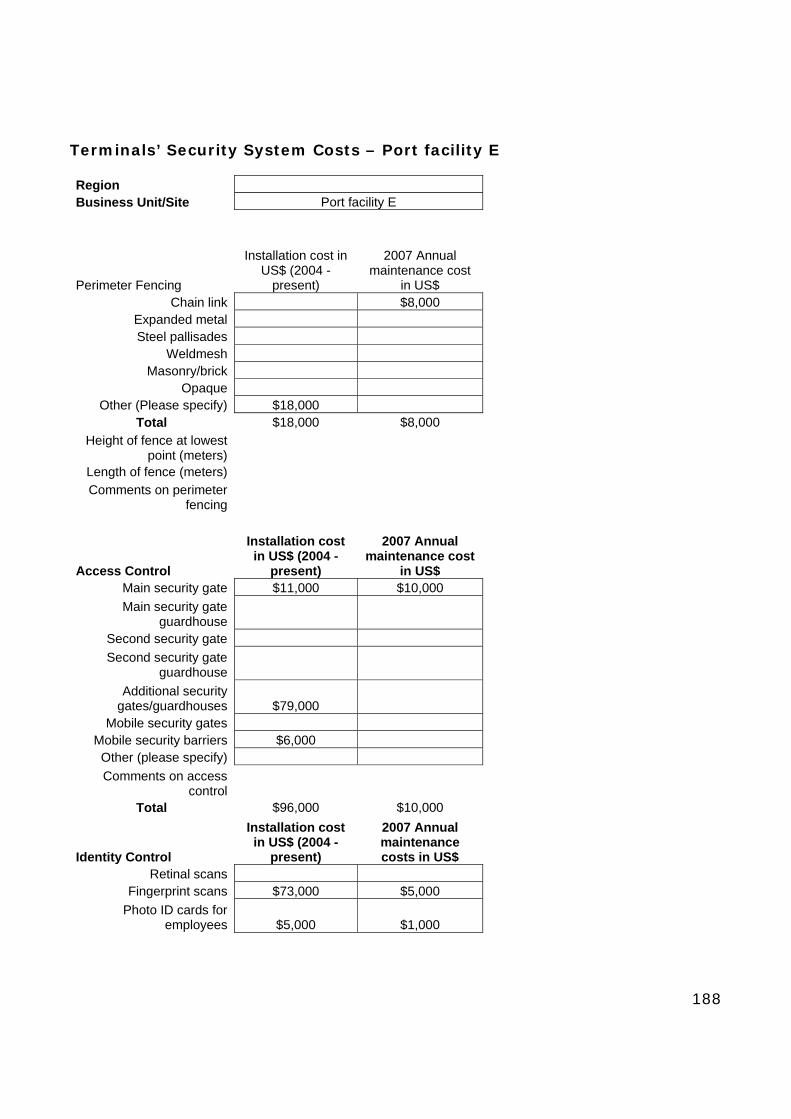
188
Terminals’ Security System Costs – Port facility E Region Business Unit/Site Port facility E
Perimeter Fencing
Installation cost in US$ (2004 -
present)
2007 Annual maintenance cost
in US$ Chain link $8,000
Expanded metal Steel pallisades
Weldmesh Masonry/brick
Opaque Other (Please specify) $18,000
Total $18,000 $8,000
Height of fence at lowest point (meters)
Length of fence (meters) Comments on perimeter
fencing
Access Control
Installation cost in US$ (2004 -
present)
2007 Annual maintenance cost
in US$ Main security gate $11,000 $10,000
Main security gate guardhouse
Second security gate
Second security gate guardhouse
Additional security gates/guardhouses $79,000
Mobile security gates Mobile security barriers $6,000 Other (please specify)
Comments on access control
Total $96,000 $10,000
Identity Control
Installation cost in US$ (2004 -
present)
2007 Annual maintenance costs in US$
Retinal scans Fingerprint scans $73,000 $5,000
Photo ID cards for employees $5,000 $1,000

189
Photo ID cards for regular Business Unit contractors
/ vendors
Instant photo ID cards for visitors
Visitor passes (numbered)
Vessel crew passes (numbered)
Vehicle passes (numbered)
Other (please specify)
Comments on identity control
Total $78,000 $6,000
Security Detection
Installation cost in US$ (2004 -
present)
2007 Annual maintenance costs in US$
Perimeter intruder detection system Perimeter lighting $10,000
Lighting of restricted areas $5,000
Cargo handling lighting $160,000 $20,000 Passenger handling
lighting Access routes lighting
CCTV - main gate $28,000 $9,000 CCTV - other gates $14,000 $5,000
CCTV - restricted areas $77,000 $15,000 CCTV - perimeter $14,000 $5,000
CCTV - cargo handling areas $21,000 $8,000
CCTV - passenger handling areas $28,000 $9,000
CCTV - office buildings Surface radar
Underwater sonar Other (please specify)
Comments on security detection
Total $342,000 $86,000
Security Communications
Installation cost in US$ (2004 -
present)
2007 Annual maintenance costs in US$
VHF radio UHF radio $141,000 $10,000
Push-to-Talk radio $11,000 $1,000 General audio alarm
Visual alarm

190
Public address system Other (please specify)
Comments on security communications Total $152,000 $11,000
Please describe the shift
pattern at your site 2007 Annual cost
in US$ Number of security
guards on the access gates / gatehouses
(included in figure for access control) $75,000
Number of security guards on patrols
(included in figure for detection) $15,000
Number of security personnel in the control room (included in figure
for detection) $10,000
Other specialised security personnel
Number of security personnel that can
respond quickly to an incident
Are your security personnel licenced?
Type of license Does your site hold their
training records?
Crisis Management
Installation cost in US$ (2004 -
present)
2007 Annual maintenance costs in US$
Specialist crisis management software
Duplicate (remote) IT system
Emergency power supply $73,000 $5,000
Crisis management - Service Providers
Other (please specify)
Fixed Variable Access Control $114,000 $93,000
Biometrics $78,000 $6,000Detection $342,000 $111,000
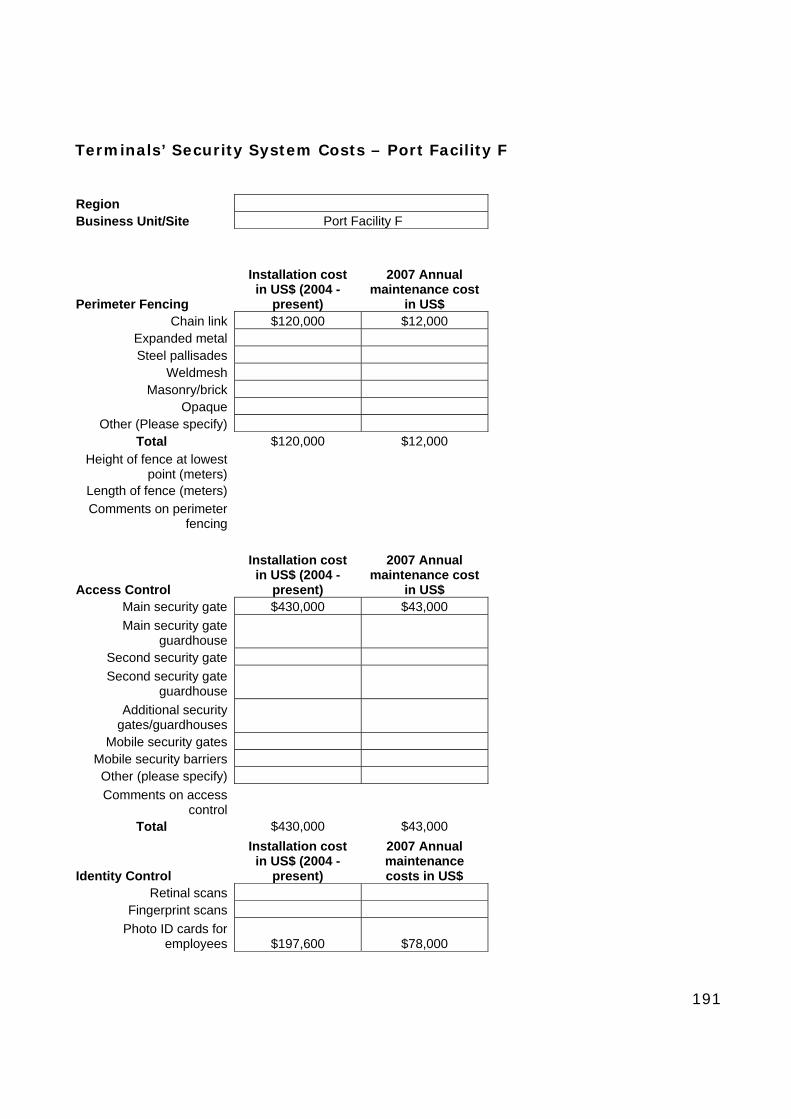
191
Terminals’ Security System Costs – Port Facility F Region Business Unit/Site Port Facility F
Perimeter Fencing
Installation cost in US$ (2004 -
present)
2007 Annual maintenance cost
in US$ Chain link $120,000 $12,000
Expanded metal Steel pallisades
Weldmesh Masonry/brick
Opaque Other (Please specify)
Total $120,000 $12,000 Height of fence at lowest
point (meters) Length of fence (meters)
Comments on perimeter fencing
Access Control
Installation cost in US$ (2004 -
present)
2007 Annual maintenance cost
in US$ Main security gate $430,000 $43,000
Main security gate guardhouse
Second security gate
Second security gate guardhouse
Additional security gates/guardhouses
Mobile security gates Mobile security barriers Other (please specify)
Comments on access control
Total $430,000 $43,000
Identity Control
Installation cost in US$ (2004 -
present)
2007 Annual maintenance costs in US$
Retinal scans Fingerprint scans
Photo ID cards for employees $197,600 $78,000

192
Photo ID cards for regular Business Unit contractors
/ vendors
Instant photo ID cards for visitors
Visitor passes (numbered)
Vessel crew passes (numbered)
Vehicle passes (numbered)
Other (please specify)
Comments on identity control
Total $197,600 $78,000
Security Detection
Installation cost in US$ (2004 -
present)
2007 Annual maintenance costs in US$
Perimeter intruder detection system
$317,777 $32,000
Perimeter lighting Lighting of restricted
areas Cargo handling lighting
Passenger handling lighting
Access routes lighting CCTV - main gate
CCTV - other gates CCTV - restricted areas
CCTV - perimeter
CCTV - cargo handling areas
CCTV - passenger handling areas
CCTV - office buildings Surface radar
Underwater sonar Other (please specify)
Comments on security detection
Total $317,777 $32,000
Security Communications
Installation cost in US$ (2004 -
present)
2007 Annual maintenance costs in US$
VHF radio UHF radio
Push-to-Talk radio General audio alarm
Visual alarm
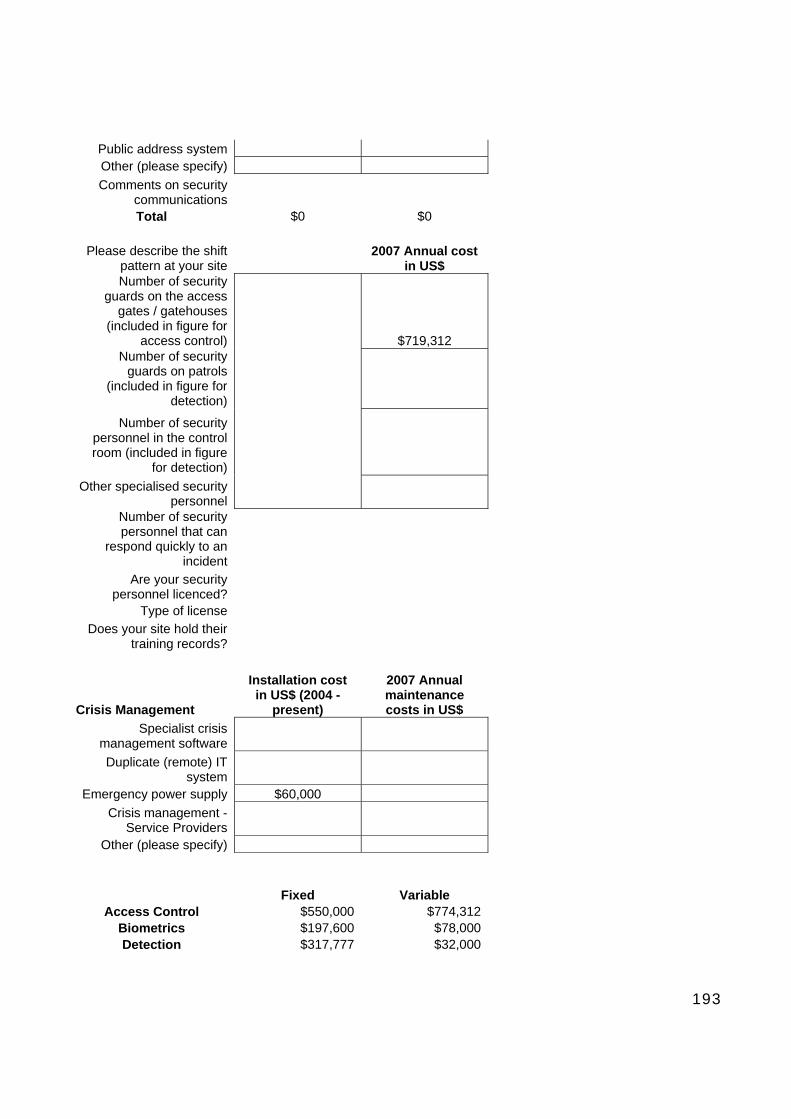
193
Public address system Other (please specify)
Comments on security communications Total $0 $0
Please describe the shift
pattern at your site 2007 Annual cost
in US$ Number of security
guards on the access gates / gatehouses
(included in figure for access control) $719,312
Number of security guards on patrols
(included in figure for detection)
Number of security personnel in the control room (included in figure
for detection)
Other specialised security personnel
Number of security personnel that can
respond quickly to an incident
Are your security personnel licenced?
Type of license Does your site hold their
training records?
Crisis Management
Installation cost in US$ (2004 -
present)
2007 Annual maintenance costs in US$
Specialist crisis management software
Duplicate (remote) IT system
Emergency power supply $60,000
Crisis management - Service Providers
Other (please specify)
Fixed Variable Access Control $550,000 $774,312
Biometrics $197,600 $78,000Detection $317,777 $32,000

194
Appendix D – List of Possible Portfolio Combinations Portfolio
No. Type of Security Incident
Security System Performance
Cost
1 A1 B1 D1
483,462 Bomb introduced by person on foot 80% 90% 75% Car Bomb 80% 90% 75% Truck bomb 85% 85% 80% Biological agent attack on terminal - on foot 80% 90% 75% Biological agent attack on terminal - by vehicle 85% 90% 75% Mining of port infrastructure 50% 0% 50% Vessel attacked by a suicide boat 50% 0% 50%
2 A1 B1 D2
2,977,788 Bomb introduced by person on foot 80% 90% 95% Car Bomb 80% 90% 95% Truck bomb 85% 85% 80% Biological agent attack on terminal - on foot 80% 90% 95% Biological agent attack on terminal - by vehicle 85% 90% 90% Mining of port infrastructure 50% 0% 80% Vessel attacked by a suicide boat 50% 0% 80%
3 A1 B1 D3
273,001 Bomb introduced by person on foot 80% 90% 70% Car Bomb 80% 90% 75% Truck bomb 85% 85% 70% Biological agent attack on terminal - on foot 80% 90% 70% Biological agent attack on terminal - by vehicle 85% 90% 75% Mining of port infrastructure 50% 0% 0% Vessel attacked by a suicide boat 50% 0% 0%
4 A1 B1 D4
1,009,133 Bomb introduced by person on foot 80% 90% 40% Car Bomb 80% 90% 0% Truck bomb 85% 85% 0% Biological agent attack on terminal - on foot 80% 90% 40% Biological agent attack on terminal - by vehicle 85% 90% 0% Mining of port infrastructure 50% 0% 40% Vessel attacked by a suicide boat 50% 0% 20%
5 A1 B1 D5
674,463 Bomb introduced by person on foot 80% 90% 0% Car Bomb 80% 90% 0% Truck bomb 85% 85% 0%

195
Biological agent attack on terminal - on foot 80% 90% 0% Biological agent attack on terminal - by vehicle 85% 90% 0% Mining of port infrastructure 50% 0% 50% Vessel attacked by a suicide boat 50% 0% 20%
6 A1 B1 D6
571,240 Bomb introduced by person on foot 80% 90% 80% Car Bomb 80% 90% 0% Truck bomb 85% 85% 0% Biological agent attack on terminal - on foot 80% 90% 80% Biological agent attack on terminal - by vehicle 85% 90% 0% Mining of port infrastructure 50% 0% 80% Vessel attacked by a suicide boat 50% 0% 50%
Portfolio No.
Type of Security Incident Security System
Performance Cost
7 A1 B2 D1
457,825 Bomb introduced by person on foot 80% 90% 75% Car Bomb 80% 90% 75% Truck bomb 85% 85% 80% Biological agent attack on terminal - on foot 80% 90% 75% Biological agent attack on terminal - by vehicle 85% 90% 75% Mining of port infrastructure 50% 0% 50% Vessel attacked by a suicide boat 50% 0% 50%
8 A1 B2 D2
2,952,151 Bomb introduced by person on foot 80% 90% 95% Car Bomb 80% 90% 95% Truck bomb 85% 85% 80% Biological agent attack on terminal - on foot 80% 90% 95% Biological agent attack on terminal - by vehicle 85% 90% 90% Mining of port infrastructure 50% 0% 80% Vessel attacked by a suicide boat 50% 0% 80%
9 A1 B2 D3
247,364 Bomb introduced by person on foot 80% 90% 70% Car Bomb 80% 90% 75% Truck bomb 85% 85% 70% Biological agent attack on terminal - on foot 80% 90% 70% Biological agent attack on terminal - by vehicle 85% 90% 75% Mining of port infrastructure 50% 0% 0% Vessel attacked by a suicide boat 50% 0% 0%
10 A1 B2 D4
983,496 Bomb introduced by person on foot 80% 90% 40%
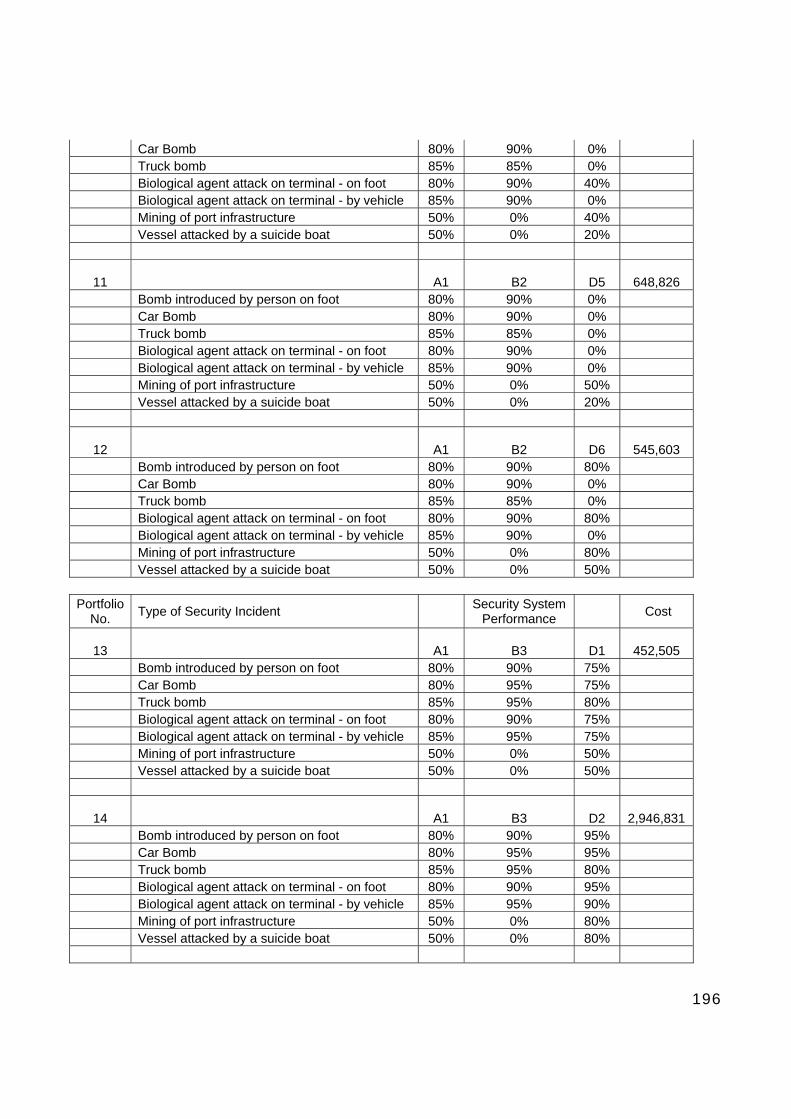
196
Car Bomb 80% 90% 0% Truck bomb 85% 85% 0% Biological agent attack on terminal - on foot 80% 90% 40% Biological agent attack on terminal - by vehicle 85% 90% 0% Mining of port infrastructure 50% 0% 40% Vessel attacked by a suicide boat 50% 0% 20%
11 A1 B2 D5
648,826 Bomb introduced by person on foot 80% 90% 0% Car Bomb 80% 90% 0% Truck bomb 85% 85% 0% Biological agent attack on terminal - on foot 80% 90% 0% Biological agent attack on terminal - by vehicle 85% 90% 0% Mining of port infrastructure 50% 0% 50% Vessel attacked by a suicide boat 50% 0% 20%
12 A1 B2 D6
545,603 Bomb introduced by person on foot 80% 90% 80% Car Bomb 80% 90% 0% Truck bomb 85% 85% 0% Biological agent attack on terminal - on foot 80% 90% 80% Biological agent attack on terminal - by vehicle 85% 90% 0% Mining of port infrastructure 50% 0% 80% Vessel attacked by a suicide boat 50% 0% 50%
Portfolio No.
Type of Security Incident Security System
Performance Cost
13 A1 B3 D1
452,505 Bomb introduced by person on foot 80% 90% 75% Car Bomb 80% 95% 75% Truck bomb 85% 95% 80% Biological agent attack on terminal - on foot 80% 90% 75% Biological agent attack on terminal - by vehicle 85% 95% 75% Mining of port infrastructure 50% 0% 50% Vessel attacked by a suicide boat 50% 0% 50%
14 A1 B3 D2
2,946,831 Bomb introduced by person on foot 80% 90% 95% Car Bomb 80% 95% 95% Truck bomb 85% 95% 80% Biological agent attack on terminal - on foot 80% 90% 95% Biological agent attack on terminal - by vehicle 85% 95% 90% Mining of port infrastructure 50% 0% 80% Vessel attacked by a suicide boat 50% 0% 80%

197
15 A1 B3 D3
242,044 Bomb introduced by person on foot 80% 90% 70% Car Bomb 80% 95% 75% Truck bomb 85% 95% 70% Biological agent attack on terminal - on foot 80% 90% 70% Biological agent attack on terminal - by vehicle 85% 95% 75% Mining of port infrastructure 50% 0% 0% Vessel attacked by a suicide boat 50% 0% 0%
16 A1 B3 D4
978,176 Bomb introduced by person on foot 80% 90% 40% Car Bomb 80% 95% 0% Truck bomb 85% 95% 0% Biological agent attack on terminal - on foot 80% 90% 40% Biological agent attack on terminal - by vehicle 85% 95% 0% Mining of port infrastructure 50% 0% 40% Vessel attacked by a suicide boat 50% 0% 20%
17 A1 B3 D5
643,506 Bomb introduced by person on foot 80% 90% 0% Car Bomb 80% 95% 0% Truck bomb 85% 95% 0% Biological agent attack on terminal - on foot 80% 90% 0% Biological agent attack on terminal - by vehicle 85% 95% 0% Mining of port infrastructure 50% 0% 50% Vessel attacked by a suicide boat 50% 0% 20%
18 A1 B3 D6
540,283 Bomb introduced by person on foot 80% 90% 80% Car Bomb 80% 95% 0% Truck bomb 85% 95% 0% Biological agent attack on terminal - on foot 80% 90% 80% Biological agent attack on terminal - by vehicle 85% 95% 0% Mining of port infrastructure 50% 0% 80% Vessel attacked by a suicide boat 50% 0% 50%
Portfolio No.
Type of Security Incident Security System
Performance Cost
19 A1 B4 D1
462,025 Bomb introduced by person on foot 80% 40% 75% Car Bomb 80% 40% 75% Truck bomb 85% 40% 80% Biological agent attack on terminal - on foot 80% 40% 75% Biological agent attack on terminal - by vehicle 85% 40% 75% Mining of port infrastructure 50% 40% 50%

198
Vessel attacked by a suicide boat 50% 0% 50%
20 A1 B4 D2
2,956,351 Bomb introduced by person on foot 80% 40% 95% Car Bomb 80% 40% 95% Truck bomb 85% 40% 80% Biological agent attack on terminal - on foot 80% 40% 95% Biological agent attack on terminal - by vehicle 85% 40% 90% Mining of port infrastructure 50% 40% 80% Vessel attacked by a suicide boat 50% 0% 80%
21 A1 B4 D3
251,564 Bomb introduced by person on foot 80% 40% 70% Car Bomb 80% 40% 75% Truck bomb 85% 40% 70% Biological agent attack on terminal - on foot 80% 40% 70% Biological agent attack on terminal - by vehicle 85% 40% 75% Mining of port infrastructure 50% 40% 0% Vessel attacked by a suicide boat 50% 0% 0%
22 A1 B4 D4
987,696 Bomb introduced by person on foot 80% 40% 40% Car Bomb 80% 40% 0% Truck bomb 85% 40% 0% Biological agent attack on terminal - on foot 80% 40% 40% Biological agent attack on terminal - by vehicle 85% 40% 0% Mining of port infrastructure 50% 40% 40% Vessel attacked by a suicide boat 50% 0% 20%
23 A1 B4 D5
653,026 Bomb introduced by person on foot 80% 40% 0% Car Bomb 80% 40% 0% Truck bomb 85% 40% 0% Biological agent attack on terminal - on foot 80% 40% 0% Biological agent attack on terminal - by vehicle 85% 40% 0% Mining of port infrastructure 50% 40% 50% Vessel attacked by a suicide boat 50% 0% 20%
24 A1 B4 D6
549,803 Bomb introduced by person on foot 80% 40% 80% Car Bomb 80% 40% 0% Truck bomb 85% 40% 0% Biological agent attack on terminal - on foot 80% 40% 80% Biological agent attack on terminal - by vehicle 85% 40% 0% Mining of port infrastructure 50% 40% 80%
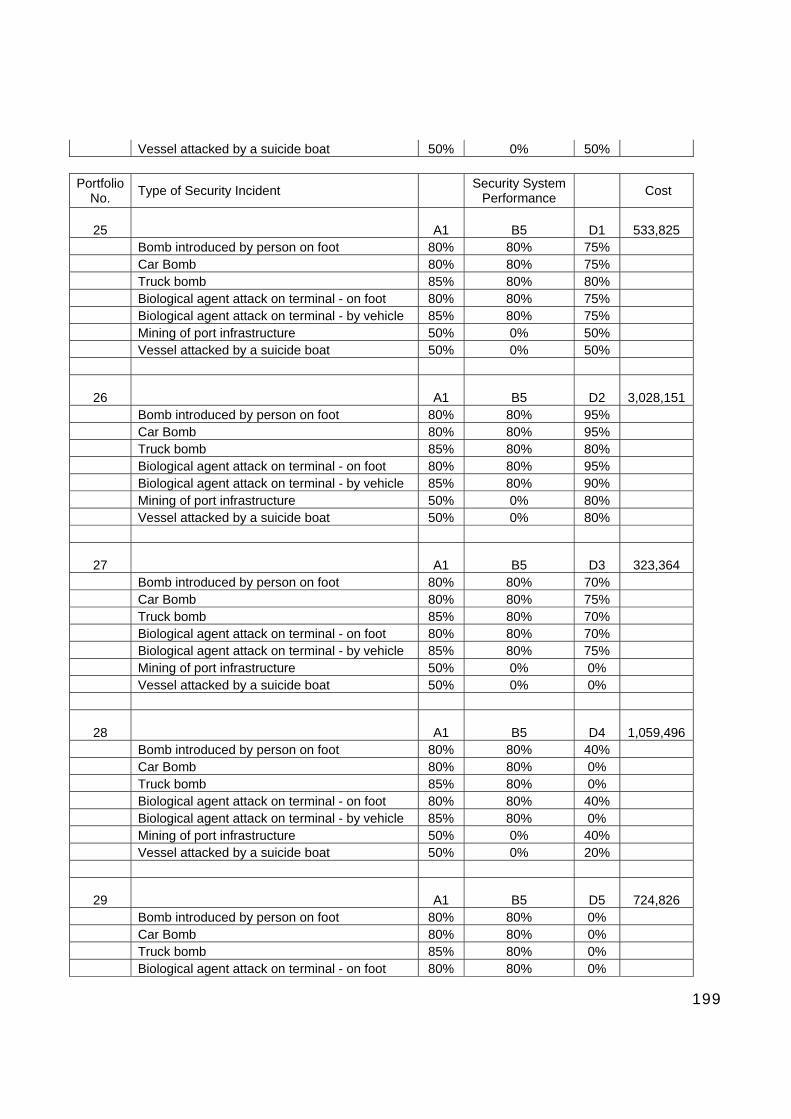
199
Vessel attacked by a suicide boat 50% 0% 50%
Portfolio No.
Type of Security Incident Security System
Performance Cost
25 A1 B5 D1
533,825 Bomb introduced by person on foot 80% 80% 75% Car Bomb 80% 80% 75% Truck bomb 85% 80% 80% Biological agent attack on terminal - on foot 80% 80% 75% Biological agent attack on terminal - by vehicle 85% 80% 75% Mining of port infrastructure 50% 0% 50% Vessel attacked by a suicide boat 50% 0% 50%
26 A1 B5 D2
3,028,151 Bomb introduced by person on foot 80% 80% 95% Car Bomb 80% 80% 95% Truck bomb 85% 80% 80% Biological agent attack on terminal - on foot 80% 80% 95% Biological agent attack on terminal - by vehicle 85% 80% 90% Mining of port infrastructure 50% 0% 80% Vessel attacked by a suicide boat 50% 0% 80%
27 A1 B5 D3
323,364 Bomb introduced by person on foot 80% 80% 70% Car Bomb 80% 80% 75% Truck bomb 85% 80% 70% Biological agent attack on terminal - on foot 80% 80% 70% Biological agent attack on terminal - by vehicle 85% 80% 75% Mining of port infrastructure 50% 0% 0% Vessel attacked by a suicide boat 50% 0% 0%
28 A1 B5 D4
1,059,496 Bomb introduced by person on foot 80% 80% 40% Car Bomb 80% 80% 0% Truck bomb 85% 80% 0% Biological agent attack on terminal - on foot 80% 80% 40% Biological agent attack on terminal - by vehicle 85% 80% 0% Mining of port infrastructure 50% 0% 40% Vessel attacked by a suicide boat 50% 0% 20%
29 A1 B5 D5
724,826 Bomb introduced by person on foot 80% 80% 0% Car Bomb 80% 80% 0% Truck bomb 85% 80% 0% Biological agent attack on terminal - on foot 80% 80% 0%

200
Biological agent attack on terminal - by vehicle 85% 80% 0% Mining of port infrastructure 50% 0% 50% Vessel attacked by a suicide boat 50% 0% 20%
30 A1 B5 D6
621,603 Bomb introduced by person on foot 80% 80% 80% Car Bomb 80% 80% 0% Truck bomb 85% 80% 0% Biological agent attack on terminal - on foot 80% 80% 80% Biological agent attack on terminal - by vehicle 85% 80% 0% Mining of port infrastructure 50% 0% 80% Vessel attacked by a suicide boat 50% 0% 50%
Portfolio No.
Type of Security Incident Security System
Performance Cost
31 A1 B6 D1
725,425 Bomb introduced by person on foot 80% 95% 75% Car Bomb 80% 95% 75% Truck bomb 85% 95% 80% Biological agent attack on terminal - on foot 80% 95% 75% Biological agent attack on terminal - by vehicle 85% 95% 75% Mining of port infrastructure 50% 0% 50% Vessel attacked by a suicide boat 50% 0% 50%
32 A1 B6 D2
3,219,751 Bomb introduced by person on foot 80% 95% 95% Car Bomb 80% 95% 95% Truck bomb 85% 95% 80% Biological agent attack on terminal - on foot 80% 95% 95% Biological agent attack on terminal - by vehicle 85% 95% 90% Mining of port infrastructure 50% 0% 80% Vessel attacked by a suicide boat 50% 0% 80%
33 A1 B6 D3
514,964 Bomb introduced by person on foot 80% 95% 70% Car Bomb 80% 95% 75% Truck bomb 85% 95% 70% Biological agent attack on terminal - on foot 80% 95% 70% Biological agent attack on terminal - by vehicle 85% 95% 75% Mining of port infrastructure 50% 0% 0% Vessel attacked by a suicide boat 50% 0% 0%
34 A1 B6 D4
1,251,096 Bomb introduced by person on foot 80% 95% 40% Car Bomb 80% 95% 0%

201
Truck bomb 85% 95% 0% Biological agent attack on terminal - on foot 80% 95% 40% Biological agent attack on terminal - by vehicle 85% 95% 0% Mining of port infrastructure 50% 0% 40% Vessel attacked by a suicide boat 50% 0% 20%
35 A1 B6 D5
916,426 Bomb introduced by person on foot 80% 95% 0% Car Bomb 80% 95% 0% Truck bomb 85% 95% 0% Biological agent attack on terminal - on foot 80% 95% 0% Biological agent attack on terminal - by vehicle 85% 95% 0% Mining of port infrastructure 50% 0% 50% Vessel attacked by a suicide boat 50% 0% 20%
36 A1 B6 D6
813,203 Bomb introduced by person on foot 80% 95% 80% Car Bomb 80% 95% 0% Truck bomb 85% 95% 0% Biological agent attack on terminal - on foot 80% 95% 80% Biological agent attack on terminal - by vehicle 85% 95% 0% Mining of port infrastructure 50% 0% 80% Vessel attacked by a suicide boat 50% 0% 50%
Portfolio No.
Type of Security Incident Security System
Performance Cost
37 A2 B1 D1
1,010,636 Bomb introduced by person on foot 90% 90% 75% Car Bomb 90% 90% 75% Truck bomb 80% 85% 80% Biological agent attack on terminal - on foot 90% 90% 75% Biological agent attack on terminal - by vehicle 85% 90% 75% Mining of port infrastructure 50% 0% 50% Vessel attacked by a suicide boat 50% 0% 50%
38 A2 B1 D2
3,504,962 Bomb introduced by person on foot 90% 90% 95% Car Bomb 90% 90% 95% Truck bomb 80% 85% 80% Biological agent attack on terminal - on foot 90% 90% 95% Biological agent attack on terminal - by vehicle 85% 90% 90% Mining of port infrastructure 50% 0% 80% Vessel attacked by a suicide boat 50% 0% 80%
39 A2 B1 D3
800,175
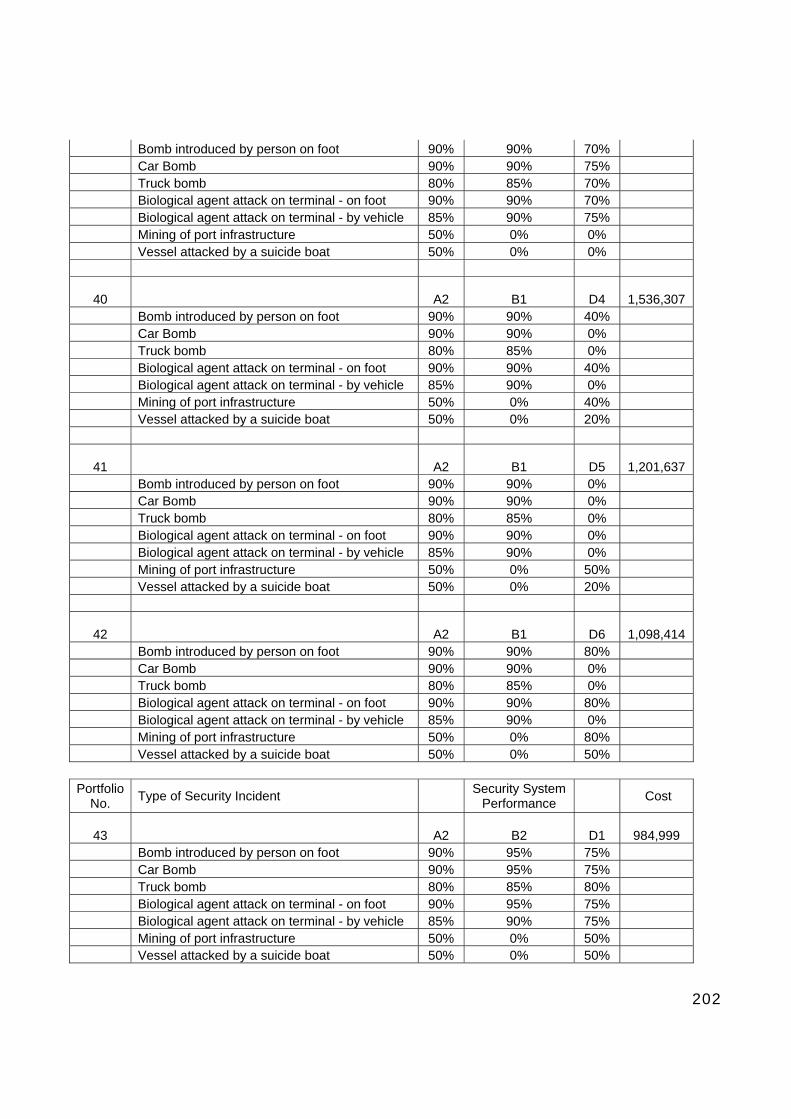
202
Bomb introduced by person on foot 90% 90% 70% Car Bomb 90% 90% 75% Truck bomb 80% 85% 70% Biological agent attack on terminal - on foot 90% 90% 70% Biological agent attack on terminal - by vehicle 85% 90% 75% Mining of port infrastructure 50% 0% 0% Vessel attacked by a suicide boat 50% 0% 0%
40 A2 B1 D4
1,536,307 Bomb introduced by person on foot 90% 90% 40% Car Bomb 90% 90% 0% Truck bomb 80% 85% 0% Biological agent attack on terminal - on foot 90% 90% 40% Biological agent attack on terminal - by vehicle 85% 90% 0% Mining of port infrastructure 50% 0% 40% Vessel attacked by a suicide boat 50% 0% 20%
41 A2 B1 D5
1,201,637 Bomb introduced by person on foot 90% 90% 0% Car Bomb 90% 90% 0% Truck bomb 80% 85% 0% Biological agent attack on terminal - on foot 90% 90% 0% Biological agent attack on terminal - by vehicle 85% 90% 0% Mining of port infrastructure 50% 0% 50% Vessel attacked by a suicide boat 50% 0% 20%
42 A2 B1 D6
1,098,414 Bomb introduced by person on foot 90% 90% 80% Car Bomb 90% 90% 0% Truck bomb 80% 85% 0% Biological agent attack on terminal - on foot 90% 90% 80% Biological agent attack on terminal - by vehicle 85% 90% 0% Mining of port infrastructure 50% 0% 80% Vessel attacked by a suicide boat 50% 0% 50%
Portfolio No.
Type of Security Incident Security System
Performance Cost
43 A2 B2 D1
984,999 Bomb introduced by person on foot 90% 95% 75% Car Bomb 90% 95% 75% Truck bomb 80% 85% 80% Biological agent attack on terminal - on foot 90% 95% 75% Biological agent attack on terminal - by vehicle 85% 90% 75% Mining of port infrastructure 50% 0% 50% Vessel attacked by a suicide boat 50% 0% 50%
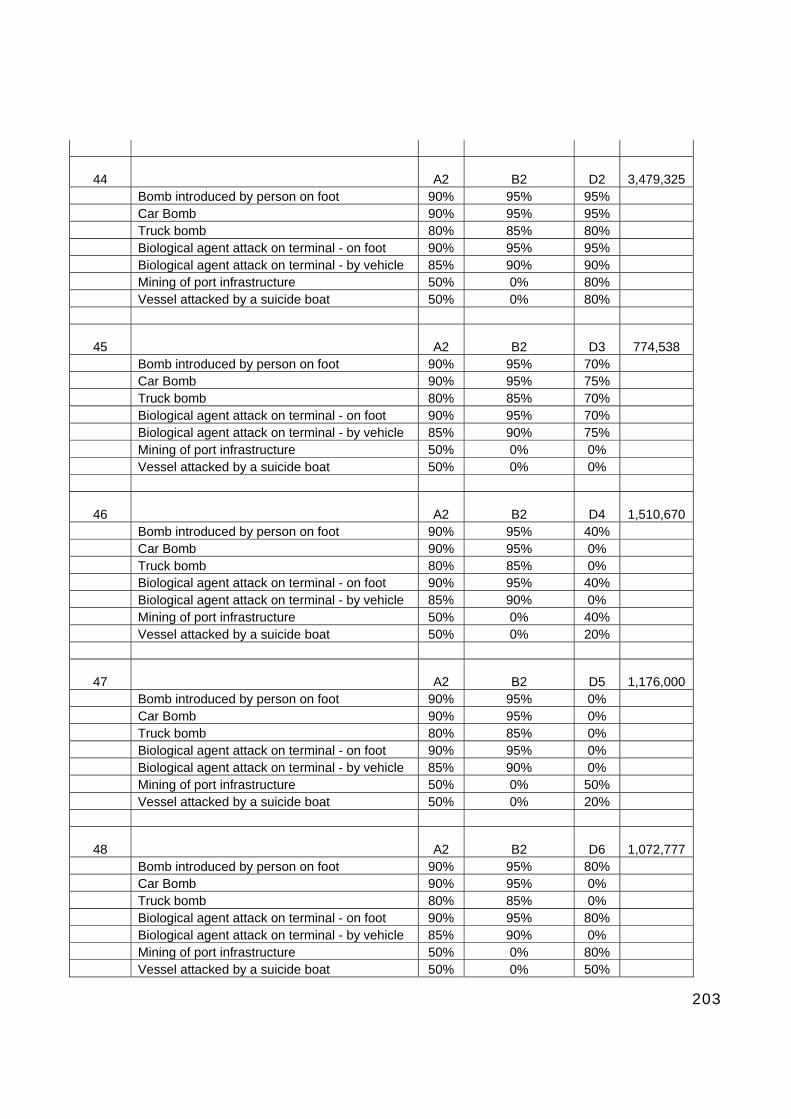
203
44 A2 B2 D2
3,479,325 Bomb introduced by person on foot 90% 95% 95% Car Bomb 90% 95% 95% Truck bomb 80% 85% 80% Biological agent attack on terminal - on foot 90% 95% 95% Biological agent attack on terminal - by vehicle 85% 90% 90% Mining of port infrastructure 50% 0% 80% Vessel attacked by a suicide boat 50% 0% 80%
45 A2 B2 D3
774,538 Bomb introduced by person on foot 90% 95% 70% Car Bomb 90% 95% 75% Truck bomb 80% 85% 70% Biological agent attack on terminal - on foot 90% 95% 70% Biological agent attack on terminal - by vehicle 85% 90% 75% Mining of port infrastructure 50% 0% 0% Vessel attacked by a suicide boat 50% 0% 0%
46 A2 B2 D4
1,510,670 Bomb introduced by person on foot 90% 95% 40% Car Bomb 90% 95% 0% Truck bomb 80% 85% 0% Biological agent attack on terminal - on foot 90% 95% 40% Biological agent attack on terminal - by vehicle 85% 90% 0% Mining of port infrastructure 50% 0% 40% Vessel attacked by a suicide boat 50% 0% 20%
47 A2 B2 D5
1,176,000 Bomb introduced by person on foot 90% 95% 0% Car Bomb 90% 95% 0% Truck bomb 80% 85% 0% Biological agent attack on terminal - on foot 90% 95% 0% Biological agent attack on terminal - by vehicle 85% 90% 0% Mining of port infrastructure 50% 0% 50% Vessel attacked by a suicide boat 50% 0% 20%
48 A2 B2 D6
1,072,777 Bomb introduced by person on foot 90% 95% 80% Car Bomb 90% 95% 0% Truck bomb 80% 85% 0% Biological agent attack on terminal - on foot 90% 95% 80% Biological agent attack on terminal - by vehicle 85% 90% 0% Mining of port infrastructure 50% 0% 80% Vessel attacked by a suicide boat 50% 0% 50%

204
Portfolio No.
Type of Security Incident Security System
Performance Cost
49 A2 B3 D1
979,679 Bomb introduced by person on foot 90% 90% 75% Car Bomb 90% 95% 75% Truck bomb 80% 95% 80% Biological agent attack on terminal - on foot 90% 90% 75% Biological agent attack on terminal - by vehicle 85% 95% 75% Mining of port infrastructure 50% 0% 50% Vessel attacked by a suicide boat 50% 0% 50%
50 A2 B3 D2
3,474,005 Bomb introduced by person on foot 90% 90% 95% Car Bomb 90% 95% 95% Truck bomb 80% 95% 80% Biological agent attack on terminal - on foot 90% 90% 95% Biological agent attack on terminal - by vehicle 85% 95% 90% Mining of port infrastructure 50% 0% 80% Vessel attacked by a suicide boat 50% 0% 80%
51 A2 B3 D3
769,218 Bomb introduced by person on foot 90% 90% 70% Car Bomb 90% 95% 75% Truck bomb 80% 95% 70% Biological agent attack on terminal - on foot 90% 90% 70% Biological agent attack on terminal - by vehicle 85% 95% 75% Mining of port infrastructure 50% 0% 0% Vessel attacked by a suicide boat 50% 0% 0%
52 A2 B3 D4
1,505,350 Bomb introduced by person on foot 90% 90% 40% Car Bomb 90% 95% 0% Truck bomb 80% 95% 0% Biological agent attack on terminal - on foot 90% 90% 40% Biological agent attack on terminal - by vehicle 85% 95% 0% Mining of port infrastructure 50% 0% 40% Vessel attacked by a suicide boat 50% 0% 20%
53 A2 B3 D5
1,170,680 Bomb introduced by person on foot 90% 90% 0% Car Bomb 90% 95% 0% Truck bomb 80% 95% 0% Biological agent attack on terminal - on foot 90% 90% 0% Biological agent attack on terminal - by vehicle 85% 95% 0%

205
Mining of port infrastructure 50% 0% 50% Vessel attacked by a suicide boat 50% 0% 20%
54 A2 B3 D6
1,067,457 Bomb introduced by person on foot 90% 90% 80% Car Bomb 90% 95% 0% Truck bomb 80% 95% 0% Biological agent attack on terminal - on foot 90% 90% 80% Biological agent attack on terminal - by vehicle 85% 95% 0% Mining of port infrastructure 50% 0% 80% Vessel attacked by a suicide boat 50% 0% 50%
Portfolio No.
Type of Security Incident Security System
Performance Cost
55 A2 B4 D1
989,199 Bomb introduced by person on foot 90% 40% 75% Car Bomb 90% 40% 75% Truck bomb 80% 40% 80% Biological agent attack on terminal - on foot 90% 40% 75% Biological agent attack on terminal - by vehicle 85% 40% 75% Mining of port infrastructure 50% 40% 50% Vessel attacked by a suicide boat 50% 0% 50%
56 A2 B4 D2
3,483,525 Bomb introduced by person on foot 90% 40% 95% Car Bomb 90% 40% 95% Truck bomb 80% 40% 80% Biological agent attack on terminal - on foot 90% 40% 95% Biological agent attack on terminal - by vehicle 85% 40% 90% Mining of port infrastructure 50% 40% 80% Vessel attacked by a suicide boat 50% 0% 80%
57 A2 B4 D3
778,738 Bomb introduced by person on foot 90% 40% 70% Car Bomb 90% 40% 75% Truck bomb 80% 40% 70% Biological agent attack on terminal - on foot 90% 40% 70% Biological agent attack on terminal - by vehicle 85% 40% 75% Mining of port infrastructure 50% 40% 0% Vessel attacked by a suicide boat 50% 0% 0%
58 A2 B4 D4
1,514,870 Bomb introduced by person on foot 90% 40% 40% Car Bomb 90% 40% 0% Truck bomb 80% 40% 0%

206
Biological agent attack on terminal - on foot 90% 40% 40% Biological agent attack on terminal - by vehicle 85% 40% 0% Mining of port infrastructure 50% 40% 40% Vessel attacked by a suicide boat 50% 0% 20%
59 A2 B4 D5
1,180,200 Bomb introduced by person on foot 90% 40% 0% Car Bomb 90% 40% 0% Truck bomb 80% 40% 0% Biological agent attack on terminal - on foot 90% 40% 0% Biological agent attack on terminal - by vehicle 85% 40% 0% Mining of port infrastructure 50% 40% 50% Vessel attacked by a suicide boat 50% 0% 20%
60 A2 B4 D6
1,076,977 Bomb introduced by person on foot 90% 40% 80% Car Bomb 90% 40% 0% Truck bomb 80% 40% 0% Biological agent attack on terminal - on foot 90% 40% 80% Biological agent attack on terminal - by vehicle 85% 40% 0% Mining of port infrastructure 50% 40% 80% Vessel attacked by a suicide boat 50% 0% 50%
Portfolio No.
Type of Security Incident Security System
Performance Cost
61 A2 B5 D1
1,060,999 Bomb introduced by person on foot 90% 80% 75% Car Bomb 90% 80% 75% Truck bomb 80% 80% 80% Biological agent attack on terminal - on foot 90% 80% 75% Biological agent attack on terminal - by vehicle 85% 80% 75% Mining of port infrastructure 50% 0% 50% Vessel attacked by a suicide boat 50% 0% 50%
62 A2 B5 D2
3,555,325 Bomb introduced by person on foot 90% 80% 95% Car Bomb 90% 80% 95% Truck bomb 80% 80% 80% Biological agent attack on terminal - on foot 90% 80% 95% Biological agent attack on terminal - by vehicle 85% 80% 90% Mining of port infrastructure 50% 0% 80% Vessel attacked by a suicide boat 50% 0% 80%
63 A2 B5 D3
850,538 Bomb introduced by person on foot 90% 80% 70%

207
Car Bomb 90% 80% 75% Truck bomb 80% 80% 70% Biological agent attack on terminal - on foot 90% 80% 70% Biological agent attack on terminal - by vehicle 85% 80% 75% Mining of port infrastructure 50% 0% 0% Vessel attacked by a suicide boat 50% 0% 0%
64 A2 B5 D4
1,586,670 Bomb introduced by person on foot 90% 80% 40% Car Bomb 90% 80% 0% Truck bomb 80% 80% 0% Biological agent attack on terminal - on foot 90% 80% 40% Biological agent attack on terminal - by vehicle 85% 80% 0% Mining of port infrastructure 50% 0% 40% Vessel attacked by a suicide boat 50% 0% 20%
65 A2 B5 D5
1,252,000 Bomb introduced by person on foot 90% 80% 0% Car Bomb 90% 80% 0% Truck bomb 80% 80% 0% Biological agent attack on terminal - on foot 90% 80% 0% Biological agent attack on terminal - by vehicle 85% 80% 0% Mining of port infrastructure 50% 0% 50% Vessel attacked by a suicide boat 50% 0% 20%
66 A2 B5 D6
1,148,777 Bomb introduced by person on foot 90% 80% 80% Car Bomb 90% 80% 0% Truck bomb 80% 80% 0% Biological agent attack on terminal - on foot 90% 80% 80% Biological agent attack on terminal - by vehicle 85% 80% 0% Mining of port infrastructure 50% 0% 80% Vessel attacked by a suicide boat 50% 0% 50%
Portfolio No.
Type of Security Incident Security System
Performance Cost
67 A2 B6 D1
1,252,599 Bomb introduced by person on foot 90% 95% 75% Car Bomb 90% 95% 75% Truck bomb 80% 95% 80% Biological agent attack on terminal - on foot 90% 95% 75% Biological agent attack on terminal - by vehicle 85% 95% 75% Mining of port infrastructure 50% 0% 50% Vessel attacked by a suicide boat 50% 0% 50%
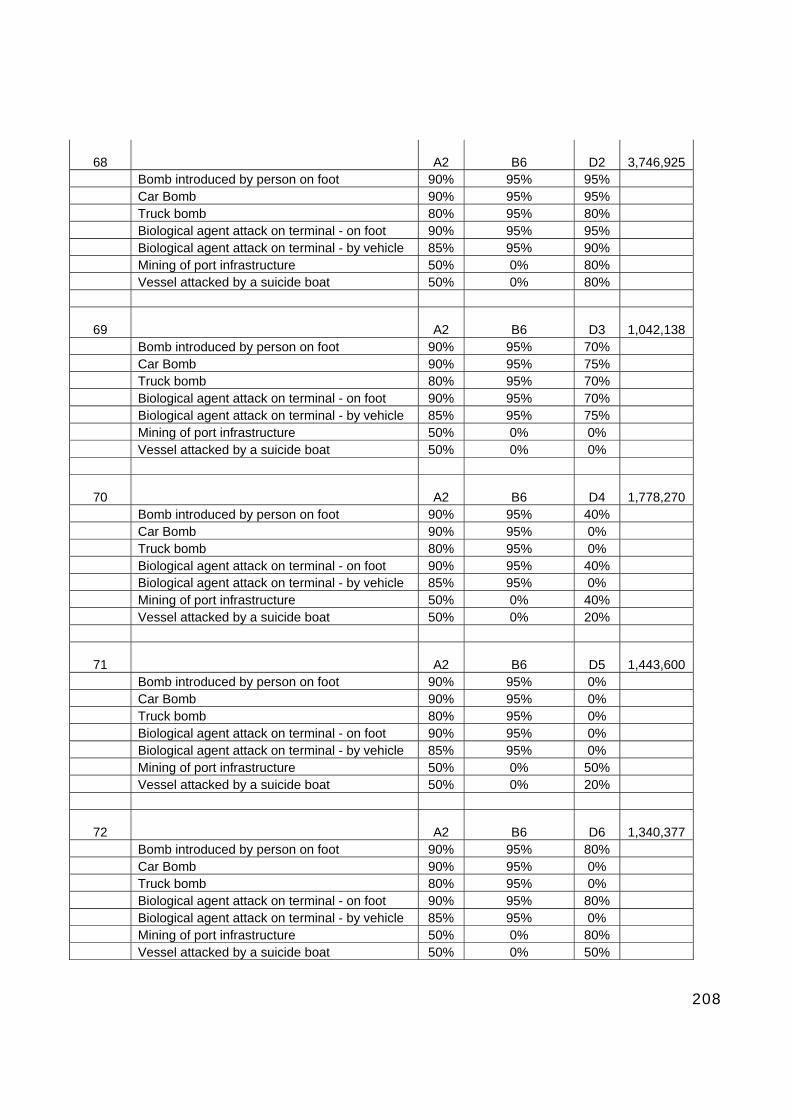
208
68 A2 B6 D2
3,746,925 Bomb introduced by person on foot 90% 95% 95% Car Bomb 90% 95% 95% Truck bomb 80% 95% 80% Biological agent attack on terminal - on foot 90% 95% 95% Biological agent attack on terminal - by vehicle 85% 95% 90% Mining of port infrastructure 50% 0% 80% Vessel attacked by a suicide boat 50% 0% 80%
69 A2 B6 D3
1,042,138 Bomb introduced by person on foot 90% 95% 70% Car Bomb 90% 95% 75% Truck bomb 80% 95% 70% Biological agent attack on terminal - on foot 90% 95% 70% Biological agent attack on terminal - by vehicle 85% 95% 75% Mining of port infrastructure 50% 0% 0% Vessel attacked by a suicide boat 50% 0% 0%
70 A2 B6 D4
1,778,270 Bomb introduced by person on foot 90% 95% 40% Car Bomb 90% 95% 0% Truck bomb 80% 95% 0% Biological agent attack on terminal - on foot 90% 95% 40% Biological agent attack on terminal - by vehicle 85% 95% 0% Mining of port infrastructure 50% 0% 40% Vessel attacked by a suicide boat 50% 0% 20%
71 A2 B6 D5
1,443,600 Bomb introduced by person on foot 90% 95% 0% Car Bomb 90% 95% 0% Truck bomb 80% 95% 0% Biological agent attack on terminal - on foot 90% 95% 0% Biological agent attack on terminal - by vehicle 85% 95% 0% Mining of port infrastructure 50% 0% 50% Vessel attacked by a suicide boat 50% 0% 20%
72 A2 B6 D6
1,340,377 Bomb introduced by person on foot 90% 95% 80% Car Bomb 90% 95% 0% Truck bomb 80% 95% 0% Biological agent attack on terminal - on foot 90% 95% 80% Biological agent attack on terminal - by vehicle 85% 95% 0% Mining of port infrastructure 50% 0% 80% Vessel attacked by a suicide boat 50% 0% 50%

209
Portfolio No.
Type of Security Incident Security System
Performance Cost
73 A3 B1 D1
708,370 Bomb introduced by person on foot 80% 90% 75% Car Bomb 85% 90% 75% Truck bomb 85% 85% 80% Biological agent attack on terminal - on foot 80% 90% 75% Biological agent attack on terminal - by vehicle 85% 90% 75% Mining of port infrastructure 0% 0% 50% Vessel attacked by a suicide boat 0% 0% 50%
74 A3 B1 D2
3,202,696 Bomb introduced by person on foot 80% 90% 95% Car Bomb 85% 90% 95% Truck bomb 85% 85% 80% Biological agent attack on terminal - on foot 80% 90% 95% Biological agent attack on terminal - by vehicle 85% 90% 90% Mining of port infrastructure 0% 0% 80% Vessel attacked by a suicide boat 0% 0% 80%
75 A3 B1 D3
497,909 Bomb introduced by person on foot 80% 90% 70% Car Bomb 85% 90% 75% Truck bomb 85% 85% 70% Biological agent attack on terminal - on foot 80% 90% 70% Biological agent attack on terminal - by vehicle 85% 90% 75% Mining of port infrastructure 0% 0% 0% Vessel attacked by a suicide boat 0% 0% 0%
76 A3 B1 D4
1,234,041 Bomb introduced by person on foot 80% 90% 40% Car Bomb 85% 90% 0% Truck bomb 85% 85% 0% Biological agent attack on terminal - on foot 80% 90% 40% Biological agent attack on terminal - by vehicle 85% 90% 0% Mining of port infrastructure 0% 0% 40% Vessel attacked by a suicide boat 0% 0% 20%
77 A3 B1 D5
899,371 Bomb introduced by person on foot 80% 90% 0% Car Bomb 85% 90% 0% Truck bomb 85% 85% 0% Biological agent attack on terminal - on foot 80% 90% 0% Biological agent attack on terminal - by vehicle 85% 90% 0% Mining of port infrastructure 0% 0% 50%

210
Vessel attacked by a suicide boat 0% 0% 20%
78 A3 B1 D6
796,148 Bomb introduced by person on foot 80% 90% 80% Car Bomb 85% 90% 0% Truck bomb 85% 85% 0% Biological agent attack on terminal - on foot 80% 90% 80% Biological agent attack on terminal - by vehicle 85% 90% 0% Mining of port infrastructure 0% 0% 80% Vessel attacked by a suicide boat 0% 0% 50%
Portfolio No.
Type of Security Incident Security System
Performance Cost
79 A3 B2 D1
682,733 Bomb introduced by person on foot 80% 90% 75% Car Bomb 85% 90% 75% Truck bomb 85% 85% 80% Biological agent attack on terminal - on foot 80% 90% 75% Biological agent attack on terminal - by vehicle 85% 90% 75% Mining of port infrastructure 0% 0% 50% Vessel attacked by a suicide boat 0% 0% 50%
80 A3 B2 D2
3,177,059 Bomb introduced by person on foot 80% 90% 95% Car Bomb 85% 90% 95% Truck bomb 85% 85% 80% Biological agent attack on terminal - on foot 80% 90% 95% Biological agent attack on terminal - by vehicle 85% 90% 90% Mining of port infrastructure 0% 0% 80% Vessel attacked by a suicide boat 0% 0% 80%
81 A3 B2 D3
472,272 Bomb introduced by person on foot 80% 90% 70% Car Bomb 85% 90% 75% Truck bomb 85% 85% 70% Biological agent attack on terminal - on foot 80% 90% 70% Biological agent attack on terminal - by vehicle 85% 90% 75% Mining of port infrastructure 0% 0% 0% Vessel attacked by a suicide boat 0% 0% 0%
82 A3 B2 D4
1,208,404 Bomb introduced by person on foot 80% 90% 40% Car Bomb 85% 90% 0% Truck bomb 85% 85% 0% Biological agent attack on terminal - on foot 80% 90% 40%
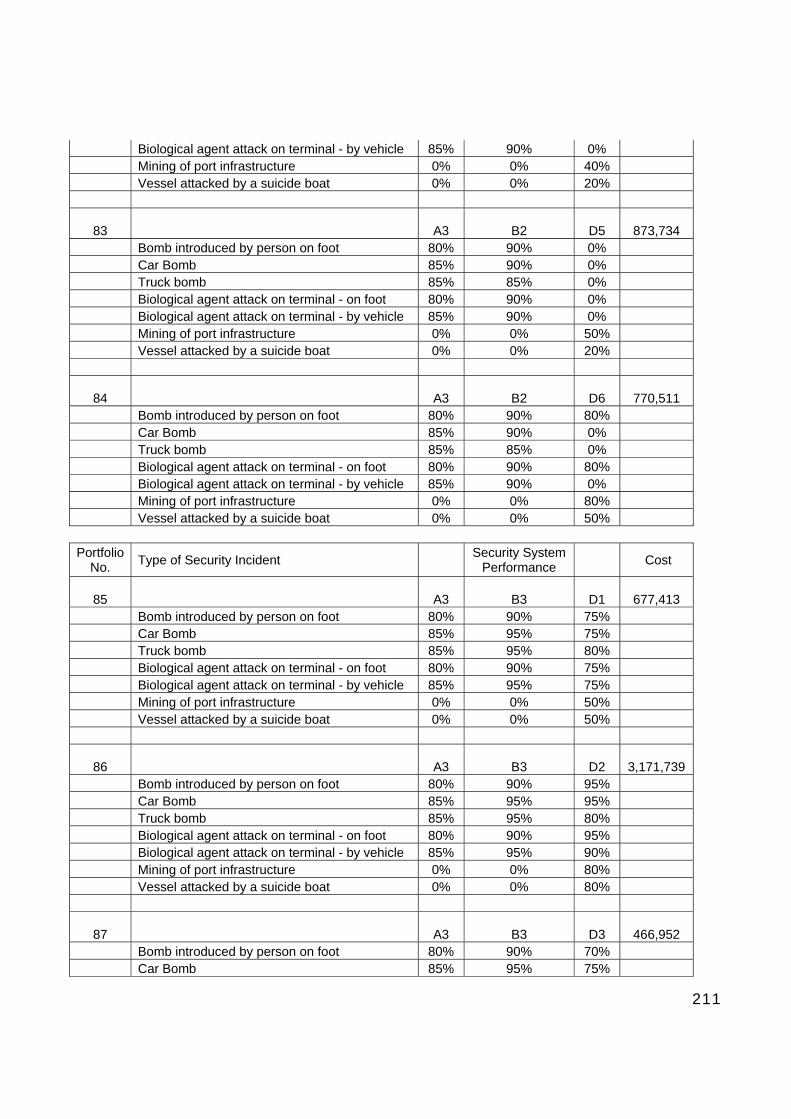
211
Biological agent attack on terminal - by vehicle 85% 90% 0% Mining of port infrastructure 0% 0% 40% Vessel attacked by a suicide boat 0% 0% 20%
83 A3 B2 D5
873,734 Bomb introduced by person on foot 80% 90% 0% Car Bomb 85% 90% 0% Truck bomb 85% 85% 0% Biological agent attack on terminal - on foot 80% 90% 0% Biological agent attack on terminal - by vehicle 85% 90% 0% Mining of port infrastructure 0% 0% 50% Vessel attacked by a suicide boat 0% 0% 20%
84 A3 B2 D6
770,511 Bomb introduced by person on foot 80% 90% 80% Car Bomb 85% 90% 0% Truck bomb 85% 85% 0% Biological agent attack on terminal - on foot 80% 90% 80% Biological agent attack on terminal - by vehicle 85% 90% 0% Mining of port infrastructure 0% 0% 80% Vessel attacked by a suicide boat 0% 0% 50%
Portfolio No.
Type of Security Incident Security System
Performance Cost
85 A3 B3 D1
677,413 Bomb introduced by person on foot 80% 90% 75% Car Bomb 85% 95% 75% Truck bomb 85% 95% 80% Biological agent attack on terminal - on foot 80% 90% 75% Biological agent attack on terminal - by vehicle 85% 95% 75% Mining of port infrastructure 0% 0% 50% Vessel attacked by a suicide boat 0% 0% 50%
86 A3 B3 D2
3,171,739 Bomb introduced by person on foot 80% 90% 95% Car Bomb 85% 95% 95% Truck bomb 85% 95% 80% Biological agent attack on terminal - on foot 80% 90% 95% Biological agent attack on terminal - by vehicle 85% 95% 90% Mining of port infrastructure 0% 0% 80% Vessel attacked by a suicide boat 0% 0% 80%
87 A3 B3 D3
466,952 Bomb introduced by person on foot 80% 90% 70% Car Bomb 85% 95% 75%
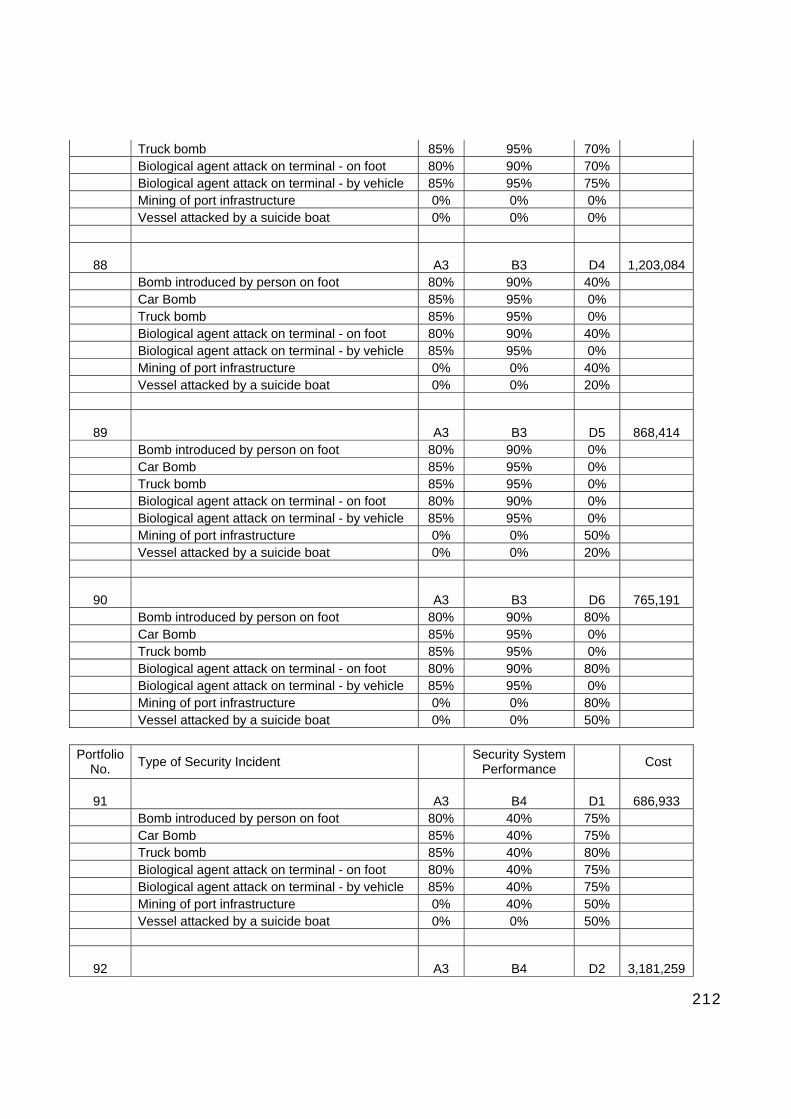
212
Truck bomb 85% 95% 70% Biological agent attack on terminal - on foot 80% 90% 70% Biological agent attack on terminal - by vehicle 85% 95% 75% Mining of port infrastructure 0% 0% 0% Vessel attacked by a suicide boat 0% 0% 0%
88 A3 B3 D4
1,203,084 Bomb introduced by person on foot 80% 90% 40% Car Bomb 85% 95% 0% Truck bomb 85% 95% 0% Biological agent attack on terminal - on foot 80% 90% 40% Biological agent attack on terminal - by vehicle 85% 95% 0% Mining of port infrastructure 0% 0% 40% Vessel attacked by a suicide boat 0% 0% 20%
89 A3 B3 D5
868,414 Bomb introduced by person on foot 80% 90% 0% Car Bomb 85% 95% 0% Truck bomb 85% 95% 0% Biological agent attack on terminal - on foot 80% 90% 0% Biological agent attack on terminal - by vehicle 85% 95% 0% Mining of port infrastructure 0% 0% 50% Vessel attacked by a suicide boat 0% 0% 20%
90 A3 B3 D6
765,191 Bomb introduced by person on foot 80% 90% 80% Car Bomb 85% 95% 0% Truck bomb 85% 95% 0% Biological agent attack on terminal - on foot 80% 90% 80% Biological agent attack on terminal - by vehicle 85% 95% 0% Mining of port infrastructure 0% 0% 80% Vessel attacked by a suicide boat 0% 0% 50%
Portfolio No.
Type of Security Incident Security System
Performance Cost
91 A3 B4 D1
686,933 Bomb introduced by person on foot 80% 40% 75% Car Bomb 85% 40% 75% Truck bomb 85% 40% 80% Biological agent attack on terminal - on foot 80% 40% 75% Biological agent attack on terminal - by vehicle 85% 40% 75% Mining of port infrastructure 0% 40% 50% Vessel attacked by a suicide boat 0% 0% 50%
92 A3 B4 D2
3,181,259

213
Bomb introduced by person on foot 80% 40% 95% Car Bomb 85% 40% 95% Truck bomb 85% 40% 80% Biological agent attack on terminal - on foot 80% 40% 95% Biological agent attack on terminal - by vehicle 85% 40% 90% Mining of port infrastructure 0% 40% 80% Vessel attacked by a suicide boat 0% 0% 80%
93 A3 B4 D3
476,472 Bomb introduced by person on foot 80% 40% 70% Car Bomb 85% 40% 75% Truck bomb 85% 40% 70% Biological agent attack on terminal - on foot 80% 40% 70% Biological agent attack on terminal - by vehicle 85% 40% 75% Mining of port infrastructure 0% 40% 0% Vessel attacked by a suicide boat 0% 0% 0%
94 A3 B4 D4
1,212,604 Bomb introduced by person on foot 80% 40% 40% Car Bomb 85% 40% 0% Truck bomb 85% 40% 0% Biological agent attack on terminal - on foot 80% 40% 40% Biological agent attack on terminal - by vehicle 85% 40% 0% Mining of port infrastructure 0% 40% 40% Vessel attacked by a suicide boat 0% 0% 20%
95 A3 B4 D5
877,934 Bomb introduced by person on foot 80% 40% 0% Car Bomb 85% 40% 0% Truck bomb 85% 40% 0% Biological agent attack on terminal - on foot 80% 40% 0% Biological agent attack on terminal - by vehicle 85% 40% 0% Mining of port infrastructure 0% 40% 50% Vessel attacked by a suicide boat 0% 0% 20%
96 A3 B4 D6
774,711 Bomb introduced by person on foot 80% 40% 80% Car Bomb 85% 40% 0% Truck bomb 85% 40% 0% Biological agent attack on terminal - on foot 80% 40% 80% Biological agent attack on terminal - by vehicle 85% 40% 0% Mining of port infrastructure 0% 40% 80% Vessel attacked by a suicide boat 0% 0% 50%

214
Portfolio No.
Type of Security Incident Security System
Performance Cost
97 A3 B5 D1
758,733 Bomb introduced by person on foot 80% 80% 75% Car Bomb 85% 80% 75% Truck bomb 85% 80% 80% Biological agent attack on terminal - on foot 80% 80% 75% Biological agent attack on terminal - by vehicle 85% 80% 75% Mining of port infrastructure 0% 0% 50% Vessel attacked by a suicide boat 0% 0% 50%
98 A3 B5 D2
3,253,059 Bomb introduced by person on foot 80% 80% 95% Car Bomb 85% 80% 95% Truck bomb 85% 80% 80% Biological agent attack on terminal - on foot 80% 80% 95% Biological agent attack on terminal - by vehicle 85% 80% 90% Mining of port infrastructure 0% 0% 80% Vessel attacked by a suicide boat 0% 0% 80%
99 A3 B5 D3
548,272 Bomb introduced by person on foot 80% 80% 70% Car Bomb 85% 80% 75% Truck bomb 85% 80% 70% Biological agent attack on terminal - on foot 80% 80% 70% Biological agent attack on terminal - by vehicle 85% 80% 75% Mining of port infrastructure 0% 0% 0% Vessel attacked by a suicide boat 0% 0% 0%
100 A3 B5 D4
1,284,404 Bomb introduced by person on foot 80% 80% 40% Car Bomb 85% 80% 0% Truck bomb 85% 80% 0% Biological agent attack on terminal - on foot 80% 80% 40% Biological agent attack on terminal - by vehicle 85% 80% 0% Mining of port infrastructure 0% 0% 40% Vessel attacked by a suicide boat 0% 0% 20%
101 A3 B5 D5
949,734 Bomb introduced by person on foot 80% 80% 0% Car Bomb 85% 80% 0% Truck bomb 85% 80% 0% Biological agent attack on terminal - on foot 80% 80% 0% Biological agent attack on terminal - by vehicle 85% 80% 0% Mining of port infrastructure 0% 0% 50%
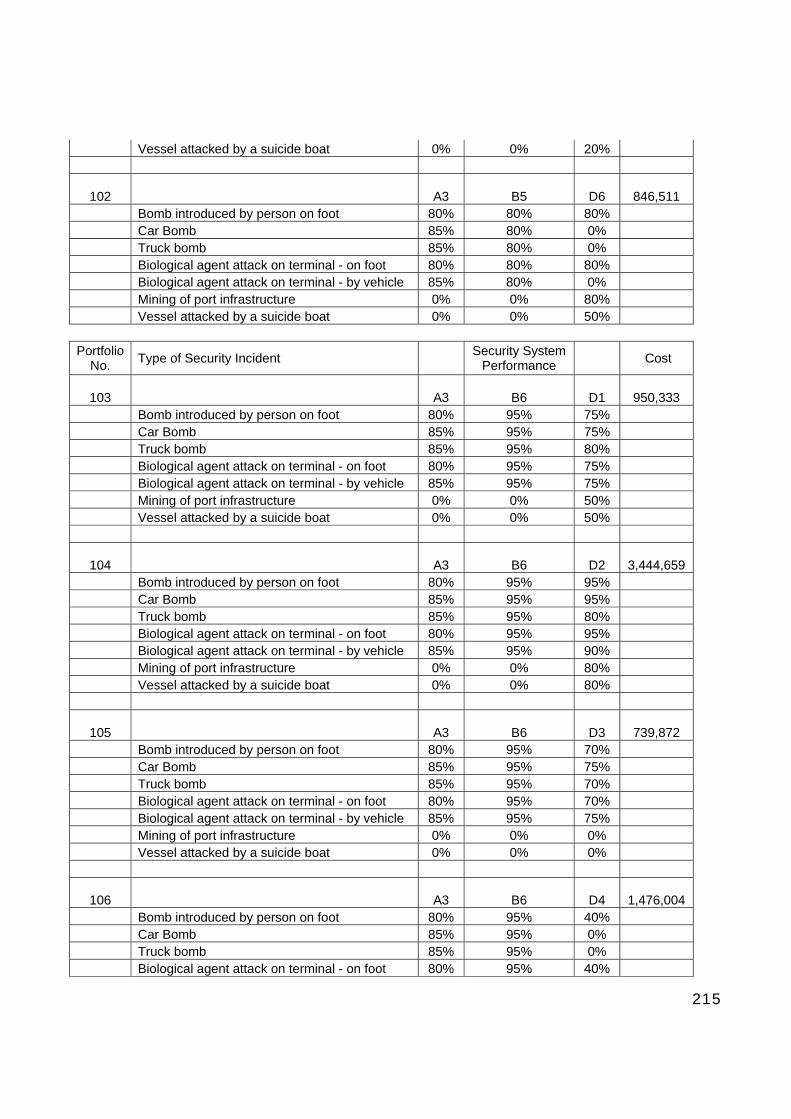
215
Vessel attacked by a suicide boat 0% 0% 20%
102 A3 B5 D6
846,511 Bomb introduced by person on foot 80% 80% 80% Car Bomb 85% 80% 0% Truck bomb 85% 80% 0% Biological agent attack on terminal - on foot 80% 80% 80% Biological agent attack on terminal - by vehicle 85% 80% 0% Mining of port infrastructure 0% 0% 80% Vessel attacked by a suicide boat 0% 0% 50%
Portfolio No.
Type of Security Incident Security System
Performance Cost
103 A3 B6 D1
950,333 Bomb introduced by person on foot 80% 95% 75% Car Bomb 85% 95% 75% Truck bomb 85% 95% 80% Biological agent attack on terminal - on foot 80% 95% 75% Biological agent attack on terminal - by vehicle 85% 95% 75% Mining of port infrastructure 0% 0% 50% Vessel attacked by a suicide boat 0% 0% 50%
104 A3 B6 D2
3,444,659 Bomb introduced by person on foot 80% 95% 95% Car Bomb 85% 95% 95% Truck bomb 85% 95% 80% Biological agent attack on terminal - on foot 80% 95% 95% Biological agent attack on terminal - by vehicle 85% 95% 90% Mining of port infrastructure 0% 0% 80% Vessel attacked by a suicide boat 0% 0% 80%
105 A3 B6 D3
739,872 Bomb introduced by person on foot 80% 95% 70% Car Bomb 85% 95% 75% Truck bomb 85% 95% 70% Biological agent attack on terminal - on foot 80% 95% 70% Biological agent attack on terminal - by vehicle 85% 95% 75% Mining of port infrastructure 0% 0% 0% Vessel attacked by a suicide boat 0% 0% 0%
106 A3 B6 D4
1,476,004 Bomb introduced by person on foot 80% 95% 40% Car Bomb 85% 95% 0% Truck bomb 85% 95% 0% Biological agent attack on terminal - on foot 80% 95% 40%

216
Biological agent attack on terminal - by vehicle 85% 95% 0% Mining of port infrastructure 0% 0% 40% Vessel attacked by a suicide boat 0% 0% 20%
107 A3 B6 D5
1,141,334 Bomb introduced by person on foot 80% 95% 0% Car Bomb 85% 95% 0% Truck bomb 85% 95% 0% Biological agent attack on terminal - on foot 80% 95% 0% Biological agent attack on terminal - by vehicle 85% 95% 0% Mining of port infrastructure 0% 0% 50% Vessel attacked by a suicide boat 0% 0% 20%
108 A3 B6 D6
1,038,111 Bomb introduced by person on foot 80% 95% 80% Car Bomb 85% 95% 0% Truck bomb 85% 95% 0% Biological agent attack on terminal - on foot 80% 95% 80% Biological agent attack on terminal - by vehicle 85% 95% 0% Mining of port infrastructure 0% 0% 80% Vessel attacked by a suicide boat 0% 0% 50%
Portfolio No.
Type of Security Incident Security System
Performance Cost
109 A4 B1 D1
1,125,366 Bomb introduced by person on foot 20% 90% 75% Car Bomb 20% 90% 75% Truck bomb 20% 85% 80% Biological agent attack on terminal - on foot 20% 90% 75% Biological agent attack on terminal - by vehicle 20% 90% 75% Mining of port infrastructure 20% 0% 50% Vessel attacked by a suicide boat 40% 0% 50%
110 A4 B1 D2
3,619,692 Bomb introduced by person on foot 20% 90% 95% Car Bomb 20% 90% 95% Truck bomb 20% 85% 80% Biological agent attack on terminal - on foot 20% 90% 95% Biological agent attack on terminal - by vehicle 20% 90% 90% Mining of port infrastructure 20% 0% 80% Vessel attacked by a suicide boat 40% 0% 80%
111 A4 B1 D3
914,905 Bomb introduced by person on foot 20% 90% 70% Car Bomb 20% 90% 75%

217
Truck bomb 20% 85% 70% Biological agent attack on terminal - on foot 20% 90% 70% Biological agent attack on terminal - by vehicle 20% 90% 75% Mining of port infrastructure 20% 0% 0% Vessel attacked by a suicide boat 40% 0% 0%
112 A4 B1 D4
1,651,037 Bomb introduced by person on foot 20% 90% 40% Car Bomb 20% 90% 0% Truck bomb 20% 85% 0% Biological agent attack on terminal - on foot 20% 90% 40% Biological agent attack on terminal - by vehicle 20% 90% 0% Mining of port infrastructure 20% 0% 40% Vessel attacked by a suicide boat 40% 0% 20%
113 A4 B1 D5
1,316,367 Bomb introduced by person on foot 20% 90% 0% Car Bomb 20% 90% 0% Truck bomb 20% 85% 0% Biological agent attack on terminal - on foot 20% 90% 0% Biological agent attack on terminal - by vehicle 20% 90% 0% Mining of port infrastructure 20% 0% 50% Vessel attacked by a suicide boat 40% 0% 20%
114 A4 B1 D6
1,213,144 Bomb introduced by person on foot 20% 90% 80% Car Bomb 20% 90% 0% Truck bomb 20% 85% 0% Biological agent attack on terminal - on foot 20% 90% 80% Biological agent attack on terminal - by vehicle 20% 90% 0% Mining of port infrastructure 20% 0% 80% Vessel attacked by a suicide boat 40% 0% 50%
Portfolio No.
Type of Security Incident Security System
Performance Cost
115 A4 B2 D1
1,099,729 Bomb introduced by person on foot 20% 90% 75% Car Bomb 20% 90% 75% Truck bomb 20% 85% 80% Biological agent attack on terminal - on foot 20% 90% 75% Biological agent attack on terminal - by vehicle 20% 90% 75% Mining of port infrastructure 20% 0% 50% Vessel attacked by a suicide boat 40% 0% 50%
116 A4 B2 D2
3,594,055

218
Bomb introduced by person on foot 20% 90% 95% Car Bomb 20% 90% 95% Truck bomb 20% 85% 80% Biological agent attack on terminal - on foot 20% 90% 95% Biological agent attack on terminal - by vehicle 20% 90% 90% Mining of port infrastructure 20% 0% 80% Vessel attacked by a suicide boat 40% 0% 80%
117 A4 B2 D3
889,268 Bomb introduced by person on foot 20% 90% 70% Car Bomb 20% 90% 75% Truck bomb 20% 85% 70% Biological agent attack on terminal - on foot 20% 90% 70% Biological agent attack on terminal - by vehicle 20% 90% 75% Mining of port infrastructure 20% 0% 0% Vessel attacked by a suicide boat 40% 0% 0%
118 A4 B2 D4
1,625,400 Bomb introduced by person on foot 20% 90% 40% Car Bomb 20% 90% 0% Truck bomb 20% 85% 0% Biological agent attack on terminal - on foot 20% 90% 40% Biological agent attack on terminal - by vehicle 20% 90% 0% Mining of port infrastructure 20% 0% 40% Vessel attacked by a suicide boat 40% 0% 20%
119 A4 B2 D5
1,290,730 Bomb introduced by person on foot 20% 90% 0% Car Bomb 20% 90% 0% Truck bomb 20% 85% 0% Biological agent attack on terminal - on foot 20% 90% 0% Biological agent attack on terminal - by vehicle 20% 90% 0% Mining of port infrastructure 20% 0% 50% Vessel attacked by a suicide boat 40% 0% 20%
120 A4 B2 D6
1,187,507 Bomb introduced by person on foot 20% 90% 80% Car Bomb 20% 90% 0% Truck bomb 20% 85% 0% Biological agent attack on terminal - on foot 20% 90% 80% Biological agent attack on terminal - by vehicle 20% 90% 0% Mining of port infrastructure 20% 0% 80% Vessel attacked by a suicide boat 40% 0% 50%

219
Portfolio No.
Type of Security Incident Security System
Performance Cost
121 A4 B3 D1
1,094,409 Bomb introduced by person on foot 20% 90% 75% Car Bomb 20% 95% 75% Truck bomb 20% 95% 80% Biological agent attack on terminal - on foot 20% 90% 75% Biological agent attack on terminal - by vehicle 20% 95% 75% Mining of port infrastructure 20% 0% 50% Vessel attacked by a suicide boat 40% 0% 50%
122 A4 B3 D2
3,588,735 Bomb introduced by person on foot 20% 90% 95% Car Bomb 20% 95% 95% Truck bomb 20% 95% 80% Biological agent attack on terminal - on foot 20% 90% 95% Biological agent attack on terminal - by vehicle 20% 95% 90% Mining of port infrastructure 20% 0% 80% Vessel attacked by a suicide boat 40% 0% 80%
123 A4 B3 D3
883,948 Bomb introduced by person on foot 20% 90% 70% Car Bomb 20% 95% 75% Truck bomb 20% 95% 70% Biological agent attack on terminal - on foot 20% 90% 70% Biological agent attack on terminal - by vehicle 20% 95% 75% Mining of port infrastructure 20% 0% 0% Vessel attacked by a suicide boat 40% 0% 0%
124 A4 B3 D4
1,620,080 Bomb introduced by person on foot 20% 90% 40% Car Bomb 20% 95% 0% Truck bomb 20% 95% 0% Biological agent attack on terminal - on foot 20% 90% 40% Biological agent attack on terminal - by vehicle 20% 95% 0% Mining of port infrastructure 20% 0% 40% Vessel attacked by a suicide boat 40% 0% 20%
125 A4 B3 D5
1,285,410 Bomb introduced by person on foot 20% 90% 0% Car Bomb 20% 95% 0% Truck bomb 20% 95% 0% Biological agent attack on terminal - on foot 20% 90% 0% Biological agent attack on terminal - by vehicle 20% 95% 0% Mining of port infrastructure 20% 0% 50%

220
Vessel attacked by a suicide boat 40% 0% 20%
126 A4 B3 D6
1,182,187 Bomb introduced by person on foot 20% 90% 80% Car Bomb 20% 95% 0% Truck bomb 20% 95% 0% Biological agent attack on terminal - on foot 20% 90% 80% Biological agent attack on terminal - by vehicle 20% 95% 0% Mining of port infrastructure 20% 0% 80% Vessel attacked by a suicide boat 40% 0% 50%
Portfolio No.
Type of Security Incident Security System
Performance Cost
127 A4 B4 D1
1,103,929 Bomb introduced by person on foot 20% 40% 75% Car Bomb 20% 40% 75% Truck bomb 20% 40% 80% Biological agent attack on terminal - on foot 20% 40% 75% Biological agent attack on terminal - by vehicle 20% 40% 75% Mining of port infrastructure 20% 40% 50% Vessel attacked by a suicide boat 40% 0% 50%
128 A4 B4 D2
3,598,255 Bomb introduced by person on foot 20% 40% 95% Car Bomb 20% 40% 95% Truck bomb 20% 40% 80% Biological agent attack on terminal - on foot 20% 40% 95% Biological agent attack on terminal - by vehicle 20% 40% 90% Mining of port infrastructure 20% 40% 80% Vessel attacked by a suicide boat 40% 0% 80%
129 A4 B4 D3
893,468 Bomb introduced by person on foot 20% 40% 70% Car Bomb 20% 40% 75% Truck bomb 20% 40% 70% Biological agent attack on terminal - on foot 20% 40% 70% Biological agent attack on terminal - by vehicle 20% 40% 75% Mining of port infrastructure 20% 40% 0% Vessel attacked by a suicide boat 40% 0% 0%
130 A4 B4 D4
1,629,600 Bomb introduced by person on foot 20% 40% 40% Car Bomb 20% 40% 0% Truck bomb 20% 40% 0% Biological agent attack on terminal - on foot 20% 40% 40%
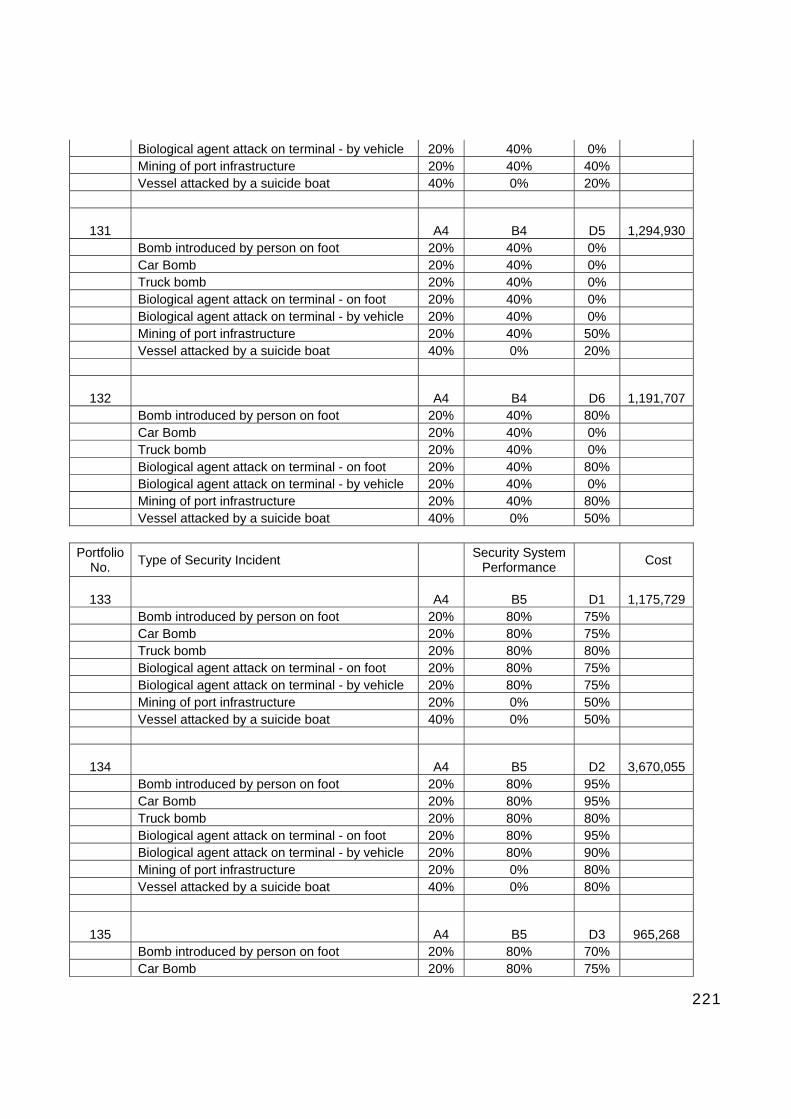
221
Biological agent attack on terminal - by vehicle 20% 40% 0% Mining of port infrastructure 20% 40% 40% Vessel attacked by a suicide boat 40% 0% 20%
131 A4 B4 D5
1,294,930 Bomb introduced by person on foot 20% 40% 0% Car Bomb 20% 40% 0% Truck bomb 20% 40% 0% Biological agent attack on terminal - on foot 20% 40% 0% Biological agent attack on terminal - by vehicle 20% 40% 0% Mining of port infrastructure 20% 40% 50% Vessel attacked by a suicide boat 40% 0% 20%
132 A4 B4 D6
1,191,707 Bomb introduced by person on foot 20% 40% 80% Car Bomb 20% 40% 0% Truck bomb 20% 40% 0% Biological agent attack on terminal - on foot 20% 40% 80% Biological agent attack on terminal - by vehicle 20% 40% 0% Mining of port infrastructure 20% 40% 80% Vessel attacked by a suicide boat 40% 0% 50%
Portfolio No.
Type of Security Incident Security System
Performance Cost
133 A4 B5 D1
1,175,729 Bomb introduced by person on foot 20% 80% 75% Car Bomb 20% 80% 75% Truck bomb 20% 80% 80% Biological agent attack on terminal - on foot 20% 80% 75% Biological agent attack on terminal - by vehicle 20% 80% 75% Mining of port infrastructure 20% 0% 50% Vessel attacked by a suicide boat 40% 0% 50%
134 A4 B5 D2
3,670,055 Bomb introduced by person on foot 20% 80% 95% Car Bomb 20% 80% 95% Truck bomb 20% 80% 80% Biological agent attack on terminal - on foot 20% 80% 95% Biological agent attack on terminal - by vehicle 20% 80% 90% Mining of port infrastructure 20% 0% 80% Vessel attacked by a suicide boat 40% 0% 80%
135 A4 B5 D3
965,268 Bomb introduced by person on foot 20% 80% 70% Car Bomb 20% 80% 75%

222
Truck bomb 20% 80% 70% Biological agent attack on terminal - on foot 20% 80% 70% Biological agent attack on terminal - by vehicle 20% 80% 75% Mining of port infrastructure 20% 0% 0% Vessel attacked by a suicide boat 40% 0% 0%
136 A4 B5 D4
1,701,400 Bomb introduced by person on foot 20% 80% 40% Car Bomb 20% 80% 0% Truck bomb 20% 80% 0% Biological agent attack on terminal - on foot 20% 80% 40% Biological agent attack on terminal - by vehicle 20% 80% 0% Mining of port infrastructure 20% 0% 40% Vessel attacked by a suicide boat 40% 0% 20%
137 A4 B5 D5
1,366,730 Bomb introduced by person on foot 20% 80% 0% Car Bomb 20% 80% 0% Truck bomb 20% 80% 0% Biological agent attack on terminal - on foot 20% 80% 0% Biological agent attack on terminal - by vehicle 20% 80% 0% Mining of port infrastructure 20% 0% 50% Vessel attacked by a suicide boat 40% 0% 20%
138 A4 B5 D6
1,263,507 Bomb introduced by person on foot 20% 80% 80% Car Bomb 20% 80% 0% Truck bomb 20% 80% 0% Biological agent attack on terminal - on foot 20% 80% 80% Biological agent attack on terminal - by vehicle 20% 80% 0% Mining of port infrastructure 20% 0% 80% Vessel attacked by a suicide boat 40% 0% 50%
Portfolio No.
Type of Security Incident Security System
Performance Cost
139 A4 B6 D1
1,367,329 Bomb introduced by person on foot 20% 95% 75% Car Bomb 20% 95% 75% Truck bomb 20% 95% 80% Biological agent attack on terminal - on foot 20% 95% 75% Biological agent attack on terminal - by vehicle 20% 95% 75% Mining of port infrastructure 20% 0% 50% Vessel attacked by a suicide boat 40% 0% 50%
140 A4 B6 D2
3,861,655

223
Bomb introduced by person on foot 20% 95% 95% Car Bomb 20% 95% 95% Truck bomb 20% 95% 80% Biological agent attack on terminal - on foot 20% 95% 95% Biological agent attack on terminal - by vehicle 20% 95% 90% Mining of port infrastructure 20% 0% 80% Vessel attacked by a suicide boat 40% 0% 80%
141 A4 B6 D3
1,156,868 Bomb introduced by person on foot 20% 95% 70% Car Bomb 20% 95% 75% Truck bomb 20% 95% 70% Biological agent attack on terminal - on foot 20% 95% 70% Biological agent attack on terminal - by vehicle 20% 95% 75% Mining of port infrastructure 20% 0% 0% Vessel attacked by a suicide boat 40% 0% 0%
142 A4 B6 D4
1,893,000 Bomb introduced by person on foot 20% 95% 40% Car Bomb 20% 95% 0% Truck bomb 20% 95% 0% Biological agent attack on terminal - on foot 20% 95% 40% Biological agent attack on terminal - by vehicle 20% 95% 0% Mining of port infrastructure 20% 0% 40% Vessel attacked by a suicide boat 40% 0% 20%
143 A4 B6 D5
1,558,330 Bomb introduced by person on foot 20% 95% 0% Car Bomb 20% 95% 0% Truck bomb 20% 95% 0% Biological agent attack on terminal - on foot 20% 95% 0% Biological agent attack on terminal - by vehicle 20% 95% 0% Mining of port infrastructure 20% 0% 50% Vessel attacked by a suicide boat 40% 0% 20%
144 A4 B6 D6
1,455,107 Bomb introduced by person on foot 20% 95% 80% Car Bomb 20% 95% 0% Truck bomb 20% 95% 0% Biological agent attack on terminal - on foot 20% 95% 80% Biological agent attack on terminal - by vehicle 20% 95% 0% Mining of port infrastructure 20% 0% 80% Vessel attacked by a suicide boat 40% 0% 50%
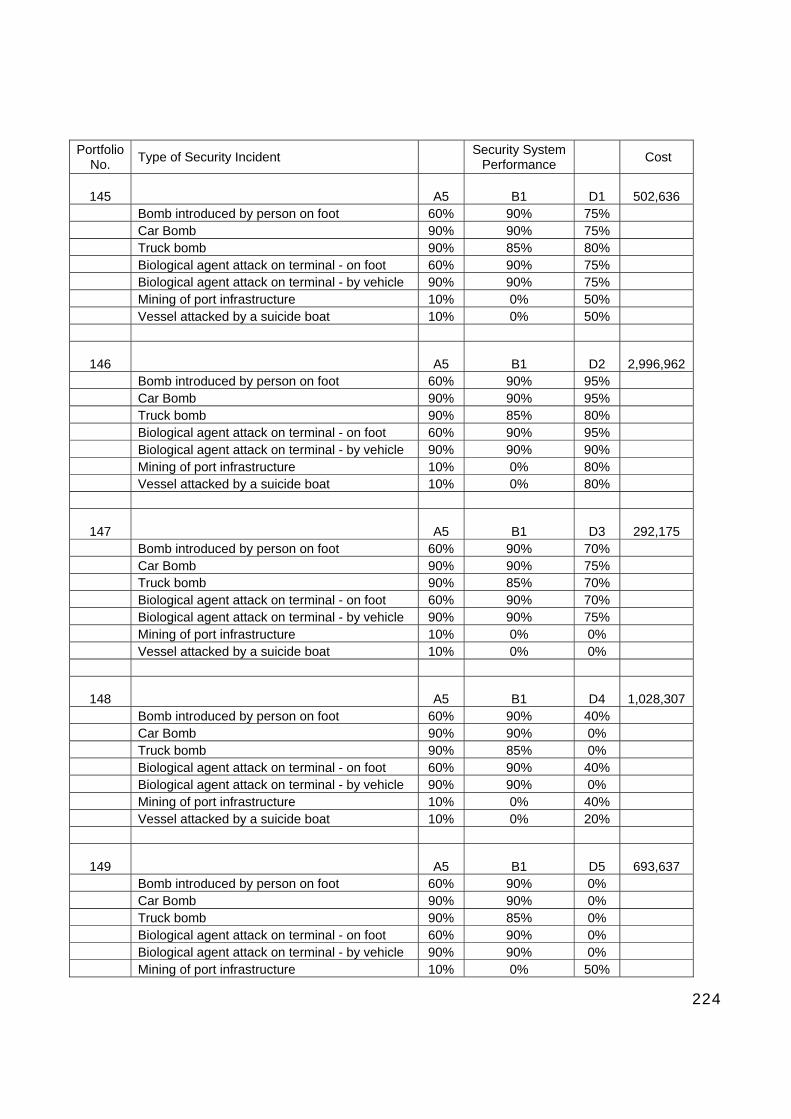
224
Portfolio No.
Type of Security Incident Security System
Performance Cost
145 A5 B1 D1
502,636 Bomb introduced by person on foot 60% 90% 75% Car Bomb 90% 90% 75% Truck bomb 90% 85% 80% Biological agent attack on terminal - on foot 60% 90% 75% Biological agent attack on terminal - by vehicle 90% 90% 75% Mining of port infrastructure 10% 0% 50% Vessel attacked by a suicide boat 10% 0% 50%
146 A5 B1 D2
2,996,962 Bomb introduced by person on foot 60% 90% 95% Car Bomb 90% 90% 95% Truck bomb 90% 85% 80% Biological agent attack on terminal - on foot 60% 90% 95% Biological agent attack on terminal - by vehicle 90% 90% 90% Mining of port infrastructure 10% 0% 80% Vessel attacked by a suicide boat 10% 0% 80%
147 A5 B1 D3
292,175 Bomb introduced by person on foot 60% 90% 70% Car Bomb 90% 90% 75% Truck bomb 90% 85% 70% Biological agent attack on terminal - on foot 60% 90% 70% Biological agent attack on terminal - by vehicle 90% 90% 75% Mining of port infrastructure 10% 0% 0% Vessel attacked by a suicide boat 10% 0% 0%
148 A5 B1 D4
1,028,307 Bomb introduced by person on foot 60% 90% 40% Car Bomb 90% 90% 0% Truck bomb 90% 85% 0% Biological agent attack on terminal - on foot 60% 90% 40% Biological agent attack on terminal - by vehicle 90% 90% 0% Mining of port infrastructure 10% 0% 40% Vessel attacked by a suicide boat 10% 0% 20%
149 A5 B1 D5
693,637 Bomb introduced by person on foot 60% 90% 0% Car Bomb 90% 90% 0% Truck bomb 90% 85% 0% Biological agent attack on terminal - on foot 60% 90% 0% Biological agent attack on terminal - by vehicle 90% 90% 0% Mining of port infrastructure 10% 0% 50%

225
Vessel attacked by a suicide boat 10% 0% 20%
150 A5 B1 D6
590,414 Bomb introduced by person on foot 60% 90% 80% Car Bomb 90% 90% 0% Truck bomb 90% 85% 0% Biological agent attack on terminal - on foot 60% 90% 80% Biological agent attack on terminal - by vehicle 90% 90% 0% Mining of port infrastructure 10% 0% 80% Vessel attacked by a suicide boat 10% 0% 50%
Portfolio No.
Type of Security Incident Security System
Performance Cost
151 A5 B2 D1
476,999 Bomb introduced by person on foot 60% 90% 75% Car Bomb 90% 90% 75% Truck bomb 90% 85% 80% Biological agent attack on terminal - on foot 60% 90% 75% Biological agent attack on terminal - by vehicle 90% 90% 75% Mining of port infrastructure 10% 0% 50% Vessel attacked by a suicide boat 10% 0% 50%
152 A5 B2 D2
2,971,325 Bomb introduced by person on foot 60% 90% 95% Car Bomb 90% 90% 95% Truck bomb 90% 85% 80% Biological agent attack on terminal - on foot 60% 90% 95% Biological agent attack on terminal - by vehicle 90% 90% 90% Mining of port infrastructure 10% 0% 80% Vessel attacked by a suicide boat 10% 0% 80%
153 A5 B2 D3
266,538 Bomb introduced by person on foot 60% 90% 70% Car Bomb 90% 90% 75% Truck bomb 90% 85% 70% Biological agent attack on terminal - on foot 60% 90% 70% Biological agent attack on terminal - by vehicle 90% 90% 75% Mining of port infrastructure 10% 0% 0% Vessel attacked by a suicide boat 10% 0% 0%
154 A5 B2 D4
1,002,670 Bomb introduced by person on foot 60% 90% 40% Car Bomb 90% 90% 0% Truck bomb 90% 85% 0% Biological agent attack on terminal - on foot 60% 90% 40%

226
Biological agent attack on terminal - by vehicle 90% 90% 0% Mining of port infrastructure 10% 0% 40% Vessel attacked by a suicide boat 10% 0% 20%
155 A5 B2 D5
668,000 Bomb introduced by person on foot 60% 90% 0% Car Bomb 90% 90% 0% Truck bomb 90% 85% 0% Biological agent attack on terminal - on foot 60% 90% 0% Biological agent attack on terminal - by vehicle 90% 90% 0% Mining of port infrastructure 10% 0% 50% Vessel attacked by a suicide boat 10% 0% 20%
156 A5 B2 D6
564,777 Bomb introduced by person on foot 60% 90% 80% Car Bomb 90% 90% 0% Truck bomb 90% 85% 0% Biological agent attack on terminal - on foot 60% 90% 80% Biological agent attack on terminal - by vehicle 90% 90% 0% Mining of port infrastructure 10% 0% 80% Vessel attacked by a suicide boat 10% 0% 50%
Portfolio No.
Type of Security Incident Security System
Performance Cost
157 A5 B3 D1
471,679 Bomb introduced by person on foot 60% 90% 75% Car Bomb 90% 95% 75% Truck bomb 90% 95% 80% Biological agent attack on terminal - on foot 60% 90% 75% Biological agent attack on terminal - by vehicle 90% 95% 75% Mining of port infrastructure 10% 0% 50% Vessel attacked by a suicide boat 10% 0% 50%
158 A5 B3 D2
2,966,005 Bomb introduced by person on foot 60% 90% 95% Car Bomb 90% 95% 95% Truck bomb 90% 95% 80% Biological agent attack on terminal - on foot 60% 90% 95% Biological agent attack on terminal - by vehicle 90% 95% 90% Mining of port infrastructure 10% 0% 80% Vessel attacked by a suicide boat 10% 0% 80%
159 A5 B3 D3
261,218 Bomb introduced by person on foot 60% 90% 70% Car Bomb 90% 95% 75%

227
Truck bomb 90% 95% 70% Biological agent attack on terminal - on foot 60% 90% 70% Biological agent attack on terminal - by vehicle 90% 95% 75% Mining of port infrastructure 10% 0% 0% Vessel attacked by a suicide boat 10% 0% 0%
160 A5 B3 D4
997,350 Bomb introduced by person on foot 60% 90% 40% Car Bomb 90% 95% 0% Truck bomb 90% 95% 0% Biological agent attack on terminal - on foot 60% 90% 40% Biological agent attack on terminal - by vehicle 90% 95% 0% Mining of port infrastructure 10% 0% 40% Vessel attacked by a suicide boat 10% 0% 20%
161 A5 B3 D5
662,680 Bomb introduced by person on foot 60% 90% 0% Car Bomb 90% 95% 0% Truck bomb 90% 95% 0% Biological agent attack on terminal - on foot 60% 90% 0% Biological agent attack on terminal - by vehicle 90% 95% 0% Mining of port infrastructure 10% 0% 50% Vessel attacked by a suicide boat 10% 0% 20%
162 A5 B3 D6
559,457 Bomb introduced by person on foot 60% 90% 80% Car Bomb 90% 95% 0% Truck bomb 90% 95% 0% Biological agent attack on terminal - on foot 60% 90% 80% Biological agent attack on terminal - by vehicle 90% 95% 0% Mining of port infrastructure 10% 0% 80% Vessel attacked by a suicide boat 10% 0% 50%
Portfolio No.
Type of Security Incident Security System
Performance Cost
163 A5 B4 D1
481,199 Bomb introduced by person on foot 60% 40% 75% Car Bomb 90% 40% 75% Truck bomb 90% 40% 80% Biological agent attack on terminal - on foot 60% 40% 75% Biological agent attack on terminal - by vehicle 90% 40% 75% Mining of port infrastructure 10% 40% 50% Vessel attacked by a suicide boat 10% 0% 50%
164 A5 B4 D2
2,975,525

228
Bomb introduced by person on foot 60% 40% 95% Car Bomb 90% 40% 95% Truck bomb 90% 40% 80% Biological agent attack on terminal - on foot 60% 40% 95% Biological agent attack on terminal - by vehicle 90% 40% 90% Mining of port infrastructure 10% 40% 80% Vessel attacked by a suicide boat 10% 0% 80%
165 A5 B4 D3
270,738 Bomb introduced by person on foot 60% 40% 70% Car Bomb 90% 40% 75% Truck bomb 90% 40% 70% Biological agent attack on terminal - on foot 60% 40% 70% Biological agent attack on terminal - by vehicle 90% 40% 75% Mining of port infrastructure 10% 40% 0% Vessel attacked by a suicide boat 10% 0% 0%
166 A5 B4 D4
1,006,870 Bomb introduced by person on foot 60% 40% 40% Car Bomb 90% 40% 0% Truck bomb 90% 40% 0% Biological agent attack on terminal - on foot 60% 40% 40% Biological agent attack on terminal - by vehicle 90% 40% 0% Mining of port infrastructure 10% 40% 40% Vessel attacked by a suicide boat 10% 0% 20%
167 A5 B4 D5
672,200 Bomb introduced by person on foot 60% 40% 0% Car Bomb 90% 40% 0% Truck bomb 90% 40% 0% Biological agent attack on terminal - on foot 60% 40% 0% Biological agent attack on terminal - by vehicle 90% 40% 0% Mining of port infrastructure 10% 40% 50% Vessel attacked by a suicide boat 10% 0% 20%
168 A5 B4 D6
568,977 Bomb introduced by person on foot 60% 40% 80% Car Bomb 90% 40% 0% Truck bomb 90% 40% 0% Biological agent attack on terminal - on foot 60% 40% 80% Biological agent attack on terminal - by vehicle 90% 40% 0% Mining of port infrastructure 10% 40% 80% Vessel attacked by a suicide boat 10% 0% 50%

229
Portfolio No.
Type of Security Incident Security System
Performance Cost
169 A5 B5 D1
552,999 Bomb introduced by person on foot 60% 80% 75% Car Bomb 90% 80% 75% Truck bomb 90% 80% 80% Biological agent attack on terminal - on foot 60% 80% 75% Biological agent attack on terminal - by vehicle 90% 80% 75% Mining of port infrastructure 10% 0% 50% Vessel attacked by a suicide boat 10% 0% 50%
170 A5 B5 D2
3,047,325 Bomb introduced by person on foot 60% 80% 95% Car Bomb 90% 80% 95% Truck bomb 90% 80% 80% Biological agent attack on terminal - on foot 60% 80% 95% Biological agent attack on terminal - by vehicle 90% 80% 90% Mining of port infrastructure 10% 0% 80% Vessel attacked by a suicide boat 10% 0% 80%
171 A5 B5 D3
342,538 Bomb introduced by person on foot 60% 80% 70% Car Bomb 90% 80% 75% Truck bomb 90% 80% 70% Biological agent attack on terminal - on foot 60% 80% 70% Biological agent attack on terminal - by vehicle 90% 80% 75% Mining of port infrastructure 10% 0% 0% Vessel attacked by a suicide boat 10% 0% 0%
172 A5 B5 D4
1,078,670 Bomb introduced by person on foot 60% 80% 40% Car Bomb 90% 80% 0% Truck bomb 90% 80% 0% Biological agent attack on terminal - on foot 60% 80% 40% Biological agent attack on terminal - by vehicle 90% 80% 0% Mining of port infrastructure 10% 0% 40% Vessel attacked by a suicide boat 10% 0% 20%
173 A5 B5 D5
744,000 Bomb introduced by person on foot 60% 80% 0% Car Bomb 90% 80% 0% Truck bomb 90% 80% 0% Biological agent attack on terminal - on foot 60% 80% 0% Biological agent attack on terminal - by vehicle 90% 80% 0% Mining of port infrastructure 10% 0% 50%

230
Vessel attacked by a suicide boat 10% 0% 20%
174 A5 B5 D6
640,777 Bomb introduced by person on foot 60% 80% 80% Car Bomb 90% 80% 0% Truck bomb 90% 80% 0% Biological agent attack on terminal - on foot 60% 80% 80% Biological agent attack on terminal - by vehicle 90% 80% 0% Mining of port infrastructure 10% 0% 80% Vessel attacked by a suicide boat 10% 0% 50%
Portfolio No.
Type of Security Incident Security System
Performance Cost
175 A5 B6 D1
744,599 Bomb introduced by person on foot 60% 95% 75% Car Bomb 90% 95% 75% Truck bomb 90% 95% 80% Biological agent attack on terminal - on foot 60% 95% 75% Biological agent attack on terminal - by vehicle 90% 95% 75% Mining of port infrastructure 10% 0% 50% Vessel attacked by a suicide boat 10% 0% 50%
176 A5 B6 D2
3,238,925 Bomb introduced by person on foot 60% 95% 95% Car Bomb 90% 95% 95% Truck bomb 90% 95% 80% Biological agent attack on terminal - on foot 60% 95% 95% Biological agent attack on terminal - by vehicle 90% 95% 90% Mining of port infrastructure 10% 0% 80% Vessel attacked by a suicide boat 10% 0% 80%
177 A5 B6 D3
534,138 Bomb introduced by person on foot 60% 95% 70% Car Bomb 90% 95% 75% Truck bomb 90% 95% 70% Biological agent attack on terminal - on foot 60% 95% 70% Biological agent attack on terminal - by vehicle 90% 95% 75% Mining of port infrastructure 10% 0% 0% Vessel attacked by a suicide boat 10% 0% 0%
178 A5 B6 D4
1,270,270 Bomb introduced by person on foot 60% 95% 40% Car Bomb 90% 95% 0% Truck bomb 90% 95% 0% Biological agent attack on terminal - on foot 60% 95% 40%
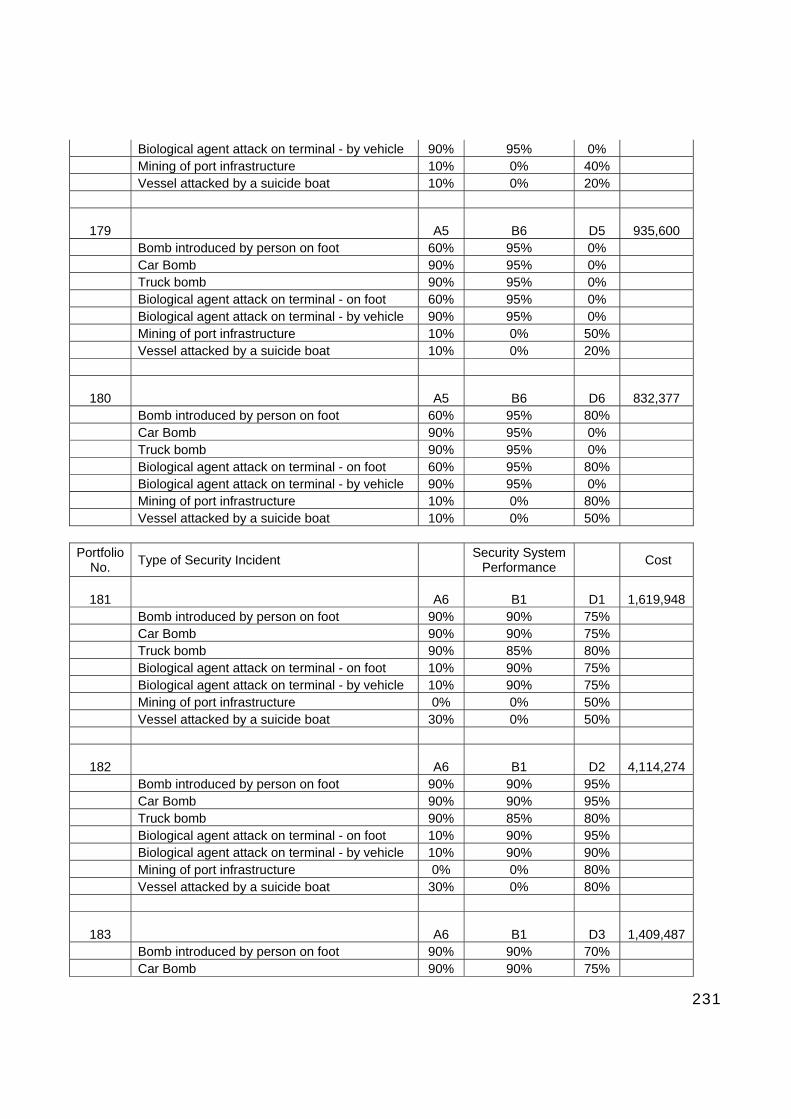
231
Biological agent attack on terminal - by vehicle 90% 95% 0% Mining of port infrastructure 10% 0% 40% Vessel attacked by a suicide boat 10% 0% 20%
179 A5 B6 D5
935,600 Bomb introduced by person on foot 60% 95% 0% Car Bomb 90% 95% 0% Truck bomb 90% 95% 0% Biological agent attack on terminal - on foot 60% 95% 0% Biological agent attack on terminal - by vehicle 90% 95% 0% Mining of port infrastructure 10% 0% 50% Vessel attacked by a suicide boat 10% 0% 20%
180 A5 B6 D6
832,377 Bomb introduced by person on foot 60% 95% 80% Car Bomb 90% 95% 0% Truck bomb 90% 95% 0% Biological agent attack on terminal - on foot 60% 95% 80% Biological agent attack on terminal - by vehicle 90% 95% 0% Mining of port infrastructure 10% 0% 80% Vessel attacked by a suicide boat 10% 0% 50%
Portfolio No.
Type of Security Incident Security System
Performance Cost
181 A6 B1 D1
1,619,948 Bomb introduced by person on foot 90% 90% 75% Car Bomb 90% 90% 75% Truck bomb 90% 85% 80% Biological agent attack on terminal - on foot 10% 90% 75% Biological agent attack on terminal - by vehicle 10% 90% 75% Mining of port infrastructure 0% 0% 50% Vessel attacked by a suicide boat 30% 0% 50%
182 A6 B1 D2
4,114,274 Bomb introduced by person on foot 90% 90% 95% Car Bomb 90% 90% 95% Truck bomb 90% 85% 80% Biological agent attack on terminal - on foot 10% 90% 95% Biological agent attack on terminal - by vehicle 10% 90% 90% Mining of port infrastructure 0% 0% 80% Vessel attacked by a suicide boat 30% 0% 80%
183 A6 B1 D3
1,409,487 Bomb introduced by person on foot 90% 90% 70% Car Bomb 90% 90% 75%

232
Truck bomb 90% 85% 70% Biological agent attack on terminal - on foot 10% 90% 70% Biological agent attack on terminal - by vehicle 10% 90% 75% Mining of port infrastructure 0% 0% 0% Vessel attacked by a suicide boat 30% 0% 0%
184 A6 B1 D4
2,145,619 Bomb introduced by person on foot 90% 90% 40% Car Bomb 90% 90% 0% Truck bomb 90% 85% 0% Biological agent attack on terminal - on foot 10% 90% 40% Biological agent attack on terminal - by vehicle 10% 90% 0% Mining of port infrastructure 0% 0% 40% Vessel attacked by a suicide boat 30% 0% 20%
185 A6 B1 D5
1,810,949 Bomb introduced by person on foot 90% 90% 0% Car Bomb 90% 90% 0% Truck bomb 90% 85% 0% Biological agent attack on terminal - on foot 10% 90% 0% Biological agent attack on terminal - by vehicle 10% 90% 0% Mining of port infrastructure 0% 0% 50% Vessel attacked by a suicide boat 30% 0% 20%
186 A6 B1 D6
1,707,726 Bomb introduced by person on foot 90% 90% 80% Car Bomb 90% 90% 0% Truck bomb 90% 85% 0% Biological agent attack on terminal - on foot 10% 90% 80% Biological agent attack on terminal - by vehicle 10% 90% 0% Mining of port infrastructure 0% 0% 80% Vessel attacked by a suicide boat 30% 0% 50%
Portfolio No.
Type of Security Incident Security System
Performance Cost
187 A6 B2 D1
1,594,311 Bomb introduced by person on foot 90% 90% 75% Car Bomb 90% 90% 75% Truck bomb 90% 85% 80% Biological agent attack on terminal - on foot 10% 90% 75% Biological agent attack on terminal - by vehicle 10% 90% 75% Mining of port infrastructure 0% 0% 50% Vessel attacked by a suicide boat 30% 0% 50%
188 A6 B2 D2
4,088,637

233
Bomb introduced by person on foot 90% 90% 95% Car Bomb 90% 90% 95% Truck bomb 90% 85% 80% Biological agent attack on terminal - on foot 10% 90% 95% Biological agent attack on terminal - by vehicle 10% 90% 90% Mining of port infrastructure 0% 0% 80% Vessel attacked by a suicide boat 30% 0% 80%
189 A6 B2 D3
1,383,850 Bomb introduced by person on foot 90% 90% 70% Car Bomb 90% 90% 75% Truck bomb 90% 85% 70% Biological agent attack on terminal - on foot 10% 90% 70% Biological agent attack on terminal - by vehicle 10% 90% 75% Mining of port infrastructure 0% 0% 0% Vessel attacked by a suicide boat 30% 0% 0%
190 A6 B2 D4
2,119,982 Bomb introduced by person on foot 90% 90% 40% Car Bomb 90% 90% 0% Truck bomb 90% 85% 0% Biological agent attack on terminal - on foot 10% 90% 40% Biological agent attack on terminal - by vehicle 10% 90% 0% Mining of port infrastructure 0% 0% 40% Vessel attacked by a suicide boat 30% 0% 20%
191 A6 B2 D5
1,785,312 Bomb introduced by person on foot 90% 90% 0% Car Bomb 90% 90% 0% Truck bomb 90% 85% 0% Biological agent attack on terminal - on foot 10% 90% 0% Biological agent attack on terminal - by vehicle 10% 90% 0% Mining of port infrastructure 0% 0% 50% Vessel attacked by a suicide boat 30% 0% 20%
192 A6 B2 D6
1,682,089 Bomb introduced by person on foot 90% 90% 80% Car Bomb 90% 90% 0% Truck bomb 90% 85% 0% Biological agent attack on terminal - on foot 10% 90% 80% Biological agent attack on terminal - by vehicle 10% 90% 0% Mining of port infrastructure 0% 0% 80% Vessel attacked by a suicide boat 30% 0% 50%

234
Portfolio No.
Type of Security Incident Security System
Performance Cost
193 A6 B3 D1
1,588,991 Bomb introduced by person on foot 90% 90% 75% Car Bomb 90% 95% 75% Truck bomb 90% 95% 80% Biological agent attack on terminal - on foot 10% 90% 75% Biological agent attack on terminal - by vehicle 10% 95% 75% Mining of port infrastructure 0% 0% 50% Vessel attacked by a suicide boat 30% 0% 50%
194 A6 B3 D2
4,083,317 Bomb introduced by person on foot 90% 90% 95% Car Bomb 90% 95% 95% Truck bomb 90% 95% 80% Biological agent attack on terminal - on foot 10% 90% 95% Biological agent attack on terminal - by vehicle 10% 95% 90% Mining of port infrastructure 0% 0% 80% Vessel attacked by a suicide boat 30% 0% 80%
195 A6 B3 D3
1,378,530 Bomb introduced by person on foot 90% 90% 70% Car Bomb 90% 95% 75% Truck bomb 90% 95% 70% Biological agent attack on terminal - on foot 10% 90% 70% Biological agent attack on terminal - by vehicle 10% 95% 75% Mining of port infrastructure 0% 0% 0% Vessel attacked by a suicide boat 30% 0% 0%
196 A6 B3 D4
2,114,662 Bomb introduced by person on foot 90% 90% 40% Car Bomb 90% 95% 0% Truck bomb 90% 95% 0% Biological agent attack on terminal - on foot 10% 90% 40% Biological agent attack on terminal - by vehicle 10% 95% 0% Mining of port infrastructure 0% 0% 40% Vessel attacked by a suicide boat 30% 0% 20%
197 A6 B3 D5
1,779,992 Bomb introduced by person on foot 90% 90% 0% Car Bomb 90% 95% 0% Truck bomb 90% 95% 0% Biological agent attack on terminal - on foot 10% 90% 0% Biological agent attack on terminal - by vehicle 10% 95% 0% Mining of port infrastructure 0% 0% 50%

235
Vessel attacked by a suicide boat 30% 0% 20%
198 A6 B3 D6
1,676,769 Bomb introduced by person on foot 90% 90% 80% Car Bomb 90% 95% 0% Truck bomb 90% 95% 0% Biological agent attack on terminal - on foot 10% 90% 80% Biological agent attack on terminal - by vehicle 10% 95% 0% Mining of port infrastructure 0% 0% 80% Vessel attacked by a suicide boat 30% 0% 50%
Portfolio No.
Type of Security Incident Security System
Performance Cost
199 A6 B4 D1
1,598,511 Bomb introduced by person on foot 90% 40% 75% Car Bomb 90% 40% 75% Truck bomb 90% 40% 80% Biological agent attack on terminal - on foot 10% 40% 75% Biological agent attack on terminal - by vehicle 10% 40% 75% Mining of port infrastructure 0% 40% 50% Vessel attacked by a suicide boat 30% 0% 50%
200 A6 B4 D2
4,092,837 Bomb introduced by person on foot 90% 40% 95% Car Bomb 90% 40% 95% Truck bomb 90% 40% 80% Biological agent attack on terminal - on foot 10% 40% 95% Biological agent attack on terminal - by vehicle 10% 40% 90% Mining of port infrastructure 0% 40% 80% Vessel attacked by a suicide boat 30% 0% 80%
201 A6 B4 D3
1,388,050 Bomb introduced by person on foot 90% 40% 70% Car Bomb 90% 40% 75% Truck bomb 90% 40% 70% Biological agent attack on terminal - on foot 10% 40% 70% Biological agent attack on terminal - by vehicle 10% 40% 75% Mining of port infrastructure 0% 40% 0% Vessel attacked by a suicide boat 30% 0% 0%
202 A6 B4 D4
2,124,182 Bomb introduced by person on foot 90% 40% 40% Car Bomb 90% 40% 0% Truck bomb 90% 40% 0% Biological agent attack on terminal - on foot 10% 40% 40%

236
Biological agent attack on terminal - by vehicle 10% 40% 0% Mining of port infrastructure 0% 40% 40% Vessel attacked by a suicide boat 30% 0% 20%
203 A6 B4 D5
1,789,512 Bomb introduced by person on foot 90% 40% 0% Car Bomb 90% 40% 0% Truck bomb 90% 40% 0% Biological agent attack on terminal - on foot 10% 40% 0% Biological agent attack on terminal - by vehicle 10% 40% 0% Mining of port infrastructure 0% 40% 50% Vessel attacked by a suicide boat 30% 0% 20%
204 A6 B4 D6
1,686,289 Bomb introduced by person on foot 90% 40% 80% Car Bomb 90% 40% 0% Truck bomb 90% 40% 0% Biological agent attack on terminal - on foot 10% 40% 80% Biological agent attack on terminal - by vehicle 10% 40% 0% Mining of port infrastructure 0% 40% 80% Vessel attacked by a suicide boat 30% 0% 50%
Portfolio No.
Type of Security Incident Security System
Performance Cost
205 A6 B5 D1
1,670,311 Bomb introduced by person on foot 90% 80% 75% Car Bomb 90% 80% 75% Truck bomb 90% 80% 80% Biological agent attack on terminal - on foot 10% 80% 75% Biological agent attack on terminal - by vehicle 10% 80% 75% Mining of port infrastructure 0% 0% 50% Vessel attacked by a suicide boat 30% 0% 50%
206 A6 B5 D2
4,164,637 Bomb introduced by person on foot 90% 80% 95% Car Bomb 90% 80% 95% Truck bomb 90% 80% 80% Biological agent attack on terminal - on foot 10% 80% 95% Biological agent attack on terminal - by vehicle 10% 80% 90% Mining of port infrastructure 0% 0% 80% Vessel attacked by a suicide boat 30% 0% 80%
207 A6 B5 D3
1,459,850 Bomb introduced by person on foot 90% 80% 70% Car Bomb 90% 80% 75%

237
Truck bomb 90% 80% 70% Biological agent attack on terminal - on foot 10% 80% 70% Biological agent attack on terminal - by vehicle 10% 80% 75% Mining of port infrastructure 0% 0% 0% Vessel attacked by a suicide boat 30% 0% 0%
208 A6 B5 D4
2,195,982 Bomb introduced by person on foot 90% 80% 40% Car Bomb 90% 80% 0% Truck bomb 90% 80% 0% Biological agent attack on terminal - on foot 10% 80% 40% Biological agent attack on terminal - by vehicle 10% 80% 0% Mining of port infrastructure 0% 0% 40% Vessel attacked by a suicide boat 30% 0% 20%
209 A6 B5 D5
1,861,312 Bomb introduced by person on foot 90% 80% 0% Car Bomb 90% 80% 0% Truck bomb 90% 80% 0% Biological agent attack on terminal - on foot 10% 80% 0% Biological agent attack on terminal - by vehicle 10% 80% 0% Mining of port infrastructure 0% 0% 50% Vessel attacked by a suicide boat 30% 0% 20%
210 A6 B5 D6
1,758,089 Bomb introduced by person on foot 90% 80% 80% Car Bomb 90% 80% 0% Truck bomb 90% 80% 0% Biological agent attack on terminal - on foot 10% 80% 80% Biological agent attack on terminal - by vehicle 10% 80% 0% Mining of port infrastructure 0% 0% 80% Vessel attacked by a suicide boat 30% 0% 50%
Portfolio No.
Type of Security Incident Security System
Performance Cost
211 A6 B6 D1
1,861,911 Bomb introduced by person on foot 90% 95% 75% Car Bomb 90% 95% 75% Truck bomb 90% 95% 80% Biological agent attack on terminal - on foot 10% 95% 75% Biological agent attack on terminal - by vehicle 10% 95% 75% Mining of port infrastructure 0% 0% 50% Vessel attacked by a suicide boat 30% 0% 50%
212 A6 B6 D2
4,356,237
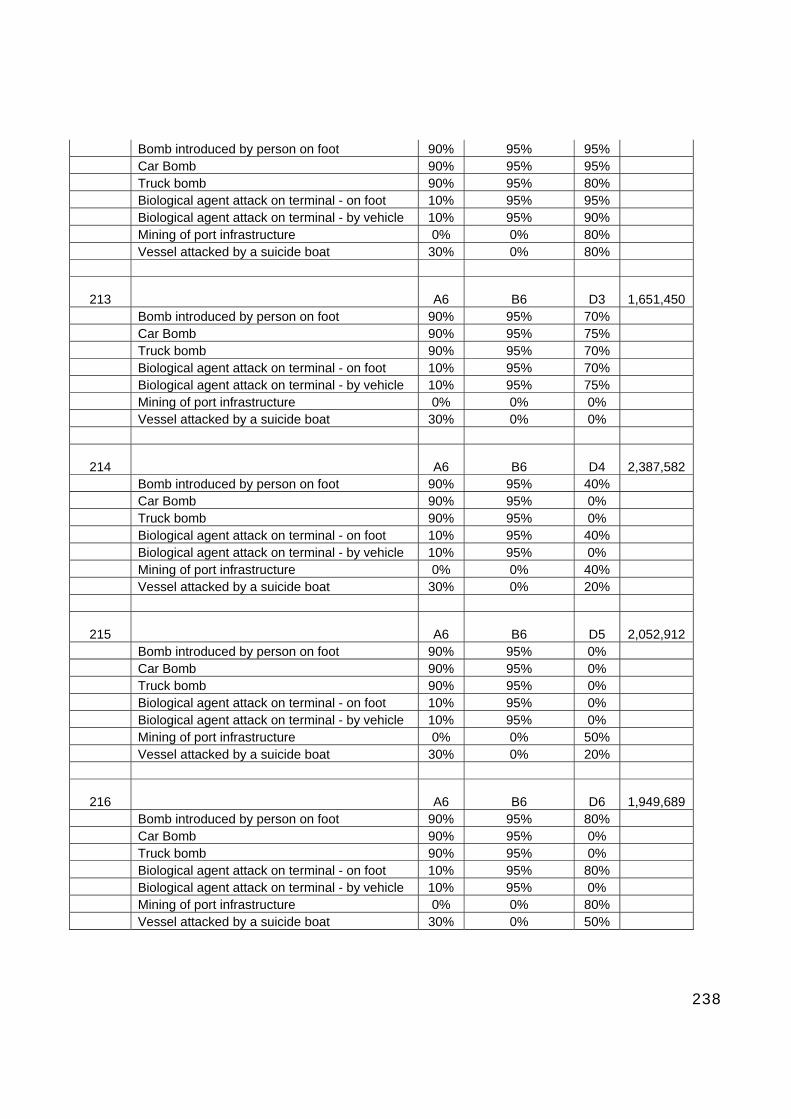
238
Bomb introduced by person on foot 90% 95% 95% Car Bomb 90% 95% 95% Truck bomb 90% 95% 80% Biological agent attack on terminal - on foot 10% 95% 95% Biological agent attack on terminal - by vehicle 10% 95% 90% Mining of port infrastructure 0% 0% 80% Vessel attacked by a suicide boat 30% 0% 80%
213 A6 B6 D3
1,651,450 Bomb introduced by person on foot 90% 95% 70% Car Bomb 90% 95% 75% Truck bomb 90% 95% 70% Biological agent attack on terminal - on foot 10% 95% 70% Biological agent attack on terminal - by vehicle 10% 95% 75% Mining of port infrastructure 0% 0% 0% Vessel attacked by a suicide boat 30% 0% 0%
214 A6 B6 D4
2,387,582 Bomb introduced by person on foot 90% 95% 40% Car Bomb 90% 95% 0% Truck bomb 90% 95% 0% Biological agent attack on terminal - on foot 10% 95% 40% Biological agent attack on terminal - by vehicle 10% 95% 0% Mining of port infrastructure 0% 0% 40% Vessel attacked by a suicide boat 30% 0% 20%
215 A6 B6 D5
2,052,912 Bomb introduced by person on foot 90% 95% 0% Car Bomb 90% 95% 0% Truck bomb 90% 95% 0% Biological agent attack on terminal - on foot 10% 95% 0% Biological agent attack on terminal - by vehicle 10% 95% 0% Mining of port infrastructure 0% 0% 50% Vessel attacked by a suicide boat 30% 0% 20%
216 A6 B6 D6
1,949,689 Bomb introduced by person on foot 90% 95% 80% Car Bomb 90% 95% 0% Truck bomb 90% 95% 0% Biological agent attack on terminal - on foot 10% 95% 80% Biological agent attack on terminal - by vehicle 10% 95% 0% Mining of port infrastructure 0% 0% 80% Vessel attacked by a suicide boat 30% 0% 50%

239
Appendix E - Transcript of interview with Russell Kennedy at Lloyd’s of London, 23 April 2009. RK: So I’m going to talk you through this and it will all make sense. The idea is that you rate each individual location on its own technical rate. So for instance let’s say you were doing….where this comes from really is from the all risks, from the property….so let’s say you’ve got a portfolio that is exposed to all risks in the States. RT: Yes RT: So that means you’ve got exposure for fire, you’ve got exposure for flood, quake and wind. So you would need to effectively price those separately. So you would need to get a price for the fire and each of those. They would come up in a model for flood, quake and wind. The fire you would rate separately on occupancy so a saw mill has a different rate to a hotel or an office building. So each one of those is rated separately, you would then add on all of your expenses on top of those rates per risk so you have a percentage of expenses to be included that you would need to charge for profit and added with profit to give you a market price. RT: So when you work back from the market price and you strip out all of those additional expenses you are looking to arrive at the technical rate so effectively the closest to a pure premium rate you can actually achieve. RK: And that is effectively based on your expected losses which is your expected probability. So that’s different to….the difficulty is when you’re rating something that is, for instance this here….I mean it may be if you were doing a port then it’s OK as you’ve got an actual set of locations. Let’s say you’re doing ABC and they have ten thousand locations. Well how do you actually rate each one of those individual locations? How do you come up with a technical rate for that? I mean it’s a difficult thing to get your head round. So what we’ve done is started off with a rate per country so I’ll just talk you through it. So let’s assume we’re writing a risk, let’s take this one. I’ll just call this up (on the computer screen) so this is….excuse my handwriting it’s terrible….This is XXX Energy Group. This is a….they’re basically underground oil storage. So they will be in and around terminals. So, we assume twenty percent brokerage, then we have all these other various expenses, then the different ULR’s that we’re writing. We would want to target Y% return on capital, which is quite ambitious. This really is about Z% over the risk-free rate of what we’re trying to target. So we then divide it by a loss ratio that we need to make over the long term. So this might be a bit confusing. There are 34 locations over 4 countries. South Africa…. RT: Yes RK: ….there’s two locations in the Congo which all around they have locations of eleven million each. Then there’s seventy five million (US Dollars) in Ashkelon, and then there’s a hundred and fifty million which is worldwide. The schedule which we have for worldwide is Belgium, Netherlands, Luxembourg, Norway, and they’ve got this a hundred and fifty million facility which fluctuates depending on how much they’ve got in different terminals.

240
RT: Sure RK: So what I did was, you put in the limits for each of those, and each one of those will have a different limit RT: So where it is on other people’s property, it’s just stocks of oil RK: Yeah RT: Alright RK: It can fluctuate over the year but that’s the maximum amount, in fact, it’s slightly misleading but because I saw the amounts they had last year, it was never anything like that but they buy that just in case. RT: Sure RK: Each one of those is then in excess of a hundred thousand (US Dollars). A straight hundred thousand, no additional deductible. So we rate per country. So, South Africa, Belgium, Israel, Congo, then we have a sector is....now that sector is divided….comprised of a set of indices that I came up with twenty occupancies from our book, divided everything we’ve written into twenty occupancies and then came up with an average rate, divided them all up with an average rate…market price for each one of those. Now that was kind of difficult. RT: So they are professional services, light industry…. RK: Energy, oil and gas, power, banking, finance….and there is....there is ports and harbours. RT: Ports and harbours. RK: Now what I did was, the reason I did that, even they are all market prices is you’re going to have so many differences in terms of security, clients, territory. What it gave me was basically a proportional spread so I could see which ones were paying more or less in comparison to each other. That’s the occupancy. So then I thought how am I going to rate per country? So I took the Exclusive Analysis rating.... RT: Would that be a minimum country rate? RK: Yes. So they give you, on their website, risk maps. So they give you a risk score for each one of these perils, effectively. So, terrorism, war, civil unrest. That’s to one decimal place between one and ten. So in my thinking, how was I going to translate that into a risk score? So, what I did was, I took the US to be the midpoint: forty percent of my risks are in the US. I had to take a midpoint somewhere, I think the US in terms of risk....I assumed a base rate for each occupancy of x%....that didn’t come out of the book for market price....I took x% to be my notional base rate...that’s....and that’s not come out of nowhere.

241
RT: Right. OK. How would you describe that base rate of x% per annum rate? RK: So. This is the key. This is where everything I’ve thought about stacks up. It’s a combination of finding...in essence what I’m doing here is trying to find a price that I can price that risk at. And the reason I took x% the average fire rate is about y%....notionally it’s a peril where you write all risks including terrorism....it makes up a part of that. RT: And your x% background rate would be unaffected by any movement in terms of how the market is moving or the dollar rate. RK: Yes, that’s right. It’s just my opinion of what I think, so for instance, energy terminals or oil and gas storage....I spoke at length with our energy underwriter, sat down with him for about three hours....he described to me, he’s got about forty years of experience, and they write terrorism within their programme....he talked me through facilities and actually how impenetrable they are, how difficult it is to have a large loss. And from that, my energy oil and gas rate for terrorism went from....was slightly above average and I took it down to being the lowest one. So it moves over time as different information.... RT: Do you include in that rate the likelihood of a particular industry being targeted? RK: I’ll come on to that. So then I have to get a country rate. I take the country rate from Exclusive Analysis rating and information. So that is effectively....on an index from one to ten at one decimal place. Most of the rates tend to hang around the one or two mark. Afghanistan is seven....obviously it’s not seven times more likely to get hit than UK, it’s multiples of that, so how do I get.... RT: It’s almost like a logarithmic scale. RK: It’s exactly what it is. So, what I did was I basically took two to the power of the index to elongate the scale, so that now gives me....with US as the midpoint....actually Afghanistan is two thousand five hundred times more likely to get hit than the US as a notional, you know, for there to be an event, whether it’s a pipe bomb or a suicide attack or a....just to give you some indication of risk. So then when you combine, times one by the other....that gives you a technical rate for the country. So it gives you a rate for the occupancy in the territory and a price. RT: So would you be able to give me country rates for these port locations? [RT hands RK list of locations] RK: Yes, of course.

242
Appendix F – Attacks on Port Facilities 1968-2007 1 June 1968 UNITED STATES, GALVESTON, TEXAS The Japanese vessel “Mikagasan Maru” was extensively damaged by a bomb allegedly placed by El Poder Cubano, a Cuban exile group. 16 September 1968 UNITED STATES, MIAMI HARBOUR El Poder Cubano terrorists fired at the Polish general cargo vessel “Polancia”. 24 January 1970 ISRAEL Al Fatah and the Popular Front for the Liberation of Palestine jointly claim credit for an explosion in an ammunition truck unloading in the docks. 19 February 1971 TURKEY, ISTANBUL A U.S. army passenger vessel was damaged by a bomb. 29 March 1972 UNITED STATES, BISCAYNE, FLORIDA A Soviet research vessel was bombed by the JCN, an anti-Castro Cuban group. 1 December 1972 CYPRUS An attempt by the Black September Organisation to hijack an Italian passenger vessel was thwarted by Coast Guard police. 4 March 1973 LEBANON The Greek charter vessel “Sanya” sank in Beirut harbor following an explosion on board. The official investigation revealed that the explosion was caused by a limpet mine. Black September Organisation claimed credit for the attack. 30 December 1973 UNITED STATES, MIAMI, FLORIDA Two bombs damaged the 573 ton “Mereghan II” while moored alongside waiting to lift cargo in Miami River docks. 2 February 1974 PAKISTAN, KARACHI Three gunmen, members of the Muslim International Guerrillas seized a Greek general cargo vessel and threatened to blow up the ship unless the Greek government free two Arab prisoners. 2 March 1974

243
FRANCE The Pierre Overnay brigade attacked the barge “Ouest France” while moored alongside the quay and firebombed 180 Renault cars. May 1974 UNITED STATES, LOS ANGELES The “Caribe Star” was sunk in the harbor by a bomb placed on board. The 120 ft former ferry had been fitted out for Arab interests. The Jewish Defense League claimed responsibility. 9 April 1974 PORTUGAL The Revolutionary Brigades attacked the Portuguese troop ship “Niassa”. The vessel’s hull was holed in two places on the waterline. 20 July 1974 IRELAND, BELFAST A bomb exploded on board the ferry “Ulster Queen”. Provisional IRA suspected after coded telephone warning to a newspaper. 16 December 1974 UNITED STATES, MIAMI A bomb exploded in the port offices of the Eastern Steamship Lines. Frente de Liberacion Nacional Cubana suspected. 9 March 1975 IRELAND, GREENCASTLE HARBOUR Over 30 incendiary devices were planted on trawlers in the harbour. Only two exploded, destroying the vessels. Ulster Defence Association suspected. 23 July 1975 JAPAN, OKINAWA A Chilean training vessel and a Kobe University vessel docked at the International Ocean Expo were attacked by terrorists using Molotov cocktails. Radical leftists suspected. 1 August 1975 ARGENTINA, SANTA FE The Montoneros and the People’s Revolutionary Army made lighting bomb strikes on the river port. 2 November 1975 PUERTO RICO, SAN JUAN Russian vessel “Maxim Gorkiy” damaged by two bomb blasts below the waterline while at anchor in the port. 28 November 1975 PUERTO RICO

244
Russian vessel “Maxim Gorkiy” hit by a second attack when a bomb was thrown onboard injuring one crew member and causing minor damage. August 1976 LEBANON The Greek vessel “Tina” was sunk by three limpet mines believed to be by members of a right wing Lebanese Christian group while the vessel was part loaded with a cargo of arms for Fatah. 16 September 1976 UNITED STATES, PORT ELIZABETH, JERSEY A Soviet cargo vessel was damaged by a limpet mine planted by an anti-Castro refugee. 23 October 1976 LEBANON Three Greek vessels “Eko”, “Riri” and “Spiro” were attacked in port with limpet mines. All vessels sank at their moorings. 22 July 1977 PERU A Cuban trawler, docked at a port near Lima was bombed and vessel sank. The International Commandos of Zone 6 of CORU claimed responsibility. 30 April 1978 PHILIPPINES The “Don Carlos” was boarded by armed members of a Muslim Separatist rebel group of the South Philippines. Cargo offloaded and passengers taken hostage. 3 October 1978 ISRAEL Israeli Navy sank a bomb laden vessel belonging to Fatah heading for Eilat with the intention of destroying the Eilat-Ashkelon pipeline and oil tank farms in the port. March-June 1979 UNITED STATES, MASSACHUSETTS Multiple bomb threats against vessels and petroleum storage site disrupt port operations. 1979 (month unknown) PORTUGAL Whaler “Sierra” rammed by “Sea Shepherd”. Perpetrators arrested by escaped – suspected to be members of Greenpeace or Fund for Animals. 9 January 1980 UNITED STATES, SACRAMENTO, CALIFORNIA Port closed for three days following threats to bomb the Soviet vessel “Nicolay Karamzin” and that the harbour had been mined.

245
16 June 1980 BELGIUM Demonstrators smashed navigational and radio equipment onboard “Andrea Smits” while loading nuclear waste for disposal in the Atlantic. 29 October 1980 ITALY, GENOA A Libyan vessel under repair almost sank following a limpet mine explosion on the waterline. Maltese National Front suspected. 2 October 1981 SPAIN, SANTANDER A powerful bomb caused a six foot hole in the hull of a destroyer moored in the port. ETA military wing suspected. 2 November 1981 FRANCE, NANTES British hydrographic survey vessel “Hecate” suffered minor explosion on the hull while docked. Divers subsequently found another bomb with 2.2 lbs of plastic explosive which had failed to explode. Irish National Liberation Army terrorists suspected. 2 January 1982 LEBANON, TRIPOLI The Lebanese-registered tanker “Babanaft” is shelled while lifting Iraqi crude in the port. Fire on deck extinguished and vessel sailed immediately. 9 March 1982 LEBANON, TYRE Lebanese general cargo vessel bombed in the port despite strict security. 16 March 1982 BRAZIL, RIO DE JANEIRO Liberian-flagged tanker “Hercules” ordered to leave after a bomb was found onboard. Outcome unknown. 16 December 1982 PHILIPPINES The ferry “Santa Lucia” was damaged while in Pagadian by an explosive device planted by the Moro National Liberation Front. 23 February 1983 IRELAND, LOUGH FOYLE A British cargo vessel was seized in an inlet by IRA and the ship was blown up. 5 August 1983 FALKLAND ISLANDS, PORT STANLEY

246
An ultra-nationalist Argentine group claimed responsibility for an explosion onboard the Danish vessel “Kraka” moored in the harbour. The vessel was unloading granite blocks to be used to build a memorial to fallen British soldiers during the Falklands War. 20 March 1984 NICARAGUA, PUERTO SANDINO Explosive device planted at port entrance which damaged a Soviet tanker. Jan-March 1984 NICARAGUA, CORINTO, BLUEFIELDS & EL BLUFF Mine laying operations in three ports caused a total of 11 ships to sink, including Soviet, Panamanian Dutch, Liberian and Nicaraguan Registered. 28 June 1984 ARGENTINA, BUENOS AIRES Two tankers, the “Perito Morena” and “Belgrano” set ablaze by the Sargento Cisneros Commandos. 25 September 1985 CYPRUS Three members of the PLO’s elite Force-17 seized an Israeli yacht on Yom Kippur and killed the three inhabitants. 7 October 1985 EGYPT The Italian cruise vessel “Achille Lauro” was seized with 511 passengers onboard by four members of the Popular Front for the Liberation of Palestine. An American passenger, Leon Klinghoffer was shot in the head and thrown overboard in his wheelchair. 30 January 1986 ITALY, MESSINA Two 135-ton Cypriot-flagged hydrofoils were bombed and sunk while docked for repairs. 14 September 1986 MOROCCO A Spanish vessel was attacked by Polisario guerrillas. 23 January 1987 MAURITANIA Panamanian bulker “Maritime King” attacked with rocket fire by Polisario guerrillas. 1 February 1987 LEBANON Egyptian vessel “Fast Carrier” damaged by two limpet mines placed on the port side. 25 March 1987 GERMANY, HAMBURG

247
Molotov cocktails thrown at British truck and trailer parked in the port. 14 February 1988 CYPRUS, LIMASSOL A ferry boat damaged by an explosion in the port. 11 July 1988 GREECE Two men preparing an explosive device to attack the vessel “City of Poros” died when the bomb went off prematurely in the port. Middle Eastern gunmen then attacked the “City of Poros” firing automatic weapons at the crowd of passengers and throwing grenades. 1 August 1988 NICARAGUA A ferryboat with a 10-person US delegation was ambushed by guerrillas in the south east of the country. 25 December 1993 ISRAEL, EILAT An Israeli vessel “Jrush Shalom” was bombed while docked in the port. 8 July 1994 ALGERIA, JIJEL GIA attackers boarded a cargo vessel moored in the port and murdered seven Italian sailors. 16 January 1995 TURKEY, TRABZON A ferry “Avraysa” hijacked in the port by Turkish-Abkhaz terrorists. April 1996 SRI LANKA, COLOMBO Van Ommeren vessel docked in the port came under mortar attack by two LTTE gunboats. Damage to accommodation block and two sailors injured. 9 August 1996 SRI LANKA, TRINCOMALEE A Philippine registered vessel was bombed under the waterline by LTTE while loading sand. 1 July 1997 SRI LANKA, JAFFNA The LTTE abducted the Indonesia crew of a ferry and blew up the ship. 7 July 1997 SRI LANKA, JAFFNA LTTE hijack “Morang Bong” and abduct 37 North Korean sailors. 1 September 1997
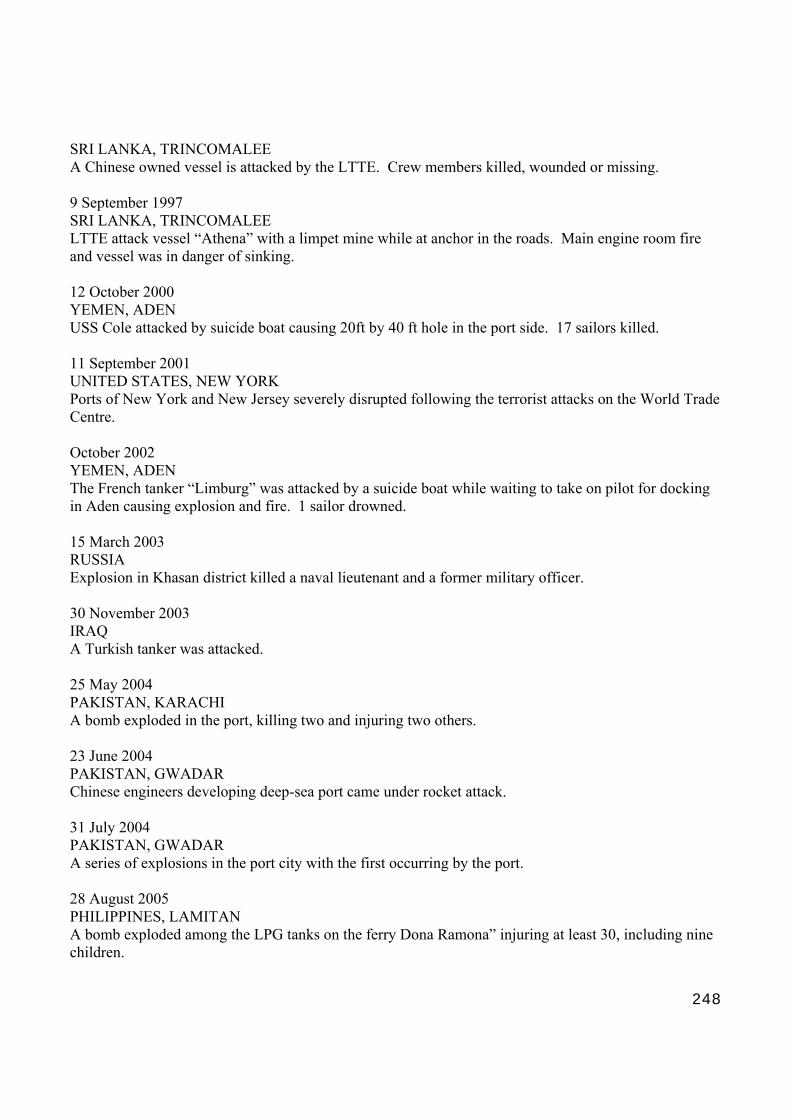
248
SRI LANKA, TRINCOMALEE A Chinese owned vessel is attacked by the LTTE. Crew members killed, wounded or missing. 9 September 1997 SRI LANKA, TRINCOMALEE LTTE attack vessel “Athena” with a limpet mine while at anchor in the roads. Main engine room fire and vessel was in danger of sinking. 12 October 2000 YEMEN, ADEN USS Cole attacked by suicide boat causing 20ft by 40 ft hole in the port side. 17 sailors killed. 11 September 2001 UNITED STATES, NEW YORK Ports of New York and New Jersey severely disrupted following the terrorist attacks on the World Trade Centre. October 2002 YEMEN, ADEN The French tanker “Limburg” was attacked by a suicide boat while waiting to take on pilot for docking in Aden causing explosion and fire. 1 sailor drowned. 15 March 2003 RUSSIA Explosion in Khasan district killed a naval lieutenant and a former military officer. 30 November 2003 IRAQ A Turkish tanker was attacked. 25 May 2004 PAKISTAN, KARACHI A bomb exploded in the port, killing two and injuring two others. 23 June 2004 PAKISTAN, GWADAR Chinese engineers developing deep-sea port came under rocket attack. 31 July 2004 PAKISTAN, GWADAR A series of explosions in the port city with the first occurring by the port. 28 August 2005 PHILIPPINES, LAMITAN A bomb exploded among the LPG tanks on the ferry Dona Ramona” injuring at least 30, including nine children.

249
13 May 2006 CORSICA, BASTIA A bomb exploded in the Bastia Maritime Authority complex. 3 March 2007 INDONESIA, AMBON A bomb exploded at the port gates in the Yos Sudarso port in Ambon. 8 September 2007 ALGERIA, DELLYS Coast Guard troops targeted by suicide truck bomber during a flag-raising ceremony.
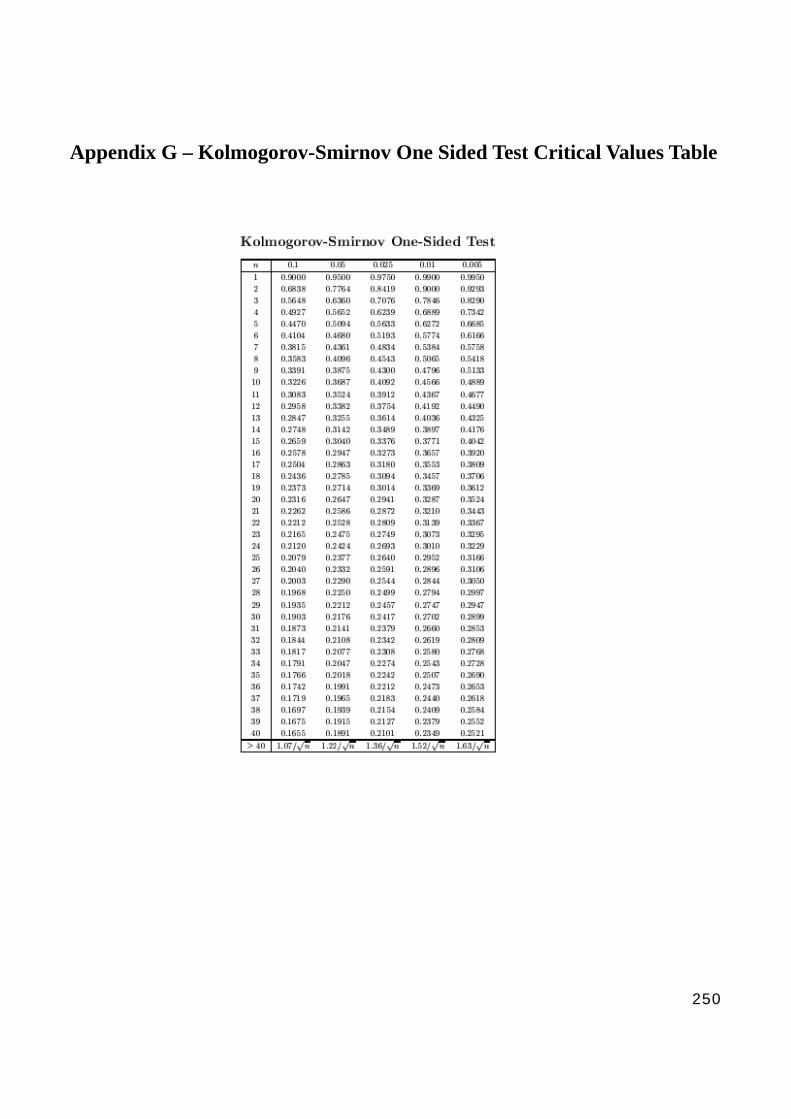
250
Appendix G – Kolmogorov-Smirnov One Sided Test Critical Values Table

251
Appendix H – Sensitivity Analysis Simulations: Cost Reduction and Performance Enhancement of Port Security Systems
Sensitivity Analysis: Costs Sensitivity Analysis: Performance Portfolio
No. Access Control Biometrics Detection Access Control
Biometrics Detection
1 -3.89% -0.70% -5.42% 102.72% 104.17% 103.11% 2 -0.63% -0.11% -9.26% 103.29% 105.04% 101.67% 3 -6.88% -1.23% -1.89% 102.27% 103.48% 104.26% 4 -1.86% -0.33% -7.81% 101.84% 102.82% 105.33% 5 -2.78% -0.50% -6.72% 101.80% 102.76% 105.44% 6 -3.29% -0.59% -6.12% 102.08% 103.18% 104.74% 7 -4.10% -0.17% -5.72% 102.72% 104.17% 103.11% 8 -0.64% -0.03% -9.34% 103.29% 105.04% 101.67% 9 -7.59% -0.32% -2.08% 102.27% 103.48% 104.26% 10 -1.91% -0.08% -8.01% 101.84% 102.82% 105.33% 11 -2.89% -0.12% -6.98% 101.80% 102.76% 105.44% 12 -3.44% -0.15% -6.41% 102.08% 103.18% 104.74% 13 -4.15% -0.06% -5.79% 102.81% 103.97% 103.21% 14 -0.64% -0.01% -9.35% 103.42% 104.84% 101.74% 15 -7.76% -0.11% -2.13% 102.33% 103.29% 104.38% 16 -1.92% -0.03% -8.05% 101.88% 102.66% 105.46% 17 -2.92% -0.04% -7.04% 101.84% 102.60% 105.57% 18 -3.48% -0.05% -6.47% 102.13% 103.01% 104.86% 19 -4.07% -0.26% -5.67% 102.21% 105.26% 102.53% 20 -0.64% -0.04% -9.32% 102.58% 106.12% 101.31% 21 -7.47% -0.48% -2.05% 101.90% 104.52% 103.58% 22 -1.90% -0.12% -7.97% 101.59% 103.79% 104.62% 23 -2.88% -0.19% -6.94% 101.56% 103.71% 104.73% 24 -3.42% -0.22% -6.36% 101.77% 104.20% 104.04% 25 -3.52% -1.57% -4.91% 102.59% 104.44% 102.96% 26 -0.62% -0.28% -9.10% 103.10% 105.32% 101.58% 27 -5.81% -2.60% -1.59% 102.18% 103.73% 104.09% 28 -1.77% -0.79% -7.43% 101.78% 103.05% 105.16% 29 -2.59% -1.16% -6.25% 101.74% 102.98% 105.27% 30 -3.02% -1.35% -5.63% 102.00% 103.43% 104.57% 31 -2.59% -3.80% -3.61% 102.83% 103.94% 103.23% 32 -0.58% -0.86% -8.56% 103.45% 104.80% 101.75% 33 -3.65% -5.35% -1.00% 102.34% 103.26% 104.40% 34 -1.50% -2.20% -6.30% 101.89% 102.63% 105.48% 35 -2.05% -3.01% -4.94% 101.85% 102.57% 105.59% 36 -2.31% -3.39% -4.30% 102.14% 102.97% 104.89% 37 -7.07% -0.33% -2.59% 102.65% 104.21% 103.14% 38 -2.04% -0.10% -7.86% 103.21% 105.10% 101.69% 39 -8.94% -0.42% -0.64% 102.20% 103.50% 104.29% 40 -4.65% -0.22% -5.13% 101.79% 102.84% 105.37% 41 -5.95% -0.28% -3.77% 101.74% 102.78% 105.48%

252
42 -6.51% -0.31% -3.18% 102.02% 103.21% 104.78% 43 -7.26% -0.08% -2.66% 102.67% 104.16% 103.17% 44 -2.05% -0.02% -7.92% 103.25% 105.04% 101.71% 45 -9.23% -0.10% -0.67% 102.22% 103.45% 104.33% 46 -4.73% -0.05% -5.21% 101.80% 102.79% 105.41% 47 -6.08% -0.07% -3.85% 101.76% 102.73% 105.52% 48 -6.66% -0.07% -3.26% 102.03% 103.16% 104.81% 49 -7.30% -0.03% -2.67% 102.74% 104.01% 103.25% 50 -2.06% -0.01% -7.93% 103.34% 104.90% 101.76% 51 -9.30% -0.03% -0.67% 102.27% 103.32% 104.42% 52 -4.75% -0.02% -5.23% 101.83% 102.68% 105.49% 53 -6.11% -0.02% -3.87% 101.78% 102.61% 105.60% 54 -6.70% -0.03% -3.28% 102.07% 103.03% 104.90% 55 -7.23% -0.12% -2.65% 102.15% 105.30% 102.55% 56 -2.05% -0.04% -7.91% 102.51% 106.17% 101.32% 57 -9.18% -0.16% -0.66% 101.85% 104.55% 103.60% 58 -4.72% -0.08% -5.20% 101.55% 103.81% 104.65% 59 -6.06% -0.10% -3.84% 101.51% 103.73% 104.76% 60 -6.64% -0.11% -3.25% 101.71% 104.22% 104.06% 61 -6.74% -0.79% -2.47% 102.52% 104.48% 102.99% 62 -2.01% -0.24% -7.75% 103.03% 105.38% 101.60% 63 -8.41% -0.99% -0.61% 102.12% 103.76% 104.12% 64 -4.51% -0.53% -4.96% 101.73% 103.07% 105.20% 65 -5.71% -0.67% -3.62% 101.69% 103.00% 105.31% 66 -6.22% -0.73% -3.04% 101.94% 103.45% 104.60% 67 -5.71% -2.20% -2.09% 102.76% 103.98% 103.27% 68 -1.91% -0.74% -7.36% 103.37% 104.86% 101.77% 69 -6.86% -2.64% -0.49% 102.28% 103.28% 104.44% 70 -4.02% -1.55% -4.43% 101.84% 102.65% 105.52% 71 -4.95% -1.91% -3.14% 101.79% 102.58% 105.63% 72 -5.33% -2.06% -2.61% 102.08% 103.00% 104.92% 73 -5.83% -0.47% -3.70% 103.78% 103.56% 102.65% 74 -1.29% -0.11% -8.61% 104.44% 104.18% 101.38% 75 -8.29% -0.68% -1.04% 103.23% 103.04% 103.73% 76 -3.34% -0.27% -6.38% 102.69% 102.53% 104.78% 77 -4.59% -0.37% -5.04% 102.63% 102.48% 104.89% 78 -5.18% -0.42% -4.39% 102.99% 102.82% 104.19% 79 -6.05% -0.12% -3.84% 103.78% 103.56% 102.65% 80 -1.30% -0.03% -8.68% 104.44% 104.18% 101.38% 81 -8.74% -0.17% -1.09% 103.23% 103.04% 103.73% 82 -3.42% -0.07% -6.52% 102.69% 102.53% 104.78% 83 -4.72% -0.09% -5.18% 102.63% 102.48% 104.89% 84 -5.36% -0.10% -4.54% 102.99% 102.82% 104.19% 85 -6.09% -0.04% -3.87% 103.89% 103.38% 102.73% 86 -1.30% -0.01% -8.69% 104.59% 103.98% 101.43% 87 -8.84% -0.06% -1.10% 103.31% 102.87% 103.82% 88 -3.43% -0.02% -6.55% 102.74% 102.38% 104.88% 89 -4.75% -0.03% -5.22% 102.68% 102.33% 104.99%

253
90 -5.39% -0.04% -4.57% 103.06% 102.65% 104.29% 91 -6.01% -0.18% -3.81% 103.16% 104.62% 102.22% 92 -1.30% -0.04% -8.66% 103.61% 105.26% 101.13% 93 -8.66% -0.26% -1.08% 102.77% 104.04% 103.19% 94 -3.40% -0.10% -6.50% 102.36% 103.44% 104.20% 95 -4.70% -0.14% -5.16% 102.32% 103.38% 104.31% 96 -5.33% -0.16% -4.51% 102.59% 103.78% 103.63% 97 -5.44% -1.11% -3.45% 103.63% 103.82% 102.55% 98 -1.27% -0.26% -8.47% 104.23% 104.45% 101.32% 99 -7.53% -1.53% -0.94% 103.12% 103.28% 103.60% 100 -3.21% -0.65% -6.13% 102.61% 102.75% 104.64% 101 -4.35% -0.88% -4.77% 102.56% 102.69% 104.75% 102 -4.88% -0.99% -4.13% 102.89% 103.05% 104.06% 103 -4.34% -2.90% -2.76% 103.91% 103.34% 102.75% 104 -1.20% -0.80% -8.00% 104.62% 103.94% 101.44% 105 -5.58% -3.72% -0.70% 103.32% 102.84% 103.84% 106 -2.80% -1.87% -5.34% 102.75% 102.35% 104.90% 107 -3.62% -2.41% -3.97% 102.69% 102.30% 105.01% 108 -3.98% -2.65% -3.37% 103.07% 102.62% 104.31% 109 -7.37% -0.30% -2.33% 104.92% 102.91% 102.17% 110 -2.29% -0.09% -7.61% 105.59% 103.31% 101.10% 111 -9.07% -0.37% -0.56% 104.31% 102.56% 103.13% 112 -5.03% -0.20% -4.77% 103.69% 102.19% 104.13% 113 -6.30% -0.26% -3.44% 103.62% 102.15% 104.23% 114 -6.84% -0.28% -2.88% 104.04% 102.39% 103.56% 115 -7.54% -0.07% -2.38% 104.92% 102.91% 102.17% 116 -2.31% -0.02% -7.67% 105.59% 103.31% 101.10% 117 -9.33% -0.09% -0.58% 104.31% 102.56% 103.13% 118 -5.10% -0.05% -4.85% 103.69% 102.19% 104.13% 119 -6.43% -0.06% -3.51% 103.62% 102.15% 104.23% 120 -6.99% -0.07% -2.95% 104.04% 102.39% 103.56% 121 -7.58% -0.02% -2.39% 105.03% 102.75% 102.22% 122 -2.31% -0.01% -7.68% 105.74% 103.13% 101.13% 123 -9.39% -0.03% -0.58% 104.40% 102.40% 103.20% 124 -5.12% -0.02% -4.86% 103.75% 102.05% 104.20% 125 -6.45% -0.02% -3.52% 103.68% 102.01% 104.31% 126 -7.02% -0.02% -2.96% 104.12% 102.25% 103.63% 127 -7.52% -0.11% -2.37% 104.24% 103.89% 101.87% 128 -2.31% -0.03% -7.66% 104.73% 104.34% 100.93% 129 -9.29% -0.14% -0.58% 103.78% 103.47% 102.75% 130 -5.09% -0.07% -4.83% 103.29% 103.02% 103.69% 131 -6.41% -0.09% -3.50% 103.24% 102.97% 103.79% 132 -6.96% -0.10% -2.94% 103.57% 103.28% 103.15% 133 -7.06% -0.71% -2.23% 104.76% 103.15% 102.10% 134 -2.26% -0.23% -7.51% 105.38% 103.56% 101.06% 135 -8.60% -0.87% -0.53% 104.19% 102.77% 103.04% 136 -4.88% -0.49% -4.63% 103.60% 102.38% 104.02% 137 -6.07% -0.61% -3.31% 103.53% 102.34% 104.13%
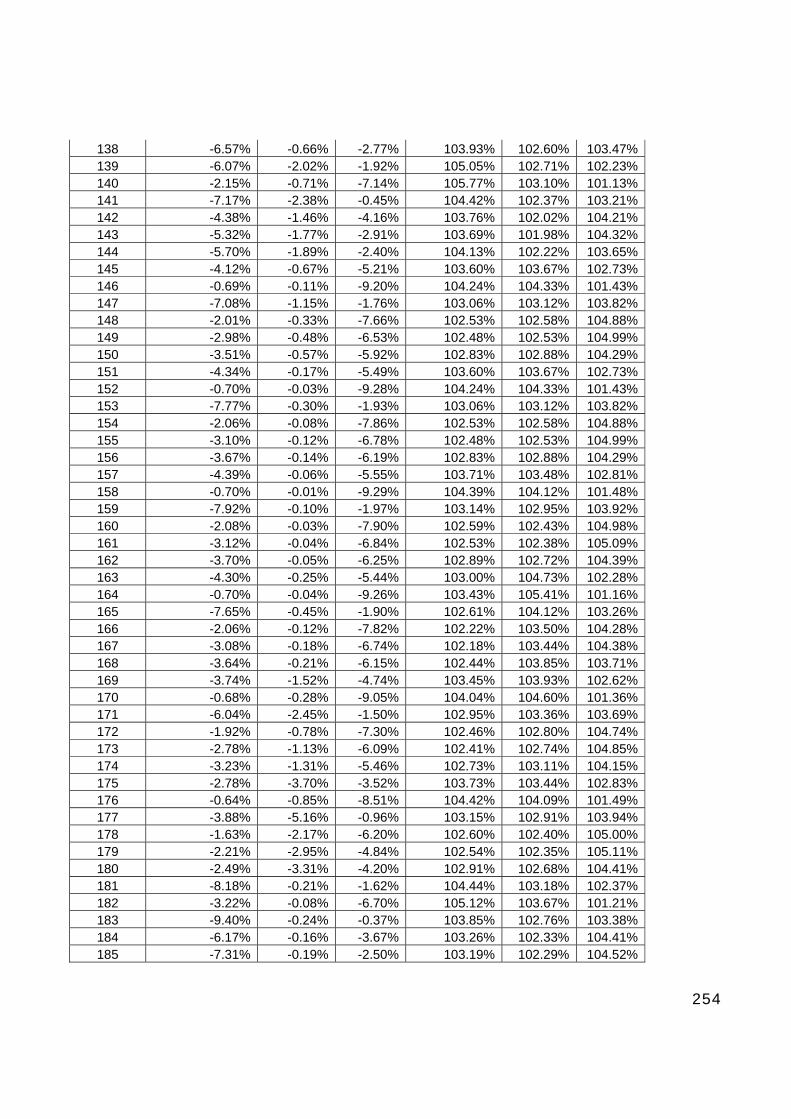
254
138 -6.57% -0.66% -2.77% 103.93% 102.60% 103.47% 139 -6.07% -2.02% -1.92% 105.05% 102.71% 102.23% 140 -2.15% -0.71% -7.14% 105.77% 103.10% 101.13% 141 -7.17% -2.38% -0.45% 104.42% 102.37% 103.21% 142 -4.38% -1.46% -4.16% 103.76% 102.02% 104.21% 143 -5.32% -1.77% -2.91% 103.69% 101.98% 104.32% 144 -5.70% -1.89% -2.40% 104.13% 102.22% 103.65% 145 -4.12% -0.67% -5.21% 103.60% 103.67% 102.73% 146 -0.69% -0.11% -9.20% 104.24% 104.33% 101.43% 147 -7.08% -1.15% -1.76% 103.06% 103.12% 103.82% 148 -2.01% -0.33% -7.66% 102.53% 102.58% 104.88% 149 -2.98% -0.48% -6.53% 102.48% 102.53% 104.99% 150 -3.51% -0.57% -5.92% 102.83% 102.88% 104.29% 151 -4.34% -0.17% -5.49% 103.60% 103.67% 102.73% 152 -0.70% -0.03% -9.28% 104.24% 104.33% 101.43% 153 -7.77% -0.30% -1.93% 103.06% 103.12% 103.82% 154 -2.06% -0.08% -7.86% 102.53% 102.58% 104.88% 155 -3.10% -0.12% -6.78% 102.48% 102.53% 104.99% 156 -3.67% -0.14% -6.19% 102.83% 102.88% 104.29% 157 -4.39% -0.06% -5.55% 103.71% 103.48% 102.81% 158 -0.70% -0.01% -9.29% 104.39% 104.12% 101.48% 159 -7.92% -0.10% -1.97% 103.14% 102.95% 103.92% 160 -2.08% -0.03% -7.90% 102.59% 102.43% 104.98% 161 -3.12% -0.04% -6.84% 102.53% 102.38% 105.09% 162 -3.70% -0.05% -6.25% 102.89% 102.72% 104.39% 163 -4.30% -0.25% -5.44% 103.00% 104.73% 102.28% 164 -0.70% -0.04% -9.26% 103.43% 105.41% 101.16% 165 -7.65% -0.45% -1.90% 102.61% 104.12% 103.26% 166 -2.06% -0.12% -7.82% 102.22% 103.50% 104.28% 167 -3.08% -0.18% -6.74% 102.18% 103.44% 104.38% 168 -3.64% -0.21% -6.15% 102.44% 103.85% 103.71% 169 -3.74% -1.52% -4.74% 103.45% 103.93% 102.62% 170 -0.68% -0.28% -9.05% 104.04% 104.60% 101.36% 171 -6.04% -2.45% -1.50% 102.95% 103.36% 103.69% 172 -1.92% -0.78% -7.30% 102.46% 102.80% 104.74% 173 -2.78% -1.13% -6.09% 102.41% 102.74% 104.85% 174 -3.23% -1.31% -5.46% 102.73% 103.11% 104.15% 175 -2.78% -3.70% -3.52% 103.73% 103.44% 102.83% 176 -0.64% -0.85% -8.51% 104.42% 104.09% 101.49% 177 -3.88% -5.16% -0.96% 103.15% 102.91% 103.94% 178 -1.63% -2.17% -6.20% 102.60% 102.40% 105.00% 179 -2.21% -2.95% -4.84% 102.54% 102.35% 105.11% 180 -2.49% -3.31% -4.20% 102.91% 102.68% 104.41% 181 -8.18% -0.21% -1.62% 104.44% 103.18% 102.37% 182 -3.22% -0.08% -6.70% 105.12% 103.67% 101.21% 183 -9.40% -0.24% -0.37% 103.85% 102.76% 103.38% 184 -6.17% -0.16% -3.67% 103.26% 102.33% 104.41% 185 -7.31% -0.19% -2.50% 103.19% 102.29% 104.52%

255
186 -7.75% -0.20% -2.05% 103.59% 102.57% 103.83% 187 -8.31% -0.05% -1.64% 104.44% 103.18% 102.37% 188 -3.24% -0.02% -6.74% 105.12% 103.67% 101.21% 189 -9.57% -0.06% -0.37% 103.85% 102.76% 103.38% 190 -6.25% -0.04% -3.72% 103.26% 102.33% 104.41% 191 -7.42% -0.04% -2.54% 103.19% 102.29% 104.52% 192 -7.87% -0.05% -2.08% 103.59% 102.57% 103.83% 193 -8.33% -0.02% -1.65% 104.56% 103.01% 102.43% 194 -3.24% -0.01% -6.75% 105.27% 103.48% 101.25% 195 -9.61% -0.02% -0.37% 103.94% 102.60% 103.46% 196 -6.26% -0.01% -3.72% 103.32% 102.19% 104.49% 197 -7.44% -0.02% -2.54% 103.25% 102.15% 104.60% 198 -7.90% -0.02% -2.09% 103.67% 102.42% 103.91% 199 -8.28% -0.08% -1.64% 103.78% 104.20% 102.02% 200 -3.24% -0.03% -6.73% 104.26% 104.73% 101.01% 201 -9.54% -0.09% -0.37% 103.35% 103.71% 102.94% 202 -6.23% -0.06% -3.71% 102.89% 103.20% 103.91% 203 -7.40% -0.07% -2.53% 102.84% 103.15% 104.01% 204 -7.85% -0.07% -2.07% 103.15% 103.49% 103.36% 205 -7.93% -0.50% -1.57% 104.28% 103.43% 102.29% 206 -3.18% -0.20% -6.62% 104.91% 103.93% 101.16% 207 -9.07% -0.58% -0.35% 103.73% 102.99% 103.28% 208 -6.03% -0.38% -3.59% 103.17% 102.54% 104.29% 209 -7.11% -0.45% -2.43% 103.11% 102.49% 104.40% 210 -7.53% -0.48% -1.99% 103.49% 102.79% 103.72% 211 -7.11% -1.48% -1.41% 104.58% 102.97% 102.44% 212 -3.04% -0.63% -6.33% 105.30% 103.44% 101.26% 213 -8.02% -1.67% -0.31% 103.96% 102.57% 103.47% 214 -5.55% -1.15% -3.30% 103.33% 102.16% 104.51% 215 -6.45% -1.34% -2.21% 103.26% 102.12% 104.62% 216 -6.79% -1.41% -1.79% 103.68% 102.39% 103.93%
mean -4.92% -0.62% -4.46% 103.15% 103.28% 103.57% SD 2.48% 0.94% 2.56% 0.98% 0.86% 1.31%


