
Comprehensive Sentencing Task Force November 9th, 2010, 1:30‐4:30PM
710 Kipling, 3rd Floor Conference Room
ATTENDEES: CHAIR
Jeanne Smith/Division of Criminal Justice
TASK FORCE MEMBERS
Carl Blesch, Division of Criminal Justice
Christie Donner/Criminal Justice Reform Coalition
Charles Garcia/Denver Crime Prevention & Control Commission
Claire Levy/State Representative
Gil Martinez/District Court Judge (phone)
J.P. Moore/DA 17th Judicial
Pete Hautzinger/DA 21st Judicial (phone)
Tom Quinn/Director of Probation Services
Celeste Quinones, Parole Board
Mark Scheffel, Senator
Dianne Tramutola‐Lawson/CURE
Doug Wilson/State Public Defender
STAFF
Paul Herman/Center for Effective Public Policy
Peg Flick/ Division of Criminal Justice
Linda Harrison/ Division of Criminal Justice
Germaine Miera/Division of Criminal Justice
ADDITIONAL ATTENDEES
Miles Madorin
Ken Tomlinson
Mark Evans
Kathy Isor
Haley Wilmer
ABSENT
Jeaneene Miller/DOC Division of Parole
John Suthers/Attorney General
Joe Cannata/Voices of Victims
Jason Middleton/ Public Defender/Appellate Division
Joe Pelle/Sheriff, Boulder County
1
Issue/Topic:
Welcome and Introductions
Discussion:
Jeanne Smith opened the meeting with introductions and an overview of the meeting. Gil Martinez and Pete Hautzinger attended by phone.
Issue/Topic:
Report Back ‐ Theft Analysis
Discussion:
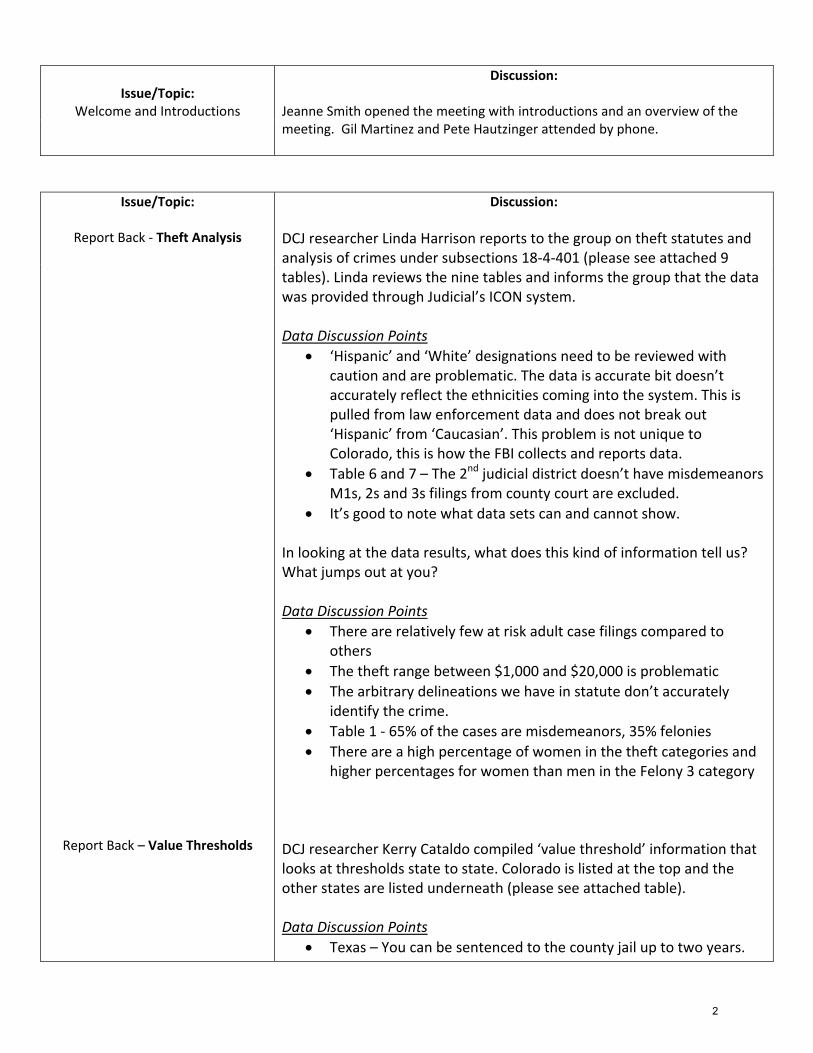
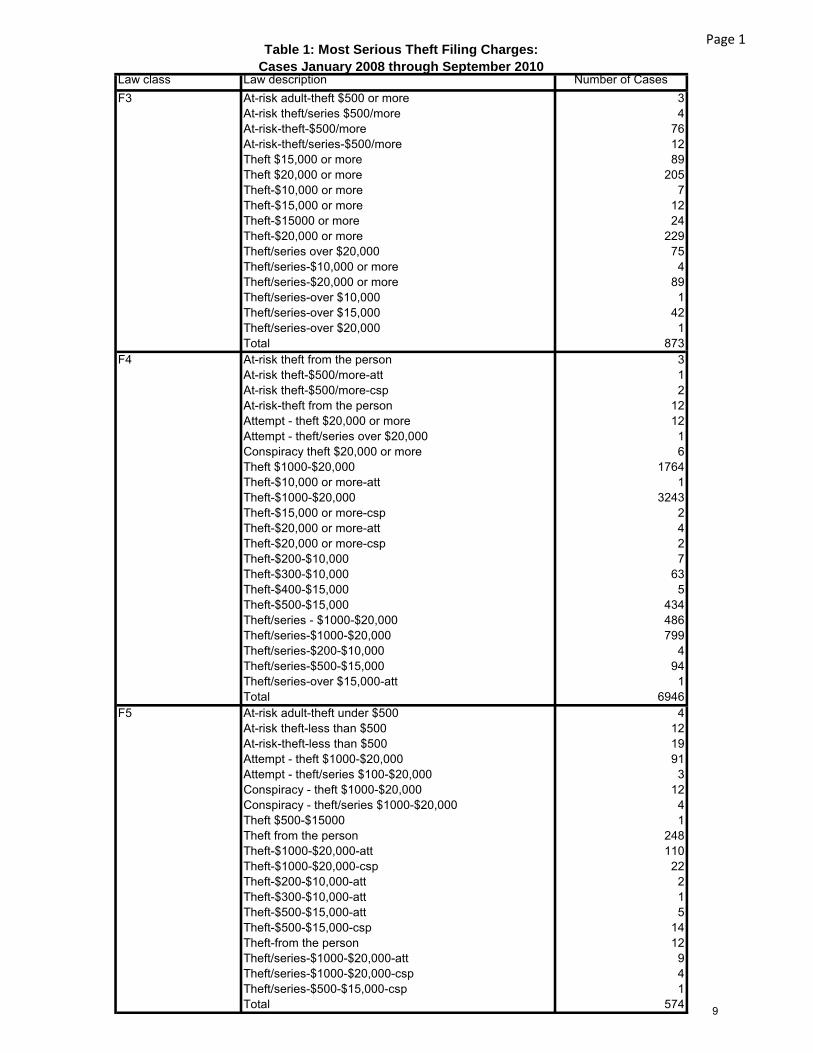
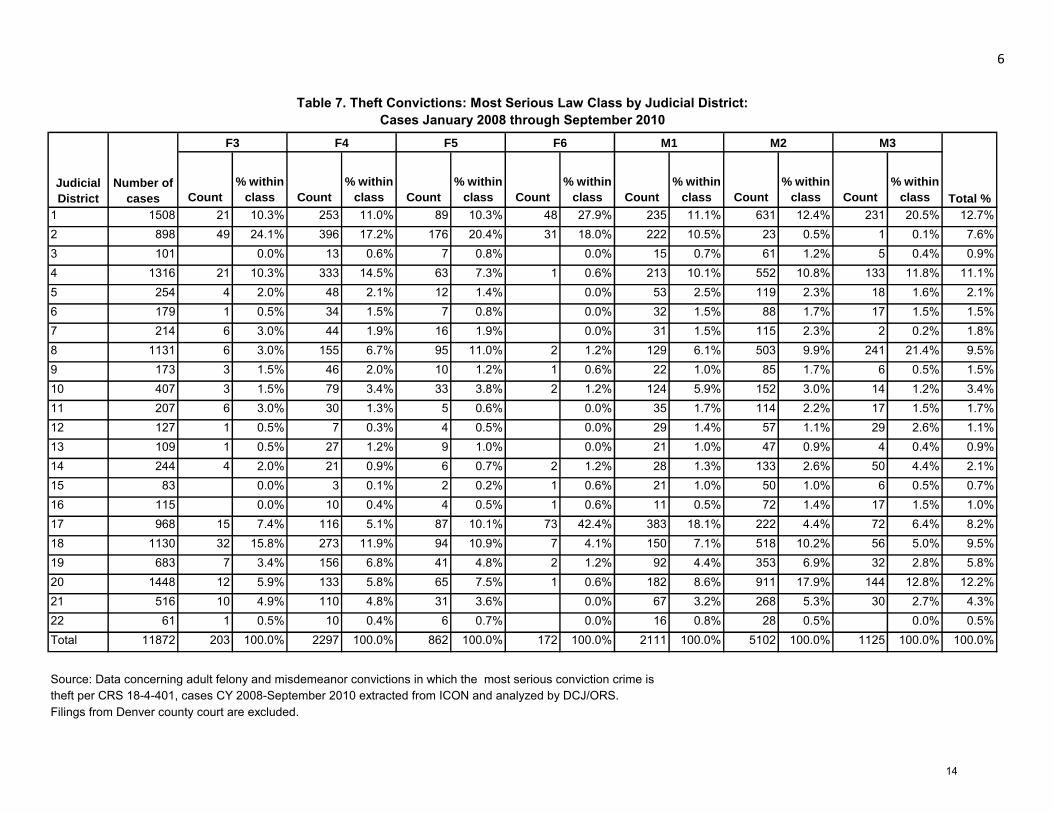
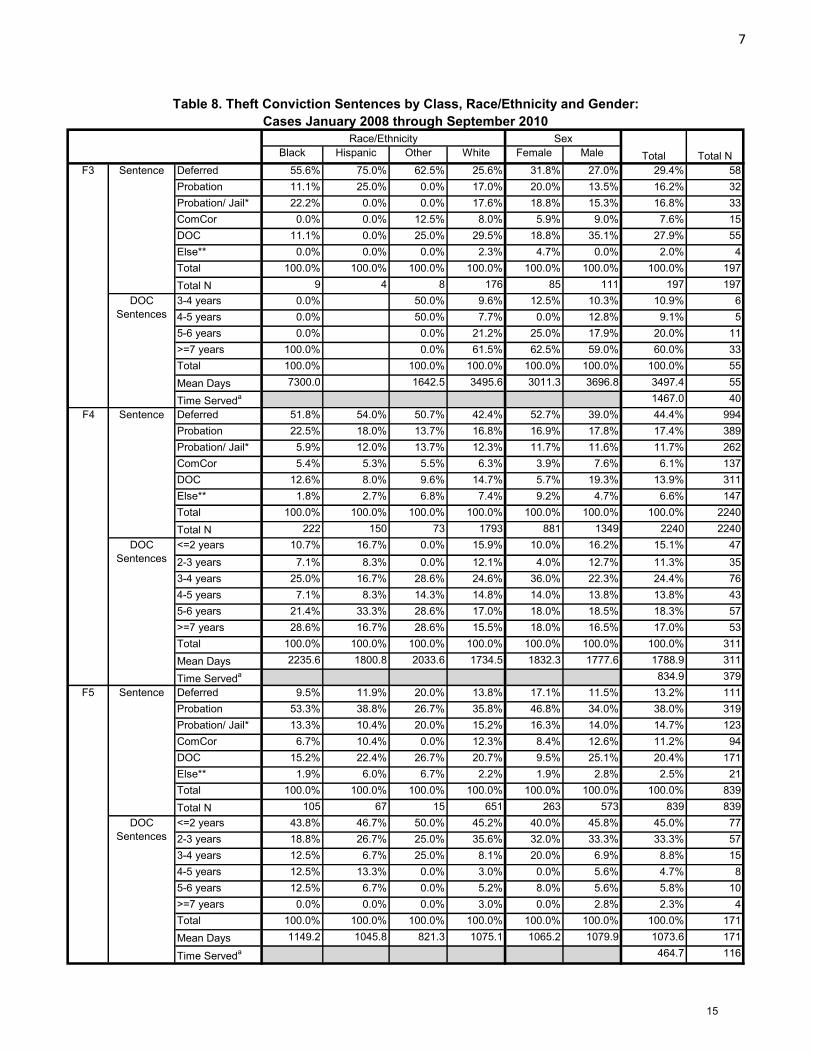
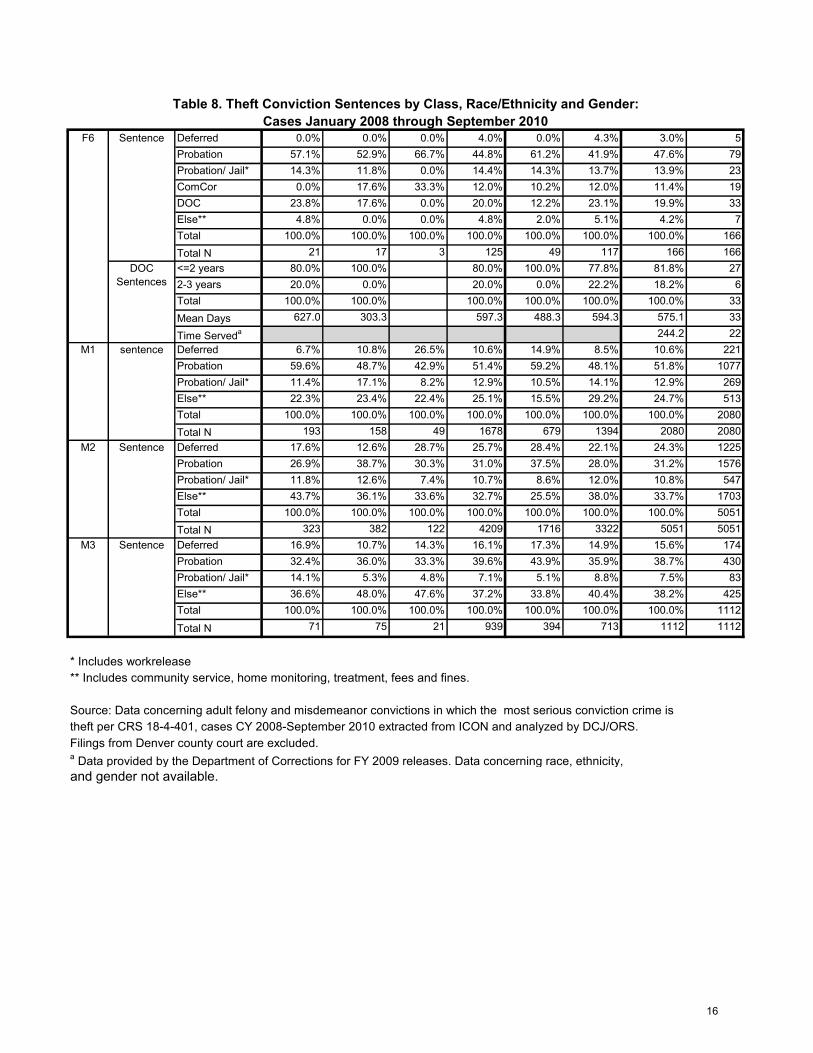
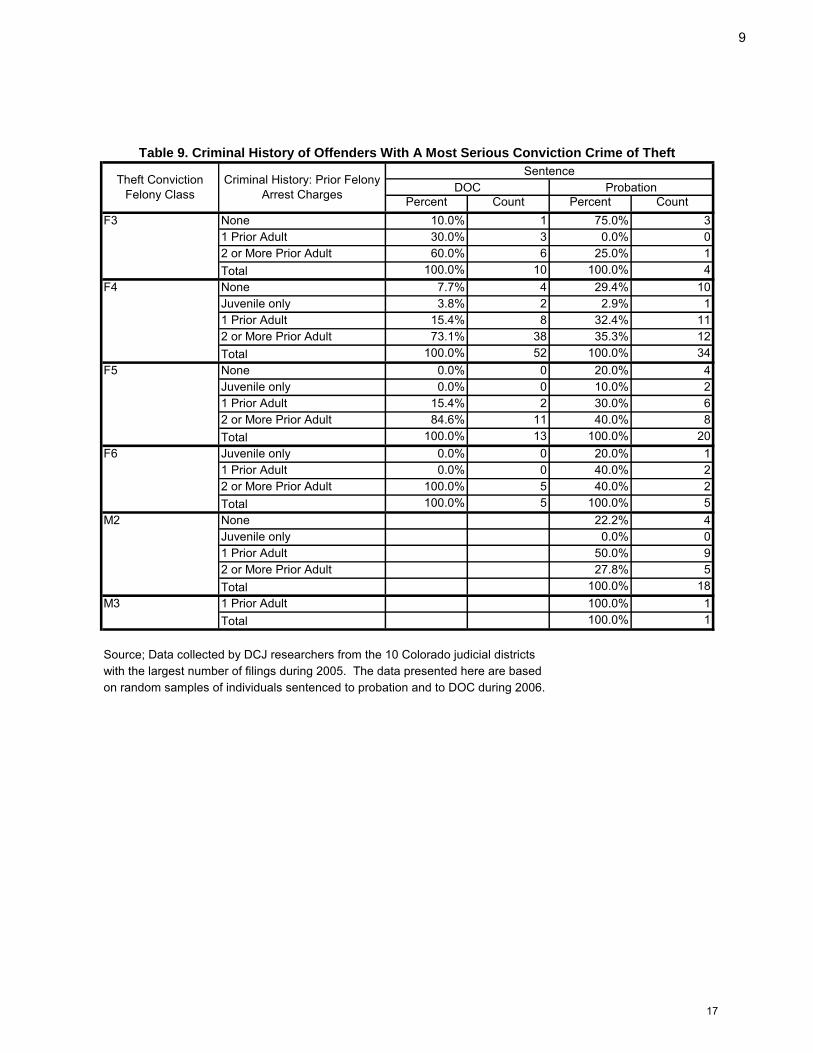
DCJ researcher Linda Harrison reports to the group on theft statutes and analysis of crimes under subsections 18‐4‐401 (please see attached 9 tables). Linda reviews the nine tables and informs the group that the data was provided through Judicial’s ICON system. Data Discussion Points
‘Hispanic’ and ‘White’ designations need to be reviewed with caution and are problematic. The data is accurate bit doesn’t accurately reflect the ethnicities coming into the system. This is pulled from law enforcement data and does not break out ‘Hispanic’ from ‘Caucasian’. This problem is not unique to Colorado, this is how the FBI collects and reports data.
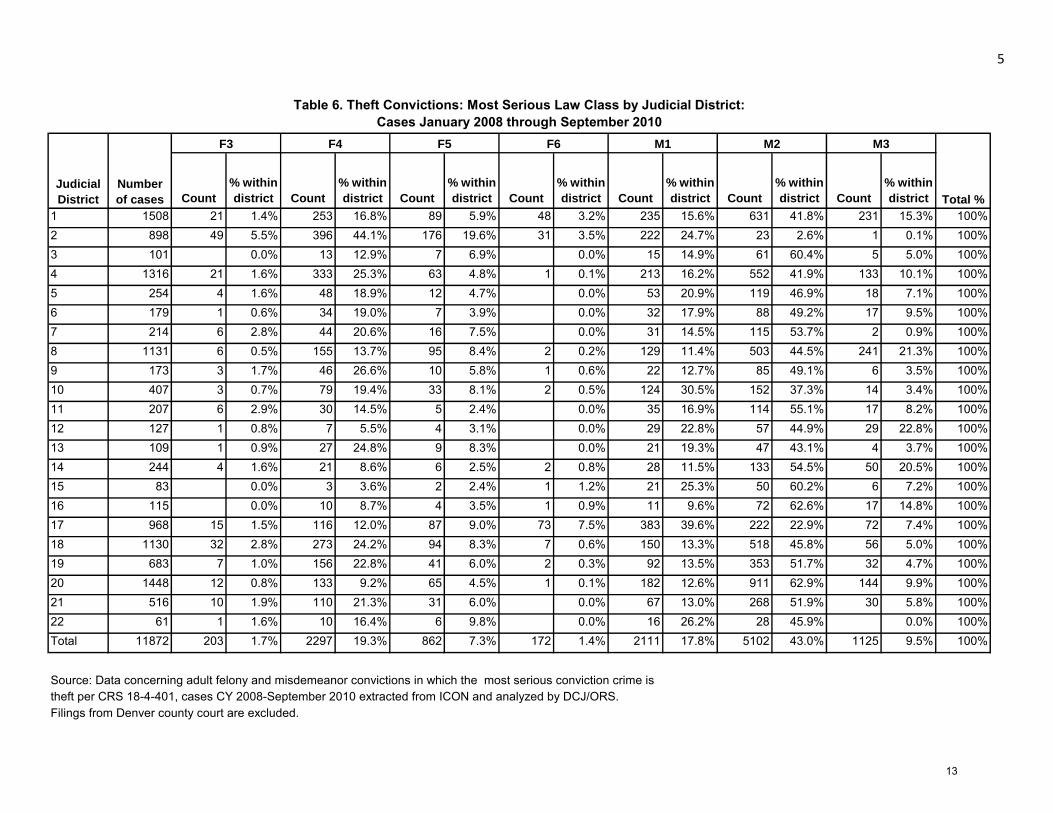
Table 6 and 7 – The 2nd judicial district doesn’t have misdemeanors M1s, 2s and 3s filings from county court are excluded.
It’s good to note what data sets can and cannot show. In looking at the data results, what does this kind of information tell us? What jumps out at you? Data Discussion Points
There are relatively few at risk adult case filings compared to others
The theft range between $1,000 and $20,000 is problematic
The arbitrary delineations we have in statute don’t accurately identify the crime.
Table 1 ‐ 65% of the cases are misdemeanors, 35% felonies
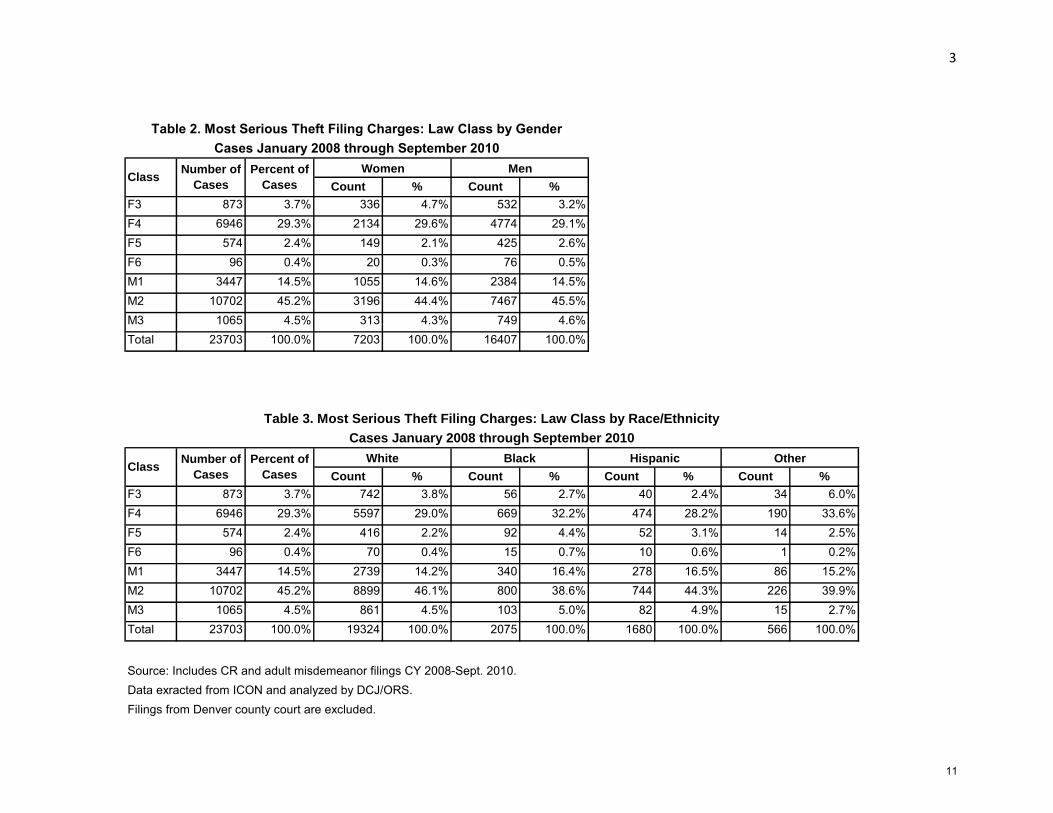
There are a high percentage of women in the theft categories and higher percentages for women than men in the Felony 3 category
DCJ researcher Kerry Cataldo compiled ‘value threshold’ information that looks at thresholds state to state. Colorado is listed at the top and the other states are listed underneath (please see attached table). Data Discussion Points
Texas – You can be sentenced to the county jail up to two years.
Report Back – Value Thresholds
2
Action
Florida – Not much significant here, just different
Ohio – the range of punishment is huge, you won’t do as much time in Ohio
Washington – like Colorado, there are only 2 categories, but threshold values are lower
Arizona – Has a complicated sentencing scheme and offenders will do 85% of their sentence
Connecticut – Has 3 values
Basically, with these numbers we can compare categories and thresholds and range of punishment. Colorado is not out of line in terms of what other states are doing.
In looking at this data what conclusions do you come to? It’s not worth looking at; there are so many variables once you dig into the numbers.
Longer prison sentences are related to more value taken but not necessarily assessment
Issue/Topic:
Report Back – Restitution ordered vs. collected
Discussion: Tom Quinn provides a handout to the group regarding Restitution Ordered and Collected on All Theft Cases Sentenced between 7‐1‐2005 thru Present.
Data Discussion The numbers show that there is a lot of restitution ordered
Whether restitution is added at sentencing or later it is reflected in the chart
The 2nd chart addresses total percent of restitution paid during that time. This reflects how much was paid no matter how much was ordered.
For those ordered to pay, the biggest bulk for those who have paid is in the $1 to $500 range. The $1 to $500 could include the DOC offenders.
18 people paid $100,000 or more.
Are there any ‘Ns’? Tom says didn’t include them because the charts were pretty busy as it was.
Deferred sentences are included under probation, if deferred is unsupervised it’s under the “unsupervised” category.
These numbers reflect people who had a theft conviction under 18‐4‐401 and were ordered to pay restitution. The average offender paid 16% of restitution. Folks on diversion or unsupervised are more likely to pay their restitution.
There is a valid point here. What is the goal of a criminal theft charge? Is it to make the victim whole? Is it to collect the amount owed? Is restitution on theft collected different than in any other categories?
Can we have misdemeanants removed from this chart? Seems to be mixing apples and oranges.
It’s difficult to detect how much restitution was paid in DOC, at Comm. Corr. or on probation.
Action
3

Since the data reflects open cases it’s not exactly accurate.
Can we do this on a cohort of concluded cases? That wouldn’t be accurate either as cases often go to collections once an offender is ‘off paper’.
The offenders who stole the most money, get the most severe sentence, which also means they’re less likely to pay back because they’re in DOC.
This is a good policy question ‐ Would it be better not to incapacitate so an offender is more likely and has the ability to pay back the money?
Table 2 – Gives the mean, median and high range for each of these sentences.
The final chart – shows the average percent collected by type of sentence. Those with larger amounts have paid a smaller percentage as it’s often more of a challenge.
Again, there’s a lot of restitution that gets collected through private parties.
Another thing to keep in mind is to track MEDIAN numbers. On the charts that break down average percent collected per offender, agency and sentence type make sure to look at the median. Averages can be weird if say 2 people are ordered to pay a million bucks. Median is important.
Are there any lessons learned from asking about data regarding restitution?
Discussion You don’t know what you’re going to find until you look at the data.
Know what you want and why you want it before you get the data
This data excludes payment for anything else.. fines, fees, just restitution only
As we refine our skills in this, the more specific we are in terms of our questions, the better off we are.
Issue/Topic:
Sunrise Review Process
Discussion:
Representative Claire Levy reports back to the task force on the conclusions her small working group came to regarding a proposed Sunrise Review Process. The working group consisted of Charlie Garcia, Christie Donner, Tom Raynes and staff from Legislative Council. The group met yesterday (Nov. 8th) to discuss this issue.
Discussion The group met to talk about what to do regarding the problem of new
legislation that doesn’t necessarily address a true problem, but instead clogs up the statute book. This takes into account the incidences of ‘designer offenses’ that come up out of a particular circumstance, a high profile case, etc.
The group discussed a possible formalized review process or maybe a way to codify some criteria to be considered when bills are being passed.
The group came up with a recommendation that before someone goes
Action
4

to committee on a bill there must be a fiscal note and analysis presented to Legislative Council. Leg. Council would then determine if the bill should move forward.
Leg. Council says they may need some additional resources to do this.
The process would go something like this – ‐ A new theft bill gets introduced, goes to CDAC, DOC, Judicial, public
defenders. These stakeholders would be asked “Can you charge this crime under existing statutes?” Each party would have a list of predetermined questions and they would know what topics need to be addressed.
‐ Then all parties would do a fiscal analysis and say if there are other statutes where this could be filed. How many times in the last five years has this occurred and have we not been able to adequately address the situation in the past.
‐ It would be kind of a codified “10 commandments” before legislation passes
‐ Basically is this new law needed and is the classification appropriate?
‐ The goal is to get clarity around new legislation and have a statement as to where the proposed legislation fits in the existing legislation and is there consistency with current statute?
‐ The goal of this process would be to find out ‘is this new bill in the interest of public safety’? There would be objective info that doesn’t come from a proponent or opponent.
‐ The hope is that legislators would do some self analysis around new legislation.
‐ This would need a statutory change. Does this group want to move this recommendation forward to the Commission? Rather than calling this a ‘Sunrise Review’ we will call this something like “Additional analysis and information for the legislature”. We would ask Leg. Council to take a more formal role , ask specific question about new legislation, and provide a separate note in addition to the fiscal note. The task force takes a vote‐ Support ‐7 Live with‐6 Cannot support‐0 This recommendation will be informally presented to the Commission during its November meeting this week, and then formally presented to the Commission for a vote in December.
5
Issue/Topic:
Next steps
Discussion:
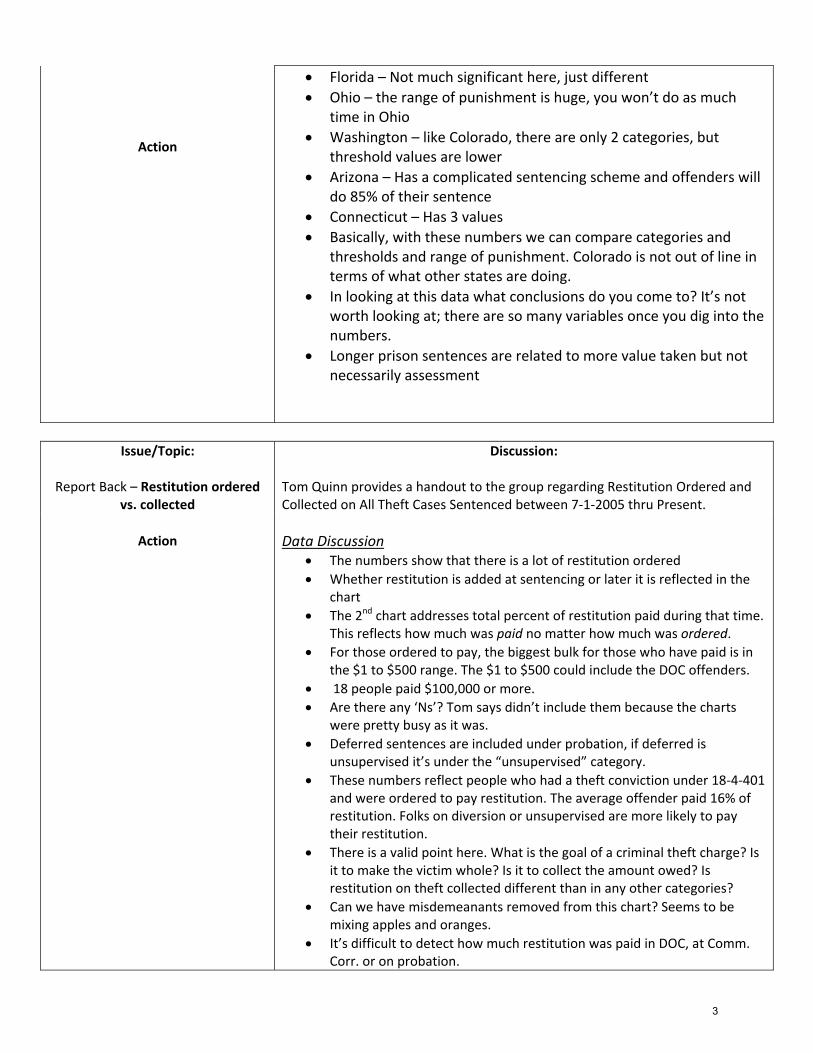
What are the next steps we need to go through at this point? What do we need to do as our work moves forward? Jeanne asks Judge Martinez to talk to the group about what is really happening during a sentencing, what is the judge looking at when sentencing a theft case?
Judge Martinez feedback Regarding thefts ‐ Judges look at amounts stolen and tie that into the
ability to pay restitution, and is it going to be realistic restitution. The amount stolen will really determine how LONG probation will be. If it’s a significant amount, the length of probation will be longer.
Judges also look at WHAT was stolen? For example, if drugs or pharmaceuticals were stolen that brings up other issues that the offender may have.
We look at prior record, has this happened before?
Was restitution paid up front, or CAN restitution be paid up front – which relates to how much can a person be rehabilitated
We look at victim’s desire, they’re main concern is usually that they want to be ‘made whole’ (i.e., financially).
Is this a series of transactions or a single transaction?
Are there substance abuse issues?
What is the employment history (which is also tied to restitution)
We know there is not usually a lot of physical community safety issues in theft crimes
We also have to temper this with did the person make bond prior to sentencing and have they made restitution? At the same time, we don’t want to punish those who haven’t made bail. We don’t want to punish someone if they’ve been in custody and haven’t had a chance to start paying restitution
Also, how big was the betrayal (a series of transactions)?
We will look at alternative sentences but we want to be practical as well.
The more deliberation the higher the responsibility of the defendant
One different thing about theft is that there are fewer community safety to worry about
Theft is uncomplicated. You’re talking about amounts, etc. For a judge it’s an uncomplicated sentence.
There are no statutory constraints that affect theft sentences
What about an employed thief who can pay back vs. someone unemployed who can’t pay back? A judge would probably give them both probation, but a lot of it goes back to good faith effort.
Regardless, we can’t set an offender up to fail. However, they do have to make a good faith effort.
Do you ever convert restitution to community service? Judges would usually rather waive fees that go to community service and put that
Action
6

toward restitution.
A judges primary goal in these cases is to get restitution to the victims.
Someone shouldn’t go to prison just because they’re unemployed and can’t pay restitution.
More experienced judges are a little more realistic at looking at conditions and not overloading a person. New judges are often a little overzealous with the conditions they put on an offender. New judges aren’t often realistic. It takes a while for new PSIR writers to get there, too.
Jeanne asks Tom Quinn to talk to the group about what happens when Probation gets a theft case, what does staff consider on an individual for PSIR or initial intake. Tom Quinn feedback
When probation gets a theft case, ‘risk’ is an issue. Probation performs the LSI and if there is high risk then that’s going to generate a little bit more of a public safety supervision plan. On the flip side, if they need a job or have mental health issues there will be more of a treatment oriented case plan.
It’s really a balancing act
We want to limit the number of issues we give to an offender to work on. Don’t load them up with 30 tasks to complete.
Consider victim restoration always
Sometime victim’s request community service
When looking at conditions, how much does the availability of resources factor in? You don’t want to create a desirable condition that is impossible to implement
Would a probationer in the metro area end up with different conditions than a rural probationer with fewer resources? Yes, all parties try to make the best possible sentence for the district. This is true for judges also.
Discussion Points – the group gives feedback on additional issues to be considered
Prior record
Victim’s desires
Substance abuse
Employment record
Bond prior to sentencing vs. in custody
Language barriers with understanding conditions, ability to get a job and pay restitution.
Discussion:
Issue/Topic:
7

Adjourn and Next Meeting
The meeting adjourned at 4:30pm. The next meeting is set for December 9, 2010
Future Meeting Dates: Date Location Time December 9, 2010 690 Kipling, 1st floor conference room 1:30‐4:30PM
8
Page 1
Law class Law description Number of CasesAt-risk adult-theft $500 or more 3At-risk theft/series $500/more 4At-risk-theft-$500/more 76At-risk-theft/series-$500/more 12Theft $15,000 or more 89Theft $20,000 or more 205Theft-$10,000 or more 7Theft-$15,000 or more 12Theft-$15000 or more 24Theft-$20,000 or more 229Theft/series over $20,000 75Theft/series-$10,000 or more 4Theft/series-$20,000 or more 89Theft/series-over $10,000 1Theft/series-over $15,000 42Theft/series-over $20,000 1Total 873At-risk theft from the person 3At-risk theft-$500/more-att 1At-risk theft-$500/more-csp 2At-risk-theft from the person 12Attempt - theft $20,000 or more 12Attempt - theft/series over $20,000 1Conspiracy theft $20,000 or more 6Theft $1000-$20,000 1764Theft-$10,000 or more-att 1Theft-$1000-$20,000 3243Theft-$15,000 or more-csp 2Theft-$20,000 or more-att 4Theft-$20,000 or more-csp 2Theft-$200-$10,000 7Theft-$300-$10,000 63Theft-$400-$15,000 5Theft-$500-$15,000 434Theft/series - $1000-$20,000 486Theft/series-$1000-$20,000 799Theft/series-$200-$10,000 4Theft/series-$500-$15,000 94Theft/series-over $15,000-att 1Total 6946At-risk adult-theft under $500 4At-risk theft-less than $500 12At-risk-theft-less than $500 19Attempt - theft $1000-$20,000 91Attempt - theft/series $100-$20,000 3Conspiracy - theft $1000-$20,000 12Conspiracy - theft/series $1000-$20,000 4Theft $500-$15000 1Theft from the person 248Theft-$1000-$20,000-att 110Theft-$1000-$20,000-csp 22Theft-$200-$10,000-att 2Theft-$300-$10,000-att 1Theft-$500-$15,000-att 5Theft-$500-$15,000-csp 14Theft-from the person 12Theft/series-$1000-$20,000-att 9Theft/series-$1000-$20,000-csp 4Theft/series-$500-$15,000-csp 1Total 574
Table 1: Most Serious Theft Filing Charges:
Cases January 2008 through September 2010
F3
F4
F5
9

Page 2
Law class Law description Number of Cases
Table 1: Most Serious Theft Filing Charges:
Cases January 2008 through September 2010
F3 Theft from the person-att 93Theft from the person-csp 3Total 96Theft $500-$1000 1163Theft-$500-$1000 2281Theft-$500-$1000-att 1Theft-under $100 2Total 3447Attempt - theft $500-$1000 51Conspiracy - theft $500-$1000 6Theft $500-$1000 1Theft under $500 3331Theft-$100-$400 78Theft-$100-$500 225Theft-$50-$200 133Theft-$50-$300 598Theft-$500-$1000-att 39Theft-$500-$1000-csp 11Theft-under $100 7Theft-under $500 6222Total 10702Unspecified 1Attempt - theft under $500 81Conspiracy - theft under $500 7Theft - under $100 - attempt 21Theft under $500 2Theft-$100-$500-att 3Theft-$100-$500-csp 1Theft-$50-$200-att 2Theft-$50-$300-att 33Theft-$50-$300-csp 4Theft-$500-$1000 1Theft-under $100 570Theft-under $100 (repealed 6/30/07) 12Theft-under $100-att 1Theft-under $100-csp 2Theft-under $50 180Theft-under $50-att 5Theft-under $500-att 113Theft-under $500-csp 26Total 1065
* Includes workrelease** Includes community service, home monitoring, treatment, fees and fines. Source: Includes CR and adult misdemeanor filings CY 2008-Sept. 2010. Data exracted from ICON and analyzed by DCJ/ORS. Filings from Denver county court are excluded.
F6
M1
M2
M3
10
3
Count % Count %
F3 873 3.7% 336 4.7% 532 3.2%F4 6946 29.3% 2134 29.6% 4774 29.1%F5 574 2.4% 149 2.1% 425 2.6%F6 96 0.4% 20 0.3% 76 0.5%M1 3447 14.5% 1055 14.6% 2384 14.5%M2 10702 45.2% 3196 44.4% 7467 45.5%M3 1065 4.5% 313 4.3% 749 4.6%Total 23703 100.0% 7203 100.0% 16407 100.0%
Count % Count % Count % Count %
F3 873 3.7% 742 3.8% 56 2.7% 40 2.4% 34 6.0%F4 6946 29.3% 5597 29.0% 669 32.2% 474 28.2% 190 33.6%F5 574 2.4% 416 2.2% 92 4.4% 52 3.1% 14 2.5%F6 96 0.4% 70 0.4% 15 0.7% 10 0.6% 1 0.2%M1 3447 14.5% 2739 14.2% 340 16.4% 278 16.5% 86 15.2%M2 10702 45.2% 8899 46.1% 800 38.6% 744 44.3% 226 39.9%M3 1065 4.5% 861 4.5% 103 5.0% 82 4.9% 15 2.7%Total 23703 100.0% 19324 100.0% 2075 100.0% 1680 100.0% 566 100.0%
Source: Includes CR and adult misdemeanor filings CY 2008-Sept. 2010. Data exracted from ICON and analyzed by DCJ/ORS. Filings from Denver county court are excluded.
Hispanic OtherBlackWhite
Table 2. Most Serious Theft Filing Charges: Law Class by Gender
Cases January 2008 through September 2010
Table 3. Most Serious Theft Filing Charges: Law Class by Race/Ethnicity
Cases January 2008 through September 2010
ClassNumber of
Cases
Percent of
Cases
Percent of
Cases
Women MenClass
Number of
Cases
11
4
Number of
Cases% of Cases
Number of
Cases% of Cases
F3 203 1.7% 86 2.1% 116 1.5%F4 2297 19.3% 897 21.7% 1390 18.0%F5 862 7.3% 269 6.5% 590 7.7%F6 172 1.4% 51 1.2% 121 1.6%M1 2111 17.8% 689 16.7% 1415 18.4%M2 5102 43.0% 1735 42.1% 3354 43.5%M3 1125 9.5% 399 9.7% 721 9.4%Total 11872 100.0% 4126 100.0% 7707 100.0%
Count % Count % Count % Count %
F3 203 1.7% 182 1.9% 9 0.9% 4 0.5% 8 2.7%F4 2297 19.3% 1845 19.0% 222 23.2% 153 17.6% 74 25.0%F5 862 7.3% 666 6.8% 108 11.3% 71 8.2% 16 5.4%F6 172 1.4% 130 1.3% 22 2.3% 17 2.0% 3 1.0%M1 2111 17.8% 1702 17.5% 200 20.9% 158 18.2% 49 16.6%M2 5102 43.0% 4249 43.7% 325 33.9% 389 44.9% 124 41.9%M3 1125 9.5% 950 9.8% 72 7.5% 75 8.7% 22 7.4%Total 11872 100.0% 9724 100.0% 958 100.0% 867 100.0% 296 100.0%
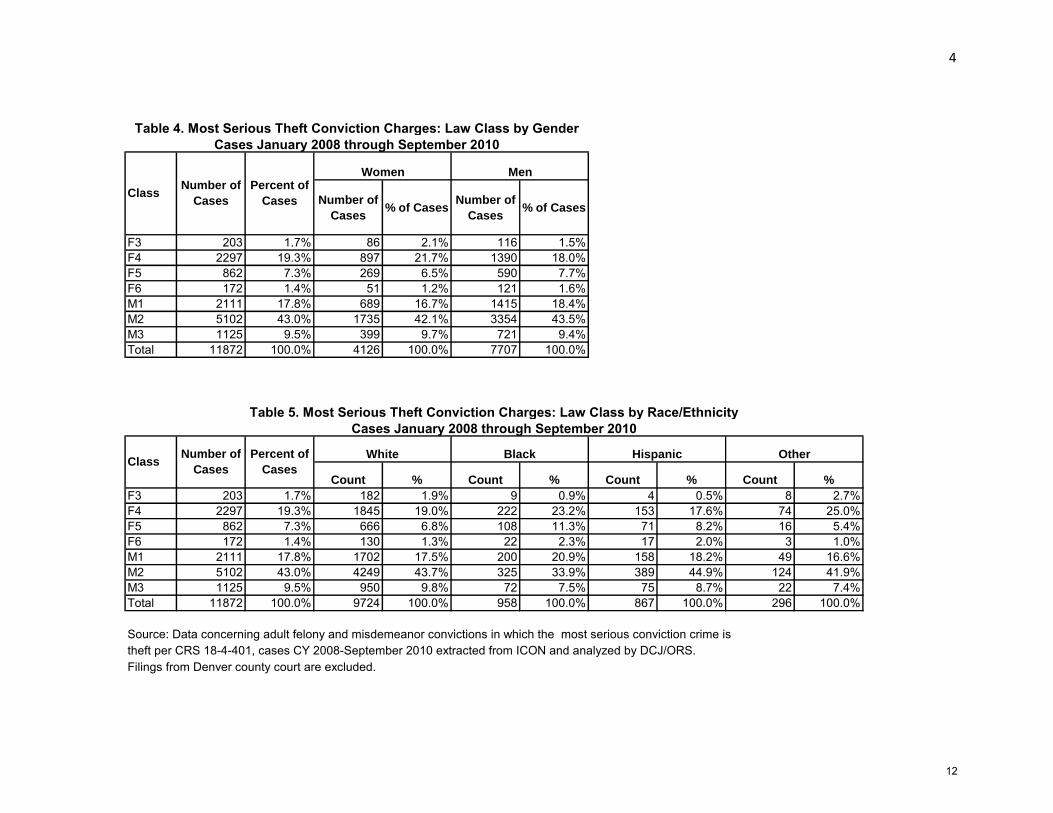
Source: Data concerning adult felony and misdemeanor convictions in which the most serious conviction crime istheft per CRS 18-4-401, cases CY 2008-September 2010 extracted from ICON and analyzed by DCJ/ORS. Filings from Denver county court are excluded.
Table 5. Most Serious Theft Conviction Charges: Law Class by Race/Ethnicity
Cases January 2008 through September 2010
ClassNumber of
Cases
Percent of
Cases
White Black Hispanic Other
Table 4. Most Serious Theft Conviction Charges: Law Class by Gender
Cases January 2008 through September 2010
ClassNumber of
Cases
Percent of
Cases
Women Men
12
5
Count
% within
district Count
% within
district Count
% within
district Count
% within
district Count
% within
district Count
% within
district Count
% within
district
1 1508 21 1.4% 253 16.8% 89 5.9% 48 3.2% 235 15.6% 631 41.8% 231 15.3% 100%2 898 49 5.5% 396 44.1% 176 19.6% 31 3.5% 222 24.7% 23 2.6% 1 0.1% 100%3 101 0.0% 13 12.9% 7 6.9% 0.0% 15 14.9% 61 60.4% 5 5.0% 100%4 1316 21 1.6% 333 25.3% 63 4.8% 1 0.1% 213 16.2% 552 41.9% 133 10.1% 100%5 254 4 1.6% 48 18.9% 12 4.7% 0.0% 53 20.9% 119 46.9% 18 7.1% 100%6 179 1 0.6% 34 19.0% 7 3.9% 0.0% 32 17.9% 88 49.2% 17 9.5% 100%7 214 6 2.8% 44 20.6% 16 7.5% 0.0% 31 14.5% 115 53.7% 2 0.9% 100%8 1131 6 0.5% 155 13.7% 95 8.4% 2 0.2% 129 11.4% 503 44.5% 241 21.3% 100%9 173 3 1.7% 46 26.6% 10 5.8% 1 0.6% 22 12.7% 85 49.1% 6 3.5% 100%10 407 3 0.7% 79 19.4% 33 8.1% 2 0.5% 124 30.5% 152 37.3% 14 3.4% 100%11 207 6 2.9% 30 14.5% 5 2.4% 0.0% 35 16.9% 114 55.1% 17 8.2% 100%12 127 1 0.8% 7 5.5% 4 3.1% 0.0% 29 22.8% 57 44.9% 29 22.8% 100%13 109 1 0.9% 27 24.8% 9 8.3% 0.0% 21 19.3% 47 43.1% 4 3.7% 100%14 244 4 1.6% 21 8.6% 6 2.5% 2 0.8% 28 11.5% 133 54.5% 50 20.5% 100%15 83 0.0% 3 3.6% 2 2.4% 1 1.2% 21 25.3% 50 60.2% 6 7.2% 100%16 115 0.0% 10 8.7% 4 3.5% 1 0.9% 11 9.6% 72 62.6% 17 14.8% 100%17 968 15 1.5% 116 12.0% 87 9.0% 73 7.5% 383 39.6% 222 22.9% 72 7.4% 100%18 1130 32 2.8% 273 24.2% 94 8.3% 7 0.6% 150 13.3% 518 45.8% 56 5.0% 100%19 683 7 1.0% 156 22.8% 41 6.0% 2 0.3% 92 13.5% 353 51.7% 32 4.7% 100%20 1448 12 0.8% 133 9.2% 65 4.5% 1 0.1% 182 12.6% 911 62.9% 144 9.9% 100%21 516 10 1.9% 110 21.3% 31 6.0% 0.0% 67 13.0% 268 51.9% 30 5.8% 100%22 61 1 1.6% 10 16.4% 6 9.8% 0.0% 16 26.2% 28 45.9% 0.0% 100%Total 11872 203 1.7% 2297 19.3% 862 7.3% 172 1.4% 2111 17.8% 5102 43.0% 1125 9.5% 100%
Source: Data concerning adult felony and misdemeanor convictions in which the most serious conviction crime istheft per CRS 18-4-401, cases CY 2008-September 2010 extracted from ICON and analyzed by DCJ/ORS. Filings from Denver county court are excluded.
Table 6. Theft Convictions: Most Serious Law Class by Judicial District:
Cases January 2008 through September 2010
Total %
Judicial
District
F3 F4 F5 F6 M1 M2 M3
Number
of cases
13
6
Count
% within
class Count
% within
class Count
% within
class Count
% within
class Count
% within
class Count
% within
class Count
% within
class
1 1508 21 10.3% 253 11.0% 89 10.3% 48 27.9% 235 11.1% 631 12.4% 231 20.5% 12.7%2 898 49 24.1% 396 17.2% 176 20.4% 31 18.0% 222 10.5% 23 0.5% 1 0.1% 7.6%3 101 0.0% 13 0.6% 7 0.8% 0.0% 15 0.7% 61 1.2% 5 0.4% 0.9%4 1316 21 10.3% 333 14.5% 63 7.3% 1 0.6% 213 10.1% 552 10.8% 133 11.8% 11.1%5 254 4 2.0% 48 2.1% 12 1.4% 0.0% 53 2.5% 119 2.3% 18 1.6% 2.1%6 179 1 0.5% 34 1.5% 7 0.8% 0.0% 32 1.5% 88 1.7% 17 1.5% 1.5%7 214 6 3.0% 44 1.9% 16 1.9% 0.0% 31 1.5% 115 2.3% 2 0.2% 1.8%8 1131 6 3.0% 155 6.7% 95 11.0% 2 1.2% 129 6.1% 503 9.9% 241 21.4% 9.5%9 173 3 1.5% 46 2.0% 10 1.2% 1 0.6% 22 1.0% 85 1.7% 6 0.5% 1.5%10 407 3 1.5% 79 3.4% 33 3.8% 2 1.2% 124 5.9% 152 3.0% 14 1.2% 3.4%11 207 6 3.0% 30 1.3% 5 0.6% 0.0% 35 1.7% 114 2.2% 17 1.5% 1.7%12 127 1 0.5% 7 0.3% 4 0.5% 0.0% 29 1.4% 57 1.1% 29 2.6% 1.1%13 109 1 0.5% 27 1.2% 9 1.0% 0.0% 21 1.0% 47 0.9% 4 0.4% 0.9%14 244 4 2.0% 21 0.9% 6 0.7% 2 1.2% 28 1.3% 133 2.6% 50 4.4% 2.1%15 83 0.0% 3 0.1% 2 0.2% 1 0.6% 21 1.0% 50 1.0% 6 0.5% 0.7%16 115 0.0% 10 0.4% 4 0.5% 1 0.6% 11 0.5% 72 1.4% 17 1.5% 1.0%17 968 15 7.4% 116 5.1% 87 10.1% 73 42.4% 383 18.1% 222 4.4% 72 6.4% 8.2%18 1130 32 15.8% 273 11.9% 94 10.9% 7 4.1% 150 7.1% 518 10.2% 56 5.0% 9.5%19 683 7 3.4% 156 6.8% 41 4.8% 2 1.2% 92 4.4% 353 6.9% 32 2.8% 5.8%20 1448 12 5.9% 133 5.8% 65 7.5% 1 0.6% 182 8.6% 911 17.9% 144 12.8% 12.2%21 516 10 4.9% 110 4.8% 31 3.6% 0.0% 67 3.2% 268 5.3% 30 2.7% 4.3%22 61 1 0.5% 10 0.4% 6 0.7% 0.0% 16 0.8% 28 0.5% 0.0% 0.5%Total 11872 203 100.0% 2297 100.0% 862 100.0% 172 100.0% 2111 100.0% 5102 100.0% 1125 100.0% 100.0%
Source: Data concerning adult felony and misdemeanor convictions in which the most serious conviction crime istheft per CRS 18-4-401, cases CY 2008-September 2010 extracted from ICON and analyzed by DCJ/ORS. Filings from Denver county court are excluded.
Table 7. Theft Convictions: Most Serious Law Class by Judicial District:
Cases January 2008 through September 2010
Number of
cases
F3 F4 F5 F6 M1 M2 M3
Total %
Judicial
District
14
7
Black Hispanic Other White Female MaleDeferred 55.6% 75.0% 62.5% 25.6% 31.8% 27.0% 29.4% 58Probation 11.1% 25.0% 0.0% 17.0% 20.0% 13.5% 16.2% 32Probation/ Jail* 22.2% 0.0% 0.0% 17.6% 18.8% 15.3% 16.8% 33ComCor 0.0% 0.0% 12.5% 8.0% 5.9% 9.0% 7.6% 15DOC 11.1% 0.0% 25.0% 29.5% 18.8% 35.1% 27.9% 55Else** 0.0% 0.0% 0.0% 2.3% 4.7% 0.0% 2.0% 4Total 100.0% 100.0% 100.0% 100.0% 100.0% 100.0% 100.0% 197Total N 9 4 8 176 85 111 197 1973-4 years 0.0% 50.0% 9.6% 12.5% 10.3% 10.9% 64-5 years 0.0% 50.0% 7.7% 0.0% 12.8% 9.1% 55-6 years 0.0% 0.0% 21.2% 25.0% 17.9% 20.0% 11>=7 years 100.0% 0.0% 61.5% 62.5% 59.0% 60.0% 33Total 100.0% 100.0% 100.0% 100.0% 100.0% 100.0% 55Mean Days 7300.0 1642.5 3495.6 3011.3 3696.8 3497.4 55
Time Serveda 1467.0 40Deferred 51.8% 54.0% 50.7% 42.4% 52.7% 39.0% 44.4% 994Probation 22.5% 18.0% 13.7% 16.8% 16.9% 17.8% 17.4% 389Probation/ Jail* 5.9% 12.0% 13.7% 12.3% 11.7% 11.6% 11.7% 262ComCor 5.4% 5.3% 5.5% 6.3% 3.9% 7.6% 6.1% 137DOC 12.6% 8.0% 9.6% 14.7% 5.7% 19.3% 13.9% 311Else** 1.8% 2.7% 6.8% 7.4% 9.2% 4.7% 6.6% 147Total 100.0% 100.0% 100.0% 100.0% 100.0% 100.0% 100.0% 2240Total N 222 150 73 1793 881 1349 2240 2240<=2 years 10.7% 16.7% 0.0% 15.9% 10.0% 16.2% 15.1% 472-3 years 7.1% 8.3% 0.0% 12.1% 4.0% 12.7% 11.3% 353-4 years 25.0% 16.7% 28.6% 24.6% 36.0% 22.3% 24.4% 764-5 years 7.1% 8.3% 14.3% 14.8% 14.0% 13.8% 13.8% 435-6 years 21.4% 33.3% 28.6% 17.0% 18.0% 18.5% 18.3% 57>=7 years 28.6% 16.7% 28.6% 15.5% 18.0% 16.5% 17.0% 53Total 100.0% 100.0% 100.0% 100.0% 100.0% 100.0% 100.0% 311Mean Days 2235.6 1800.8 2033.6 1734.5 1832.3 1777.6 1788.9 311
Time Serveda 834.9 379Deferred 9.5% 11.9% 20.0% 13.8% 17.1% 11.5% 13.2% 111Probation 53.3% 38.8% 26.7% 35.8% 46.8% 34.0% 38.0% 319Probation/ Jail* 13.3% 10.4% 20.0% 15.2% 16.3% 14.0% 14.7% 123ComCor 6.7% 10.4% 0.0% 12.3% 8.4% 12.6% 11.2% 94DOC 15.2% 22.4% 26.7% 20.7% 9.5% 25.1% 20.4% 171Else** 1.9% 6.0% 6.7% 2.2% 1.9% 2.8% 2.5% 21Total 100.0% 100.0% 100.0% 100.0% 100.0% 100.0% 100.0% 839Total N 105 67 15 651 263 573 839 839<=2 years 43.8% 46.7% 50.0% 45.2% 40.0% 45.8% 45.0% 772-3 years 18.8% 26.7% 25.0% 35.6% 32.0% 33.3% 33.3% 573-4 years 12.5% 6.7% 25.0% 8.1% 20.0% 6.9% 8.8% 154-5 years 12.5% 13.3% 0.0% 3.0% 0.0% 5.6% 4.7% 85-6 years 12.5% 6.7% 0.0% 5.2% 8.0% 5.6% 5.8% 10>=7 years 0.0% 0.0% 0.0% 3.0% 0.0% 2.8% 2.3% 4Total 100.0% 100.0% 100.0% 100.0% 100.0% 100.0% 100.0% 171Mean Days 1149.2 1045.8 821.3 1075.1 1065.2 1079.9 1073.6 171
Time Serveda 464.7 116
Race/Ethnicity Sex
F5
DOC Sentences
F4
DOC Sentences
Total N
Cases January 2008 through September 2010
Table 8. Theft Conviction Sentences by Class, Race/Ethnicity and Gender:
Sentence
Sentence
TotalSentenceF3
DOC Sentences
15
Race/Ethnicity SexTotal N
Cases January 2008 through September 2010
Table 8. Theft Conviction Sentences by Class, Race/Ethnicity and Gender:
Total
Deferred 0.0% 0.0% 0.0% 4.0% 0.0% 4.3% 3.0% 5Probation 57.1% 52.9% 66.7% 44.8% 61.2% 41.9% 47.6% 79Probation/ Jail* 14.3% 11.8% 0.0% 14.4% 14.3% 13.7% 13.9% 23ComCor 0.0% 17.6% 33.3% 12.0% 10.2% 12.0% 11.4% 19DOC 23.8% 17.6% 0.0% 20.0% 12.2% 23.1% 19.9% 33Else** 4.8% 0.0% 0.0% 4.8% 2.0% 5.1% 4.2% 7Total 100.0% 100.0% 100.0% 100.0% 100.0% 100.0% 100.0% 166Total N 21 17 3 125 49 117 166 166<=2 years 80.0% 100.0% 80.0% 100.0% 77.8% 81.8% 272-3 years 20.0% 0.0% 20.0% 0.0% 22.2% 18.2% 6Total 100.0% 100.0% 100.0% 100.0% 100.0% 100.0% 33Mean Days 627.0 303.3 597.3 488.3 594.3 575.1 33
Time Serveda 244.2 22Deferred 6.7% 10.8% 26.5% 10.6% 14.9% 8.5% 10.6% 221Probation 59.6% 48.7% 42.9% 51.4% 59.2% 48.1% 51.8% 1077Probation/ Jail* 11.4% 17.1% 8.2% 12.9% 10.5% 14.1% 12.9% 269Else** 22.3% 23.4% 22.4% 25.1% 15.5% 29.2% 24.7% 513Total 100.0% 100.0% 100.0% 100.0% 100.0% 100.0% 100.0% 2080Total N 193 158 49 1678 679 1394 2080 2080Deferred 17.6% 12.6% 28.7% 25.7% 28.4% 22.1% 24.3% 1225Probation 26.9% 38.7% 30.3% 31.0% 37.5% 28.0% 31.2% 1576Probation/ Jail* 11.8% 12.6% 7.4% 10.7% 8.6% 12.0% 10.8% 547Else** 43.7% 36.1% 33.6% 32.7% 25.5% 38.0% 33.7% 1703Total 100.0% 100.0% 100.0% 100.0% 100.0% 100.0% 100.0% 5051Total N 323 382 122 4209 1716 3322 5051 5051Deferred 16.9% 10.7% 14.3% 16.1% 17.3% 14.9% 15.6% 174Probation 32.4% 36.0% 33.3% 39.6% 43.9% 35.9% 38.7% 430Probation/ Jail* 14.1% 5.3% 4.8% 7.1% 5.1% 8.8% 7.5% 83Else** 36.6% 48.0% 47.6% 37.2% 33.8% 40.4% 38.2% 425Total 100.0% 100.0% 100.0% 100.0% 100.0% 100.0% 100.0% 1112
Total N 71 75 21 939 394 713 1112 1112
* Includes workrelease** Includes community service, home monitoring, treatment, fees and fines.
Source: Data concerning adult felony and misdemeanor convictions in which the most serious conviction crime istheft per CRS 18-4-401, cases CY 2008-September 2010 extracted from ICON and analyzed by DCJ/ORS. Filings from Denver county court are excluded. a Data provided by the Department of Corrections for FY 2009 releases. Data concerning race, ethnicity,and gender not available.
F6
DOC Sentences
M3 Sentence
Sentence
M1 sentence
M2 Sentence
16
9
Percent Count Percent CountNone 10.0% 1 75.0% 31 Prior Adult 30.0% 3 0.0% 02 or More Prior Adult 60.0% 6 25.0% 1Total 100.0% 10 100.0% 4None 7.7% 4 29.4% 10Juvenile only 3.8% 2 2.9% 11 Prior Adult 15.4% 8 32.4% 112 or More Prior Adult 73.1% 38 35.3% 12Total 100.0% 52 100.0% 34None 0.0% 0 20.0% 4Juvenile only 0.0% 0 10.0% 21 Prior Adult 15.4% 2 30.0% 62 or More Prior Adult 84.6% 11 40.0% 8Total 100.0% 13 100.0% 20Juvenile only 0.0% 0 20.0% 11 Prior Adult 0.0% 0 40.0% 22 or More Prior Adult 100.0% 5 40.0% 2Total 100.0% 5 100.0% 5None 22.2% 4Juvenile only 0.0% 01 Prior Adult 50.0% 92 or More Prior Adult 27.8% 5Total 100.0% 181 Prior Adult 100.0% 1Total 100.0% 1
Source; Data collected by DCJ researchers from the 10 Colorado judicial districtswith the largest number of filings during 2005. The data presented here are basedon random samples of individuals sentenced to probation and to DOC during 2006.
Table 9. Criminal History of Offenders With A Most Serious Conviction Crime of Theft
DOC
F6
M2
F3
F4
F5
ProbationSentence
Theft Conviction Felony Class
Criminal History: Prior Felony Arrest Charges
M3
17
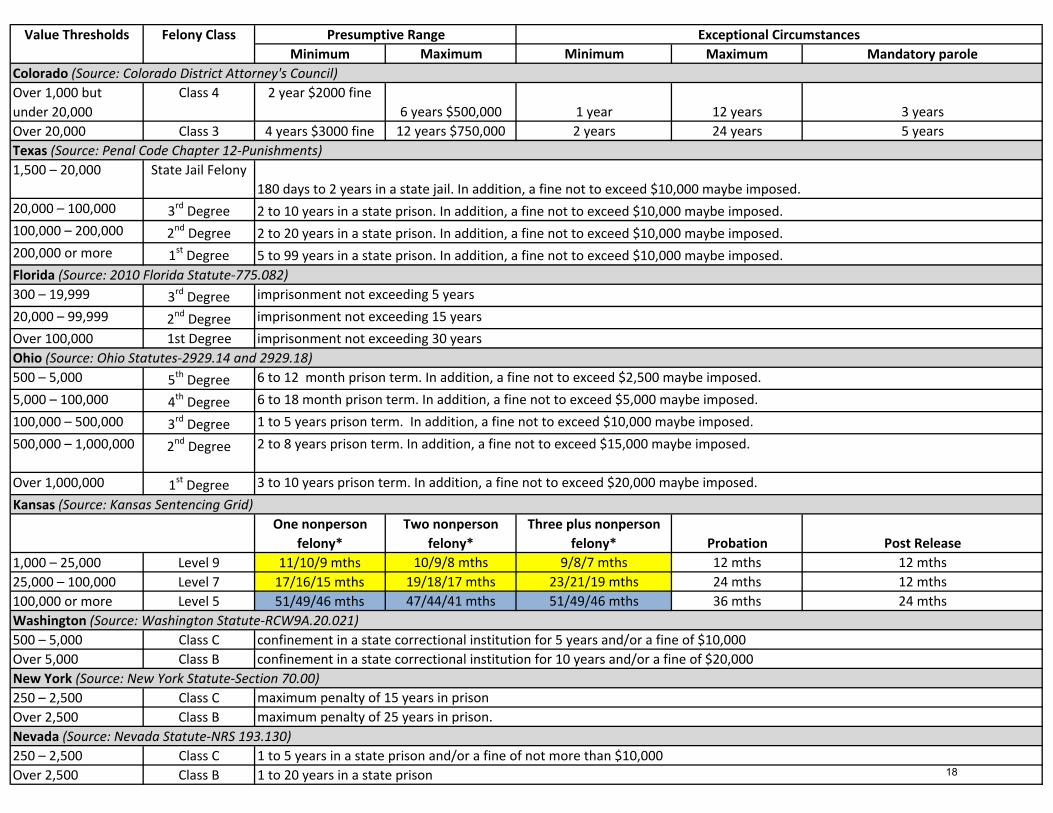
Minimum Maximum Minimum Maximum Mandatory parole
Over 1,000 but
under 20,000
Class 4 2 year $2000 fine
6 years $500,000 1 year 12 years 3 years
Over 20,000 Class 3 4 years $3000 fine 12 years $750,000 2 years 24 years 5 years
1,500 – 20,000 State Jail Felony
20,000 – 100,000 3rd Degree
100,000 – 200,000 2nd Degree
200,000 or more 1st Degree
300 – 19,999 3rd Degree
20,000 – 99,999 2nd Degree
Over 100,000 1st Degree
500 – 5,000 5th Degree
5,000 – 100,000 4th Degree
100,000 – 500,000 3rd Degree
500,000 – 1,000,000 2nd Degree
Over 1,000,000 1st Degree
One nonperson
felony*
Two nonperson
felony*
Three plus nonperson
felony* Probation Post Release
1,000 – 25,000 Level 9 11/10/9 mths 10/9/8 mths 9/8/7 mths 12 mths 12 mths
25,000 – 100,000 Level 7 17/16/15 mths 19/18/17 mths 23/21/19 mths 24 mths 12 mths
100,000 or more Level 5 51/49/46 mths 47/44/41 mths 51/49/46 mths 36 mths 24 mths
500 – 5,000 Class C
Over 5,000 Class B
250 – 2,500 Class C
Over 2,500 Class B
250 – 2,500 Class C
Over 2,500 Class B
Texas (Source: Penal Code Chapter 12‐Punishments)
Ohio (Source: Ohio Statutes‐2929.14 and 2929.18)
Florida (Source: 2010 Florida Statute‐775.082)
confinement in a state correctional institution for 10 years and/or a fine of $20,000
confinement in a state correctional institution for 5 years and/or a fine of $10,000
Nevada (Source: Nevada Statute‐NRS 193.130)
2 to 20 years in a state prison. In addition, a fine not to exceed $10,000 maybe imposed.
5 to 99 years in a state prison. In addition, a fine not to exceed $10,000 maybe imposed.
3 to 10 years prison term. In addition, a fine not to exceed $20,000 maybe imposed.
2 to 8 years prison term. In addition, a fine not to exceed $15,000 maybe imposed.
1 to 5 years prison term. In addition, a fine not to exceed $10,000 maybe imposed.
6 to 18 month prison term. In addition, a fine not to exceed $5,000 maybe imposed.
maximum penalty of 15 years in prison
maximum penalty of 25 years in prison.
1 to 5 years in a state prison and/or a fine of not more than $10,000
1 to 20 years in a state prison
Kansas (Source: Kansas Sentencing Grid)
Washington (Source: Washington Statute‐RCW9A.20.021)
New York (Source: New York Statute‐Section 70.00)
Presumptive Range Exceptional CircumstancesValue Thresholds Felony Class
180 days to 2 years in a state jail. In addition, a fine not to exceed $10,000 maybe imposed.
Colorado (Source: Colorado District Attorney's Council)
2 to 10 years in a state prison. In addition, a fine not to exceed $10,000 maybe imposed.
imprisonment not exceeding 15 years
imprisonment not exceeding 5 years
6 to 12 month prison term. In addition, a fine not to exceed $2,500 maybe imposed.
imprisonment not exceeding 30 years
18

500 – 10,000 Class H
10,000 – 100,000 Class G
Over 100,000 Class E
500 – 2,500 4th Degree
2,500 – 25,000 3rd Degree
Over 25,000 2nd Degree
500 – 25,000 Class C
Over 25,000 Class B
Mitigated Minimum Presumptive Maximum Aggravated
250 – 1,000 Class 6 0.33 years 0.5 years 1 year 1.5 years 2 years
1,000 – 2,000 Class 5 0.5 years 0.75 years 1.5 years 2 years 2.5 years
2,000 – 3,000 Class 4 1 year 1.5 years 2.5 years 3 years 3.75 years
3,000 – 25,000 Class 3 2 years 2.5 years 3.5 years 7 years 8.75 years
Over 25,000 Class 2 3 years 4 years 5 years 10 years 12.5 years
250 – 1,000 Class 6 0.3 years 0.5 years 1 year 1.5 years 1.8 years
1,000 – 2,000 Class 5 0.5 years 0.75 years 1.5 years 2 years 2.5 years
2,000 – 3,000 Class 4 1.1 years 1.5 years 2.5 years 3 years 3.75 years
3,000 – 25,000 Class 3 1.8 years 2.5 years 3.5 years 7 years 8.75 years
Over 25,000 Class 2 3 years 4 years 5 years 10 years 12.5 years
250 – 1,000 Class 6 0.75 years 1 year 1.75 years 2.25 years 2.75 years
1,000 – 2,000 Class 5 1 year 1.5 years 2.25 years 3 years 3.75 years
2,000 – 3,000 Class 4 2.25 years 3 years 4.5 years 6 years 7.5 years
3,000 – 25,000 Class 3 3.3 years 4.5 years 6.5 years 13 years 16.25 years
Over 25,000 Class 2 4.5 years 6 years 9.25 years 18.5 years 23.1 years
250 – 1,000 Class 6 2.25 years 3 years 3.75 years 4.5 years 5.75 years
1,000 – 2,000 Class 5 3 years 4 years 5 years 6 years 7.5 years
2,000 – 3,000 Class 4 6 years 8 years 10 years 12 years 15 years
3,000 – 25,000 Class 3 7.5 years 10 years 11.25 years 20 years 25 years
Over 25,000 Class 2 10.5 years 14 years 15.75 years 28 years 35 years
Over 1,000 Class D 1 to 5 years imprisonment
the term of confinement in prison may not exceed 10 years.
18 months imprisonment, In addition, a fine not to exceed $5,000 maybe imposed.
Repetitve offense‐Category One**
Repetitve offense‐Category Two***
Repetitve offense‐Category Three****
Wisconsin (Source: Wisconsin Statute‐973.01)
New Mexico (Source: New Mexico Statute‐31‐18‐15)
Missouri (Source: Missouri Statute‐Section 557.021)
3 years imprisonment. In addition, a fine not to exceed $5,000 maybe imposed.
9 years imprisonment. In addition, a fine not to exceed $10,000 maybe imposed.
maximum term of imprisonment authorized is ten years
maximum term of imprisonment authorized exceeds ten years but is less than twenty years
First offense
the term of confinement in prison may not exceed 5 years.
the term of confinement in prison may not exceed 3 years.
Arizona (Source: Arizona Statute‐13‐702 and 13‐703)
Connecticut (Source: Connecticut Penal Code‐Updated and Revised)19
Over 5,000 Class C
Over 10,000 Class B
Over 500 Class C
Over 10,000 Class B
Over 1,000 Class 4
Over 10,000 Class 3
500 – 1,000 Class E
1,000 – 10,000 Class D
10,000 – 60,000 Class C
Over 60,000 Class B
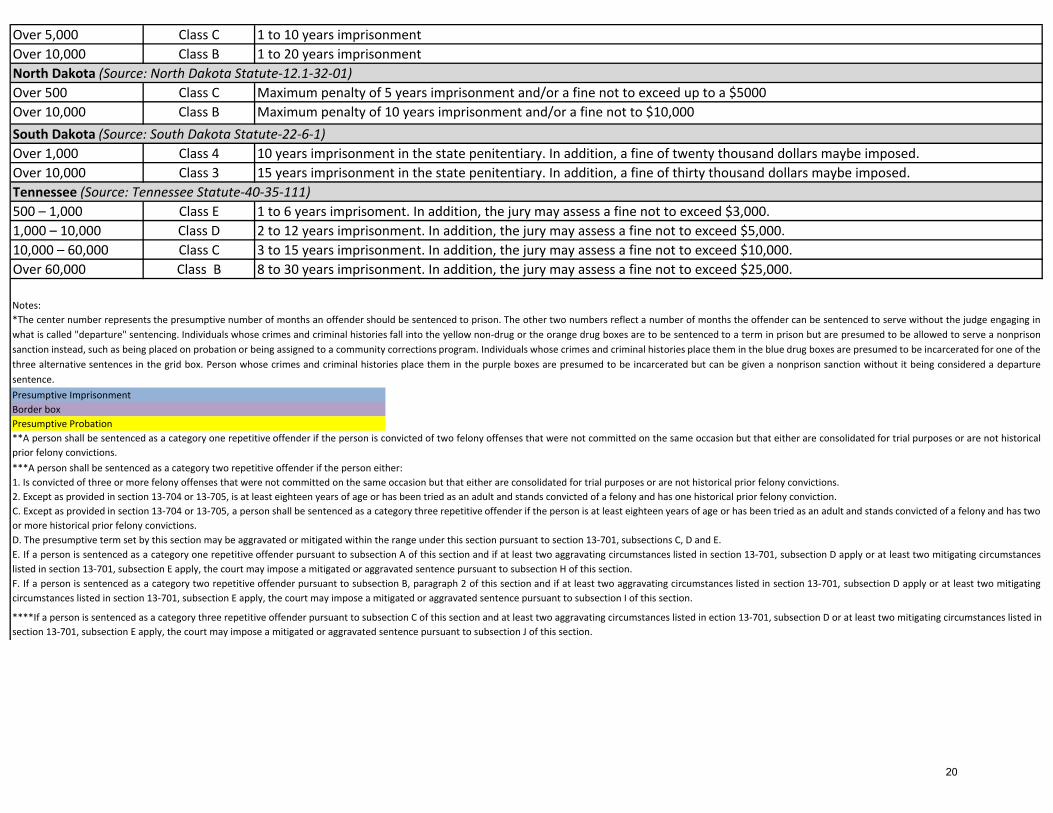
Notes:
*The center number represents the presumptive number of months an offender should be sentenced to prison. The other two numbers reflect a number of months the offender can be sentenced to serve without the judge engaging in
what is called "departure" sentencing. Individuals whose crimes and criminal histories fall into the yellow non‐drug or the orange drug boxes are to be sentenced to a term in prison but are presumed to be allowed to serve a nonprison
sanction instead, such as being placed on probation or being assigned to a community corrections program. Individuals whose crimes and criminal histories place them in the blue drug boxes are presumed to be incarcerated for one of the
three alternative sentences in the grid box. Person whose crimes and criminal histories place them in the purple boxes are presumed to be incarcerated but can be given a nonprison sanction without it being considered a departure
sentence.
**A person shall be sentenced as a category one repetitive offender if the person is convicted of two felony offenses that were not committed on the same occasion but that either are consolidated for trial purposes or are not historical
prior felony convictions.
North Dakota (Source: North Dakota Statute‐12.1‐32‐01)
South Dakota (Source: South Dakota Statute‐22‐6‐1)
Tennessee (Source: Tennessee Statute‐40‐35‐111)
1 to 6 years imprisoment. In addition, the jury may assess a fine not to exceed $3,000.
2 to 12 years imprisonment. In addition, the jury may assess a fine not to exceed $5,000.
3 to 15 years imprisonment. In addition, the jury may assess a fine not to exceed $10,000.
8 to 30 years imprisonment. In addition, the jury may assess a fine not to exceed $25,000.
1 to 10 years imprisonment
1 to 20 years imprisonment
Maximum penalty of 5 years imprisonment and/or a fine not to exceed up to a $5000
Maximum penalty of 10 years imprisonment and/or a fine not to $10,000
10 years imprisonment in the state penitentiary. In addition, a fine of twenty thousand dollars maybe imposed.
15 years imprisonment in the state penitentiary. In addition, a fine of thirty thousand dollars maybe imposed.
***A person shall be sentenced as a category two repetitive offender if the person either:
1. Is convicted of three or more felony offenses that were not committed on the same occasion but that either are consolidated for trial purposes or are not historical prior felony convictions.
2. Except as provided in section 13‐704 or 13‐705, is at least eighteen years of age or has been tried as an adult and stands convicted of a felony and has one historical prior felony conviction.
C. Except as provided in section 13‐704 or 13‐705, a person shall be sentenced as a category three repetitive offender if the person is at least eighteen years of age or has been tried as an adult and stands convicted of a felony and has two
or more historical prior felony convictions.
D. The presumptive term set by this section may be aggravated or mitigated within the range under this section pursuant to section 13‐701, subsections C, D and E.
E. If a person is sentenced as a category one repetitive offender pursuant to subsection A of this section and if at least two aggravating circumstances listed in section 13‐701, subsection D apply or at least two mitigating circumstances
listed in section 13‐701, subsection E apply, the court may impose a mitigated or aggravated sentence pursuant to subsection H of this section.
F. If a person is sentenced as a category two repetitive offender pursuant to subsection B, paragraph 2 of this section and if at least two aggravating circumstances listed in section 13‐701, subsection D apply or at least two mitigating
circumstances listed in section 13‐701, subsection E apply, the court may impose a mitigated or aggravated sentence pursuant to subsection I of this section.
****If a person is sentenced as a category three repetitive offender pursuant to subsection C of this section and at least two aggravating circumstances listed in ection 13‐701, subsection D or at least two mitigating circumstances listed in
section 13‐701, subsection E apply, the court may impose a mitigated or aggravated sentence pursuant to subsection J of this section.
Presumptive Imprisonment
Border box
Presumptive Probation
20
Restitution Ordered and Collected on All Theft Cases Sentence between 7-1-2005 thru Present
Prepared for CCJJ Sentencing Reform Taskforce
Working Draft
November 5, 2010
Prepared by Division of Probation Services
Kris Nash
21
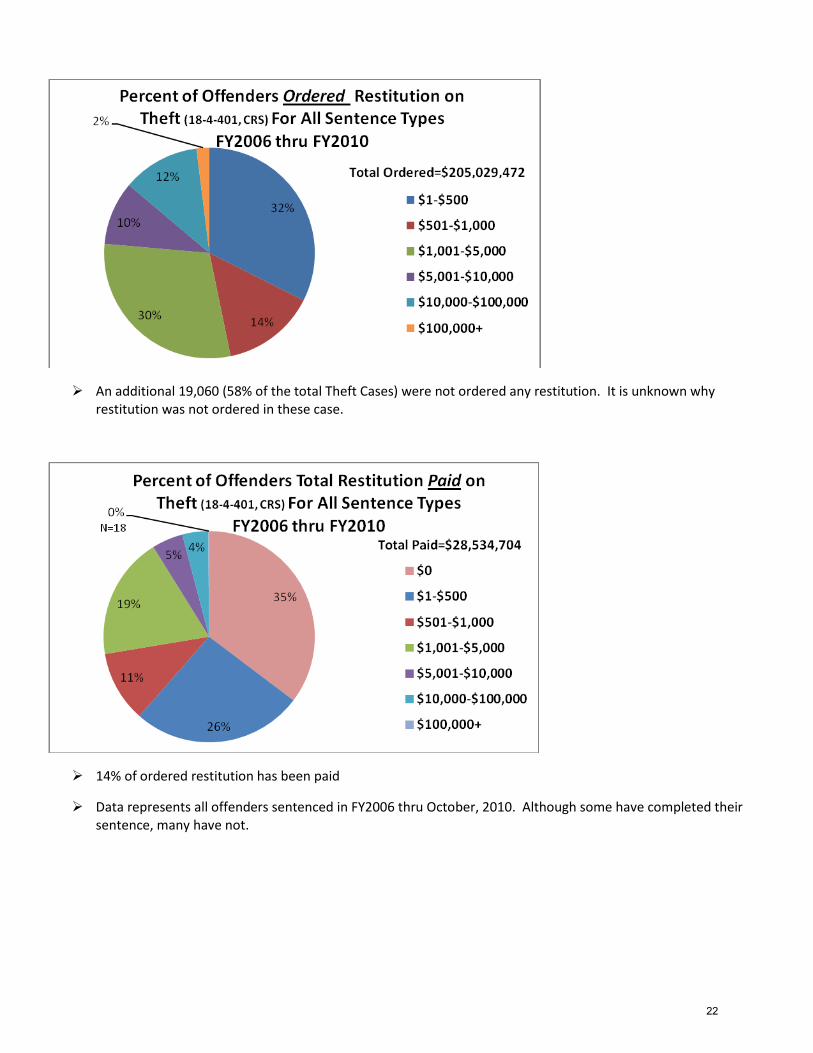
An additional 19,060 (58% of the total Theft Cases) were not ordered any restitution. It is unknown why restitution was not ordered in these case.
14% of ordered restitution has been paid
Data represents all offenders sentenced in FY2006 thru October, 2010. Although some have completed their sentence, many have not.
22

By example, the above chart indicates that on average, DOC inmates pay 16.30% of their restitution ordered
Agency Amt Ordered Amt Paid % Collected
DOC $107,657,581 $2,642,311 16.30%
Community Corrections $10,362,808 $767,439 25.95%
Probation $76,827,342 $20,765,986 45.09%
Jail $1,913,368 $454,807 26.57%
Diversion $1,461,268 $752,497 65.41%
Unsupervised $6,761,692 $3,118,672 53.06%
Community Service $45,413 $32,992 39.96%
Total $205,029,472 $28,534,704
Sentence Type Ordered Paid
DOC Mean $62,230 $1,527 Median $2,490 $0 High Range $15,379,428 $603,459
Community Corrections Mean $15,330 $1,135 Median $2,105 $141 High Range $1,152,691 $55,515
Probation Mean $10,682 $2,887 Median $1,650 $475 High Range $2,272,481 $1,294,728
Jail Mean $1,207 $287 Median $245 $0 High Range $392,292 $26,820
Diversion Mean $6,828 $3,516 Median $2,143 $865 High Range $437,476 $103,557
Unsupervised Mean $2,940 $1,356 Median $501 $187 High Range $322,636 $55,000
Community Service Mean $445 $323 Median $99 $83 High Range $11,465 $11,050
23
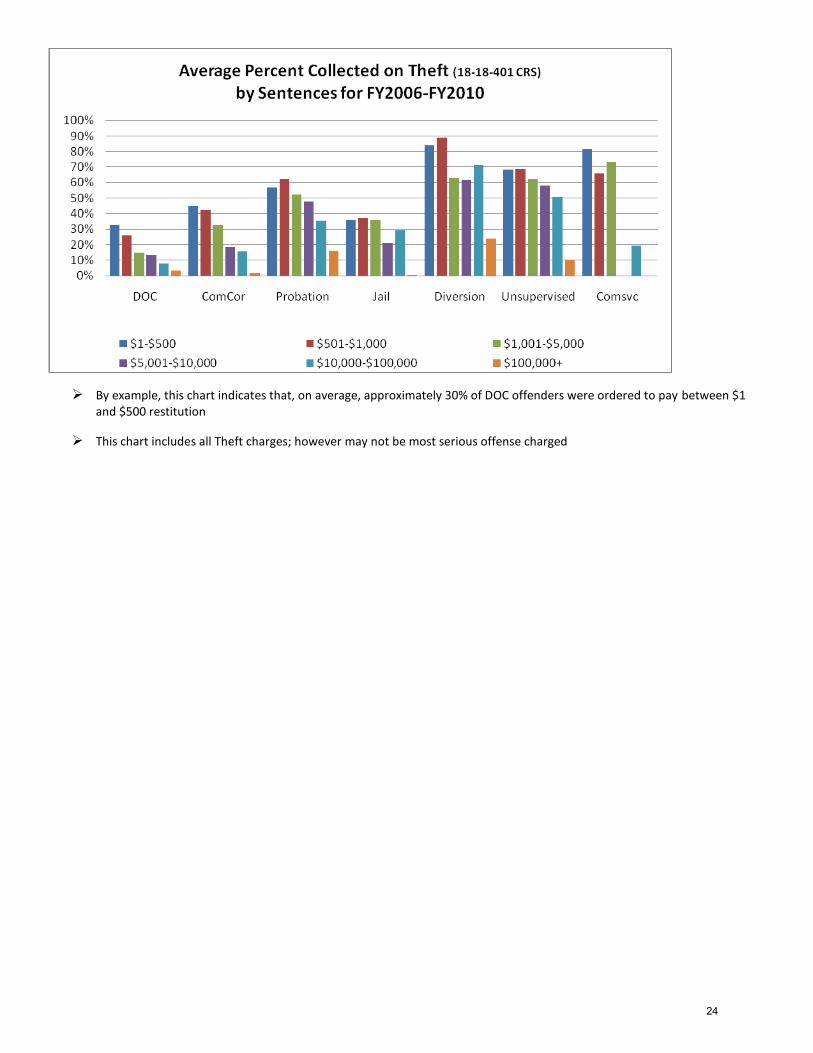
By example, this chart indicates that, on average, approximately 30% of DOC offenders were ordered to pay between $1 and $500 restitution
This chart includes all Theft charges; however may not be most serious offense charged
24


