
1
Differentiated Instruction to Support High-Risk Preschool Learners
Barbara D. DeBaryshe
University of Hawai‗i Mānoa Center on the Family
In C. Vukelich (Chair). Supporting struggling learners in preschool: Emerging approaches and
opportunities. Paper symposium presented at the 2010 American Educational Research
Association annual meeting, Denver, CO, April 30 – May 4.

2
Abstract
Differentiated instruction is a strategy for meeting the needs of diverse learners. In this paper, I
describe a differentiated instruction model and examine the effects on high-risk children. One
hundred twenty-eight children and their teachers from eight Head Start classrooms participated
in this study. Teachers provided developmentally sequenced, bi-level instruction in small group
formats. Children made gains on all areas assessed (vocabulary, emergent reading, alphabet
knowledge, print concepts, phonological awareness, emergent math). A sub-group of higher-risk
children was defined as those who scored in the bottom 5th
percentile on English vocabulary at
the start of the school year. This higher-risk group comprised 26% of the sample. Higher-risk
children made much larger gains on vocabulary over the course of the year than did their lower-
risk classmates and showed similar or slightly lower rates of change on other measures of early
academic skills. Practical issues relating to the implementation of a differentiated instruction
model are discussed.

3
High-Risk Preschool Learners
Inequality in educational opportunities and outcomes as a function of poverty, parent
education, ethnicity, and native language status remains a shameful fact of American life and
these educational disparities exist even for our youngest citizens. Preschool attendance
strengthens early academic skills and the benefits of preschool may be stronger for at-risk
children (Magnuson, Meyers, Ruhm & Waldfogel, 2004). However, preschool quality is a key
issue; only programs of exceptionally high quality are likely to result in long-term reductions in
academic disparities (Magnuson & Waldfogel, 2005). Initiatives such as Early Reading First
were developed with the goal of significantly improving the quality of curriculum and instruction
provided to at-risk preschool children in order to close the readiness gap.
Even within high-risk populations there is considerable variation in terms of children‘s
school readiness and rates of progress in the classroom over time. However, relatively little
attention has been paid to the issue of achievement disparities within at-risk populations. The
relevant data do not present a clear picture. Molfese et al. (2006) found that half of low-SES
four-year-olds in a compensatory preschool program made no gains in alphabet knowledge over
the school year. These children started the school year with low assessment in all domains and
showed little benefit from being in preschool, thus suggesting that the Matthew effect operates
even within a high-risk sample. The FACES 2000 study (Administration for Children and
Families, 2003) shows the opposite pattern—here the poor got richer and the rich got poorer. In
the FACES sample Head Start children who started the school year in the lowest quartile made
larger gains on vocabulary, alphabet knowledge and math than did their peers in the highest
quartile. In fact, children in the highest quartile showed declines over the year on standardized
scores. Finally, Kaplan and Walpole (2005) reported results for kindergarten children using
4
ECLS-K data. They found that 38% of children from families living below the poverty line
entered kindergarten with minimal knowledge of the alphabet or phonological awareness. More
disturbing, 63% of these children with low fall scores failed to make gains during the
kindergarten year. Unfortunately, these studies do not provide a clear answer concerning which
low-SES children are at risk for falling further and further behind. But they do indicate that
current educational practices are not providing many at-risk children with the support they need.
Differentiated Instruction
Children come to preschool with different home experiences, cultural backgrounds,
readiness skills, interests, and learning styles. Because of this, children learn at different rates
and may need different kinds of instructional strategies. According to Tomlinson (2000):
Differentiation consists of the efforts of teachers to respond to variance among learners in
the classroom. Whenever a teacher reaches out to an individual or group to vary his or
her teaching in order to provide the best learning experience possible, that teacher is
differentiating instruction. (p. 1)
In a differentiated instruction model, all children are taught using the same curriculum
and learning standards. However, children may be taught using different materials, learning
activities, or levels of teacher scaffolding. Children may also be allowed to show their
understanding in different modes or formats. Hallmarks of differentiated instruction include
small group teaching, flexible grouping, and continuous performance assessment to guide
instructional modifications (Tomlinson, 2000; Tomlinson & McTighe, 2006). Research
conducted with K-12 learners indicates that differentiated instruction improves children‘s
motivation and achievement (Tomlinson & McTighe, 2006). As Purcell and Rosemary (2008)
point out, differentiated instruction is integral to developmentally appropriate practice.
5
Furthermore, when differentiated instruction is skillfully conducted, all children are taught
within their zone of proximal development (Vygotsky, 1978).
The purpose of this paper is to describe a differentiated instruction model used in
an Early Reading First project and to examine the effects on at-risk preschool learners. Since the
project was conducted in Head Start classrooms, all children were at educational risk due to
socioeconomic factors. However, within this low-SES group, we identified a sub-group of
children who were especially vulnerable based on low pretest vocabulary scores. We compared
outcomes for this particularly high-risk group with those of their classroom peers. In our
discussion section, we examine challenges that would need to be addressed in using our
differentiated instruction model in typical preschool programs serving at-risk children. We also
suggest directions for future research.
Methods
Participants
Data reported here are from project year three of the Learning Connections Early
Reading First (ERF) project, which started in the fall of 2005. Participating classrooms were
from the same Head Start program, although sites were located across the island of O‗ahu. Five
classrooms followed a traditional Head Start calendar and three classrooms followed a full-day,
year-round schedule. On the average, lead teachers had over 16 years of teaching experience and
most had a bachelor‘s degree (88%). Assistant teachers had an average of 9.4 years in the field.
Most assistant teachers had a high school diploma (40%) or a diploma plus a CDA (40%); 20%
had a bachelor‘s degree.
Results are presented for the 128 children with complete pre- and posttest data. At the
start of the school year, children ranged in age from 32 to 55 months, with a mean age of 43.9
6
months. Slightly more than half of the children (57%) were kinderbound. There were more boys
(58%) than girls (41%). Slightly more than half the children (56%) were Native Hawaiian, 14%
were of other Pacific Island heritage, 26% were Asian American, and less than 2% each were
White, African American, or Native American. About one-third of children (35%) were English
language learners (ELLs). Nineteen different foreign languages were spoken in children‘s
homes; the more prevalent languages were Chinese dialects, Filipino dialects, and various
languages from Micronesia (e.g., Chuukese, Marshallese, Pohnpean). Six percent of children had
diagnosed special needs and 19% were referred for evaluation during the school year.
Curriculum
Classrooms implemented the Learning Connections (LC) curriculum as an enhancement
to the Creative Curriculum (Dodge, 2002). LC is an experimentally-validated enrichment
curriculum that that focuses on emergent literacy and emergent math (DeBaryshe & Gorecki,
2005; DeBaryshe & Gorecki, 2007; Sophian, 2004). The LC curriculum addresses seven
learning domains: Oral language, phonological and phonemic awareness, alphabet knowledge
and print concepts, emergent writing, numbers and operations, geometry and measurement. A
series of weekly home learning activities is also provided to families, to allow children to build
on what they have been learning at school. Hallmarks of LC include an emphasis on (a) small-
group instruction, (b) developmental sequencing, and (c) differentiated instruction through the
use of bi-level lesson plans and activity modifications.
Differentiated instruction
Unlike other groups in this symposium, we did not provide extra instructional time to the
most high risk children. Rather, we followed a differentiated instruction model in which each
child was taught within his or her zone of proximal development. Within each of the seven LC

7
curriculum domains learning activities are developmentally sequenced. Ideally, instruction for
each child would be individualized to the extent that he or she would start at the appropriate
place in the sequence for each curriculum domain, and progress through the sequence at a
challenging, but appropriate pace. We expected that it would be difficult for teaches to achieve
this ideal level of individualization. We attempted to approach this ideal by using the following
differentiation strategies.
Flexible small group instruction. Teachers established flexible small learning groups
(suggested group size was 3-4 children) with similar skill levels. Teachers varied the size of the
group depending on the needs of the children involved and the particular activity. One-on-one
and 1:2 formats were used most often for children who were easily distracted, had minimal
English proficiency, or had special learning needs.
Bi-level lesson plans. Lessons plans were developed on a monthly basis. Although we
had an expected scope and sequence of lesson plans for the school year, where we started in the
sequence and rate of progress through the sequence was based on child assessment data and
teacher input. Children in Level 1 (developmentally less advanced) and Level 2 (more advanced)
followed different lesson plans. Level 2 children (29% of all children) were older on the average
than level 1 children, and were more likely to be returning students participating in the project
for the second consecutive year. Both lesson plans addressed the same learning domains, but
each level had different specific small group activities that addressed different levels of
complexity in the developmental sequence.
For example, at the start of the school year, the numbers and operation activity for Level
1 children might involve one-to-one correspondence, while Level 2 children might work on
creating sets of five to ten objects. The phonological awareness activity for Level 1 might

8
involve segmenting compound words or clapping out words of 1-3 syllables. Level 2 children
would work on a more advanced phonological awareness activity, such as going on a scavenger
hunt for objects that start with one of two different target phonemes and sorting their treasures
according to the initial sound.
Activity variations. Each LC activity was designed to be offered at different levels of
complexity. The curriculum manual included detailed suggestions for modifying each activity to
make it either more or less challenging while still addressing the core learning outcome.
Teachers could use any variation of the core lesson they felt was most suitable for their small
group of children; they could also use different variations for different children within the same
small group.
Activity options within a level. As the school year progressed, we found that some
children were well ahead of or behind their small group peers on particular skills areas. When
this situation arose, we provided teachers with options within the day‘s level 1 and level 2 lesson
plans. For example, there might be two choices of phonological awareness activities for the level
2 children. Most level 2 children would sort objects by first sounds, while a smaller number who
had strong phoneme-level skills and alphabet knowledge could work with moveable letters to
create CVC words.
Measures
Children were assessed at the start and end of the year by trained assessors on the: 1)
Peabody Picture Vocabulary Test, Third Edition (PPVT) (Dunn & Dunn, 1997), 2) Test of Early
Reading Abilities, Third Edition (TERA) (Reid, Hresko, & Hammill, 2001), 3) PALS-PreK
(PALS) (Invernizzi, Sullivan, Meier & Swank, 2004), and 4) mathematical operations and
logical reasoning scale of the Developing Skills Checklist (DSC) (CTB/McGraw-Hill, 1990).
9
Teachers administered two progress monitoring measures designed for the LC
curriculum. The LC Probe is a short performance measure that covers basic literacy and math
skills. The LC Probe was used to make the initial assignment of children to Level 1 or Level 2
small groups. The LC Child Observation Record (LC-COR) is a curriculum-based assessment
rubric used to document children‘s progress on curriculum goals. LC-COR scores correlate in the
range of .11 - .52 with the different components of our standardized test battery, with most
correlations being .4 and higher.
Analysis and Results
Post-hoc definitions of risk group
For the purpose of this paper, a risk status classification was developed based on pretest
score on the PPVT. The higher-risk group was defined as those who had a standard score of 75
or less at pretest; this represents the bottom 5% based on national norms. Thirty-three children
(26%) met the higher-risk criterion. The lower-risk group consisted of the remaining classroom
peers, i.e., those children with PPVT pretest scores greater than 75. Risk status was not evenly
distributed across classrooms ranging from 6% to 44%. The division of children into higher- and
lower-risk groups was a post-hoc analysis. Unlike several of the other papers in this symposium,
we did not deliver additional or different instruction to our higher-risk group. Instead, all
children received the same dosage of differentiated instruction.
Children in the higher-risk and lower-risk groups were similar on most demographic
characteristics. However, higher-risk children were much more likely to be English language
learners (72% vs. 22%, χ2 = 27.96, df = 1, p < .0005). Higher-risk children scored significantly
lower than their lower-risk peers on the PPVT and all other pretest assessment measures. All but
10
two of the higher-risk children had been assigned to Level 1 small groups; overall, higher-risk
children comprised one-third of the level 1 instructional group.
Progress Monitoring Measures
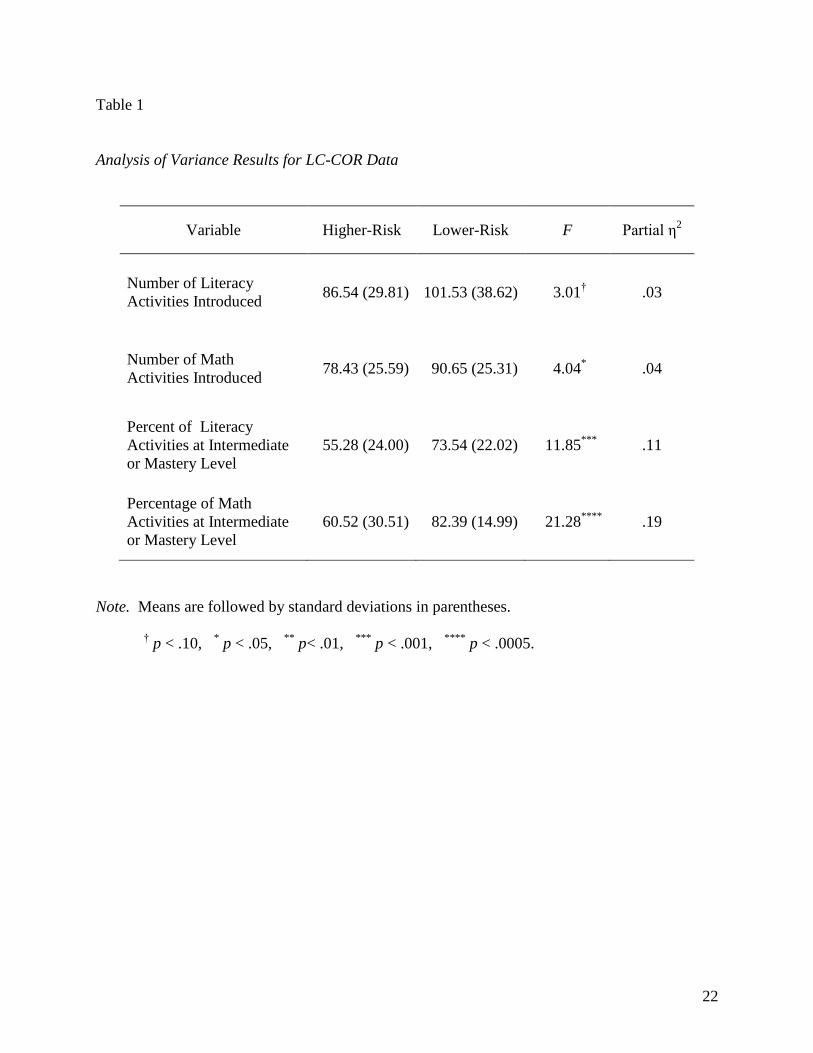
Results for the LC-COR are shown in Table 1. By the end of the school year, higer-risk
children were exposed to fewer literacy and math activities than were their lower-risk peers
(although the difference for the total number of literacy activities was only marginally
significant). Higher-risk children also showed lower levels of competence on the activities to
which they were exposed, as indicated by a lower percentage of activities rated by their teacher
as being at the intermediate or mastery levels of proficiency. In other words, the higher-risk
children moved through a smaller portion of the curriculum sequence and were less likely to
master the subject matter to which they were exposed.
Insert Table 1 about here
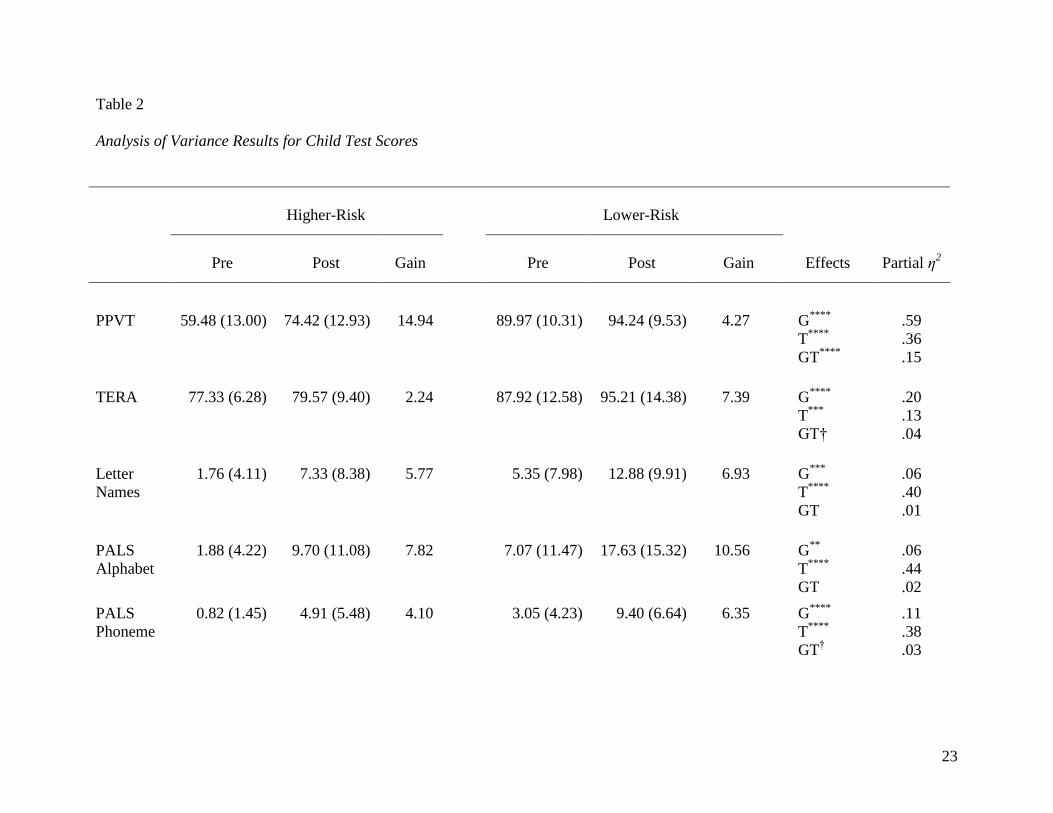
Child Assessment Battery
Data from the standardized assessment battery were analyzed using a series of 2 (higher-
risk vs. lower-risk) by 2 (pre vs. post) analysis of variance models. Results are shown in Table 2.
A significant group effect indicates that the lower-risk group out-performed the higher-risk
group, aggregated across time periods. A time effect indicates that children‘s scores (aggregated
across the higher- and lower-risk groups) increased over time. A group x time interaction
indicates that the rate of change from pre to post was different for the higher vs. lower-risk
groups. The magnitude of these effects is expressed as partial eta-squared which represents the
11
proportion of variance in overall scores accounted for by group, time, and the group x time
interaction, respectively.
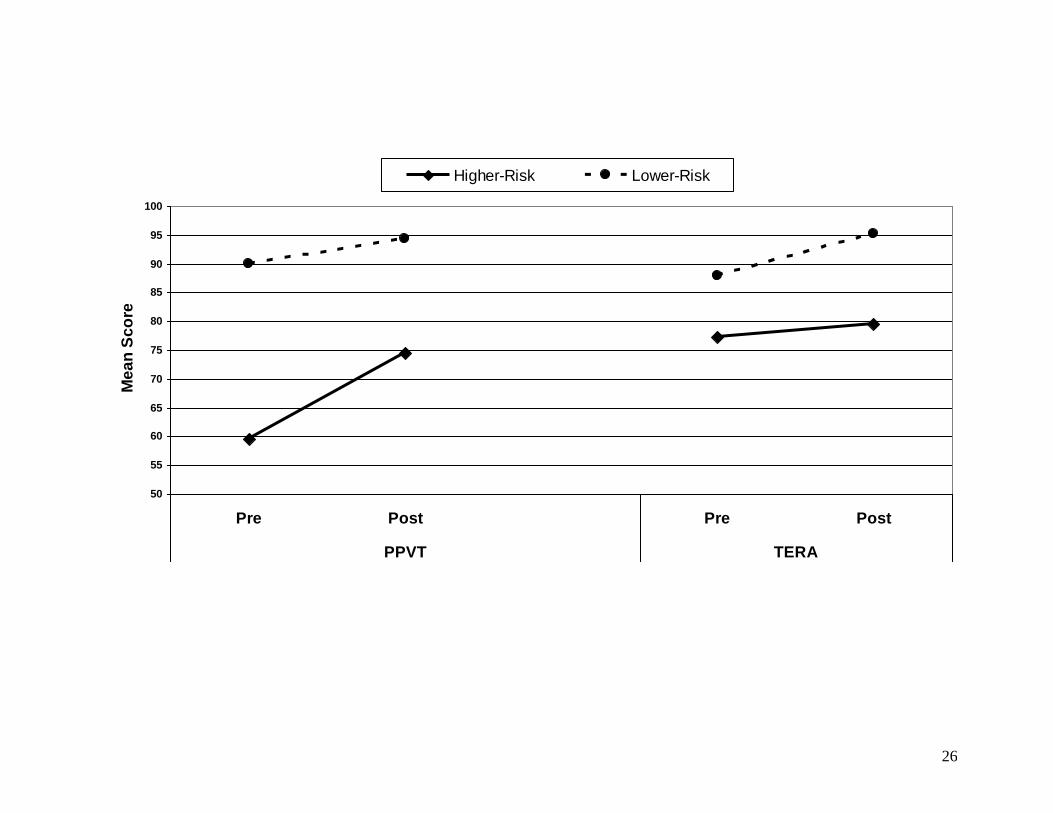
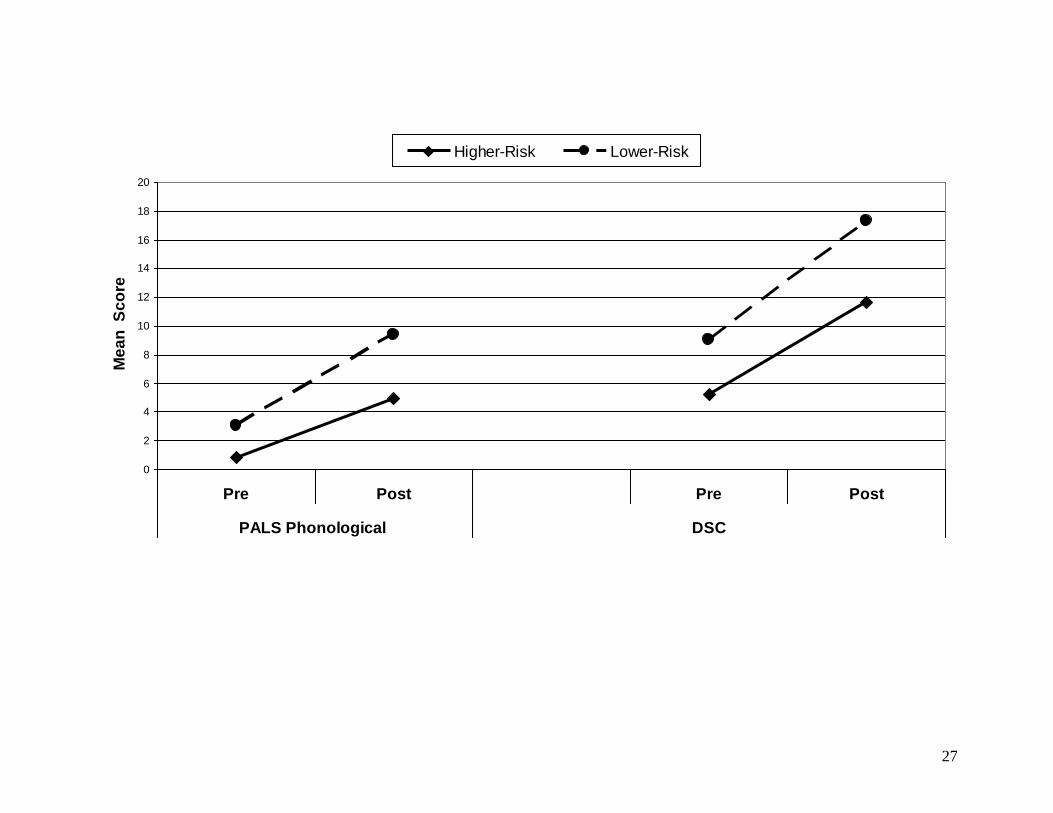
Insert Table 2 and Figures 1 and 2 about here
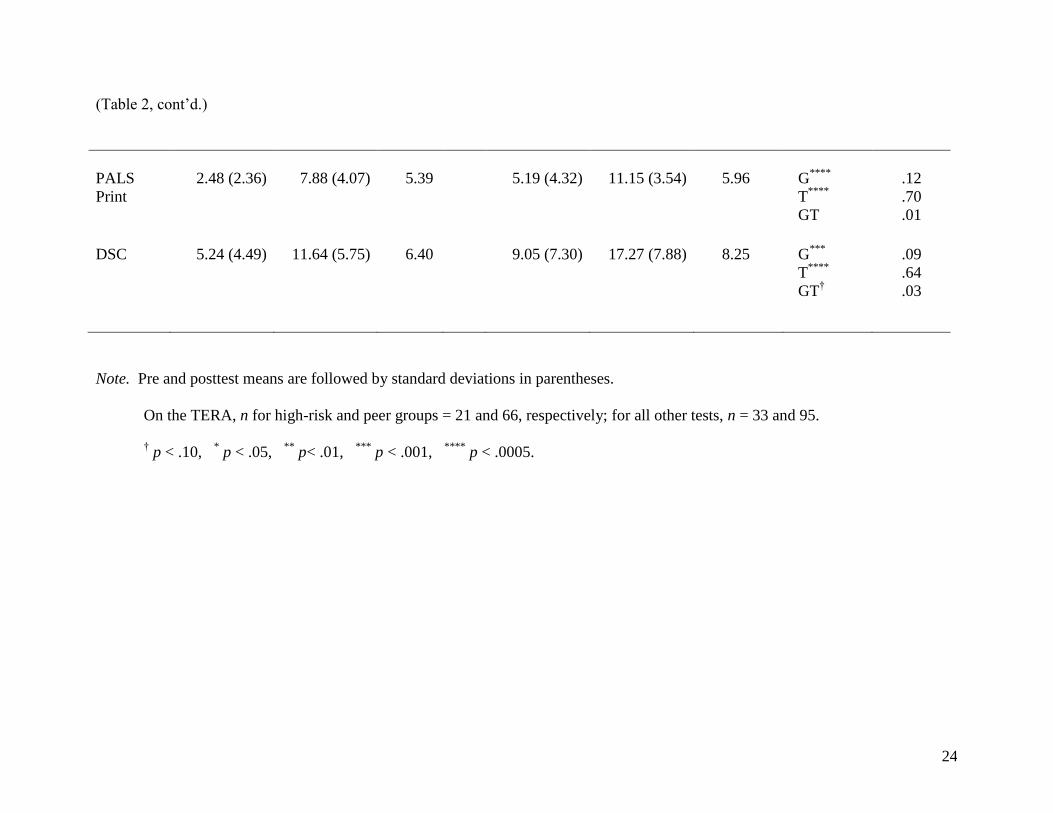
On all measures, the lower-risk group scored higher than the higher-risk group, and
children‘s scores in both groups improved over time. Of more interest are the findings for the
group x time interactions. These interactions are shown graphically in Figures 1 and 2. For the
PPVT, growth over time was steeper for the higher-risk group; the higher-risk children started
with much lower scores, and showed larger average gains (roughly 15 vs. 4 points, respectively).
The groups did not show differential growth on the PALS alphabet knowledge or print concepts.
There was a non-significant trend in the direction of greater growth for the lower-risk children
(i.e., p < .09) on the TERA, PALS phonological awareness and DSC.
In summary, the higher-risk group started the school year with lower scores on all
assessment measures. The higher-risk group showed greater gains over time on the PPVT and
the magnitude of this change was quite large, about 1 standard deviation. Results for other
outcomes showed some evidence of greater gains by the lower-risk group. However, these
differences were modest in magnitude and did not reach traditional levels of statistical
significance.
In addition to knowing the magnitude of the gains that children made over the school
year, it is important to know whether they attained desired levels of proficiency or whether they
still fell below performance benchmarks at the posttest period. Federal ERF accountability
standards define age-appropriate performance on the PPVT as a standard score of 85 (the 16th
12
percentile) or higher. We used this benchmark for both the PPVT and TERA. For the DSC, we
used a normal curve equivalent score of 28 (equivalent to the 16th
percentile) or higher. For the
PALS sub-test benchmarks we used the spring developmental ranges provided in the PALS
manual.
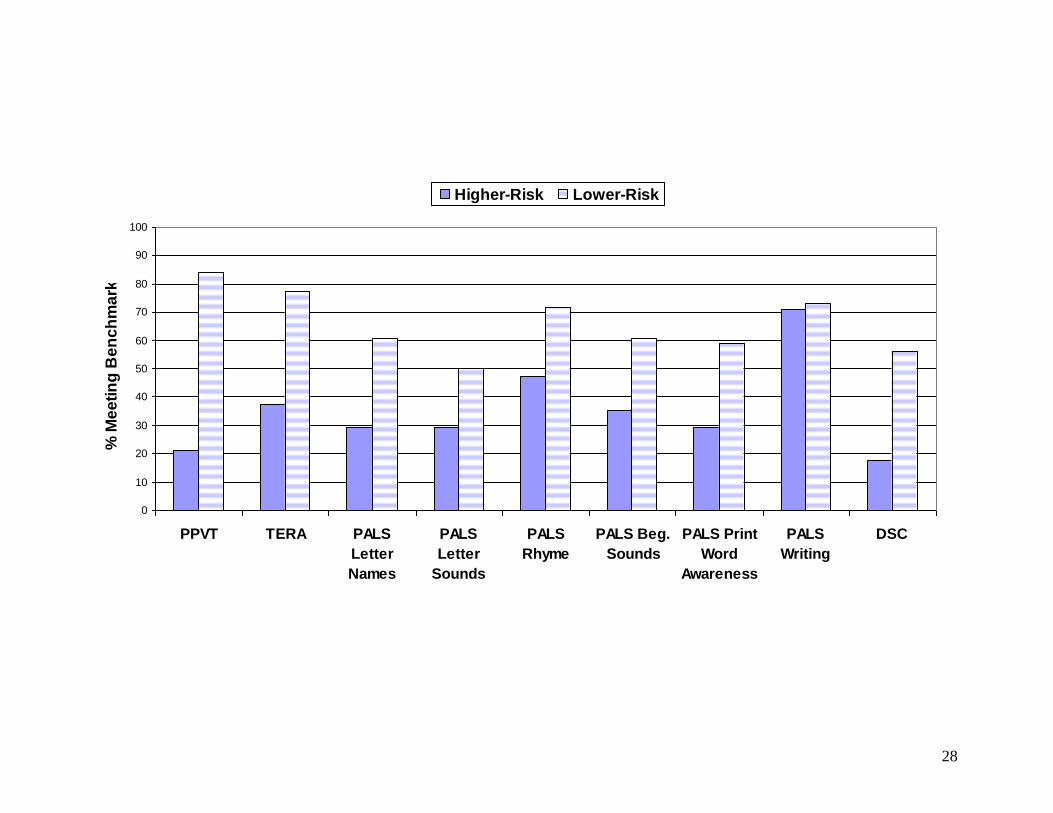
Results for the benchmark data are shown in Figure 3. Despite the large average gains
made by the higher-risk group, only 21% of high-risk children met the PPVT posttest
benchmark, compared to 84% of the peer group. On five benchmarks (PPVT, TERA, letter
names, print word awareness, DSC) a significantly larger percentage of lower-risk children met
the benchmark threshold, based on chi-squared tests. For rhyme and beginning sounds, there was
a nonsignificant trend (p < .09) favoring the lower-risk group. And for letter sounds and name
writing, group comparisons were nonsignificant.
Insert Figure 3 about here
Individual Differences Within the High-Risk Group
Within the higher-risk group, children showed different rates of progress. Sixteen of the
higher-risk children (48%) had posttest PPVT scores above 75; these ―large gainers‖ no longer
met the criteria for membership in the higher-risk group at the end of the school year. On
average, children who moved out of the higher-risk group gained 21.23 points on the PPVT as
compared to an average gain of 9.40 points for children who still met the higher-risk criterion at
the end of the school year (F = 6.61, df = 1, 31, p < .02).
What distinguished the large gainers from the children who remain at high risk? The
larger gainers started off at less of a disadvantage; they had higher pretest scores on the PPVT
13
(Ms = 63.82 vs. 54.87, F = 4.31, df = 1, 31, p < .05), PALS print concepts (Ms = 3.29 vs. 1.62, F
= 4.58, df = 1, 31, p < .04), and DSC (Ms = 6.94 vs. 3.44, F = 5.78, df = 1, 31, p < .003). The
large gainers were less likely to be English language learners (37% vs. 89%, respectively, χ2 =
6.92, df = 1, p < .01). Their parents were more likely to read aloud to them at home (an average
of 1.49 books per week vs. 0.70, F = 5.76, df = 1, 31, p < .02) and had a non-significant trend
towards completing a higher percentage of the LC home learning activities (71% vs. 49%, F =
3.83, df = 1, 31, p < .06).
Discussion
The differentiated instruction model used in our ERF project appears to be a promising
approach to promoting early academic skills for the full range of children who attend Head Start.
Children in our higher-risk group (i.e., those who started the year with very weak English
vocabulary skills) made impressive progress in this target area, achieving a steeper rate of
change than their classroom peers. The higher-risk children also made gains on emergent literacy
and math skills, showing rates of change that were similar to, or only slightly less than their
peers Although the higher-risk children made statistically significant gains, most did not reach
benchmark levels of performance by the end of the school year. It may be unrealistic to expect
that achievement gaps can be erased after only one or two years of preschool participation
(Magnuson & Waldfogel, 2005). Eliminating achievement gaps may be especially difficult for
young English language learners, who typically do not acquire the English fluency required for
full classroom participation before third grade (Ballantyne, Sanderman, D‘Emilio & Mclaughlin,
2008). While it is necessary to hold high expectations for all children, it is also important to have
well-grounded information on how much change can reasonably be achieved through early
education alone, particularly if high-risk children transition into low quality K-12 settings.
14
Research issues
Our project did not include a control group, so we cannot clearly attribute the gains we
saw to either our ERF project as a whole or to particular project components. Can we conclude
that differentiated instruction was especially effective in promoting vocabulary growth for our
higher-risk children? Regression to the mean is a statistical phenomenon that complicates the
interpretation of pre- and posttest data. Our finding that our higher-risk children showed much
greater gains on the PPVT is consistent with regression to the mean. However, we did not find
this same pattern on the other assessment measures, which suggests that our results for the PPVT
were not a statistical artifact. Defining and measuring successful differentiation is a complex
task. Another limitation of our study is that our fidelity measure of the quality of differentiation
was fairly basic, has not been validated, and was collected at the classroom level. Thus, our
classroom process data do not clearly indicate whether children‘s individual instructional needs
were truly being met.
There is a clear need for research that refines and tests models of differentiated
instruction for preschool settings. The goal would be to develop a set of practical strategies that
benefit children across the spectrum of risk found in typical preschool settings. As a first step, we
need clear operational definitions and validated measures of differentiation strategies. Smaller-
scale studies could then demonstrate the conditions under which teachers implement
differentiated instruction with high fidelity. For example, consistent use of progress monitoring
tools appears to be a challenge; support strategies could include setting a dedicated time to
complete these assessments or enlisting the center director or other support staff as additional
assessors. Multiple baseline studies could show whether providing feedback on observed
differentiation strategies increases teachers‘ use of target behaviors, and whether these new
15
teaching behaviors maintain over time or transfer occurs to additional differentiation techniques
that were not the original target of intervention. Such feasibility studies can identify the setting
conditions under which effective differentiated instruction is likely to occur. The next step would
be to conduct randomized experiments (i.e., efficacy studies) to compare teacher practices and
child outcomes in classrooms that use the same curriculum but differ on the use of differentiated
instruction. Should these results look promising, the final step would be to implement large-scale
field trials (i.e., effectiveness studies) to ascertain whether differentiated instruction still yields
positive results across the range of real-world teachers and programs.
Practical considerations
Differentiated instruction is not easy to do. Purcell & Rosemary (2008) describe some of
the challenges to using differentiated instruction in preschool settings. First, teachers must be
well versed concerning appropriate learning goals and the developmental sequencing of target
skills. Second, teachers must be good observers and be able to use ongoing assessments of each
child‘s learning as the basis of their instructional planning. Third, teachers must be able to
appropriately scaffold their interactions with children, providing different levels of support as
needed. Finally, environmental design and classroom management techniques need to be used to
their full advantage, so that children can independently engage in meaningful activities during
those times that the teacher is involved in small group instruction.
Based on our own experience we foresee four likely issues. The first relates to the
collection of progress monitoring data. Our teachers did not complete the ongoing progress
monitoring measure as often as we asked. Updating the LC-COR on a daily, weekly, or even
monthly basis was burdensome, even though teachers felt better informed about each child‘s
progress when they did keep this information up to date. This made the LC-COR data less
16
valuable for lesson planning. The regularity of progress monitoring varied across classrooms and
appeared to be a function of teacher buy-in. Perhaps not coincidentally, children‘s gains were
largest on all outcome measures in the two classrooms that faithfully completed the LC-COR.
A second challenge we faced was meeting the needs of our ELL children. The children in
our classrooms were quite linguistically diverse, but their teachers were not. In most cases,
teachers were not able to differentiate instruction by using ELL children‘s native language. We
provided training on instructional strategies for dual language learners (Restrepo & Dubasik,
2008), but fell far short of delivering best bilingual education practices.
The third challenge we anticipate is that a focus on small group instruction will require
procedural changes for many classrooms. National data indicate that the typical preschool child
spends 23% of his or her day in teacher-led, whole group instruction, but only 6% of the day in a
small group instruction setting (FPG Child Development Institute, 2005). Small group formats
and multi-level lesson plans require more time to prepare and implement than does a schedule
that relies on large group, non-differentiated activities. Our teachers often felt pressed for time
and/or that they neglected aspects of the holistic curriculum such as time for art and creative
expression. This stress was especially pronounced in half-day classrooms. Teachers would
prefer to do only 1-2 small group activities per day, but it is unlikely that this low level of
intensity would provide enough focused teacher-child interaction to result in learning gains of
the desired magnitude. Providing additional adults in the classroom who could supervise children
in free choice activities (e.g., parent or community volunteers, paraprofessional aides) could free
teachers to spend more time in small group interactions. Ensuring that teachers have adequate
paid preparation hours would also reduce the perceived burden of planning and preparation.
17
Finally, ERF provides resources that are beyond the means of many preschool
organizations. Our teachers received a variety of supports—monthly lesson plans, new classroom
materials, in-class coaching, in-service workshops, and college courses. Sustainability and
replication are important issues for any demonstration program. It would likely be difficult for a
preschool program to replicate our work in its entirety without a hefty infusion of resources.
However, selected aspects could be introduced in an incremental manner. Tomlinson and
colleagues (Tomlinson, 2000; Tomlinson & McTighe, 2006) provide detailed suggestions for
those who are interested in implementing differentiated instruction. Their overarching message is
to think big, but start small. They suggest laying the groundwork with study groups or training
that focuses on the big picture—the broad goals and desired outcomes of differentiated
instruction. But subsequent plans for new classroom practices should focus on only one or two
small changes at a time, such as trying multi-level instruction for one particular learning activity
and observing how children respond. As teachers become comfortable and successful with the
new steps, additional and larger changes can be added.
18
References
Administration for Children and Families. (2003). Head Start FACES 2000: A whole-child
perspective on program performance. Fourth progress report. Washington, DC: US
Department of Health and Human Services.
CTB/McGraw-Hill (1990). The Developing Skills Checklist norms book and technical manual.
Monterey, CA: Author.
DeBaryshe, B. D., & Gorecki, D. M. (2007). Experimental validation of a preschool emergent
literacy curriculum. Early Education and Development, 18, 93-110.
DeBaryshe, B. D. & Gorecki, D. (2005). Enhancing emergent literacy and math in at-risk
preschoolers: A home-school partnership model. In A. Maynard and M. Martini (Eds.). The
psychology of learning in context: Cultural artifacts, families, peers and schools pp. 175-200.
New York: Kluwer/Plenum.
Dodge, D.T. (2002). The creative curriculum for preschool, (4th
Ed). Washington, D.C.:
Teaching Strategies, Inc. (Available from Teaching Strategies, Inc., Box 42243, Washington,
DC 20015.)
Dunn, L. & Dunn, L. (1997). Peabody Picture Vocabulary Test--Third Edition (PPVT-III). AGS
Publishing, Circle Pines, MN 55014-1796
FPG Child Development Institute (2005). How is the preschool day spent? Early Developments,
9(1), 22-27. Retrieved January 4, 2009 from http://www.fpg.unc.edu/ncedl/PDFs/ED9_1.pdf
Invernizzi, M., Sullivan, A., Meier, J. & Swank, L. (2004). Phonological Awareness Literacy
Screening (PALS-PreK). Charlottesville, VA: University of Virginia.
19
Kaplan, D., & Walpole, S. (2005). A stage-sequential model of reading transitions: Evidence
from the Early Childhood Longitudinal Study. Journal of Educational Psychology, 97, 551-
563.
Magnuson, K. A. & Waldfogel, J. (2005) Early childhood care and education: Effects of ethnic
and racial gaps in school readiness. The Future of Children, 15(1), 169-196.
Magnuson, K. A., Meyers, M . K., Ruhm, C. J., & Waldofgel, J. (2004). Inequality in preschool
education and school readiness. American Education Research Journal, 41, 115-157.
Molfese, V. J., Modglin, A. A., Beswick, J. L., Neamon, J. D., Berg, S. A., Berg, J., & Molnar,
A. (2006). Letter knowledge, phonological processing, and print knowledge: Skill
development in nonreading preschool children. Journal of Reading Disabilities, 39, 296-
305.
Tomlinson, C. A. (2000). Differentiation of instruction in the elementary grades. ERIC Digest
EDO-PS-00-7. Retrieved December 16, 2008 from http://www.ericdigests.org/2001-
2/elementary.html
Tomlinson, C., & McTighe, J. (2006). Integrating differentiated instruction and understanding
by design: Connecting content and kids. Alexandria, VA: Association for Supervision and
Curriculum Development.
Purcell, T., & Rosemary, C. A. (2008). Differentiating instruction in the preschool classroom:
Bridging emergent literacy instruction and developmentally appropriate practice. In L. M.
Justice and C. Vukelich (Eds.). Achieving excellence in preschool literacy instruction (pp.
221-241). New York: Guilford.
Reid, D., Hresko, W. & Hammill, D., (2001). TERA3 examiner’s manual. Austin, TX: Pro-ed.
20
Restrepo, M. A. & Dubusik, V. (2008). Language and literacy practices for English language
learners in the preschool setting. . In L. M. Justice and C. Vukelich (Eds.). Achieving
excellence in preschool literacy instruction (pp. 242-260). New York: Guilford.
Sophian, C. (2004). Mathematics for the future: Developing a Head Start curriculum to support
mathematics learning. Early Childhood Research Quarterly 19, 59-81.
U.S. Department of Education, National Center for Educational Statistics (2001). Entering
kindergarten: A portrait of American children when they begin school: Findings from The
Condition of Education, 2000. NCES 2001-035. Washington, DC: U. S. Government Printing
Office.
Vygostky, L. S. (1978). Mind in society: The development of higher mental processes.
Cambridge, MA: Harvard University Press.
21
Author Note
Address correspondence to Barbara DeBaryshe, University of Hawaii Center on the
Family, 2515 Campus Road, Honolulu, HI 96822 or [email protected]
This work was supported by Early Reading First award #S359B050024 from the U.S.
Department of Education, Office of Elementary and Secondary Education.
We wish to thank the teachers, parents, children, and staff of Honolulu Community
Action Program Head Start.
22
Table 1
Analysis of Variance Results for LC-COR Data
Variable Higher-Risk Lower-Risk F Partial η2
Number of Literacy
Activities Introduced 86.54 (29.81) 101.53 (38.62) 3.01
† .03
Number of Math
Activities Introduced 78.43 (25.59) 90.65 (25.31) 4.04
* .04
Percent of Literacy
Activities at Intermediate
or Mastery Level
55.28 (24.00) 73.54 (22.02) 11.85***
.11
Percentage of Math
Activities at Intermediate
or Mastery Level
60.52 (30.51) 82.39 (14.99) 21.28****
.19
Note. Means are followed by standard deviations in parentheses.
† p < .10,
* p < .05,
** p< .01,
*** p < .001,
**** p < .0005.
23
Table 2
Analysis of Variance Results for Child Test Scores
Higher-Risk
Lower-Risk
Pre
Post
Gain
Pre
Post
Gain
Effects
Partial η2
PPVT 59.48 (13.00) 74.42 (12.93) 14.94 89.97 (10.31) 94.24 (9.53) 4.27 G****
T****
GT****
.59
.36
.15
TERA 77.33 (6.28) 79.57 (9.40) 2.24 87.92 (12.58) 95.21 (14.38) 7.39 G****
T***
GT†
.20
.13
.04
Letter
Names
1.76 (4.11) 7.33 (8.38) 5.77 5.35 (7.98) 12.88 (9.91) 6.93 G***
T****
GT
.06
.40
.01
PALS
Alphabet
1.88 (4.22) 9.70 (11.08) 7.82 7.07 (11.47) 17.63 (15.32) 10.56 G**
T****
GT
.06
.44
.02
PALS
Phoneme
0.82 (1.45) 4.91 (5.48) 4.10 3.05 (4.23) 9.40 (6.64) 6.35 G****
T****
GT†
.11
.38
.03
24
(Table 2, cont‘d.)
PALS
2.48 (2.36)
7.88 (4.07)
5.39
5.19 (4.32)
11.15 (3.54)
5.96
G****
T****
GT
.12
.70
.01
DSC
5.24 (4.49)
11.64 (5.75)
6.40
9.05 (7.30)
17.27 (7.88)
8.25
G***
T****
GT†
.09
.64
.03
Note. Pre and posttest means are followed by standard deviations in parentheses.
On the TERA, n for high-risk and peer groups = 21 and 66, respectively; for all other tests, n = 33 and 95.
† p < .10,
* p < .05,
** p< .01,
*** p < .001,
**** p < .0005.
25
Figure Captions
Figure 1: Pre- and posttest PPVT and TERA scores by group
Figure 2: Pre- and posttest phonological awareness and DSC scores by group
Figure 3: Percentage of children meeting spring benchmarks by group
26
50
55
60
65
70
75
80
85
90
95
100
Pre Post Pre Post
PPVT TERA
Me
an
Sc
ore
Higher-Risk Lower-Risk
27
0
2
4
6
8
10
12
14
16
18
20
Pre Post Pre Post
PALS Phonological DSC
Me
an
S
co
re
Higher-Risk Lower-Risk
28
0
10
20
30
40
50
60
70
80
90
100
PPVT TERA PALS
Letter
Names
PALS
Letter
Sounds
PALS
Rhyme
PALS Beg.
Sounds
PALS Print
Word
Awareness
PALS
Writing
DSC
% M
ee
tin
g B
en
ch
ma
rk
Higher-Risk Lower-Risk


