

Diversification of the world's energy sources and its challenges
for the technical professions.
CPAC-SI
July 2009
2
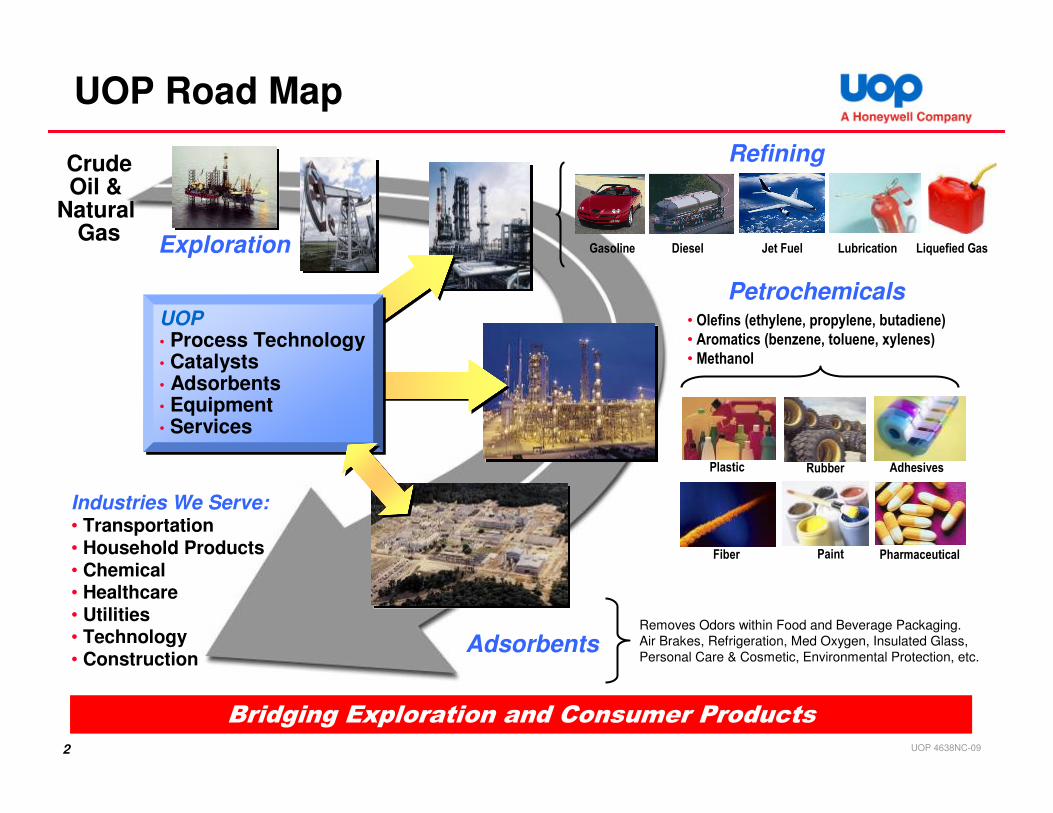
UOP Road Map
CrudeOil &
Natural Gas
Industries We Serve:• Transportation• Household Products• Chemical• Healthcare• Utilities• Technology• Construction
AdsorbentsRemoves Odors within Food and Beverage Packaging.
Air Brakes, Refrigeration, Med Oxygen, Insulated Glass,
Personal Care & Cosmetic, Environmental Protection, etc.
• Olefins (ethylene, propylene, butadiene)
• Aromatics (benzene, toluene, xylenes)
• Methanol
Gasoline Jet FuelDiesel Liquefied GasLubrication
RubberPlastic
Paint
Adhesives
Pharmaceutical Fiber
UOP • Process Technology• Catalysts• Adsorbents• Equipment • Services
Bridging Exploration and Consumer Products
Exploration
UOP 4638NC-09
Petrochemicals
Refining
3
Outline
• Introduction: Mega Trends that impact Energy Diversification
• Crude Oil
• Coal
• Natural Gas
• CO2 Capture and Sequestration
• Summary of Opportunities

4
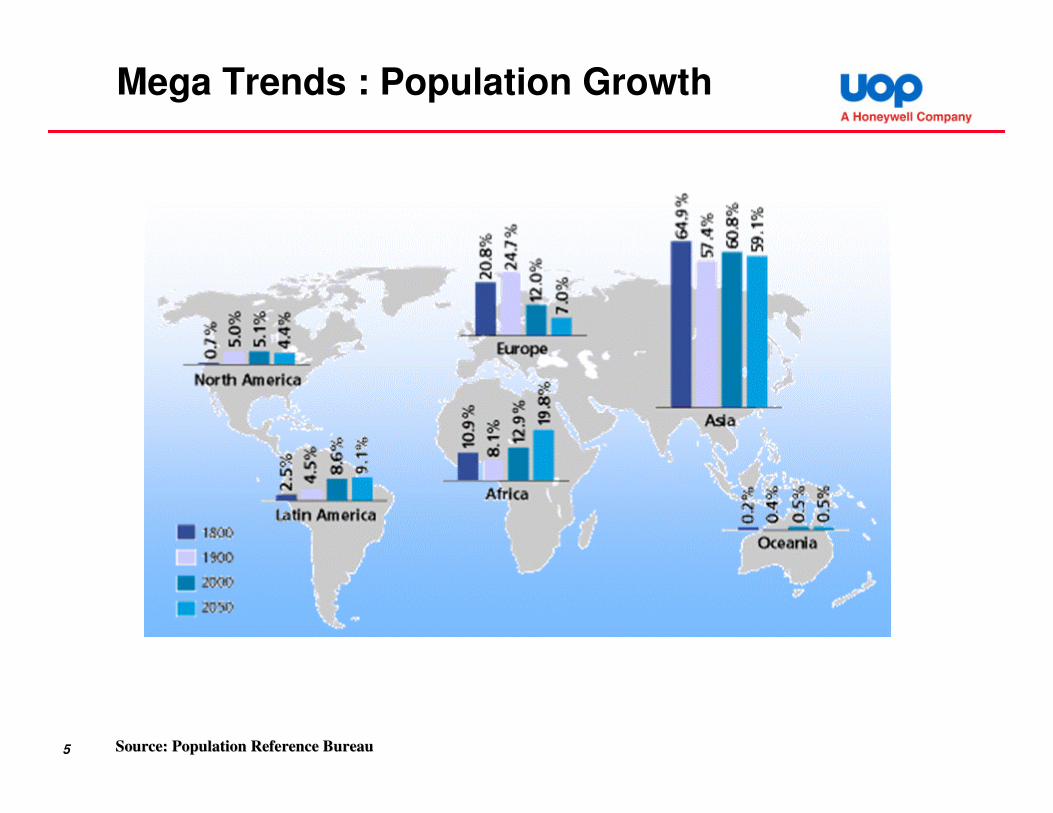
Mega Trends : Population Growth
17501750 18001800 18501850 19001900 19501950 20002000 20502050
Po
pu
lati
on
(b
illi
on
s)P
op
ula
tio
n (
bil
lio
ns)
YearYear
1212
1010
88
66
44
22
00
20006.1. billion
20006.1. billion
Source: United Nations, World Population Prospects, 1998Source: United Nations, World Population Prospects, 1998
5
Mega Trends : Population Growth
Source: Population Reference BureauSource: Population Reference Bureau
6
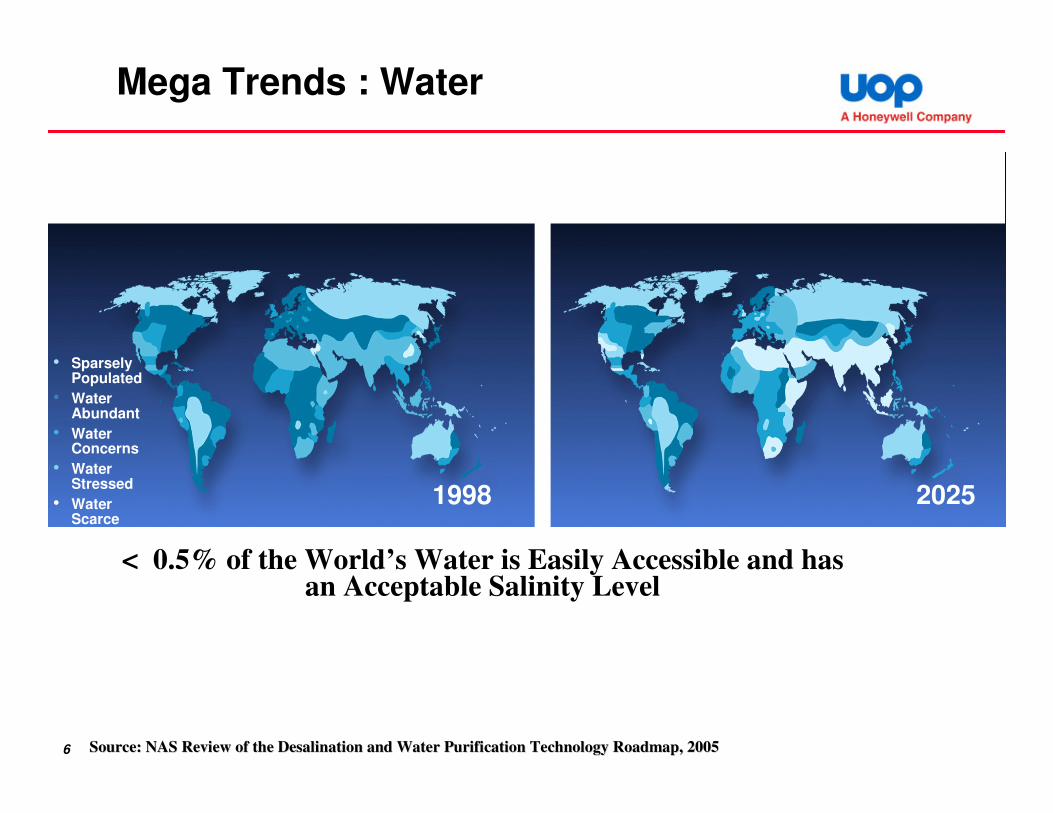
Mega Trends : Water
Source: NAS Review of the Desalination and Water Purification TeSource: NAS Review of the Desalination and Water Purification Technology Roadmap, 2005chnology Roadmap, 2005
• Sparsely Populated
• Water Abundant
• Water Concerns
• Water Stressed
• Water Scarce
< 0.5% of the World’s Water is Easily Accessible and has an Acceptable Salinity Level
1998 2025

7
Mega Trends : Political Unrest
Iranian
Revolution
Hostage Crisis
in Teheran
Iran-Iraq War
Desert StormCruise
missiles S. Iraq
Unrest in
Venezuela
Militant attacks
in Nigeria
No
min
al $/b
bl

8
Mega Trends : Energy use per capita
USA
Euro zone
Norway
India
China
Source: World Resources InstituteSource: World Resources Institute

9
Mega Trends : Increase in atmospheric CO2

10
http://web.mit.edu/newsoffice/2009/roulette-0519.html
Global Warming Roulette Wheel

11
Result : Rapid Growth and Diversification of Global Primary Energy Demand
0
100
200
300
400
500
600
700
800
900
1997 2005 2015 2025 2035 2045
RENEWABLES_EQ
HYDRO_EQ
NUCLEAR
GAS
OIL
COAL
EPPA
Quad.
BT
U

12
Crude Oil Consumption and Quality
0
20
40
60
80
100
120
2005 2010 2015 2020 2025
0
10
20
30
40
50
60
70
Residential Commercial Industrial
Transportation Global GDP
Mb
bl/
da
y
Tri
llio
n 9
7 U
S$
Source : eia.doe.gov
0
0.2
0.4
0.6
0.8
1
1.2
1.4
1.6
Feb-82 Aug-87 Jan-93 Jul-98 Jan-04 Jul-09
29.5
30
30.5
31
31.5
32
32.5
33
33.5
S C
on
ten
t [w
t %
]
AP
I G
ravit
y [
º]
Brent
Mayan
Difference

13
Refining flow diagram

14
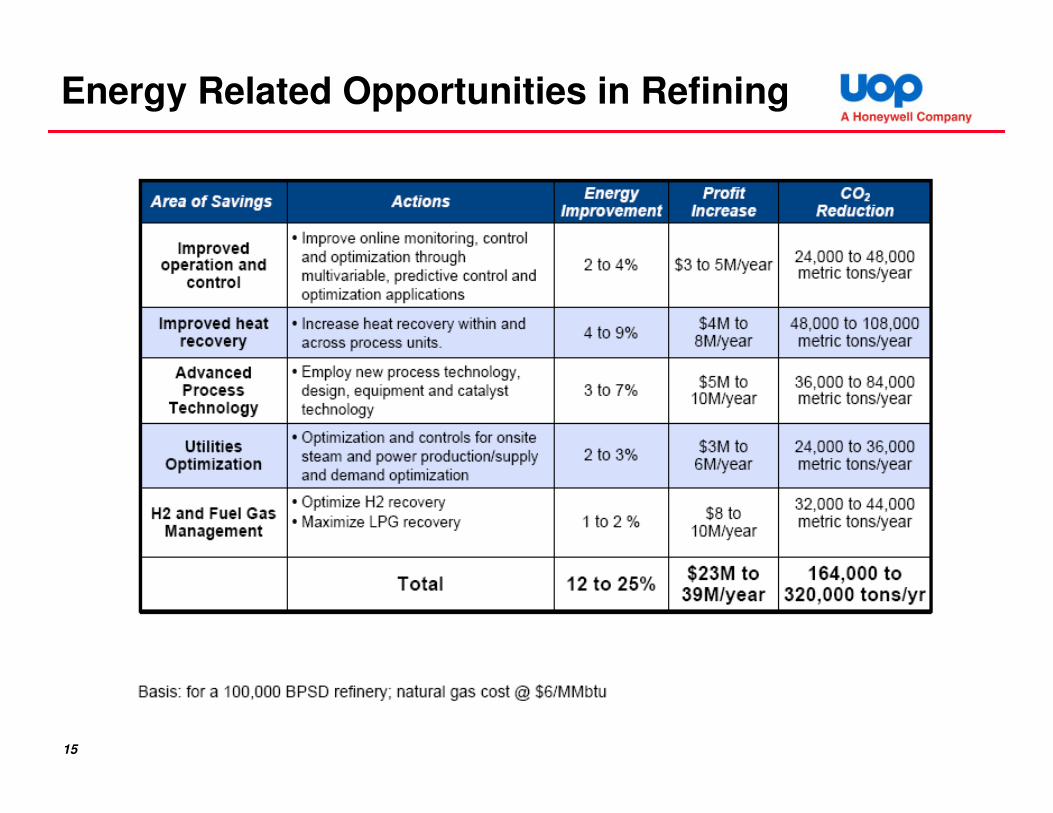
15
Energy Related Opportunities in Refining
16
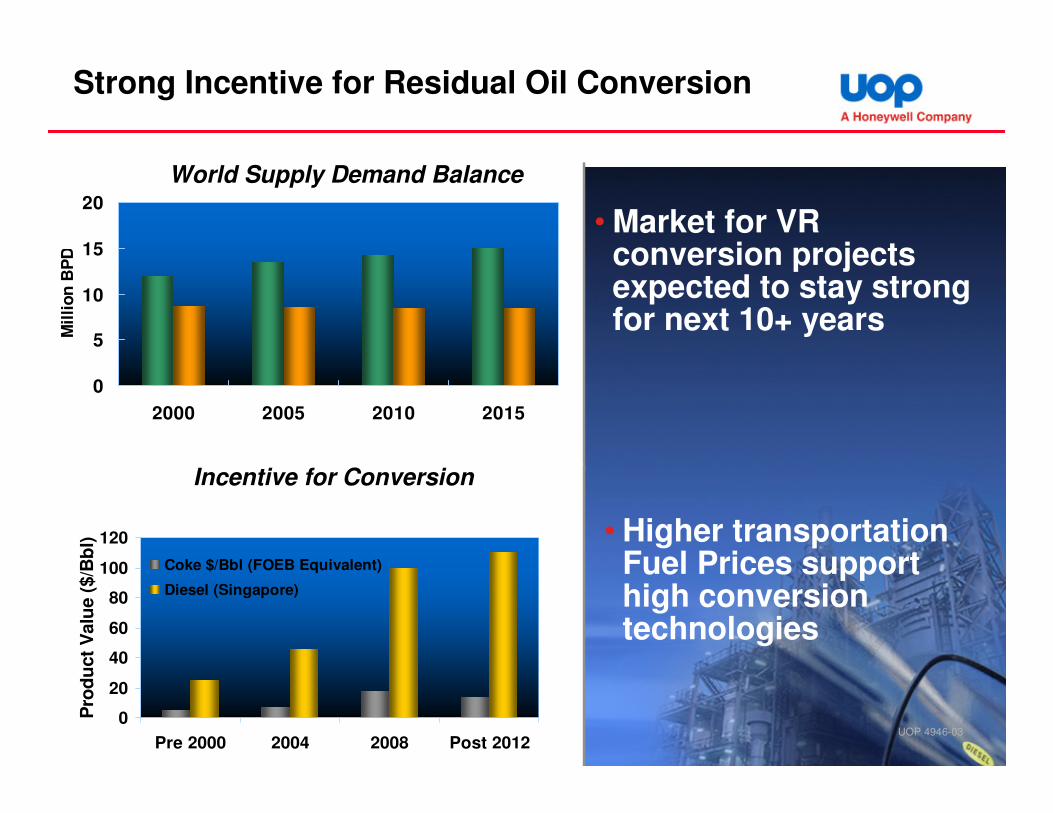
Strong Incentive for Residual Oil Conversion
• Market for VR conversion projects expected to stay strong for next 10+ years
0
5
10
15
20
2000 2005 2010 2015
Mil
lio
n B
PD
World Supply Demand Balance
UOP 4946-030
20
40
60
80
100
120
Pre 2000 2004 2008 Post 2012
Pro
du
ct
Valu
e (
$/B
bl)
Coke $/Bbl (FOEB Equivalent)
Diesel (Singapore)
• Higher transportation Fuel Prices support high conversion technologies
Incentive for Conversion

17
Coal Reserves and Distribution
18
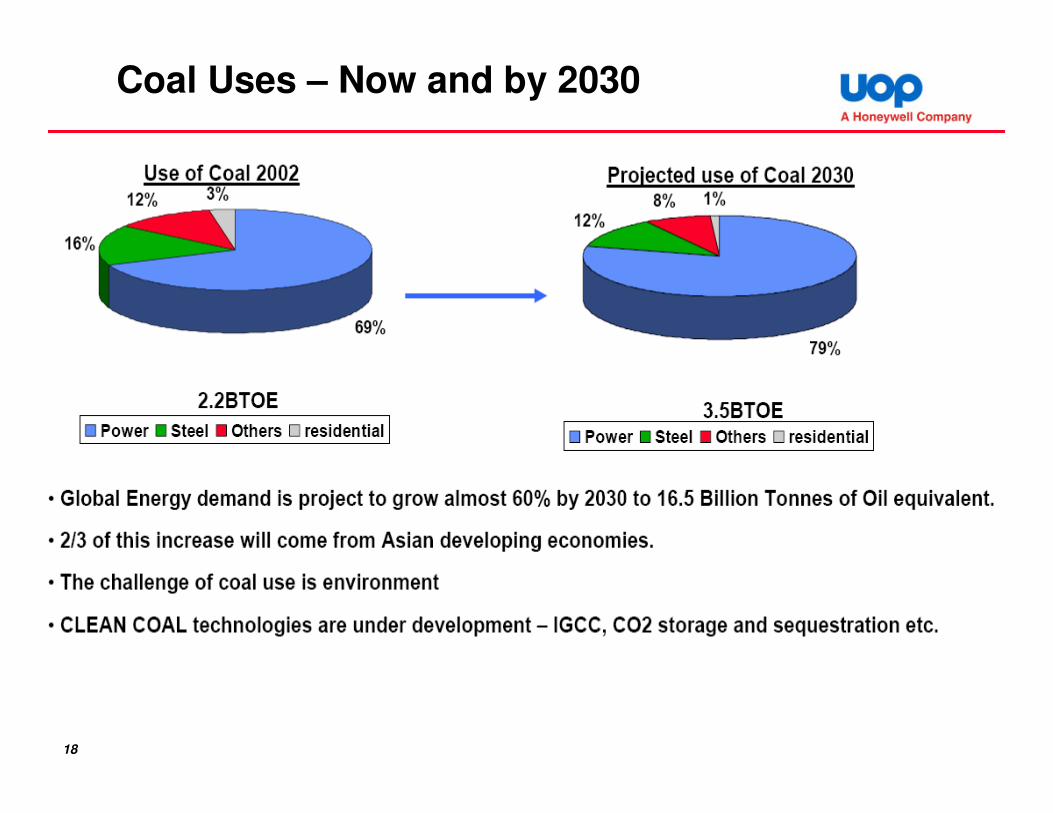
Coal Uses – Now and by 2030
19
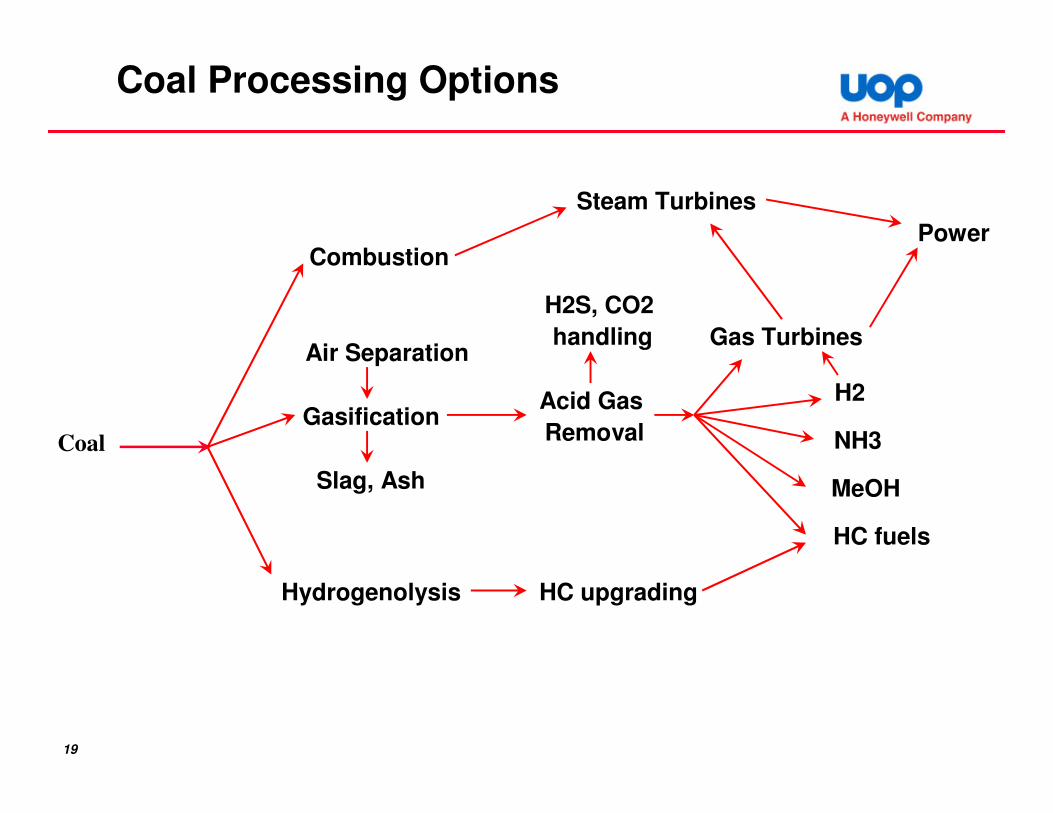
Coal
Coal Processing Options
Combustion
Steam Turbines
Power
Hydrogenolysis HC upgrading
HC fuels
Gasification
Air Separation
Slag, Ash
Acid Gas
Removal
H2S, CO2
handling Gas Turbines
MeOH
NH3
H2
20
Technical
Difficulty
2015 2025
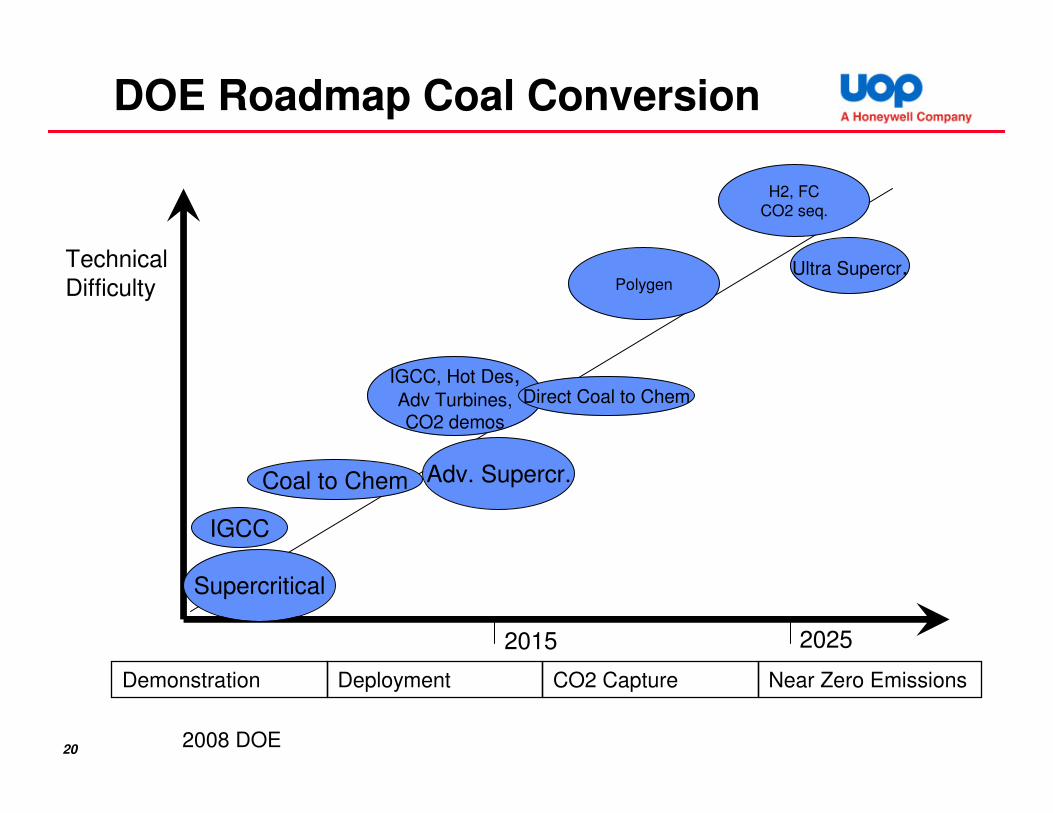
DOE Roadmap Coal Conversion
Supercritical
Adv. Supercr.
Ultra Supercr.
IGCC
IGCC, Hot Des,Adv Turbines,CO2 demos
H2, FC
CO2 seq.
Direct Coal to Chem
Demonstration Deployment CO2 Capture Near Zero Emissions
Coal to Chem
Polygen
2008 DOE

21
Technical
Difficulty
Supercritical
IGCC
Adv. Supercr.
IGCC, Hot Des,Adv Turbines,CO2 demos
H2, FC
CO2 seq.
Ultra Supercr.
2015 2025
Coal to Chem
DOE Roadmap – Key Advances
Capacity,
Efficiency
USC – 1250 F
USC – 1400 F
Oxycombustion,
materials
Adv. Air Sep
Fuel Flexible.
Dry Slurry Feed
Cost, Efficiency
H2 Turbines,
Large SOFCH2 Sep
Novel CO2 capt
Reliability, Life
Direct Coal to Chem
Demonstration Deployment CO2 Capture Near Zero Emissions
Coal to Chem
Polygen
22
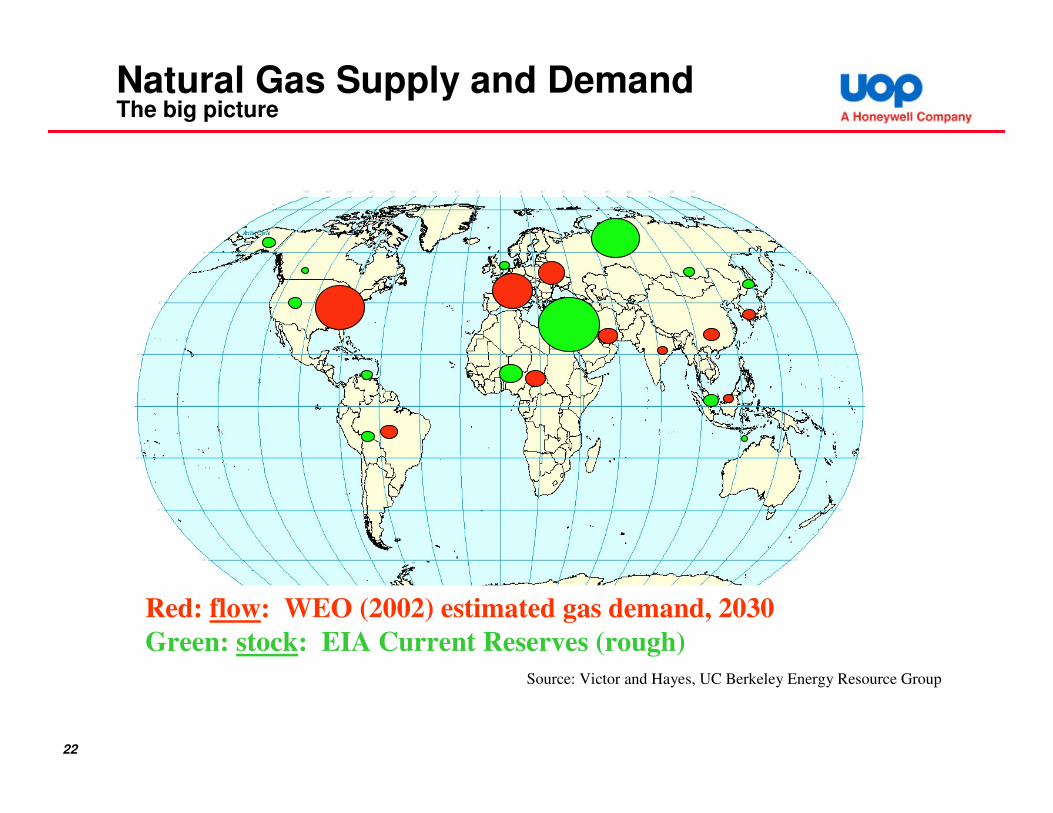
Natural Gas Supply and DemandThe big picture
Red: flow: WEO (2002) estimated gas demand, 2030
Green: stock: EIA Current Reserves (rough)
Source: Victor and Hayes, UC Berkeley Energy Resource Group

23
• 2025 double 2001
• Increased share of world
energy market
• Growth rate twice that of oil
• 3.9% growth in developing
nations
• 2.2% growth in industrialised
nations
• Significant new production in
the US shifts LNG import
balance. Source: EIA
0
20
40
60
80
100
120
140
160
180
200
1990 2000 2001 2005 2010 2015 2020 2025
Tcf
Central and South America
Africa
Middle East
Developing Asia
E. Europe/FSU
Industrialized Asia
Western Europe
North America
Strong Growth in Gas Consumption Forecast

24
Offshore gas production to increase strongly, mainly in FSU, Asia, Africa & Mid East
Opportunities - Offshore Technologies
Drivers:
• Remote resources
• Security issues
• Offshore liquids
production
• Government policies
• Possible cost
savings on
infrastructure
• Flaring reduction
0
5,000
10,000
15,000
20,000
25,000
1998 1999 2000 2001 2002 2003 2004 2005 2006 2007
mm
bo
e
AfricaAsiaAustralasiaFSU & Eastern EuropeLatin AmericaMiddle EastNorth AmericaWestern Europe
Offshore Gas Development
– Known Prospects

25
1
10
100
1,000
10,000
100,000
> 15 T
CF
> 5 T
CF
> 3 T
CF
> 1 T
CF
> 0.5
TCF
> 0.2
TCF
> 0.1
TCF
Bal
ance
Hyd
rate
s
Ga
s V
olu
me
(T
CF
)
Gas Fields vs Size of Resource
Scale-limits
and efficiency
at large scale
Source : IHS Energy 2007
Economics
and feasibility
at small scale
26
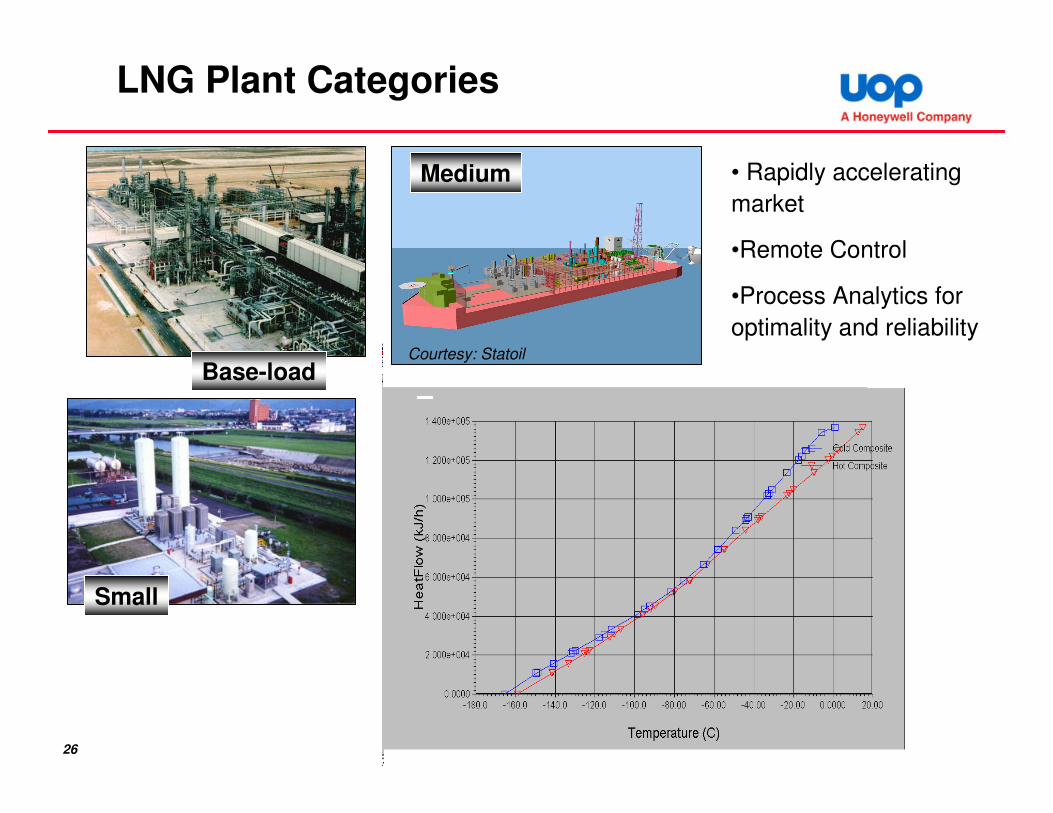
LNG Plant Categories
Base-load
Small
• Rapidly accelerating
market
•Remote Control
•Process Analytics for
optimality and reliabilityCourtesy: Statoil
Medium
27
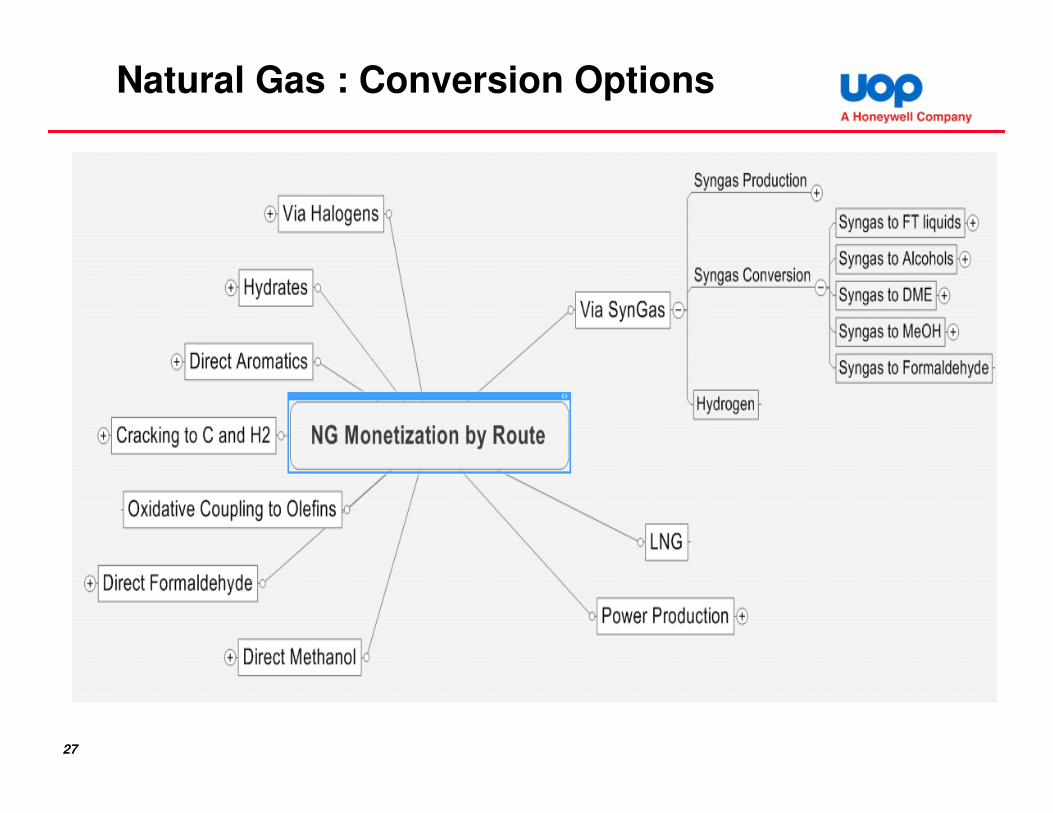
Natural Gas : Conversion Options
28
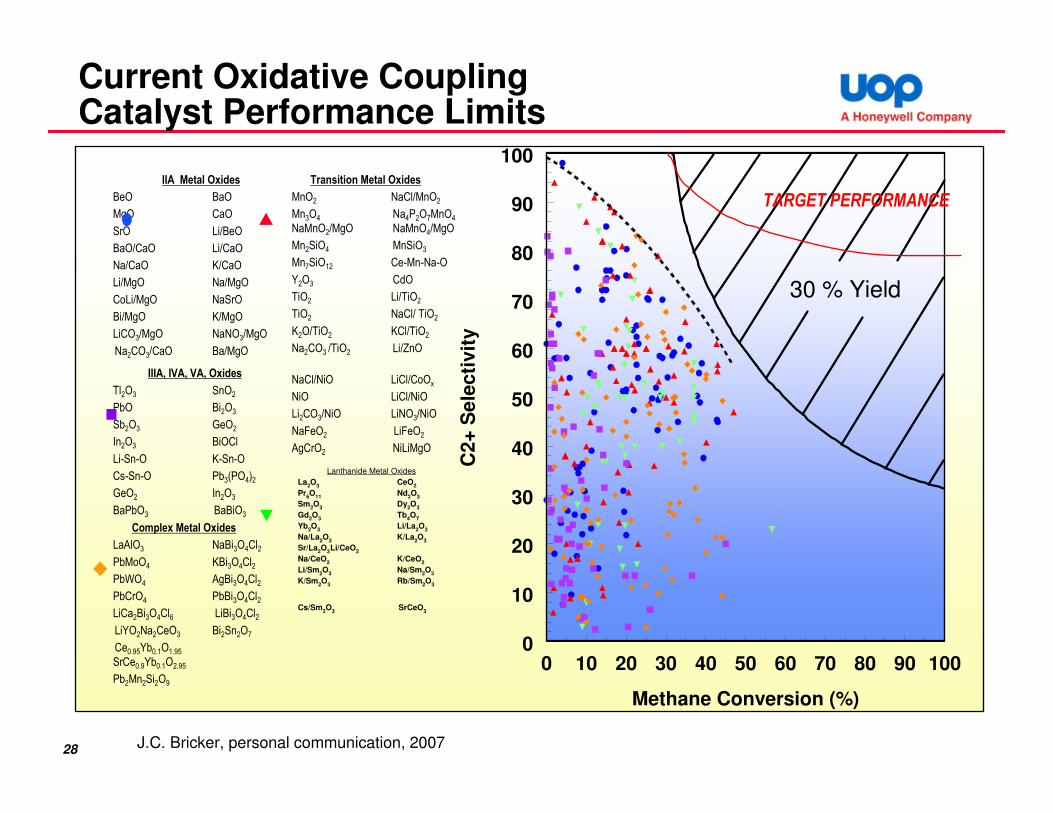
0 10 20 30 40 50 60 70 80 90 100
Methane Conversion (%)
0
10
20
30
40
50
60
70
80
90
100
C2
+ S
ele
cti
vit
y
30 % Yield
TARGET PERFORMANCE
Complex Metal Oxides
LaAlO3 NaBi3O4Cl2
PbMoO4 KBi3O4Cl2
PbWO4 AgBi3O4Cl2
PbCrO4 PbBi3O4Cl2
LiCa2Bi3O4Cl6 LiBi3O4Cl2
LiYO2Na2CeO3 Bi2Sn2O7
Ce0.95Yb0.1O1.95
SrCe0.9Yb0.1O2.95
Pb2Mn2Si2O9
IIIA, IVA, VA, Oxides
Tl2O3 SnO2
PbO Bi2O3
Sb2O3 GeO2
In2O3 BiOCl
Li-Sn-O K-Sn-O
Cs-Sn-O Pb3(PO4)2
GeO2 In2O3
BaPbO3 BaBiO3
IIA Metal Oxides
BeO BaO
MgO CaO
SrO Li/BeO
BaO/CaO Li/CaO
Na/CaO K/CaO
Li/MgO Na/MgO
CoLi/MgO NaSrO
Bi/MgO K/MgO
LiCO3/MgO NaNO3/MgO
Na2CO3/CaO Ba/MgO
Lanthanide Metal Oxides
La2O
3CeO
2
Pr6O
11Nd
2O
3
Sm2O
3Dy
2O
3
Gd2O
3Tb
4O
7
Yb2O
3Li/La
2O
3
Na/La2O
3 K/La
2O
3
Sr/La2O
3Li/CeO
2
Na/CeO2
K/CeO2
Li/Sm2O
3Na/Sm
2O
3
K/Sm2O
3Rb/Sm
2O
3
Cs/Sm2O
3SrCeO
3
Transition Metal Oxides
MnO2 NaCl/MnO2
Mn3O4 Na4P2O7MnO4
NaMnO2/MgO NaMnO4/MgO
Mn2SiO4 MnSiO3
Mn7SiO12 Ce-Mn-Na-O
Y2O3 CdO
TiO2 Li/TiO2
TiO2 NaCl/ TiO2
K2O/TiO2 KCl/TiO2
Na2CO3 /TiO2 Li/ZnO
NaCl/NiO LiCl/CoOx
NiO LiCl/NiO
Li2CO3/NiO LiNO3/NiO
NaFeO2 LiFeO2
AgCrO2 NiLiMgO
Current Oxidative Coupling Catalyst Performance Limits
J.C. Bricker, personal communication, 2007

29
The CCS see-saw … and a deadline
Reaching an agreement in Copenhagen this December to sharply
cut greenhouse gas emissions is "the world’s last chance to stop
climate change before it passes the point of no return.“
—EU Environment Commissioner Stavros Dimas, February 2009
30
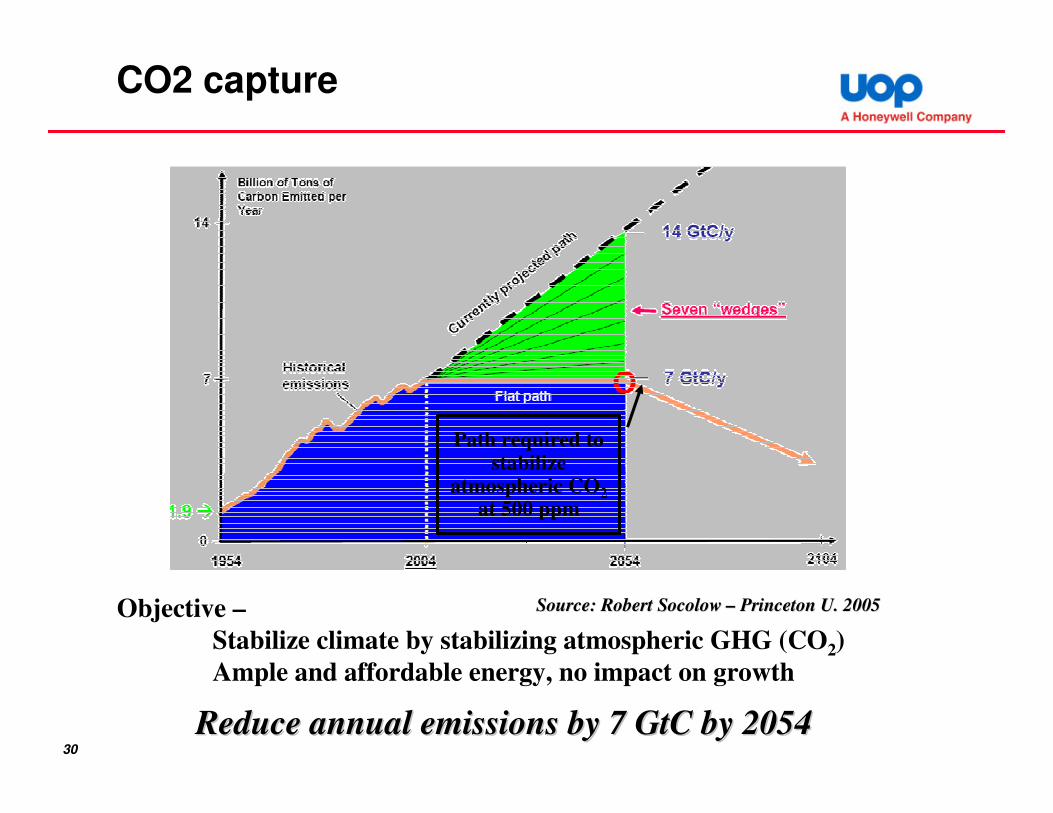
CO2 capture
Path required to stabilize
atmospheric CO2
at 500 ppm
Objective –
Stabilize climate by stabilizing atmospheric GHG (CO2)
Ample and affordable energy, no impact on growth
Reduce annual emissions by 7 Reduce annual emissions by 7 GtCGtC by 2054by 2054
Source: Robert Source: Robert SocolowSocolow –– Princeton U. 2005Princeton U. 2005

31
• CO2 capture and storage
• Renewable electricity and fuels
• Energy Efficiency and Conservation
• Fuel Switching
• Nuclear Fission
• Forests and Soils
Total = 25 Gigatons carbon1 GtC/yr
50 years
Wedges:
Potential Wedges:
@$100/tC
~ $2.5 trillion
Source: Robert Source: Robert SocolowSocolow –– Princeton U. 2005Princeton U. 2005
Wedge model for CO2 concentration stabilization

32
Magnitude of The Challenge
What is needed to achieve 1 GtC/yr reduction?
Example 2: CO2 Storage
• 3500 Sleipners @ 1 Mt CO2/yr
• 100x U.S. CO2 injection rate for EOR
• A flow of CO2 into the earth equal to
the flow of oil out of the earth today Statoil
Example 1: Electric Power
Carbon capture (and storage) for 800 GW
coal power generation (+1400 plants)
DOE/NETL

33
Carbon Capture and Storage Approaches
POX+ CO2 Sep
Air Separation Unit
CO2 Sep
Fossil Fuel
CO2
Compression& Dehydration
Power & Heat
Power & Heat
Power & Heat
N2
N2 & H2O
O2
H2
N2
O2
CO2
CO2
CO2
Air
Post
Combustion
Precombustion
Decarbonisation
Oxyfuel
Air
Air
CO2 Storage
CO2 / N2 / O2 /H2O
CO2 / H2 / CO
N2 / O2
CO2 /H2O
Source: COSource: CO22 Capture ConsortiumCapture Consortium
34
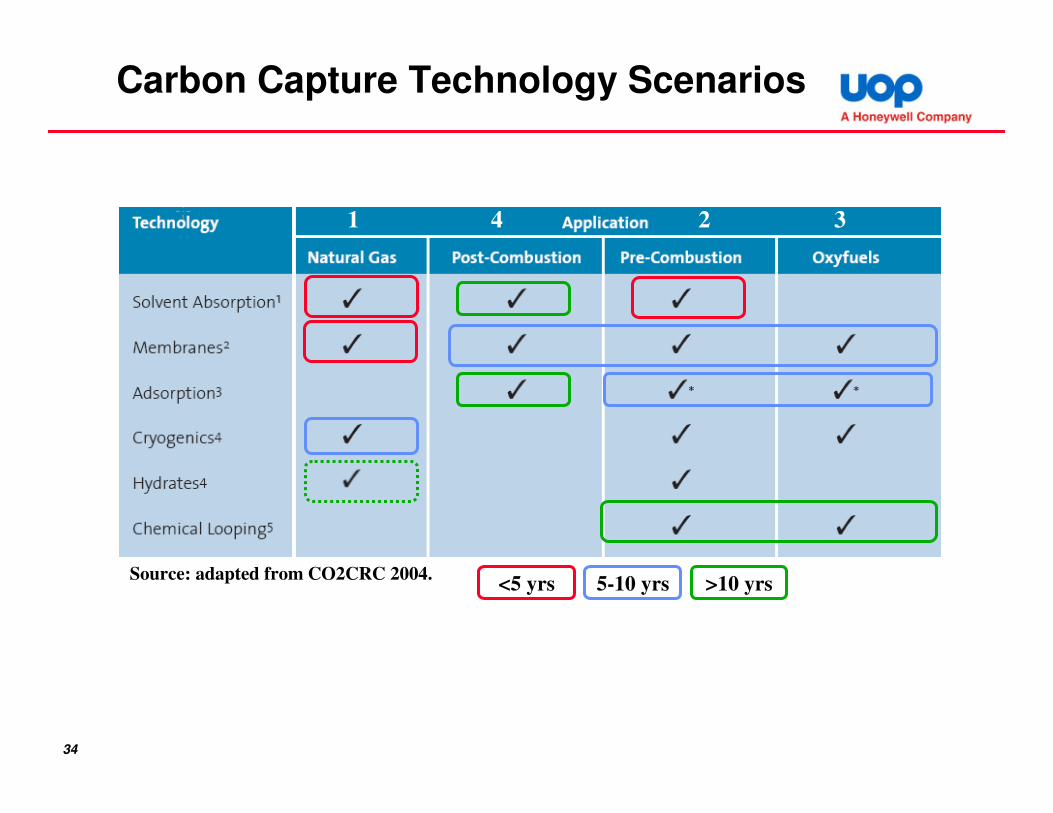
Carbon Capture Technology Scenarios
<5 yrs 5-10 yrs >10 yrs
1 2 34
Source: adapted from CO2CRC 2004.

35
CO2 Monitoring, Verification, Accounting
Image c
ourt
esy
of
CO
2C
RC
• Verification of CO2 sequestration an essential aspect of CO2
mitigation systems
• Extensive systems for monitoring, auditing, remediation, reporting will be required
• End-to-end chain must be considered: from sensors and instrumentation to industry/national audit trails
• Risk management perspective: potential failure modes and models must be identified, mitigation strategies established
Honeywell CO2
detectors
Corrosion
monitoring

36
Remote control of CO2 Transportation and Injection
• Geographically dispersed plant and equipment such as pipelines, valves, compressors, gas treatment, wellheads and underground systems with minimal staffing. Requires remote control and remote monitoring technology.
• Dynamic process fluctuations and the large scale of assets require self-regulating automation for plant to operate to design and to modulate to ambient conditions
• Sensing of safety-critical parameters and plant and equipment shutdown on detection of onset of breaches
• Sense and measure parameters for various stakeholders including operations, maintenance and compliance
Honeywell
Remote Controller
Honeywell (HMI)
Human Machine Interface
Honeywell Remote Control Room
& SCADABroad range of wired and
wireless sensing and
measurement
37
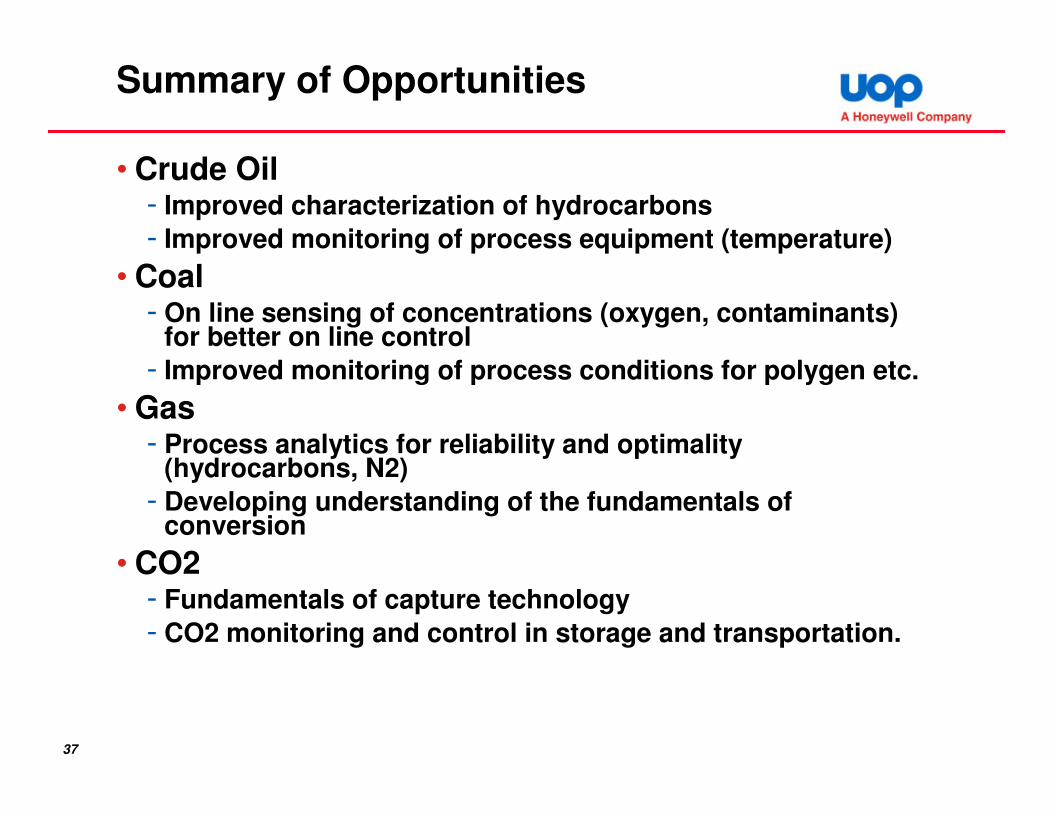
Summary of Opportunities
• Crude Oil- Improved characterization of hydrocarbons
- Improved monitoring of process equipment (temperature)
• Coal- On line sensing of concentrations (oxygen, contaminants)
for better on line control
- Improved monitoring of process conditions for polygen etc.
• Gas- Process analytics for reliability and optimality
(hydrocarbons, N2)
- Developing understanding of the fundamentals of conversion
• CO2- Fundamentals of capture technology
- CO2 monitoring and control in storage and transportation.

38
Acknowledgements
• Contributions of the following colleagues are gratefully acknowledged :- UOP/Honeywell
� Blaise Arena
� Bryan Magnus
� Robert Haizmann
� David Penner
� Paul Barger
� Jeffery Bricker
� Stephen Lupton
� Robert James
� Ganesh Venimadhavan
� Tariq Samad
� Brendan Sheehan
- Other � Hugh Hillhouse, Purdue University


