
The Effect of WMA on RAP in Hot Mix Asphalt
DRAFT FINAL REPORT
March 2015
Submitted by
NJDOT Research Project Manager
Giri Venkiteela
FHWA-NJ-20XX-0XX
Thomas Bennert, Ph.D. Rutgers University
In cooperation with
New Jersey Department of Transportation
Bureau of Research and Technology and
U.S. Department of Transportation Federal Highway Administration
ii
Disclaimer Statement
"The contents of this report reflect the views of the author who is responsible for the facts and the
accuracy of the data presented herein. The contents do not necessarily reflect the official views or policies of the New Jersey Department of Transportation or the Federal Highway Administration. This report does not constitute
a standard, specification, or regulation."
iii
1. Report No. 2. Government Accession No.
TECHNICAL REPORT STANDARD TITLE PAGE
3. Rec ip ient ’s Cata log No.
5 . Repor t Date
8. Performing Organization Report No.
6. Performing Organizat ion Code
4. Ti t le and Subt i t le
7. Author(s)
9. Performing Organization Name and Address 10. Work Unit No.
11. Contract or Grant No.
13. Type of Report and Period Covered
14. Sponsoring Agency Code
12. Sponsoring Agency Name and Address
15. Supplementary Notes
16. Abstract
17. Key Words
19. Security Classif (of this report)
Form DOT F 1700.7 (8-69)
20. Security Classif. (of this page)
18. Distr ibution Statement
21. No of Pages 22. Price
March 2015
Final Report 1/2011 – 12/2014
Rutgers University Piscataway, NJ 08854
New Jersey Department of Transportation Federal Highway Administration CN 600 U.S. Department of Transportation Trenton, NJ 08625 Washington, D.C.
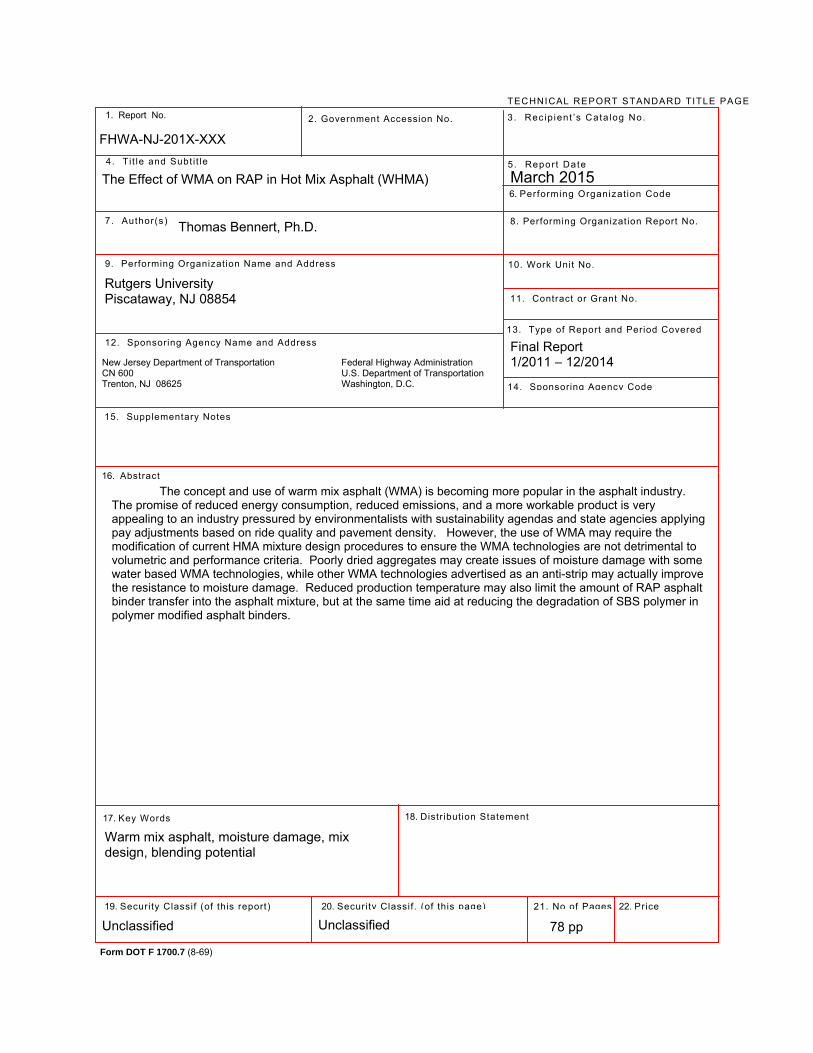
The concept and use of warm mix asphalt (WMA) is becoming more popular in the asphalt industry.
The promise of reduced energy consumption, reduced emissions, and a more workable product is very appealing to an industry pressured by environmentalists with sustainability agendas and state agencies applying pay adjustments based on ride quality and pavement density. However, the use of WMA may require the modification of current HMA mixture design procedures to ensure the WMA technologies are not detrimental to volumetric and performance criteria. Poorly dried aggregates may create issues of moisture damage with some water based WMA technologies, while other WMA technologies advertised as an anti-strip may actually improve the resistance to moisture damage. Reduced production temperature may also limit the amount of RAP asphalt binder transfer into the asphalt mixture, but at the same time aid at reducing the degradation of SBS polymer in polymer modified asphalt binders.
Warm mix asphalt, moisture damage, mix design, blending potential
Unclassified Unclassified
78 pp
FHWA-NJ-201X-XXX
Thomas Bennert, Ph.D.
The Effect of WMA on RAP in Hot Mix Asphalt (WHMA)
iv
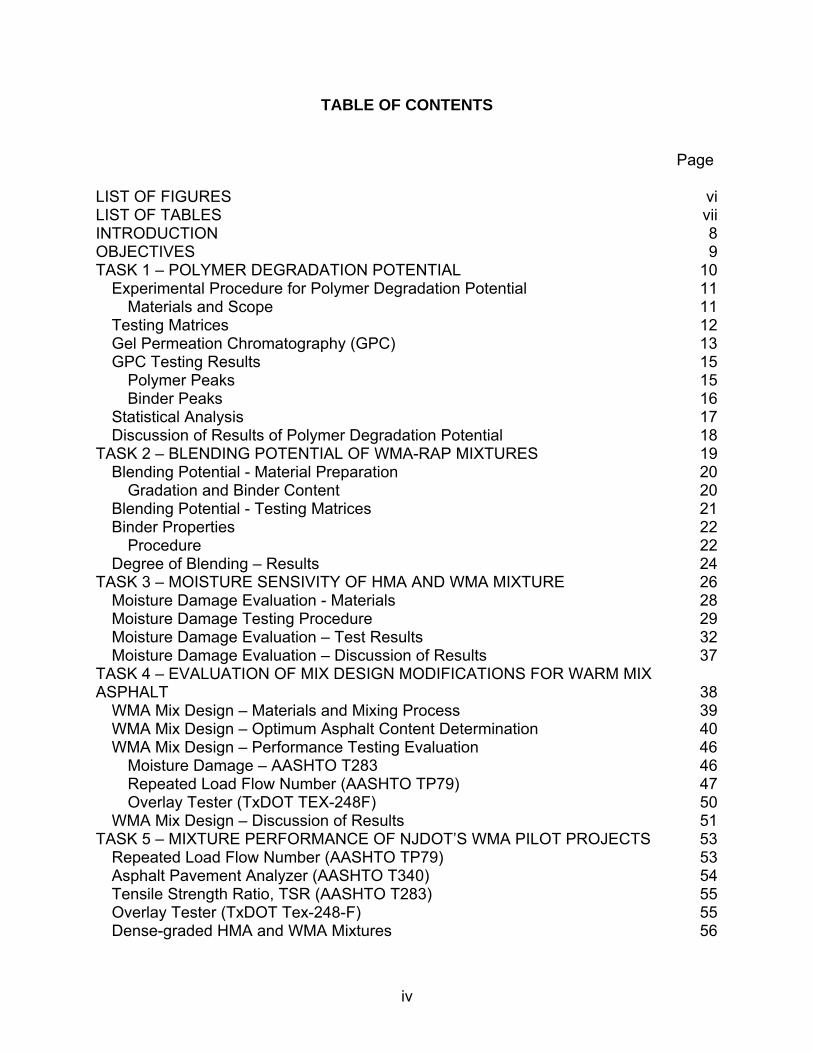
TABLE OF CONTENTS Page LIST OF FIGURES vi LIST OF TABLES vii INTRODUCTION 8 OBJECTIVES 9 TASK 1 – POLYMER DEGRADATION POTENTIAL 10
Experimental Procedure for Polymer Degradation Potential 11 Materials and Scope 11
Testing Matrices 12 Gel Permeation Chromatography (GPC) 13 GPC Testing Results 15
Polymer Peaks 15 Binder Peaks 16
Statistical Analysis 17 Discussion of Results of Polymer Degradation Potential 18
TASK 2 – BLENDING POTENTIAL OF WMA-RAP MIXTURES 19 Blending Potential - Material Preparation 20
Gradation and Binder Content 20 Blending Potential - Testing Matrices 21 Binder Properties 22
Procedure 22 Degree of Blending – Results 24
TASK 3 – MOISTURE SENSIVITY OF HMA AND WMA MIXTURE 26 Moisture Damage Evaluation - Materials 28 Moisture Damage Testing Procedure 29 Moisture Damage Evaluation – Test Results 32 Moisture Damage Evaluation – Discussion of Results 37
TASK 4 – EVALUATION OF MIX DESIGN MODIFICATIONS FOR WARM MIX ASPHALT 38
WMA Mix Design – Materials and Mixing Process 39 WMA Mix Design – Optimum Asphalt Content Determination 40 WMA Mix Design – Performance Testing Evaluation 46
Moisture Damage – AASHTO T283 46 Repeated Load Flow Number (AASHTO TP79) 47 Overlay Tester (TxDOT TEX-248F) 50
WMA Mix Design – Discussion of Results 51 TASK 5 – MIXTURE PERFORMANCE OF NJDOT’S WMA PILOT PROJECTS 53
Repeated Load Flow Number (AASHTO TP79) 53 Asphalt Pavement Analyzer (AASHTO T340) 54 Tensile Strength Ratio, TSR (AASHTO T283) 55 Overlay Tester (TxDOT Tex-248-F) 55 Dense-graded HMA and WMA Mixtures 56
v
Stone Matrix Asphalt (SMA) WMA Mixtures – Fiberless SMA 58 NJDOT Pilot Project – Discussion of Results 59
CONCLUSIONS 61 RECOMMENDATIONS FOR IMPLEMENTATION 63 REFERENCES 64 APPENDIX A – WMA PILOT PROJECT SPECIFICATION 68
Section 401 – Hot Mix Asphalt (HMA) Courses 69 401.01 Description 69 401.04 Measurement and Payment 69 902.10 WARM Mix Asphalt (WMA) 71
NJDOT B-10 – Overlay test for Determining Crack Resistance of HMA 76
vi
LIST OF FIGURES Figure 1 – Example of Particle Size Exclusion 14 Figure 2 – Chromatograph with the Selection of the Polymer Peak 15 Figure 3 – Polymer Peak Molecular Weight at Original, RTFO 133oC, and RFTO 163oC
16 Figure 4 – Binder Peak Molecular Weight at Original, RTFO 133oC, and RTFO 163oC 17 Figure 5 – Job Mix Formula (JMF) and Gap Gradation for 25% RAP 21 Figure 6 – Job Mix Formula Information for Moisture Damage Study 29 Figure 7 – Aggregate Blends Saturating Prior to Mixing 30 Figure 8 – Heating and Mixing Aggregate Blends 30 Figure 9 – Monitoring Temperature of Aggregate Blend with Infrared Temperature
Probe 31 Figure 10 – Advera WMA Test Specimens for 240oF Mixing Temperature, 2%
Aggregate Moisture Content 34 Figure 11 - Advera WMA Test Specimens for 240oF Mixing Temperature, 4% Aggregate
Moisture Content 35 Figure 12 – Aggregate Blend for 12.5M76, 0% and 25% RAP, Mixture 39 Figure 13 – Optimum Asphalt Content Determination for Baseline (Hot Mix Asphalt @
315oF) Mixture with 0% and 25% RAP 41 Figure 14 - Optimum Asphalt Content Determination for Baseline (Warm Mix Asphalt @
275oF – No Additive) Mixture with 0% and 25% RAP 42 Figure 15 - Optimum Asphalt Content Determination for Baseline (Warm Mix Asphalt @
275oF – Evotherm Additive) Mixture with 0% and 25% RAP 43 Figure 16 - Optimum Asphalt Content Determination for Baseline (Warm Mix Asphalt @
275oF – Advera Additive) Mixture with 0% and 25% RAP 44 Figure 17 - Optimum Asphalt Content Determination for Baseline (Warm Mix Asphalt @
275oF – Sasobit Additive) Mixture with 0% and 25% RAP 45 Figure 18 – Tensile Strength Ratio (TSR) Results of Mixtures 47 Figure 19 – Asphalt Mixture Performance Tester (AMPT) at Rutgers University 48 Figure 20 – Flow Number Test Results for WMA Mixtures 49 Figure 21 – Overlay Tester Device at Rutgers University 50 Figure 22 – Overlay Tester Fatigue Cracking Results for WMA Mixtures 51 Figure 23 – a) Asphalt Pavement Analyzer at Rutgers University; b) Inside the Asphalt
Pavement Analyzer Device 54 Figure 24 – Picture of the Overlay Tester (Chamber Door Open) 55 Figure 25 – Relationship Between Draindown Potential and Compacted Air Voids for a
Fiberless SMA Mixture 59
vii
LIST OF TABLES Table 1 – Testing Matrix for Polymer Degradation 13 Table 2 – Input Parameters Used for GPC Software 14 Table 3 – Testing Matrix for Degree of Blending 22 Table 4 – Degree of Blending Results 24 Table 5 – Tensile Strength Ratio Values Measured on Asphalt Mixtures of Different
Aggregates and Moisture Contents (After Bennert, 2012) 28 Table 6 – Moisture Damage Potential for Control Asphalt Mixture (No WMA Additive) 32 Table 7 – Moisture Damage Potential for Sasobit WMA Additive 33 Table 8 – Moisture Damage Potential for Rediset WMA Additive 33 Table 9 – Moisture Damage Potential for Advera WMA Additive 34 Table 10 – Improvement in Tensile Strength Ratio (TSR), Comparison for Sasobit to
Control Mixture 36 Table 11 – Improvement in Tensile Strength Ratio (TSR), Comparison for Rediset to
Control Mixture 36 Table 12 – Improvement in Tensile Strength Ratio (TSR), Comparison for Advera to
Control Mixture 37 Table 13 – Summary of Optimum Asphalt Content for 12.5M76 with Different WMA
Additives and RAP Contents 41 Table 14 – Minimum Flow Number Requirements for Warm Mix Asphalt (Bonaquist,
2011) 48 Table 15 – Recommended Minimum Flow Number Requirements for Warm Mix Asphalt
(WMA) and Hot Mix Asphatl (HMA) (after Bonaquist, 2011) 54 Table 16 – Summary of Dense-Graded HMA and WMA Mixture Performance 57 Table 17 – Summary of SMA and Fiberless SMA Mixture Performance 60
8
INTRODUCTION Warm mix asphalt refers to asphalt concrete mixtures that are produced at temperatures approximately 40 to 70 °F cooler than typically used in the production of hot mix asphalt. The goal with warm mix asphalt is to produce mixtures with similar strength, durability, and performance characteristics as hot mix asphalt using substantially reduced production temperatures. There are important environmental and health benefits associated with reduced production temperatures including: lower greenhouse gas emissions, lower fuel consumption, and reduced exposure of workers to asphalt fumes. Lower production temperatures can also potentially improve pavement performance by reducing binder aging, providing added time for mixture compaction, and allowing improved compaction during cold weather paving. Warm mix asphalt technologies were first introduced in Europe in the late 1990’s as one measure to reduce greenhouse gas emissions. The National Asphalt Pavement Association has been instrumental in bringing these technologies into the United States with several demonstration projects being constructed since 2004. These projects have demonstrated the feasibility of using warm mix processes in the United States. Pavements have been successfully constructed using various warm mix processes with only minimal changes to equipment and quality control practices. These projects have served the important function of introducing warm mix asphalt to agency and contractor personnel, demonstrating the constructability of warm mix asphalt and providing data on energy usage and emissions. They also provide critically needed pavement sections for monitoring the performance of warm mix asphalt. Recently, a Warm Mix Asphalt Technical Working Group (TWG) has been assembled by the Federal Highway Administration (FHWA) to help guide future efforts to implement this technology. Dr. Thomas Bennert, the Principle Investigator (PI) for this proposal, was elected to this organization. One of the critical issues facing warm mix asphalt is the lack of a formal mixture design procedure. To date, properly designed hot mix asphalt concrete has served as the design for the warm mix projects constructed in the United Sates. However, the potential inclusion of higher RAP contents and plant systems that utilize foaming techniques may require modifications to the current Superpave procedure used for hot mix asphalt. If warm mix asphalt is to replace or used in conjunction with hot mix asphalt in the future, a laboratory mixture design procedure for warm mix asphalt must be established. Current efforts are underway under NCHRP 9-43 (Bonaquist, 2007) that have recommended modifications to Superpave, but to date, nothing has yet to be adopted. Another critical issue which needs further evaluation is the use of RAP, and higher RAP percentages, in conjunction with WMA. Recent work by Bennert (2009) and Mehta (2009) has indicated that during hot mix asphalt production, it is highly unlikely that full blending between the RAP and virgin asphalt binders exist. Bennert and Dongre (2009) showed this through the backcalculation of the effective asphalt binder properties of RAP mixtures by dynamic modulus testing and analytical techniques, while Mehta
9
(2009) showed this through coating studies. When blending does not occur, an under-asphalted condition occurs due to a decrease in film thickness on the virgin aggregates. This was validated in mixture fatigue testing (Flexural Beam Fatigue and Overlay Tester) conducted by Bennert (2009). Therefore, if blending does not occur at elevated temperatures, it is highly unlikely that blending of RAP and virgin binders occur at lower temperatures. However, what may help in counter-acting the lack of binder blending is the reduced oxidative aging of the asphalt binder and reduced levels of asphalt binder absorption at lower production temperatures. Unfortunately, even though this may provide a more fatigue resist mix, rutting susceptibility may become an issue. The development and adoption of a WMA technology/additive Acceptance Procedure that is based on mixture performance testing would certainly help NJDOT gain confidence in the future adoption of warm mix asphalt. OBJECTIVES The objective of NJDOT 2010-04, The Effect of Warm Mix Asphalt on RAP in HMA, is to determine whether recycled asphalt pavement (RAP) can be used at typical and higher percentages in warm mix asphalt (WMA). As stated in the RFP, due to the fact this will be highly dependent on how the final mixture is produced, much of the work is required to be conducted on the WMA mixtures. Key issues that will be addressed during the research project are; 1) Possible influence of production temperatures on polymer degradation in polymer-modified asphalt; 2) Evaluate blending potential of RAP in WMA conditions; 3) Moisture susceptibility of WMA using different technologies; 4) Possible mixture design modifications and laboratory performance of WMA technologies and additives; and 5) Comparison of WMA Pilot Study test sections to comparison HMA test sections. Dr. Thomas Bennert of the Center for Advanced Infrastructure and Technology (CAIT) at Rutgers University managed the project and managed and directly oversaw the work effort in Tasks 3 to 5 noted above. Rowan University was a subcontractor to the Center for Advanced Infrastructure and Technology (CAIT). Rowan was led by Dr. Yusuf Mehta and were tasked with conducting Tasks 1 and 2 noted above.
10
TASK 1 – POLYMER DEGRADATION POTENTIAL In response to the Kyoto Accord adopted in December 1997, the European Union was prompted to seek new ways to reduce carbon emissions via any median, including paving methods and practices. By 2000, the European Union (EU) had introduced various paving alternatives, one of which was warm mix asphalt (WMA) technology. Progress made regarding warm mix technology in European nations prompted the United States industries to make several tours and scans of the research and projects that had been implemented. As a result of these trips, about 25 warm mix asphalt technologies are now available in the United States and various studies exist exploring the characteristics of the various types of warm mix. WMA (warm mix asphalt) technology reduces the production temperature of asphalt concrete by approximately 100 ºF (50 ºC) to 130 ºF (75 ºC) (Estakhri et al., 2010). The decrease in production temperature decreases greenhouse gas emissions as well as health and odor problems associated with the emission (Stroup-Gardiner and Lange, 2002). This drop in emission can lead to a significant cost reduction considering emission control required at asphalt plants (Hampton, 2011). The process by which the production temperature is reduced typically varies between the various warm mix technologies that are available. Generally these processes are categorized into 4 different types that include plant foaming, foaming agents, viscosity reducers, and emulsifiers (Bennert, 2010). These include foaming agent/additives, plant foaming, viscosity reducers, and emulsions. There are more than 25 different WMA technologies currently in the United States. In conventional asphalt pavements or hot mix asphalt, polymer modification is necessary to meet traffic and climate demands relative to local climate and traffic volume. The most widely used polymer modifier in the state of New Jersey is styrene-butadiene-styrene (SBS). Polymer modification is known to lead to superior performance in pavements with respect to rutting, load associated fatigue cracking and low temperature thermal cracking (Von Quintus et al, 2005). The polymers within the asphalt pavements undergo traffic frequency and climactic effects both of which contribute to premature pavement failure. Some failures are a result of chemical and structural modification which leads to asphalt aging and oxidation and polymer degradation. Polymer degradation is the breakdown and deterioration of performance in modified binders due to oxidation and heat. Lu and Isaccson (1998, 2000) concluded that the rheological properties of asphalt binder were adversely affected by oxidation and styrene-butadiene-styrene (SBS) degradation in SBS modified binders. Styrene-Butadiene-Styrene (SBS) is a block copolymer that is categorized as an elastomer, which exhibits higher strength at higher temperature but maintains ductility at low temperatures (Hrdlicka et al., 2007). Block polymers like SBS are formed by joining two or more chemically different monomer or oligomer blocks into a linear series. The styrene blocks of SBS contribute to the strength associated with SBS while the butadiene block contributes to the rubbery and ductile matrix. Typically SBS requires certain butadiene richness in order to properly strengthen asphalt which ranges from
11
60-70% in butadiene content. When aging is imparted on SBS, it is typically the butadiene block that is immediately oxidized and leads to chain separations and an asphalt that begins to behave more brittle (Mouillet et al., 2008). Gel permeation chromatography (GPC) have been used to measure the molecular weights of the binder and polymer components of the binder (Lu and Isacsson, 2000; Sugano et al., 2009). GPC measures the range of molecular weight of the largest particles first which in this case are the polymers and a reduced molecular weight could indicate the reduction of the polymer molecules. Results showed that as heat and oxidation increased, polymer molecular weight decreased indicating polymer degradation as a result of stabilization with chemical constituents within the binder. Unlike the polymer, the binder increased in molecular weight as a result of the increase of the high molecular weight binder constituent known as asphaltenes (Sugano et al., 2009). Cortizo (2004) delved further into the concept of thermal degradation of polymers by comparing SBS polymers with different chemical structures (linear and star) and controlled aging through GPC testing. Although comprised of similar materials, the two structures differ in molecular weight in addition to behavior in thermal degradation. It was concluded that cross-linking products were formed as a result of star structured products. Linear SBS modified asphalt produced lower molecular size products which resulted from a lack of free radicals to cross-link with asphalt constituents which led to chain scission and additions to asphalt constituents. The addition of broken polymer chains would lead to higher binder molecular weights in aged binders.
Experimental Procedure for Polymer Degradation Potential Materials and Scope In this study, a base binder consisting of a SBS-modified PG76-22 supplied by NuStar Asphalt in Paulsboro, NJ was modified with two WMA additives, totaling three binders for the polymer degradation study. WMAT 1 and WMAT 2 were the two WMA additives selected for this study and were preblended with the base binder at 0.8% and 1.5% by weight of asphalt binder, respectively. Currently WMAT 1 and WMAT 2 are two of the most widely used WMA additives in the paving industry and thus the reason for their selection in this study. A brief overview of these additives is found below. WMAT 1 is categorized as a synthetic emulsifier in that it chemically reacts to blend two previously immiscible products which are the asphalt and aggregate. Typical hot mix asphalt uses higher temperatures to reduce viscosity and promote coating. WMAT 1 reduces the heat energy required and uses chemical energy to promote coating. WMAT 1 is comprised of surface active agents (surfactants), which have polar and non-polar properties. These surfactants are able to react with the non-polar asphalt and polar aggregate bringing the two together at a lower temperature.
12
WMAT 2 is categorized as a viscosity reducer of both mixing and compaction temperature. WMAT 2 is long chain aliphatic polymethylene hydrocarbon crystalline structure that originates from byproducts of the Fischer-Tropsch process on natural gases or coal. The byproducts of interest are the Fischer-Tropsch waxes which have long hydrocarbon chains which lead to higher melting points. WMAT 2 is completely soluble in asphalt binder at temperatures higher than 248°F (120°C) and will not separate in storage. The crystalline properties at lower temperatures of asphalt provide rut resistance and can be considered an alternative to SBS modification. The GPC analysis was used to quantify polymer degradation sensitivity of the resultant polymer and binder molecular weights. A decrease or increase in molecular weight would indicate change in molecular size distribution for both polymer and binder molecular weight distributions, respectively. Testing Matrices The polymer degradation testing regimen is presented in Table 1. Duplicate testing was conducted to provide an average for comparisons. A uniform set of the three binders were created using the rolling thin film oven (RTFO) procedure in accordance with AASHTO T240. The three binders were tested at three of the following aging conditions: Original binder with no aging; RTFO aging at 133°C (~270oF) to simulate short term aging at warm mix plant conditions; and RTFO aging at 163°C (~325oF) to simulate short term aging at hot mix plant conditions. The time in the RTFO was controlled at 1 hour and 25 minutes in accordance to AASHTO T240. The number average molecular weight (Mn) and weight average molecular weight (Mw) were measured from the gel permeation chromatography test replicates.
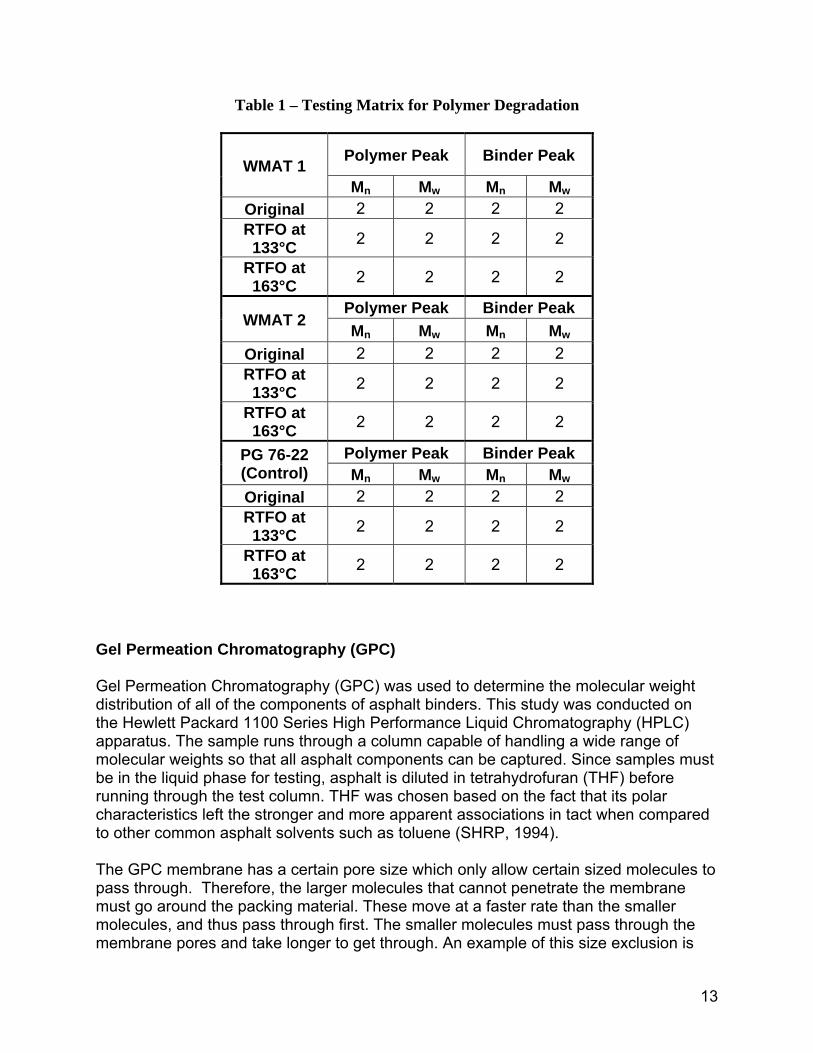
13
Table 1 – Testing Matrix for Polymer Degradation
WMAT 1 Polymer Peak Binder Peak
Mn Mw Mn Mw Original 2 2 2 2 RTFO at 133°C 2 2 2 2
RTFO at 163°C 2 2 2 2
WMAT 2 Polymer Peak Binder Peak Mn Mw Mn Mw
Original 2 2 2 2 RTFO at 133°C 2 2 2 2
RTFO at 163°C 2 2 2 2
PG 76-22 (Control)
Polymer Peak Binder Peak Mn Mw Mn Mw
Original 2 2 2 2 RTFO at 133°C 2 2 2 2
RTFO at 163°C 2 2 2 2
Gel Permeation Chromatography (GPC)
Gel Permeation Chromatography (GPC) was used to determine the molecular weight distribution of all of the components of asphalt binders. This study was conducted on the Hewlett Packard 1100 Series High Performance Liquid Chromatography (HPLC) apparatus. The sample runs through a column capable of handling a wide range of molecular weights so that all asphalt components can be captured. Since samples must be in the liquid phase for testing, asphalt is diluted in tetrahydrofuran (THF) before running through the test column. THF was chosen based on the fact that its polar characteristics left the stronger and more apparent associations in tact when compared to other common asphalt solvents such as toluene (SHRP, 1994). The GPC membrane has a certain pore size which only allow certain sized molecules to pass through. Therefore, the larger molecules that cannot penetrate the membrane must go around the packing material. These move at a faster rate than the smaller molecules, and thus pass through first. The smaller molecules must pass through the membrane pores and take longer to get through. An example of this size exclusion is
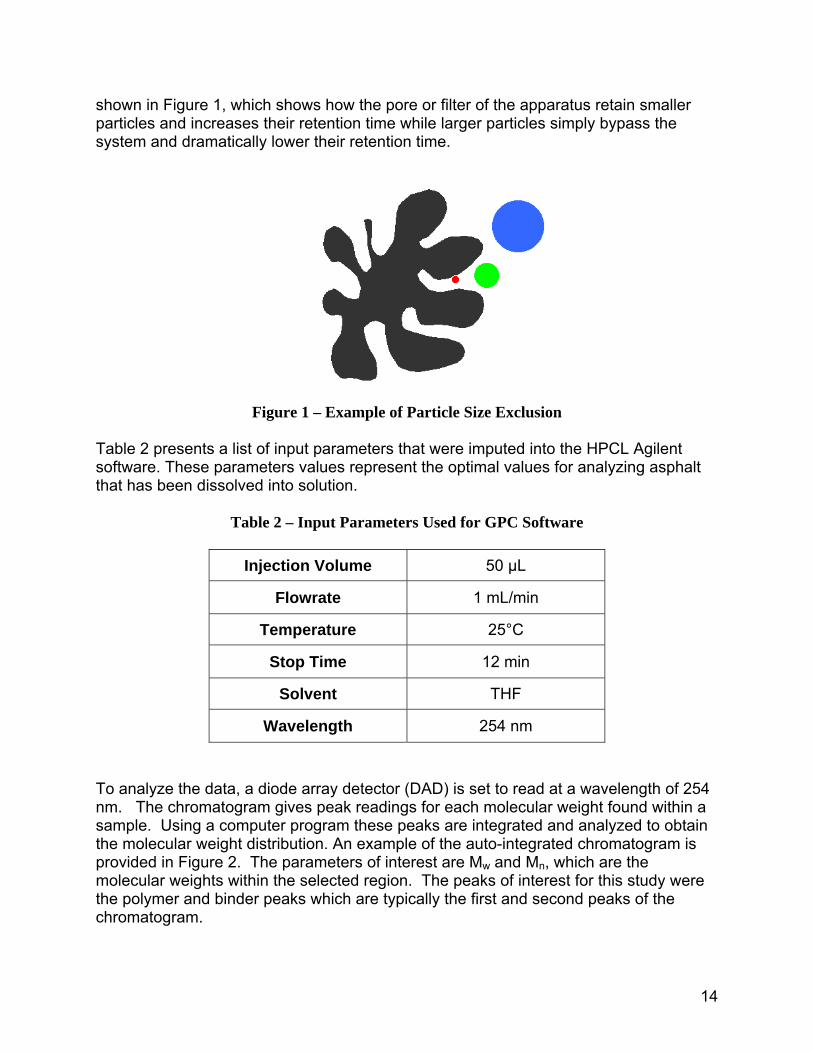
14
shown in Figure 1, which shows how the pore or filter of the apparatus retain smaller particles and increases their retention time while larger particles simply bypass the system and dramatically lower their retention time.
Figure 1 – Example of Particle Size Exclusion
Table 2 presents a list of input parameters that were imputed into the HPCL Agilent software. These parameters values represent the optimal values for analyzing asphalt that has been dissolved into solution.
Table 2 – Input Parameters Used for GPC Software
Injection Volume 50 µL
Flowrate 1 mL/min
Temperature 25°C
Stop Time 12 min
Solvent THF
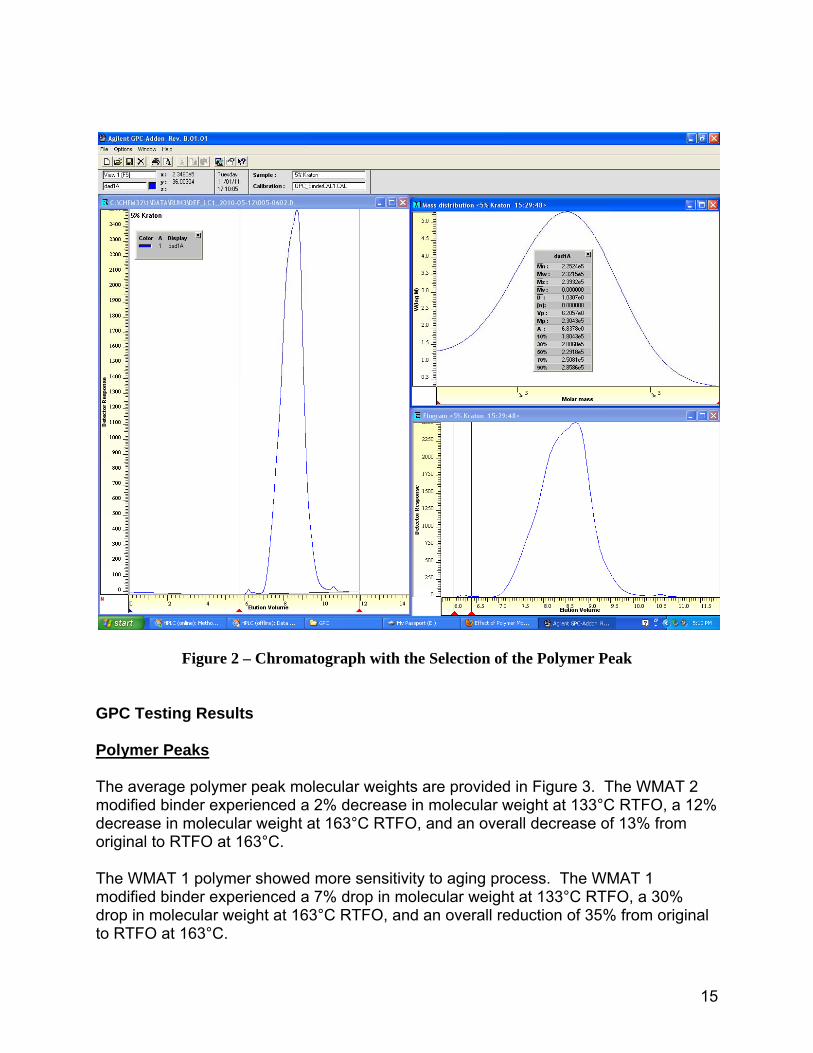
Wavelength 254 nm To analyze the data, a diode array detector (DAD) is set to read at a wavelength of 254 nm. The chromatogram gives peak readings for each molecular weight found within a sample. Using a computer program these peaks are integrated and analyzed to obtain the molecular weight distribution. An example of the auto-integrated chromatogram is provided in Figure 2. The parameters of interest are Mw and Mn, which are the molecular weights within the selected region. The peaks of interest for this study were the polymer and binder peaks which are typically the first and second peaks of the chromatogram.
15
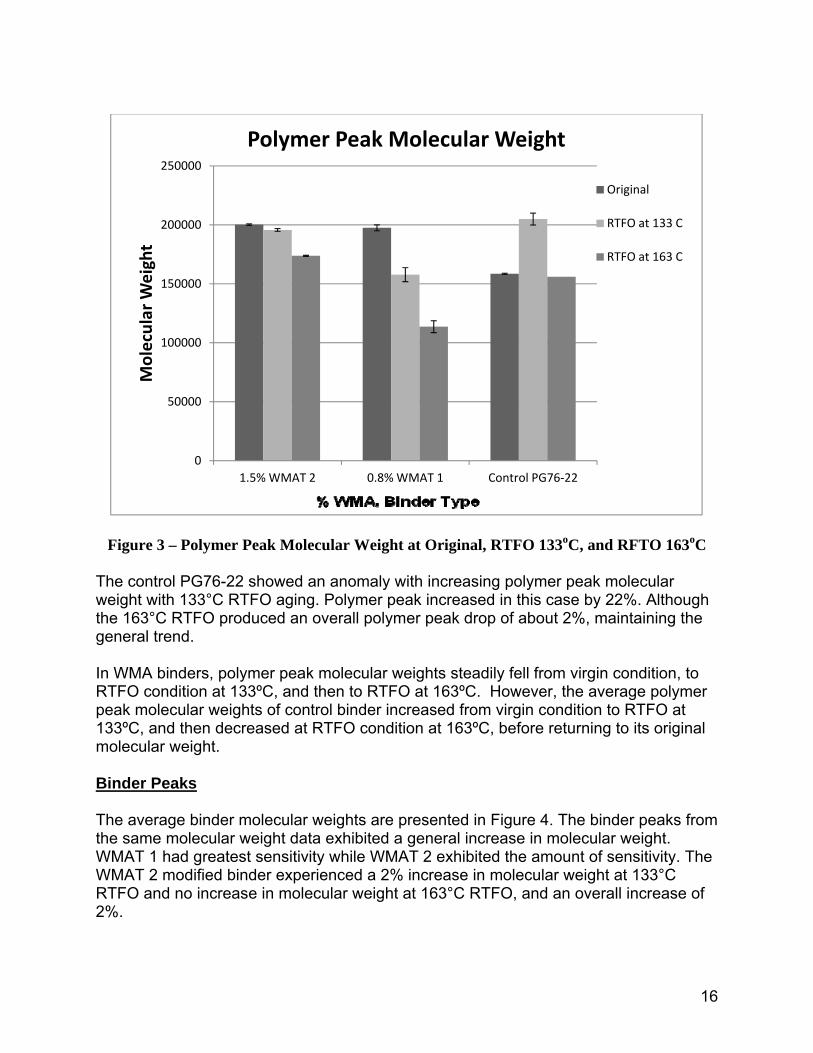
Figure 2 – Chromatograph with the Selection of the Polymer Peak GPC Testing Results Polymer Peaks The average polymer peak molecular weights are provided in Figure 3. The WMAT 2 modified binder experienced a 2% decrease in molecular weight at 133°C RTFO, a 12% decrease in molecular weight at 163°C RTFO, and an overall decrease of 13% from original to RTFO at 163°C. The WMAT 1 polymer showed more sensitivity to aging process. The WMAT 1 modified binder experienced a 7% drop in molecular weight at 133°C RTFO, a 30% drop in molecular weight at 163°C RTFO, and an overall reduction of 35% from original to RTFO at 163°C.
16
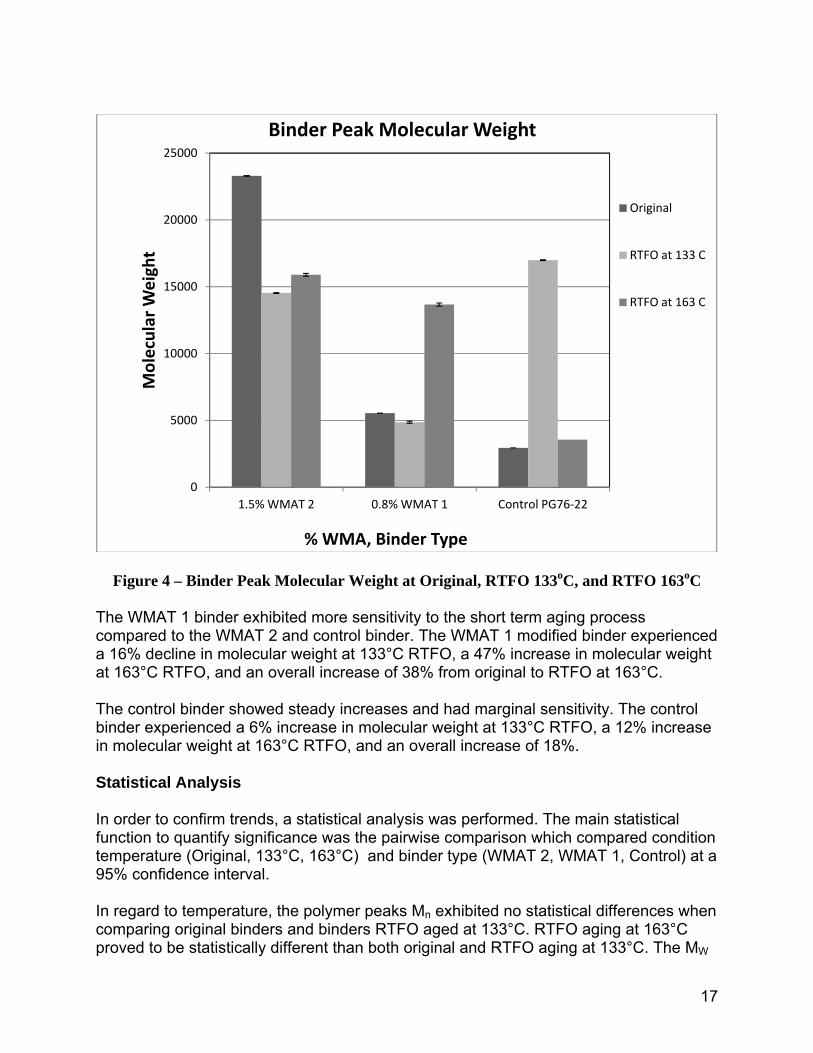
Figure 3 – Polymer Peak Molecular Weight at Original, RTFO 133oC, and RFTO 163oC The control PG76-22 showed an anomaly with increasing polymer peak molecular weight with 133°C RTFO aging. Polymer peak increased in this case by 22%. Although the 163°C RTFO produced an overall polymer peak drop of about 2%, maintaining the general trend. In WMA binders, polymer peak molecular weights steadily fell from virgin condition, to RTFO condition at 133ºC, and then to RTFO at 163ºC. However, the average polymer peak molecular weights of control binder increased from virgin condition to RTFO at 133ºC, and then decreased at RTFO condition at 163ºC, before returning to its original molecular weight. Binder Peaks The average binder molecular weights are presented in Figure 4. The binder peaks from the same molecular weight data exhibited a general increase in molecular weight. WMAT 1 had greatest sensitivity while WMAT 2 exhibited the amount of sensitivity. The WMAT 2 modified binder experienced a 2% increase in molecular weight at 133°C RTFO and no increase in molecular weight at 163°C RTFO, and an overall increase of 2%.
0
50000
100000
150000
200000
250000
1.5% WMAT 2 0.8% WMAT 1 Control PG76‐22
Molecular W
eight
Polymer Peak Molecular Weight
Original
RTFO at 133 C
RTFO at 163 C
17
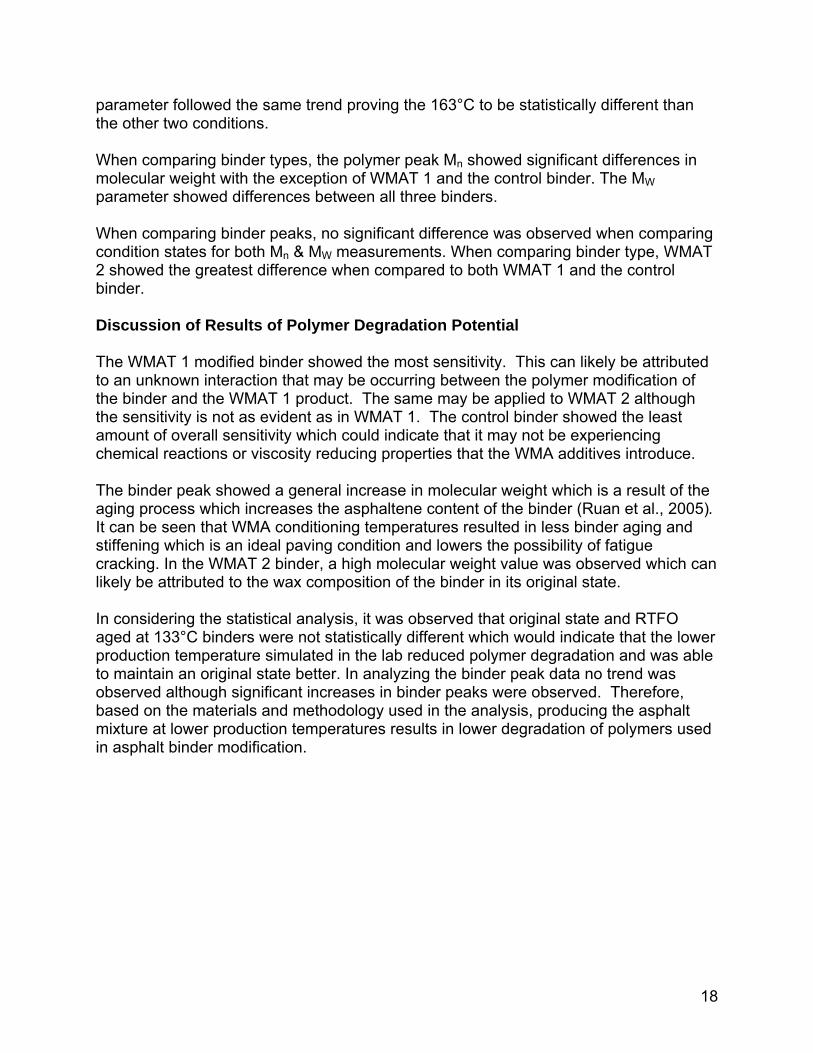
Figure 4 – Binder Peak Molecular Weight at Original, RTFO 133oC, and RTFO 163oC The WMAT 1 binder exhibited more sensitivity to the short term aging process compared to the WMAT 2 and control binder. The WMAT 1 modified binder experienced a 16% decline in molecular weight at 133°C RTFO, a 47% increase in molecular weight at 163°C RTFO, and an overall increase of 38% from original to RTFO at 163°C. The control binder showed steady increases and had marginal sensitivity. The control binder experienced a 6% increase in molecular weight at 133°C RTFO, a 12% increase in molecular weight at 163°C RTFO, and an overall increase of 18%. Statistical Analysis In order to confirm trends, a statistical analysis was performed. The main statistical function to quantify significance was the pairwise comparison which compared condition temperature (Original, 133°C, 163°C) and binder type (WMAT 2, WMAT 1, Control) at a 95% confidence interval. In regard to temperature, the polymer peaks Mn exhibited no statistical differences when comparing original binders and binders RTFO aged at 133°C. RTFO aging at 163°C proved to be statistically different than both original and RTFO aging at 133°C. The MW
0
5000
10000
15000
20000
25000
1.5% WMAT 2 0.8% WMAT 1 Control PG76‐22
Molecular W
eight
% WMA, Binder Type
Binder Peak Molecular Weight
Original
RTFO at 133 C
RTFO at 163 C
18
parameter followed the same trend proving the 163°C to be statistically different than the other two conditions. When comparing binder types, the polymer peak Mn showed significant differences in molecular weight with the exception of WMAT 1 and the control binder. The MW parameter showed differences between all three binders. When comparing binder peaks, no significant difference was observed when comparing condition states for both Mn & MW measurements. When comparing binder type, WMAT 2 showed the greatest difference when compared to both WMAT 1 and the control binder. Discussion of Results of Polymer Degradation Potential The WMAT 1 modified binder showed the most sensitivity. This can likely be attributed to an unknown interaction that may be occurring between the polymer modification of the binder and the WMAT 1 product. The same may be applied to WMAT 2 although the sensitivity is not as evident as in WMAT 1. The control binder showed the least amount of overall sensitivity which could indicate that it may not be experiencing chemical reactions or viscosity reducing properties that the WMA additives introduce. The binder peak showed a general increase in molecular weight which is a result of the aging process which increases the asphaltene content of the binder (Ruan et al., 2005). It can be seen that WMA conditioning temperatures resulted in less binder aging and stiffening which is an ideal paving condition and lowers the possibility of fatigue cracking. In the WMAT 2 binder, a high molecular weight value was observed which can likely be attributed to the wax composition of the binder in its original state. In considering the statistical analysis, it was observed that original state and RTFO aged at 133°C binders were not statistically different which would indicate that the lower production temperature simulated in the lab reduced polymer degradation and was able to maintain an original state better. In analyzing the binder peak data no trend was observed although significant increases in binder peaks were observed. Therefore, based on the materials and methodology used in the analysis, producing the asphalt mixture at lower production temperatures results in lower degradation of polymers used in asphalt binder modification.
19
TASK 2 – BLENDING POTENTIAL OF WMA-RAP MIXTURES One of the biggest concerns regarding the use of WMA is the potential for lack of blending between the virgin binder and RAP binder at the reduced mixing temperatures. A number of researchers have tried to identify methods that evaluates the degree of blending between virgin and RAP binders. Bonaquist (2007) utilized measured dynamic modulus results of mixtures and predicted dynamic modulus results using the Hirsch model to determine if blending was indeed occurring. The assumption being that if the measured values statistically matched those of the Hirsch model using the extracted/recovered asphalt binder of the mixtures, then blending in the asphalt mixture was occurring. Previous studies have shown strong evidence that neither black rock theory nor full blending occur but partial blending (Huang et al., 2005; Shirodkar et al., 2010; Nguyen, 2009). A study conducted by Huang (2005) in which virgin aggregates above the No.4 sieve were mixed with fine RAP aggregates below the No.4 sieve with no virgin binder aided in observing and quantifying the amount RAP binder interaction. This study was conducted with varying proportions of RAP (10%-30%) and mixed at 190°C for 3 minutes. Results from the Huang et al. (2005) study concluded that approximately 11% of RAP binder was actually mobilized which would indicate a degree of blending far less than the 100% assumption at most agencies. In another study conducted by Shirodkar et al. (2010), gap-graded RAP aggregates (No aggregates between the No.4 and No. 8 sieve) were heated to remove any preexisting moisture. Virgin coarse aggregates were washed to eliminate fines and RAP aggregate was sieved finer than the No. 8 sieve. The virgin and RAP material was then mixed at 350°F for 1, 2, and 3 minutes and at RAP contents of 10%, 25%, and 40% using a mechanical mixer. It was observed that percentage of RAP binder transfer increased after one minute and stopped increasing in the range of two to three minutes. The increase in RAP percentage also showed a decrease in RAP binder transfer mostly due to the fact that RAP aggregate is more likely to transfer binder to other RAP aggregate at higher RAP percentages. Shirodkar et al. (2010) developed an equation to quantify the degree of blending between virgin coarse aggregate and RAP fine aggregate using the binder properties from extracted and recovered samples. This involved mixing a gap graded asphalt mixture in which virgin aggregate comprised the coarse aggregate and RAP comprised the fine aggregate. The asphalt mixture was then manually separated into coarse and fine mixed aggregate. The separated coarse and fine aggregates were then extracted and recovered (AASHTO T-319) followed by binder property testing (AASHTO M-320). A blending ratio was developed using the RTFO G*/sin (δ) parameter from AASHTO M-320. The blending ratio equation was determined as follows in Equation 1:
/ /
/ / (1)
20
The numerator in Equation 1 presents the difference between the RTFO G*/sin (δ) parameter of the virgin and RAP material. The denominator represents the condition in which zero blending or no mobilization of RAP binder occurs. Since no RAP is activated, the binder extracted from virgin aggregate is expected to have the same properties as virgin binder material, which is represented in the first half of the denominator. Furthermore, RAP binder is not expected to mobilize during mixing but will still be removed during the extraction and recovery process. In order to replicate the black rock effect, film thicknesses around virgin and RAP aggregates were determined using the Bailey’s method. Bailey’s method approximates the total surface area of aggregates within a mixture using surface area factors obtained from the overall gradation. This total surface area is then used in conjunction with the asphalt content of the mixture for determining the approximate film thickness around each aggregate (Kandhal and Mallick, 1998; Sengoz and Topal, 2007). The film thickness was assumed to be the same for each aggregate in order to simplify calculations.
Nguyen (2009) concluded that the full blending assumed by a majority of transportation agencies does not occur by studying colored virgin binder and RAP aggregate imaging.. Fine and coarse RAP was considered in this study with a variety of mixing times ranging from 2 to 8 minutes for coarse RAP and 1 to 8 minutes for fine RAP. It was observed that coarse RAP led to an increased mixing effort and higher thermal energy requirements to prevent RAP from collecting. Although increased mixing time and fine RAP increased the homogeneity observed through slicing of compacted specimens, RAP collection was still evident in various combinations of conditioning and mixing time. Blending Potential - Material Preparation In order to measure the amount of RAP binder transfer between fine and coarse aggregate during the mixing and conditioning process preliminary preparations of RAP and aggregate were necessary. Coarse aggregate that is greater than the No. 4 (4.75 mm) sieve will act as the virgin aggregate material while the RAP sieved smaller than the No. 8 (2.38 mm) contributes the finer portions of the gradation in addition to RAP binder. This in turn leaves a gap between the No. 4 (4.75 mm) sieve and the No. 8 (2.38 mm) creating a gap gradation which will allow for easier separation of course and fine material. The following aggregate and RAP preparation was performed: sieve the virgin aggregate above the No. 4 (4.75 mm) sieve, wash the aggregate to remove any fines that would pass the No. 4(4.75 mm), dry the aggregate in the oven, and sieve the RAP to be less than No. 8 sieve (2.38 mm). Gradation and Binder Content A job mix formula (JMF) was provided by a mixing plant and was modified to accommodate the material preparation mentioned in the previous section. Figure 5 shows the JMF provided, and the modified JMF used, for the degree of blending study. The intent was to replicate the JMF as much as possible while maintaining a gap gradation.
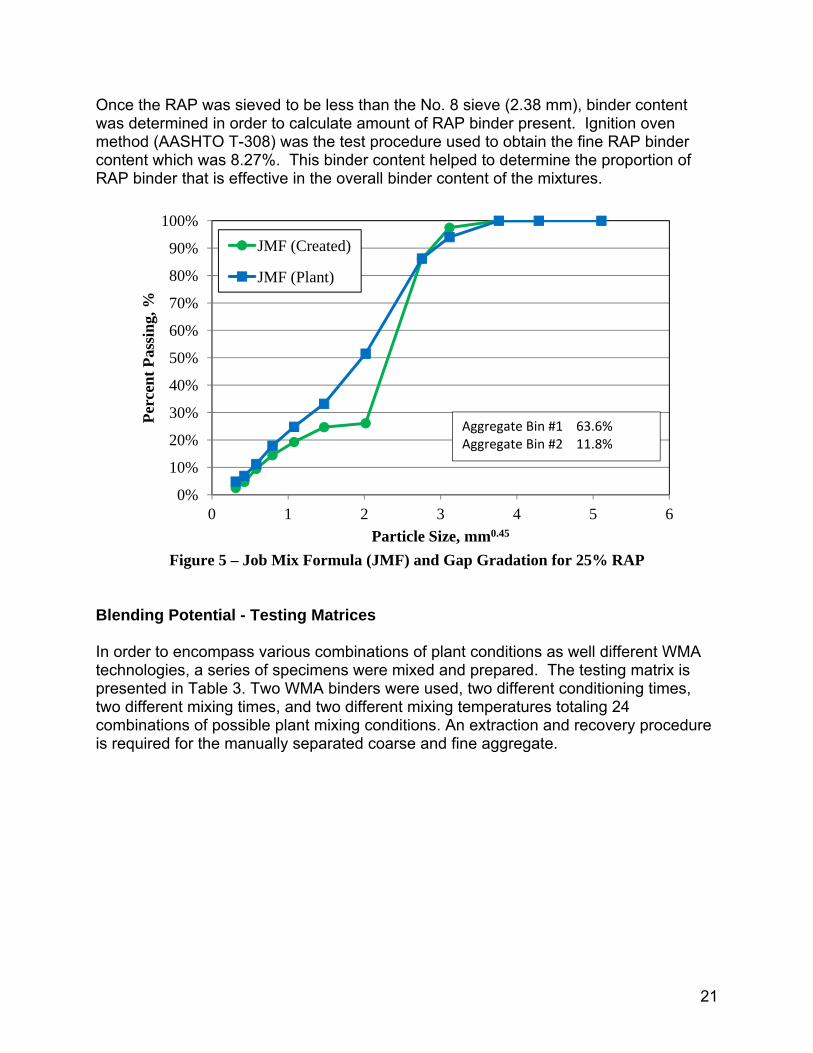
21
Once the RAP was sieved to be less than the No. 8 sieve (2.38 mm), binder content was determined in order to calculate amount of RAP binder present. Ignition oven method (AASHTO T-308) was the test procedure used to obtain the fine RAP binder content which was 8.27%. This binder content helped to determine the proportion of RAP binder that is effective in the overall binder content of the mixtures.
Figure 5 – Job Mix Formula (JMF) and Gap Gradation for 25% RAP
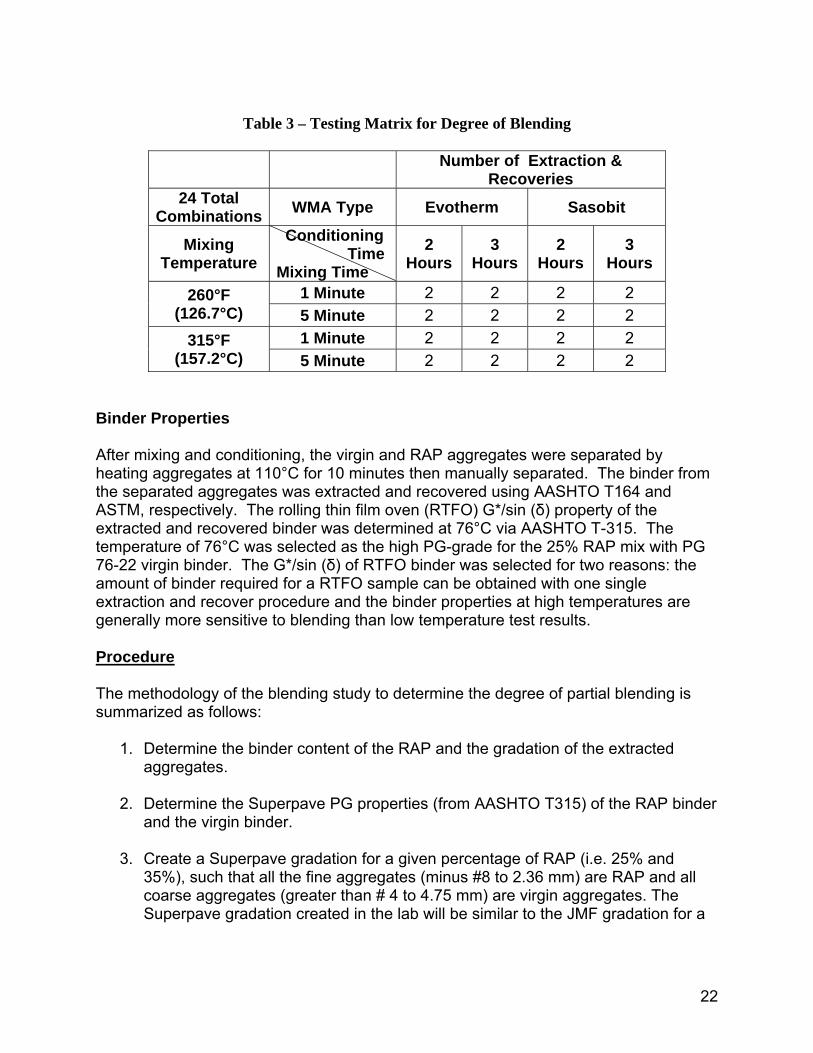
Blending Potential - Testing Matrices In order to encompass various combinations of plant conditions as well different WMA technologies, a series of specimens were mixed and prepared. The testing matrix is presented in Table 3. Two WMA binders were used, two different conditioning times, two different mixing times, and two different mixing temperatures totaling 24 combinations of possible plant mixing conditions. An extraction and recovery procedure is required for the manually separated coarse and fine aggregate.
0%
10%
20%
30%
40%
50%
60%
70%
80%
90%
100%
0 1 2 3 4 5 6
Perc
ent P
assi
ng, %
Particle Size, mm0.45
JMF (Created)
JMF (Plant)
Aggregate Bin #1 63.6%Aggregate Bin #2 11.8%
22
Table 3 – Testing Matrix for Degree of Blending
Number of Extraction &
Recoveries 24 Total
Combinations WMA Type Evotherm Sasobit
Mixing Temperature
Conditioning Time Mixing Time
2 Hours
3 Hours
2 Hours
3 Hours
260°F (126.7°C)
1 Minute 2 2 2 2 5 Minute 2 2 2 2
315°F (157.2°C)
1 Minute 2 2 2 2 5 Minute 2 2 2 2
Binder Properties After mixing and conditioning, the virgin and RAP aggregates were separated by heating aggregates at 110°C for 10 minutes then manually separated. The binder from the separated aggregates was extracted and recovered using AASHTO T164 and ASTM, respectively. The rolling thin film oven (RTFO) G*/sin (δ) property of the extracted and recovered binder was determined at 76°C via AASHTO T-315. The temperature of 76°C was selected as the high PG-grade for the 25% RAP mix with PG 76-22 virgin binder. The G*/sin (δ) of RTFO binder was selected for two reasons: the amount of binder required for a RTFO sample can be obtained with one single extraction and recover procedure and the binder properties at high temperatures are generally more sensitive to blending than low temperature test results. Procedure The methodology of the blending study to determine the degree of partial blending is summarized as follows:
1. Determine the binder content of the RAP and the gradation of the extracted aggregates.
2. Determine the Superpave PG properties (from AASHTO T315) of the RAP binder
and the virgin binder.
3. Create a Superpave gradation for a given percentage of RAP (i.e. 25% and 35%), such that all the fine aggregates (minus #8 to 2.36 mm) are RAP and all coarse aggregates (greater than # 4 to 4.75 mm) are virgin aggregates. The Superpave gradation created in the lab will be similar to the JMF gradation for a
23
given percentage of RAP. This gap gradation was created in order for the manual separation of virgin and RAP aggregates to be possible.
4. Consider design binder content from the JMF for the study. If the design binder
content is not known, determine the design binder content (DBC) based on the Superpave mixture design.
5. Assume an initial degree of blending in the range of 0% to 100%.
6. Create the mixture at the virgin binder content (VBC) determined from Equation 2
below:
Binder Content (virgin) = JMF Binder Content (Design) –RAP(Estimated Working Binder) (2)
7. Separate the coated virgin and RAP aggregates after mixing by slight heating at 110°C and manually separating into above #4 and below #8 sieves.
8. Extract and recover the binder separately from the coarse virgin aggregates (plus
#4) and fine RAP aggregates (minus #8).
9. Determine the Superpave PG properties (from AASHTO T315) of the blended binder on the RAP and the virgin aggregates.
10. Determine the proportion of the virgin binder that would coat the RAP and the
virgin aggregates under zero blending condition by estimating the surface area of the aggregates at each sieve size using Bailey’s method.
11. Blend the RAP binder with the proportion of the virgin binder determined from
step 10 above. Determine the Superpave PG properties (from AASHTO T315), such as G* / sin (δ).
12. Calculate the degree of partial blending from Equation 3:
% 100|1 | (3) Where:
(G*/sin(δ))blend binder virgin aggregate
- RTFO G*/sin (δ) of blended binder coating the virgin aggregates (determined from step 8)
(G*/sin(δ))blend binder - RTFO G*/sin (δ) of blended
24
RAP aggregate binder coating the RAP (determined from step 8)
(G*/sin(δ)) virgin binder - RTFO G*/sin (δ) of the virgin binder (determined from step 2)
(G*/sin(δ))RAP virgin binder 0 blend
- RTFO G*/sin (δ) of the RAP and virgin binder that is coating the RAP aggregate assuming 0% blending (determined from step 10)
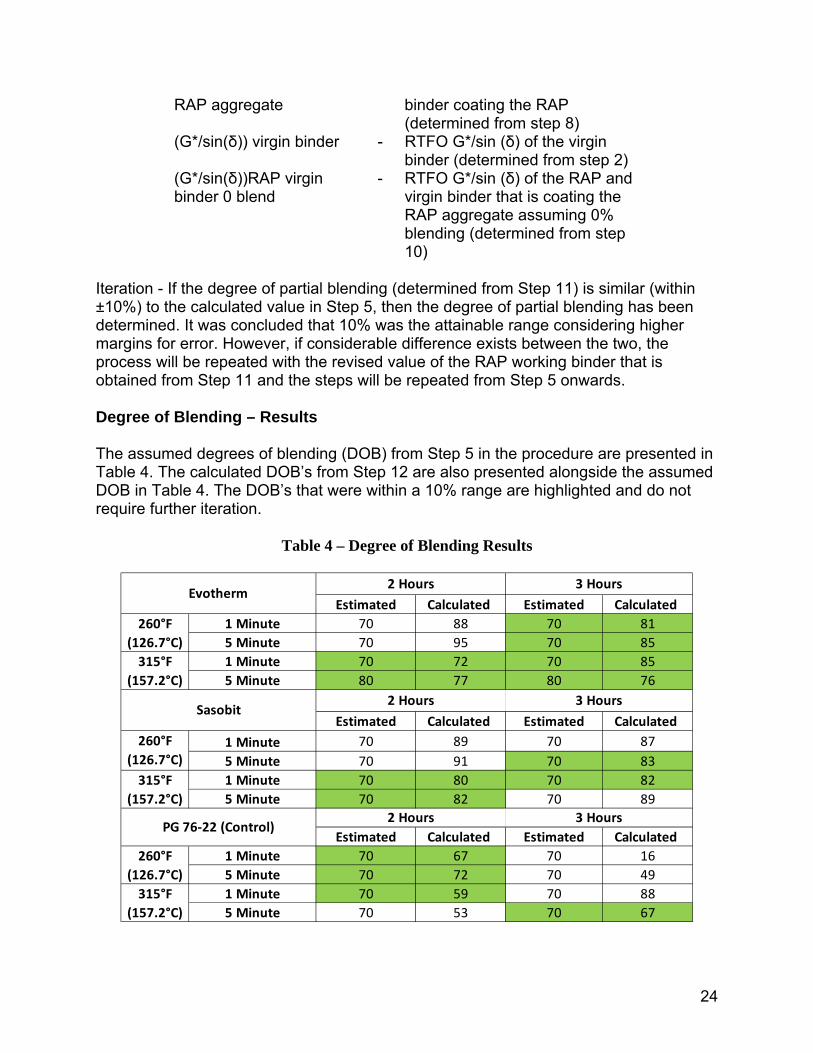
Iteration - If the degree of partial blending (determined from Step 11) is similar (within ±10%) to the calculated value in Step 5, then the degree of partial blending has been determined. It was concluded that 10% was the attainable range considering higher margins for error. However, if considerable difference exists between the two, the process will be repeated with the revised value of the RAP working binder that is obtained from Step 11 and the steps will be repeated from Step 5 onwards. Degree of Blending – Results The assumed degrees of blending (DOB) from Step 5 in the procedure are presented in Table 4. The calculated DOB’s from Step 12 are also presented alongside the assumed DOB in Table 4. The DOB’s that were within a 10% range are highlighted and do not require further iteration.
Table 4 – Degree of Blending Results
Estimated Calculated Estimated Calculated 1 Minute 70 88 70 815 Minute 70 95 70 851 Minute 70 72 70 855 Minute 80 77 80 76
Estimated Calculated Estimated Calculated
1 Minute 70 89 70 875 Minute 70 91 70 831 Minute 70 80 70 825 Minute 70 82 70 89
Estimated Calculated Estimated Calculated 1 Minute 70 67 70 165 Minute 70 72 70 491 Minute 70 59 70 885 Minute 70 53 70 67
260°F (126.7°C)
260°F (126.7°C)315°F
(157.2°C)
Evotherm2 Hours 3 Hours
Sasobit2 Hours 3 Hours
PG 76‐22 (Control)2 Hours 3 Hours
260°F (126.7°C)315°F
(157.2°C)
315°F (157.2°C)
25
Although further iteration is necessary, DOB’s of different warm mix additives are similar when comparing their respective temperature, mixing time, and conditioning time combinations. No trend was observed when comparing 2 and 3 hour conditioning time. No trend is observed when comparing WMA and HMA mixing temperatures either. The 1 and 5 minute mixing times exhibited an increase in DOB in most of the combinations. It should be noted that the degree of blending generated in this study is based on laboratory conditions, as well as the specific gradation, asphalt binder, and laboratory procedures used. It would be very difficult to simulate this methodology from plant produced asphalt mixtures, which would have a significantly larger level of variables. Therefore, this exercise identifies that at reduced mixing temperatures, there is some level of blending that occurs between the RAP and virgin asphalt binders.
26
TASK 3 – MOISTURE SENSIVITY OF HMA AND WMA MIXTURE Researchers have identified two primary modes of moisture damage: 1) Adhesive and 2) Cohesive failure (Taylor and Kholsa, 1983; Kiggundu and Roberts, 1988; Terrel and Al-Swailmi, 1994; Little and Jones, 2003). An adhesive failure occurs when the asphalt binder separates itself from the aggregate matrix, typically in the presence of water. Cohesive failures occur due to a weakening within the asphalt binder film coating the aggregate due to moisture effects. Within these two types of failures, five (5) primary mechanisms can lead to moisture damage and could be related specifically to WMA production. 1. Spontaneous Emulsification – when water gets suspended within the asphalt binder
and coats the aggregate. This mechanism results in cohesive failure of the mixture. a. WMA – although not cited in the literature initially reviewed by the
Research Team, it can be hypothesized that this mechanism is possible during the WMA foaming technologies, where water/moisture is utilized to foam the asphalt binder.
2. Detachment – when excessive moisture in the aggregate is not removed and can later migrate from within the aggregate to the aggregate/asphalt interface eventually detaching the asphalt film.
a. WMA – lower production temperatures may not thoroughly dry aggregates, resulting in residual moisture in the WMA aggregate
3. Displacement – when moisture is absorbed into the aggregate through a break/opening in the asphalt film coating the aggregate. The moisture begins to displace the asphalt film resulting in stripping of the asphalt film off of the aggregate surface. This mechanism can be accelerated as a result of aggregate fracturing, in-service traffic loading, and freeze-thaw action.
a. WMA – lower production temperatures that generate poor mixing conditions or WMA foaming technologies that significantly reduce the asphalt binder viscosity may not provide adequate and thicker asphalt films on the aggregate surface. Lack of coating or thinner films would accelerate the displacement mechanism.
4. Pore Pressure Mechanism – when densification of the asphalt mixture occurs under traffic and causes the interconnected voids to become isolated, trapping residual moisture within the voids of the compacted asphalt mat. Traffic loading creates pore pressures in the voids that can initiate the stripping of the asphalt film from the aggregate.
a. WMA – due to the reduction in oxidative aging, asphalt binders may be initially softer and more prone to densification immediately after construction. Moisture introduced during this time, and even during construction, may eventually undergo the pore pressure mechanism.
5. Hydraulic Scour – when the application of traffic generates a compression-tension cycle of water pressure on the pavement surface eventually leading to displacement or spontaneous emulsification.
a. WMA – all WMA materials placed as a surface course in a pavement structure is susceptible to this mechanism. And with generally softer
27
asphalt binders, cohesion between the asphalt binder and aggregate may deteriorate under the hydraulic scour phenomena.
Two additional mechanisms, pH Instability between the aggregate and asphalt binder (Yoon, 1987) and Environmental Effects on the Aggregate-Asphalt System (Terrel and Al-Swailmi, 1994) have also been identified as means of initiating moisture damage. However, both mechanisms can be equally applied to both hot mix asphalt and warm mix asphalt. Unlike the other five mechanisms noted above that could be more prevalent in WMA due to its method of production. The five mechanisms of moisture damage, cited in the literature and summarized above, can all be associated with the production and placement of WMA. It is logical to assume that moisture damage will not be solely due to a single mechanism, but a combination of mechanisms occurring within the same general timeframe. In general though, as noted, water must be present either within the aggregate and/or within the pavement for moisture damage to occur. Unfortunately, the production of WMA may lead to the insufficient drying of the aggregate, softening of the asphalt binder, accelerated densification, poor asphalt film coating and entrapped water suspended in the asphalt binder which have all been shown to promote moisture damage. In a previous NJDOT study, Bennert (2012) showed that aggregates retaining residual moisture may be prone to moisture sensitivity issues when evaluated under AASHTO T283, Resistance of Compacted Hot Mix Asphalt (HMA) to Moisture-Induced Damage. Table 5 show the results of TSR test results for laboratory produced asphalt mixtures using two different aggregates sources (low and intermediate absorption levels) and different initial aggregate blend moisture contents. As the results indicate, the TSR value decreases as the mixing temperature decreases and the initial moisture content increases. This scenario is clearly something that could take place during the production of warm mix asphalt.
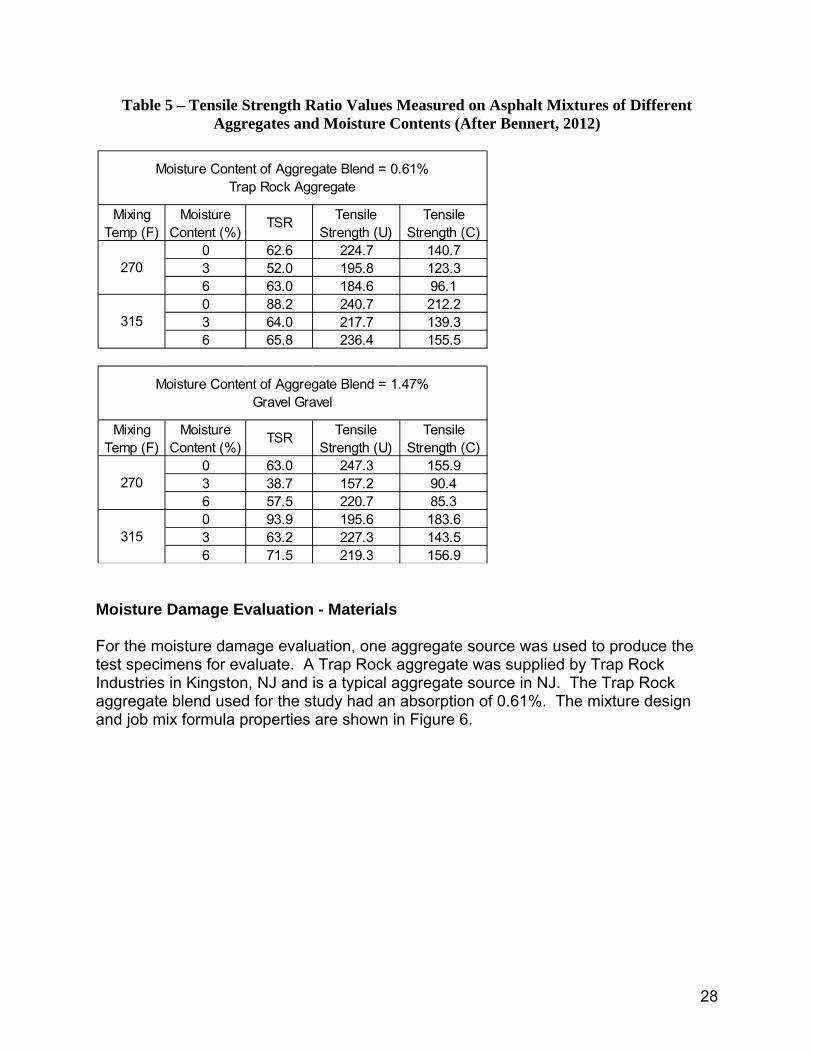
28
Table 5 – Tensile Strength Ratio Values Measured on Asphalt Mixtures of Different Aggregates and Moisture Contents (After Bennert, 2012)
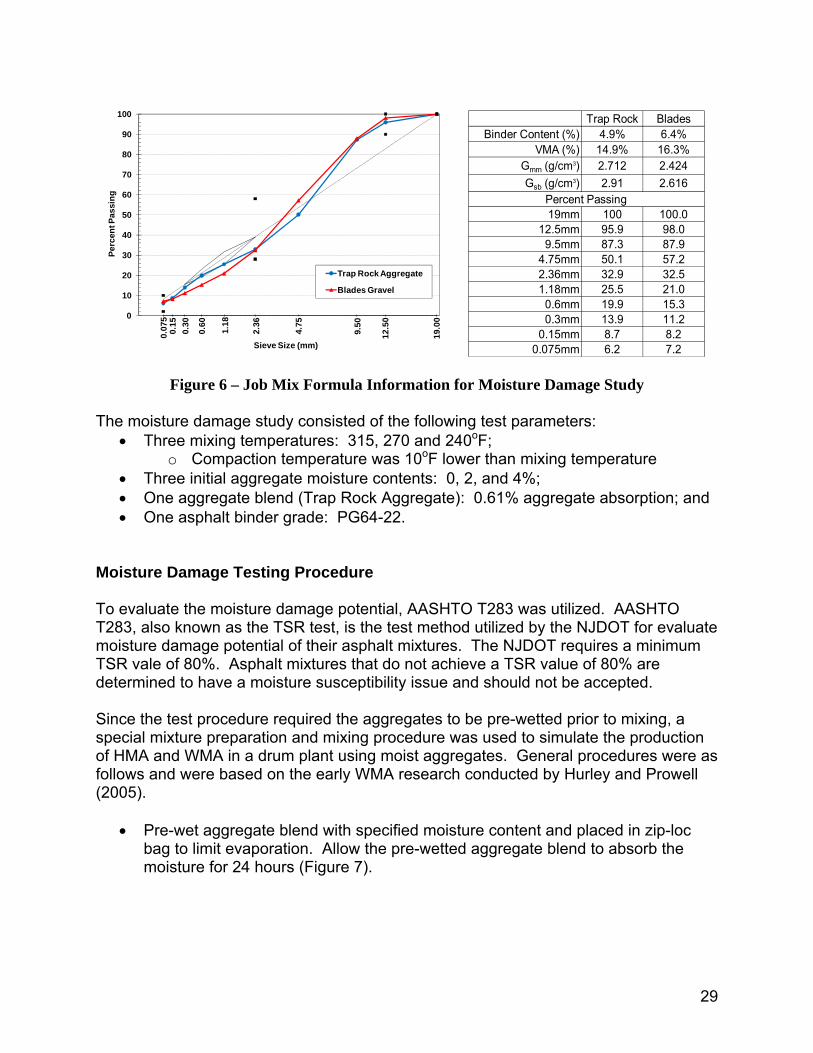
Moisture Damage Evaluation - Materials For the moisture damage evaluation, one aggregate source was used to produce the test specimens for evaluate. A Trap Rock aggregate was supplied by Trap Rock Industries in Kingston, NJ and is a typical aggregate source in NJ. The Trap Rock aggregate blend used for the study had an absorption of 0.61%. The mixture design and job mix formula properties are shown in Figure 6.
0 62.6 224.7 140.73 52.0 195.8 123.36 63.0 184.6 96.10 88.2 240.7 212.23 64.0 217.7 139.36 65.8 236.4 155.5
0 63.0 247.3 155.93 38.7 157.2 90.46 57.5 220.7 85.30 93.9 195.6 183.63 63.2 227.3 143.56 71.5 219.3 156.9
270
315
Moisture Content of Aggregate Blend = 1.47% Gravel Gravel
Mixing Temp (F)
Moisture Content (%)
TSR Tensile Strength (U)
Tensile Strength (C)
315
270
Moisture Content of Aggregate Blend = 0.61% Trap Rock Aggregate
Tensile Strength (C)
Mixing Temp (F)
Moisture Content (%)
Tensile Strength (U)
TSR
29
Figure 6 – Job Mix Formula Information for Moisture Damage Study
The moisture damage study consisted of the following test parameters: • Three mixing temperatures: 315, 270 and 240oF;
o Compaction temperature was 10oF lower than mixing temperature • Three initial aggregate moisture contents: 0, 2, and 4%; • One aggregate blend (Trap Rock Aggregate): 0.61% aggregate absorption; and • One asphalt binder grade: PG64-22.
Moisture Damage Testing Procedure To evaluate the moisture damage potential, AASHTO T283 was utilized. AASHTO T283, also known as the TSR test, is the test method utilized by the NJDOT for evaluate moisture damage potential of their asphalt mixtures. The NJDOT requires a minimum TSR vale of 80%. Asphalt mixtures that do not achieve a TSR value of 80% are determined to have a moisture susceptibility issue and should not be accepted. Since the test procedure required the aggregates to be pre-wetted prior to mixing, a special mixture preparation and mixing procedure was used to simulate the production of HMA and WMA in a drum plant using moist aggregates. General procedures were as follows and were based on the early WMA research conducted by Hurley and Prowell (2005).
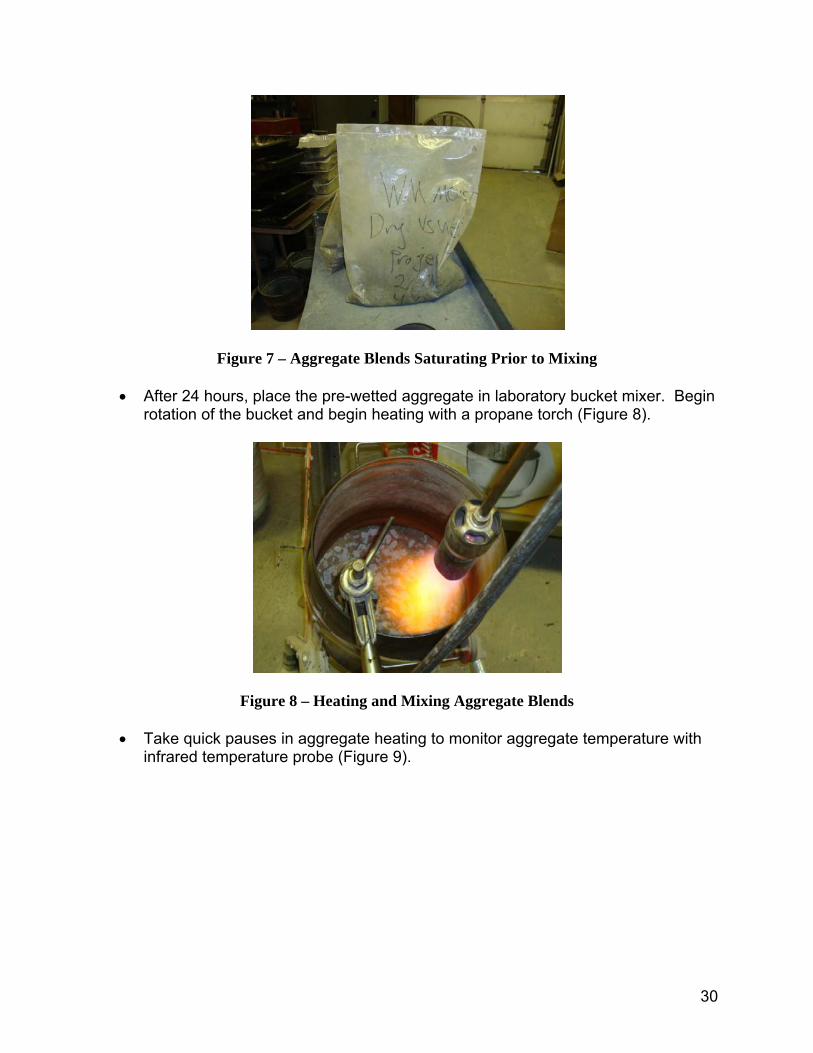
• Pre-wet aggregate blend with specified moisture content and placed in zip-loc bag to limit evaporation. Allow the pre-wetted aggregate blend to absorb the moisture for 24 hours (Figure 7).
19.0
0
12.5
0
9.50
4.75
2.36
1.18
0.60
0.30
0.15
0.07
50
10
20
30
40
50
60
70
80
90
100Pe
rcen
t Pas
sing
Sieve Size (mm)
Trap Rock Aggregate
Blades Gravel
Trap Rock BladesBinder Content (%) 4.9% 6.4%
VMA (%) 14.9% 16.3%Gmm (g/cm3) 2.712 2.424Gsb (g/cm3) 2.91 2.616
19mm 100 100.012.5mm 95.9 98.0
9.5mm 87.3 87.94.75mm 50.1 57.22.36mm 32.9 32.51.18mm 25.5 21.0
0.6mm 19.9 15.30.3mm 13.9 11.2
0.15mm 8.7 8.20.075mm 6.2 7.2
Percent Passing
30
Figure 7 – Aggregate Blends Saturating Prior to Mixing
• After 24 hours, place the pre-wetted aggregate in laboratory bucket mixer. Begin rotation of the bucket and begin heating with a propane torch (Figure 8).
Figure 8 – Heating and Mixing Aggregate Blends
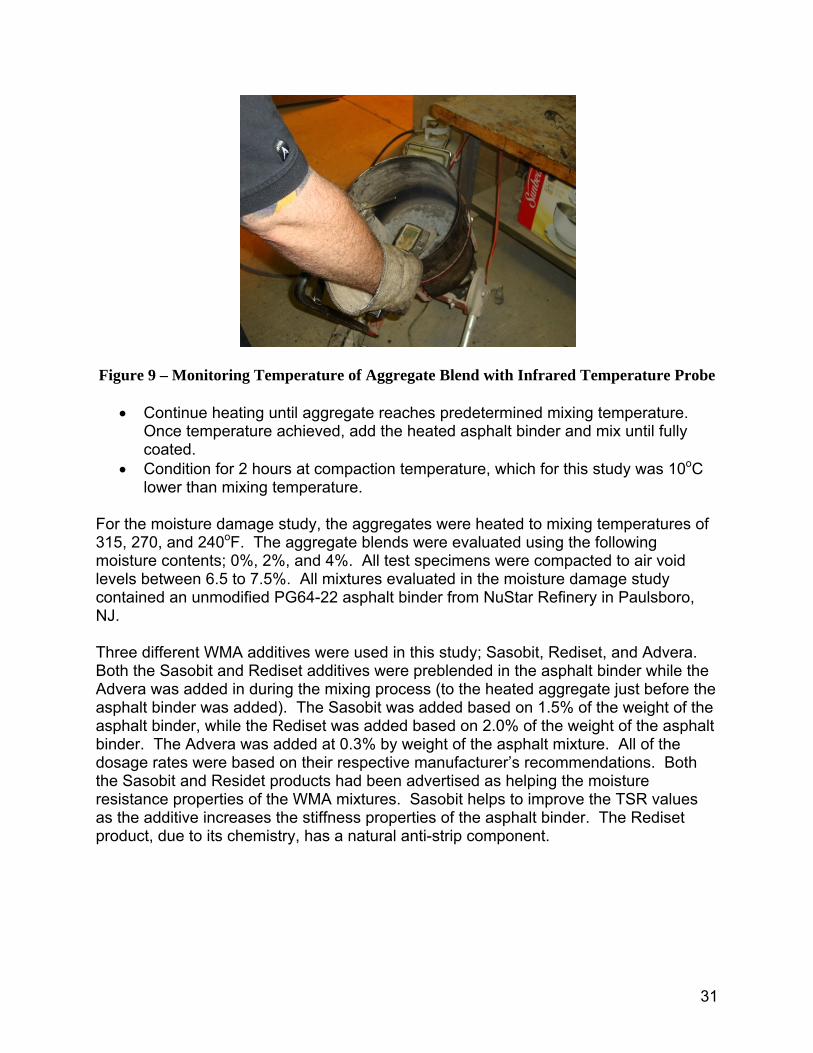
• Take quick pauses in aggregate heating to monitor aggregate temperature with infrared temperature probe (Figure 9).
31
Figure 9 – Monitoring Temperature of Aggregate Blend with Infrared Temperature Probe
• Continue heating until aggregate reaches predetermined mixing temperature. Once temperature achieved, add the heated asphalt binder and mix until fully coated.
• Condition for 2 hours at compaction temperature, which for this study was 10oC lower than mixing temperature.
For the moisture damage study, the aggregates were heated to mixing temperatures of 315, 270, and 240oF. The aggregate blends were evaluated using the following moisture contents; 0%, 2%, and 4%. All test specimens were compacted to air void levels between 6.5 to 7.5%. All mixtures evaluated in the moisture damage study contained an unmodified PG64-22 asphalt binder from NuStar Refinery in Paulsboro, NJ. Three different WMA additives were used in this study; Sasobit, Rediset, and Advera. Both the Sasobit and Rediset additives were preblended in the asphalt binder while the Advera was added in during the mixing process (to the heated aggregate just before the asphalt binder was added). The Sasobit was added based on 1.5% of the weight of the asphalt binder, while the Rediset was added based on 2.0% of the weight of the asphalt binder. The Advera was added at 0.3% by weight of the asphalt mixture. All of the dosage rates were based on their respective manufacturer’s recommendations. Both the Sasobit and Residet products had been advertised as helping the moisture resistance properties of the WMA mixtures. Sasobit helps to improve the TSR values as the additive increases the stiffness properties of the asphalt binder. The Rediset product, due to its chemistry, has a natural anti-strip component.
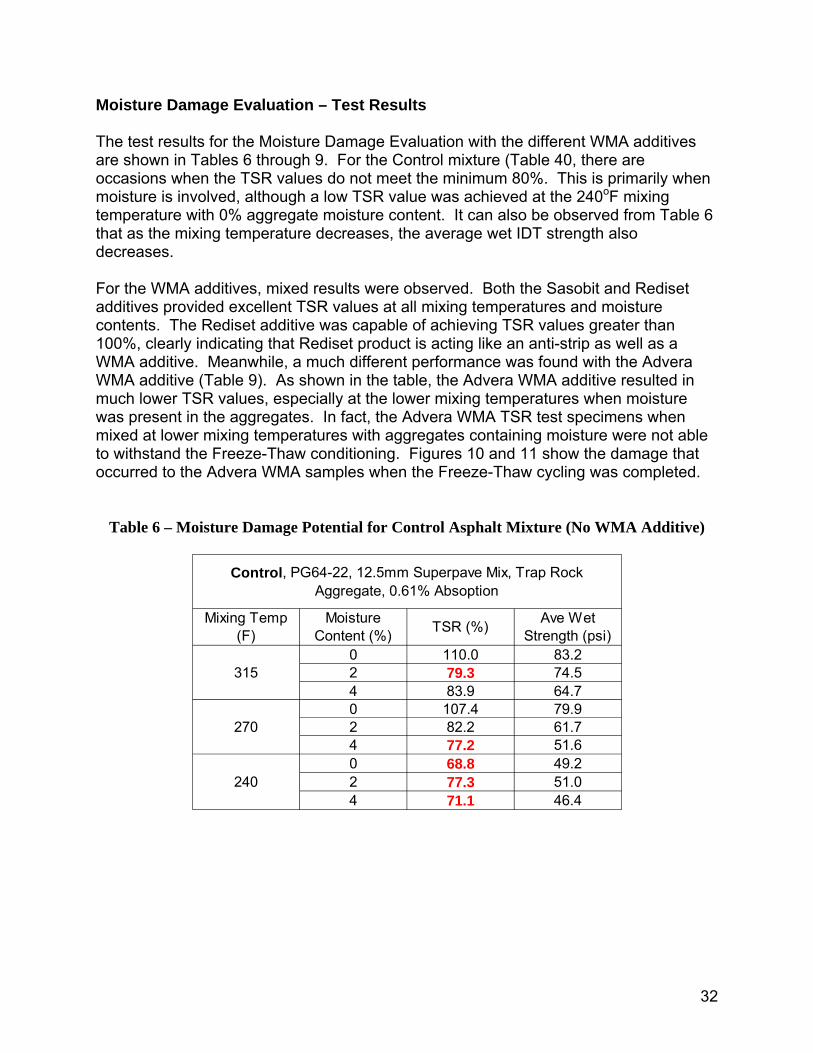
32
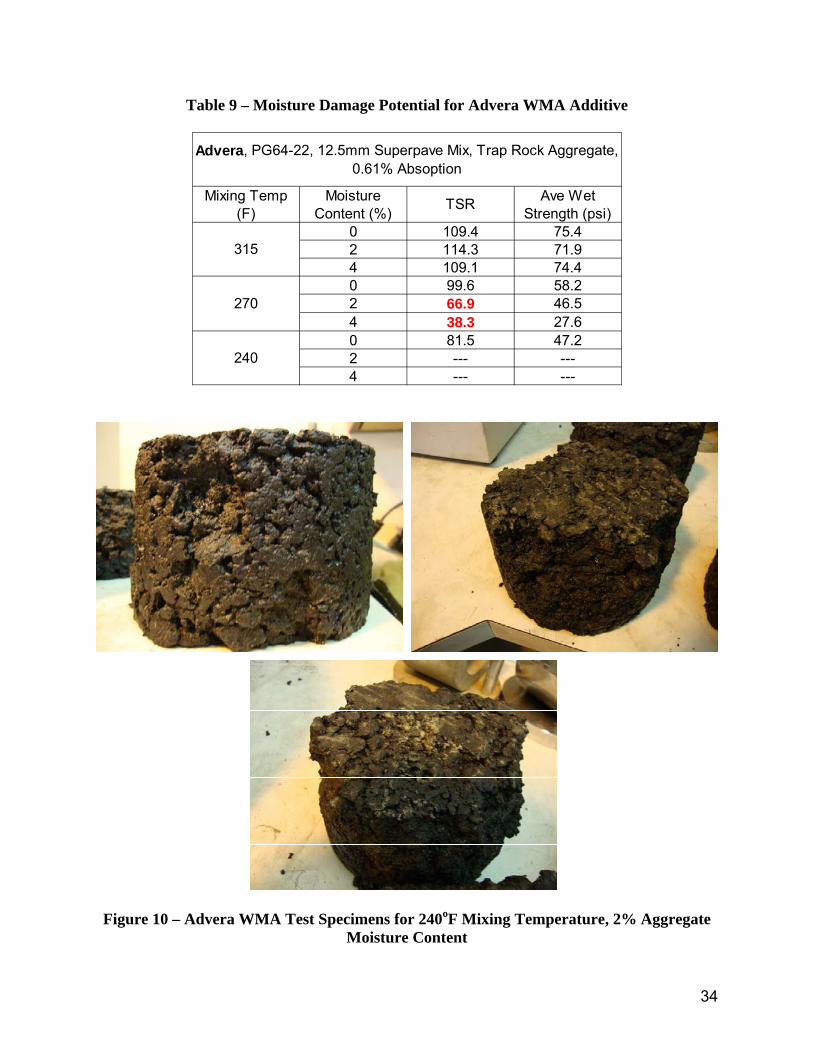
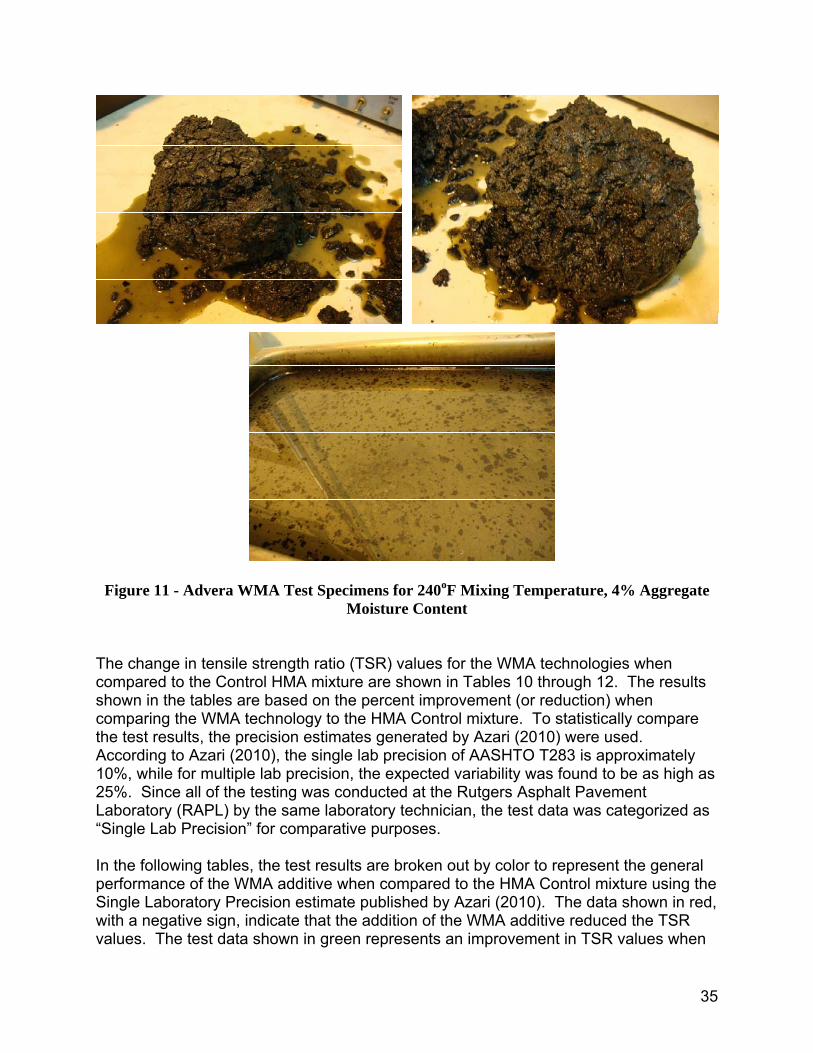
Moisture Damage Evaluation – Test Results The test results for the Moisture Damage Evaluation with the different WMA additives are shown in Tables 6 through 9. For the Control mixture (Table 40, there are occasions when the TSR values do not meet the minimum 80%. This is primarily when moisture is involved, although a low TSR value was achieved at the 240oF mixing temperature with 0% aggregate moisture content. It can also be observed from Table 6 that as the mixing temperature decreases, the average wet IDT strength also decreases. For the WMA additives, mixed results were observed. Both the Sasobit and Rediset additives provided excellent TSR values at all mixing temperatures and moisture contents. The Rediset additive was capable of achieving TSR values greater than 100%, clearly indicating that Rediset product is acting like an anti-strip as well as a WMA additive. Meanwhile, a much different performance was found with the Advera WMA additive (Table 9). As shown in the table, the Advera WMA additive resulted in much lower TSR values, especially at the lower mixing temperatures when moisture was present in the aggregates. In fact, the Advera WMA TSR test specimens when mixed at lower mixing temperatures with aggregates containing moisture were not able to withstand the Freeze-Thaw conditioning. Figures 10 and 11 show the damage that occurred to the Advera WMA samples when the Freeze-Thaw cycling was completed.
Table 6 – Moisture Damage Potential for Control Asphalt Mixture (No WMA Additive)
0 110.0 83.22 79.3 74.54 83.9 64.70 107.4 79.92 82.2 61.74 77.2 51.60 68.8 49.22 77.3 51.04 71.1 46.4
240
315
270
Control, PG64-22, 12.5mm Superpave Mix, Trap Rock Aggregate, 0.61% Absoption
Mixing Temp (F)
Moisture Content (%) TSR (%) Ave Wet
Strength (psi)
33
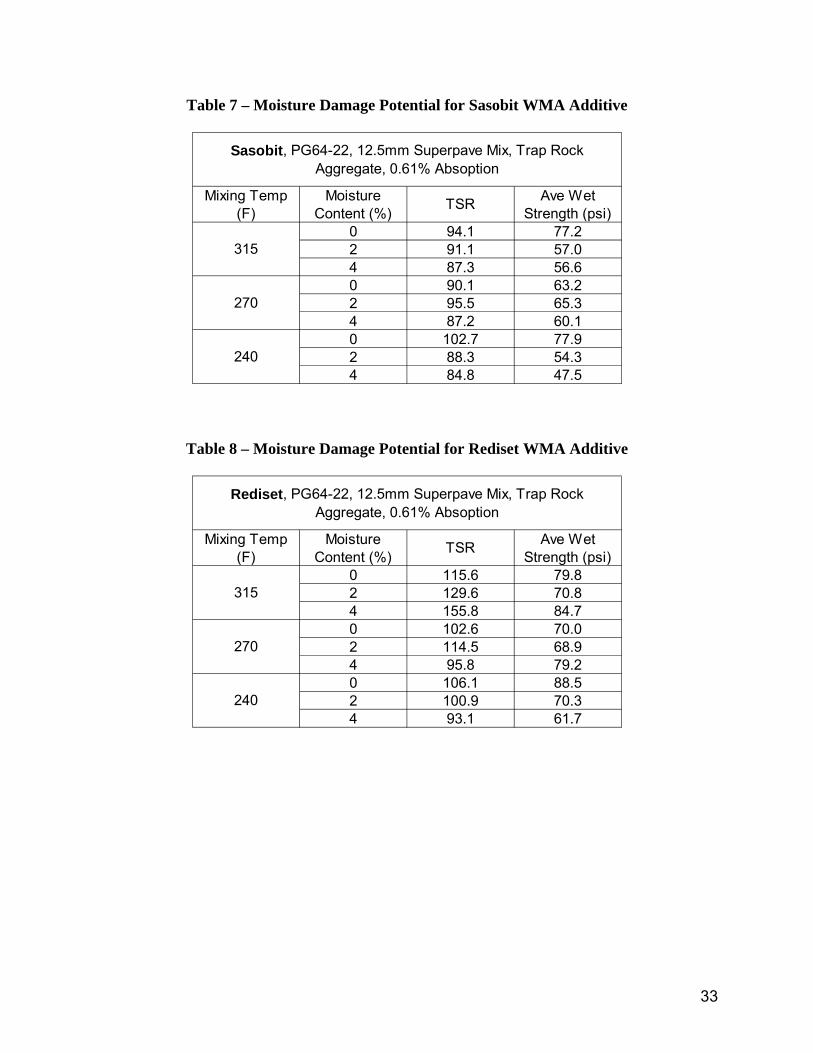
Table 7 – Moisture Damage Potential for Sasobit WMA Additive
Table 8 – Moisture Damage Potential for Rediset WMA Additive
0 94.1 77.22 91.1 57.04 87.3 56.60 90.1 63.22 95.5 65.34 87.2 60.10 102.7 77.92 88.3 54.34 84.8 47.5
240
Sasobit, PG64-22, 12.5mm Superpave Mix, Trap Rock Aggregate, 0.61% Absoption
Mixing Temp (F)
Moisture Content (%) TSR
315
270
Ave Wet Strength (psi)
0 115.6 79.82 129.6 70.84 155.8 84.70 102.6 70.02 114.5 68.94 95.8 79.20 106.1 88.52 100.9 70.34 93.1 61.7
315
270
240
Rediset, PG64-22, 12.5mm Superpave Mix, Trap Rock Aggregate, 0.61% Absoption
Mixing Temp (F)
Moisture Content (%) TSR Ave Wet
Strength (psi)
34
Table 9 – Moisture Damage Potential for Advera WMA Additive
Figure 10 – Advera WMA Test Specimens for 240oF Mixing Temperature, 2% Aggregate
Moisture Content
0 109.4 75.42 114.3 71.94 109.1 74.40 99.6 58.22 66.9 46.54 38.3 27.60 81.5 47.22 --- ---4 --- ---
315
270
240
Advera, PG64-22, 12.5mm Superpave Mix, Trap Rock Aggregate, 0.61% Absoption
Mixing Temp (F)
Moisture Content (%) TSR Ave Wet
Strength (psi)
35
Figure 11 - Advera WMA Test Specimens for 240oF Mixing Temperature, 4% Aggregate Moisture Content
The change in tensile strength ratio (TSR) values for the WMA technologies when compared to the Control HMA mixture are shown in Tables 10 through 12. The results shown in the tables are based on the percent improvement (or reduction) when comparing the WMA technology to the HMA Control mixture. To statistically compare the test results, the precision estimates generated by Azari (2010) were used. According to Azari (2010), the single lab precision of AASHTO T283 is approximately 10%, while for multiple lab precision, the expected variability was found to be as high as 25%. Since all of the testing was conducted at the Rutgers Asphalt Pavement Laboratory (RAPL) by the same laboratory technician, the test data was categorized as “Single Lab Precision” for comparative purposes. In the following tables, the test results are broken out by color to represent the general performance of the WMA additive when compared to the HMA Control mixture using the Single Laboratory Precision estimate published by Azari (2010). The data shown in red, with a negative sign, indicate that the addition of the WMA additive reduced the TSR values. The test data shown in green represents an improvement in TSR values when
36
comparing the WMA additive to the HMA Control. Meanwhile, the test results shown in black indicates that there is no statistical difference between the WMA additive and HMA Control mixtures.
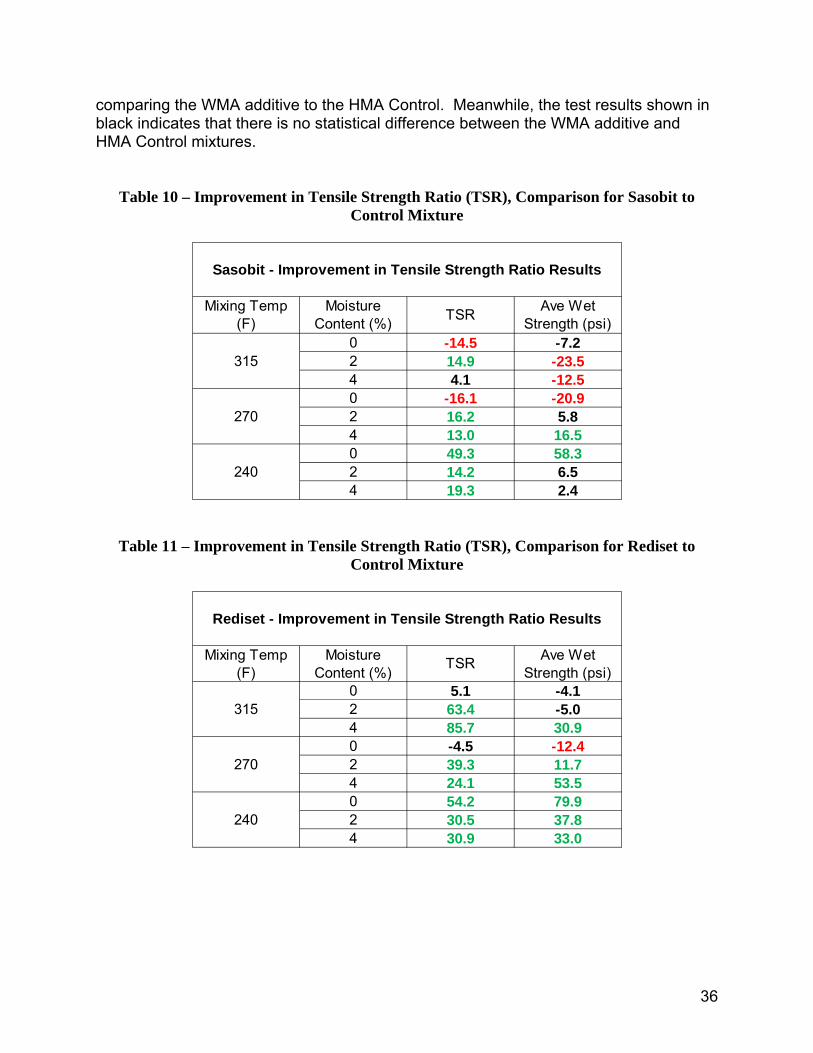
Table 10 – Improvement in Tensile Strength Ratio (TSR), Comparison for Sasobit to Control Mixture
Table 11 – Improvement in Tensile Strength Ratio (TSR), Comparison for Rediset to Control Mixture
0 -14.5 -7.22 14.9 -23.54 4.1 -12.50 -16.1 -20.92 16.2 5.84 13.0 16.50 49.3 58.32 14.2 6.54 19.3 2.4
TSR Ave Wet Strength (psi)
315
270
240
Sasobit - Improvement in Tensile Strength Ratio Results
Mixing Temp (F)
Moisture Content (%)
0 5.1 -4.12 63.4 -5.04 85.7 30.90 -4.5 -12.42 39.3 11.74 24.1 53.50 54.2 79.92 30.5 37.84 30.9 33.0
315
270
240
Rediset - Improvement in Tensile Strength Ratio Results
Mixing Temp (F)
Moisture Content (%) TSR Ave Wet
Strength (psi)

37
Table 12 – Improvement in Tensile Strength Ratio (TSR), Comparison for Advera to Control Mixture
The test results for the Sasobit and Rediset WMA technologies show that the mixtures generally show a slight reduction in TSR and wet tensile strength at the higher mixing temperature. However, as the mixing temperature decreases, the TSR test results for the Sasobit and Rediset additives show an improvement over the Control mixtures. The Rediset additive provided the greatest improvement in both TSR and wet tensile strengths when compared to the HMA Control mixture. Meanwhile, the Advera additive showed to have a detrimental effect on the TSR values when compared to the HMA Control mixture (Table 12). Also, as noted and shown earlier, most of the test specimens at the 240oF mixing temperature with moist aggregates did not survive the freeze-thaw cycling without breaking apart. Moisture Damage Evaluation – Discussion of Results The modified warm mix asphalt (WMA) mixing procedure utilized during the moisture damage evaluation task resulted in some interesting findings regarding the moisture damage potential of asphalt mixtures with different WMA technologies produced at different mixing temperatures with aggregates having varying initial moisture contents. Both the Sasobit and Rediset additives show value in improving the tensile strength ratio properties of the WMA mixtures, especially at lower mixing temperatures. Meanwhile, the Advera additive resulted in a decrease in tensile strength performance and were unable to survive the freeze-thaw cycle during AASHTO T283. It is hypothesized that the Advera product had issues at the lower mixing temperatures due to the inability to release all of the internal moisture in the Advera powder. With moisture still trapped in the powder, the freeze-thaw conditioning caused expansion/contraction in the mixture, which resulted in physical damage of the test specimens.
0 -0.5 -9.42 44.1 -3.54 30.0 15.00 -7.3 -27.22 -18.6 -24.64 -50.4 -46.50 18.5 -4.12 --- ---4 --- ---
315
270
240
Advera - Improvement in Tensile Strength Ratio Results
Mixing Temp (F)
Moisture Content (%) TSR Ave Wet
Strength (psi)
38
TASK 4 – EVALUATION OF MIX DESIGN MODIFICATIONS FOR WARM MIX ASPHALT For most warm mix asphalt (WMA) projects constructed in the United States, the use of WMA has been done based on simply substituting the WMA for the HMA mixture without a mixture design change. In NCHRP Project 9-43, Mix Design Practices for Warm Mix Asphalt, the objective of the study was to develop a mix design procedure that could be utilized by mix designers and suppliers. The findings of the study was proposed to be added as an appendix to AASHTO R35, Standard Practice for Superpave Volumetric Design for Hot-Mix Asphalt (HMA). The findings of NCHRP Project 9-43, which are summarized in NCHRP Report 691: Mix Design Practices for Warm Mix Asphalt (Bonaquist, 2011) were;
1. Compactability of WMA in the gyratory compactor was sensitive to WMA process and temperature, particularly for asphalt mixtures containing RAP, when compared to HMA mixtures.
2. Moisture sensitivity of WMA mixtures, as determined using AASHTO T283, will likely be lower for WMA mixtures than HMA mixtures unless the WMA process includes an anti-strip. This was observed earlier during the Task 3 of this study.
3. Very low WMA temperatures may lead to mixtures with inadequate rutting resistance.
The WMA mix design recommendations in the R35 Appendix are intended to be process specific; meaning that the mix design procedure should be conducted in manner that replicates the field production. Asphalt binder and aggregates should be heated to temperatures expected in the field, although it should be noted that the temperature of the asphalt binder should be maintained at temperatures that still allow the asphalt binder to be pumped adequately through the asphalt plant’s system. When RAP is being used during the mixture design, it should be heated only up to 2 hours so as not to alter the properties of the RAP binder. The potential issue of conducting a WMA specific mixture design for New Jersey asphalt mixtures is that during NCHRP Project 9-43, the WMA mixtures were found to be able to achieve lower air voids (better compactability) during asphalt content determination in the gyratory compactor. If this is indeed the case, lower asphalt contents can be achieved. Currently, asphalt mixtures in New Jersey have a tendency to be low on asphalt content, so to promote a procedure that encourages lowering the optimum asphalt content would not be welcomed by the NJDOT. Therefore, an evaluation of the AASHTO R35 recommendations for WMA mix design using New Jersey materials.
39
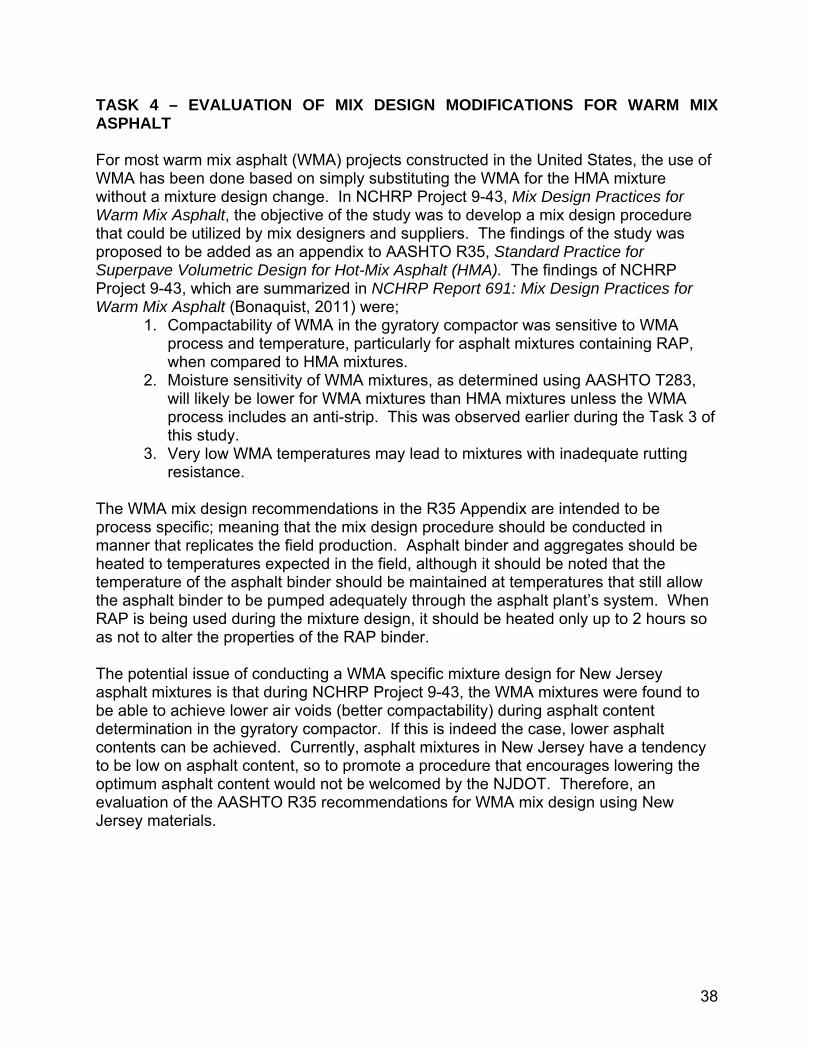
WMA Mix Design – Materials and Mixing Process A NJDOT approved mix design from Trap Rock Industries was chosen for this task of the research study. The asphalt mixture, 12.5M76, is a typical asphalt mixture designation used in New Jersey for surface courses. The aggregate blend gradation for the mixture is found in Figure. The optimum asphalt content of the asphalt mixture was noted to be 4.9%. The asphalt binder used in the mixtures was a SBS polymer-modified asphalt binder from NuStar Asphalt in Paulsboro, NJ. The asphalt content of the RAP was determined to be 4.8%.
Figure 12 – Aggregate Blend for 12.5M76, 0% and 25% RAP, Mixture
The mix design procedure recommended by NCHRP Project 9-43 was followed in preparing and mixing the asphalt mixtures. In particular, the following procedure was followed:
1. Virgin aggregates were heated overnight at 15oC higher than the specified mixing temperature.
2. RAP materials were dried under a fan for a minimum of 3 days prior to using. The RAP material was heated for 2 hours at the mixing temperature prior to being introduced into the heated aggregates during the mixing process.
3. The asphalt binder was heated to the specified mixing temperature.
19.0
0
12.5
0
9.50
4.75
2.361.18
0.60
0.30
0.15
0.07
50
10
20
30
40
50
60
70
80
90
100
Perc
ent P
assi
ng
Sieve Size (mm)
0% RAP
25% RAP
40
4. The heated aggregate was first added to the mixing bucket and then the asphalt binder and WMA additive. After mixing for approximately 10 seconds, the heated RAP was then added to the mixing bucket. Mixing continued for approximately another 20 to 30 seconds, until visual coating was achieved.
5. The introduction of the WMA additives were different depending on the type of additive used.
a. For the Evotherm and Sasobit WMA additives, the additives were blended with the heated binder for 1 hour at a mixing temperature of 150oC. The additives were blended into the heated binder using a low shear mixer. The Evotherm additive was blended at 0.6% by total weight of the asphalt binder while the Sasobit additive was blended at 1.5% by the total weight of the asphalt binder. The asphalt binder with the WMA additive was then added to the asphalt mixture as noted above.
b. For the Advera after, once the aggregate was added to the mixing bowl, a small “crater” was formed in the heated aggregate using a mixing spoon. The Advera was added at 0.3% by total weight of the asphalt mixture to the crater formed in the aggregate. The asphalt binder was then also added to the crater and the mixing process began.
Once the mixing was complete, the loose mix was conditioned in the oven at the compaction temperature for 2 hours before the mix design and performance test specimens were compacted. WMA Mix Design – Optimum Asphalt Content Determination The optimum asphalt content of the asphalt mixtures were determined using the procedures outline in AASHTO R35. Each of the asphalt mixtures were prepared at four different asphalt binder contents. Three gyratory specimens and two maximum specific gravity (Gmm) specimens were prepared and tested for each asphalt binder content. Since the concept of this portion of the task was only to evaluate the influence of compacted air voids, only the data corresponding to the resultant compacted air voids are shown. The asphalt mixtures were produced using two different RAP contents; 0% and 25%. Currently the NJDOT does not require asphalt mixtures to be design with RAP. However, with the recommendations of NCHRP Project 9-43 to utilize RAP during the WMA mixture design process, both virgin mixes and 25% RAP mixtures were evaluated. In the Superpave asphalt mixture design, the optimum asphalt content is determined by compacting the asphalt mixture to an air void level of 4%. If the measured air void level is greater than 4% air voids, then additional asphalt binder is required to be added. In contrast, if the compacted air void level is below 4%, then asphalt binder needs to be taken out of the asphalt mixture. Therefore, if an additive is added to an asphalt mixture that enhances the compaction of the mixture, it may appear that the asphalt mixture is over-asphalted and asphalt binder needs to be taken out.
41
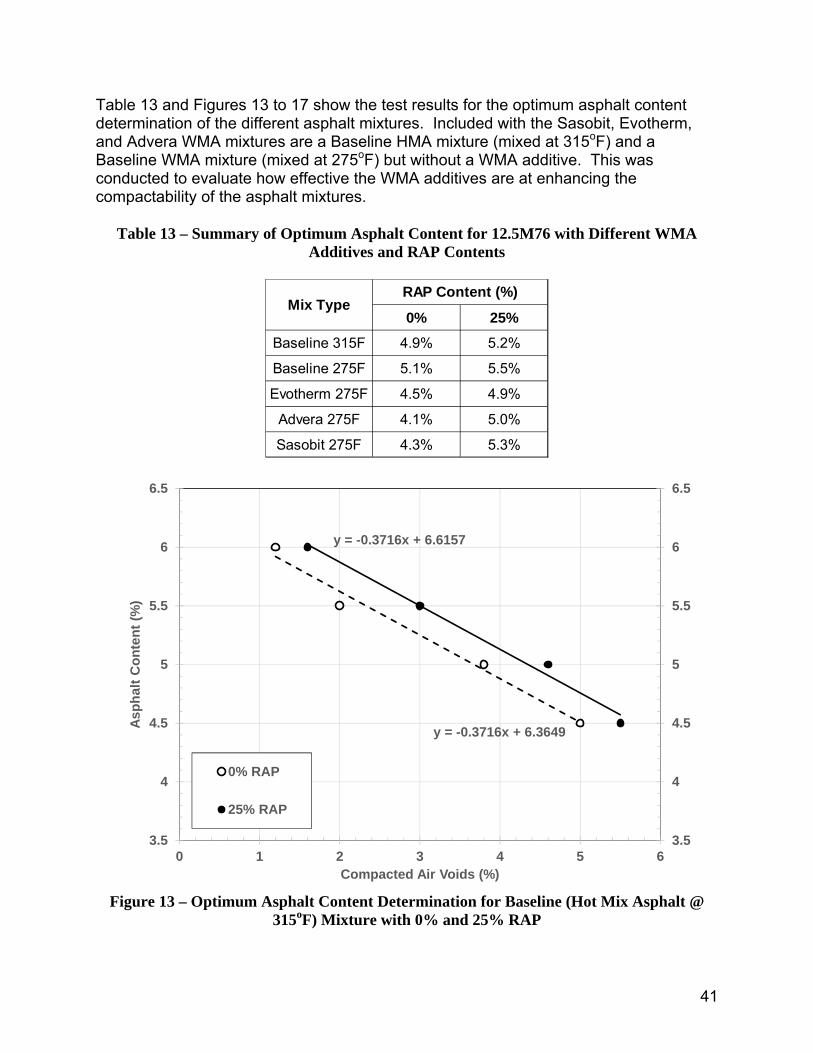
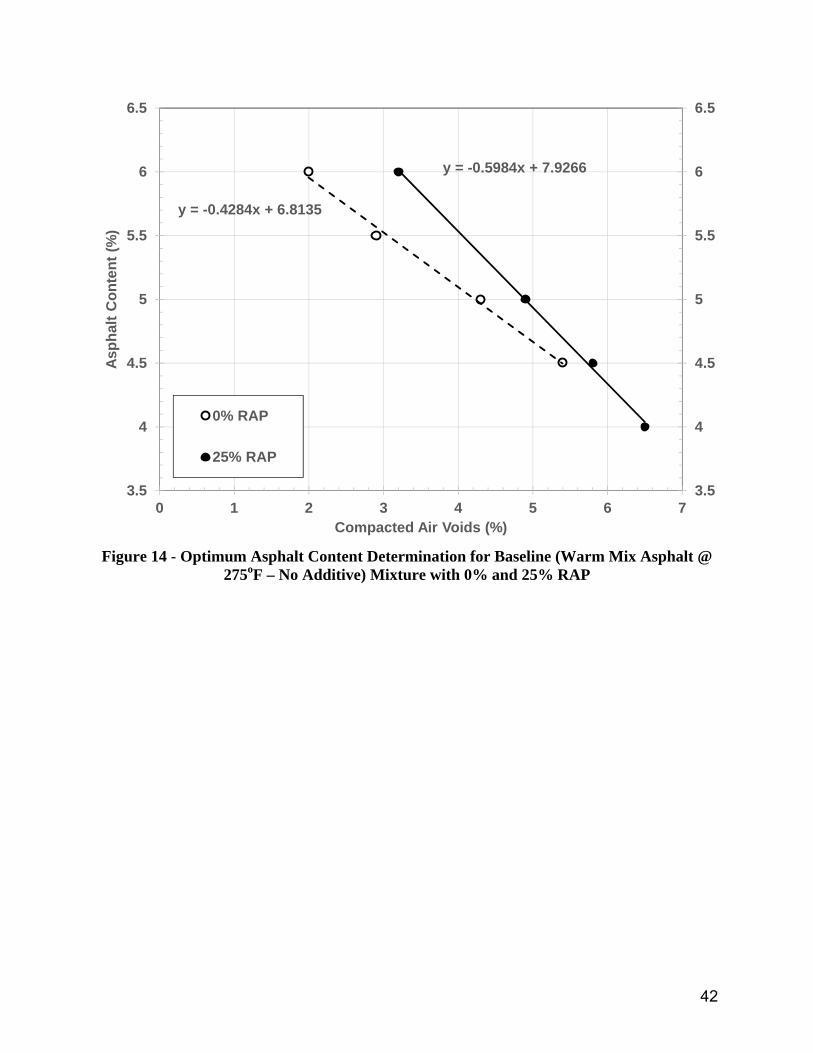
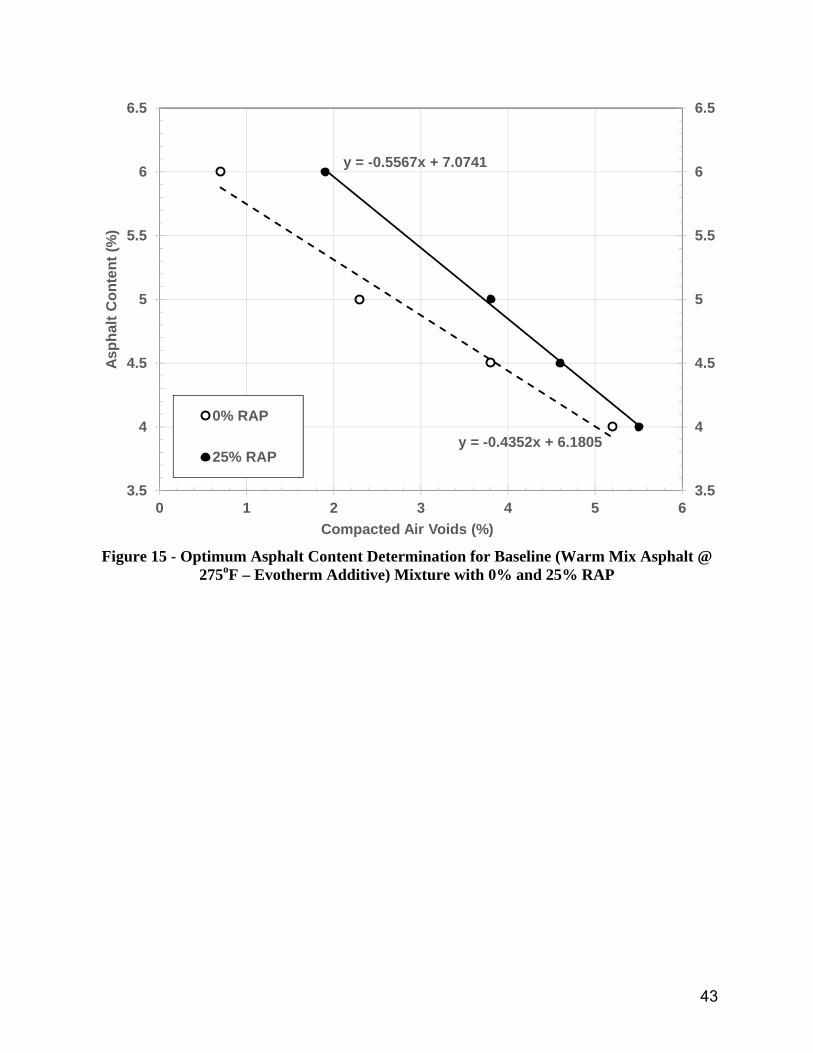
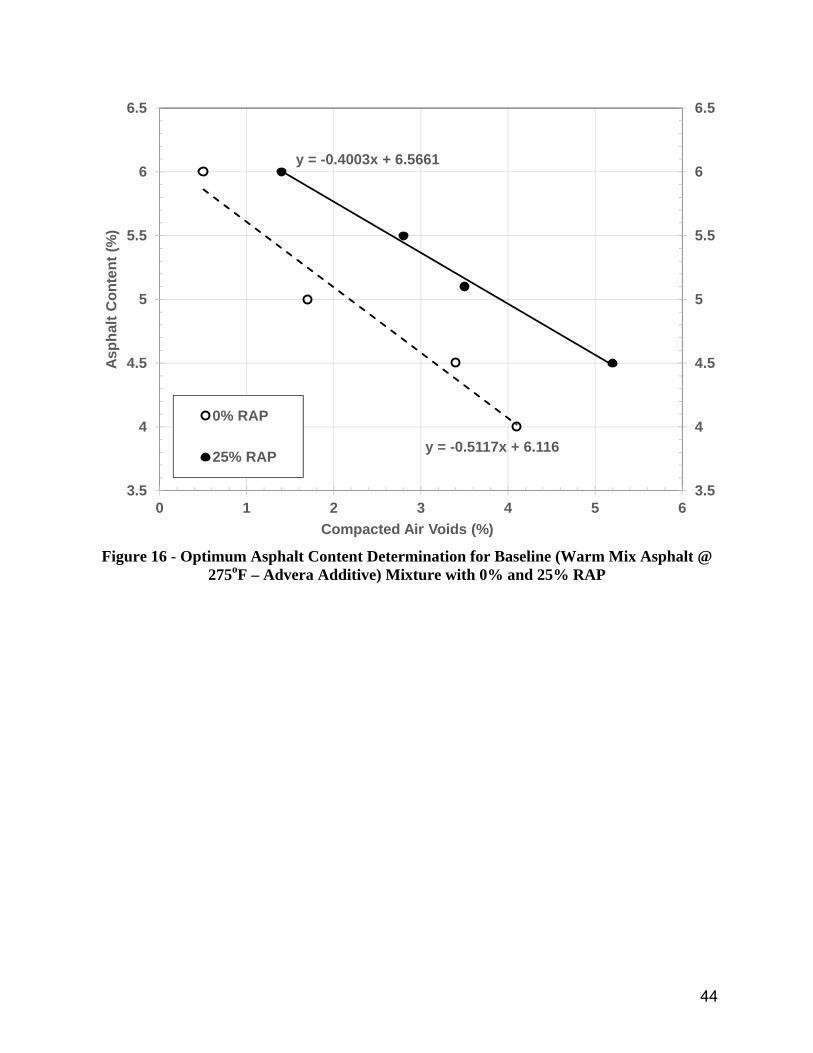
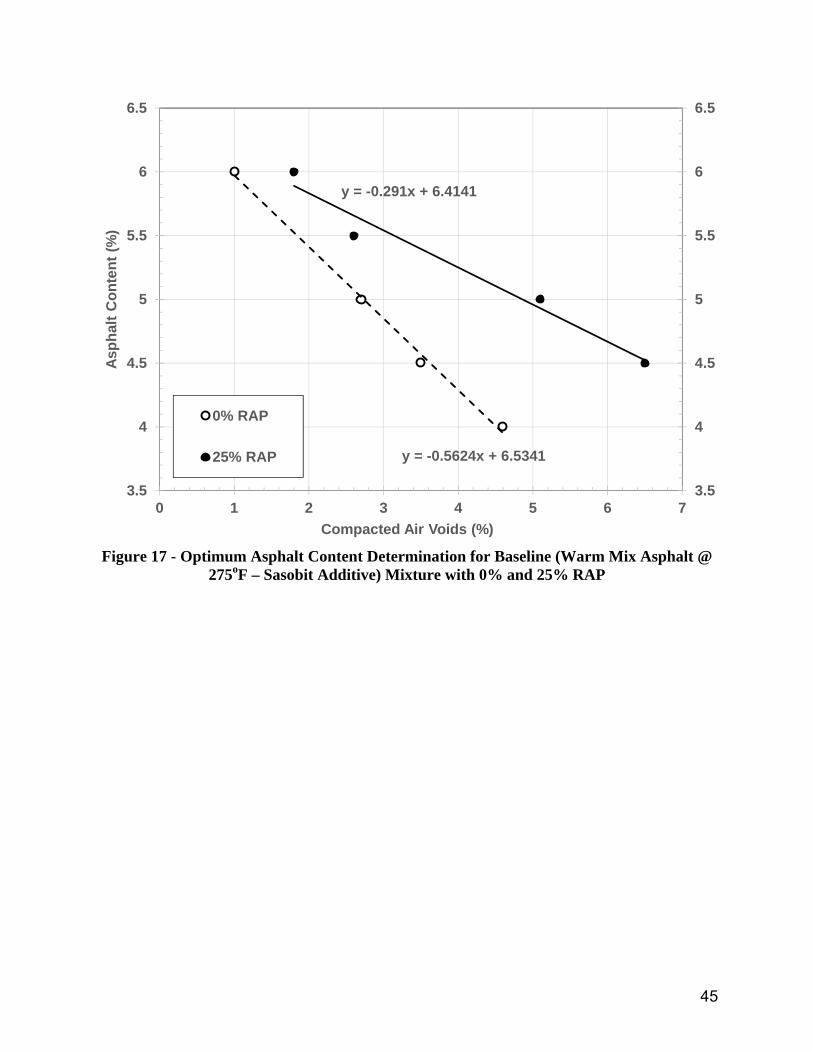
Table 13 and Figures 13 to 17 show the test results for the optimum asphalt content determination of the different asphalt mixtures. Included with the Sasobit, Evotherm, and Advera WMA mixtures are a Baseline HMA mixture (mixed at 315oF) and a Baseline WMA mixture (mixed at 275oF) but without a WMA additive. This was conducted to evaluate how effective the WMA additives are at enhancing the compactability of the asphalt mixtures.
Table 13 – Summary of Optimum Asphalt Content for 12.5M76 with Different WMA Additives and RAP Contents
Figure 13 – Optimum Asphalt Content Determination for Baseline (Hot Mix Asphalt @
315oF) Mixture with 0% and 25% RAP
0% 25%
Baseline 315F 4.9% 5.2%
Baseline 275F 5.1% 5.5%
Evotherm 275F 4.5% 4.9%
Advera 275F 4.1% 5.0%
Sasobit 275F 4.3% 5.3%
Mix TypeRAP Content (%)
y = -0.3716x + 6.3649
y = -0.3716x + 6.6157
3.5
4
4.5
5
5.5
6
6.5
3.5
4
4.5
5
5.5
6
6.5
0 1 2 3 4 5 6
Asph
alt C
onte
nt (%
)
Compacted Air Voids (%)
0% RAP
25% RAP
42
Figure 14 - Optimum Asphalt Content Determination for Baseline (Warm Mix Asphalt @
275oF – No Additive) Mixture with 0% and 25% RAP
y = -0.4284x + 6.8135
y = -0.5984x + 7.9266
3.5
4
4.5
5
5.5
6
6.5
3.5
4
4.5
5
5.5
6
6.5
0 1 2 3 4 5 6 7
Asph
alt C
onte
nt (%
)
Compacted Air Voids (%)
0% RAP
25% RAP
43
Figure 15 - Optimum Asphalt Content Determination for Baseline (Warm Mix Asphalt @
275oF – Evotherm Additive) Mixture with 0% and 25% RAP
y = -0.4352x + 6.1805
y = -0.5567x + 7.0741
3.5
4
4.5
5
5.5
6
6.5
3.5
4
4.5
5
5.5
6
6.5
0 1 2 3 4 5 6
Asph
alt C
onte
nt (%
)
Compacted Air Voids (%)
0% RAP
25% RAP
44
Figure 16 - Optimum Asphalt Content Determination for Baseline (Warm Mix Asphalt @
275oF – Advera Additive) Mixture with 0% and 25% RAP
y = -0.5117x + 6.116
y = -0.4003x + 6.5661
3.5
4
4.5
5
5.5
6
6.5
3.5
4
4.5
5
5.5
6
6.5
0 1 2 3 4 5 6
Asph
alt C
onte
nt (%
)
Compacted Air Voids (%)
0% RAP
25% RAP
45
Figure 17 - Optimum Asphalt Content Determination for Baseline (Warm Mix Asphalt @
275oF – Sasobit Additive) Mixture with 0% and 25% RAP
y = -0.5624x + 6.5341
y = -0.291x + 6.4141
3.5
4
4.5
5
5.5
6
6.5
3.5
4
4.5
5
5.5
6
6.5
0 1 2 3 4 5 6 7
Asph
alt C
onte
nt (%
)
Compacted Air Voids (%)
0% RAP
25% RAP
46
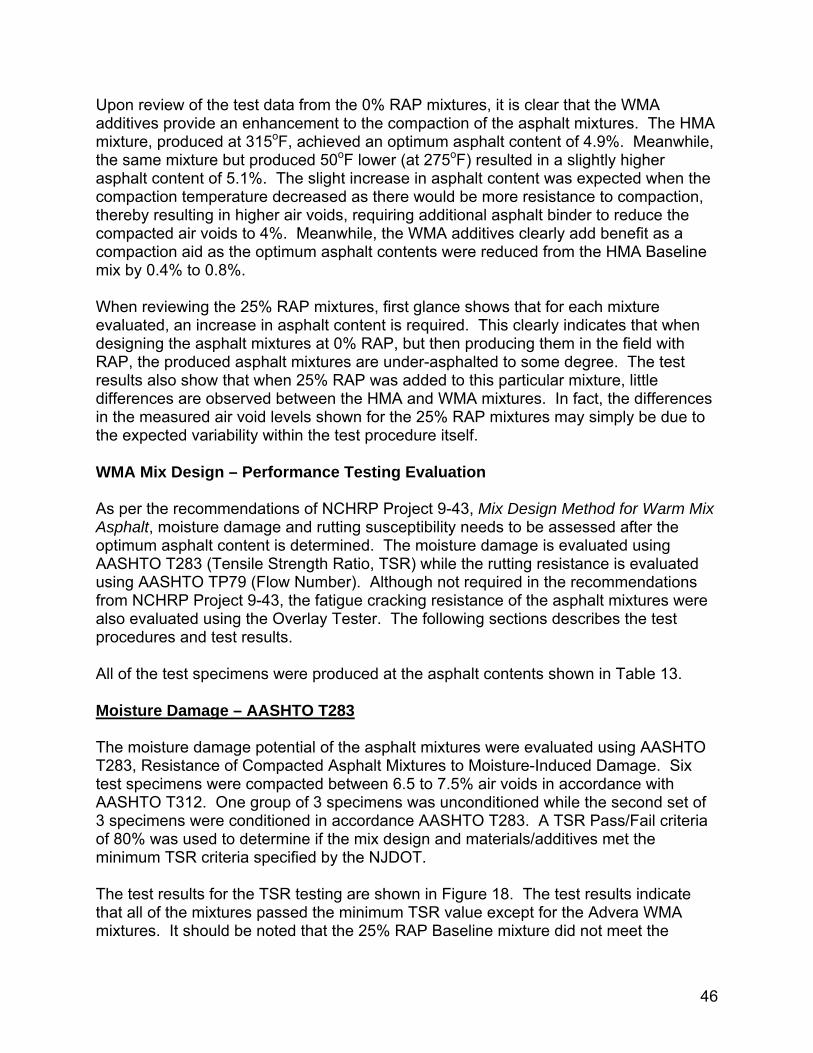
Upon review of the test data from the 0% RAP mixtures, it is clear that the WMA additives provide an enhancement to the compaction of the asphalt mixtures. The HMA mixture, produced at 315oF, achieved an optimum asphalt content of 4.9%. Meanwhile, the same mixture but produced 50oF lower (at 275oF) resulted in a slightly higher asphalt content of 5.1%. The slight increase in asphalt content was expected when the compaction temperature decreased as there would be more resistance to compaction, thereby resulting in higher air voids, requiring additional asphalt binder to reduce the compacted air voids to 4%. Meanwhile, the WMA additives clearly add benefit as a compaction aid as the optimum asphalt contents were reduced from the HMA Baseline mix by 0.4% to 0.8%. When reviewing the 25% RAP mixtures, first glance shows that for each mixture evaluated, an increase in asphalt content is required. This clearly indicates that when designing the asphalt mixtures at 0% RAP, but then producing them in the field with RAP, the produced asphalt mixtures are under-asphalted to some degree. The test results also show that when 25% RAP was added to this particular mixture, little differences are observed between the HMA and WMA mixtures. In fact, the differences in the measured air void levels shown for the 25% RAP mixtures may simply be due to the expected variability within the test procedure itself. WMA Mix Design – Performance Testing Evaluation As per the recommendations of NCHRP Project 9-43, Mix Design Method for Warm Mix Asphalt, moisture damage and rutting susceptibility needs to be assessed after the optimum asphalt content is determined. The moisture damage is evaluated using AASHTO T283 (Tensile Strength Ratio, TSR) while the rutting resistance is evaluated using AASHTO TP79 (Flow Number). Although not required in the recommendations from NCHRP Project 9-43, the fatigue cracking resistance of the asphalt mixtures were also evaluated using the Overlay Tester. The following sections describes the test procedures and test results. All of the test specimens were produced at the asphalt contents shown in Table 13. Moisture Damage – AASHTO T283 The moisture damage potential of the asphalt mixtures were evaluated using AASHTO T283, Resistance of Compacted Asphalt Mixtures to Moisture-Induced Damage. Six test specimens were compacted between 6.5 to 7.5% air voids in accordance with AASHTO T312. One group of 3 specimens was unconditioned while the second set of 3 specimens were conditioned in accordance AASHTO T283. A TSR Pass/Fail criteria of 80% was used to determine if the mix design and materials/additives met the minimum TSR criteria specified by the NJDOT. The test results for the TSR testing are shown in Figure 18. The test results indicate that all of the mixtures passed the minimum TSR value except for the Advera WMA mixtures. It should be noted that the 25% RAP Baseline mixture did not meet the
47
Figure 18 – Tensile Strength Ratio (TSR) Results of Mixtures
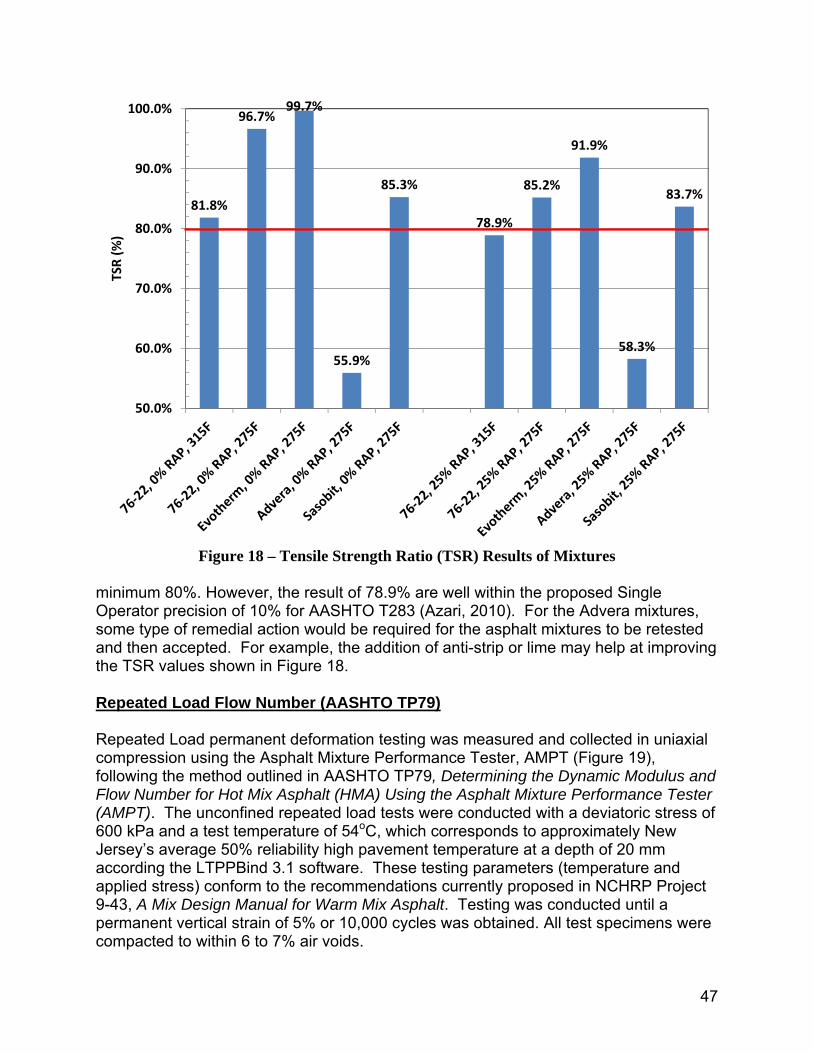
minimum 80%. However, the result of 78.9% are well within the proposed Single Operator precision of 10% for AASHTO T283 (Azari, 2010). For the Advera mixtures, some type of remedial action would be required for the asphalt mixtures to be retested and then accepted. For example, the addition of anti-strip or lime may help at improving the TSR values shown in Figure 18. Repeated Load Flow Number (AASHTO TP79) Repeated Load permanent deformation testing was measured and collected in uniaxial compression using the Asphalt Mixture Performance Tester, AMPT (Figure 19), following the method outlined in AASHTO TP79, Determining the Dynamic Modulus and Flow Number for Hot Mix Asphalt (HMA) Using the Asphalt Mixture Performance Tester (AMPT). The unconfined repeated load tests were conducted with a deviatoric stress of 600 kPa and a test temperature of 54oC, which corresponds to approximately New Jersey’s average 50% reliability high pavement temperature at a depth of 20 mm according the LTPPBind 3.1 software. These testing parameters (temperature and applied stress) conform to the recommendations currently proposed in NCHRP Project 9-43, A Mix Design Manual for Warm Mix Asphalt. Testing was conducted until a permanent vertical strain of 5% or 10,000 cycles was obtained. All test specimens were compacted to within 6 to 7% air voids.
81.8%
96.7%99.7%
55.9%
85.3%
78.9%
85.2%
91.9%
58.3%
83.7%
50.0%
60.0%
70.0%
80.0%
90.0%
100.0%TSR (%
)
48
Figure 19 – Asphalt Mixture Performance Tester (AMPT) at Rutgers University Flow Number test specimens were produced at compacted air void levels between 6 and 7% air voids. Based on the work conducted under NCHRP 9-43, minimum Flow Number requirements were developed as a function of traffic level (ESAL’s). Table 14 shows the recommended minimum requirements for WMA.
Table 14 – Minimum Flow Number Requirements for Warm Mix Asphalt (Bonaquist, 2011)
<3 N.A.3 to < 10 30
10 to < 30 105≥ 30 415
Minimum Flow Number
Traffic Level, Million ESAL's
49
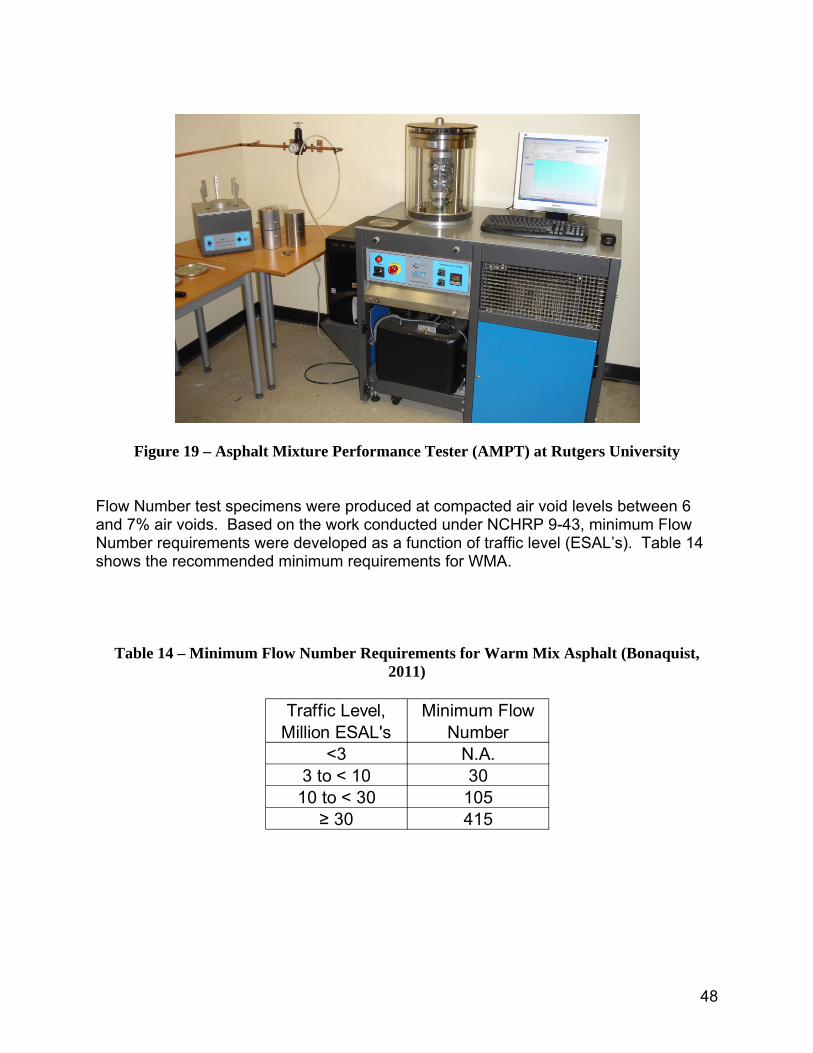
The Flow Number test results for the WMA mixtures evaluated in this study are shown in Figure 20. Comparing the results in Figure 20 to the minimum requirements in Table 14, it is clear that the WMA mixtures, 0% and 25% RAP, both are highly rut resistant and would be rated for > 30 million ESAL’s. The inclusion of RAP, even at higher optimum asphalt contents, generally resulted in slightly better resistance to permanent deformation.
Figure 20 – Flow Number Test Results for WMA Mixtures
1,866
1,274 1,353 1,058
3,898
2,225
1,264 1,301
1,670 1,742
-
500
1,000
1,500
2,000
2,500
3,000
3,500
4,000
4,500
Flow
Num
ber (
cycl
es)
50
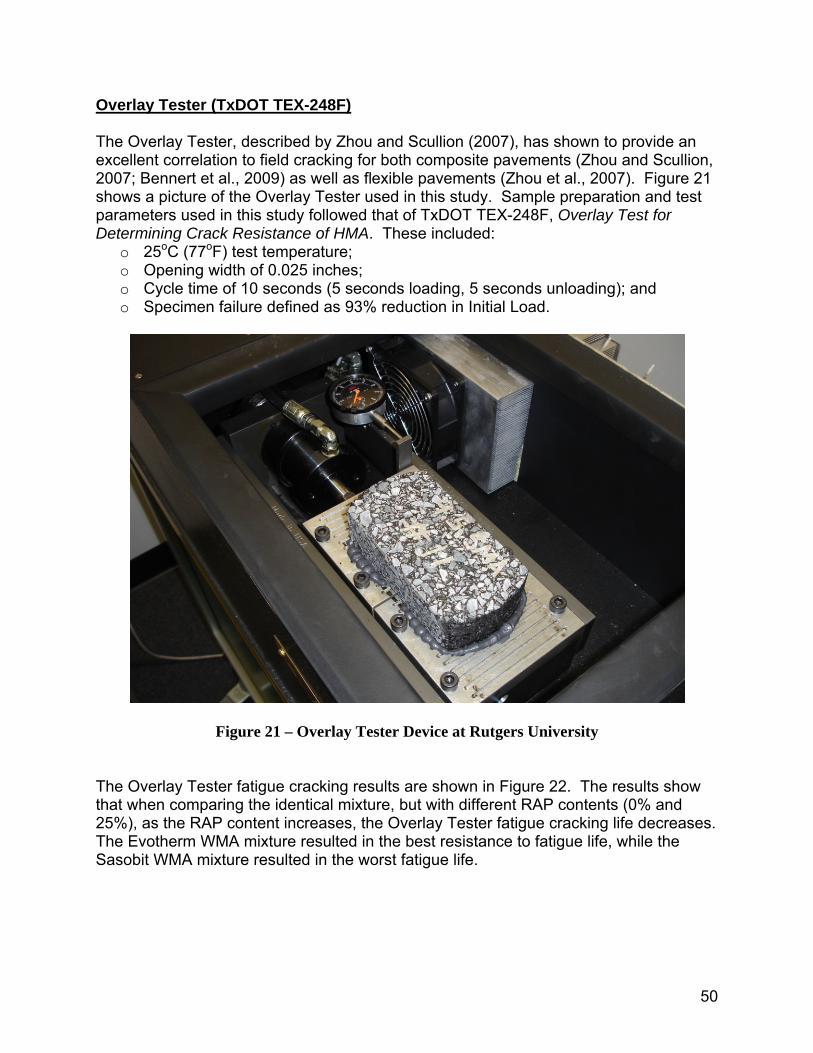
Overlay Tester (TxDOT TEX-248F) The Overlay Tester, described by Zhou and Scullion (2007), has shown to provide an excellent correlation to field cracking for both composite pavements (Zhou and Scullion, 2007; Bennert et al., 2009) as well as flexible pavements (Zhou et al., 2007). Figure 21 shows a picture of the Overlay Tester used in this study. Sample preparation and test parameters used in this study followed that of TxDOT TEX-248F, Overlay Test for Determining Crack Resistance of HMA. These included:
o 25oC (77oF) test temperature; o Opening width of 0.025 inches; o Cycle time of 10 seconds (5 seconds loading, 5 seconds unloading); and o Specimen failure defined as 93% reduction in Initial Load.
Figure 21 – Overlay Tester Device at Rutgers University The Overlay Tester fatigue cracking results are shown in Figure 22. The results show that when comparing the identical mixture, but with different RAP contents (0% and 25%), as the RAP content increases, the Overlay Tester fatigue cracking life decreases. The Evotherm WMA mixture resulted in the best resistance to fatigue life, while the Sasobit WMA mixture resulted in the worst fatigue life.
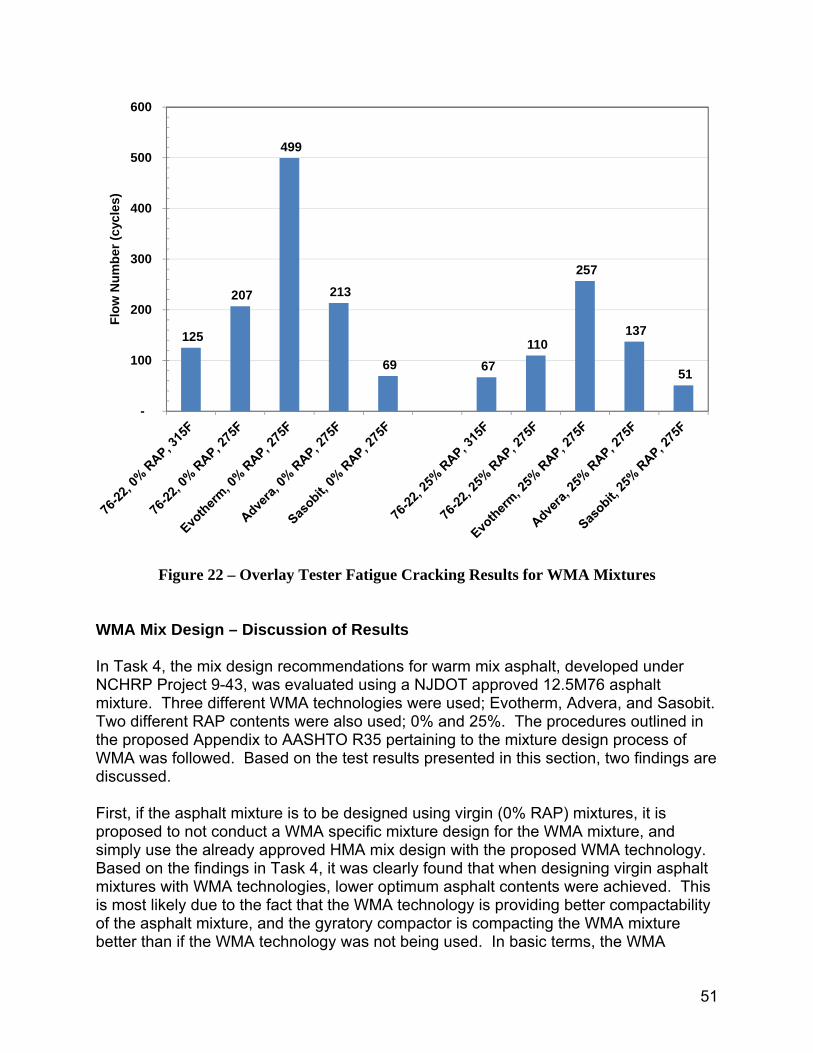
51
Figure 22 – Overlay Tester Fatigue Cracking Results for WMA Mixtures WMA Mix Design – Discussion of Results In Task 4, the mix design recommendations for warm mix asphalt, developed under NCHRP Project 9-43, was evaluated using a NJDOT approved 12.5M76 asphalt mixture. Three different WMA technologies were used; Evotherm, Advera, and Sasobit. Two different RAP contents were also used; 0% and 25%. The procedures outlined in the proposed Appendix to AASHTO R35 pertaining to the mixture design process of WMA was followed. Based on the test results presented in this section, two findings are discussed. First, if the asphalt mixture is to be designed using virgin (0% RAP) mixtures, it is proposed to not conduct a WMA specific mixture design for the WMA mixture, and simply use the already approved HMA mix design with the proposed WMA technology. Based on the findings in Task 4, it was clearly found that when designing virgin asphalt mixtures with WMA technologies, lower optimum asphalt contents were achieved. This is most likely due to the fact that the WMA technology is providing better compactability of the asphalt mixture, and the gyratory compactor is compacting the WMA mixture better than if the WMA technology was not being used. In basic terms, the WMA
125
207
499
213
69 67 110
257
137
51
-
100
200
300
400
500
600Fl
ow N
umbe
r (cy
cles
)
52
technology is allowing the gyratory compactor to “squeeze” the asphalt binder out of the mixture. Second, if the WMA mix design process is to be specified to be followed by the NJDOT, then the mix design must include the RAP materials during the design. When the RAP was included during the WMA mix design process, the resultant optimum asphalt contents were at levels that one would find similar, to slightly higher, than the asphalt mixtures currently being produced. Quality control (QC) testing and NJDOT limits also need to be considered when implementing WMA technologies. As demonstrated during the mixture design process, the WMA technologies allow for the asphalt mixture to be compacted to lower air void contents in the gyratory compactor. During production QC testing, this may be misconstrued as too high of an asphalt content, thereby allowing the asphalt plant to reduce the asphalt content a few tenths. The NJDOT may need to consider lower the allowable air void level during production from 3% to 2.5% or even 2.0%, while specifying that asphalt contents should not be reduced below what is approved on the JMF. This would help to ensure that the asphalt mixtures with WMA technologies are not being produced with low asphalt contents.
53
TASK 5 – MIXTURE PERFORMANCE OF NJDOT’S WMA PILOT PROJECTS After completion of the NJDOT’s first Warm Mix Asphalt (WMA) research project (Bennert, 2012), the NJDOT decided to allow the use of WMA under a pilot project process. Each WMA Pilot Project would require a WMA and HMA companion sections so the asphalt mixture performance could be evaluated and compared. In Task 5 of this study, the mixture performance of HMA and WMA mixtures were evaluated for their respective rutting resistance, moisture damage potential, and cracking potential. Of importance to the NJDOT were the following;
• Rutting Resistance – Flow Number (AASHTO TP79) and Asphalt Pavement Analyzer (AASHTO T340);
• Moisture Damage Potential – Tensile Strength Ratio (AASHTO T283); and • Fatigue Cracking Potential – Overlay Tester (NJDOT B-10)
Each supplier was required to compact and provide gyratory test specimens for evaluation. Each of the respective HMA and WMA mixtures contained 15% RAP. During Task 5, none of the asphalt suppliers wanted to use higher than 15% RAP during any of the WMA projects. The WMA Pilot Project study details can be found in Appendix A of this report. Detailed information pertaining to the testing is found below. Repeated Load Flow Number (AASHTO TP79) Repeated Load permanent deformation testing was measured and collected in uniaxial compression using the Simple Performance Tester (SPT) following the method outlined in AASHTO TP79, Determining the Dynamic Modulus and Flow Number for Hot Mix Asphalt (HMA) Using the Asphalt Mixture Performance Tester (AMPT). The unconfined repeated load tests were conducted with a deviatoric stress of 600 kPa and a test temperature of 54oC, which corresponds to approximately New Jersey’s average 50% reliability high pavement temperature at a depth of 20 mm according the LTPPBind 3.1 software. These testing parameters (temperature and applied stress) conform to the recommendations currently proposed in NCHRP Project 9-43, A Mix Design Manual for Warm Mix Asphalt. Testing was conducted until a permanent vertical strain of 5% or 10,000 cycles was obtained. All test specimens were compacted to within 6 to 7% air voids. Minimum recommended Flow Number values, based on ESAL level, has been established under NCHRP Project 9-43 and are proposed for implementation in AASHTO R35. Table 15 provides the minimum recommended values as proposed in the Appendix to AASHTO R35, Appendix: Special Mixture Design Considerations and Methods for Warm Mix Asphalt (WMA).
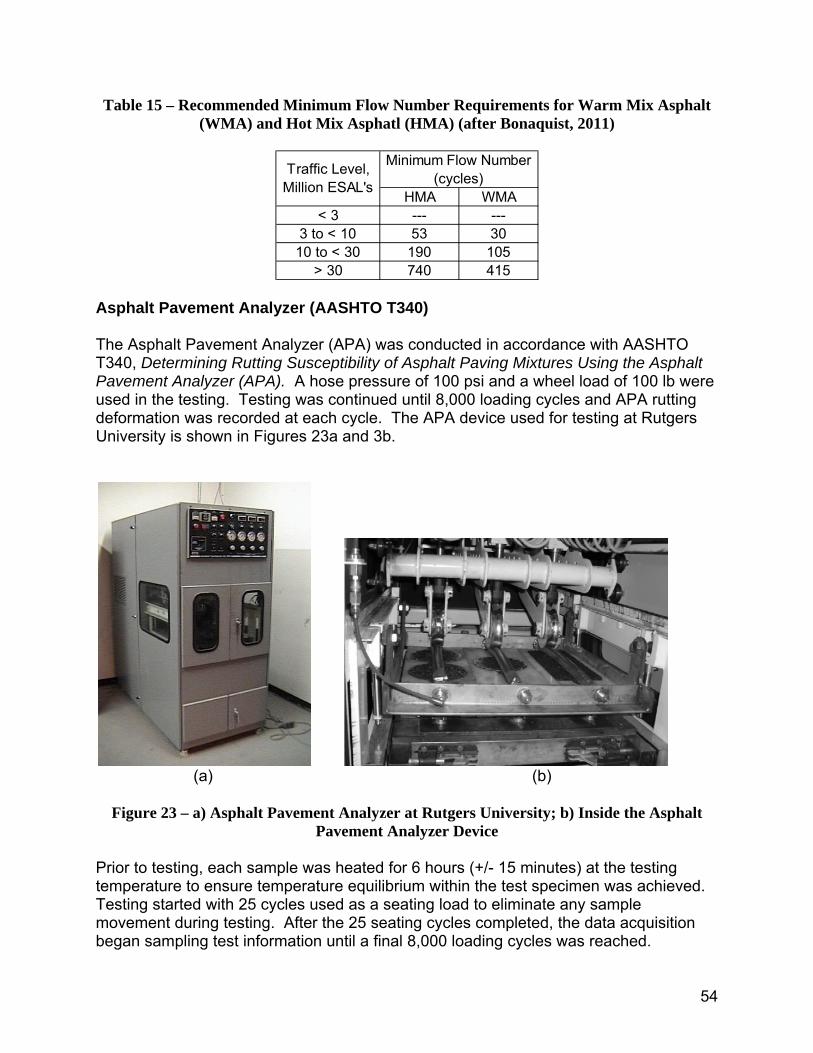
54
Table 15 – Recommended Minimum Flow Number Requirements for Warm Mix Asphalt (WMA) and Hot Mix Asphatl (HMA) (after Bonaquist, 2011)
Asphalt Pavement Analyzer (AASHTO T340) The Asphalt Pavement Analyzer (APA) was conducted in accordance with AASHTO T340, Determining Rutting Susceptibility of Asphalt Paving Mixtures Using the Asphalt Pavement Analyzer (APA). A hose pressure of 100 psi and a wheel load of 100 lb were used in the testing. Testing was continued until 8,000 loading cycles and APA rutting deformation was recorded at each cycle. The APA device used for testing at Rutgers University is shown in Figures 23a and 3b.
(a) (b)
Figure 23 – a) Asphalt Pavement Analyzer at Rutgers University; b) Inside the Asphalt
Pavement Analyzer Device Prior to testing, each sample was heated for 6 hours (+/- 15 minutes) at the testing temperature to ensure temperature equilibrium within the test specimen was achieved. Testing started with 25 cycles used as a seating load to eliminate any sample movement during testing. After the 25 seating cycles completed, the data acquisition began sampling test information until a final 8,000 loading cycles was reached.
HMA WMA< 3 --- ---
3 to < 10 53 3010 to < 30 190 105
> 30 740 415
Traffic Level, Million ESAL's
Minimum Flow Number (cycles)
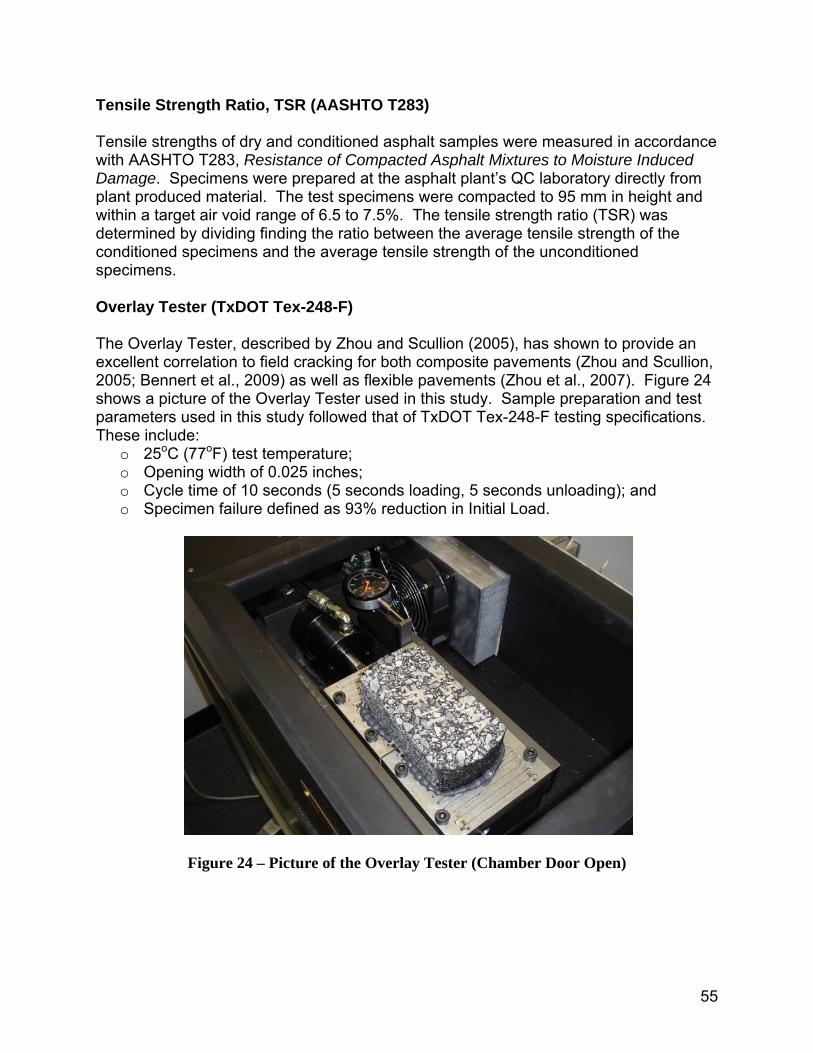
55
Tensile Strength Ratio, TSR (AASHTO T283) Tensile strengths of dry and conditioned asphalt samples were measured in accordance with AASHTO T283, Resistance of Compacted Asphalt Mixtures to Moisture Induced Damage. Specimens were prepared at the asphalt plant’s QC laboratory directly from plant produced material. The test specimens were compacted to 95 mm in height and within a target air void range of 6.5 to 7.5%. The tensile strength ratio (TSR) was determined by dividing finding the ratio between the average tensile strength of the conditioned specimens and the average tensile strength of the unconditioned specimens. Overlay Tester (TxDOT Tex-248-F) The Overlay Tester, described by Zhou and Scullion (2005), has shown to provide an excellent correlation to field cracking for both composite pavements (Zhou and Scullion, 2005; Bennert et al., 2009) as well as flexible pavements (Zhou et al., 2007). Figure 24 shows a picture of the Overlay Tester used in this study. Sample preparation and test parameters used in this study followed that of TxDOT Tex-248-F testing specifications. These include:
o 25oC (77oF) test temperature; o Opening width of 0.025 inches; o Cycle time of 10 seconds (5 seconds loading, 5 seconds unloading); and o Specimen failure defined as 93% reduction in Initial Load.
Figure 24 – Picture of the Overlay Tester (Chamber Door Open)
56
Dense-graded HMA and WMA Mixtures Two different sets of asphalt mixtures were evaluated under Task 5; dense-graded mixes and stone matrix asphalt (SMA) mixtures.Six different WMA Pilot Projects were constructed using dense-graded asphalt mixtures. For each of the WMA projects, the WMA mixture was produced using the identical job mix formula as the HMA – no modification to the JMF or separate mixture design was conducted. Therefore, the only difference between the HMA and WMA mixtures were the WMA technology and the mixing and production temperature. Unfortunately, background information regarding plant type, mixing and compaction temperature, moisture content of stockpiles, etc., data recommended to be collected during each of the WMA Pilot Project studies, were rarely collected and therefore not shown. However, from discussions with the different asphalt suppliers, typical HMA and WMA production temperature for the dense-graded projects were 320 to 310oF and 280 to 270oF, respectively. This is approximately a 40oF reduction in production temperature. Two different WMA technologies were commonly used in the projects; water injection and Evotherm. Both of the Evotherm projects had dosage rates of 0.5% by total weight of the asphalt binder. Meanwhile, the water injection technologies varied depending on the asphalt plant producing the WMA mixture. Nominal maximum aggregate size (NMAS) of the dense graded mixtures were typically 9.5 or 12.5 mm and by chance, all of the asphalt mixtures produced contained a PG64-22 asphalt binder. Table 16 contains the results of the performance testing for the dense-graded HMA and WMA asphalt mixtures. On average, the test results show the following trends;
• Rutting Resistance o The results of the AMPT Flow Number test (AASHTO TP79) indicate that
approximately a 30% decrease in the Flow Number value was found when comparing the HMA to the WMA test specimens. However, as shown in Table 15, there is an expected reduction in the measure Flow Number of the WMA mixture due to the reduced oxidation level of the asphalt binder.
o The results of the Asphalt Pavement Analyzer (AASHTO T340) shows an average 21% increase in measured rutting in the APA. This follows the trend of the Flow Number results.
• Moisture Damage Potential o Overall, the use of WMA improved the TSR values by 5%. However, the
test data was separated out based on WMA technology (Evotherm and Water Injection) as the Evotherm product has an anti-strip component to it.
Evotherm modified WMA was found to have on average a 15% improvement in the TSR value.
Water Injection modified WMA was found to have on average a 16% reduction in the TSR value.
o The results of the moisture damage potential clearly show that unlike the rutting resistance, the change in TSR value of WMA mixtures will be highly dependent on the WMA technology used.
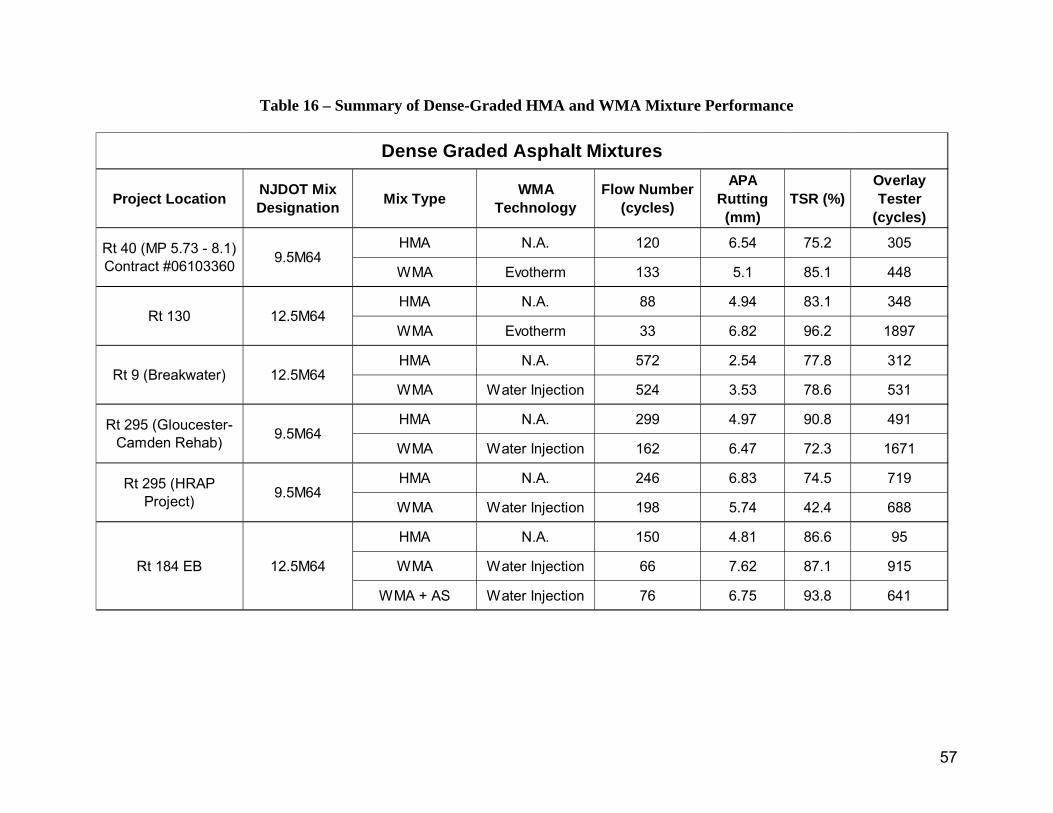
57
Table 16 – Summary of Dense-Graded HMA and WMA Mixture Performance
HMA N.A. 120 6.54 75.2 305
WMA Evotherm 133 5.1 85.1 448
HMA N.A. 88 4.94 83.1 348
WMA Evotherm 33 6.82 96.2 1897
HMA N.A. 572 2.54 77.8 312
WMA Water Injection 524 3.53 78.6 531
HMA N.A. 299 4.97 90.8 491
WMA Water Injection 162 6.47 72.3 1671
HMA N.A. 246 6.83 74.5 719
WMA Water Injection 198 5.74 42.4 688
HMA N.A. 150 4.81 86.6 95
WMA Water Injection 66 7.62 87.1 915
WMA + AS Water Injection 76 6.75 93.8 641
Dense Graded Asphalt Mixtures
Rt 295 (Gloucester-Camden Rehab) 9.5M64
Overlay Tester
(cycles)TSR (%)
APA Rutting (mm)
Flow Number (cycles)Mix Type WMA
Technology
12.5M64Rt 130
9.5M64Rt 295 (HRAP Project)
NJDOT Mix Designation
9.5M64Rt 40 (MP 5.73 - 8.1) Contract #06103360
12.5M64Rt 9 (Breakwater)
12.5M64Rt 184 EB
Project Location
58
• Fatigue Cracking o Overall, the WMA mixtures resulted in a better resistance to fatigue
cracking when evaluated in the Overlay Tester. However, the magnitude of the improvement ranged from minimally to an order of magnitude. This was found for both the Evotherm and Water Injection technologies. Therefore, this would suggest that production parameters and mixture design may have more of an impact of the fatigue resistance than simply the WMA technology itself.
Stone Matrix Asphalt (SMA) WMA Mixtures – Fiberless SMA The concept of Fiberless SMA is based on the concept that fibers are used to resist the draindown of the asphalt binder in the SMA mixture by increasing the viscosity of the mastic portion of the SMA mixture. However, the viscosity of the mastic portion of the SMA could also be increased by increasing the viscosity of the asphalt binder via reducing the temperature of the SMA mixture itself. Unfortunately, reducing the temperature of the SMA mixture would ultimately create compaction issues, unless an additive that could enhance the compactability of the SMA mixture could be used. Therefore, to properly produce a Fiberless SMA, the production temperatures of the SMA are reduced to a level that increases the viscosity of the mastic portion of the SMA so draindown is minimal. Then, a WMA additive is utilized as a compaction aid, so the SMA mixture can be properly compacted in the field at the lower production/compaction temperature. To verify the Fiberless SMA concept for a SMA mixture, the SMA mixture is produced at different production temperatures, without fibers, and evaluated for its draindown potential at each of the respective production temperature. Also, at each one of these production temperatures, gyratory specimens are also compacted to the design gyration level and air voids are determined to ensure the SMA mixtures can be compacted. A Draindown vs Compacted Air Voids for a fiberless SMA mixture is found in Figure 25. As the figure shows, the Draindown of the asphalt binder significantly decreases as the temperature decreases simply due to the natural increase in the asphalt binder viscosity. Meanwhile, due to the addition of the WMA technology, in this case Evotherm, the QC compacted air void range was still able to be met. In October 2009, the first Fiberless SMA project was produced on Route 1 in New Jersey. The contractor noted the Fiberless SMA mixture was easy to handle and compact with no indication of draindown issues during the project. Loose mix brought back to the laboratory and evaluated showed that the Fiberless SMA was rut resistant and highly fatigue resistant (Bennert, 2012). Since 2009, three additional Fiberless SMA mixtures have been produced in the North Region of New Jersey. The mixture test results are summarized in Table 17. The test results show that all three of the Fiberless SMA mixtures are rut resistant and fatigue cracking resistant. Moisture damage potential is also very low for these mixtures.
59
Figure 25 – Relationship Between Draindown Potential and Compacted Air Voids for a
Fiberless SMA Mixture NJDOT Pilot Project – Discussion of Results A total of nine WMA Pilot Projects were conducted between 2011 and 2014. These projects consisted of six dense-grade and three Fiberless SMA projects. For each of the projects test specimens were produced to evaluate the rutting resistance, moisture damage potential, and fatigue cracking resistance of the mixtures. In summary, the WMA mixtures were found to have laboratory results that were less rut resistant than their companion WMA mixtures. Meanwhile, the WMA mixtures were found to be more resistant to fatigue cracking than the companion WMA mixtures. These results make sense as with reduced production temperature, the asphalt binder is aged less. The moisture damage potential was found to be dependent on the WMA technology used. When Evotherm was used, the WMA mixtures achieved better TSR values than the HMA mixtures. Meanwhile, when the Water Injection technologies were used, the WMA mixtures had lower TSR values than the companion HMA mixtures.
2.73
1.5
0.85
0.18
3.86
3.453.73
4.36
0.0
0.5
1.0
1.5
2.0
2.5
3.0
3.5
4.0
4.5
5.0
5.5
6.0
0.00
0.25
0.50
0.75
1.00
1.25
1.50
1.75
2.00
2.25
2.50
2.75
3.00
240 250 260 270 280 290 300 310 320 330
Com
pact
ed A
ir Vo
ids
(%)
Dra
indo
wn
(%)
Temperature (oF)
Draindown (%)
Air Voids (%)
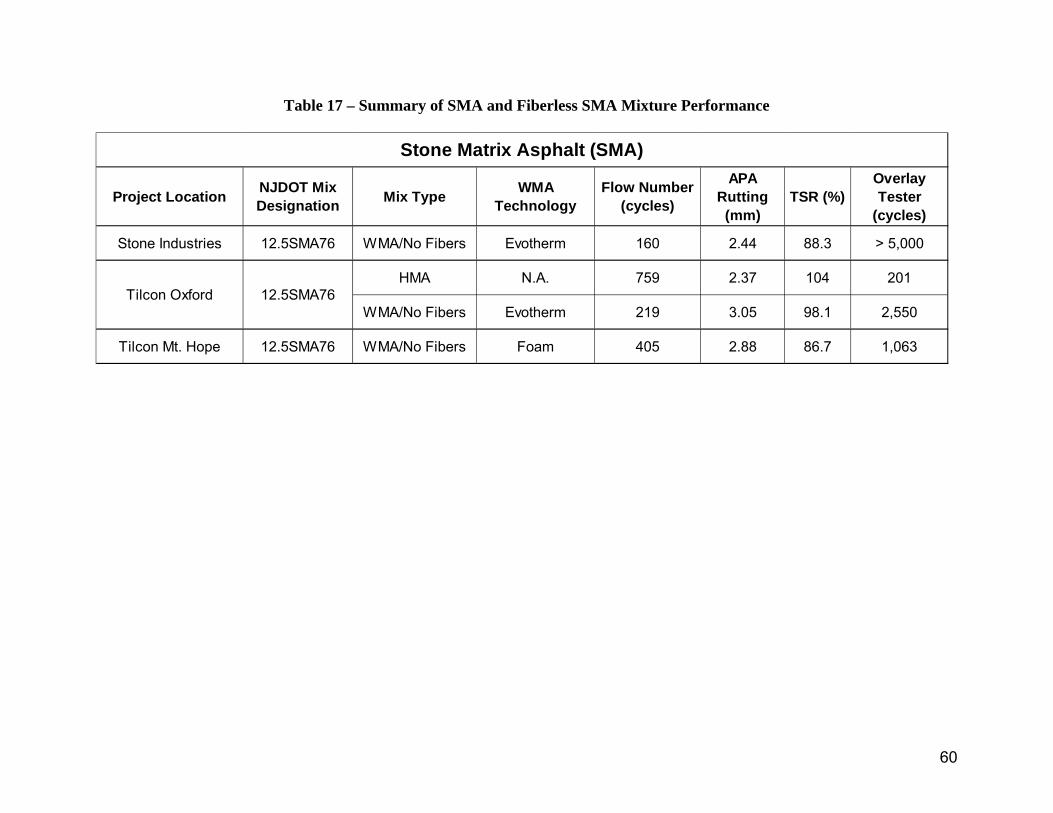
60
Table 17 – Summary of SMA and Fiberless SMA Mixture Performance
Stone Industries 12.5SMA76 WMA/No Fibers Evotherm 160 2.44 88.3 > 5,000
HMA N.A. 759 2.37 104 201
WMA/No Fibers Evotherm 219 3.05 98.1 2,550
Tilcon Mt. Hope 12.5SMA76 WMA/No Fibers Foam 405 2.88 86.7 1,063
Project Location NJDOT Mix Designation Mix Type WMA
TechnologyFlow Number
(cycles)
APA Rutting (mm)
TSR (%)Overlay Tester
(cycles)
Stone Matrix Asphalt (SMA)
12.5SMA76Tilcon Oxford
61
CONCLUSIONS A research project was undertaken to better understand the performance of WMA mixtures for use in New Jersey. In summary, the following conclusions can be drawn from the testing conducted during this work;
The use of warm mix asphalt (WMA) helps to reduce the degradation of SBS polymers in SBS polymer modified PG76-22. Gel Permeation Chromatography (GPC) testing showed that when asphalt binders are heated at lower temperatures, the SBS polymer was less likely to degrade. The analysis in this study showed that SBS modified asphalt binders conditioned in the RTFO at 133°C (~270oF) were statistically equal to unaged (Original Condition) SBS modified asphalt binders with respect to their polymer peak molecular weight. A reduction in polymer peak molecular weight would indicate the SBS degradation. Meanwhile, when conditioning the SBS modified binder in the RTFO at current specification temperatures (163°C (~325oF)), a significant drop in the asphalt binder’s polymer peak molecular weight was found, clearly indicating that the SBS is breaking down during the conditioning.
The procedure developed by Shirodkar et al. (2010) was used to assess the blending potential of RAP with virgin asphalt binder during WMA production. Two WMA additives were preblended in the asphalt binder, two different conditioning times, two different mixing times, and two different mixing temperatures totaling 24 combinations of possible plant mixing conditions were evaluated. Based on the laboratory mixing process used, it was found that the RAP binder does have some level of blending with the virgin binder at the reduced mixing temperatures. However, the methodology used was not able to determine if the blending was sensitive to mixing time or temperature.
The moisture damage potential of WMA mixtures were found to be highly dependent on the WMA technology used. Some of the WMA technologies stiffen the asphalt binder or have an anti-strip component to the technology that aids in resisting moisture damage. Two of these additives were evaluated in this study with Rediset (anti-strip component) and Sasobit (stiffens the asphalt binder). The third WMA technology evaluated was Advera, which releases a small amount of moisture into the mixture, creating a miniature foaming reaction. The modified mixing procedure used in this task incorporated moisture in the aggregate blend prior to the mixing process, as well as three different mixing temperatures. The test results showed that the wet indirect tensile strengths were highly dependent on the production temperature (as production temperature decreased, the wet tensile strengths decreased). Both the Sasobit and Rediset WMA technologies provided the additional benefit of improving the TSR values when compared to conventional HMA produced at identical conditions. Meanwhile, the Advera product did not improve the TSR values, and may have accelerated specimen damage during the freeze-thaw conditioning phase at the lower mixing temperature/higher aggregate moisture content conditions.
The evaluation of the recommended modifications to AASHTO R35 for Warm Mix Asphalt mixture design showed that for New Jersey’s conditions, it is not recommended to conduct a WMA specific mix design when virgin asphalt mixture
62
designs are being conducted. Work conducted in this study found that the WMA technologies used resulted in lower optimum asphalt contents during the design phase as the WMA technologies allowed for the asphalt mixtures to compact “tighter” in the gyratory compactor. As New Jersey’s asphalt mixtures are already lean on asphalt content, it is not advisable to promote any technology that takes additional asphalt binder out of the mixture. However, if the WMA mixture design is to include the RAP during the design phase, then it was found that the WMA technology could be incorporated and reasonable asphalt contents should result.
Results from the NJDOT WMA Pilot Projects showed that the WMA mixtures are more prone to permanent deformation, while being more resistant to fatigue cracking when compared to companion HMA test sections. Moisture damage potential was found to be a function of the WMA technology used, with Evotherm WMA resulting in better TSR values and Water Injection WMA resulting in lower TSR values when compared to companion HMA test sections.
63
RECOMMENDATIONS FOR IMPLEMENTATION During the progress of the research study, many of the findings were utilized to allow for the full implementation of WMA in New Jersey. Currently, the NJDOT allows either HMA or WMA, and addresses WMA under Section 902.01.05, shown below.
902.01.05 Warm Mix Asphalt (WMA) Additives and Processes
Use a WMA additive or process that is listed on the Northeast Asphalt User/Producer Group (NEAUPG) Qualified WMA Technologies List which can be found at the following website: http://www.neaupg.uconn.edu/
If an approved HMA mix design is used, a separate mix design with WMA additives or processes is not required. Submit information on the WMA additive or process with the Paving Plan required in 401.03.06.A For controlled foaming systems, also submit the operating parameters of the system including accuracy of the meter, operating range, and temperature of the binder. Provide the target and operating tolerances for the percent water injection and temperatures for the binder. Provide a method for validating this with changing production rates. Ensure that a technical representative of the manufacturer is on-site or available for consultation for the first day or night of production.
Therefore, it can be concluded that the findings in this report helped to fully implement the use of WMA in New Jersey.
64
REFERENCES Azari, H., 2010, Precision Estimates of AASHTO T283: Resistance of Compacted Hot Mix Asphalt (HMA) to Moisture-Induced Damage, NCHRP Web-Only Document 166, National Cooperative Highway Research Program (NCHRP), Transportation Research Board, Washington, D.C., 83 pp. Bausano, J. and R.C. Williams, 2009, “Transitioning from AASHTO T283 to the Simple Performance Test Using Moisture Conditioning”, Journal of Materials in Civil Engineering, Volume 21, Issue 2, American Society of Civil Engineers, ASCE, p. 73-82. Bennert, T., 2007, Results of New Jersey’s Rt. 38 Warm Mix Evaluation, Presented to the New Jersey Department of Transportation, October, 2007. Bennert, T., 2009, Evaluation of Warm Asphalt Technologies – 2009 3rd Quarterly Report, Submitted and Presented to the New Jersey Department of Transportation, October 2009. Bennert, T., and Williams, S., 2009, “Precision of AASHTO TP62-07 for Use in the Mechanistic Empirical Pavement Design Guide for Flexible Pavements”, Transportation Research Record: Journal of the Transportation Research Board, No. 2127, Transportation Research Board of the National Academies, Washington, D.C., pp. 115 – 126. Bennert, T., “Evaluation of Warm Asphalt Technology” Center for Advanced Infrastructure & Transportation, Rutgers University-New Brunswick, Presented to New Jersey Department of Transportation, 2010 Bennert, 2012, Evaluation of Warm Asphalt Technology, FHWA-NJ-2011-005, New Jersey Department of Transportation (NJDOT), 126 pp. Bonaquist, R. (2011), Mix Design Practices for Warm Mix Asphalt, NCHRP Report 691, National Cooperative Highway Research Program (NCHRP), Transportation Research Board, Washington, D.C., 111 pp. Christensen, D. and R. Bonaquist, 2006, NCHRP Report 567, Volumetric Requirements for Superpave Mix Design, Transportation Research Board, Washington D.C., 57 pp. Cortizo, M., Larsen, D., Bianchetto, H., Alessandrini, J., 2004, “Effect Of The Thermal Degradation Of SBS Copolymers During The Ageing Of Modified Asphalts”, Polymer Degradation and Stability, Volume 86, Issue 2, November 2004, pp 275-282. Diefenderfer, S. and A. Hearon, 2009, Laboratory Evaluation of a Warm Asphalt Technology for Use in Virginia, Virginia Transportation Research Council, 46 pp.
65
Edwards, Y., 2006, Influence of Waxes on Bitumen and Asphalt Concrete Mixture Performance, Dissertation for the KTH Architecture and the Built Environment. Epps, J., E. Berger, and J. Anagnos, 2003, “Treatments”, Moisture Sensitivity of Asphalt Pavements, A National Seminar, February 4th to 6th, 2003, San Diego, CA, p. 117 – 177. Estakhri, Cindy, Button, Joe, Alvarez, Allex E., “Field and Laboratory Investigation of Warm Mix Asphalt In Texas”, http://tti.tamu.edu/documents/0-5597-2.pdf. Accessed July 6. 2010 Hicks, R.G., L. Santucci, and T. Aschenbrener, 2003, “Introduction and Seminar Objectives”, Moisture Sensitivity of Asphalt Pavements, A National Seminar, February 4th to 6th, 2003, San Diego, CA, p. 3 – 22. Hrdlicka, G. M. et al. (2007). “Evaluation of Binder Tests for Identifying Rutting and Cracking Potential of Modified Asphalt Binders”. Center for Transportation Infrastructure Systems. Research Report 0-4824-1. Conducted for Texas Department of Transportation. Huang, B. Z, G. Li.et al. (2005), “Laboratory Investigation of Mixing HMA with RAP”, Transportation Research Board: Journal of the Transportation Research Board, No. 1929, Transportation Research Board of the National Academies, Washington, D.C., pp. 37-45. Kandhal, P., Foo, K. and Mallick R. (1998), “A critical review of VMA requirements in Superpave”, NCAT report No. 98-105 Kiggundu, B. and F. Roberts, 1988, Stripping in HMA Mixtures: State-of-the-Art and Critical Review of Test Methods, NCAT Report 88-2, National Center for Asphalt Technology, Auburn University, Auburn, AL. Kvasnak, A., R. West, J. Moore, J. Nelson, P. Turner, and N. Tran, 2009, “Case Study of Warm Mix Asphalt Moisture Susceptibility in Birmingham”, Presented at the 2009 Annual Meeting of the Transportation Research Board, Washington, D.C. Little, D. and D. Jones, 2003, “Chemical and Mechanical Processes of Moisture Damage in Hot-Mix Asphalt Pavements”, Moisture Sensitivity of Asphalt Pavements, A National Seminar, February 4th to 6th, 2003, San Diego, CA, p. 37 – 70. Lu, X. and Isacsson, U., 1998, “Chemical and Rheological Evaluation of Ageing Properties of SBS Polymer Modified Bitumens”, Fuel 77, 961-972. Lu, X. and Isacsson, U., 2000, “Artificial Aging of Polymer Modified Bitumens”, Journal of Applied Polymer Science, 76, 1811-1824
66
Mallick, R., M. Teto, and L.A. Cooley, 2002, Issues Pertaining to the Permeability Characteristics of Coarse-Graded Superpave Mixes, NCAT Report 02-07, National Center for Asphalt Technology, Auburn University, Auburn, AL. Mouillet V. et al., 2008, “Infrared Microscopy Investigation of Oxidation and Phase Evolution in Bitumen Modified With Polymers”, Fuel 87 pp 1270-1280. www.fuelfirst.com. Ruan Y. et al., 2003, “The Effect of Long-Term Oxidation on the Rheological Properties of Polymer Modified Asphalts”, Fuel 82, pp 1763-1773. Prowell, B., and G. Hurley, 2006, Evaluation of WMAT 2 for Use in Warm Mix Asphalt, Graham, Hurley C., National Center for Asphalt Technology (NCAT), Auburn University. Schmidt, R. and P. Graf, 1972, “The Effect of Water on the Resilient Modulus of Asphalt Treated Mixes”, Proceedings of the Association of Asphalt Paving Technologists, Vol. 41, p. 118 – 162. Sengoz, B. and Topal, A., “Minimum Voids in Mineral Aggregate in Hot-mix Asphalt Based on Asphalt Film Thickness”, Science Direct, Volume 42, Issue 10, October 2007, pp 3629-3635. Shirodkar P., Mehta Y., Nolan A., Sonpal K., Norton A., Tomlinson C., Dubois E., Sullivan P., Sauber R., “A Study to Determine the Degree of Partial Blending of Reclaimed Asphalt Pavement (RAP) Binder for High RAP Hot Mix Asphalt”, Journal of Construction and Building Materials (2010). Solaimanian, M., R. Bonaquist, and V. Tandon, 2007, NCHRP Report 589, Improved Conditioning and Testing Procedures for HMA Moisture Susceptibility, Transportation Research Board, Washington D.C., 79 pp. Solaimanian, M., J. Harvey, M. Tahmoressi, and V. Tandon, 2003, “Test Methods to Predict Moisture Sensitivity of Hot-Mix Asphalt Pavements”, Moisture Sensitivity of Asphalt Pavements, A National Seminar, February 4th to 6th, 2003, San Diego, CA, p. 77 – 110. Stroup-Gardiner, M and C. Lange, “Characterization of Asphalt Odors and Emissions”, In Proceedings of the Ninth International Conference on Asphalt Pavements, Copenhagen, Denmark, August 2002 St. Martin, J. and L.A. Cooley, 2003, “Production and Construction Issues for Moisture Sensitivity of Hot-Mix Asphalt Pavements”, Moisture Sensitivity of Asphalt Pavements, A National Seminar, February 4th to 6th, 2003, San Diego, CA, p. 209 – 223. Sugano, M., Iwabuchi, I., Watanabe, T., Kajita J., Iwai*, S., Hirano, K.,(2009), “Thermal Degradation Mechanism of Polymer Modified Asphalt” Department of Materials and
67
Applied Chemistry, *Department of Transportation Engineering and Socio-Technology, Nihon University. Taylor, M. and N.P. Khosla, 1983, “Stripping of Asphalt Pavements: State of the Art”, Transportation Research Record 911, Transportation Research Board, National Research Council, Washington, D.C., p. 150 – 158. Terrel, R. and S. Al-Swailmi, 1994, Water Sensitivity of Asphalt-Aggregate Mixes: Test Selection, SHRP Report A-403, Strategic Highway Research Program, National Research Council, Washington D.C. Wasiuddin, N., S., Selvamohan, M. Zaman, and M. Guegan, 2007, “Comparative Laboratory Study of Sasobit and Aspha-min Additives in Warm-Mix Asphalt”, Transportation Research Record, No. 1998, Transportation Research Board, Washington, D.C., pp. 82 – 88. Yoon, H., 1987, Interface Phenomenon and Surfactants in Asphalt Paving Materials, A Dissertation Submitted for Partial Fulfillment for Doctor of Philosophy, Auburn University. Zhou, F. and Tom Scullion, 2005, “Overlay Tester: A Simple Performance Test for Thermal Reflective Cracking”, Journal of the Association of Asphalt Paving Technologists, Vol. 74, pp. 443 – 484. Zhou, F., S. Hu, and T. Scullion, 2007, Development and Verification of the Overlay Tester Based Fatigue Cracking Prediction Approach, FHWA/TX-07/9-1502-01-8, 90 pp.

68
APPENDIX A – WMA PILOT PROJECT SPECIFICATION
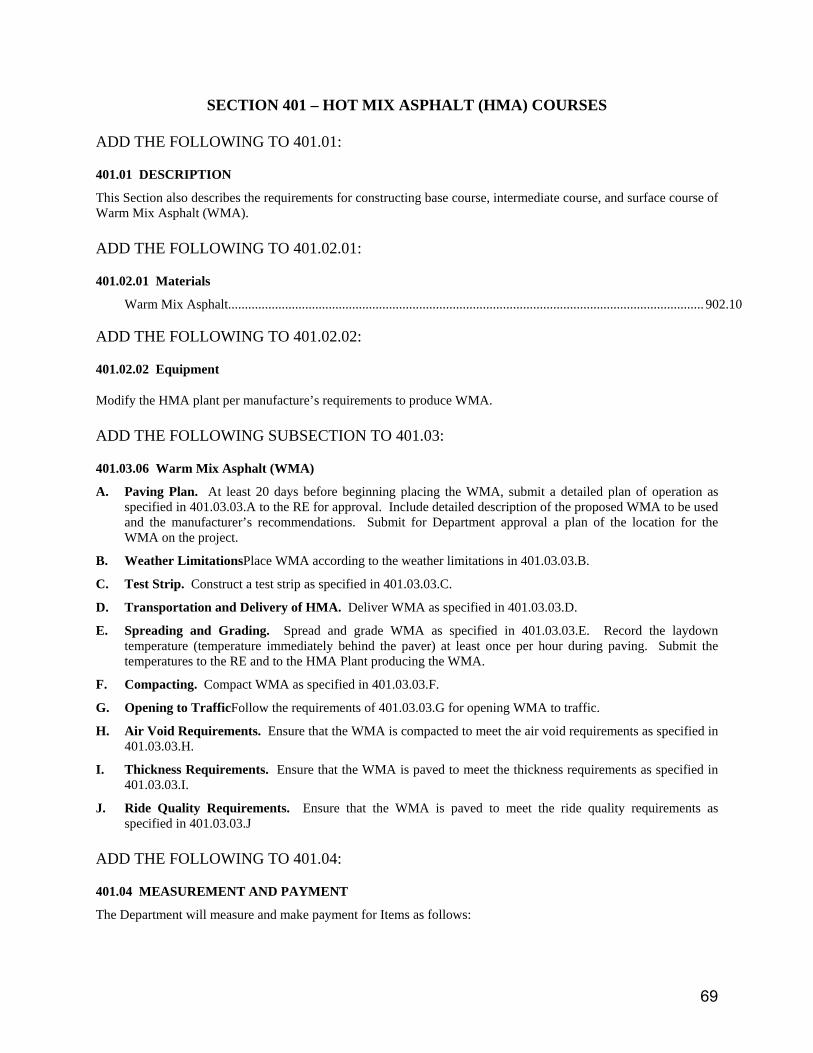
69
SECTION 401 – HOT MIX ASPHALT (HMA) COURSES ADD THE FOLLOWING TO 401.01:
401.01 DESCRIPTION
This Section also describes the requirements for constructing base course, intermediate course, and surface course of Warm Mix Asphalt (WMA). ADD THE FOLLOWING TO 401.02.01:
401.02.01 Materials
Warm Mix Asphalt.............................................................................................................................................. 902.10
ADD THE FOLLOWING TO 401.02.02:
401.02.02 Equipment
Modify the HMA plant per manufacture’s requirements to produce WMA. ADD THE FOLLOWING SUBSECTION TO 401.03:
401.03.06 Warm Mix Asphalt (WMA)
A. Paving Plan. At least 20 days before beginning placing the WMA, submit a detailed plan of operation as specified in 401.03.03.A to the RE for approval. Include detailed description of the proposed WMA to be used and the manufacturer’s recommendations. Submit for Department approval a plan of the location for the WMA on the project.
B. Weather LimitationsPlace WMA according to the weather limitations in 401.03.03.B.
C. Test Strip. Construct a test strip as specified in 401.03.03.C.
D. Transportation and Delivery of HMA. Deliver WMA as specified in 401.03.03.D.
E. Spreading and Grading. Spread and grade WMA as specified in 401.03.03.E. Record the laydown temperature (temperature immediately behind the paver) at least once per hour during paving. Submit the temperatures to the RE and to the HMA Plant producing the WMA.
F. Compacting. Compact WMA as specified in 401.03.03.F.
G. Opening to TrafficFollow the requirements of 401.03.03.G for opening WMA to traffic.
H. Air Void Requirements. Ensure that the WMA is compacted to meet the air void requirements as specified in 401.03.03.H.
I. Thickness Requirements. Ensure that the WMA is paved to meet the thickness requirements as specified in 401.03.03.I.
J. Ride Quality Requirements. Ensure that the WMA is paved to meet the ride quality requirements as specified in 401.03.03.J
ADD THE FOLLOWING TO 401.04:
401.04 MEASUREMENT AND PAYMENT
The Department will measure and make payment for Items as follows:
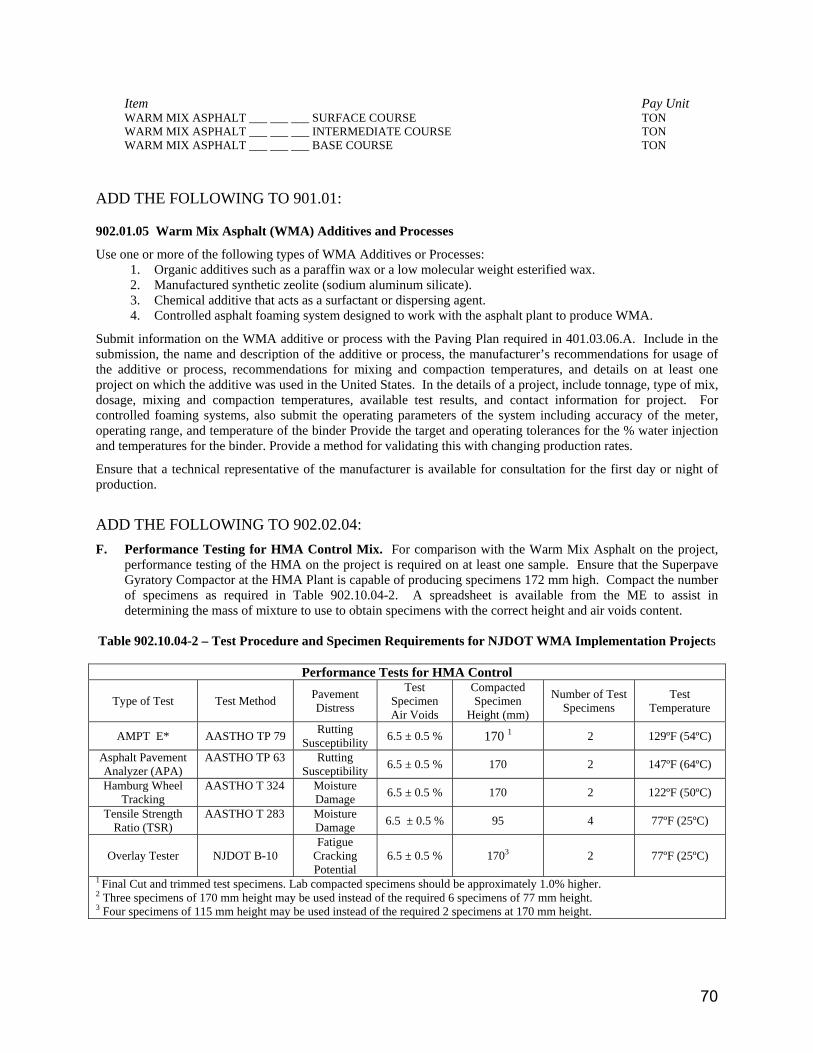
70
Item Pay Unit WARM MIX ASPHALT ___ ___ ___ SURFACE COURSE TON WARM MIX ASPHALT ___ ___ ___ INTERMEDIATE COURSE TON WARM MIX ASPHALT ___ ___ ___ BASE COURSE TON
ADD THE FOLLOWING TO 901.01:
902.01.05 Warm Mix Asphalt (WMA) Additives and Processes
Use one or more of the following types of WMA Additives or Processes: 1. Organic additives such as a paraffin wax or a low molecular weight esterified wax. 2. Manufactured synthetic zeolite (sodium aluminum silicate). 3. Chemical additive that acts as a surfactant or dispersing agent. 4. Controlled asphalt foaming system designed to work with the asphalt plant to produce WMA.
Submit information on the WMA additive or process with the Paving Plan required in 401.03.06.A. Include in the submission, the name and description of the additive or process, the manufacturer’s recommendations for usage of the additive or process, recommendations for mixing and compaction temperatures, and details on at least one project on which the additive was used in the United States. In the details of a project, include tonnage, type of mix, dosage, mixing and compaction temperatures, available test results, and contact information for project. For controlled foaming systems, also submit the operating parameters of the system including accuracy of the meter, operating range, and temperature of the binder Provide the target and operating tolerances for the % water injection and temperatures for the binder. Provide a method for validating this with changing production rates.
Ensure that a technical representative of the manufacturer is available for consultation for the first day or night of production.
ADD THE FOLLOWING TO 902.02.04: F. Performance Testing for HMA Control Mix. For comparison with the Warm Mix Asphalt on the project,
performance testing of the HMA on the project is required on at least one sample. Ensure that the Superpave Gyratory Compactor at the HMA Plant is capable of producing specimens 172 mm high. Compact the number of specimens as required in Table 902.10.04-2. A spreadsheet is available from the ME to assist in determining the mass of mixture to use to obtain specimens with the correct height and air voids content.
Table 902.10.04-2 – Test Procedure and Specimen Requirements for NJDOT WMA Implementation Projects
Performance Tests for HMA Control
Type of Test Test Method Pavement Distress
Test Specimen Air Voids
Compacted Specimen
Height (mm)
Number of Test Specimens
Test Temperature
AMPT E* AASTHO TP 79 Rutting Susceptibility 6.5 ± 0.5 % 170 1 2 129ºF (54ºC)
Asphalt Pavement Analyzer (APA)
AASTHO TP 63 Rutting Susceptibility 6.5 ± 0.5 % 170 2 147ºF (64ºC)
Hamburg Wheel Tracking
AASTHO T 324 Moisture Damage 6.5 ± 0.5 % 170 2 122ºF (50ºC)
Tensile Strength Ratio (TSR)
AASTHO T 283 Moisture Damage 6.5 ± 0.5 % 95 4 77ºF (25ºC)
Overlay Tester NJDOT B-10 Fatigue
Cracking Potential
6.5 ± 0.5 % 1703 2 77ºF (25ºC) 1 Final Cut and trimmed test specimens. Lab compacted specimens should be approximately 1.0% higher. 2 Three specimens of 170 mm height may be used instead of the required 6 specimens of 77 mm height. 3 Four specimens of 115 mm height may be used instead of the required 2 specimens at 170 mm height.
71
Once sampled from the truck prior to leaving the plant, do not keep the asphalt mixtures at compaction temperature for no longer than 30 minutes greater than the anticipated travel time to the field location. For example, if the travel time to the construction site is 30 minutes, then compact the loose mix within 1 hour from the time of sampling. To accurately compare the performance data, it is very important to maintain a similar conditioning time for the mixtures at their respective compaction temperatures. Erratic conditioning times will greatly influence the general stiffness properties of the mixtures and result in bias in the collected performance data. Along with the test specimens, submit the following plant production and construction information:
• Moisture content of stockpiles (if possible) • Set burner temperature • Asphalt mixture discharge temperature • Production rate • Silo storage time • Compaction temperature in field (immediately behind paver) (obtained from the Contractor) • RAP content • Mix Design and lot data sheet
ADD THE FOLLOWING TO 902:
902.10 WARM MIX ASPHALT (WMA)
902.10.01 WMA Definitions and Mix Designations
WMA is a method of producing asphalt pavement at a mixing and compaction temperatures at least 30ºF lower than Hot Mix Asphalt (HMA) using either a WMA additive or a controlled asphalt foaming system. For PG 64-22, normal mixing temperatures are in the range of 300 to 315ºF and normal compaction temperatures are in the range of 285 to 300ºF. For PG 76-22, normal mixing temperatures are in the range of 315 to 325ºF and normal compaction temperatures are in the range of 305 to 315ºF.
The requirements for specific WMA mixtures are identified by the abbreviated fields in the Item description as defined as follows:
WARM MIX ASPHALT 12.5H64 SURFACE COURSE
1. “WARM MIX ASPHALT” “Warm Mix Asphalt” is located in the first field in the Item description for the purpose of identifying the mixture requirements.
2. “12.5” The second field in the Item description designates the nominal maximum size aggregate (in millimeters) for the job mix formula (sizes are 4.75, 9.5, 12.5, 19, 25, and 37.5 mm).
3. “H” The third field in the Item description designates the design compaction level for the job mix formula based on traffic forecasts as listed in Table 902.10.03-2 (levels are L=low, M=medium, and H=high).
4. “64” The fourth field in the Item description designates the high temperature (in °C) of the performance-graded binder (options are 64, 70, and 76 °C). All binders shall have a low temperature of –22 °C, unless otherwise specified.
5. “SURFACE COURSE” The last field in the Item description designates the intended use and location within the pavement structure (options are surface, intermediate, or base course).
902.10.02 Composition of Mixtures
Provide materials as specified:
72
Aggregates for Hot Mix Asphalt ......................................................................................................................... 901.05 Asphalt Binder ............................................................................................................................................... 902.01.01 WMA Additive .............................................................................................................................................. 902.01.05
If a WMA additive is pre-blended in the asphalt binder, ensure that the asphalt binder meets the requirements of the specified grade after the addition of the WMA additive. If a WMA additive is added at the HMA plant, ensure that the addition of the additive will not negatively impact the grade of asphalt binder. Follow the manufacturer’s recommendations for percentage of WMA additive needed.
Mix WMA in a plant that is listed on the QPL for HMA Plants and conforms to the requirements for HMA Plants as specified in 1009.01.
Composition of the mixture for WMA surface course is coarse aggregate, fine aggregate, and asphalt binder, and may also include mineral filler, a WMA additive, and up to 15 percent Reclaimed Asphalt Pavement (RAP). For controlled asphalt foaming system WMA, the Department may require an anti-stripping additive. Ensure that the finished mix does not contain more than a total of 1 percent by weight contamination from Crushed Recycled Container Glass (CRCG).
The composition of the mixture for WMA base or intermediate course is coarse aggregate, fine aggregate, and asphalt binder, and may also include mineral filler, a WMA additive, and up to 35 percent of recycled materials. For controlled asphalt foaming system WMA, the Department may require an anti-stripping additive. The 35 percent of recycled materials may consist of a combination of RAP, CRCG, Ground Bituminous Shingle Material (GBSM), and RPCSA, with the following individual limits:
Table 902.10.02-1 Use of Recycled Materials in HMA Base or Intermediate Course Recycled Material Maximum PercentageRAP 25CRCG 10GBSM 5RPCSA 20
Combine the aggregates to ensure that the resulting mixture meets the grading requirements specified in Table 902.10.03-1. In determining the percentage of aggregates of the various sizes necessary to meet gradation requirements, exclude the asphalt binder.
Ensure that the combined coarse aggregate, when tested according to ASTM D 4791, has less than 10 percent flat and elongated pieces retained on the No. 4 sieve and larger. Measure aggregate using the ratio of 5:1, comparing the length (longest dimension) to the thickness (smallest dimension) of the aggregate particles.
Ensure that the combined fine aggregate in the mixture conforms to the requirements specified in Table 902.10.02-2. Ensure that the material passing the No. 40 sieve is non-plastic when tested according to AASHTO T 90.
Table 902.10.02-2 Additional Fine Aggregate Requirements for WMA
Tests Test Method
Minimum Percent
Uncompacted Void Content of Fine Aggregate
AASHTO T 304, Method A 45
Sand Equivalent AASHTO T 176 45
902.10.03 Mix Design
For production of WMA, use an HMA mix design that meets the requirements of 902.02.03 and has been approved by the ME.

73
Test the mix design to ensure that it meets a minimum tensile strength ratio of 80 percent, when tested according to AASHTO T 283. If a controlled foaming system is used to produce the WMA, produce specimens for tensile strength ratio from plant produced mix. The ME will require tensile strength ratio testing for all WMA mixes.
For WMA mix design verification, submit with the mix design forms 2 gyratory specimens and 1 loose sample corresponding to the composition of the JMF. For controlled asphalt foaming systems, produce the specimens from material produced from the plant using the controlled asphalt foaming system. The ME will use these to verify the properties of the JMF. Compact the specimens to the design number of gyrations (Ndes). For the mix design to be acceptable, all gyratory specimens must comply with the requirements specified in Table 902.10.03-1 and Table 902.10.03-3. The ME reserves the right to be present at the time the gyratory specimens are molded. For controlled asphalt foaming system mixes, the ME will approve the mix for only the plant that was used in producing the mix for verification.
In addition, submit samples as detailed in 902.10.04.E for performance testing of the WMA mixture. The ME will perform performance testing of the WMA for final approval of the mix design.
902.10.04 Sampling and Testing
A. General Acceptance Requirements. The RE or ME may reject and require disposal of any batch or shipment that is rendered unfit for its intended use due to contamination, segregation, improper temperature, lumps of cold material, or incomplete coating of the aggregate. For other than improper temperature, visual inspection of the material by the RE or ME is considered sufficient grounds for such rejection.
For WMA, ensure that the temperature of the mixture at discharge from the plant or surge and storage bins meets the WMA manufacturer’s recommendations. Do not allow the mixture temperature to exceed 300°F at discharge from the plant.
Combine and mix the aggregates and asphalt binder to ensure that at least 95 percent of the coarse aggregate particles are entirely coated with asphalt binder as determined according to AASHTO T 195. If the ME determines that there is an on-going problem with coating, the ME may obtain random samples from 5 trucks and will determine the adequacy of the mixing on the average of particle counts made on these 5 test portions. If the requirement for 95 percent coating is not met on each sample, modify plant operations, as necessary, to obtain the required degree of coating.
Ensure that the equipment for controlled asphalt foaming system is running according to the manufacturer’s recommendations. Ensure that the metering of water and temperature of the binder for foaming the asphalt is controlled to produce a uniform mixture.
B. Sampling. The ME will take 5 stratified random samples of WMA for volumetric acceptance testing from each lot of approximately 3500 tons of a mix. When a lot of WMA is less than 3500 tons, the ME will take samples at random for each mix at the rate of one sample for each 700 tons. The ME will perform sampling according to AASHTO T 168, NJDOT B-2, or ASTM D 3665.
Use a portion of the samples taken for volumetric acceptance testing for composition testing.
C. Quality Control Testing. The WMA producer shall provide a quality control (QC) technician who is certified by the Society of Asphalt Technologists of New Jersey as an Asphalt Technologist, Level 2. The QC technician may substitute equivalent technician certification by the Mid-Atlantic Region Technician Certification Program (MARTCP). Ensure that the QC technician is present during periods of mix production for the sole purpose of quality control testing and to assist the ME. The ME will not perform the quality control testing or other routine test functions in the absence of, or instead of, the QC technician.
The QC technician shall perform sampling and testing according to the approved quality control plan, to keep the mix within the limits specified for the mix being produced. The QC technician may use acceptance test results or perform additional testing as necessary to control the mix.
To determine the composition, perform ignition oven testing according to AASHTO T 308.
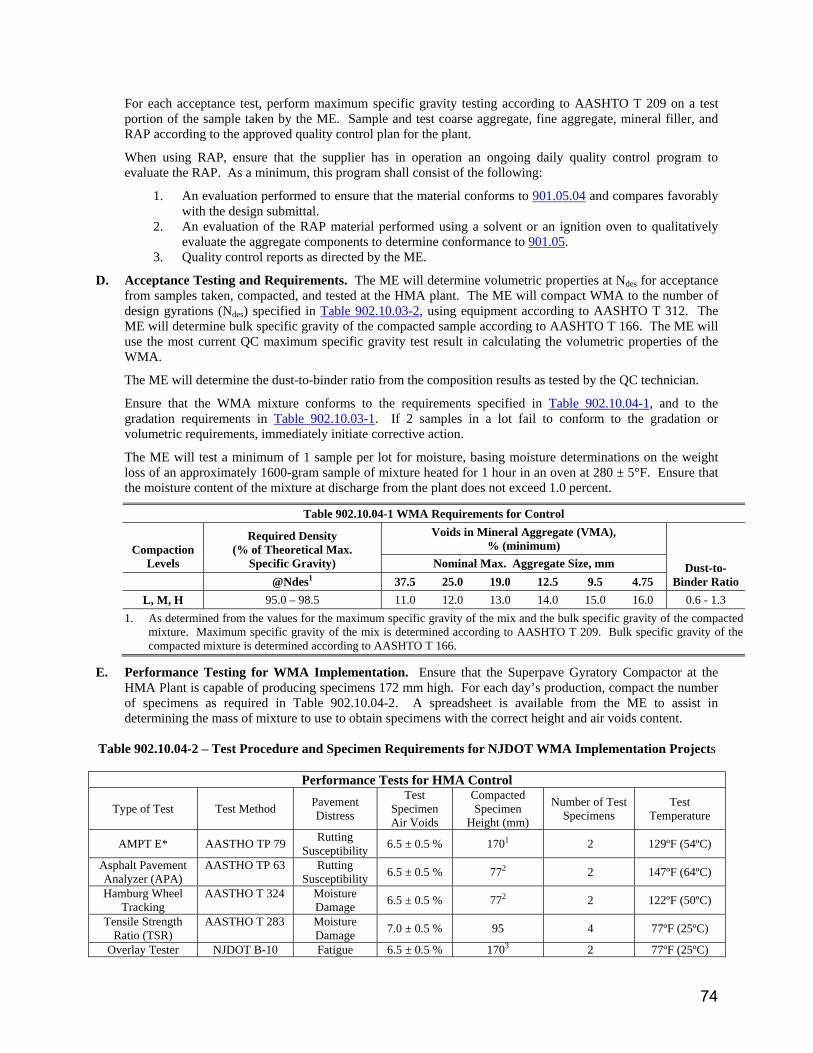
74
For each acceptance test, perform maximum specific gravity testing according to AASHTO T 209 on a test portion of the sample taken by the ME. Sample and test coarse aggregate, fine aggregate, mineral filler, and RAP according to the approved quality control plan for the plant.
When using RAP, ensure that the supplier has in operation an ongoing daily quality control program to evaluate the RAP. As a minimum, this program shall consist of the following:
1. An evaluation performed to ensure that the material conforms to 901.05.04 and compares favorably with the design submittal.
2. An evaluation of the RAP material performed using a solvent or an ignition oven to qualitatively evaluate the aggregate components to determine conformance to 901.05.
3. Quality control reports as directed by the ME.
D. Acceptance Testing and Requirements. The ME will determine volumetric properties at Ndes for acceptance from samples taken, compacted, and tested at the HMA plant. The ME will compact WMA to the number of design gyrations (Ndes) specified in Table 902.10.03-2, using equipment according to AASHTO T 312. The ME will determine bulk specific gravity of the compacted sample according to AASHTO T 166. The ME will use the most current QC maximum specific gravity test result in calculating the volumetric properties of the WMA.
The ME will determine the dust-to-binder ratio from the composition results as tested by the QC technician.
Ensure that the WMA mixture conforms to the requirements specified in Table 902.10.04-1, and to the gradation requirements in Table 902.10.03-1. If 2 samples in a lot fail to conform to the gradation or volumetric requirements, immediately initiate corrective action.
The ME will test a minimum of 1 sample per lot for moisture, basing moisture determinations on the weight loss of an approximately 1600-gram sample of mixture heated for 1 hour in an oven at 280 ± 5°F. Ensure that the moisture content of the mixture at discharge from the plant does not exceed 1.0 percent.
Table 902.10.04-1 WMA Requirements for Control
Compaction Levels
Required Density (% of Theoretical Max.
Specific Gravity)
Voids in Mineral Aggregate (VMA), % (minimum)
Dust-to-Binder Ratio
Nominal Max. Aggregate Size, mm @Ndes1 37.5 25.0 19.0 12.5 9.5 4.75
L, M, H 95.0 – 98.5 11.0 12.0 13.0 14.0 15.0 16.0 0.6 - 1.3 1. As determined from the values for the maximum specific gravity of the mix and the bulk specific gravity of the compacted
mixture. Maximum specific gravity of the mix is determined according to AASHTO T 209. Bulk specific gravity of the compacted mixture is determined according to AASHTO T 166.
E. Performance Testing for WMA Implementation. Ensure that the Superpave Gyratory Compactor at the HMA Plant is capable of producing specimens 172 mm high. For each day’s production, compact the number of specimens as required in Table 902.10.04-2. A spreadsheet is available from the ME to assist in determining the mass of mixture to use to obtain specimens with the correct height and air voids content.
Table 902.10.04-2 – Test Procedure and Specimen Requirements for NJDOT WMA Implementation Projects
Performance Tests for HMA Control
Type of Test Test Method Pavement Distress
Test Specimen Air Voids
Compacted Specimen
Height (mm)
Number of Test Specimens
Test Temperature
AMPT E* AASTHO TP 79 Rutting Susceptibility 6.5 ± 0.5 % 1701 2 129ºF (54ºC)
Asphalt Pavement Analyzer (APA)
AASTHO TP 63 Rutting Susceptibility 6.5 ± 0.5 % 772 2 147ºF (64ºC)
Hamburg Wheel Tracking
AASTHO T 324 Moisture Damage 6.5 ± 0.5 % 772 2 122ºF (50ºC)
Tensile Strength Ratio (TSR)
AASTHO T 283 Moisture Damage 7.0 ± 0.5 % 95 4 77ºF (25ºC)
Overlay Tester NJDOT B-10 Fatigue 6.5 ± 0.5 % 1703 2 77ºF (25ºC)

75
Cracking Potential
1 Final Cut and trimmed test specimens. Lab compacted specimens should be approximately 1.0% higher. 2 Three specimens of 170 mm height may be used instead of the required 6 specimens of 77 mm height. 3 Four specimens of 115 mm height may be used instead of the required 2 specimens at 170 mm height.
Once sampled from the truck prior to leaving the plant, do not keep the asphalt mixtures at compaction temperature for no longer than 30 minutes greater than the anticipated travel time to the field location. For example, if the travel time to the construction site is 30 minutes, then compact the loose mix within 1 hour from the time of sampling. To accurately compare the performance data, it is very important to maintain a similar conditioning time for the mixtures at their respective compaction temperatures. Erratic conditioning times will greatly influence the general stiffness properties of the mixtures and result in bias in the collected performance data. Along with the test specimens, submit the following plant production and construction information:
• Moisture content of stockpiles (if possible) • Set burner temperature • Asphalt mixture discharge temperature • Production rate • Silo storage time • Compaction temperature in field (immediately behind paver) (obtained from the Contractor) • RAP content • Mix Design and lot data sheet • Binder grade, supplier, and lot number • For controlled foaming system, details on the settings for the foaming system
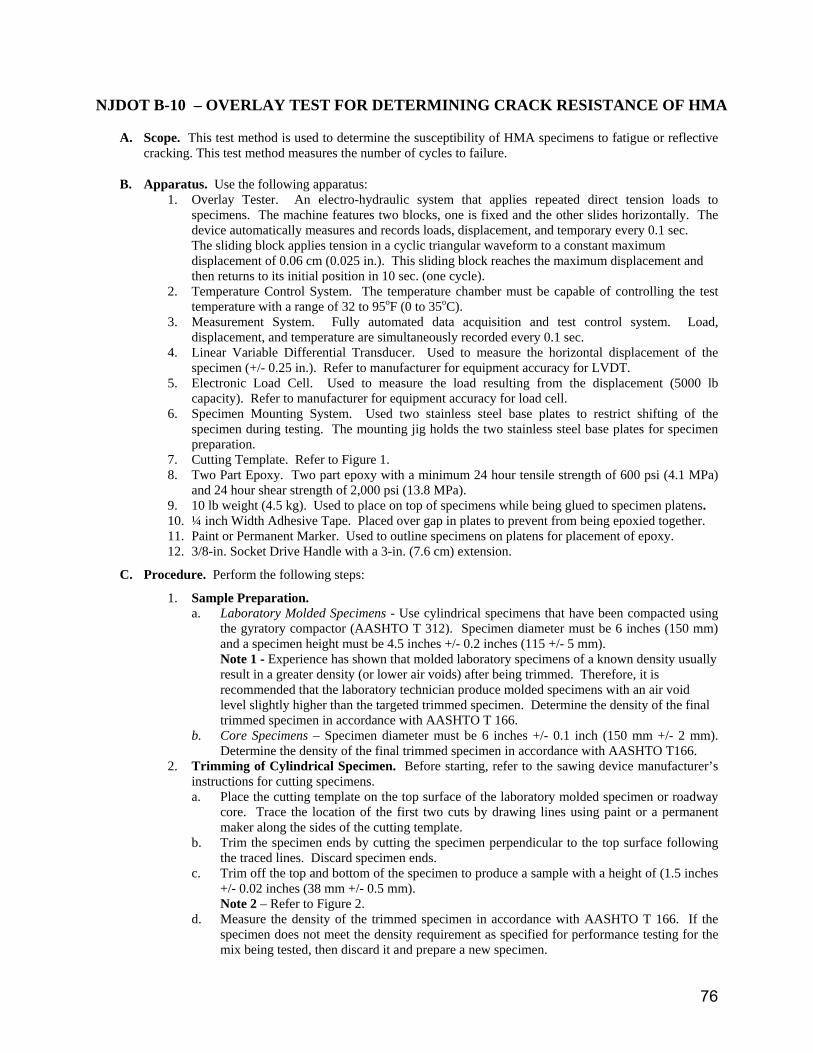
76
NJDOT B-10 – OVERLAY TEST FOR DETERMINING CRACK RESISTANCE OF HMA
A. Scope. This test method is used to determine the susceptibility of HMA specimens to fatigue or reflective cracking. This test method measures the number of cycles to failure.
B. Apparatus. Use the following apparatus: 1. Overlay Tester. An electro-hydraulic system that applies repeated direct tension loads to
specimens. The machine features two blocks, one is fixed and the other slides horizontally. The device automatically measures and records loads, displacement, and temporary every 0.1 sec. The sliding block applies tension in a cyclic triangular waveform to a constant maximum displacement of 0.06 cm (0.025 in.). This sliding block reaches the maximum displacement and then returns to its initial position in 10 sec. (one cycle).
2. Temperature Control System. The temperature chamber must be capable of controlling the test temperature with a range of 32 to 95oF (0 to 35oC).
3. Measurement System. Fully automated data acquisition and test control system. Load, displacement, and temperature are simultaneously recorded every 0.1 sec.
4. Linear Variable Differential Transducer. Used to measure the horizontal displacement of the specimen (+/- 0.25 in.). Refer to manufacturer for equipment accuracy for LVDT.
5. Electronic Load Cell. Used to measure the load resulting from the displacement (5000 lb capacity). Refer to manufacturer for equipment accuracy for load cell.
6. Specimen Mounting System. Used two stainless steel base plates to restrict shifting of the specimen during testing. The mounting jig holds the two stainless steel base plates for specimen preparation.
7. Cutting Template. Refer to Figure 1. 8. Two Part Epoxy. Two part epoxy with a minimum 24 hour tensile strength of 600 psi (4.1 MPa)
and 24 hour shear strength of 2,000 psi (13.8 MPa). 9. 10 lb weight (4.5 kg). Used to place on top of specimens while being glued to specimen platens. 10. ¼ inch Width Adhesive Tape. Placed over gap in plates to prevent from being epoxied together. 11. Paint or Permanent Marker. Used to outline specimens on platens for placement of epoxy. 12. 3/8-in. Socket Drive Handle with a 3-in. (7.6 cm) extension.
C. Procedure. Perform the following steps:
1. Sample Preparation. a. Laboratory Molded Specimens - Use cylindrical specimens that have been compacted using
the gyratory compactor (AASHTO T 312). Specimen diameter must be 6 inches (150 mm) and a specimen height must be 4.5 inches +/- 0.2 inches (115 +/- 5 mm). Note 1 - Experience has shown that molded laboratory specimens of a known density usually result in a greater density (or lower air voids) after being trimmed. Therefore, it is recommended that the laboratory technician produce molded specimens with an air void level slightly higher than the targeted trimmed specimen. Determine the density of the final trimmed specimen in accordance with AASHTO T 166.
b. Core Specimens – Specimen diameter must be 6 inches +/- 0.1 inch (150 mm +/- 2 mm). Determine the density of the final trimmed specimen in accordance with AASHTO T166.
2. Trimming of Cylindrical Specimen. Before starting, refer to the sawing device manufacturer’s instructions for cutting specimens. a. Place the cutting template on the top surface of the laboratory molded specimen or roadway
core. Trace the location of the first two cuts by drawing lines using paint or a permanent maker along the sides of the cutting template.
b. Trim the specimen ends by cutting the specimen perpendicular to the top surface following the traced lines. Discard specimen ends.
c. Trim off the top and bottom of the specimen to produce a sample with a height of (1.5 inches +/- 0.02 inches (38 mm +/- 0.5 mm). Note 2 – Refer to Figure 2.
d. Measure the density of the trimmed specimen in accordance with AASHTO T 166. If the specimen does not meet the density requirement as specified for performance testing for the mix being tested, then discard it and prepare a new specimen.
77
e. Air dry the trimmed specimen to constant mass, where constant mass is defined as the weight of the trimmed specimen not changing by more than 0.05% in a 2 hour interval.
3. Mounting Trimmed Specimen to Base Plates (Platens). a. Mount and secure the base plates (platens) to the mounting jig. Cut a piece of adhesive tape
approximately 4.0 inches (102 mm) in length. Center and place the piece of tape over the gap between the base plates.
b. Prepare the epoxy following manufacturer’s instructions. c. Cover a majority of the base plates (platens) with epoxy, including the tape. Glue the
trimmed specimen to the base plates. d. Place a 10 lb (4.5 kg) weight on top of the glued specimen to ensure full contact of the
trimmed specimen to the base plates. Allow the epoxy to cure for the time recommended by the manufacturer. Remove the weight from the specimen after the epoxy has cured.
e. Turn over the glued specimen so the bottom of the base plates faces upward. Using a hacksaw, cut a notch through the epoxy which can be seen through the gap in the base plates. The notch should be cut as evenly as possible and should just begin to reach the specimen underneath the epoxy. Great care should be taken not to cut more than 1/16 inch (1.58 mm) into the specimen.
f. Place the test sample assembly in the Overlay Tester’s environmental chamber for a minimum of 1 hour before testing.
4. Start Testing Device. Please refer to manufacturer’s equipment manual prior to operating equipment. a. Turn on the Overlay Tester. Turn on the computer and wait to ensure communication
between the computer and the Overlay Tester occurs. b. Turn on the hydraulic pump using the Overlay Tester’s software. Allow the pump to warm
up for a minimum of 20 minutes. c. Turn the machine to load control mode to mount the sample assembly.
5. Mounting Specimen Assembly to Testing Device. Enter the required test information into the Overlay Tester software for the specimen to be tested. a. Mount the specimen assembly onto the machine according to the manufacturer’s instructions
and the following procedural steps. 1. Clean the bottom of the base plates and the top of the testing machine blocks before
placing the specimen assembly into the blocks. If all four surfaces are not clean, damage may occur to the machine, the specimen, or the base plates when tightening the base plates.
2. Apply 15 lb-in of torque for each screw when fastening the base plates to the machine. 6. Testing Specimen.
a. Perform testing at a constant temperature recommended by the New Jersey Department of Transportation for the mixture in question. This is typically either 59oF (15oC) or 77oF (25oC). Note 3 – Ensure the trimmed specimen has also reached the constant temperature required.
b. Start the test by enabling the start button on the computer control program. Perform testing until a 93% reduction or more of the maximum load measured from the first opening cycle occurs. If 93% is not reached, run the test until a minimum of 1,200 cycles.
c. After the test is complete, remove the specimen assembly from the Overlay Tester machine blocks.
D. Report. Include the following items in the report:
1. Date and time molded or cored. 2. NJDOT mixture identification. 3. Trimmed specimen density. 4. Starting Load. 5. Final Load. 6. Percent decline (or reduction) in Load. 7. Number of cycles until failure. 8. Test Temperature.
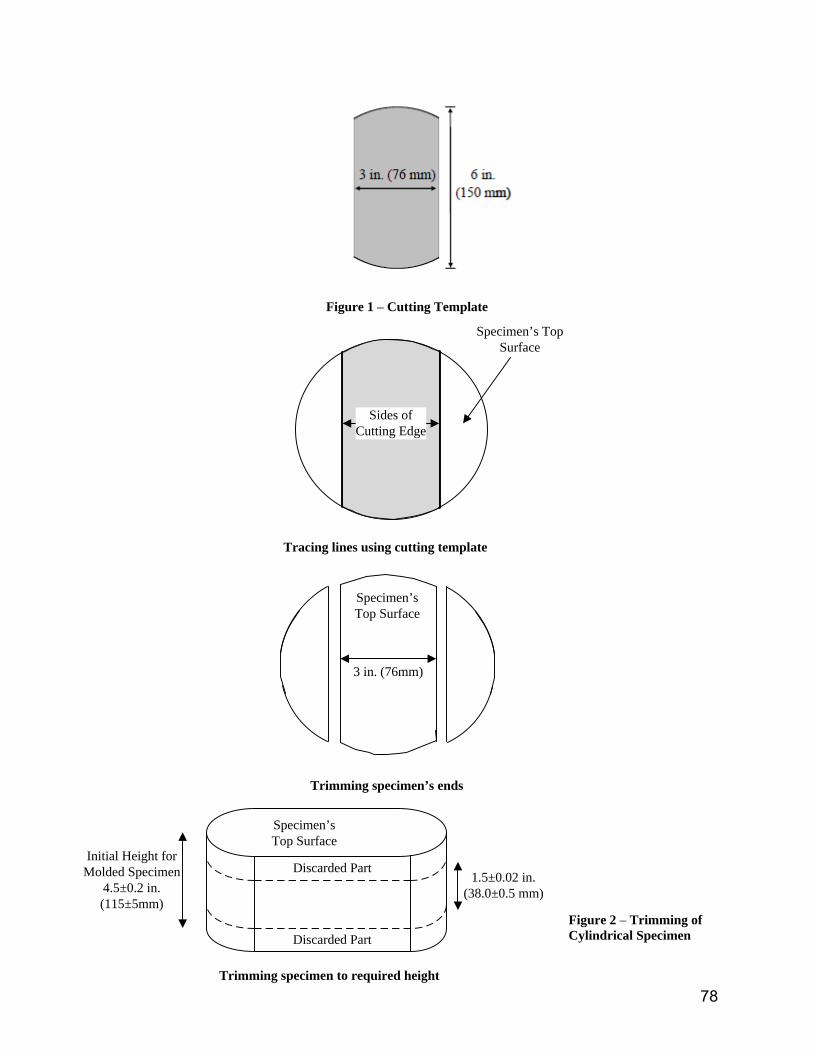
78
Figure 1 – Cutting Template
Figure 2 – Trimming of Cylindrical Specimen
Tracing lines using cutting template
Sides of Cutting Edge
Specimen’s Top Surface
Trimming specimen’s ends
3 in. (76mm)
Specimen’s Top Surface
Trimming specimen to required height
Discarded Part
Discarded Part
1.5±0.02 in. (38.0±0.5 mm)
Initial Height for Molded Specimen
4.5±0.2 in.(115±5mm)
Specimen’sTop Surface


