
Electromembrane Extraction of Biologically Active Substances –
Investigation of Fundamental Aspects
Thesis for the degree Philosophiae Doctor
by
Knut Fredrik Seip
Department of Pharmaceutical Chemistry
School of Pharmacy
University of Oslo
Norway
© Knut Fredrik Seip, 2014 Series of dissertations submitted to the Faculty of Mathematics and Natural Sciences, University of Oslo No. 1501 ISSN 1501-7710 All rights reserved. No part of this publication may be reproduced or transmitted, in any form or by any means, without permission. Cover: Inger Sandved Anfinsen. Printed in Norway: AIT Oslo AS. Produced in co-operation with Akademika Publishing. The thesis is produced by Akademika Publishing merely in connection with the thesis defence. Kindly direct all inquiries regarding the thesis to the copyright holder or the unit which grants the doctorate.
PhD thesis Knut Fredrik Seip Content
1
CONTENT
ACKNOWLEDGEMENTS .................................................................................................................. 3
LIST OF PAPERS ................................................................................................................................. 5
ABBREVIATIONS ............................................................................................................................... 7
ABSTRACT ........................................................................................................................................... 8
1 INTRODUCTION ....................................................................................................................... 11
1.1 Importance of sample preparation in bioanalysis ............................................................ 11
1.2 Supported liquid membranes in sample preparation ...................................................... 12
1.3 The use of electric fields as a driving force in sample preparation ................................. 14
1.4 Microextraction techniques ................................................................................................ 17
1.4.1 Microextractions into a solid phase ............................................................................... 18
1.4.2 Microextractions into a liquid phase ............................................................................. 19
1.4.3 Hollow fiber liquid phase microextraction .................................................................... 20
1.5 Electromembrane extraction .............................................................................................. 23
1.5.1 Introduction to the EME principle ................................................................................. 24
1.5.2 Extraction theory and kinetics ....................................................................................... 25
1.5.3 Factors of importance for extraction ............................................................................. 27
1.5.4 Modifications to the original EME format .................................................................... 30
1.5.5 Applications and performance of EME ......................................................................... 31
2 AIM OF THE STUDY ................................................................................................................ 35
3 RESULTS AND DISCUSSION .................................................................................................. 36
3.1 Selection of model analytes and extraction conditions ..................................................... 36
3.1.1 Extraction conditions and technical setup ..................................................................... 36
3.1.2 Model analytes .............................................................................................................. 37
3.2 Investigation of theoretical aspects of EME ...................................................................... 41
3.2.1 A phenomenological theoretical model for the extraction process ............................... 41
3.2.2 Characteristics of the SLM ............................................................................................ 43
3.2.3 Recovery and kinetics when extracting from partly organic matrices .......................... 50
3.2.4 Recovery and kinetics when extracting from samples containing substantial amounts of salts ............................................................................................................. 52
3.3 Stability considerations in EME ........................................................................................ 54
3.3.1 Current levels ................................................................................................................ 55
3.3.2 SLM solvents ................................................................................................................. 56
3.3.3 Stability when extracting from partly organic matrices ................................................ 57
PhD thesis Knut Fredrik Seip Content
2
3.4 Tuning the EME system to different applications ............................................................ 58
3.4.1 Unpolar basic drugs (log P > 2) ..................................................................................... 59
3.4.2 Dried blood spot eluate .................................................................................................. 61
3.4.3 Peptides ......................................................................................................................... 63
CONCLUDING REMARKS .............................................................................................................. 65
REFERENCES .................................................................................................................................... 67
PAPERS I-V
PhD thesis Knut Fredrik Seip Acknowledgements
3
ACKNOWLEDGEMENTS The research behind this thesis was performed at the Department of Pharmaceutical
Chemistry, School of Pharmacy, University of Oslo in the period from August 2010 to March
2014.
First of all I would like to thank my supervisors Stig Pedersen-Bjergaard and Astrid Gjelstad
for excellent supervision and support during the work with this thesis. Without your inspiring
ideas and solutions to all the challenges we have met during these last years, this task would
have been a lot more difficult. Even when I have been in doubt about where a project is going,
I have always been more optimistic after our meetings. You have a unique ability to see
exactly what is needed to do things even better, and I have learned a lot by having you as my
supervisors.
I would also like to thank all my co-authors: Henrik Jensen, Marte Balchen, Jeanette Stigsson,
Marit Hovde Sønsteby, Moheba Faizi, Cristina Vergel, and Thanh Elisabeth Kieu. You have
all done an excellent contribution to the work behind this thesis.
My master students, Marit, Kari, Sara, and Moheba also deserve extra gratitude for their hard
work in the lab and positive attitude. Your lab work and the discussions we had have been
inspiring and have helped a great deal in our projects.
The working environment has of course a great deal to do with motivation at work, and in this
area there has been nothing to complain about. You have all been excellent colleagues, and I
will miss working with all of you and going to conferences with you, especially my fellow
PhD students: Lars Erik, Silje, Siri VE, Siri H, Cecilia, Cecilie, and Chuixiu. Our office talks
have made almost every day fun.
Special thanks go to my dear friend and colleague Silje Bøen Torsetnes. All our lunch and
coffee breaks with discussions about absolutely everything, both work related and not, has
been very important to me. You almost qualify as a co-author on all my articles. It has been a
rare privilege to work together for all these years, and I am very thankful for that.
My family and friends also deserve a warm thank you. I have chosen a quite different path
than most of you, and even though much of what I have been doing might have seemed
strange and difficult to talk about, you should know that you have helped me a lot by the
support you have been showing. Especially to my parents and sister: you have always been

PhD thesis Knut Fredrik Seip Acknowledgements
4
there for me and supported me in what I have been doing. I am very grateful for that and all
your help to make me reach where I am today.
Finally, special thanks go to my wonderful girlfriend Kotryna for always supporting me and
believing in me. You manage to make me put work aside even in stressful periods. Coming
home to you has always cheered me up, no matter what mood I am in.
Oslo, February 2014
Knut Fredrik Seip
PhD thesis Knut Fredrik Seip List of papers
5
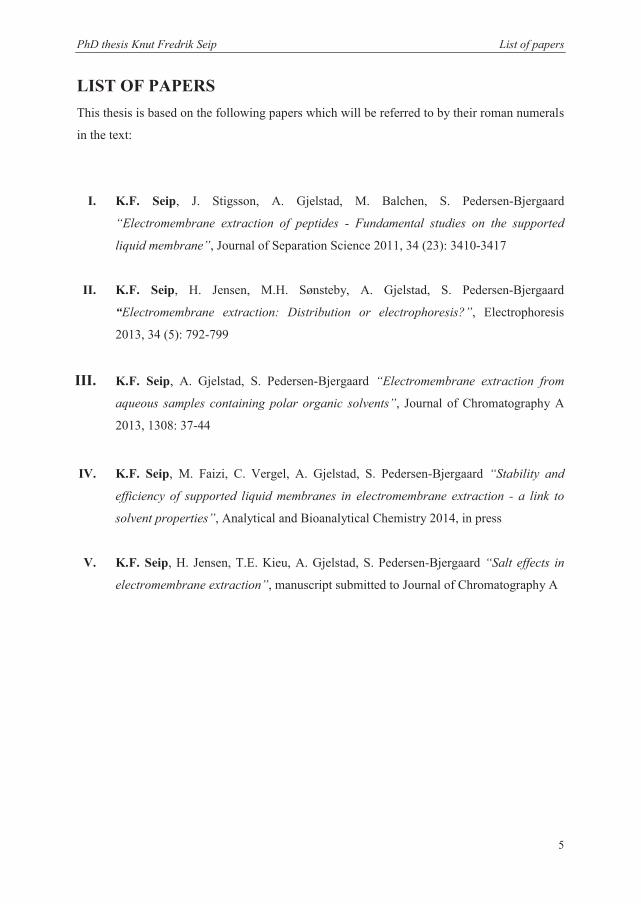
LIST OF PAPERS This thesis is based on the following papers which will be referred to by their roman numerals
in the text:
I. K.F. Seip, J. Stigsson, A. Gjelstad, M. Balchen, S. Pedersen-Bjergaard
“Electromembrane extraction of peptides - Fundamental studies on the supported
liquid membrane”, Journal of Separation Science 2011, 34 (23): 3410-3417
II. K.F. Seip, H. Jensen, M.H. Sønsteby, A. Gjelstad, S. Pedersen-Bjergaard
“Electromembrane extraction: Distribution or electrophoresis?”, Electrophoresis
2013, 34 (5): 792-799
III. K.F. Seip, A. Gjelstad, S. Pedersen-Bjergaard “Electromembrane extraction from
aqueous samples containing polar organic solvents”, Journal of Chromatography A
2013, 1308: 37-44
IV. K.F. Seip, M. Faizi, C. Vergel, A. Gjelstad, S. Pedersen-Bjergaard “Stability and
efficiency of supported liquid membranes in electromembrane extraction - a link to
solvent properties”, Analytical and Bioanalytical Chemistry 2014, in press
V. K.F. Seip, H. Jensen, T.E. Kieu, A. Gjelstad, S. Pedersen-Bjergaard “Salt effects in
electromembrane extraction”, manuscript submitted to Journal of Chromatography A
PhD thesis Knut Fredrik Seip List of papers
6
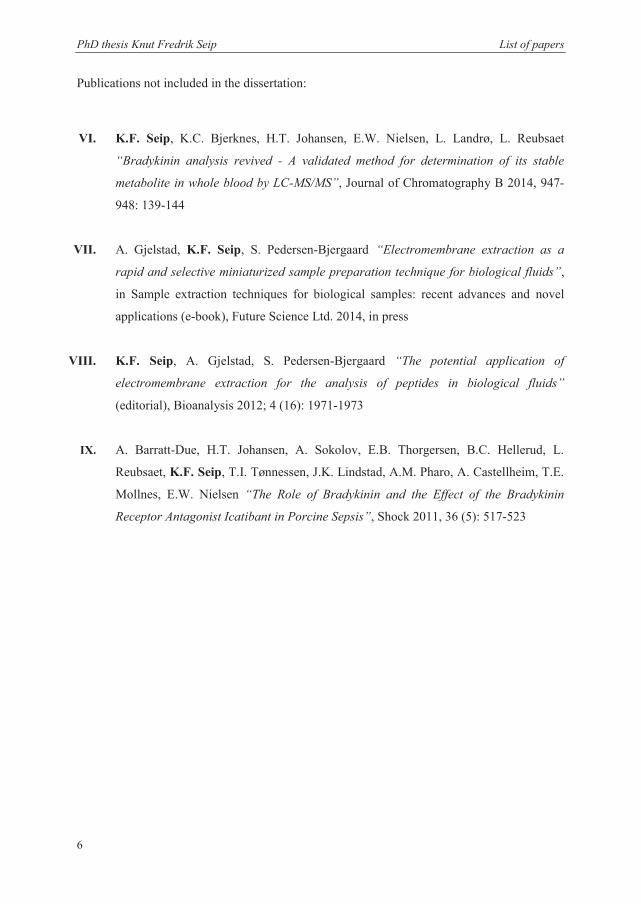
Publications not included in the dissertation:
VI. K.F. Seip, K.C. Bjerknes, H.T. Johansen, E.W. Nielsen, L. Landrø, L. Reubsaet
“Bradykinin analysis revived - A validated method for determination of its stable
metabolite in whole blood by LC-MS/MS”, Journal of Chromatography B 2014, 947-
948: 139-144
VII. A. Gjelstad, K.F. Seip, S. Pedersen-Bjergaard “Electromembrane extraction as a
rapid and selective miniaturized sample preparation technique for biological fluids”,
in Sample extraction techniques for biological samples: recent advances and novel
applications (e-book), Future Science Ltd. 2014, in press
VIII. K.F. Seip, A. Gjelstad, S. Pedersen-Bjergaard “The potential application of
electromembrane extraction for the analysis of peptides in biological fluids”
(editorial), Bioanalysis 2012; 4 (16): 1971-1973
IX. A. Barratt-Due, H.T. Johansen, A. Sokolov, E.B. Thorgersen, B.C. Hellerud, L.
Reubsaet, K.F. Seip, T.I. Tønnessen, J.K. Lindstad, A.M. Pharo, A. Castellheim, T.E.
Mollnes, E.W. Nielsen “The Role of Bradykinin and the Effect of the Bradykinin
Receptor Antagonist Icatibant in Porcine Sepsis”, Shock 2011, 36 (5): 517-523
PhD thesis Knut Fredrik Seip Abbreviations
7
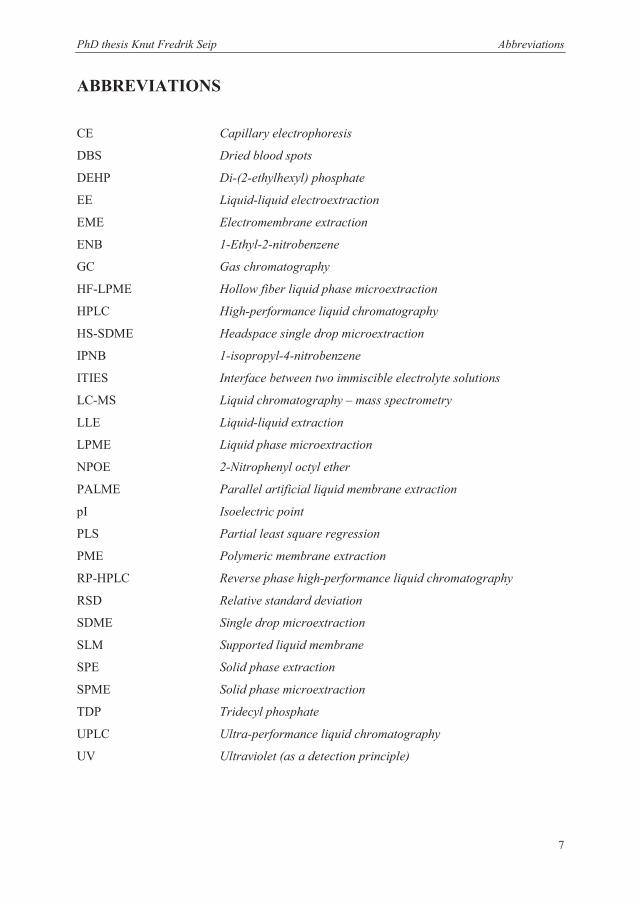
ABBREVIATIONS
CE Capillary electrophoresis
DBS Dried blood spots
DEHP Di-(2-ethylhexyl) phosphate
EE Liquid-liquid electroextraction
EME Electromembrane extraction
ENB 1-Ethyl-2-nitrobenzene
GC Gas chromatography
HF-LPME Hollow fiber liquid phase microextraction
HPLC High-performance liquid chromatography
HS-SDME Headspace single drop microextraction
IPNB 1-isopropyl-4-nitrobenzene
ITIES Interface between two immiscible electrolyte solutions
LC-MS Liquid chromatography – mass spectrometry
LLE Liquid-liquid extraction
LPME Liquid phase microextraction
NPOE 2-Nitrophenyl octyl ether
PALME Parallel artificial liquid membrane extraction
pI Isoelectric point
PLS Partial least square regression
PME Polymeric membrane extraction
RP-HPLC Reverse phase high-performance liquid chromatography
RSD Relative standard deviation
SDME Single drop microextraction
SLM Supported liquid membrane
SPE Solid phase extraction
SPME Solid phase microextraction
TDP Tridecyl phosphate
UPLC Ultra-performance liquid chromatography
UV Ultraviolet (as a detection principle)
PhD thesis Knut Fredrik Seip Abstract
8
ABSTRACT Electromembrane extraction (EME) was introduced in 2006 as a fast and selective
microextraction technique that offered good recoveries for basic analytes. Since then, more
than 90 publications have been presented on the technique in various applications and
technical setups. The principle is based on extraction of analytes across a thin supported
liquid membrane (SLM) by the use of an electric field. Several key parameters for an efficient
EME setup has been described previously, but systematic knowledge about the extraction
process and the importance of the SLM was lacking at the beginning of this PhD project. The
main objective of the work with this thesis was to further develop the theoretical
understanding of EME on biologically active substances and to build systematic knowledge
about the extraction process. Special attention has been given to the SLM, distribution of
analytes throughout the EME system over time, stability of the EME system, and how the
extraction process was affected by high amounts of either salts or organic solvents in the
sample solution.
In paper I, a screening of different SLM compositions for the extraction of eight model
peptides with EME was performed. The model peptides were selected to represent a broad
range of physical chemical parameters. This paper confirmed previous findings on the
importance of combining an organic solvent with a carrier for efficient extractions, as well as
identifying several new compositions of carriers and solvents that were effective as SLMs.
The effective compositions comprised a mono- or dialkylated phosphate acting as a carrier
and a primary alcohol or ketone acting as a solvent. Especially the combination 2-octanone
and tridecyl phosphate (9:1 w/w) was shown to give higher extraction recoveries and lower
standard deviations than previously reported SLMs.
In paper II, a phenomenological theoretical model for the time dependent distribution of
analytes in EME was presented and experimentally verified on several unpolar basic drugs
and peptides, representing a broad range of physical chemical properties. Distribution profiles
were made, where the amount of analytes in the sample, SLM, and acceptor solution at
different extraction times were investigated. The distribution profiles were in good
accordance with the theoretical model, but a deviation was seen for some of the peptides
where a relatively high amount became trapped in the membrane. The resulting observations
demonstrated that the mass transfer across the SLM in EME had elements of both a
PhD thesis Knut Fredrik Seip Abstract
9
distributive and electrophoretic process. This can be seen from the theoretical model by the
inclusion of a voltage dependent distribution coefficient.
In paper III, EME was performed on samples containing a substantial amount of the organic
solvents ethanol, methanol, dimethyl sulfoxide, or acetonitrile together with five unpolar basic
drugs as model analytes. The main purpose was to investigate the stability and efficiency of
EME when organic solvents were present in the sample. When nitrophenyl octyl ether (NPOE)
was used as SLM, stable extractions were achieved from samples containing up to 50 % (v/v)
ethanol or methanol, and up to 75 % (v/v) dimethyl sulfoxide. Acetonitrile partially dissolved
the SLM solvent, and samples containing acetonitrile were unsuitable for EME. The
maximum recovery was unaffected by the presence of organic solvent in the sample, but the
time to reach this level increased from 5-10 minutes to 15-25 minutes. A practical example of
these discoveries was successfully performed on the highly organic eluate from a commercial
dried blood spot card.
In paper IV, a large systematic screening of 61 potential SLM solvents in EME was
performed and evaluated according to stability during extractions and their ability to give high
extraction recoveries for five unpolar basic model drugs. Several relevant solvent properties
were correlated to these parameters through partial least square regression (PLS) analysis. The
efficient EME solvents were characterized with a low water solubility (<0.5 g/L), high dipole
moments, high proton acceptor properties, and low proton donor properties. Especially some
nitroaromatics and ketones belonged to this group, and several efficient solvents that had not
been previously described were identified from these criteria. Some solvents were classified
as unsuitable because they gave a high extraction current, often combined with an
electroosmotic flow of water through the SLM. This was solvents with a low log P value and
high water solubility. Finally, some solvents were inefficient and provided no extraction
recovery. These were solvents with a high log P value (log P > 4).
In paper V, EME was performed on samples containing different concentrations of NaCl.
The presence of NaCl in the sample solution and its effect on extraction recovery,
repeatability, and membrane current in EME was thoroughly investigated on 17 unpolar basic
drugs with various physical chemical properties. For eight drugs, a substantial reduction in
recovery was seen when more than 1 % (w/v) of NaCl was present in the sample solution and
NPOE was used in a hollow fiber membrane setup. No correlation was seen between this
recovery loss and the physical chemical properties of these analytes. With a NaCl content of
PhD thesis Knut Fredrik Seip Abstract
10
5 % (w/v) the repeatability of the extractions was compromised. The reduction in recovery
was hypothesized to be caused by ion pairing in the SLM, and a mathematical model was
made according to this hypothesis and the experimental data. Changing the SLM solvent from
NPOE to 6-undecanone, or reducing the SLM to acceptor solution volume ratio by using a
thinner membrane, reduced the observed recovery loss, which was consistent with the ion pair
hypothesis.
PhD thesis Knut Fredrik Seip Introduction
11
1 INTRODUCTION
1.1 Importance of sample preparation in bioanalysis An analytical process is usually divided into five consecutive steps: Sampling; sample
preparation; separation; detection; and interpretation of the acquired data. When working with
complicated matrices, each of these steps becomes highly important for reliable and
reproducible results. Technological achievements in the fields of separation and detection
have introduced sensitive and selective analytical instruments, and combined with powerful
software for data interpretation, selective data acquisition of low-abundance analytes is
possible. However, complex sample matrices can reduce the quality of the results by
interfering with the sensitivity and selectivity of the method in both the separation and the
detection step. In addition, some matrix components might not be compatible with the
analytical instrumentation. Based on these criteria, inefficient sample preparation can easily
become a bottle-neck for the quality of an analytical method.
In modern chemical analysis there is a high demand for accurate quantification of small
amounts of analytes such as biomarkers, pollutants, toxic substances, and drugs from complex
sample matrices. Many bioanalytical methods rely on the ability to detect endogenous
compounds that can be found in limited amounts in a biological fluid containing a high
abundance of matrix substances. One example is the determination of low-abundance
biomarkers in blood, plasma, or serum, where the protein content is dominated by proteins
such as albumin and immunoglobulins [1,2]. This high dynamic range in protein
concentration can easily overshadow the more limited compounds, making high selectivity
crucial. The low amounts of analytes also make high sensitivity an important factor. Recent
developments in instrumentation have introduced analytical instruments capable of reaching
detection limits in the low attomol levels or lower, as well as having a sufficient degree of
selectivity [3]. However, to achieve this in practice, the amount of interfering compounds
must be kept to a minimum to avoid loss of resolution in chromatography systems and severe
matrix effects [4-7]. In addition, there is often also a demand for preconcentration of analytes
to reach lower concentration limits for sufficient detection [8]. This can only be achieved
through proper sample preparation, where analytes of interest are selectively extracted and
isolated from the original sample matrix, into a compatible solvent.
The incompatibility of certain matrices and matrix compounds with the available
instrumentation also remains an important reason to do sample preparation. Biological
PhD thesis Knut Fredrik Seip Introduction
12
samples often contain compounds such as salts, proteins, lipids, and various acids and bases
that are not compatible with the instrumentation used for separation or detection. This
incompatibility can not only interfere with the quality of the results, but also severely reduce
the life time of instrument components such as analytical columns and increase the
maintenance requirements for instruments such as mass spectrometers [5,9].
Thorough sample preparation for achieving high quality results is time consuming, and it can
take up to 80 % of the total time for an analytical procedure [4]. Combined with increasing
demands of analytical methods for high-throughput screening of samples, a focus on how to
reduce the time and labor consumption has been established. Integrated and automated
systems, that often take advantage of miniaturized and hyphenated techniques, have been
increasingly popular to reduce the need for long analysis time and labor [4,6,9,10]. However,
the demand for highly time-efficient systems serves as an extra challenge to the sample
preparation in addition to efficient isolation of analytes from matrix components. The
development of new techniques for sample preparation that fulfill these criteria, without using
environmentally or physiologically hazardous chemicals, can greatly improve the quality of
analytical methods.
1.2 Supported liquid membranes in sample preparation A supported liquid membrane (SLM) consists of a small film of liquid, supported by an inert,
hydrophobic, and porous material. The liquid is kept inside the pores of the membrane
material by capillary forces, and can thus serve as a liquid barrier between aqueous phases on
each side [11-13]. In 1986, Audunsson presented the first utilization of SLMs for sample
cleanup and enrichment, where the analytes migrate from the sample solution, across the
SLM, and into an acceptor solution on the other side where they are trapped [14]. The
principle is well suited to give high selectivity and high enrichment factors, and the
possibilities for automation are good.
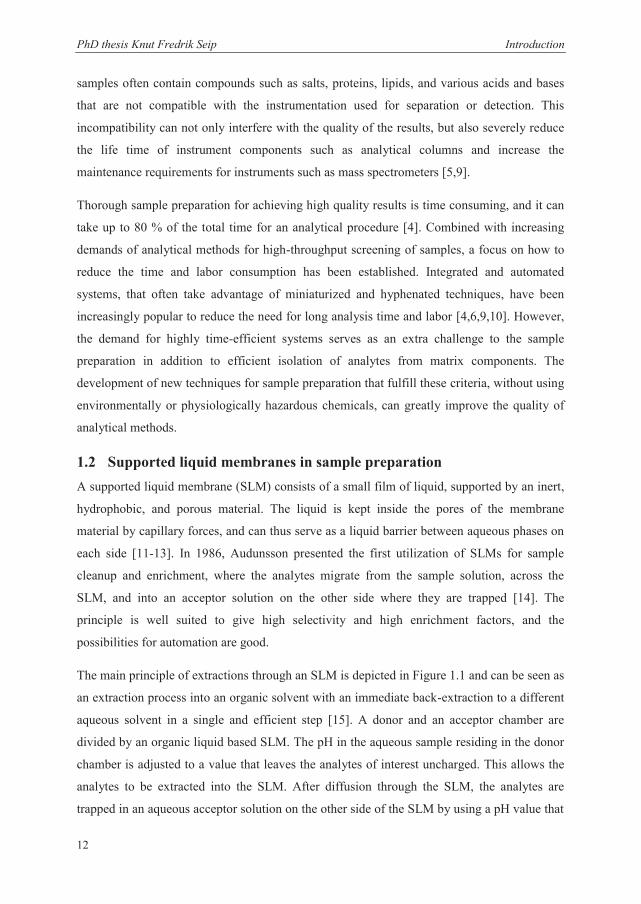
The main principle of extractions through an SLM is depicted in Figure 1.1 and can be seen as
an extraction process into an organic solvent with an immediate back-extraction to a different
aqueous solvent in a single and efficient step [15]. A donor and an acceptor chamber are
divided by an organic liquid based SLM. The pH in the aqueous sample residing in the donor
chamber is adjusted to a value that leaves the analytes of interest uncharged. This allows the
analytes to be extracted into the SLM. After diffusion through the SLM, the analytes are
trapped in an aqueous acceptor solution on the other side of the SLM by using a pH value that
PhD thesis Knut Fredrik Seip Introduction
13
ionizes the analytes. This prevents the
analytes from reentering the SLM and
causes the transport to be unidirectional,
which results in high enrichment factors
[16-18]. The acceptor solution can then be
analyzed by an analytical instrument
either manually or through an on-line
system [11]. This principle, with some
modifications, appears in most SLM
based sample preparation techniques.
However, some techniques, such as
electromembrane extraction (EME),
require ionized analytes in the sample to
achieve effective extraction across the
SLM (see section 1.5.1) [19].
The selectivity of the system can
effectively be tuned towards extraction of
certain analytes. In the example above, a
basic pH in the sample solution and an
acidic pH in the acceptor solution will
effectively enrich basic analytes. Acidic analytes will remain in the sample solution because
of their inability to enter the SLM, and neutral analytes will be mostly trapped in the SLM
with a distribution in the two aqueous phases according to partition coefficients. By using
opposite pH values, acids will be enriched instead [16-18]. Further enhancement of the
selectivity towards certain compounds can be achieved by the addition of trapping reagents in
the acceptor phase to prevent back extraction [20] or by the addition of additives to the SLM,
such as carrier molecules or ion complexation agents [21-24]. The use of SLM additives can
also increase the efficiency of the extraction system for poorly extracting compounds [25].
SLM based extractions have commonly been used on small acids or bases, but the use of
additives has even allowed extraction of larger molecules such as peptides [26,27].
Several extraction systems have used the principle of SLM extraction in various setups and
with various modifications, such as microporous membrane liquid-liquid extraction (MMLLE)
[11], hollow fiber liquid phase microextraction (HF-LPME) [28], polymeric membrane
Figure 1.1: The main principle of SLM extractions. All analytes get transported through the SLM as a neutral complex. Negatively charged analytes complex with acids (upper), positively charged analytes complex with bases (middle), and metal ions complex with a ligand/carrier (lower). Reprinted with permission from [12] © Elsevier B.V. (1992).
PhD thesis Knut Fredrik Seip Introduction
14
extraction (PME) [11], parallel artificial liquid membrane extraction (PALME) [29], and
electromembrane extraction (EME) [19]. Some of these will be discussed further in section
1.4 and 1.5. In the different configurations, the membrane support material usually consists of
polypropylene (PP) or polytetrafluoroethylene (PTFE or Teflon) and is used either as a flat
membrane or a hollow fiber membrane [15,18,28,30,31]. The liquids impregnating the
membrane are water insoluble and non-viscous, and they are classically non-polar organic
liquids such as n-undecane, kerosene, dioctyl phosphate, and di-n-hexyl ether [11,15,30].
However, later applications and modifications have introduced other SLM solvents, such as
toluene, nitroaromatics, 1-octanol, and ionic liquids [19,28,30,32-34].
In the classic SLM extraction setup, the sample is continuously pumped through the donor
chamber while the liquid in the acceptor channel is kept stagnant, and the extraction
efficiency is highly dependent on the flow rate through the donor chamber [11,16]. In another
SLM based system, both the acceptor and donor solution has been pumped through their
respective chambers to monitor real time metabolism of certain drugs [35]. SLM based
extraction techniques have also been performed from systems where the entire sample volume
is located within the donor chamber (HF-LPME, PALME, EME). This setup has been
performed from small sample volumes with and without agitation or stirring [28,36].
1.3 The use of electric fields as a driving force in sample preparation The introduction of an electric field in sample preparation techniques will affect the
movement of charged substances according to the electrical force exerted on them. If the
electric field is constant, this force ( F ) is determined by the equation:
qEF (1)
where q is the charge of the substance and E is the electric field strength. In addition, an
electric field can have several other effects such as affecting the orientation of molecules
according to their dipole moments, electroosmosis, and electrochemical reactions [37,38]. The
effect of electroosmosis is for instance utilized in capillary electrophoresis (CE), where
migration of neutral substances is achieved by an electroosmotic flow [39]. Molecular
orientation can be important for passage through membrane systems and reduce frictional
forces between molecules, and electrochemical reactions can be utilized as a driving force for
molecules across boundaries [37,38,40,41]. All these effects can potentially be used to
facilitate selective extraction of analytes during sample preparation.
PhD thesis Knut Fredrik Seip Introduction
15
The use of electric fields as a driving force in sample preparation was first presented with the
introduction of electrodialysis in the end of the 19th century, and although the main principles
have stayed the same, the technique has been developed substantially up to this date [42]. In
electrodialysis, the concept of dialysis is combined with an electric field across the permeable
dialysis membrane. This introduces an electrical component to the mass transfer in addition to
the diffusion process of conventional dialysis, thus increasing the speed, preventing back-
diffusion, and increasing the selectivity by excluding substances with the opposite charge
[37,38,43,44]. The same main principles are also used by similar techniques, such as using
ionic solvents in combination with ionic interchange membranes to generate an
electroosmotic flow across the membrane or using an electric field in combination with a
pressure-driven system (electrofiltration)
[37].
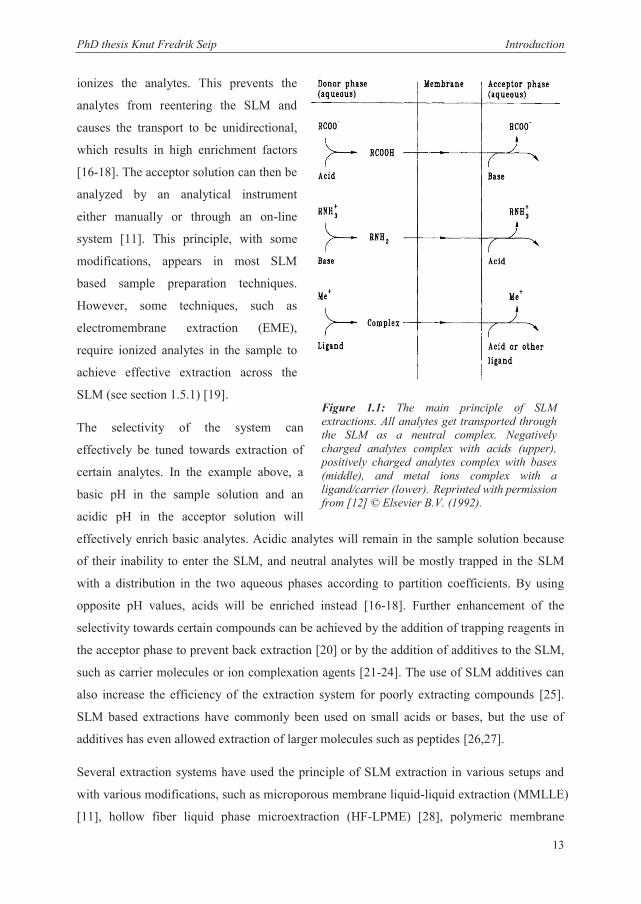
Electric fields have also been used in
combination with liquid-liquid extractions
(LLE). One of these techniques is termed
liquid-liquid electroextraction (EE) and was
presented in 1992 [45]. The main principle
is shown in Figure 1.2 for extraction of
fuchsine acid from an organic to an
aqueous phase, based on the original
presentation of the technique. Electrodes
are placed in two different liquid phases,
generating an electric field between them.
This electric field causes ions in the sample
to migrate towards the electrode of opposite
charge. In the original work, EE was
performed both with the sample solution in
between these two liquid phases (three-
phase system) and with one of the two
liquid phases as the sample solution (two-
phase system) [45]. An on-line coupling of
this technique was presented by combining
EE with isotachophoresis and CE [46,47].
Figure 1.2: A schematic illustration of EE of fuchsine acid. Before extraction, the fuchsine acid is located in the organic solvent (A), whereas after extraction the fuchsine acid has been extracted to the aqueous solvent. Reprinted with permission from [45] © Wiley-VCH Verlag (2010).
PhD thesis Knut Fredrik Seip Introduction
16
In this technique, a small amount of terminating buffer is introduced in the end of the
capillary. By placing the end of the capillary in the sample solution while applying a voltage
and a counterpressure at the same time, analytes get focused between the terminating buffer
and leading buffer through isotachophoresis. Since the electric field and resulting
electroosmotic flow can destabilize the liquid-liquid interface between the sample and the
buffer, the counterpressure is maintained to stop the sample solution from entering the
capillary. After this step, the analytes can be determined by conventional CE. An on-line
technique was also presented for liquid chromatography by performing electroextraction
through a needle device directly in the autosampler [48]. Although electroextraction
introduced the concept of electric fields in combination with liquid-liquid extractions, few
articles on this technique have been presented during recent years. This has been suggested to
be the result of poor compatibility with aqueous samples, limited extraction efficiency due to
a small area of liquid-liquid interface where extraction occurs, and practical inconvenience
[49].
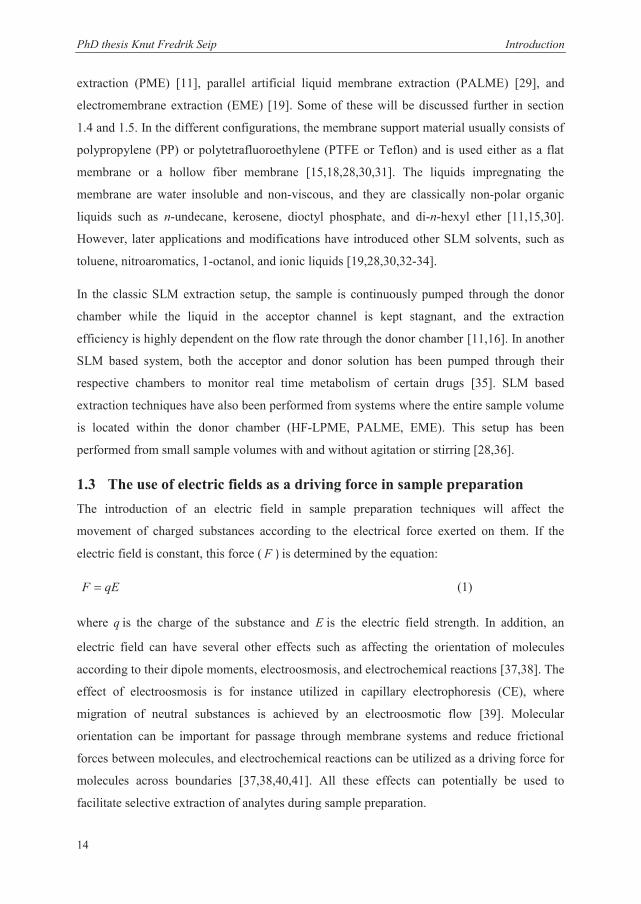
LLE with an electrical potential has also been performed in an electrochemically driven
extraction procedure. This system is named electrochemically modulated LLE, or ITIES
extraction, and is based on extraction across the “interface between two immiscible electrolyte
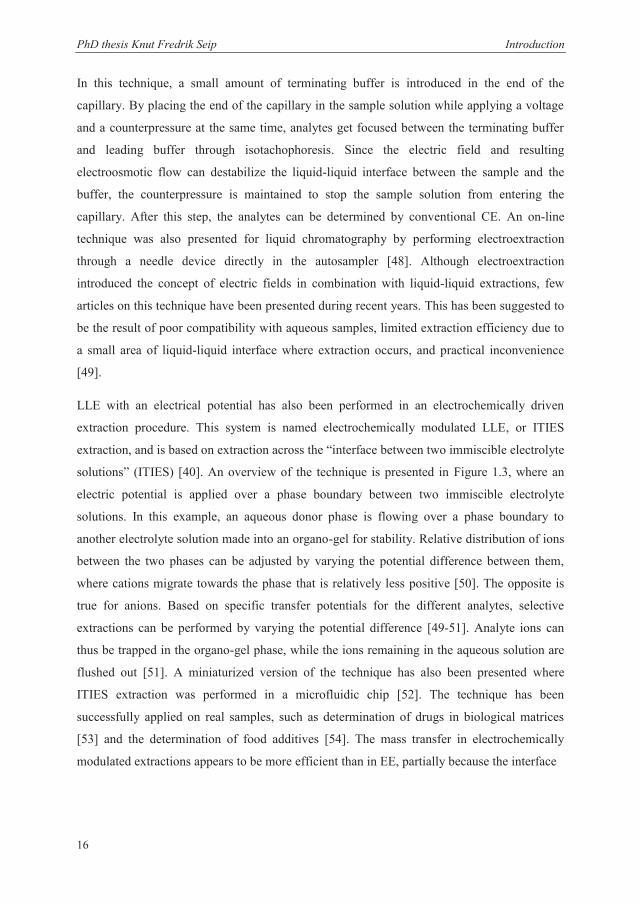
solutions” (ITIES) [40]. An overview of the technique is presented in Figure 1.3, where an
electric potential is applied over a phase boundary between two immiscible electrolyte
solutions. In this example, an aqueous donor phase is flowing over a phase boundary to
another electrolyte solution made into an organo-gel for stability. Relative distribution of ions
between the two phases can be adjusted by varying the potential difference between them,
where cations migrate towards the phase that is relatively less positive [50]. The opposite is
true for anions. Based on specific transfer potentials for the different analytes, selective
extractions can be performed by varying the potential difference [49-51]. Analyte ions can
thus be trapped in the organo-gel phase, while the ions remaining in the aqueous solution are
flushed out [51]. A miniaturized version of the technique has also been presented where
ITIES extraction was performed in a microfluidic chip [52]. The technique has been
successfully applied on real samples, such as determination of drugs in biological matrices
[53] and the determination of food additives [54]. The mass transfer in electrochemically
modulated extractions appears to be more efficient than in EE, partially because the interface
PhD thesis Knut Fredrik Seip Introduction
17
Figure 1.3: A schematic illustration of an ITIES system. A and D represent platinum mesh counter electrodes for the two phases. B is a Ag/AgCl or AG/AgSO4 reference electrode for the aqueous phase, and C is a pseudo-reference electrode of the same composition in the organic phase.
between the two phases is larger [49].
Several other techniques utilizing electric
fields have been presented, inspired by the
pioneering work with EE and ITIES
extractions. These involve electric field
assisted elution from SPE [55], as well as
electrically enhanced microextraction
techniques such as electromembrane
extraction (EME) [19], single drop
microextraction combined with an electric
field [56], electric field driven extractions
across polymer inclusion membranes [57],
and electrochemically enhanced solid phase
microextraction (EE-SPME) [58]. Some of
these techniques will be described further in
section 1.4 and 1.5.
1.4 Microextraction techniques Analytical microextractions can be defined
as non-exhaustive sample preparation techniques where small volumes of extracting phase is
used (microliters or lower) compared to the volume of sample [59]. The use of
microextraction techniques can offer several advantages to conventional sample preparation
techniques such as protein precipitation, liquid-liquid extractions (LLE), or solid phase
extractions (SPE). These advantages include miniaturization, ease of automation, high-
throughput, online coupling, low operation costs, low solvent consumption, and possibilities
for tailor made systems for particular applications [60,61]. A minimized sample preparation
step also enables measurements of trace levels of analytes in various complex matrices
[59,60]. In addition, the miniaturized system can reduce both extraction time and operation
cost, and the reduced consumption of organic solvents makes these systems less hazardous to
both the environment and the operator. These advantages offered by microextraction
techniques fits well into current trends, with the need for automated and advanced high-
throughput analytical systems that are highly sensitive and selective [4,10,62]. High
enrichment factors and the possibilities of operating with small amounts of sample make these
PhD thesis Knut Fredrik Seip Introduction
18
techniques well suited for both trace level analysis from larger sample volumes and analysis
of substances in limited amounts of biological samples.
1.4.1 Microextractions into a solid phase
The principles of microextractions became commercially available with solid phase
microextraction (SPME) [63]. In this technique, rapid sample preparation was made possible
both in the laboratory and at the site of investigation by a small and relatively simple
extraction device that integrates sampling, analyte isolation, and enrichment into a single step
[59,64-66]. The extracting phase is attached to a solid support material and then exposed to
the sample for a certain time. This causes partitioning of analytes between the sample matrix
and the extracting phase until a concentration equilibrium is reached, with no or minimal use
of organic solvents [59,67]. The concentrated extracts adsorbed to the extracting phase can
then be desorbed in the interface of an analytical instrument and analyzed [63,67]. Several
devices using the SPME principle have been presented, such as coated fibers, stir bars, vessel
walls, tubes, suspended particles, and membranes [59,60,63,65,68-70]. However, the
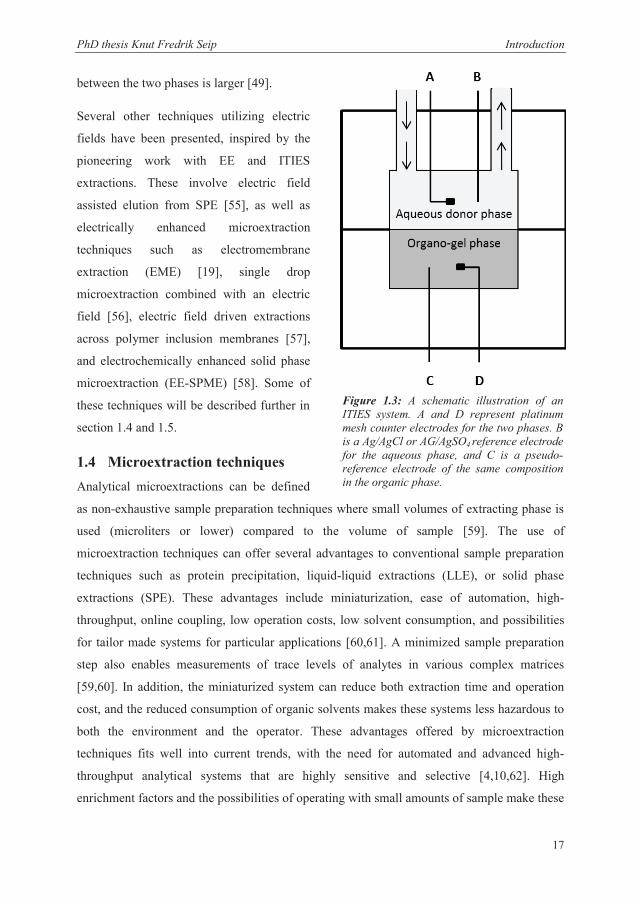
commercialized format of coated fibers as shown in Figure 1.4 is mostly used. In this format a
fused silica fiber is commonly coated with a coating material such as polydimethylsiloxane
(PDMS), divinylbenzene (DVB), or carboxen
(CAR), but various materials have been used for
more specialized extractions [71-73]. This coated
fiber is attached to the end of a metal tube that
acts as a needle to push the fiber in or out of a
larger septum so it can be used as a syringe [59].
Extraction occurs when the fiber is pushed out
and exposed to the outside environment. Likewise,
desorption will occur when the fiber with
adsorbed analytes are placed in the interface of an
analytical system that can handle SPME fibers.
This is typically a GC system, where the analytes
can be thermally desorbed by placing the fiber in
the GC injector [63,67]. The simplicity and
mobility of the device has made SPME a popular
choice for extraction of volatile and semi-volatile
substances in environmental [74,75], food [76,77],
Figure 1.4: An illustration of a commercial SPME device. Reprinted with permission from [66] © Future Science Ltd. (2013).
PhD thesis Knut Fredrik Seip Introduction
19
forensic [78-80], and pharmaceutical [81,82] samples; even direct in vivo sampling [83].
1.4.2 Microextractions into a liquid phase
In addition to extractions into solid media as in SPME, microextractions into liquid media
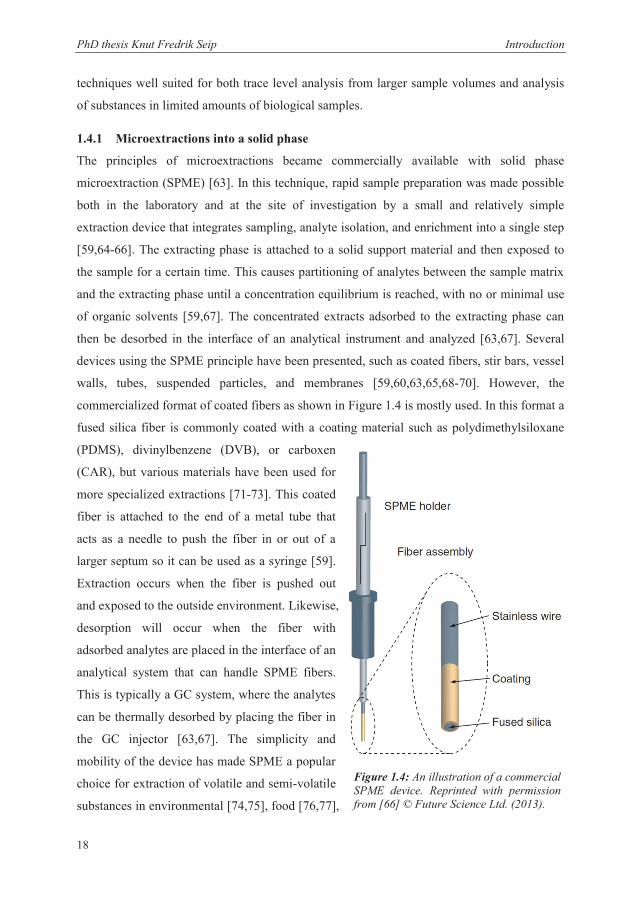
have also become a popular approach. This principle was introduced in 1996 with the
invention of single-drop microextraction (SDME) [84,85]. The technique is easy to operate,
possible to automate, fast, inexpensive, and require very low amounts of organic solvents (a
single microdrop of 1-8 μL) [86,87]. An example of an SDME extraction procedure is
presented in Figure 1.5. It is based on the principle that analytes get extracted in a two phase
system based on their distribution constants. Analytes will thus migrate from the aqueous
sample and be concentrated in a small amount of a water immiscible solvent, leading to high
enrichment factors [66,84,85,88]. The microdrop is either hanging from the end of a Teflon
rod [85], from the tip of a microsyringe [89] or as a drop suspended inside a flowing aqueous
drop [90]. After extraction, the drop can be injected into an analytical system such as a gas
chromatograph [88]. The system has, however, received some critique for its need for careful
handling to ensure stability of the drop, especially when it is compromised by complex
matrices [86,88]. Later modifications to the original principle has permitted simultaneous
back-extraction to another aqueous phase by allowing the organic drop to serve as a liquid
membrane between the two aqueous phases [91], online extraction procedures where the
microdrop is hanging from the end of a CE capillary (SDME-CE) [92], and extractions from
the headspace of samples (HS-SDME) [93]. An electric field has also been applied to a three
phase SDME system, where an aqueous drop is hanging from a pipette tip into an organic
solvent phase above the aqueous sample solution [56]. The electric field was applied between
the sample solution and the pipette tip as a way to reduce extraction time. However, the
stability of the drop was still an issue with this technique, especially at higher voltages.
Both microextractions into liquid (SDME) and solid (SPME) media have served as
fundaments for newer microextraction techniques that use the same principles with other
configurations and modifications. Combinations of these techniques with either SLMs,
electric fields, or both have started new trends in the field of microextractions. Some of these
techniques will be discussed in more detail below.
PhD thesis Knut Fredrik Seip Introduction
20
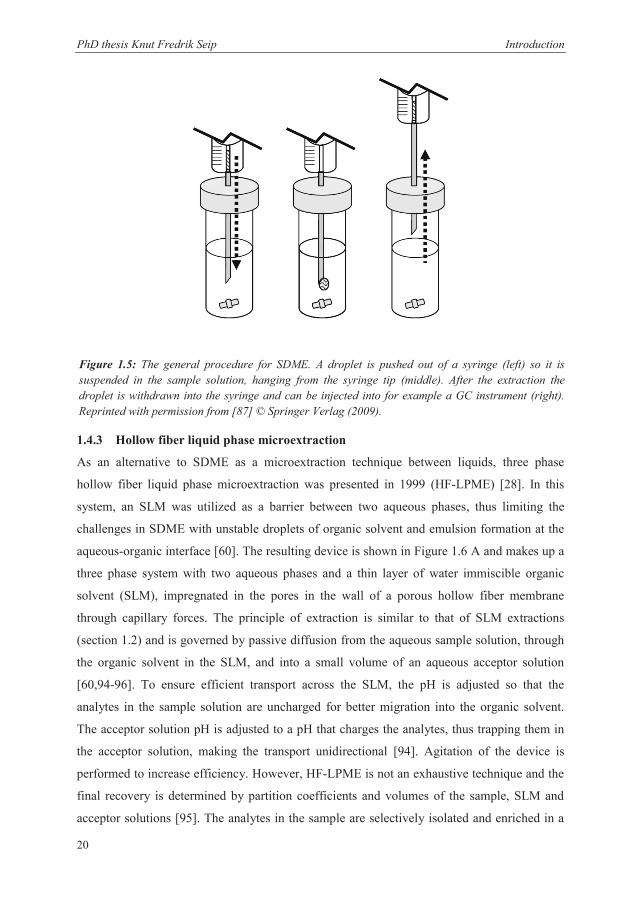
1.4.3 Hollow fiber liquid phase microextraction
As an alternative to SDME as a microextraction technique between liquids, three phase
hollow fiber liquid phase microextraction was presented in 1999 (HF-LPME) [28]. In this
system, an SLM was utilized as a barrier between two aqueous phases, thus limiting the
challenges in SDME with unstable droplets of organic solvent and emulsion formation at the
aqueous-organic interface [60]. The resulting device is shown in Figure 1.6 A and makes up a
three phase system with two aqueous phases and a thin layer of water immiscible organic
solvent (SLM), impregnated in the pores in the wall of a porous hollow fiber membrane
through capillary forces. The principle of extraction is similar to that of SLM extractions
(section 1.2) and is governed by passive diffusion from the aqueous sample solution, through
the organic solvent in the SLM, and into a small volume of an aqueous acceptor solution
[60,94-96]. To ensure efficient transport across the SLM, the pH is adjusted so that the
analytes in the sample solution are uncharged for better migration into the organic solvent.
The acceptor solution pH is adjusted to a pH that charges the analytes, thus trapping them in
the acceptor solution, making the transport unidirectional [94]. Agitation of the device is
performed to increase efficiency. However, HF-LPME is not an exhaustive technique and the
final recovery is determined by partition coefficients and volumes of the sample, SLM and
acceptor solutions [95]. The analytes in the sample are selectively isolated and enriched in a
Figure 1.5: The general procedure for SDME. A droplet is pushed out of a syringe (left) so it is suspended in the sample solution, hanging from the syringe tip (middle). After the extraction the droplet is withdrawn into the syringe and can be injected into for example a GC instrument (right). Reprinted with permission from [87] © Springer Verlag (2009).
PhD thesis Knut Fredrik Seip Introduction
21
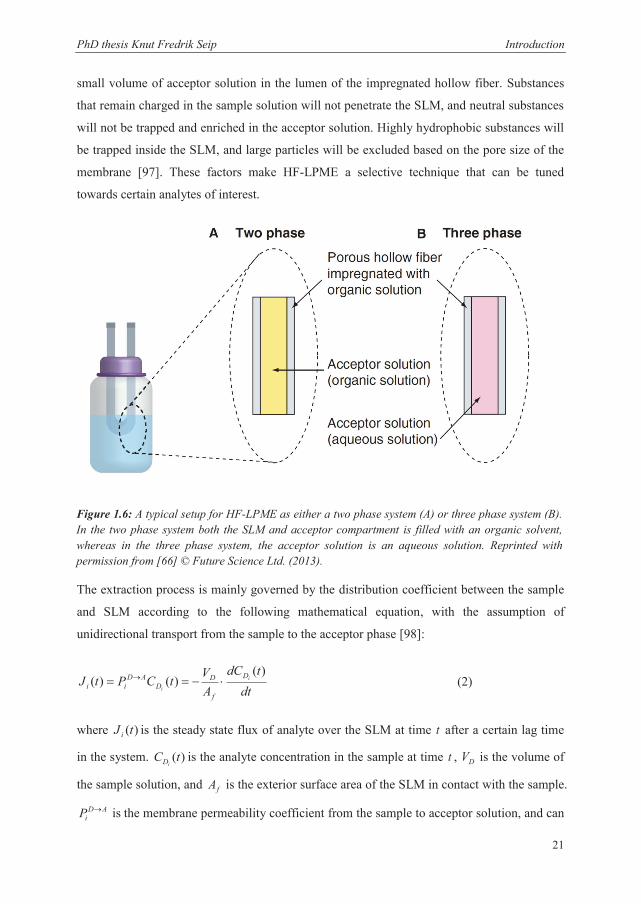
small volume of acceptor solution in the lumen of the impregnated hollow fiber. Substances
that remain charged in the sample solution will not penetrate the SLM, and neutral substances
will not be trapped and enriched in the acceptor solution. Highly hydrophobic substances will
be trapped inside the SLM, and large particles will be excluded based on the pore size of the
membrane [97]. These factors make HF-LPME a selective technique that can be tuned
towards certain analytes of interest.
The extraction process is mainly governed by the distribution coefficient between the sample
and SLM according to the following mathematical equation, with the assumption of
unidirectional transport from the sample to the acceptor phase [98]:
dttdC
AVtCPtJ i
i
D
f
DD
ADii
)()()( (2)
where )(tJ i is the steady state flux of analyte over the SLM at time t after a certain lag time
in the system. )(tCiD is the analyte concentration in the sample at time t , DV is the volume of
the sample solution, and fA is the exterior surface area of the SLM in contact with the sample.
ADiP is the membrane permeability coefficient from the sample to acceptor solution, and can
Figure 1.6: A typical setup for HF-LPME as either a two phase system (A) or three phase system (B). In the two phase system both the SLM and acceptor compartment is filled with an organic solvent, whereas in the three phase system, the acceptor solution is an aqueous solution. Reprinted with permission from [66] © Future Science Ltd. (2013).
PhD thesis Knut Fredrik Seip Introduction
22
be expressed in terms of the sample-membrane phase distribution coefficient, diK , the
diffusion coefficient of the analyte in the SLM, miD , and the thickness of the membrane, h .
hKD
P dimiADi (3)
The concentration in the acceptor solution can thus be described according to the following
equations, where a certain lag time ( lagt ) for the analytes to enter the acceptor solution is
taken into account:
lagA t t (t) Ci
0 (4a)
lagA
mdDDDDA t t
VVKVtCCV
(t) C iii
i
)(0
(4b)
where (t)CiA is the analyte concentration in the acceptor solution at time t , 0
iDC is the initial
analyte concentration in the sample, mV is the apparent volume of the SLM, and AV is the
volume of the acceptor solution.
In the period following the introduction of HF-LPME, several variations and modifications of
the system have been introduced. Several methods take advantage of different additives or
specialized solvents in one of the phases to facilitate extraction of certain analytes or improve
the technique in other ways, as described in section 1.2 [99-104]. An especially popular
modification is two phase LPME, as shown in Figure 1.6 B, where the acceptor solution
consists of the same organic solvent as the SLM [105]. In this system the analytes are kept
uncharged in the sample to ensure efficient penetration into the extracting phase contained in
the SLM and the lumen of the hollow fiber, and it is well suited for extracting hydrophobic
analytes. Several automated systems have also been presented [106-109], and recently the use
of LPME in a 96 well plate format, where multiple extractions can be performed
simultaneously was introduced under the name parallel artificial liquid membrane
microextraction (PALME) [29]. Another important modification is the utilization of the HF-
LPME principle in combination with an electric field, which has developed into a technique
called electromembrane extraction (EME). This technique is discussed in further detail in
section 1.5, section 3, and in the articles in this thesis.
PhD thesis Knut Fredrik Seip Introduction
23
HF-LPME offers several benefits, such as being a highly selective sample preparation
technique that gives clean extracts, possibilities of high enrichment factors, ease of
automation, low costs, low consumption of organic solvents, robust extractions, and low
instrumentation requirements [60,95,110-112]. In addition, since the hollow fiber is
disposable, the possibilities for carryover are limited, ensuring better reproducibility [97]. HF-
LPME is also compatible with several analytical instruments. In three-phase mode, the extract
is usually directly compatible with instruments that handle aqueous samples, such as RP-
HPLC, UPLC, LC-MS, and CE [28,113,114]. The extract in two-phase mode can usually be
directly injected in GC systems [109,113]. Some limitations of the technique have, however,
been reported. These are mainly related to difficulties in extraction of very polar analytes,
limited recovery, long extraction times due to slow diffusion across the SLM, air bubbles
attached to the surface of the hollow fiber, and hydrophobic matrix components blocking the
pores in the hollow fiber [66,95,115].
The versatility of HF-LMPE has made it a popular technique in many applications, such as
determination of drugs in biological samples [28,60,116,117], metal ions from various
matrices [118,119], pollutants in environmental and food samples [120-124], and
determination of peptides from aqueous samples [102,103].
1.5 Electromembrane extraction The concept of electromembrane extraction (EME) was introduced in 2006 under the name
electromembrane isolation, and it was presented as a technique that offered high extraction
recoveries in a relatively short extraction time [19]. It is based on the extraction system for
HF-LPME, but adds an electrokinetic component to the mass transfer of analytes, which
effectively overcomes the limitation of long extraction times in HF-LPME. Since its release in
2006, several articles and reviews discussing EME have been published, key extraction
parameters have been identified, the theoretical understanding of the technique has been
improved, and several applications have been presented [38,49,66,96,120,125-130]. This
section will give an overview of theoretical and practical aspects of EME, in addition to a
range of applications where the technique has been used up to the time the work on this thesis
started. Publications regarding EME after 2010 are thus not included in the overview given in
this section. The results and discussion part of this thesis (section 3), and the articles this
thesis is based on, go deeper into the theoretical foundation of EME and present new insight
into several theoretical aspects of the technique.
PhD thesis Knut Fredrik Seip Introduction
24
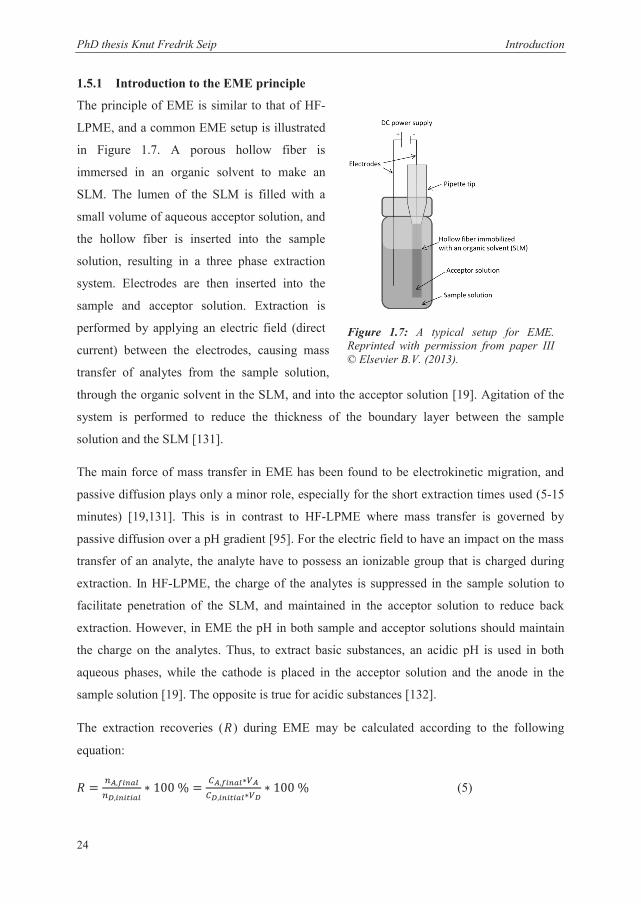
1.5.1 Introduction to the EME principle
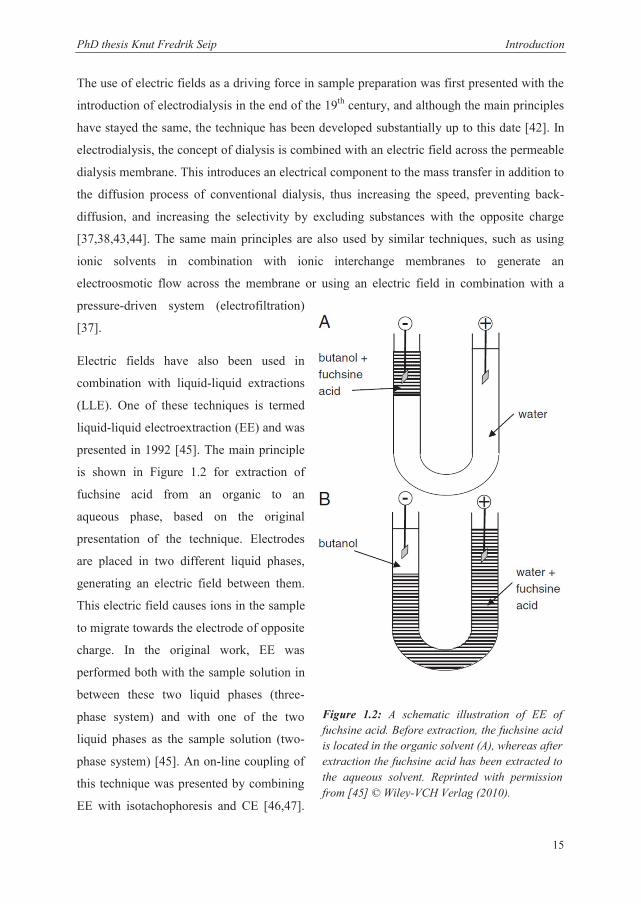
The principle of EME is similar to that of HF-
LPME, and a common EME setup is illustrated
in Figure 1.7. A porous hollow fiber is
immersed in an organic solvent to make an
SLM. The lumen of the SLM is filled with a
small volume of aqueous acceptor solution, and
the hollow fiber is inserted into the sample
solution, resulting in a three phase extraction
system. Electrodes are then inserted into the
sample and acceptor solution. Extraction is
performed by applying an electric field (direct
current) between the electrodes, causing mass
transfer of analytes from the sample solution,
through the organic solvent in the SLM, and into the acceptor solution [19]. Agitation of the
system is performed to reduce the thickness of the boundary layer between the sample
solution and the SLM [131].
The main force of mass transfer in EME has been found to be electrokinetic migration, and
passive diffusion plays only a minor role, especially for the short extraction times used (5-15
minutes) [19,131]. This is in contrast to HF-LPME where mass transfer is governed by
passive diffusion over a pH gradient [95]. For the electric field to have an impact on the mass
transfer of an analyte, the analyte have to possess an ionizable group that is charged during
extraction. In HF-LPME, the charge of the analytes is suppressed in the sample solution to
facilitate penetration of the SLM, and maintained in the acceptor solution to reduce back
extraction. However, in EME the pH in both sample and acceptor solutions should maintain
the charge on the analytes. Thus, to extract basic substances, an acidic pH is used in both
aqueous phases, while the cathode is placed in the acceptor solution and the anode in the
sample solution [19]. The opposite is true for acidic substances [132].
The extraction recoveries ( ) during EME may be calculated according to the following
equation:
(5)
Figure 1.7: A typical setup for EME. Reprinted with permission from paper III © Elsevier B.V. (2013).
PhD thesis Knut Fredrik Seip Introduction
25
where is the amount of analyte present in the acceptor solution at the end of the
extraction, and is the amount of analyte initially present in the sample. is the
concentration of analyte in the acceptor solution after extraction, while is the initial
concentration in the sample. and are the volumes of the acceptor and sample solution
respectively. This leads to enrichment factors ( ) according to the equation:
(6)
Because of small volumes of acceptor solution relative to possibly large volumes of sample
solution, the enrichment factors can be high in EME [133].
The similarities between HF-LPME and EME cause EME to have the same benefits of being
a cheap, robust, simple, and environmentally friendly technique, with good possibilities for
automation, low instrumentation requirements, low chance of carryover, and good
compatibility with analytical instruments (see section 1.4.3) [37,120,125,128]. However, the
introduction of an electric field as the force for mass transfer introduced a new tool for
controlling the selectivity, and it significantly reduced the extraction time compared to HF-
LPME [120,125,131,134]. In addition, the use of an electric field can break drug-protein
bindings, and has been suggested as a way to improve drug extractions from plasma samples
[135]. The resulting extracts after EME have proved to be very clean, with minimal
interferences from other matrix components [32,126].
1.5.2 Extraction theory and kinetics
In an EME system, the sample solution, SLM, and the acceptor solution act as an electrical
circuit, where the SLM is the major source of electrical resistance [19]. The flow of current
through an EME system reflects the flow of background ions and analytes across the SLM.
Although the transport of substances through the system is increased with higher SLM current,
a high current can also affect the stability of the system due to electrolysis at the two
electrodes according to the following reactions [19]:
Anode reaction: eOHOH 2212 22
Cathode reaction: 222 HeH
PhD thesis Knut Fredrik Seip Introduction
26
A high current will thus generate a substantial amount of bubbles in the sample and acceptor
solution, caused by 2O and 2H gas formation, as well as affecting the pH. Based on this, a
compromise has to be made between transport efficiency and tendency of bubble formation
by using optimal organic solvents and applied voltages [19,132,136].
Since the main source of electrical resistance is the SLM, the electrical field strength ( cmV / )
is very high in this area. However, the effect of transportation through the SLM varies
according to the degree of retained charge on the analytes [19]. Analytes that keep their
charge are believed to be very effectively transported through the SLM, while analytes that
easily lose their charge are discriminated, causing differences in recovery. The pH
environment in the sample and acceptor solution is adjusted so that effective analyte
migration occurs.
A theoretical model for the flux across the membrane was presented in 2007 and was verified
experimentally [137]. The model shows that the steady state flux of an ionic substance ( iJ )
through the EME system can be described, based on the Nernst-Planck flux equation,
according to the following equation:
)exp()exp(
1ln
1J 0i iii cc
hD
(7)
In this equation, iD represents the diffusion coefficient of the ion in question, h is the SLM
thickness, is the total ion concentration ratio between the donor side and the acceptor side,
ic is the concentration of the analyte at the interface between the sample solution and the
SLM, and 0ic represents this concentration at the interface between the SLM and the acceptor
solution. is a dimensionless driving force defined as:
kTezi (8)
where iz is the charge of the ion, k is the Boltzmann constant, e the elementary charge,
the electrical potential difference across the SLM, and T the absolute temperature.
Assuming that the system is kept under stable operational parameters, equation 7 and 8
predicts that the flux across the membrane can be increased by decreasing the ion balance ( )
or increasing the potential difference ( ) by increasing the extraction voltage. These
PhD thesis Knut Fredrik Seip Introduction
27
predictions have been justified experimentally [137]. The effect from adjusting the
temperature, however, is difficult to predict, since the diffusion coefficient ( iD ) also relies on
temperature. Experiments have suggested that the effect of temperature on the dimensionless
driving force is insignificant compared to its effect on the diffusion coefficient [137].
Even though a mathematical model for the flux across the membrane and some
experimentally verified theories for the extraction process have been presented, a thorough
understanding of the distribution of analytes through the system and how the organic solvent
in the SLM affects the extraction kinetics has been lacking. This thesis has further
investigated these aspects of EME, which is presented in section 3.2 and in the articles this
thesis is based on.
1.5.3 Factors of importance for extraction
The mathematical equations for flux across the membrane and the extraction theory discussed
in section 1.5.2 present some important and adjustable parameters for optimal extractions.
Several articles have been published where parameters such as pH of the sample and acceptor
solution, different types of organic solvents in the SLM, extraction voltage, agitation, and
extraction time have been investigated and optimized for certain extraction procedures
[19,32,131,132,134,136,138,139]. This section will discuss these parameters and their
importance for extraction performance.
1.5.3.1 Composition of the sample and acceptor solutions
The pH in the sample and acceptor solutions should be kept at a pH level that ensures
ionization of the analytes, so that the electric field has an effect on the mass transfer, as
discussed in section 1.5.1. Several experiments have verified this, and commonly 10 mM HCl
has been used as both acceptor and sample solution for the extraction of basic analytes
[19,32,131,134,136,138], while 10 mM NaOH serves the same function when extracting
acidic analytes [132]. However, the pH in the sample solution, in contrast to the pH in the
acceptor solution, has been seen to only have a minor effect on extraction recovery and
efficiency [19,132,140]. This has also been seen in several articles, where extractions from
untreated samples, even from highly complex biological matrices, have been achieved with
acceptable recoveries, good validation data, and short extraction times [36,135].
It is possible to obtain high enrichment factors by using a much smaller volume of acceptor
solution than sample solution. However, the extraction process itself is more effective when
the sample volume is smaller as a result of reduced distance between the electrodes and thus a
PhD thesis Knut Fredrik Seip Introduction
28
stronger electrical field [131,134]. A reduction in efficiency of the extraction process has also
been seen from biological matrices such as untreated plasma, where the kinetics became
slower compared to diluted samples as a result of high viscosity and protein binding in the
sample [135].
According to equation 7 in section 1.5.2, the ion balance between the sample and acceptor
solution can affect the ion flux across the SLM negatively [137]. This can happen if the
presence of salts is high in the sample solution, or if there is a large difference in background
ion concentrations. Practical investigations have shown support to this theory [134,138].
1.5.3.2 Extraction voltage
Increasing the extraction voltage will generally increase the flux of ions over the membrane,
as discussed in section 1.5.2. However, to find the optimal extraction voltage, the stability of
the system has to be taken into account. An extraction voltage that is too high will cause
stability issues such as excessive electrolysis and bubble formation, with a resulting loss in
repeatability between samples [19,132,134]. In addition, a high voltage can cause excessive
joule heating with a resulting loss of organic solvent in the membrane, thus compromising the
integrity of the three phase system [141]. The optimal extraction voltage is also highly
dependent on the electrical resistance in the system, and it has to be adjusted according to the
choice of organic solvent in the SLM [19,32,139]. However, low voltage extractions have
been performed successfully in several cases, for instance by using a common 9 V battery as a
power source [32,36]. Extractions with lower voltages have a potential as a method to
increase the selectivity towards compounds that migrate more efficiently through the SLM
and as a way to extract analytes prone to electrochemical degradation [49,125].
1.5.3.3 Agitation
Agitation of the system during extraction has been described as an important factor for
efficient extractions, with an increase in recovery from 8-10 % with no agitation to 70-79 %
with optimal agitation when extracting five model drugs [19]. This has been suggested as a
result of better convection in the sample compartment, causing the boundary layer between
the sample solution and the SLM to be narrower [19,131,132]. A narrow boundary layer will
increase the migration efficiency from the sample to the SLM, which has been suggested as a
possible rate limiting step in EME [131]. The benefit of agitation is considered insignificant
in the small volumes of acceptor solution and organic solvent in the SLM or when extracting
from very small volumes of sample solution [36,131].
PhD thesis Knut Fredrik Seip Introduction
29
1.5.3.4 Extraction time
In general, the extraction time in EME has been very short compared to techniques governed
by passive diffusion. Compared to HF-LPME, with extraction times of around 45-60 minutes
[95], common extraction times for EME have been around 5-15 minutes or even lower
[36,131-134,140]. After this time, the system enters a steady state in terms of recovery. The
reason for not reaching full recovery has been suggested to be caused by a suppression of the
net transfer of analytes, as a consequence of high concentration build up in the acceptor
solution, and potential back extraction to the SLM [19,32,132].
1.5.3.5 Supported liquid membrane
The SLM serves as the main boundary between the sample and acceptor solution, the main
source of electrical resistance in the extraction system, and as an important factor for
controlling the distribution ratios of drugs into the SLM (equation 3) [19,138]. To maintain a
three phase system during the extractions and avoid the organic solvent in the SLM to leak
out into the aqueous solutions, it is important to choose an organic solvent with low water
solubility. However, the solvent should maintain a certain polarity to achieve sufficient
electrical conductance [19]. The emulsifying properties of plasma samples can, however, to a
certain extent disrupt the SLM by dissolution of the organic solvent [135,142], so the organic
solvent should be chosen with care. Adding a small droplet of organic solvent inside the
lumen of the hollow fiber has been suggested as a way to stabilize the SLM in these cases
[135].
Common solvents that have proved effective in EME include nitroaromatics, such as 2-
nitrophenyl octyl ether (NPOE), 1-isopropyl-4-nitrobenzene (IPNB), and 1-ethyl-2-
nitrobenzene (ENB) for relatively unpolar basic analytes (log P > 2), and aliphatic alcohols
such as 1-octanol for acidic analytes [132,134,138,140]. More polar drugs (log P < 2) and
peptides have been successfully extracted with the introduction of carrier molecules in the
SLM, such as di-(2-ethylhexyl) phosphate (DEHP) [136,138,139,142,143]. The carriers
effectively reduce the polarity of the analytes by forming analyte-carrier complexes, which
facilitate the migration across the SLM [136,139].
The membrane support material has been porous polypropylene in a flat sheet format or
hollow fiber format [19,128,134,144]. A small pore size effectively excludes particulate
matter, but the support material is in general supposed to be inert in the extraction process.
PhD thesis Knut Fredrik Seip Introduction
30
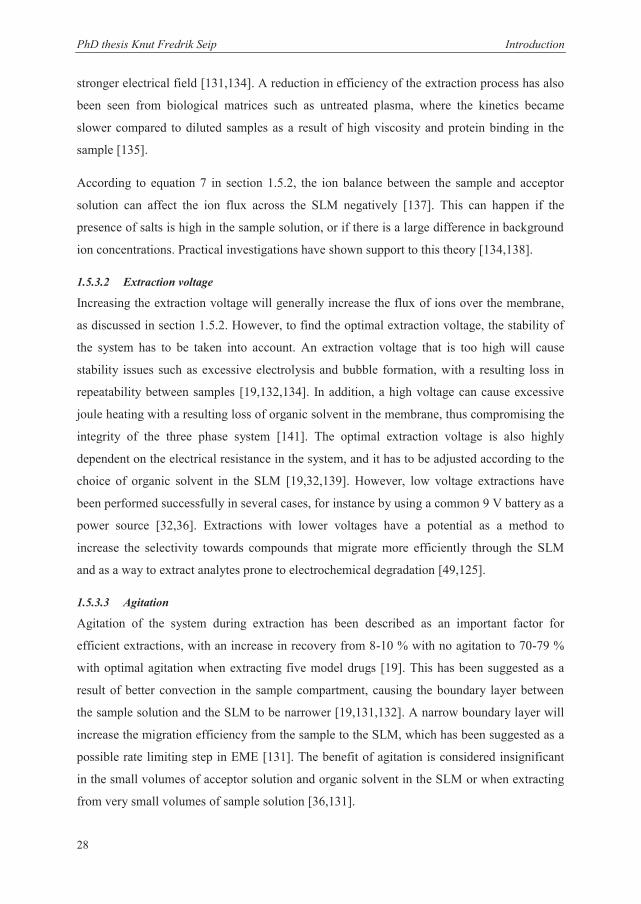
1.5.4 Modifications to the original EME format
Some modifications to the original EME format have been presented after the first publication
in 2006. In all cases the main principle for extraction is the same, but the modifications can
solve practical challenges in certain situations. One of these techniques involves extraction
from a single drop of sample solution of approximately 10 μL [144]. The extractions were
performed through a flat polypropylene membrane, impregnated with NPOE, into an acceptor
solution volume of 10 μL (Figure 1.8). In this case, the sample reservoir was a well created in
a sheet of aluminum foil, which also served as the anode. The cathode was an electrode
placed in the acceptor solution. This setup allowed extractions from very small amounts of
sample solution.
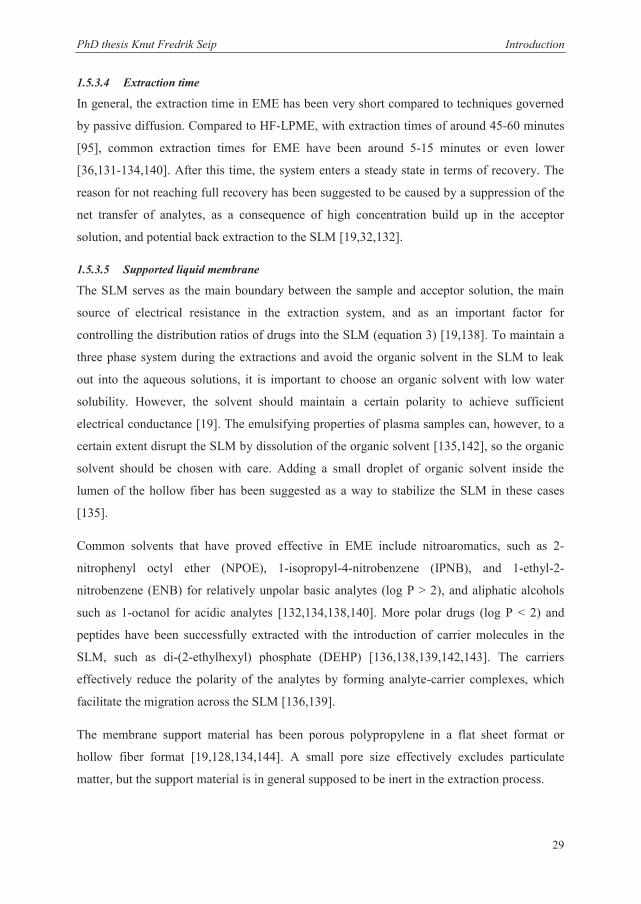
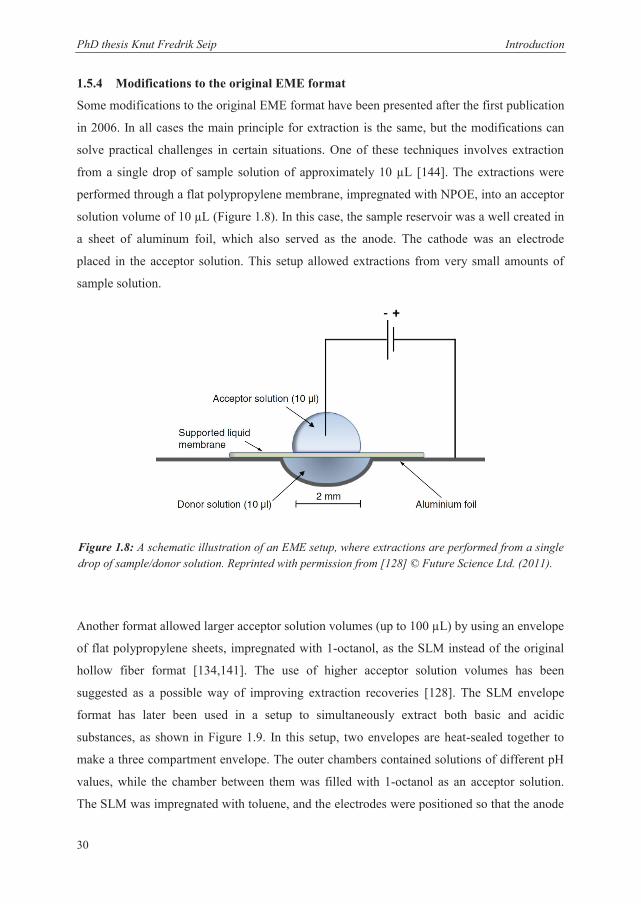
Another format allowed larger acceptor solution volumes (up to 100 μL) by using an envelope
of flat polypropylene sheets, impregnated with 1-octanol, as the SLM instead of the original
hollow fiber format [134,141]. The use of higher acceptor solution volumes has been
suggested as a possible way of improving extraction recoveries [128]. The SLM envelope
format has later been used in a setup to simultaneously extract both basic and acidic
substances, as shown in Figure 1.9. In this setup, two envelopes are heat-sealed together to
make a three compartment envelope. The outer chambers contained solutions of different pH
values, while the chamber between them was filled with 1-octanol as an acceptor solution.
The SLM was impregnated with toluene, and the electrodes were positioned so that the anode
Figure 1.8: A schematic illustration of an EME setup, where extractions are performed from a single drop of sample/donor solution. Reprinted with permission from [128] © Future Science Ltd. (2011).
PhD thesis Knut Fredrik Seip Introduction
31
was in the acidic solution and the cathode
in the alkaline solution. When an electric
field was applied, the analytes migrated
towards the electrode of opposite charge.
Because of the pH values in the media
around the electrodes, the charge of the
analytes were then neutralized, allowing
them to be extracted into the organic
acceptor solution [145].
A downscaling of EME to the chip format
was presented in 2010 [146]. In this setup,
an SLM consisting of a flat sheet of
porous polypropylene membrane
impregnated with an organic solvent was
bonded between two polymethyl
methacrylate (PMMA) substrates. A
channel with flowing sample solution
introduced the sample to the SLM on one side, while an acceptor solution chamber was
located on the other side. By adding a potential across this SLM, extraction was performed.
The on-chip device has made it possible to use very low volumes of both sample and acceptor
solution and to obtain high enrichment of analytes [146].
1.5.5 Applications and performance of EME
The years following the introduction of EME in 2006 have shown a gradual increase in the
amount of applications using the technique. The first publication was done in combination
with CE-UV on the basic drugs pethidine, nortriptyline, methadone, haloperidol, and
loperamide as model analytes [19]. In this setup, 300 V was applied for 5 minutes over an
SLM comprised of NPOE, providing recoveries of 70-79 % with less than 16 % RSD from
diluted and acidified water, plasma, and urine. A later publication presented a similar EME
setup, and it showed that EME can provide reproducible extractions of these analytes from
both human plasma, urine, and breast milk, after dilution and acidification of the biological
matrix, with recoveries and enrichment factors up to 55 % and 37, respectively [32]. In this
case the extractions were performed with a common 9 V battery as power supply. The same
analytes have also been used to evaluate the downscaling of EME into the microchip format
Figure 1.9: The general setup for EME, using a three compartment envelope for simultaneous extraction of both acidic and basic analytes. Reprinted with permission from [66] © Future Science Ltd. (2013).
PhD thesis Knut Fredrik Seip Introduction
32
and the drop-to-drop EME format from only 10 μL sample solution (see section 1.5.4)
[144,146]. These extractions were performed by using distilled water and human urine as
sample matrices in the first case, and distilled water, human urine, and plasma in the latter
case. CE-UV was used for analyzing the extracts in both cases.
Basic drugs have also been determined from various sample matrices in other applications. It
has been shown that it was possible to achieve acceptable recoveries (12-22 %) and low
detection limits (0.4-2.3 ng/mL) for parallel extraction of three samples simultaneously,
containing the psychiatric drugs amitriptyline, citalopram, fluoxetine, and fluvoxamine, by
using very short extraction times (1 minute) [36]. LC-MS was used for analyzing the extracts.
The sample matrix was 70 μL untreated human plasma, and the analytes were extracted with
reproducibility in the range 3.2-8.9 % RSD through an SLM filled with ENB. A common 9 V
battery was used as the power source for extraction in a home-made, small, and mobile EME
device. Higher recovery was obtained by using longer extraction times, but this publication
showed that acceptable performance can be achieved from untreated biological samples in a
very short time. This method was also tested on real patient samples, showing that EME
combined with LC-MS was able to detect therapeutic levels of the extracted drugs with results
comparable to other methods. EME from untreated biological matrices have also been
investigated, where seven basic drugs were extracted from untreated human plasma and whole
blood with CE-UV as the method for analysis [135]. In this case, ENB was used as the SLM
solvent, and recoveries ranged from 19 to 51 % after 10 minutes of extraction, with
reproducibility values showing less than 17 % RSD (n=6). Both this and the previous
application showed that EME can be performed at physiological pH from untreated sample
matrices.
The use of EME as a sample preparation step in chiral analysis was presented for extractions
of the enantiomers of the basic drug amlodipine, where EME was performed from acidified
human plasma and urine [140]. NPOE was used as the SLM solvent, and repeatability data in
the range 4.4 to 13.4 % RSD and recovery up to 83 % were obtained. This provided limits of
detection down to 3 ng/mL and enrichment factors up to 124. The EME extracts were
analyzed by cyclodextrin modified CE-UV.
By tuning the extraction parameters towards acidic extractions, it was possible to perform
successful and reproducible extractions of a range of eleven acidic drugs from aqueous
samples with up to 100 % recovery by using 1-heptanol as the organic solvent in the SLM and
PhD thesis Knut Fredrik Seip Introduction
33
CE-UV for analysis of the extracts [132]. This added to the versatility of EME by showing
that both acidic and basic substances can be extracted well by tuning the extraction
parameters. The viability of EME in combination with CE-UV for determination of acidic
drugs was also shown in a more recent publication [145]. In this case ibuprofen, naproxen,
and ketoprofen were used as model analytes together with the basic drugs norephedrine,
alprenolol, and propranolol in a modified setup to extract both acidic and basic drugs
simultaneously (see section 1.5.4). The extraction system showed a repeatability better than
13 % RSD (n=6), recoveries of up to 80 % and enrichment factors up to 370, and it was able
to detect the presence of some of the model analytes in unspiked wastewater samples.
EME has also been applied to some environmental pollutants and investigated in
environmental sample matrices. The nerve agent degradation products methylphosphonic acid
(MPA), ethyl methylphosphonic acid (EMPA), isopropyl methylphosphonic acid (IMPA), and
cyclohexyl methylphosphonic acid (CMPA), were determined in an EME application, in
combination with contactless conductivity detection (CE-C4D), from spiked river water
samples [141]. In this case the sample solution was untreated, and the anaytes were extracted
through an SLM impregnated with 1-octanol. The publication presents recovery data for the
analytes ranging from 1.1-56.7 %, with a variation of 2.2-8.8 % RSD. In addition, an
application for determination of the chlorophenol pesticides 4-Chlorophenol (4CP), 2,4-
dichlorophenol (24DCP), 2,4,6-Trichlorophenol (246TCP), and pentachlorophenol (PCP) in
spiked sea water, also with 1-octanol as the organic solvent in the SLM, has been published
[134]. Recovery values up to 74 % were reported with an RSD of 6.8 % (n=6), giving a
detection limit of 0.1 ng/mL and enrichment factors of up to 23. HPLC was used for
analyzing the extracts in this application.
EME as an extraction technique for heavy metals was introduced in 2008 [133], where lead
ions were extracted from human amniotic fluid, serum, and urine, as well as in lipsticks,
followed by CE-UV analysis. Toluene was used as the SLM solvent, and the method obtained
enrichment factors as high as 557 after 15 minutes of extraction. The detection limits were
reported as 19 ng/L with repeatability of 4.9-15.6 % RSD (n=3).
A slightly modified EME system, utilizing only two aqueous phases, was presented in 2008,
where 1-octanol was used both as the organic solvent in the SLM and as the acceptor solution
to ensure compatibility with GC analysis [147]. The system was operated at 60 V for 4
PhD thesis Knut Fredrik Seip Introduction
34
minutes, and it was used to study the mass transfer of the trace compounds nitrobenzene,
aniline, and phenol between aqueous media and 1-octanol.
In 2009 the first publication on EME of peptides was presented [139]. In this publication,
eight different peptides with amino acid lengths between three and 13 were extracted and
analyzed by CE-UV. An SLM containing 15 % DEHP in 1-octanol was used, and recoveries
of up to 61 % were obtained after five minutes of extraction. Repeatability data showed less
than 21 % RSD (n=6). The concept of peptide extractions and its principal operational
parameters were further investigated [143], and it lead to an application for determination of
the vasoactive angiotensin peptides angiotensin 1, 2, and 3 from acidified human plasma
[142]. In this setup, an SLM containing 8 % DEHP in 1-octanol was used, and the samples
were extracted for 10 minutes. The optimized extraction method, combined with LC-MS,
generated reproducible data (5.6-11.6 % RSD, n=6), with limits of detection at the pg/mL
level and recoveries up to 43 %. These publications showed a potential for the use of EME for
peptide extractions. Although shown previously as a good way to improve the extraction of
polar basic analytes [136,138], this was the first time an SLM containing DEHP was used in
an EME application to improve extraction performance.
During the work with this thesis, the amount of applications on EME and the theoretical
understanding of the technique have improved substantially. Applications on several new
matrices and analytes have been presented and improvements to the technique have been
suggested. Some of this progress is discussed in section 3 and in the publications this thesis is
based on.
PhD thesis Knut Fredrik Seip Aim of the study
35
2 AIM OF THE STUDY
The main goal of this study has been to further develop the theoretical foundation of EME as
a sample preparation technique for biologically active substances. Previous publications have
identified key parameters for making an efficient EME setup, and some successful SLM
solvents have been used. However, systematic knowledge about several aspects of the EME
process from a theoretical point of view was limited at the start of this study. The focus has
thus been to systematically investigate key aspects of the EME process to establish a better
theoretical platform for selecting optimal extraction parameters. The following key areas have
been investigated to achieve this goal:
Investigation of relevant solvent properties for efficient SLM solvents for extraction of:
o Basic drugs (Paper IV)
o Peptides (Paper I)
Development of a mathematical model for the distribution of analytes throughout the
extraction process based on observed extraction kinetics and analyte distribution in
EME (Paper II)
Investigations of EME stability:
o How to identify and measure stability issues? (Paper III)
o Extraction parameters causing stability issues (Paper III, IV, and V)
Investigations on how samples containing organic solvents affect the extraction
recoveries and kinetics, reproducibility, and membrane current (Paper III)
Investigations on how samples containing substantial amounts of salts in the sample
solution affect extraction recoveries and kinetics, reproducibility, and membrane
current (Paper V)
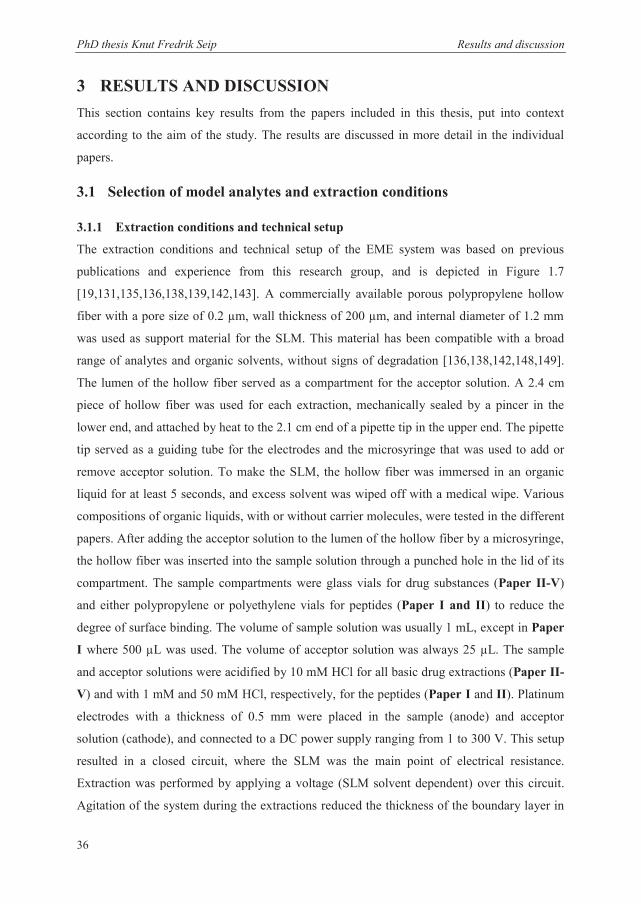
PhD thesis Knut Fredrik Seip Results and discussion
36
3 RESULTS AND DISCUSSION This section contains key results from the papers included in this thesis, put into context
according to the aim of the study. The results are discussed in more detail in the individual
papers.
3.1 Selection of model analytes and extraction conditions
3.1.1 Extraction conditions and technical setup
The extraction conditions and technical setup of the EME system was based on previous
publications and experience from this research group, and is depicted in Figure 1.7
[19,131,135,136,138,139,142,143]. A commercially available porous polypropylene hollow
fiber with a pore size of 0.2 μm, wall thickness of 200 μm, and internal diameter of 1.2 mm
was used as support material for the SLM. This material has been compatible with a broad
range of analytes and organic solvents, without signs of degradation [136,138,142,148,149].
The lumen of the hollow fiber served as a compartment for the acceptor solution. A 2.4 cm
piece of hollow fiber was used for each extraction, mechanically sealed by a pincer in the
lower end, and attached by heat to the 2.1 cm end of a pipette tip in the upper end. The pipette
tip served as a guiding tube for the electrodes and the microsyringe that was used to add or
remove acceptor solution. To make the SLM, the hollow fiber was immersed in an organic
liquid for at least 5 seconds, and excess solvent was wiped off with a medical wipe. Various
compositions of organic liquids, with or without carrier molecules, were tested in the different
papers. After adding the acceptor solution to the lumen of the hollow fiber by a microsyringe,
the hollow fiber was inserted into the sample solution through a punched hole in the lid of its
compartment. The sample compartments were glass vials for drug substances (Paper II-V)
and either polypropylene or polyethylene vials for peptides (Paper I and II) to reduce the
degree of surface binding. The volume of sample solution was usually 1 mL, except in Paper
I where 500 μL was used. The volume of acceptor solution was always 25 μL. The sample
and acceptor solutions were acidified by 10 mM HCl for all basic drug extractions (Paper II-
V) and with 1 mM and 50 mM HCl, respectively, for the peptides (Paper I and II). Platinum
electrodes with a thickness of 0.5 mm were placed in the sample (anode) and acceptor
solution (cathode), and connected to a DC power supply ranging from 1 to 300 V. This setup
resulted in a closed circuit, where the SLM was the main point of electrical resistance.
Extraction was performed by applying a voltage (SLM solvent dependent) over this circuit.
Agitation of the system during the extractions reduced the thickness of the boundary layer in
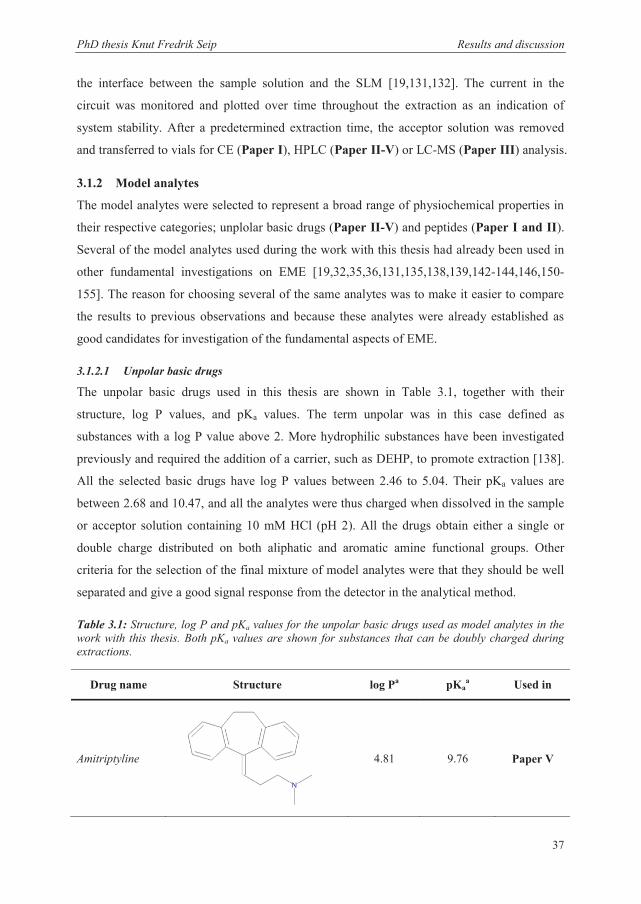
PhD thesis Knut Fredrik Seip Results and discussion
37
the interface between the sample solution and the SLM [19,131,132]. The current in the
circuit was monitored and plotted over time throughout the extraction as an indication of
system stability. After a predetermined extraction time, the acceptor solution was removed
and transferred to vials for CE (Paper I), HPLC (Paper II-V) or LC-MS (Paper III) analysis.
3.1.2 Model analytes
The model analytes were selected to represent a broad range of physiochemical properties in
their respective categories; unplolar basic drugs (Paper II-V) and peptides (Paper I and II).
Several of the model analytes used during the work with this thesis had already been used in
other fundamental investigations on EME [19,32,35,36,131,135,138,139,142-144,146,150-
155]. The reason for choosing several of the same analytes was to make it easier to compare
the results to previous observations and because these analytes were already established as
good candidates for investigation of the fundamental aspects of EME.
3.1.2.1 Unpolar basic drugs
The unpolar basic drugs used in this thesis are shown in Table 3.1, together with their
structure, log P values, and pKa values. The term unpolar was in this case defined as
substances with a log P value above 2. More hydrophilic substances have been investigated
previously and required the addition of a carrier, such as DEHP, to promote extraction [138].
All the selected basic drugs have log P values between 2.46 to 5.04. Their pKa values are
between 2.68 and 10.47, and all the analytes were thus charged when dissolved in the sample
or acceptor solution containing 10 mM HCl (pH 2). All the drugs obtain either a single or
double charge distributed on both aliphatic and aromatic amine functional groups. Other
criteria for the selection of the final mixture of model analytes were that they should be well
separated and give a good signal response from the detector in the analytical method.
Table 3.1: Structure, log P and pKa values for the unpolar basic drugs used as model analytes in the work with this thesis. Both pKa values are shown for substances that can be doubly charged during extractions.
Drug name Structure log Pa pKaa Used in
Amitriptyline
4.81 9.76 Paper V
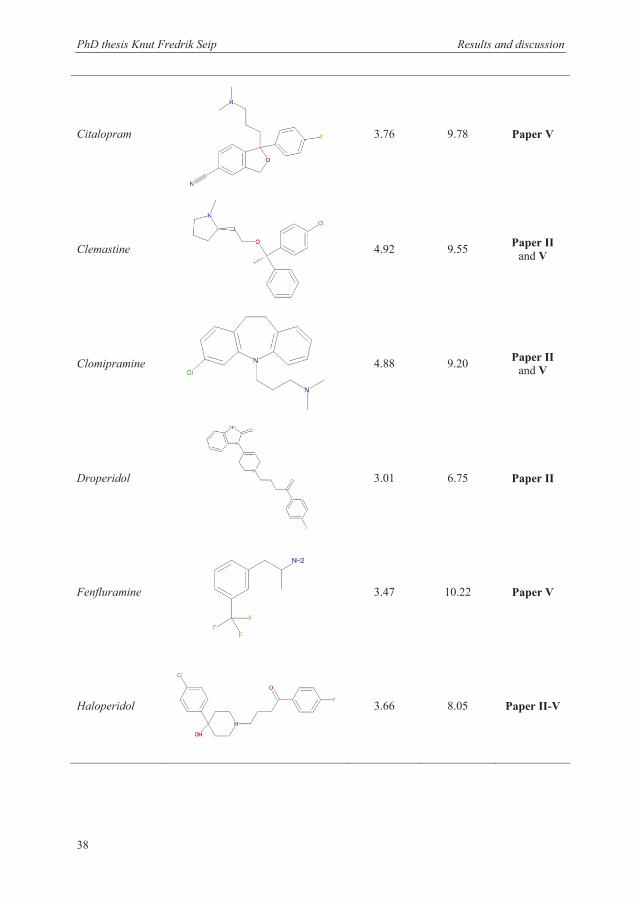
PhD thesis Knut Fredrik Seip Results and discussion
38
Citalopram
3.76 9.78 Paper V
Clemastine
4.92 9.55 Paper II and V
Clomipramine
4.88 9.20 Paper II and V
Droperidol
3.01 6.75 Paper II
Fenfluramine
3.47 10.22 Paper V
Haloperidol
3.66 8.05 Paper II-V
PhD thesis Knut Fredrik Seip Results and discussion
39
Loperamide
4.77 9.41 Paper III-V
Methadone
5.01 9.12 Paper III-V
Nortriptyline
4.43 10.47 Paper II-V
Papaverine
3.08 6.03 Paper V
Perphenazine
3.69 2.68/8.21 Paper V
Pethidine
2.46 8.16 Paper III-V
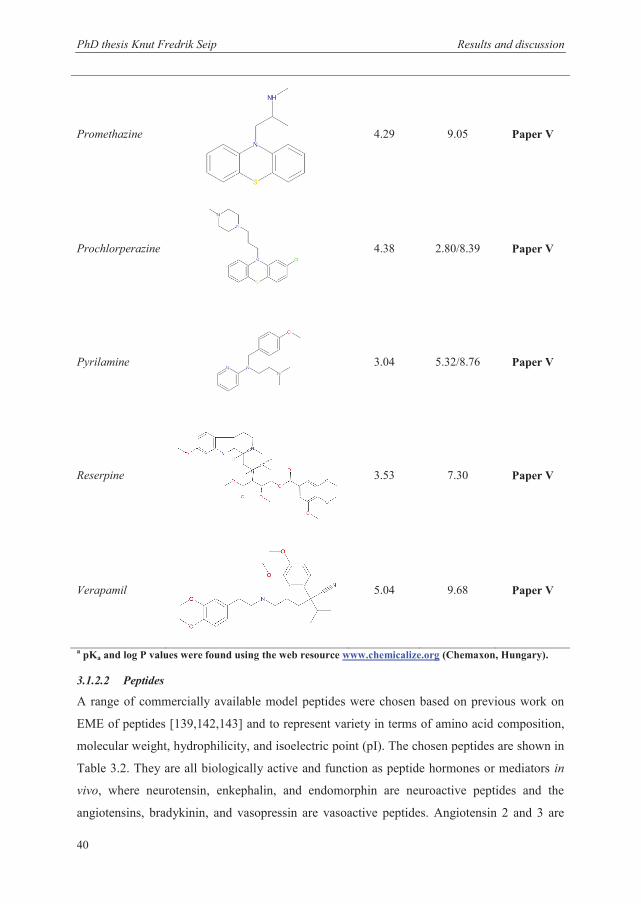
PhD thesis Knut Fredrik Seip Results and discussion
40
a pKa and log P values were found using the web resource www.chemicalize.org (Chemaxon, Hungary).
3.1.2.2 Peptides
A range of commercially available model peptides were chosen based on previous work on
EME of peptides [139,142,143] and to represent variety in terms of amino acid composition,
molecular weight, hydrophilicity, and isoelectric point (pI). The chosen peptides are shown in
Table 3.2. They are all biologically active and function as peptide hormones or mediators in
vivo, where neurotensin, enkephalin, and endomorphin are neuroactive peptides and the
angiotensins, bradykinin, and vasopressin are vasoactive peptides. Angiotensin 2 and 3 are
Promethazine
4.29 9.05 Paper V
Prochlorperazine
4.38 2.80/8.39 Paper V
Pyrilamine
3.04 5.32/8.76 Paper V
Reserpine
3.53 7.30 Paper V
Verapamil
5.04 9.68 Paper V
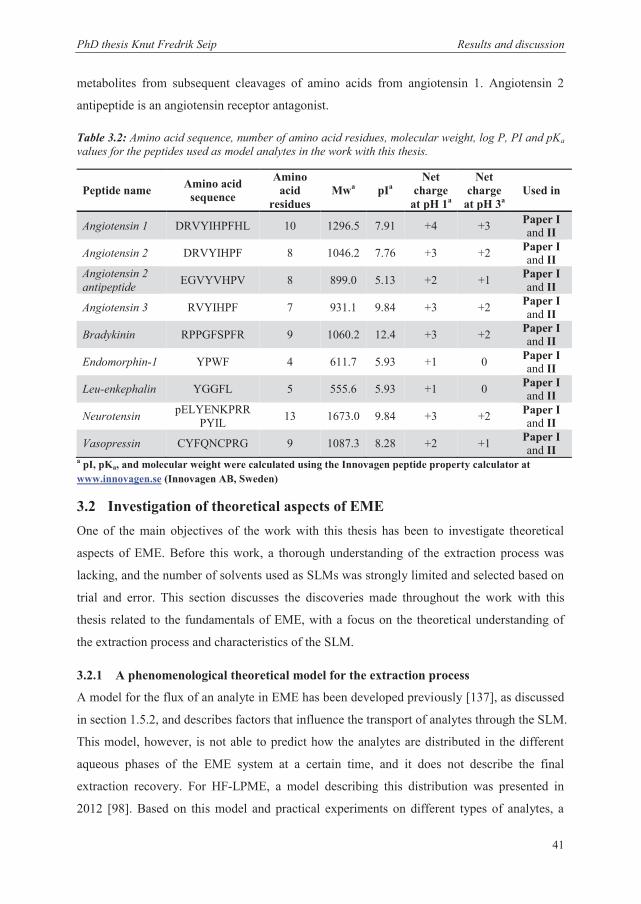
PhD thesis Knut Fredrik Seip Results and discussion
41
metabolites from subsequent cleavages of amino acids from angiotensin 1. Angiotensin 2
antipeptide is an angiotensin receptor antagonist.
Table 3.2: Amino acid sequence, number of amino acid residues, molecular weight, log P, PI and pKa values for the peptides used as model analytes in the work with this thesis.
a pI, pKa, and molecular weight were calculated using the Innovagen peptide property calculator at www.innovagen.se (Innovagen AB, Sweden)
3.2 Investigation of theoretical aspects of EME One of the main objectives of the work with this thesis has been to investigate theoretical
aspects of EME. Before this work, a thorough understanding of the extraction process was
lacking, and the number of solvents used as SLMs was strongly limited and selected based on
trial and error. This section discusses the discoveries made throughout the work with this
thesis related to the fundamentals of EME, with a focus on the theoretical understanding of
the extraction process and characteristics of the SLM.
3.2.1 A phenomenological theoretical model for the extraction process
A model for the flux of an analyte in EME has been developed previously [137], as discussed
in section 1.5.2, and describes factors that influence the transport of analytes through the SLM.
This model, however, is not able to predict how the analytes are distributed in the different
aqueous phases of the EME system at a certain time, and it does not describe the final
extraction recovery. For HF-LPME, a model describing this distribution was presented in
2012 [98]. Based on this model and practical experiments on different types of analytes, a
Peptide name Amino acid sequence
Amino acid
residues Mwa pIa
Net charge
at pH 1a
Net charge
at pH 3a Used in
Angiotensin 1 DRVYIHPFHL 10 1296.5 7.91 +4 +3 Paper I and II
Angiotensin 2 DRVYIHPF 8 1046.2 7.76 +3 +2 Paper I and II
Angiotensin 2 antipeptide EGVYVHPV 8 899.0 5.13 +2 +1 Paper I
and II
Angiotensin 3 RVYIHPF 7 931.1 9.84 +3 +2 Paper I and II
Bradykinin RPPGFSPFR 9 1060.2 12.4 +3 +2 Paper I and II
Endomorphin-1 YPWF 4 611.7 5.93 +1 0 Paper I and II
Leu-enkephalin YGGFL 5 555.6 5.93 +1 0 Paper I and II
Neurotensin pELYENKPRRPYIL 13 1673.0 9.84 +3 +2 Paper I
and II
Vasopressin CYFQNCPRG 9 1087.3 8.28 +2 +1 Paper I and II
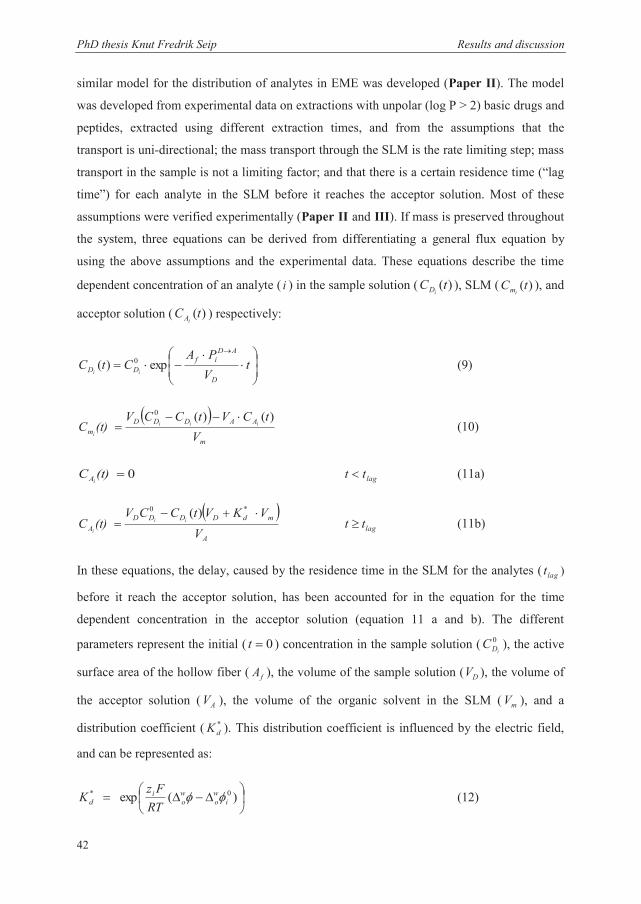
PhD thesis Knut Fredrik Seip Results and discussion
42
similar model for the distribution of analytes in EME was developed (Paper II). The model
was developed from experimental data on extractions with unpolar (log P > 2) basic drugs and
peptides, extracted using different extraction times, and from the assumptions that the
transport is uni-directional; the mass transport through the SLM is the rate limiting step; mass
transport in the sample is not a limiting factor; and that there is a certain residence time (“lag
time”) for each analyte in the SLM before it reaches the acceptor solution. Most of these
assumptions were verified experimentally (Paper II and III). If mass is preserved throughout
the system, three equations can be derived from differentiating a general flux equation by
using the above assumptions and the experimental data. These equations describe the time
dependent concentration of an analyte ( i ) in the sample solution ( )(tCiD ), SLM ( )(tC
im ), and
acceptor solution ( )(tCiA ) respectively:
tVPA
CtCD
ADif
DD iiexp)( 0 (9)
V
tCVtCCV(t) C
m
AADDDm
iii
i
)()(0
(10)
0(t) CiA lagtt (11a)
A
mdDDDDA V
VKVtCCV(t) C ii
i
*0 )( lagtt (11b)
In these equations, the delay, caused by the residence time in the SLM for the analytes ( lagt )
before it reach the acceptor solution, has been accounted for in the equation for the time
dependent concentration in the acceptor solution (equation 11 a and b). The different
parameters represent the initial ( 0t ) concentration in the sample solution ( 0iDC ), the active
surface area of the hollow fiber ( fA ), the volume of the sample solution ( DV ), the volume of
the acceptor solution ( AV ), the volume of the organic solvent in the SLM ( mV ), and a
distribution coefficient ( *dK ). This distribution coefficient is influenced by the electric field,
and can be represented as:
)(exp 0*i
wo
wo
id RT
FzK (12)
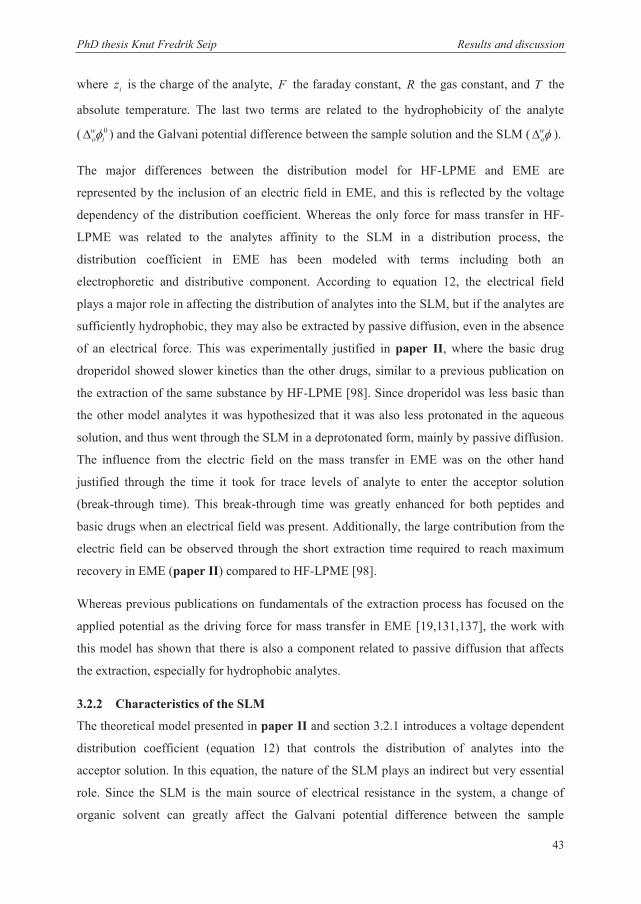
PhD thesis Knut Fredrik Seip Results and discussion
43
where iz is the charge of the analyte, F the faraday constant, R the gas constant, and T the
absolute temperature. The last two terms are related to the hydrophobicity of the analyte
( 0i
wo ) and the Galvani potential difference between the sample solution and the SLM ( w
o ).
The major differences between the distribution model for HF-LPME and EME are
represented by the inclusion of an electric field in EME, and this is reflected by the voltage
dependency of the distribution coefficient. Whereas the only force for mass transfer in HF-
LPME was related to the analytes affinity to the SLM in a distribution process, the
distribution coefficient in EME has been modeled with terms including both an
electrophoretic and distributive component. According to equation 12, the electrical field
plays a major role in affecting the distribution of analytes into the SLM, but if the analytes are
sufficiently hydrophobic, they may also be extracted by passive diffusion, even in the absence
of an electrical force. This was experimentally justified in paper II, where the basic drug
droperidol showed slower kinetics than the other drugs, similar to a previous publication on
the extraction of the same substance by HF-LPME [98]. Since droperidol was less basic than
the other model analytes it was hypothesized that it was also less protonated in the aqueous
solution, and thus went through the SLM in a deprotonated form, mainly by passive diffusion.
The influence from the electric field on the mass transfer in EME was on the other hand
justified through the time it took for trace levels of analyte to enter the acceptor solution
(break-through time). This break-through time was greatly enhanced for both peptides and
basic drugs when an electrical field was present. Additionally, the large contribution from the
electric field can be observed through the short extraction time required to reach maximum
recovery in EME (paper II) compared to HF-LPME [98].
Whereas previous publications on fundamentals of the extraction process has focused on the
applied potential as the driving force for mass transfer in EME [19,131,137], the work with
this model has shown that there is also a component related to passive diffusion that affects
the extraction, especially for hydrophobic analytes.
3.2.2 Characteristics of the SLM
The theoretical model presented in paper II and section 3.2.1 introduces a voltage dependent
distribution coefficient (equation 12) that controls the distribution of analytes into the
acceptor solution. In this equation, the nature of the SLM plays an indirect but very essential
role. Since the SLM is the main source of electrical resistance in the system, a change of
organic solvent can greatly affect the Galvani potential difference between the sample
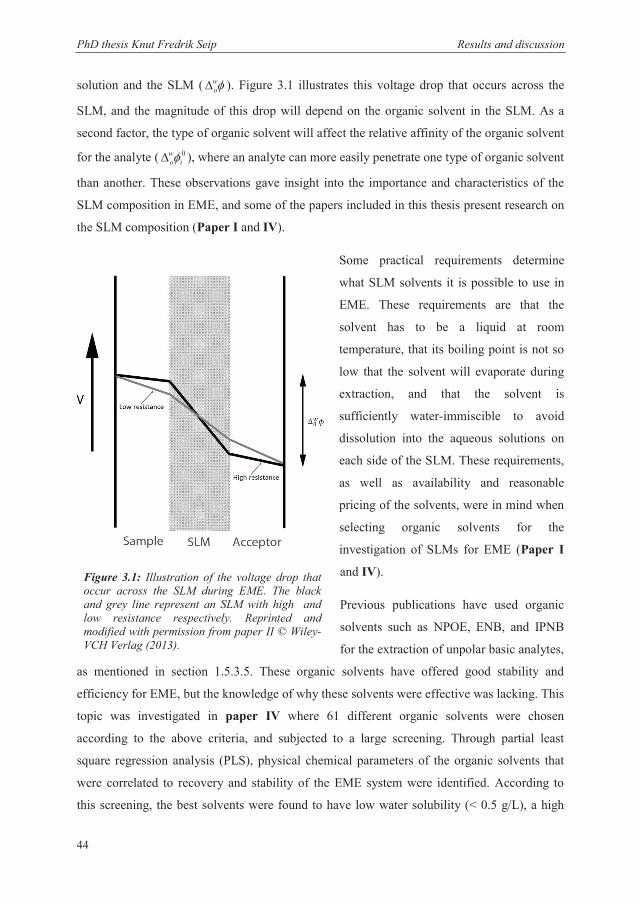
PhD thesis Knut Fredrik Seip Results and discussion
44
solution and the SLM ( wo ). Figure 3.1 illustrates this voltage drop that occurs across the
SLM, and the magnitude of this drop will depend on the organic solvent in the SLM. As a
second factor, the type of organic solvent will affect the relative affinity of the organic solvent
for the analyte ( 0i
wo ), where an analyte can more easily penetrate one type of organic solvent
than another. These observations gave insight into the importance and characteristics of the
SLM composition in EME, and some of the papers included in this thesis present research on
the SLM composition (Paper I and IV).
Some practical requirements determine
what SLM solvents it is possible to use in
EME. These requirements are that the
solvent has to be a liquid at room
temperature, that its boiling point is not so
low that the solvent will evaporate during
extraction, and that the solvent is
sufficiently water-immiscible to avoid
dissolution into the aqueous solutions on
each side of the SLM. These requirements,
as well as availability and reasonable
pricing of the solvents, were in mind when
selecting organic solvents for the
investigation of SLMs for EME (Paper I
and IV).
Previous publications have used organic
solvents such as NPOE, ENB, and IPNB
for the extraction of unpolar basic analytes,
as mentioned in section 1.5.3.5. These organic solvents have offered good stability and
efficiency for EME, but the knowledge of why these solvents were effective was lacking. This
topic was investigated in paper IV where 61 different organic solvents were chosen
according to the above criteria, and subjected to a large screening. Through partial least
square regression analysis (PLS), physical chemical parameters of the organic solvents that
were correlated to recovery and stability of the EME system were identified. According to
this screening, the best solvents were found to have low water solubility (< 0.5 g/L), a high
Figure 3.1: Illustration of the voltage drop that occur across the SLM during EME. The black and grey line represent an SLM with high and low resistance respectively. Reprinted and modified with permission from paper II © Wiley-VCH Verlag (2013).
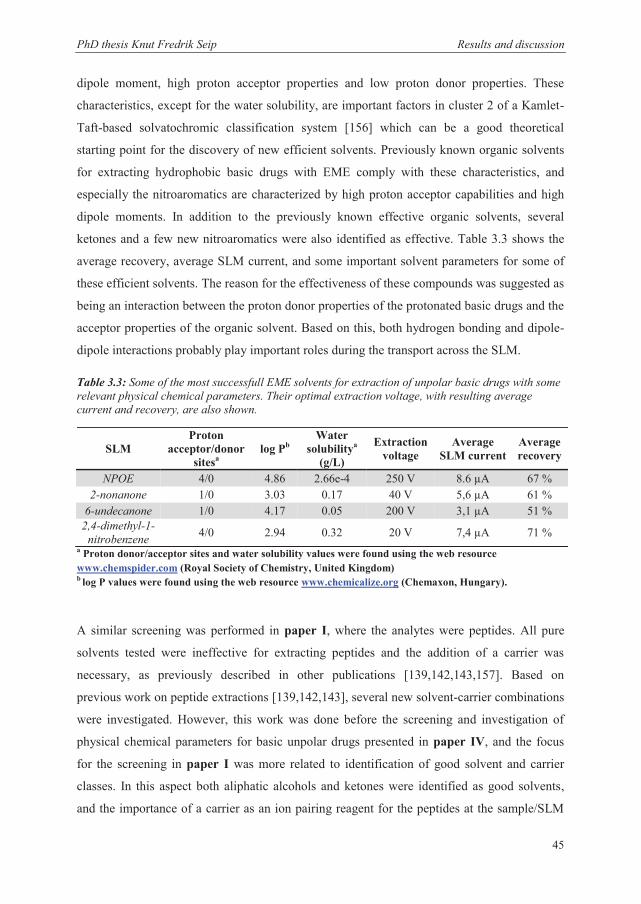
PhD thesis Knut Fredrik Seip Results and discussion
45
dipole moment, high proton acceptor properties and low proton donor properties. These
characteristics, except for the water solubility, are important factors in cluster 2 of a Kamlet-
Taft-based solvatochromic classification system [156] which can be a good theoretical
starting point for the discovery of new efficient solvents. Previously known organic solvents
for extracting hydrophobic basic drugs with EME comply with these characteristics, and
especially the nitroaromatics are characterized by high proton acceptor capabilities and high
dipole moments. In addition to the previously known effective organic solvents, several
ketones and a few new nitroaromatics were also identified as effective. Table 3.3 shows the
average recovery, average SLM current, and some important solvent parameters for some of
these efficient solvents. The reason for the effectiveness of these compounds was suggested as
being an interaction between the proton donor properties of the protonated basic drugs and the
acceptor properties of the organic solvent. Based on this, both hydrogen bonding and dipole-
dipole interactions probably play important roles during the transport across the SLM.
Table 3.3: Some of the most successfull EME solvents for extraction of unpolar basic drugs with some relevant physical chemical parameters. Their optimal extraction voltage, with resulting average current and recovery, are also shown.
a Proton donor/acceptor sites and water solubility values were found using the web resource www.chemspider.com (Royal Society of Chemistry, United Kingdom) b log P values were found using the web resource www.chemicalize.org (Chemaxon, Hungary).
A similar screening was performed in paper I, where the analytes were peptides. All pure
solvents tested were ineffective for extracting peptides and the addition of a carrier was
necessary, as previously described in other publications [139,142,143,157]. Based on
previous work on peptide extractions [139,142,143], several new solvent-carrier combinations
were investigated. However, this work was done before the screening and investigation of
physical chemical parameters for basic unpolar drugs presented in paper IV, and the focus
for the screening in paper I was more related to identification of good solvent and carrier
classes. In this aspect both aliphatic alcohols and ketones were identified as good solvents,
and the importance of a carrier as an ion pairing reagent for the peptides at the sample/SLM
SLM Proton
acceptor/donor sitesa
log Pb Water
solubilitya (g/L)
Extraction voltage
Average SLM current
Average recovery
NPOE 4/0 4.86 2.66e-4 250 V 8.6 μA 67 % 2-nonanone 1/0 3.03 0.17 40 V 5,6 μA 61 %
6-undecanone 1/0 4.17 0.05 200 V 3,1 μA 51 % 2,4-dimethyl-1-
nitrobenzene 4/0 2.94 0.32 20 V 7,4 μA 71 %
PhD thesis Knut Fredrik Seip Results and discussion
46
interface was confirmed. The importance of the interaction with a carrier to get the analytes
into the SLM was also seen in paper II, where the distribution of peptides into the SLM was
highly enhanced when a carrier was present.
In paper I, no clear link between the extraction efficiency and physical chemical properties of
the organic solvents were seen. However, the importance of proton acceptor and dipole
properties were suggested, based on the classification of the successful solvents to group II
and VI in Snyder’s solvent classification system [158,159]. The proton acceptor and dipole
properties of several solvents in these groups are similar to solvents belonging to cluster II in
the previously mentioned Kamlet-Taft-based solvatochromic classification system [156] and
are thus consistent with the discoveries made in paper IV. The aliphatic alcohols also had a
slight effect when extracting hydrophobic basic drugs, but even though they have good proton
acceptor and dipole properties, they also have relatively high proton donor capabilities, which
were suggested as the cause for their limited efficiency. Based on the structural diversity of
peptides, however, this might be beneficial for the interaction between the peptides and the
organic solvent, and could be a reason why aliphatic alcohols were more successful when
extracting peptides in paper I than for hydrophobic basic drugs in paper IV.
Carriers have previously been seen as an effective additive when extracting both peptides and
more polar basic drugs (log P < 2) [136,138,139,143,148,157,160]. Among the carriers tested
in paper I, only mono- and dialkylated phosphates were effective, and in addition to DEHP
that had been used previously, tridecyl phosphate (TDP, a commercial mixture of mono- and
di-tridecyl phosphate) and dibutyl phosphate were highly promising. All of these carriers also
had pKa values which allowed them to be charged at the sample SLM interface at pH 3 and
uncharged at the SLM/acceptor interface at pH 1.3. This confirms the previously suggested
mechanism of complexation between the oppositely charged peptide and carrier at the
sample/SLM interface and the release of peptides when the carrier gets protonated at the
SLM/acceptor interface [139,148]. Especially the introduction of 2-nonanone and TDP as
organic solvent and carrier was superior to the previously used combination of 1-octanol, di-
isobutyl ketone, and DEHP, and this knowledge was used when investigating the extraction
process for peptides in paper II. Table 3.4 shows the structure and some relevant
physiochemical parameters for some of the effective carriers.
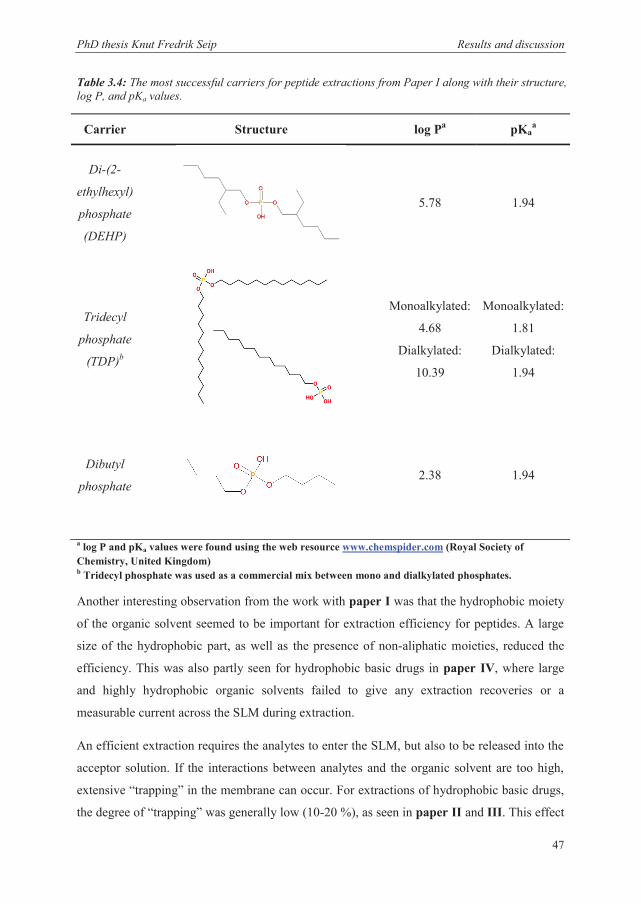
PhD thesis Knut Fredrik Seip Results and discussion
47
Table 3.4: The most successful carriers for peptide extractions from Paper I along with their structure, log P, and pKa values.
a log P and pKa values were found using the web resource www.chemspider.com (Royal Society of Chemistry, United Kingdom) b Tridecyl phosphate was used as a commercial mix between mono and dialkylated phosphates.
Another interesting observation from the work with paper I was that the hydrophobic moiety
of the organic solvent seemed to be important for extraction efficiency for peptides. A large
size of the hydrophobic part, as well as the presence of non-aliphatic moieties, reduced the
efficiency. This was also partly seen for hydrophobic basic drugs in paper IV, where large
and highly hydrophobic organic solvents failed to give any extraction recoveries or a
measurable current across the SLM during extraction.
An efficient extraction requires the analytes to enter the SLM, but also to be released into the
acceptor solution. If the interactions between analytes and the organic solvent are too high,
extensive “trapping” in the membrane can occur. For extractions of hydrophobic basic drugs,
the degree of “trapping” was generally low (10-20 %), as seen in paper II and III. This effect
Carrier Structure log Pa pKaa
Di-(2-
ethylhexyl)
phosphate
(DEHP)
5.78 1.94
Tridecyl
phosphate
(TDP)b
Monoalkylated:
4.68
Dialkylated:
10.39
Monoalkylated:
1.81
Dialkylated:
1.94
Dibutyl
phosphate
2.38 1.94
PhD thesis Knut Fredrik Seip Results and discussion
48
was also seen in paper II, where the distribution of these analytes between 10 mM HCl and
NPOE completely favored the aqueous phase for most of the analytes. For peptides, however,
the inclusion of a carrier in the membrane causes a high affinity for the analytes to the SLM,
as seen in paper I and II. In paper II this was seen as the major factor limiting extraction
recoveries, and the degree of “trapping” appeared to be reduced with increasing number of
positive charges on the peptides. This was somewhat contradictory to the observation that the
most highly charged peptide, angiotensin 1, was the most extensively trapped peptide in the
work with paper I. However, this observation was based on 5 minute extractions, where
steady state is not yet reached according to paper II. According to the time dependent
concentration in the SLM determined in paper II, this peptide have a high accumulation in
the SLM during the first minutes, before this is gradually reduced, and can thus explain the
high concentration of angiotensin 1 in the SLM observed in paper I. Possibly, more charges
makes it easier for the carrier-peptide complex to penetrate the SLM because of more
extensive binding with carriers, but with a lack of carrier molecules to complex with at the
SLM/acceptor interface and a higher exerted force from the electrical field, these compounds
are more effectively isolated in the acceptor solution as time passes. Based on this there seems
to be a compromise between efficient transport into the SLM, and efficient release into the
acceptor solution. Thus, the affinity of the SLM towards the analyte has to be high, but not
too high, to be efficient. As paper I-III and V show, the degree of “trapping” varies between
analytes, and can thus be a future possibility for creating selective extraction systems in
addition to selectivity induced by the applied voltage [155].
The degree of “trapping” was also highly dependent on the organic solvents used in the SLM.
In paper I, five different compositions of carriers and organic solvents were tested to see the
differences in peptide distribution throughout the sample, SLM, and acceptor solutions. The
resulting plots are shown in Figure 3.2. For nonanol as an organic solvent, substituting
between TDP and DEHP as a carrier caused almost no difference. However, if 2-octanone
was used instead, TDP was superior to DEHP when it came to recovery in the acceptor
solution, but also when it came to the degree of trapping in the SLM. The distribution into the
acceptor solution and SLM was also higher with 2-octanone and TDP than the previously
described composition of octanol, DEHP, and di-isobutylketone. This was suggested as being
caused by both hydrogen bonding and ionic interactions, because of the strong dipole
properties of 2-octanone compared to the strong proton acceptor properties of the alcohols.
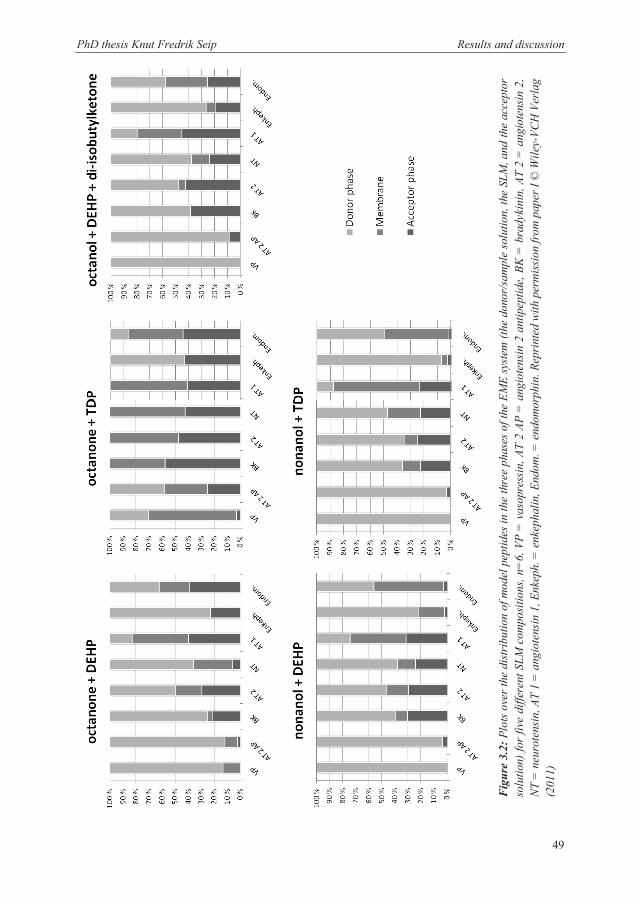
PhD thesis Knut Fredrik Seip Results and discussion
49
Fig
ure
3.2:
Plo
ts o
ver t
he d
istri
butio
n of
mod
el p
eptid
es in
the
thre
e ph
ases
of t
he E
ME
syst
em (t
he d
onor
/sam
ple
solu
tion,
the
SLM
, and
the
acce
ptor
so
lutio
n) fo
r fiv
e di
ffere
nt S
LM c
ompo
sitio
ns, n
=6.
VP
= v
asop
ress
in, A
T 2
AP =
ang
iote
nsin
2 a
ntip
eptid
e, B
K =
bra
dyki
nin,
AT
2 =
ang
iote
nsin
2,
NT
= n
euro
tens
in, A
T 1
= a
ngio
tens
in 1
, Enk
eph.
= e
nkep
halin
, End
om. =
end
omor
phin
. Rep
rint
ed w
ith p
erm
issi
on fr
om p
aper
I ©
Wile
y-VC
H V
erla
g (2
011)
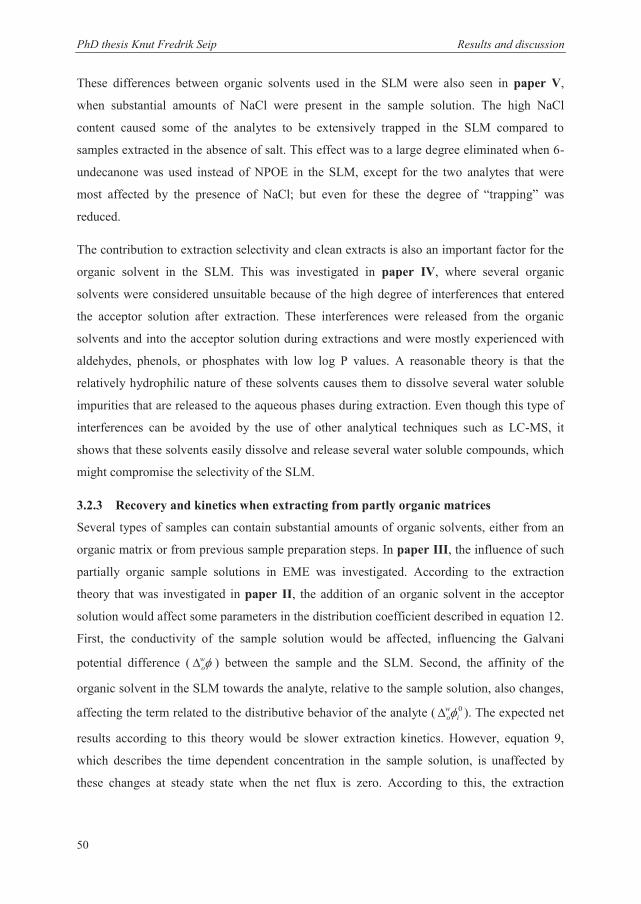
PhD thesis Knut Fredrik Seip Results and discussion
50
These differences between organic solvents used in the SLM were also seen in paper V,
when substantial amounts of NaCl were present in the sample solution. The high NaCl
content caused some of the analytes to be extensively trapped in the SLM compared to
samples extracted in the absence of salt. This effect was to a large degree eliminated when 6-
undecanone was used instead of NPOE in the SLM, except for the two analytes that were
most affected by the presence of NaCl; but even for these the degree of “trapping” was
reduced.
The contribution to extraction selectivity and clean extracts is also an important factor for the
organic solvent in the SLM. This was investigated in paper IV, where several organic
solvents were considered unsuitable because of the high degree of interferences that entered
the acceptor solution after extraction. These interferences were released from the organic
solvents and into the acceptor solution during extractions and were mostly experienced with
aldehydes, phenols, or phosphates with low log P values. A reasonable theory is that the
relatively hydrophilic nature of these solvents causes them to dissolve several water soluble
impurities that are released to the aqueous phases during extraction. Even though this type of
interferences can be avoided by the use of other analytical techniques such as LC-MS, it
shows that these solvents easily dissolve and release several water soluble compounds, which
might compromise the selectivity of the SLM.
3.2.3 Recovery and kinetics when extracting from partly organic matrices
Several types of samples can contain substantial amounts of organic solvents, either from an
organic matrix or from previous sample preparation steps. In paper III, the influence of such
partially organic sample solutions in EME was investigated. According to the extraction
theory that was investigated in paper II, the addition of an organic solvent in the acceptor
solution would affect some parameters in the distribution coefficient described in equation 12.
First, the conductivity of the sample solution would be affected, influencing the Galvani
potential difference ( wo ) between the sample and the SLM. Second, the affinity of the
organic solvent in the SLM towards the analyte, relative to the sample solution, also changes,
affecting the term related to the distributive behavior of the analyte ( 0i
wo ). The expected net
results according to this theory would be slower extraction kinetics. However, equation 9,
which describes the time dependent concentration in the sample solution, is unaffected by
these changes at steady state when the net flux is zero. According to this, the extraction
PhD thesis Knut Fredrik Seip Results and discussion
51
Figure 3.3: A comparison between extraction recoveries of the model drugs haloperidol and nortriptyline from samples containing no organic solvent (dotted line) and 50 % (v/v) methanol (solid line), n=3. Reprinted with permission from paper III © Elsevier B.V. (2013).
recovery at steady state in the sample should be unaffected. The theory from paper II thus
suggests a slower extraction process, reaching the same end point.
Four different organic solvents, ethanol, methanol, dimethyl sulfoxide, and acetonitrile were
added to the sample solution in different concentrations before extraction to investigate this
(paper III). Because organic solvents in the sample solution could affect the extraction
stability by partial dissolution of the SLM, there were some limitations to the maximum
concentration and type of organic solvent that could be used (discussed in section 3.3.3).
However, extractions from samples with up to 50 % (v/v) ethanol, methanol, or dimethyl
sulfoxide in 10 mM HCl were in excellent agreement with the theoretical model in paper II
when NPOE was used in the SLM. In Figure 3.3, a comparison between extractions with no
organic solvent and with 50 % (v/v) methanol in the sample solution is shown. Both samples
containing organic solvents and samples containing only 10 mM HCl reached maximum
steady state recoveries for the five model analytes in the range 80-90 %. However, the time to
reach steady state shifted from between 5 to 10 minutes for the extractions from only 10 mM
HCl, to 15-20 minutes when 50 % (v/v) methanol was present. Thus, the experimental data
correspond with the predicted behavior according to the theoretical model, with an unaffected
maximum recovery and slower kinetics.
The same agreement with the theoretical model was seen for 50 % (v/v) ethanol and dimethyl
sulfoxide as well. With acetonitrile in the sample, however, the EME system became unstable,
and samples containing acetonitrile should be avoided (discussed in section 3.3.3). In the case
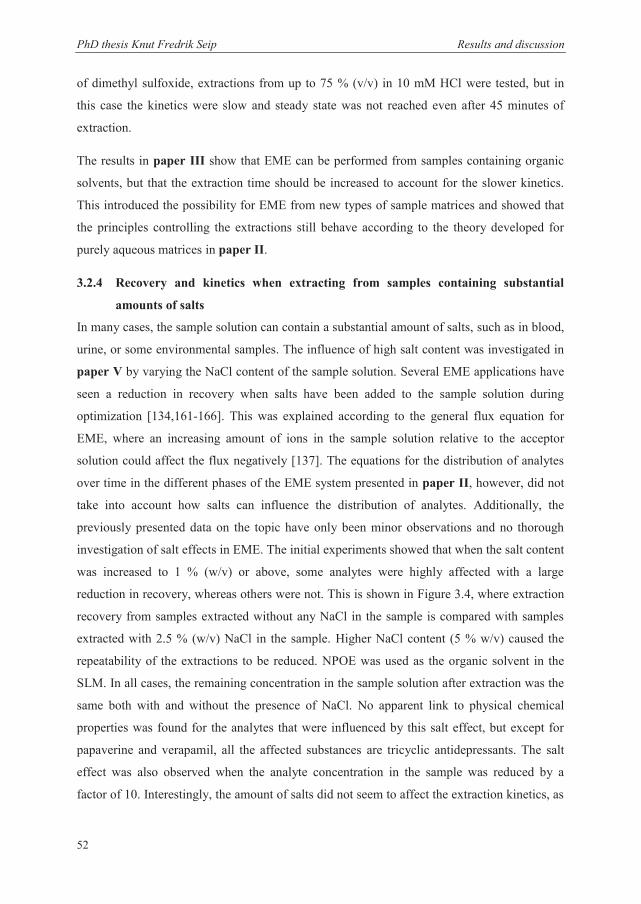
PhD thesis Knut Fredrik Seip Results and discussion
52
of dimethyl sulfoxide, extractions from up to 75 % (v/v) in 10 mM HCl were tested, but in
this case the kinetics were slow and steady state was not reached even after 45 minutes of
extraction.
The results in paper III show that EME can be performed from samples containing organic
solvents, but that the extraction time should be increased to account for the slower kinetics.
This introduced the possibility for EME from new types of sample matrices and showed that
the principles controlling the extractions still behave according to the theory developed for
purely aqueous matrices in paper II.
3.2.4 Recovery and kinetics when extracting from samples containing substantial
amounts of salts
In many cases, the sample solution can contain a substantial amount of salts, such as in blood,
urine, or some environmental samples. The influence of high salt content was investigated in
paper V by varying the NaCl content of the sample solution. Several EME applications have
seen a reduction in recovery when salts have been added to the sample solution during
optimization [134,161-166]. This was explained according to the general flux equation for
EME, where an increasing amount of ions in the sample solution relative to the acceptor
solution could affect the flux negatively [137]. The equations for the distribution of analytes
over time in the different phases of the EME system presented in paper II, however, did not
take into account how salts can influence the distribution of analytes. Additionally, the
previously presented data on the topic have only been minor observations and no thorough
investigation of salt effects in EME. The initial experiments showed that when the salt content
was increased to 1 % (w/v) or above, some analytes were highly affected with a large
reduction in recovery, whereas others were not. This is shown in Figure 3.4, where extraction
recovery from samples extracted without any NaCl in the sample is compared with samples
extracted with 2.5 % (w/v) NaCl in the sample. Higher NaCl content (5 % w/v) caused the
repeatability of the extractions to be reduced. NPOE was used as the organic solvent in the
SLM. In all cases, the remaining concentration in the sample solution after extraction was the
same both with and without the presence of NaCl. No apparent link to physical chemical
properties was found for the analytes that were influenced by this salt effect, but except for
papaverine and verapamil, all the affected substances are tricyclic antidepressants. The salt
effect was also observed when the analyte concentration in the sample was reduced by a
factor of 10. Interestingly, the amount of salts did not seem to affect the extraction kinetics, as
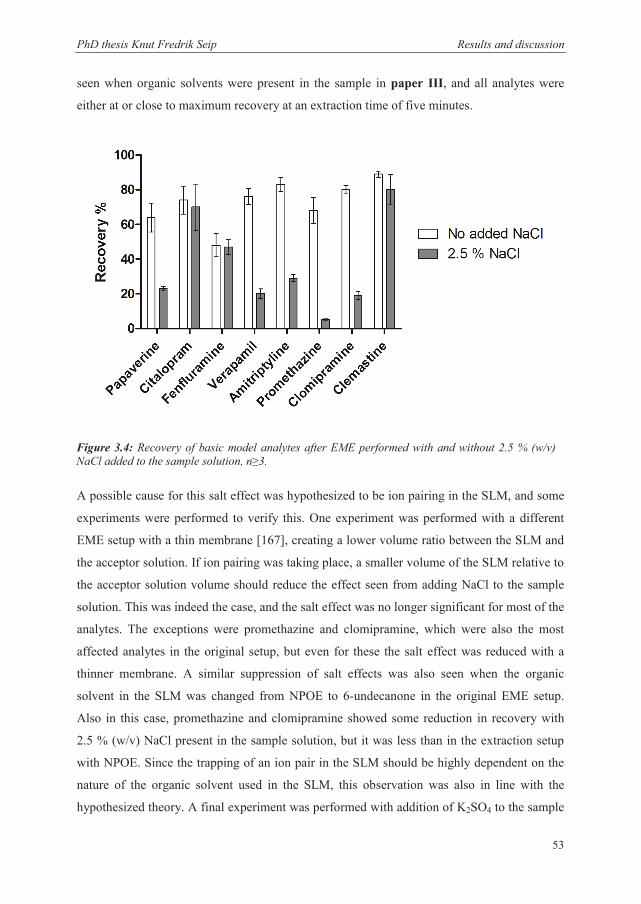
PhD thesis Knut Fredrik Seip Results and discussion
53
seen when organic solvents were present in the sample in paper III, and all analytes were
either at or close to maximum recovery at an extraction time of five minutes.
A possible cause for this salt effect was hypothesized to be ion pairing in the SLM, and some
experiments were performed to verify this. One experiment was performed with a different
EME setup with a thin membrane [167], creating a lower volume ratio between the SLM and
the acceptor solution. If ion pairing was taking place, a smaller volume of the SLM relative to
the acceptor solution volume should reduce the effect seen from adding NaCl to the sample
solution. This was indeed the case, and the salt effect was no longer significant for most of the
analytes. The exceptions were promethazine and clomipramine, which were also the most
affected analytes in the original setup, but even for these the salt effect was reduced with a
thinner membrane. A similar suppression of salt effects was also seen when the organic
solvent in the SLM was changed from NPOE to 6-undecanone in the original EME setup.
Also in this case, promethazine and clomipramine showed some reduction in recovery with
2.5 % (w/v) NaCl present in the sample solution, but it was less than in the extraction setup
with NPOE. Since the trapping of an ion pair in the SLM should be highly dependent on the
nature of the organic solvent used in the SLM, this observation was also in line with the
hypothesized theory. A final experiment was performed with addition of K2SO4 to the sample
Figure 3.4: Recovery of basic model analytes after EME performed with and without 2.5 % (w/v) NaCl added to the sample solution, n≥3.
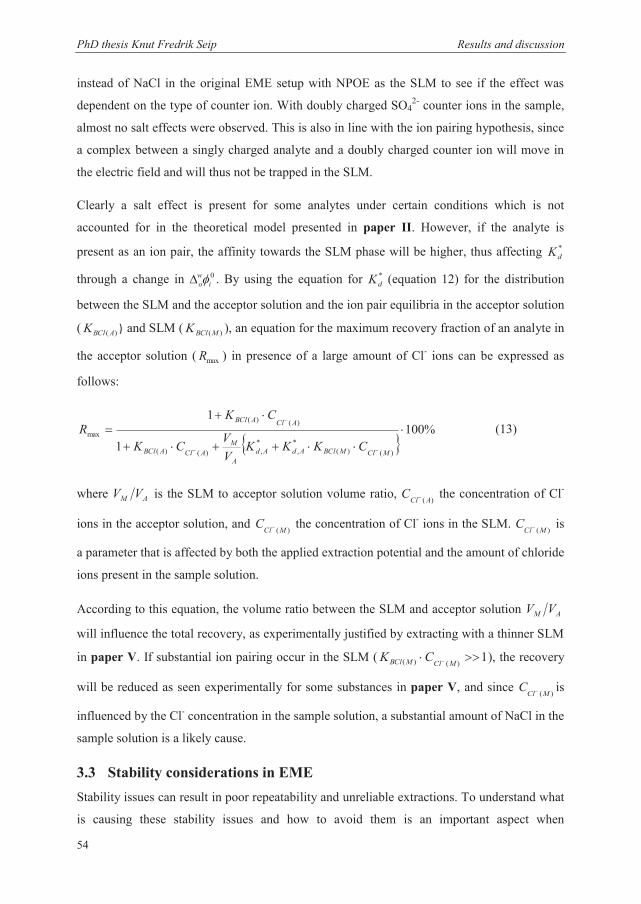
PhD thesis Knut Fredrik Seip Results and discussion
54
instead of NaCl in the original EME setup with NPOE as the SLM to see if the effect was
dependent on the type of counter ion. With doubly charged SO42- counter ions in the sample,
almost no salt effects were observed. This is also in line with the ion pairing hypothesis, since
a complex between a singly charged analyte and a doubly charged counter ion will move in
the electric field and will thus not be trapped in the SLM.
Clearly a salt effect is present for some analytes under certain conditions which is not
accounted for in the theoretical model presented in paper II. However, if the analyte is
present as an ion pair, the affinity towards the SLM phase will be higher, thus affecting *dK
through a change in 0i
wo . By using the equation for *
dK (equation 12) for the distribution
between the SLM and the acceptor solution and the ion pair equilibria in the acceptor solution
( )( ABClK ) and SLM ( )(MBClK ), an equation for the maximum recovery fraction of an analyte in
the acceptor solution ( maxR ) in presence of a large amount of Cl- ions can be expressed as
follows:
%1001
1
)()(*
,*
,)()(
)()(
max
MClMBClAdAdA
MAClABCl
AClABCl
CKKKVVCK
CKR (13)
where AM VV is the SLM to acceptor solution volume ratio, )( AClC the concentration of Cl-
ions in the acceptor solution, and )(MClC the concentration of Cl- ions in the SLM.
)(MClC is
a parameter that is affected by both the applied extraction potential and the amount of chloride
ions present in the sample solution.
According to this equation, the volume ratio between the SLM and acceptor solution AM VV
will influence the total recovery, as experimentally justified by extracting with a thinner SLM
in paper V. If substantial ion pairing occur in the SLM ( 1)()( MClMBCl CK ), the recovery
will be reduced as seen experimentally for some substances in paper V, and since )(MClC is
influenced by the Cl- concentration in the sample solution, a substantial amount of NaCl in the
sample solution is a likely cause.
3.3 Stability considerations in EME Stability issues can result in poor repeatability and unreliable extractions. To understand what
is causing these stability issues and how to avoid them is an important aspect when
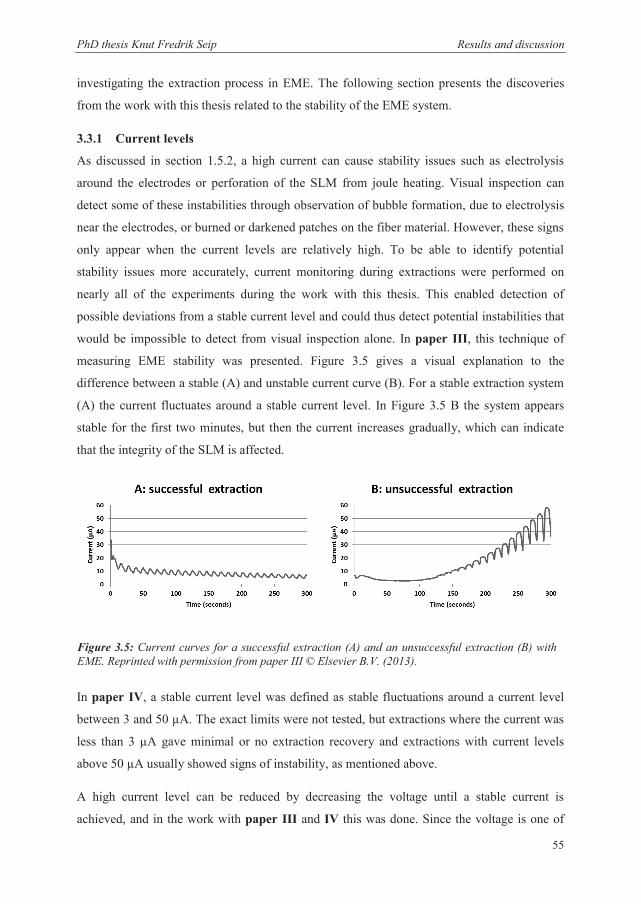
PhD thesis Knut Fredrik Seip Results and discussion
55
investigating the extraction process in EME. The following section presents the discoveries
from the work with this thesis related to the stability of the EME system.
3.3.1 Current levels
As discussed in section 1.5.2, a high current can cause stability issues such as electrolysis
around the electrodes or perforation of the SLM from joule heating. Visual inspection can
detect some of these instabilities through observation of bubble formation, due to electrolysis
near the electrodes, or burned or darkened patches on the fiber material. However, these signs
only appear when the current levels are relatively high. To be able to identify potential
stability issues more accurately, current monitoring during extractions were performed on
nearly all of the experiments during the work with this thesis. This enabled detection of
possible deviations from a stable current level and could thus detect potential instabilities that
would be impossible to detect from visual inspection alone. In paper III, this technique of
measuring EME stability was presented. Figure 3.5 gives a visual explanation to the
difference between a stable (A) and unstable current curve (B). For a stable extraction system
(A) the current fluctuates around a stable current level. In Figure 3.5 B the system appears
stable for the first two minutes, but then the current increases gradually, which can indicate
that the integrity of the SLM is affected.
In paper IV, a stable current level was defined as stable fluctuations around a current level
between 3 and 50 μA. The exact limits were not tested, but extractions where the current was
less than 3 μA gave minimal or no extraction recovery and extractions with current levels
above 50 μA usually showed signs of instability, as mentioned above.
A high current level can be reduced by decreasing the voltage until a stable current is
achieved, and in the work with paper III and IV this was done. Since the voltage is one of
Figure 3.5: Current curves for a successful extraction (A) and an unsuccessful extraction (B) with EME. Reprinted with permission from paper III © Elsevier B.V. (2013).
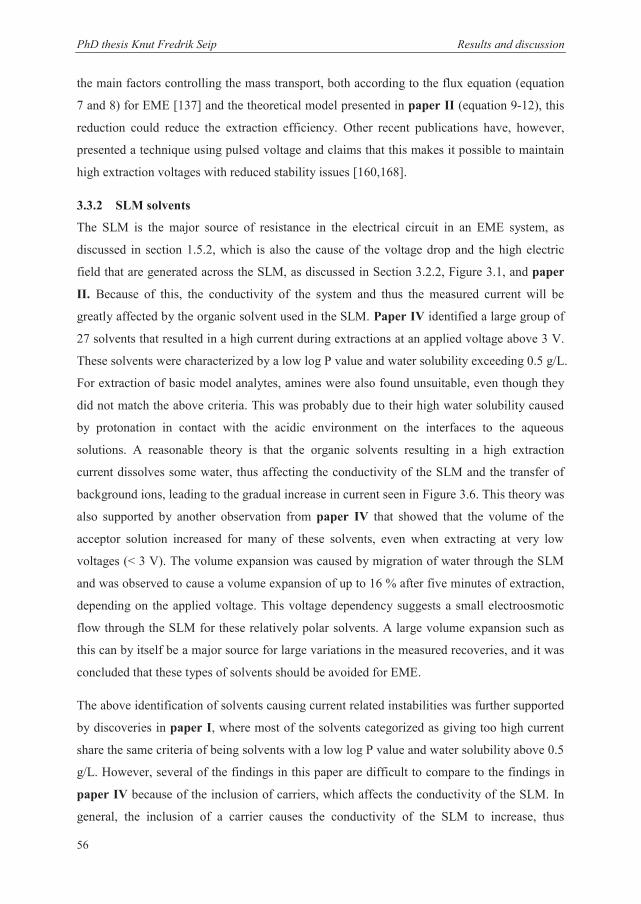
PhD thesis Knut Fredrik Seip Results and discussion
56
the main factors controlling the mass transport, both according to the flux equation (equation
7 and 8) for EME [137] and the theoretical model presented in paper II (equation 9-12), this
reduction could reduce the extraction efficiency. Other recent publications have, however,
presented a technique using pulsed voltage and claims that this makes it possible to maintain
high extraction voltages with reduced stability issues [160,168].
3.3.2 SLM solvents
The SLM is the major source of resistance in the electrical circuit in an EME system, as
discussed in section 1.5.2, which is also the cause of the voltage drop and the high electric
field that are generated across the SLM, as discussed in Section 3.2.2, Figure 3.1, and paper
II. Because of this, the conductivity of the system and thus the measured current will be
greatly affected by the organic solvent used in the SLM. Paper IV identified a large group of
27 solvents that resulted in a high current during extractions at an applied voltage above 3 V.
These solvents were characterized by a low log P value and water solubility exceeding 0.5 g/L.
For extraction of basic model analytes, amines were also found unsuitable, even though they
did not match the above criteria. This was probably due to their high water solubility caused
by protonation in contact with the acidic environment on the interfaces to the aqueous
solutions. A reasonable theory is that the organic solvents resulting in a high extraction
current dissolves some water, thus affecting the conductivity of the SLM and the transfer of
background ions, leading to the gradual increase in current seen in Figure 3.6. This theory was
also supported by another observation from paper IV that showed that the volume of the
acceptor solution increased for many of these solvents, even when extracting at very low
voltages (< 3 V). The volume expansion was caused by migration of water through the SLM
and was observed to cause a volume expansion of up to 16 % after five minutes of extraction,
depending on the applied voltage. This voltage dependency suggests a small electroosmotic
flow through the SLM for these relatively polar solvents. A large volume expansion such as
this can by itself be a major source for large variations in the measured recoveries, and it was
concluded that these types of solvents should be avoided for EME.
The above identification of solvents causing current related instabilities was further supported
by discoveries in paper I, where most of the solvents categorized as giving too high current
share the same criteria of being solvents with a low log P value and water solubility above 0.5
g/L. However, several of the findings in this paper are difficult to compare to the findings in
paper IV because of the inclusion of carriers, which affects the conductivity of the SLM. In
general, the inclusion of a carrier causes the conductivity of the SLM to increase, thus
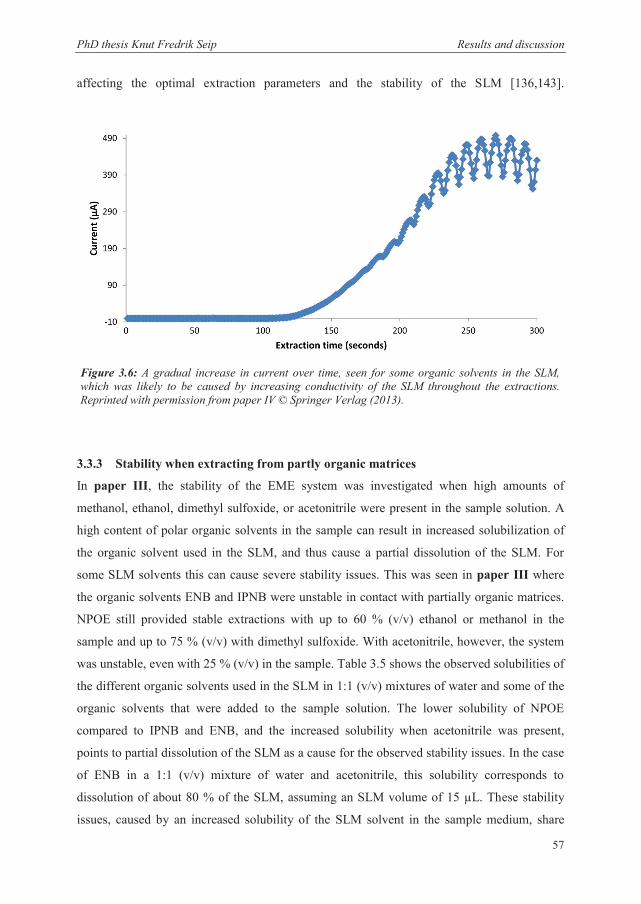
PhD thesis Knut Fredrik Seip Results and discussion
57
affecting the optimal extraction parameters and the stability of the SLM [136,143].
3.3.3 Stability when extracting from partly organic matrices
In paper III, the stability of the EME system was investigated when high amounts of
methanol, ethanol, dimethyl sulfoxide, or acetonitrile were present in the sample solution. A
high content of polar organic solvents in the sample can result in increased solubilization of
the organic solvent used in the SLM, and thus cause a partial dissolution of the SLM. For
some SLM solvents this can cause severe stability issues. This was seen in paper III where
the organic solvents ENB and IPNB were unstable in contact with partially organic matrices.
NPOE still provided stable extractions with up to 60 % (v/v) ethanol or methanol in the
sample and up to 75 % (v/v) with dimethyl sulfoxide. With acetonitrile, however, the system
was unstable, even with 25 % (v/v) in the sample. Table 3.5 shows the observed solubilities of
the different organic solvents used in the SLM in 1:1 (v/v) mixtures of water and some of the
organic solvents that were added to the sample solution. The lower solubility of NPOE
compared to IPNB and ENB, and the increased solubility when acetonitrile was present,
points to partial dissolution of the SLM as a cause for the observed stability issues. In the case
of ENB in a 1:1 (v/v) mixture of water and acetonitrile, this solubility corresponds to
dissolution of about 80 % of the SLM, assuming an SLM volume of 15 μL. These stability
issues, caused by an increased solubility of the SLM solvent in the sample medium, share
Figure 3.6: A gradual increase in current over time, seen for some organic solvents in the SLM, which was likely to be caused by increasing conductivity of the SLM throughout the extractions. Reprinted with permission from paper IV © Springer Verlag (2013).
PhD thesis Knut Fredrik Seip Results and discussion
58
similarities to the stability issues with certain SLM solvents with high water solubility
identified in paper IV.
Table 3.5: Observed solubilities for different organic solvents used as SLM in 1:1 (v/v) mixtures of water and an organic solvent. Reprinted with permission from paper III © Elsevier B.V. (2013).
In paper IV, a volume increase in the acceptor solution after the extractions was seen for
some of the solvents classified as unsuitable for EME. This was linked to a small
electroosmotic flow in the EME system. A similar pattern was noticeable for some of the
unstable extractions in paper III. This was especially seen during extractions with
acetonitrile, causing volume expansions of up to 17 %. In this paper it was hypothesized that
this effect was caused by passive diffusion of the organic solvent added to the sample solution,
causing some of it to migrate to the acceptor solution. In paper IV, when no organic solvent
was present in the sample, the concept of a small electroosmotic flow was introduced, and
possibly both of these effects could be the cause of the volume expansion seen in paper III.
During the stable extractions with ethanol, methanol, or dimethyl sulfoxide in the sample, this
volume expansion was negligible.
3.4 Tuning the EME system to different applications For optimal performance of an EME system, certain parameters have to be individually
optimized for a certain drug or a group of drugs in a specific sample matrix. The previously
published flux equation (equation 7) for EME [137] includes parameters such as applied
voltage, ion balance between the sample and acceptor solution, temperature, membrane
thickness, and a diffusivity constant that will be related to the analyte ion in question and its
diffusivity in the SLM. By optimizing these parameters, a high flux of ions across the
membrane is ensured. The theoretical model for distribution of analytes in the EME system
presented in paper II relates to several of the same parameters through the sample to acceptor
Solute Solvent mixture Observed solubility (μL/mL)
ENB ACN : H2O (1:1 v/v) 11-13 MeOH : H2O (1:1 v/v) 1-3
IPNB ACN : H2O (1:1 v/v) 10-11 MeOH : H2O (1:1 v/v) < 1
NPOE
ACN : H2O (1:1 v/v) 2-4 MeOH : H2O (1:1 v/v) < 1 EtOH : H2O (1:1 v/v) < 1
DMSO : H2O (1:1 v/v) < 1
PhD thesis Knut Fredrik Seip Results and discussion
59
permeability coefficient ( ADiP ), which is linked to the flux at a certain time ( t ), through the
equation:
dttdC
AVtCPtJ i
ii
D
f
DD
ADiD
)()()( (14)
According to this equation and equations 9-12, parameters such as the extraction time ( t ), the
active surface area on the SLM ( fA ), and the electrically enhanced distribution coefficient
( *dK ) also play essential roles in the mass transport, and could thus be of importance when
optimizing the extractions. According to equation 12 and the discussion in section 3.2.1, the
electrically enhanced distribution coefficient ( *dK ), is further dependent on variables such as
the Galvani potential difference across the membrane ( wo ), the relative hydrophobicity of
the analyte in the extraction system ( 0i
wo ), and the absolute temperature. Except for the
temperature, these parameters will be affected by the choice of organic solvent in the SLM or
from organic additives in the SLM, as studied in paper I, III and IV and discussed in section
3.2.2-3.2.3. Based on this, the choice of SLM and the applied voltage are important
parameters for optimization of an EME system.
Below, some aspects relevant to the optimization of an EME system that were revealed during
the work with this thesis are discussed. This discussion is mainly focused on the choice of
SLM (paper I and IV), extraction time (paper II and III), and stability (paper I, III, IV and
V) for extractions of basic drugs (paper II-V) or peptides (paper I and II) and for extractions
from dried blood spots (paper III) or samples containing high amounts of salt (paper V).
3.4.1 Unpolar basic drugs (log P > 2)
Several publications have thoroughly optimized the principal parameters of the EME system
for extractions of a variety of basic drug substances [19,36,135,138,154,155,161,163,164,168-
171]. Some of these previously optimized parameters were used for extractions of the same or
similar drug substances during the work with this thesis (paper II-V). As previously
discussed in section 3.2.2, it was seen in paper IV that the optimal choice of an SLM for
unpolar basic drug substances, when both extraction efficiency and stability was taken into
account, was organic solvents with low water solubility (<0.5 g/L), a high dipole moment,
high proton acceptor properties and low proton donor properties. Nitroaromatics such as
NPOE, IPNB, ENB, and 2-nitrophenyl pentyl ether have been used in several previous
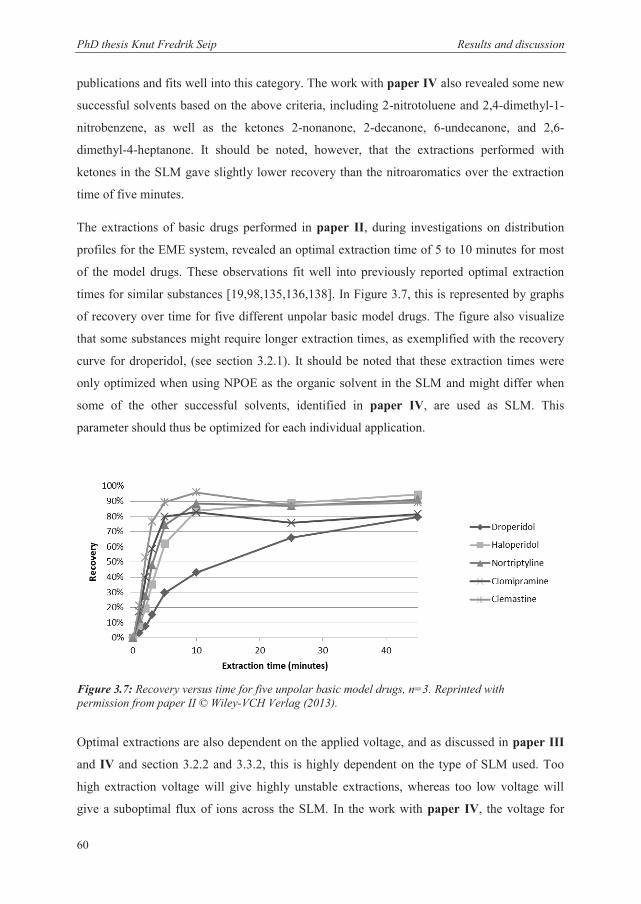
PhD thesis Knut Fredrik Seip Results and discussion
60
publications and fits well into this category. The work with paper IV also revealed some new
successful solvents based on the above criteria, including 2-nitrotoluene and 2,4-dimethyl-1-
nitrobenzene, as well as the ketones 2-nonanone, 2-decanone, 6-undecanone, and 2,6-
dimethyl-4-heptanone. It should be noted, however, that the extractions performed with
ketones in the SLM gave slightly lower recovery than the nitroaromatics over the extraction
time of five minutes.
The extractions of basic drugs performed in paper II, during investigations on distribution
profiles for the EME system, revealed an optimal extraction time of 5 to 10 minutes for most
of the model drugs. These observations fit well into previously reported optimal extraction
times for similar substances [19,98,135,136,138]. In Figure 3.7, this is represented by graphs
of recovery over time for five different unpolar basic model drugs. The figure also visualize
that some substances might require longer extraction times, as exemplified with the recovery
curve for droperidol, (see section 3.2.1). It should be noted that these extraction times were
only optimized when using NPOE as the organic solvent in the SLM and might differ when
some of the other successful solvents, identified in paper IV, are used as SLM. This
parameter should thus be optimized for each individual application.
Optimal extractions are also dependent on the applied voltage, and as discussed in paper III
and IV and section 3.2.2 and 3.3.2, this is highly dependent on the type of SLM used. Too
high extraction voltage will give highly unstable extractions, whereas too low voltage will
give a suboptimal flux of ions across the SLM. In the work with paper IV, the voltage for
Figure 3.7: Recovery versus time for five unpolar basic model drugs, n=3. Reprinted with permission from paper II © Wiley-VCH Verlag (2013).
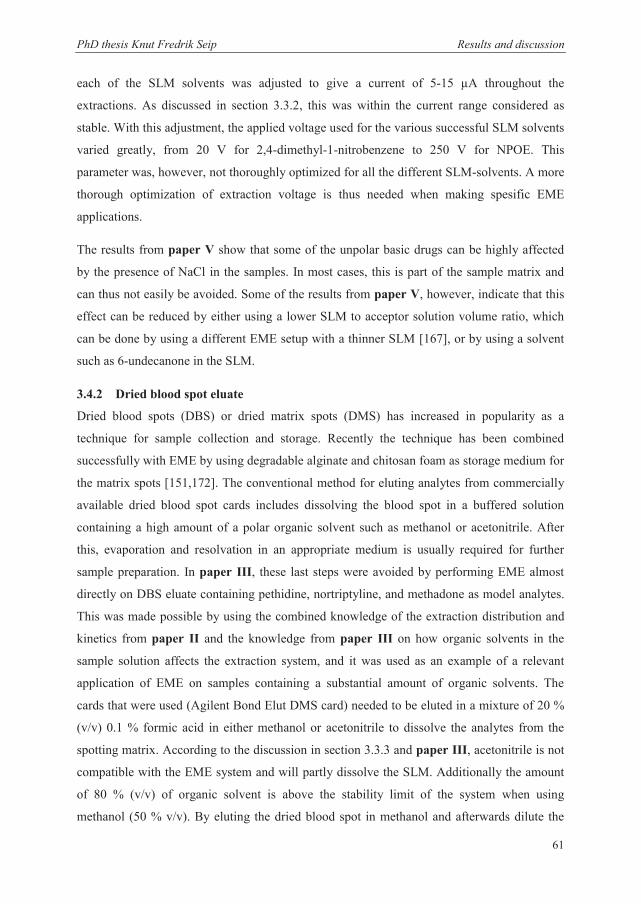
PhD thesis Knut Fredrik Seip Results and discussion
61
each of the SLM solvents was adjusted to give a current of 5-15 μA throughout the
extractions. As discussed in section 3.3.2, this was within the current range considered as
stable. With this adjustment, the applied voltage used for the various successful SLM solvents
varied greatly, from 20 V for 2,4-dimethyl-1-nitrobenzene to 250 V for NPOE. This
parameter was, however, not thoroughly optimized for all the different SLM-solvents. A more
thorough optimization of extraction voltage is thus needed when making spesific EME
applications.
The results from paper V show that some of the unpolar basic drugs can be highly affected
by the presence of NaCl in the samples. In most cases, this is part of the sample matrix and
can thus not easily be avoided. Some of the results from paper V, however, indicate that this
effect can be reduced by either using a lower SLM to acceptor solution volume ratio, which
can be done by using a different EME setup with a thinner SLM [167], or by using a solvent
such as 6-undecanone in the SLM.
3.4.2 Dried blood spot eluate
Dried blood spots (DBS) or dried matrix spots (DMS) has increased in popularity as a
technique for sample collection and storage. Recently the technique has been combined
successfully with EME by using degradable alginate and chitosan foam as storage medium for
the matrix spots [151,172]. The conventional method for eluting analytes from commercially
available dried blood spot cards includes dissolving the blood spot in a buffered solution
containing a high amount of a polar organic solvent such as methanol or acetonitrile. After
this, evaporation and resolvation in an appropriate medium is usually required for further
sample preparation. In paper III, these last steps were avoided by performing EME almost
directly on DBS eluate containing pethidine, nortriptyline, and methadone as model analytes.
This was made possible by using the combined knowledge of the extraction distribution and
kinetics from paper II and the knowledge from paper III on how organic solvents in the
sample solution affects the extraction system, and it was used as an example of a relevant
application of EME on samples containing a substantial amount of organic solvents. The
cards that were used (Agilent Bond Elut DMS card) needed to be eluted in a mixture of 20 %
(v/v) 0.1 % formic acid in either methanol or acetonitrile to dissolve the analytes from the
spotting matrix. According to the discussion in section 3.3.3 and paper III, acetonitrile is not
compatible with the EME system and will partly dissolve the SLM. Additionally the amount
of 80 % (v/v) of organic solvent is above the stability limit of the system when using
methanol (50 % v/v). By eluting the dried blood spot in methanol and afterwards dilute the
PhD thesis Knut Fredrik Seip Results and discussion
62
sample 1:1 (v/v) with 10 mM HCl, these challenges were circumvented and the sample was
now compatible with EME.
The samples containing 50 % (v/v) methanol was extracted with NPOE as the SLM, an
extraction voltage of 200 V, and an acceptor solution acidified with 10 mM HCl. As
discussed in section 3.2.3 and in
paper III, an increased extraction
time was needed when extracting
samples with a high amount of
organic solvent, and the required
extraction time in this case was
found to be 15-25 minutes,
compared to 5-10 minutes for the
extractions of basic drugs from
aqueous samples in paper II-V. An
LC-MS/MS chromatogram from an
extraction of pethidine, nortriptyline,
methadone, and haloperidol by
EME of a dried blood spot eluate is
shown in Figure 3.8.
As discussed in section 3.3.3 and in
paper III, the choices of organic
solvents when extracting from
partly organic sample solutions are
much more limited than for aqueous
samples. Several common SLM
solvents for basic drugs, such as
ENB or IPNB were too unstable
because of their higher solubility in
several organic solvents. However,
both NPOE and the even more
hydrophobic dodecyl-2-nitrophenyl
ether were still effective and stable.
Figure 3.8: A chromatogram from an extraction of pethidine, nortriptyline, methadone, and haloperidol after EME of dried blood spot eluate. Reprinted with permission from paper III © Elsevier B.V. (2013).
PhD thesis Knut Fredrik Seip Results and discussion
63
The resulting method was comparable to other standard DBS procedures when it came to
recovery and repeatability, and no significant matrix effects were detected. Additionally, the
time consumption and potential stability issues regarding an evaporation step were avoided
when performing EME directly on the DBS eluate.
3.4.3 Peptides
EME of peptides have been less investigated than extractions of basic drugs, but several
articles presenting optimized extraction systems for both peptides and amino acids have still
been published [139,142,143,148,152,153,157,160]. Many parameters from previously
optimized systems for the same set of model peptides were used during the work with paper I
and II [139,143,148]. As discussed in section 3.2.2, it was seen in paper I that several
alcohols or ketones in combination with a mono- or dialkylated phosphate as a carrier were
successful as SLM solvents for peptide extractions. Some of these solvents have been used
previously, where the most common SLM have consisted of 1-octanol in combination with
DEHP and sometimes also di-isobutyl ketone in various ratios [139,142,143,148]. Some
previously unused organic solvents for EME of peptides were revealed during the work with
paper I. These were ketones such as 2-nonanone and methylacetophenone or alcohols such as
1-nonanol and perillyl alcohol in combination with a carrier such as DEHP. Among the
different carriers tested, DEHP, TDP, and dibutyl phosphate were successful. Especially the
combination of 10 % (w/w) TDP in 2-octanone was shown to give improved recovery and
better repeatability compared to previously described SLMs. Similar effects on recovery, but
slightly improved extraction stability, was seen in paper II when 2-octanone was substituted
with the less water soluble 2-nonanone. Both paper I and II confirmed the necessity of
adding a carrier to the SLM when extracting peptides, as described in previous publications
[139,142,143,157,160].
When using an SLM of 2-nonanone with 10 % (w/w) TDP, it was shown in paper II that the
time to reach maximum recoveries were significantly longer for peptides than for basic drugs.
Figure 3.9 shows the recovery of the model peptides over time in this system. Where most of
the basic model drugs reached maximum recovery after 5-10 minutes, the model peptides
required 10-20 minutes. The time varied somewhat according to the affinity of the model
peptide to the organic solvent in the membrane, and it was increased for analytes with less
charges and a larger size. These results were consistent with previously optimized extractions
for some of the same peptides [139,142]. As for the extractions of basic drugs in paper II,
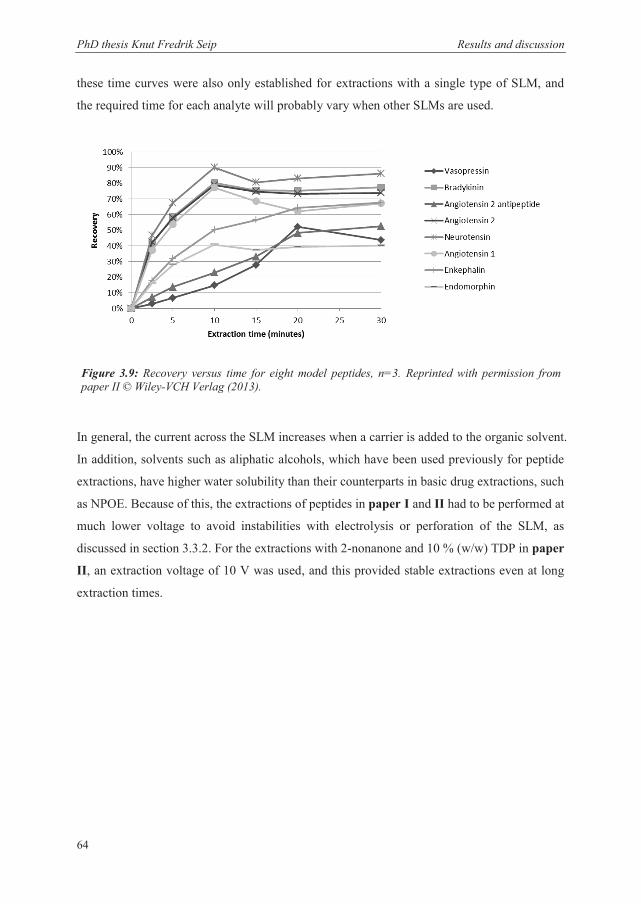
PhD thesis Knut Fredrik Seip Results and discussion
64
these time curves were also only established for extractions with a single type of SLM, and
the required time for each analyte will probably vary when other SLMs are used.
In general, the current across the SLM increases when a carrier is added to the organic solvent.
In addition, solvents such as aliphatic alcohols, which have been used previously for peptide
extractions, have higher water solubility than their counterparts in basic drug extractions, such
as NPOE. Because of this, the extractions of peptides in paper I and II had to be performed at
much lower voltage to avoid instabilities with electrolysis or perforation of the SLM, as
discussed in section 3.3.2. For the extractions with 2-nonanone and 10 % (w/w) TDP in paper
II, an extraction voltage of 10 V was used, and this provided stable extractions even at long
extraction times.
Figure 3.9: Recovery versus time for eight model peptides, n=3. Reprinted with permission from paper II © Wiley-VCH Verlag (2013).
PhD thesis Knut Fredrik Seip Concluding remarks
65
CONCLUDING REMARKS In the present thesis, several fundamental aspects of electromembrane extraction (EME) have
been investigated. The theoretical understanding of the extraction process in EME as a sample
preparation technique has been improved through thorough investigations of key aspects
regarding extraction efficiency, stability, and kinetics. These investigations involved
efficiency of different types of supported liquid membranes (SLM), extraction stability under
various conditions, and extractions from samples containing organic solvents or high amounts
of salts. The fundamental aspects investigated in the work with this thesis have been
systematically described in five papers. Some of the key discoveries during the work with this
thesis are summarized below:
The distribution of analytes over time in EME for extractions of unpolar basic drugs
and peptides was described by a phenomenological theoretical model, showing that
the mass transfer across the SLM was governed by both a distributive and
electrophoretic component. The time dependent recovery in the acceptor solution was
affected by factors such as volume of sample, SLM, acceptor solution, a potential
dependent distribution coefficient, effective membrane area, and a permeability
coefficient.
Several organic solvents for the SLM were classified as effective for both extractions
of unpolar basic drugs and peptides. For peptides, these solvents included some
primary alcohols and ketones combined with a mono- or disubstituted phosphate as a
carrier. For unpolar basic drugs, the successful solvents were either nitroaromatics or
ketones with a relatively low water solubility (<0.5 g/L), high proton acceptor
properties, low proton donor properties, and a high dipole moment.
The stability of the EME system was highly dependent on the type of SLM, and
especially SLM solvents with a relatively high water solubility (>0.5 g/L), small
molecular surface area, and low log P were unsuitable for EME because of high
current and water migration across the SLM. Current measurements throughout the
extractions were seen to be an effective tool to monitor potential stability issues.
Extractions with organic solvents in the sample were successfully performed in an
application where dried blood spot eluate was subjected to EME. These extractions
PhD thesis Knut Fredrik Seip Concluding remarks
66
were possible from samples containing up to 50 % (v/v) ethanol or methanol, or up to
75 % (v/v) DMSO in the sample solution. The total extraction recovery of these
samples compared to purely aqueous samples was unaffected, but the extraction
kinetics was slower, resulting in longer extraction times.
Extractions with substantial amounts of NaCl in the sample showed that the recovery
was reduced for some unpolar basic model analytes compared to samples without
NaCl. This effect was hypothesized to be caused by ion pairing in the SLM, and a
mathematical expression for analyte recovery in the presence of salt in the sample
solution was developed. It was seen that the reduction in recovery could be reduced or
eliminated by changing the organic solvent in the SLM or by reducing the SLM to
acceptor solution volume ratio (by using a thinner membrane).
This increased knowledge about the extraction process will hopefully be beneficial for further
development of EME as a promising sample preparation technique and as a way to improve
optimization of the EME system towards specific applications. Currently, several classes of
analytes, such as polar and acidic compounds have been difficult to extract, mainly caused by
a lack of efficient SLM materials. The increased understanding of the role of the SLM during
the extraction process for unpolar basic drugs and peptides described in this thesis might be a
step towards more effective EME systems also for other classes of analytes, and it can thus
broaden the applicability of the technique.
PhD thesis Knut Fredrik Seip References
67
REFERENCES
[1] S.M. Hanash, S.J. Pitteri, V.M. Faca, Nature 452 (2008) 571. [2] I. Neverova, J.E. Van Eyk, Journal of Chromatography B-Analytical Technologies in the
Biomedical and Life Sciences 815 (2005) 51. [3] M. Kandiah, P.L. Urban, Chem Soc Rev 42 (2013) 5299. [4] L. Novakova, J Chromatogr A 1292 (2013) 25. [5] F.M. Lagerwerf, W.D. van Dongen, R.J.J.M. Steenvoorden, M. Honing, J.H.G. Jonkman, Trac-
Trends in Analytical Chemistry 19 (2000) 418. [6] Y. Chen, Z. Guo, X. Wang, C. Qiu, J Chromatogr A 1184 (2008) 191. [7] P.J. Taylor, Clinical Biochemistry 38 (2005) 328. [8] H. Kataoka, Trac-Trends in Analytical Chemistry 22 (2003) 232. [9] L. Novakova, H. Vlckova, Anal Chim Acta 656 (2009) 8. [10] R.N.X. Xu, L.M. Fan, M.J. Rieser, T.A. El-Shourbagy, Journal of Pharmaceutical and Biomedical
Analysis 44 (2007) 342. [11] J.A. Jonsson, L. Mathiasson, J Chromatogr A 902 (2000) 205. [12] J.A. Jonsson, L. Mathiasson, Trac-Trends in Analytical Chemistry 11 (1992) 106. [13] L. Chimuka, E. Cukrowska, J.A. Jonsson, Pure and Applied Chemistry 76 (2004) 707. [14] G. Audunsson, Analytical Chemistry 58 (1986) 2714. [15] J.A. Jonsson, L. Mathiasson, Chromatographia 52 (2000) S8. [16] J.A. Jonsson, P. Lovkvist, G. Audunsson, G. Nilve, Analytica Chimica Acta 277 (1993) 9. [17] J.A. Jonsson, L. Mathiasson, Trac-Trends in Analytical Chemistry 18 (1999) 318. [18] J.A. Jonsson, Chromatographia 57 (2003) S317. [19] S. Pedersen-Bjergaard, K.E. Rasmussen, J Chromatogr A 1109 (2006) 183. [20] E. Thordarson, J.A. Jonsson, J. Emneus, Analytical Chemistry 72 (2000) 5280. [21] P. Wieczorek, J.A. Jonsson, L. Mathiasson, Analytica Chimica Acta 346 (1997) 191. [22] M. Papantoni, N.K. Djane, K. Ndungu, J.A. Jonsson, L. Mathiasson, Analyst 120 (1995) 1471. [23] M. Bryjak, P. Wieczorek, P. Kafarski, B. Lejczak, Journal of Membrane Science 56 (1991) 167. [24] T. Shinbo, T. Yamaguchi, H. Yanagishita, K. Sakaki, D. Kitamoto, M. Sugiura, Journal of
Membrane Science 84 (1993) 241. [25] J.A. Jonsson, L. Mathiasson, Trac-Trends in Analytical Chemistry 18 (1999) 325. [26] A. Poliwoda, N. Llczuk, P.P. Wieezorek, Separation and Purification Technology 57 (2007) 444. [27] A. Drapala, P. Dzygiel, J.A. Jonsson, P. Wieczorek, Acta Biochim Pol 48 (2001) 1113. [28] S. Pedersen-Bjergaard, K.E. Rasmussen, Anal Chem 71 (1999) 2650. [29] A. Gjelstad, K.E. Rasmussen, M.P. Parmer, S. Pedersen-Bjergaard, Bioanalysis 5 (2013) 1377. [30] L. Chimuka, T.A.M. Msagati, E. Cukrowska, H. Tutu, Journal of Chromatography A 1217 (2010)
2318. [31] J.A. Jonsson, J Sep Sci 24 (2001) 493. [32] I.J. Kjelsen, A. Gjelstad, K.E. Rasmussen, S. Pedersen-Bjergaard, J Chromatogr A 1180 (2008) 1. [33] L.J. Lozano, C. Godinez, A.P. de los Rios, F.J. Hernandez-Fernandez, S. Sanchez-Segado, F.J.
Alguacil, Journal of Membrane Science 376 (2011) 1. [34] J. Lezamiz, J.A. Jonsson, Journal of Chromatography A 1152 (2007) 226. [35] N.J. Petersen, S.T. Foss, H. Jensen, S.H. Hansen, C. Skonberg, D. Snakenborg, J.P. Kutter, S.
Pedersen-Bjergaard, Analytical Chemistry 83 (2011) 44. [36] L.E. Eibak, A. Gjelstad, K.E. Rasmussen, S. Pedersen-Bjergaard, J Chromatogr A 1217 (2010)
5050. [37] G. Morales-Cid, S. Cardenas, B.M. Simonet, M. Valcarcel, Trac-Trends in Analytical Chemistry
29 (2010) 158. [38] P. Kuban, A. Slampova, P. Bocek, Electrophoresis 31 (2010) 768. [39] W. Wang, F. Zhou, L. Zhao, J.R. Zhang, J.J. Zhu, Journal of Chromatography A 1170 (2007) 1.
PhD thesis Knut Fredrik Seip References
68
[40] A. Berduque, A. Sherburn, M. Ghita, R.A.W. Dryfe, D.W.M. Arrigan, Analytical Chemistry 77 (2005) 7310.
[41] Y.G. Park, Desalination 191 (2006) 404. [42] V.A. Shaposhnik, K. Kesore, Journal of Membrane Science 136 (1997) 35. [43] Z. Lazarova, W. Serro, Separation Science and Technology 37 (2002) 515. [44] G. Bargeman, G.H. Koops, J. Houwing, I. Breebaart, H.C. van der Horst, M. Wessling,
Desalination 149 (2002) 369. [45] J. Stichlmair, J. Schmidt, R. Proplesch, Chemical Engineering Science 47 (1992) 3015. [46] E. Vandervlis, M. Mazereeuw, U.R. Tjaden, H. Irth, J. Vandergreef, Journal of Chromatography
A 687 (1994) 333. [47] E. Vandervlis, M. Mazereeuw, U.R. Tjaden, H. Irth, J. Vandergreef, Journal of Chromatography
A 712 (1995) 227. [48] E. vanderVlis, M. Mazereeuw, U.R. Tjaden, H. Irth, J. vanderGreef, Journal of
Chromatography A 741 (1996) 13. [49] S. Pedersen-Bjergaard, K.E. Rasmussen, Trac-Trends in Analytical Chemistry 27 (2008) 934. [50] A. Berduque, D.W. Arrigan, Anal Chem 78 (2006) 2717. [51] C.J. Collins, D.W. Arrigan, Anal Bioanal Chem 393 (2009) 835. [52] A. Berduque, J. O'Brien, J. Alderman, D.W.M. Arrigan, Electrochemistry Communications 10
(2008) 20. [53] C.J. Collins, A. Berduque, D.W.M. Arrigan, Analytical Chemistry 80 (2008) 8102. [54] G. Herzog, V. Kam, A. Berduque, D.W.M. Arrigan, Journal of Agricultural and Food Chemistry
56 (2008) 4304. [55] G. Morales-Cid, B.M. Simonet, S. Cardenas, M. Valcarcel, Electrophoresis 29 (2008) 2033. [56] R.J. Raterink, P.W. Lindenburg, R.J. Vreeken, T. Hankemeier, Anal Chem 85 (2013) 7762. [57] H.H. See, P.C. Hauser, Anal Chem 83 (2011) 7507. [58] J.B. Zeng, J. Zou, X.H. Song, J.M. Chen, J.J. Ji, B. Wang, Y.R. Wang, J. Ha, X. Chen, Journal of
Chromatography A 1218 (2011) 191. [59] J. Pawliszyn, S. Pedersen-Bjergaard, Journal of Chromatographic Science 44 (2006) 291. [60] H. Kataoka, Anal Bioanal Chem 396 (2010) 339. [61] Y. Saito, K. Jinno, J Chromatogr A 1000 (2003) 53. [62] J. Pawliszyn, Anal Chem 75 (2003) 2543. [63] C.L. Arthur, J. Pawliszyn, Analytical Chemistry 62 (1990) 2145. [64] G.F. Ouyang, D. Vuckovic, J. Pawliszyn, Chemical Reviews 111 (2011) 2784. [65] C.F. Duan, Z. Shen, D.P. Wu, Y.F. Guan, Trac-Trends in Analytical Chemistry 30 (2011) 1568. [66] A. Namera, T. Saito, Bioanalysis 5 (2013) 915. [67] S. Risticevic, V.H. Niri, D. Vuckovic, J. Pawliszyn, Analytical and Bioanalytical Chemistry 393
(2009) 781. [68] R. Eisert, J. Pawliszyn, Analytical Chemistry 69 (1997) 3140. [69] I. Bruheim, X. Liu, J. Pawliszyn, Anal Chem 75 (2003) 1002. [70] E. Baltussen, P. Sandra, F. David, C. Cramers, Journal of Microcolumn Separations 11 (1999)
737. [71] J. Xu, J. Zheng, J. Tian, F. Zhu, F. Zeng, C. Su, G. Ouyang, TrAC - Trends in Analytical Chemistry
47 (2013) 68. [72] N. Fontanals, R.M. Marce, F. Borrull, J Chromatogr A 1152 (2007) 14. [73] A. Spietelun, M. Pilarczyk, A. Kloskowski, J. Namiesnik, Chem Soc Rev 39 (2010) 4524. [74] G. Ouyang, J. Pawliszyn, Anal Bioanal Chem 386 (2006) 1059. [75] L.J. Krutz, S.A. Senseman, A.S. Sciumbato, Journal of Chromatography A 999 (2003) 103. [76] H.H. Jelen, Journal of Chromatographic Science 44 (2006) 399. [77] W. Wardencki, M. Michulec, J. Curylo, International Journal of Food Science and Technology
39 (2004) 703. [78] F. Pragst, Analytical and Bioanalytical Chemistry 388 (2007) 1393. [79] H. Lai, P. Guerra, M. Joshi, J.R. Almirall, Journal of Separation Science 31 (2008) 402.
PhD thesis Knut Fredrik Seip References
69
[80] A. Kabir, H. Holness, K.G. Furton, J.R. Almirall, Trac-Trends in Analytical Chemistry 45 (2013) 264.
[81] M. Walles, W.M. Mullett, J. Pawliszyn, J Chromatogr A 1025 (2004) 85. [82] T. Kumazawa, X.P. Lee, K. Sato, O. Suzuki, Analytica Chimica Acta 492 (2003) 49. [83] F.M. Musteata, J. Pawliszyn, Journal of Biochemical and Biophysical Methods 70 (2007) 181. [84] H.H. Liu, P.K. Dasgupta, Trac-Trends in Analytical Chemistry 15 (1996) 468. [85] M.A. Jeannot, F.F. Cantwell, Analytical Chemistry 68 (1996) 2236. [86] J.M. Kokosa, Trac-Trends in Analytical Chemistry 43 (2013) 2. [87] C. Nerin, J. Salafranca, M. Aznar, R. Batlle, Anal Bioanal Chem 393 (2009) 809. [88] L. Xu, C. Basheer, H.K. Lee, Journal of Chromatography A 1152 (2007) 184. [89] Y. He, H.K. Lee, Analytical Chemistry 69 (1997) 4634. [90] H.H. Liu, P.K. Dasgupta, Analytical Chemistry 68 (1996) 1817. [91] M.H. Ma, F.F. Cantwell, Analytical Chemistry 71 (1999) 388. [92] K. Choi, S.J. Kim, Y.G. Jin, Y.O. Jang, J.S. Kim, D.S. Chung, Analytical Chemistry 81 (2009) 225. [93] A.L. Theis, A.J. Waldack, S.M. Hansen, M.A. Jeannot, Analytical Chemistry 73 (2001) 5651. [94] K.E. Rasmussen, S. Pedersen-Biergaard, Trac-Trends in Analytical Chemistry 23 (2004) 1. [95] S. Pedersen-Bjergaard, K.E. Rasmussen, J Chromatogr A 1184 (2008) 132. [96] M.A. Bello-Lopez, M. Ramos-Payan, J.A. Ocana-Gonzalez, R. Fernandez-Torres, M. Callejon-
Mochon, Analytical Letters 45 (2012) 804. [97] M. Ghambarian, Y. Yamini, A. Esrafili, Microchimica Acta 177 (2012) 271. [98] A. Gjelstad, H. Jensen, K.E. Rasmussen, S. Pedersen-Bjergaard, Anal Chim Acta 742 (2012) 10. [99] T.S. Ho, T.G. Halvorsen, S. Pedersen-Bjergaard, K.E. Rasmussen, J Chromatogr A 998 (2003)
61. [100] Y. Tao, J.F. Liu, X.L. Hu, H.C. Li, T. Wang, G.B. Jiang, Journal of Chromatography A 1216 (2009)
6259. [101] W. Liu, Z.Y. Wei, Q. Zhang, F. Wu, Z. Lin, Q.M. Lu, F. Lin, G.N. Chen, L. Zhang, Talanta 88 (2012)
43. [102] J.L. Reubsaet, H. Loftheim, A. Gjelstad, J Sep Sci 28 (2005) 1204. [103] J.L. Reubsaet, J.V. Paulsen, J Sep Sci 28 (2005) 295. [104] T.S. Ho, S. Pedersen-Bjergaard, K.E. Rasmussen, J Chromatogr Sci 44 (2006) 308. [105] L.M. Zhao, H.K. Lee, Analytical Chemistry 74 (2002) 2486. [106] S. Cui, S. Tan, G. Ouyang, J. Pawliszyn, J Chromatogr A 1216 (2009) 2241. [107] A. Esrafili, Y. Yamini, M. Ghambarian, B. Ebrahimpour, J Chromatogr A 1262 (2012) 27. [108] A. Esrafili, Y. Yamini, M. Ghambarian, M. Moradi, S. Seidi, J Sep Sci 34 (2011) 957. [109] G. Ouyang, J. Pawliszyn, Analytical Chemistry 78 (2006) 5783. [110] T.S. Ho, S. Pedersen-Bjergaard, K.E. Rasmussen, J Chromatogr A 963 (2002) 3. [111] T.S. Ho, T. Vasskog, T. Anderssen, E. Jensen, K.E. Rasmussen, S. Pedersen-Bjergaard, Anal
Chim Acta 592 (2007) 1. [112] K.F. Bardstu, T.S. Ho, K.E. Rasmussen, S. Pedersen-Bjergaard, J.A. Jonsson, J Sep Sci 30 (2007)
1364. [113] K.E. Rasmussen, S. Pedersen-Bjergaard, M. Krogh, H.G. Ugland, T. Gronhaug, J Chromatogr A
873 (2000) 3. [114] T.G. Halvorsen, S. Pedersen-Bjergaard, J.L.E. Reubsaet, K.E. Rasmussen, Journal of Separation
Science 24 (2001) 615. [115] T.G. Halvorsen, S. Pedersen-Bjergaard, K.E. Rasmussen, J Chromatogr B 760 (2001) 219. [116] M. Saraji, M. Khalili Boroujeni, A.A. Hajialiakbari Bidgoli, Anal Bioanal Chem 400 (2011) 2149. [117] K. Farhadi, M. Hatami, A.A. Matin, Biomedical Chromatography 26 (2012) 972. [118] A.N. Bautista-Flores, E.R.D. Miguel, J. de Gyves, J.A. Jonsson, Journal of Membrane Science
363 (2010) 180. [119] S. Dadfarnia, A.M.H. Shabani, Analytica Chimica Acta 658 (2010) 107. [120] J. Lee, H.K. Lee, K.E. Rasmussen, S. Pedersen-Bjergaard, Anal Chim Acta 624 (2008) 253. [121] C. Basheer, J.P. Obbard, H.K. Lee, Journal of Chromatography A 1068 (2005) 221.
PhD thesis Knut Fredrik Seip References
70
[122] A. Rodriguez, S. Pedersen-Bjergaard, K.E. Rasmussen, C. Nerin, J Chromatogr A 1198-1199 (2008) 38.
[123] M. Diaz-Alvarez, E. Turiel, A. Martin-Esteban, International Journal of Environmental Analytical Chemistry 93 (2013) 727.
[124] R. Romero-Gonzalez, E. Pastor-Montoro, J.L. Martinez-Vidal, A. Garrido-Frenich, Rapid Communications in Mass Spectrometry 20 (2006) 2701.
[125] N.J. Petersen, K.E. Rasmussen, S. Pedersen-Bjergaard, A. Gjelstad, Analytical Sciences 27 (2011) 965.
[126] S. Pedersen-Bjergaard, K.E. Rasmussen, Analytical and Bioanalytical Chemistry 388 (2007) 521.
[127] V. Krishna Marothu, M. Gorrepati, R. Vusa, J Chromatogr Sci 51 (2013) 619. [128] A. Gjelstad, S. Pedersen-Bjergaard, Bioanalysis 3 (2011) 787. [129] A. Gjelstad, S. Pedersen-Bjergaard, Analytical Methods 5 (2013) 4549. [130] P.W. Lindenburg, R. Ramautar, T. Hankemeier, Bioanalysis 5 (2013) 2785. [131] A. Gjelstad, T.M. Andersen, K.E. Rasmussen, S. Pedersen-Bjergaard, J Chromatogr A 1157
(2007) 38. [132] M. Balchen, A. Gjelstad, K.E. Rasmussen, S. Pedersen-Bjergaard, J Chromatogr A 1152 (2007)
220. [133] C. Basheer, S.H. Tan, H.K. Lee, J Chromatogr A 1213 (2008) 14. [134] J. Lee, F. Khalilian, H. Bagheri, H.K. Lee, Journal of Chromatography A 1216 (2009) 7687. [135] A. Gjelstad, K.E. Rasmussen, S. Pedersen-Bjergaard, Anal Bioanal Chem 393 (2009) 921. [136] A. Gjelstad, K.E. Rasmussen, S. Pedersen-Bjergaard, J Chromatogr A 1124 (2006) 29. [137] A. Gjelstad, K.E. Rasmussen, S. Pedersen-Bjergaard, J Chromatogr A 1174 (2007) 104. [138] T.M. Middelthon-Bruer, A. Gjelstad, K.E. Rasmussen, S. Pedersen-Bjergaard, J Sep Sci 31
(2008) 753. [139] M. Balchen, L. Reubsaet, S. Pedersen-Bjergaard, J Chromatogr A 1194 (2008) 143. [140] S. Nojavan, A.R. Fakhari, J Sep Sci 33 (2010) 3231. [141] L. Xu, P.C. Hauser, H.K. Lee, Journal of Chromatography A 1214 (2008) 17. [142] M. Balchen, T.G. Halvorsen, L. Reubsaet, S. Pedersen-Bjergaard, J Chromatogr A 1216 (2009)
6900. [143] M. Balchen, H. Jensen, L. Reubsaet, S. Pedersen-Bjergaard, J Sep Sci 33 (2010) 1665. [144] N.J. Petersen, H. Jensen, S.H. Hansen, K.E. Rasmussen, S. Pedersen-Bjergaard, J Chromatogr A
1216 (2009) 1496. [145] C. Basheer, J. Lee, S. Pedersen-Bjergaard, K.E. Rasmussen, H.K. Lee, J Chromatogr A 1217
(2010) 6661. [146] N.J. Petersen, H. Jensen, S.H. Hansen, S.T. Foss, D. Snakenborg, S. Pedersen-Bjergaard,
Microfluidics and Nanofluidics 9 (2010) 881. [147] Y.G. Guo, Y.Z. Yu, X.J. Liu, E.Q. Tang, Chemistry Letters 37 (2008) 1272. [148] M. Balchen, A.G. Hatterud, L. Reubsaet, S. Pedersen-Bjergaard, J Sep Sci 34 (2011) 186. [149] S. Seidi, Y. Yamini, A. Saleh, M. Moradi, J Sep Sci 34 (2011) 585. [150] M.D. Payan, B. Li, N.J. Petersen, H. Jensen, S.H. Hansen, S. Pedersen-Bjergaard, Anal Chim
Acta 785 (2013) 60. [151] L.E. Eibak, A.B. Hegge, K.E. Rasmussen, S. Pedersen-Bjergaard, A. Gjelstad, Anal Chem 84
(2012) 8783. [152] A. Slampova, P. Kuban, P. Bocek, J Chromatogr A 1234 (2012) 32. [153] M. Balchen, H. Lund, L. Reubsaet, S. Pedersen-Bjergaard, Anal Chim Acta 716 (2012) 16. [154] L.E. Eibak, A. Gjelstad, K.E. Rasmussen, S. Pedersen-Bjergaard, J Pharm Biomed Anal 57 (2012)
33. [155] N.C. Dominguez, A. Gjelstad, A.M. Nadal, H. Jensen, N.J. Petersen, S.H. Hansen, K.E.
Rasmussen, S. Pedersen-Bjergaard, J Chromatogr A 1248 (2012) 48. [156] A. deJuan, G. Fonrodona, E. Casassas, Trac-Trends in Analytical Chemistry 16 (1997) 52. [157] L. Strieglerova, P. Kuban, P. Bocek, J Chromatogr A 1218 (2011) 6248.
PhD thesis Knut Fredrik Seip References
71
[158] L.R. Snyder, Journal of Chromatography 92 (1974) 223. [159] L.R. Snyder, Journal of Chromatographic Science 16 (1978) 223. [160] M. Rezazadeh, Y. Yamini, S. Seidi, A. Esrafili, Analytica Chimica Acta 773 (2013) 52. [161] S. Seidi, Y. Yamini, A. Heydari, M. Moradi, A. Esrafili, M. Rezazadeh, Anal Chim Acta 701 (2011)
181. [162] L. Fotouhi, Y. Yamini, S. Molaei, S. Seidi, J Chromatogr A 1218 (2011) 8581. [163] A.R. Fakhari, H. Tabani, S. Nojavan, H. Abedi, Electrophoresis 33 (2012) 506. [164] S. Seidi, Y. Yamini, T. Baheri, R. Feizbakhsh, J Chromatogr A 1218 (2011) 3958. [165] K.S. Hasheminasab, A.R. Fakhari, A. Shahsavani, H. Ahmar, J Chromatogr A 1285 (2013) 1. [166] S.S. Davarani, H.R. Moazami, A.R. Keshtkar, M.H. Banitaba, S. Nojavan, Anal Chim Acta 783
(2013) 74. [167] C. Huang, L.E. Eibak, A. Gjelstad, X. Shen, R. Trones, H. Jensen, S. Pedersen-Bjergaard, J
Chromatogr A 1326 (2014) 7. [168] M. Rezazadeh, Y. Yamini, S. Seidi, A. Esrafili, Journal of Chromatography A 1262 (2012) 214. [169] M. Rezazadeh, Y. Yamini, S. Seidi, J Sep Sci 35 (2012) 571. [170] S. Seidi, Y. Yamini, M. Rezazadeh, Journal of Chromatography B-Analytical Technologies in
the Biomedical and Life Sciences 913 (2013) 138. [171] A.R. Fakhari, H. Tabani, H. Behdad, S. Nojavan, M. Taghizadeh, Microchemical Journal 106
(2013) 186. [172] C.P. Lodoen, L.E. Eng Eibak, K.E. Rasmussen, S. Pedersen-Bjergaard, T. Andersen, A. Gjelstad,
Bioanalysis 5 (2013) 317.


I


II


III


IV


V

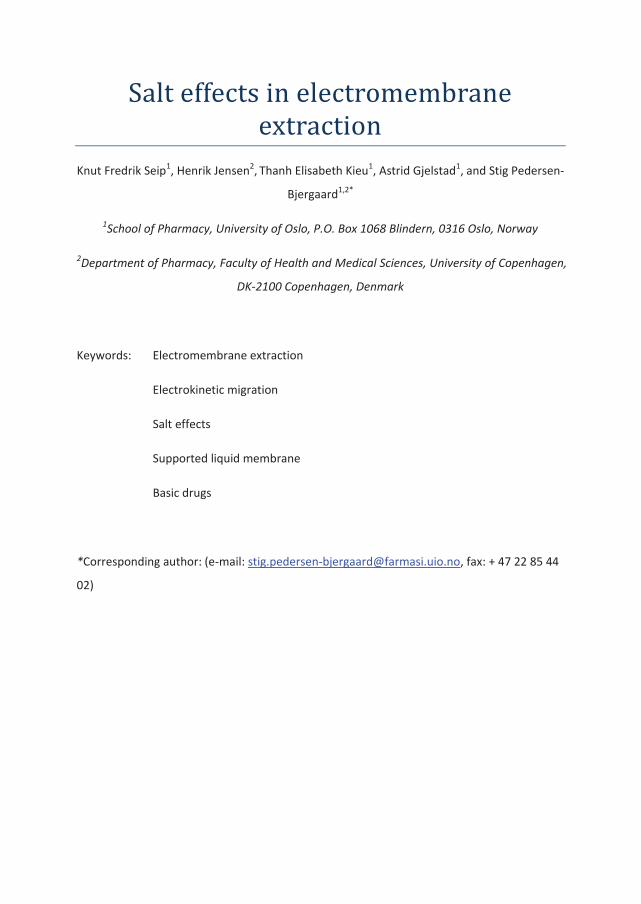
Salt effects in electromembrane extraction
Knut Fredrik Seip1, Henrik Jensen2, Thanh Elisabeth Kieu1, Astrid Gjelstad1, and Stig Pedersen-
Bjergaard1,2*
1School of Pharmacy, University of Oslo, P.O. Box 1068 Blindern, 0316 Oslo, Norway
2Department of Pharmacy, Faculty of Health and Medical Sciences, University of Copenhagen,
DK-2100 Copenhagen, Denmark
Keywords: Electromembrane extraction
Electrokinetic migration
Salt effects
Supported liquid membrane
Basic drugs
*Corresponding author: (e-mail: [email protected], fax: + 47 22 85 44
02)

Highlights:
Salt in the sample solution can reduce the recovery for some analytes in
electromembrane extraction
Salt effects have been explained by an ion pairing hypothesis
Salt effects were reduced by changing the solvent in the supported liquid membrane
Salt effects were reduced by using a lower supported liquid membrane volume
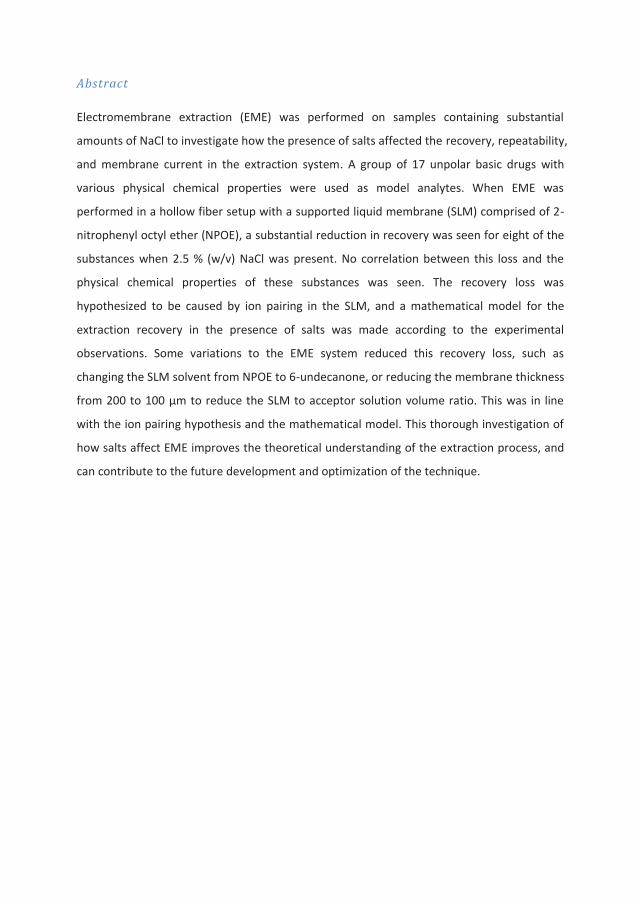
Abstract
Electromembrane extraction (EME) was performed on samples containing substantial
amounts of NaCl to investigate how the presence of salts affected the recovery, repeatability,
and membrane current in the extraction system. A group of 17 unpolar basic drugs with
various physical chemical properties were used as model analytes. When EME was
performed in a hollow fiber setup with a supported liquid membrane (SLM) comprised of 2-
nitrophenyl octyl ether (NPOE), a substantial reduction in recovery was seen for eight of the
substances when 2.5 % (w/v) NaCl was present. No correlation between this loss and the
physical chemical properties of these substances was seen. The recovery loss was
hypothesized to be caused by ion pairing in the SLM, and a mathematical model for the
extraction recovery in the presence of salts was made according to the experimental
observations. Some variations to the EME system reduced this recovery loss, such as
changing the SLM solvent from NPOE to 6-undecanone, or reducing the membrane thickness
from 200 to 100 μm to reduce the SLM to acceptor solution volume ratio. This was in line
with the ion pairing hypothesis and the mathematical model. This thorough investigation of
how salts affect EME improves the theoretical understanding of the extraction process, and
can contribute to the future development and optimization of the technique.
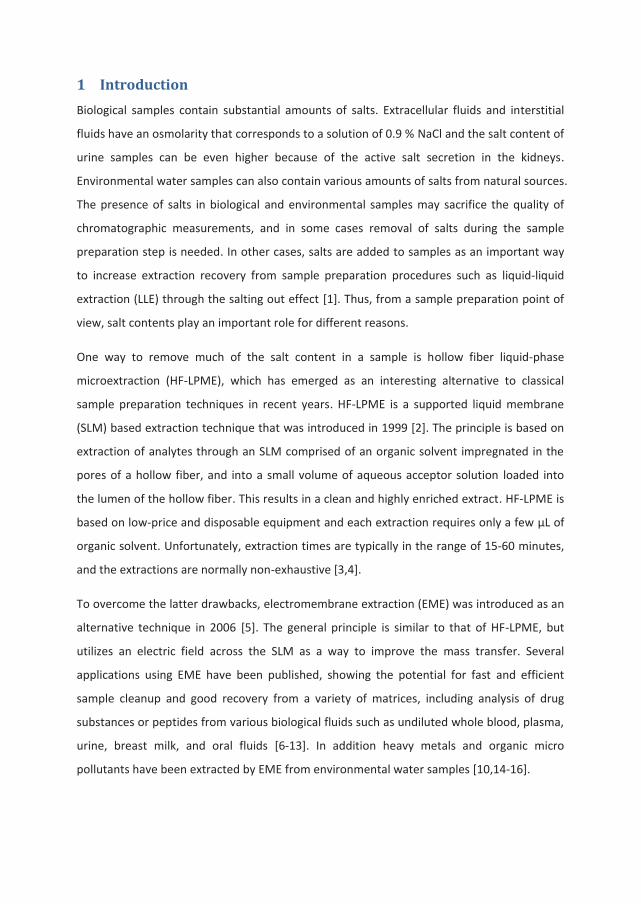
1 Introduction Biological samples contain substantial amounts of salts. Extracellular fluids and interstitial
fluids have an osmolarity that corresponds to a solution of 0.9 % NaCl and the salt content of
urine samples can be even higher because of the active salt secretion in the kidneys.
Environmental water samples can also contain various amounts of salts from natural sources.
The presence of salts in biological and environmental samples may sacrifice the quality of
chromatographic measurements, and in some cases removal of salts during the sample
preparation step is needed. In other cases, salts are added to samples as an important way
to increase extraction recovery from sample preparation procedures such as liquid-liquid
extraction (LLE) through the salting out effect [1]. Thus, from a sample preparation point of
view, salt contents play an important role for different reasons.
One way to remove much of the salt content in a sample is hollow fiber liquid-phase
microextraction (HF-LPME), which has emerged as an interesting alternative to classical
sample preparation techniques in recent years. HF-LPME is a supported liquid membrane
(SLM) based extraction technique that was introduced in 1999 [2]. The principle is based on
extraction of analytes through an SLM comprised of an organic solvent impregnated in the
pores of a hollow fiber, and into a small volume of aqueous acceptor solution loaded into
the lumen of the hollow fiber. This results in a clean and highly enriched extract. HF-LPME is
based on low-price and disposable equipment and each extraction requires only a few μL of
organic solvent. Unfortunately, extraction times are typically in the range of 15-60 minutes,
and the extractions are normally non-exhaustive [3,4].
To overcome the latter drawbacks, electromembrane extraction (EME) was introduced as an
alternative technique in 2006 [5]. The general principle is similar to that of HF-LPME, but
utilizes an electric field across the SLM as a way to improve the mass transfer. Several
applications using EME have been published, showing the potential for fast and efficient
sample cleanup and good recovery from a variety of matrices, including analysis of drug
substances or peptides from various biological fluids such as undiluted whole blood, plasma,
urine, breast milk, and oral fluids [6-13]. In addition heavy metals and organic micro
pollutants have been extracted by EME from environmental water samples [10,14-16].
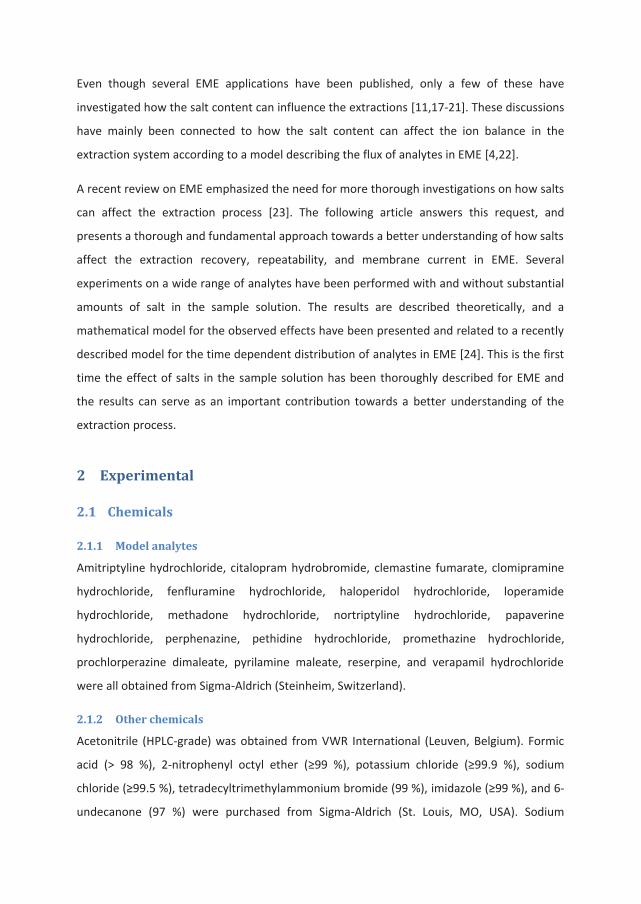
Even though several EME applications have been published, only a few of these have
investigated how the salt content can influence the extractions [11,17-21]. These discussions
have mainly been connected to how the salt content can affect the ion balance in the
extraction system according to a model describing the flux of analytes in EME [4,22].
A recent review on EME emphasized the need for more thorough investigations on how salts
can affect the extraction process [23]. The following article answers this request, and
presents a thorough and fundamental approach towards a better understanding of how salts
affect the extraction recovery, repeatability, and membrane current in EME. Several
experiments on a wide range of analytes have been performed with and without substantial
amounts of salt in the sample solution. The results are described theoretically, and a
mathematical model for the observed effects have been presented and related to a recently
described model for the time dependent distribution of analytes in EME [24]. This is the first
time the effect of salts in the sample solution has been thoroughly described for EME and
the results can serve as an important contribution towards a better understanding of the
extraction process.
2 Experimental
2.1 Chemicals
2.1.1 Model analytes
Amitriptyline hydrochloride, citalopram hydrobromide, clemastine fumarate, clomipramine
hydrochloride, fenfluramine hydrochloride, haloperidol hydrochloride, loperamide
hydrochloride, methadone hydrochloride, nortriptyline hydrochloride, papaverine
hydrochloride, perphenazine, pethidine hydrochloride, promethazine hydrochloride,
prochlorperazine dimaleate, pyrilamine maleate, reserpine, and verapamil hydrochloride
were all obtained from Sigma-Aldrich (Steinheim, Switzerland).
2.1.2 Other chemicals
Acetonitrile (HPLC-grade) was obtained from VWR International (Leuven, Belgium). Formic
acid (> 98 %), 2-nitrophenyl octyl ether (≥99 %), potassium chloride (≥99.9 %), sodium
chloride (≥99.5 %), tetradecyltrimethylammonium bromide (99 %), imidazole (≥99 %), and 6-
undecanone (97 %) were purchased from Sigma-Aldrich (St. Louis, MO, USA). Sodium
hydroxide (99 %) was obtained from VWR (Leuven, The Netherlands). Hydrochloric acid
(37 %), monosodium dihydrogen phosphate monohydrate (analysis grade), ortho-phosphoric
acid (85 %), potassium chromate (≥99 %), and potassium sulfate (≥99 %) were all purchased
from Merck (Darmstadt, Germany). A Milli-Q integral 3 water purification system (Millipore,
Billerica, MA, USA) supplied deionized water for all experiments.
2.2 Samples
Sample solutions were prepared daily by diluting stock solutions containing 1 mg mL-1 of
each model drug in methanol; stored at 4°C and protected from light. Dilutions were
performed with 10 mM HCl, to achieve the desired concentration of 1 μg mL-1 or 100 ng mL-1
of each drug substance before extraction.
2.3 Electromembrane extraction
2.3.1 Equipment and setup
Most of the extractions were performed using a hollow fiber setup as depicted previously [7].
The device consisted of three parts: a sample vial containing the sample solution, a porous
hollow fiber containing a supported liquid membrane in the pores of the fiber walls, and an
acceptor solution located inside the lumen of the hollow fiber. The sample compartment
was a glass vial with a volume of 2 mL of the type 2-SV with screw cap (Chromacol, Welwyn
Garden City, UK). A 2.4 cm piece of porous hollow fiber of the type PP Q3/2 polypropylene
hollow fiber, with a wall thickness of 200 μm, internal diameter of 1.2 mm, and a pore size of
0.2 μm (Membrana, Wuppertal, Germany) was mechanically sealed in the lower end and
attached by heat to the 2.1 cm end-piece of a pipette tip (Finntip 200 Ext, Thermo Electron,
Vantaa, Finland) in the upper end. Before extraction, this piece of hollow fiber was
impregnated by an organic liquid, comprising the SLM in the extraction setup. The lumen of
the hollow fiber was filled with an aqueous acceptor solution, making a three phase
extraction system when the hollow fiber was placed in the sample solution through a
perforated hole in the screw cap of the sample reservoir. Platinum wires with a diameter of
0.5 mm were used as electrodes (K. A. Rasmussen, Hamar, Norway), and placed in the
sample solution, through the lid of the sample compartment, and into the acceptor solution
in the lumen of the hollow fiber.
The other setup contained a thinner membrane and was used for a few experiments where
the membrane thickness had to be reduced, leading to a comparatively low SLM-to-acceptor
solution volume ratio. In this previously published extraction setup [25], the extraction
system is vertically aligned, with the sample solution in a lower compartment and acceptor
solution in an upper compartment, separated by an SLM between them. The sample solution
was kept in a 2.0 mL Eppendorf safe-lock PP tube (Eppendorf AG, Hamburg, Germany), and
the membrane was of the type Accurel PP 1E (R/P) with a thickness of 100 μm (Membrana,
Wuppertal, Germany), sealed by heat on the top of the wide end of a 10-1000 μL pipette tip
(Sartorius Biohit Liquid Handling Oy, Helsinki, Finland) by use of a Cotech soldering iron
station (Clas Ohlson AB, Insjon, Sweden). The SLM was made by impregnating this
membrane with an organic solvent and the acceptor solution reservoir was made up by the
remaining volume of the pipette tip. Electrodes of the same type as used in the hollow fiber
setup were positioned in the sample and acceptor solution. The piece of pipette tip
containing the SLM and the acceptor solution were placed on top of the sample solution in
the sample compartment.
In both systems, a power supply of the model ES 0300-0.45 from Delta Power Supplies (Delta
Electronika, Zierikzee, The Netherlands), with programmable voltage in the range 0-300 V
and current output from 0 to 450 mA, was used to create an electric field between the
electrodes. The systems were agitated during the extractions by an Eppendorff thermomixer
comfort (Eppendorff, Hamburg, Germany), and the SLM current was measured using a
custom-built device for measuring micro-currents. This device was controlled by a computer
with LabVIEW 8.2 software (National Instruments, Austin, TX, USA), which resulted in a plot
of SLM current over time for each extraction.
2.3.2 Extraction procedure
All extractions were performed according to previously optimized conditions for similar drug
substances [26]. A precalculated amount of a standard drug mix, containing the chosen
model analytes, was diluted with 10 mM HCl with or without 2.5 % (w/v) amounts of either
sodium chloride or potassium sulphate. A final concentration of 1 μg mL-1 in the sample
solution for each model analyte was typically used.
In the hollow fiber setup, the fiber was immersed in an organic liquid (either 2-nitrophenyl
octyl ether (NPOE) or 6-undecanone) for approximately five seconds to make the SLM. Any
excess solvent was wiped off by a medical wipe. A volume of 25 μL acceptor solution,
comprising 10 mM HCl, was then filled into the lumen of the hollow fiber by the use of a
microsyringe. The hollow fiber containing the SLM and acceptor solution was then inserted,
through a hole in the lid of the sample reservoir, into 1.0 mL of sample solution. A cathode
and anode was placed into the acceptor and sample solution, respectively. The extraction
device was then placed on an agitator, and extractions were performed by agitating the
system at 900 rpm and applying an electrical potential of 200 V with 6-undecanone and 250
V with NPOE, according to previously described conditions for maintaining a stable SLM
during extractions [27]. The extractions lasted for 5 minutes. Immediately after extraction,
the hollow fiber containing the SLM and acceptor solution was removed from the sample
compartment, and the acceptor solution was transferred to vials for further analysis by HPLC
or CE.
In the flat membrane setup, optimized conditions from a previously published article were
used [25]. A volume of 600 μL sample solution was added to the sample reservoir and the
anode was inserted into the solution. The SLM was then impregnated by adding 6 μL of
NPOE to the surface of the membrane, and the acceptor solution reservoir was filled with
600 μL 10 mM HCl. The anode was inserted into the acceptor solution and fixed in position
by using a small piece of a pipette tip placed into the acceptor reservoir. The compartment
containing the SLM and the acceptor solution was then pushed into the sample reservoir
until the two parts became firmly attached and the sample solution and SLM were
approximately 1 mm apart. The extraction device was then placed on an agitator, and
extractions were performed by agitating the system at 1100 rpm and applying an electrical
potential of 250 V. The extractions lasted for 15 minutes. Immediately after extraction, the
acceptor solution was transferred to vials for further analysis on HPLC.
2.4 Instrumentation
2.4.1 HPLC
All the extracts were analyzed on a Dionex Ultimate 3000 HPLC-system (Dionex Corporation,
Sunnyvale, CA, USA), comprised of a degasser (SRD-3200), pump (HPG-3200M), autosampler
(WPS-3000SL), column oven (FLM-3100), and a UV detector (VWD-3400), running
Chromeleon (v. 6.80 SP2 Build 2212) software (Dionex Corporation). Separation was
performed on a Gemini C18 (150 mm L x 2.00 mm i.d., 5 μm particle size and 110 Å pore size)
column from Phenomenex (Torrance, CA, USA), operated at 60 °C. The mobile phases
consisted of 20 mM formic acid and acetonitrile in a 95:5 v/v ratio for mobile phase A and
5:95 v/v for mobile phase B. Gradient elution was used, with a gradient that increased
linearly from 0 to 35 % mobile phase B over 20 minutes, followed by a washing procedure at
80 % mobile phase B for three minutes, before re-equilibration with mobile phase A for
seven minutes. The flow rate was 0.4 mL min-1 and the injection volume 10 μL. Detection
was performed with UV at 214 and 235 nm to ensure good signals for all the model analytes.
Total analysis time was 30 minutes per sample.
2.4.2 CE
A capillary electrophoresis instrument of the type Agilent Capillary Electrophoresis System
with Agilent 3-D-CE ChemStation software (both from Agilent Technologies, Santa Clara, CA,
USA) was used for measuring Na+ and Cl- ions by indirect UV. Separations were performed in
a fused-silica capillary with an inner diameter of 75 μm and effective length of 27 and 57 cm
(Polymicro Technologies, Phoenix, AZ, USA) for Na+ and Cl- ions respectively. The samples
were injected by using an applied hydrodynamic pressure of 50 mbar for five seconds. Other
operational parameters consisted of a stable capillary temperature of 25°C and an applied
voltage of 5 kV for Na+ ions and -15 kV for Cl- ions. Between each sample the capillary was
flushed with 100 mM NaOH for two minutes, followed by two minutes flushing with the
separation buffer. Detection was performed by indirect UV at a wavelength of 214 nm for
Na+ ions and 254 nm for Cl-.
For analysis of Na+ ions, a mixture of 6 mM imidazole and 4 mM formic acid was used as
separation buffer, according to a previously published method [28]. The imidazole was used
to generate a high background UV signal, which would be reduced in the prescence of Na+
ions. KCl was used as an internal standard.
When analyzing Cl- ions, the electroosmotic flow (EOF) was reversed to avoid poor peak
shapes, bad reproducibility, and long analysis time according to a previously published
method [29]. This was done by using a separation buffer consisting of 0.5 mM
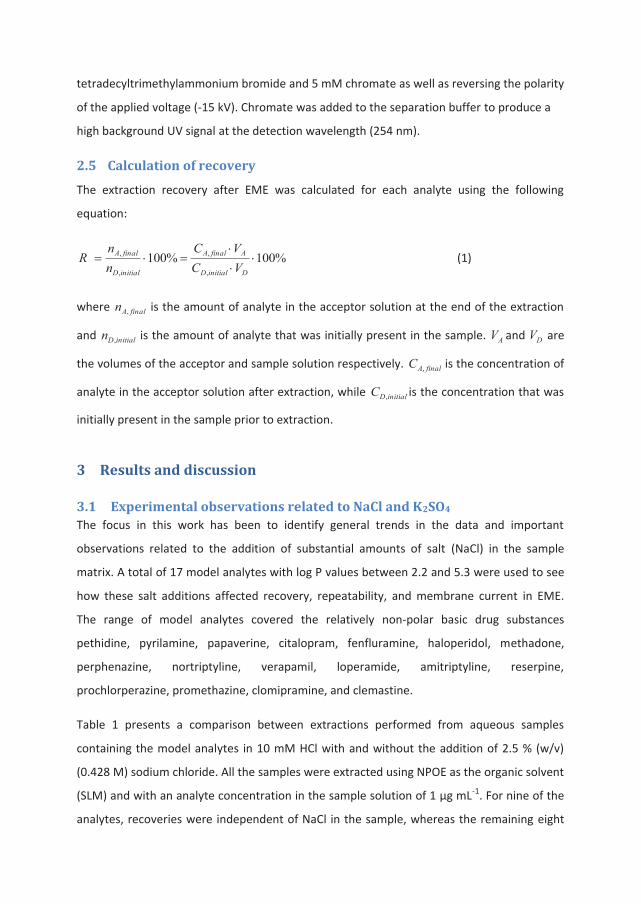
tetradecyltrimethylammonium bromide and 5 mM chromate as well as reversing the polarity
of the applied voltage (-15 kV). Chromate was added to the separation buffer to produce a
high background UV signal at the detection wavelength (254 nm).
2.5 Calculation of recovery
The extraction recovery after EME was calculated for each analyte using the following
equation:
%100%100,
,
,
,
DinitialD
AfinalA
initialD
finalA
VCVC
nn
R (1)
where finalAn , is the amount of analyte in the acceptor solution at the end of the extraction
and initialDn , is the amount of analyte that was initially present in the sample. AV and DV are
the volumes of the acceptor and sample solution respectively. finalAC , is the concentration of
analyte in the acceptor solution after extraction, while initialDC , is the concentration that was
initially present in the sample prior to extraction.
3 Results and discussion
3.1 Experimental observations related to NaCl and K2SO4 The focus in this work has been to identify general trends in the data and important
observations related to the addition of substantial amounts of salt (NaCl) in the sample
matrix. A total of 17 model analytes with log P values between 2.2 and 5.3 were used to see
how these salt additions affected recovery, repeatability, and membrane current in EME.
The range of model analytes covered the relatively non-polar basic drug substances
pethidine, pyrilamine, papaverine, citalopram, fenfluramine, haloperidol, methadone,
perphenazine, nortriptyline, verapamil, loperamide, amitriptyline, reserpine,
prochlorperazine, promethazine, clomipramine, and clemastine.
Table 1 presents a comparison between extractions performed from aqueous samples
containing the model analytes in 10 mM HCl with and without the addition of 2.5 % (w/v)
(0.428 M) sodium chloride. All the samples were extracted using NPOE as the organic solvent
(SLM) and with an analyte concentration in the sample solution of 1 μg mL-1. For nine of the
analytes, recoveries were independent of NaCl in the sample, whereas the remaining eight
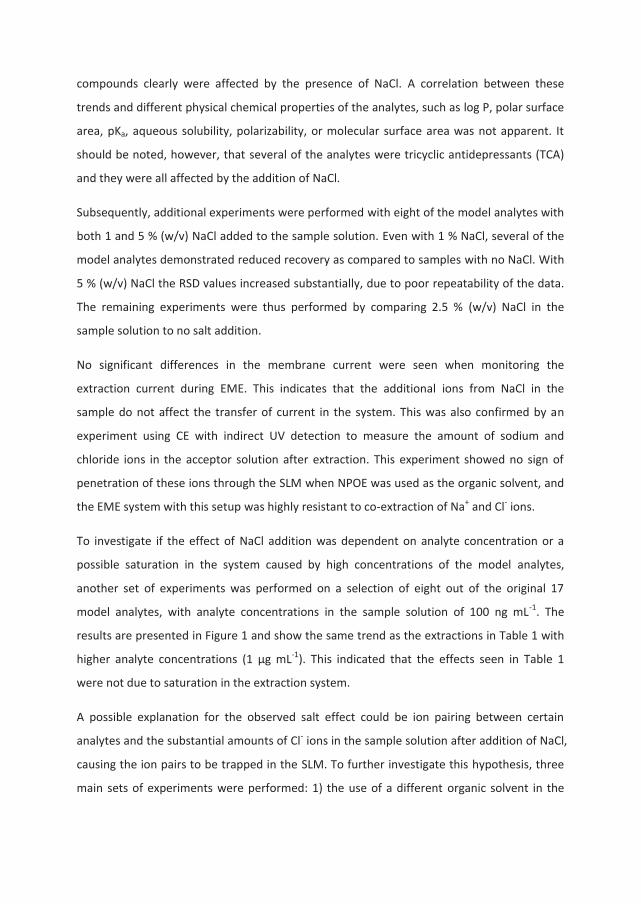
compounds clearly were affected by the presence of NaCl. A correlation between these
trends and different physical chemical properties of the analytes, such as log P, polar surface
area, pKa, aqueous solubility, polarizability, or molecular surface area was not apparent. It
should be noted, however, that several of the analytes were tricyclic antidepressants (TCA)
and they were all affected by the addition of NaCl.
Subsequently, additional experiments were performed with eight of the model analytes with
both 1 and 5 % (w/v) NaCl added to the sample solution. Even with 1 % NaCl, several of the
model analytes demonstrated reduced recovery as compared to samples with no NaCl. With
5 % (w/v) NaCl the RSD values increased substantially, due to poor repeatability of the data.
The remaining experiments were thus performed by comparing 2.5 % (w/v) NaCl in the
sample solution to no salt addition.
No significant differences in the membrane current were seen when monitoring the
extraction current during EME. This indicates that the additional ions from NaCl in the
sample do not affect the transfer of current in the system. This was also confirmed by an
experiment using CE with indirect UV detection to measure the amount of sodium and
chloride ions in the acceptor solution after extraction. This experiment showed no sign of
penetration of these ions through the SLM when NPOE was used as the organic solvent, and
the EME system with this setup was highly resistant to co-extraction of Na+ and Cl- ions.
To investigate if the effect of NaCl addition was dependent on analyte concentration or a
possible saturation in the system caused by high concentrations of the model analytes,
another set of experiments was performed on a selection of eight out of the original 17
model analytes, with analyte concentrations in the sample solution of 100 ng mL-1. The
results are presented in Figure 1 and show the same trend as the extractions in Table 1 with
higher analyte concentrations (1 μg mL-1). This indicated that the effects seen in Table 1
were not due to saturation in the extraction system.
A possible explanation for the observed salt effect could be ion pairing between certain
analytes and the substantial amounts of Cl- ions in the sample solution after addition of NaCl,
causing the ion pairs to be trapped in the SLM. To further investigate this hypothesis, three
main sets of experiments were performed: 1) the use of a different organic solvent in the
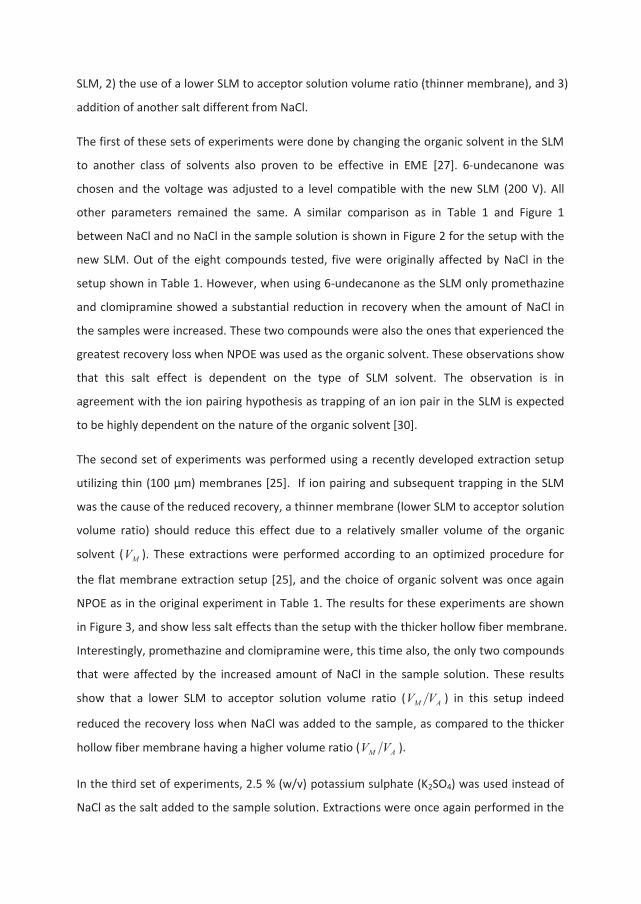
SLM, 2) the use of a lower SLM to acceptor solution volume ratio (thinner membrane), and 3)
addition of another salt different from NaCl.
The first of these sets of experiments were done by changing the organic solvent in the SLM
to another class of solvents also proven to be effective in EME [27]. 6-undecanone was
chosen and the voltage was adjusted to a level compatible with the new SLM (200 V). All
other parameters remained the same. A similar comparison as in Table 1 and Figure 1
between NaCl and no NaCl in the sample solution is shown in Figure 2 for the setup with the
new SLM. Out of the eight compounds tested, five were originally affected by NaCl in the
setup shown in Table 1. However, when using 6-undecanone as the SLM only promethazine
and clomipramine showed a substantial reduction in recovery when the amount of NaCl in
the samples were increased. These two compounds were also the ones that experienced the
greatest recovery loss when NPOE was used as the organic solvent. These observations show
that this salt effect is dependent on the type of SLM solvent. The observation is in
agreement with the ion pairing hypothesis as trapping of an ion pair in the SLM is expected
to be highly dependent on the nature of the organic solvent [30].
The second set of experiments was performed using a recently developed extraction setup
utilizing thin (100 μm) membranes [25]. If ion pairing and subsequent trapping in the SLM
was the cause of the reduced recovery, a thinner membrane (lower SLM to acceptor solution
volume ratio) should reduce this effect due to a relatively smaller volume of the organic
solvent ( MV ). These extractions were performed according to an optimized procedure for
the flat membrane extraction setup [25], and the choice of organic solvent was once again
NPOE as in the original experiment in Table 1. The results for these experiments are shown
in Figure 3, and show less salt effects than the setup with the thicker hollow fiber membrane.
Interestingly, promethazine and clomipramine were, this time also, the only two compounds
that were affected by the increased amount of NaCl in the sample solution. These results
show that a lower SLM to acceptor solution volume ratio ( AM VV ) in this setup indeed
reduced the recovery loss when NaCl was added to the sample, as compared to the thicker
hollow fiber membrane having a higher volume ratio ( AM VV ).
In the third set of experiments, 2.5 % (w/v) potassium sulphate (K2SO4) was used instead of
NaCl as the salt added to the sample solution. Extractions were once again performed in the
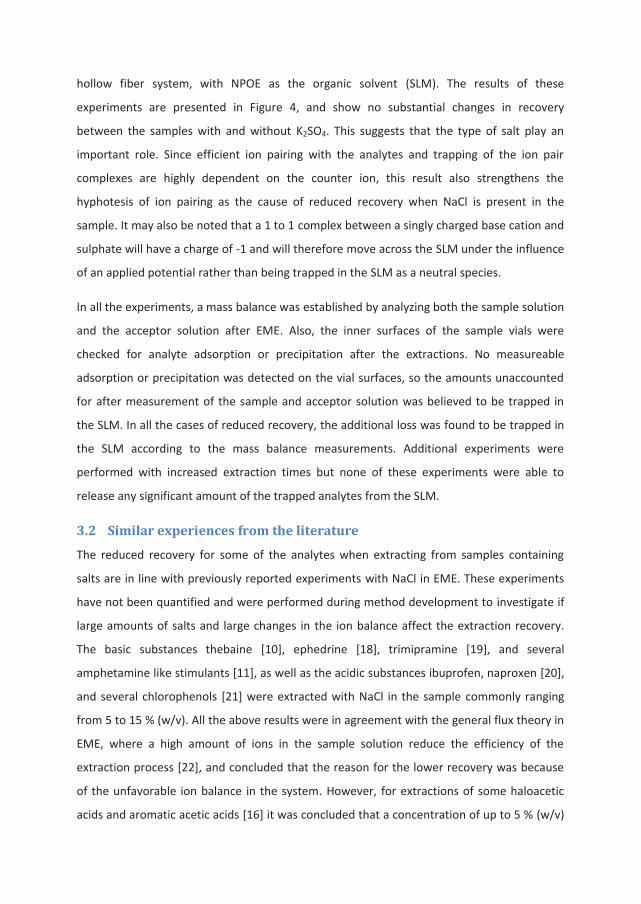
hollow fiber system, with NPOE as the organic solvent (SLM). The results of these
experiments are presented in Figure 4, and show no substantial changes in recovery
between the samples with and without K2SO4. This suggests that the type of salt play an
important role. Since efficient ion pairing with the analytes and trapping of the ion pair
complexes are highly dependent on the counter ion, this result also strengthens the
hyphotesis of ion pairing as the cause of reduced recovery when NaCl is present in the
sample. It may also be noted that a 1 to 1 complex between a singly charged base cation and
sulphate will have a charge of -1 and will therefore move across the SLM under the influence
of an applied potential rather than being trapped in the SLM as a neutral species.
In all the experiments, a mass balance was established by analyzing both the sample solution
and the acceptor solution after EME. Also, the inner surfaces of the sample vials were
checked for analyte adsorption or precipitation after the extractions. No measureable
adsorption or precipitation was detected on the vial surfaces, so the amounts unaccounted
for after measurement of the sample and acceptor solution was believed to be trapped in
the SLM. In all the cases of reduced recovery, the additional loss was found to be trapped in
the SLM according to the mass balance measurements. Additional experiments were
performed with increased extraction times but none of these experiments were able to
release any significant amount of the trapped analytes from the SLM.
3.2 Similar experiences from the literature
The reduced recovery for some of the analytes when extracting from samples containing
salts are in line with previously reported experiments with NaCl in EME. These experiments
have not been quantified and were performed during method development to investigate if
large amounts of salts and large changes in the ion balance affect the extraction recovery.
The basic substances thebaine [10], ephedrine [18], trimipramine [19], and several
amphetamine like stimulants [11], as well as the acidic substances ibuprofen, naproxen [20],
and several chlorophenols [21] were extracted with NaCl in the sample commonly ranging
from 5 to 15 % (w/v). All the above results were in agreement with the general flux theory in
EME, where a high amount of ions in the sample solution reduce the efficiency of the
extraction process [22], and concluded that the reason for the lower recovery was because
of the unfavorable ion balance in the system. However, for extractions of some haloacetic
acids and aromatic acetic acids [16] it was concluded that a concentration of up to 5 % (w/v)
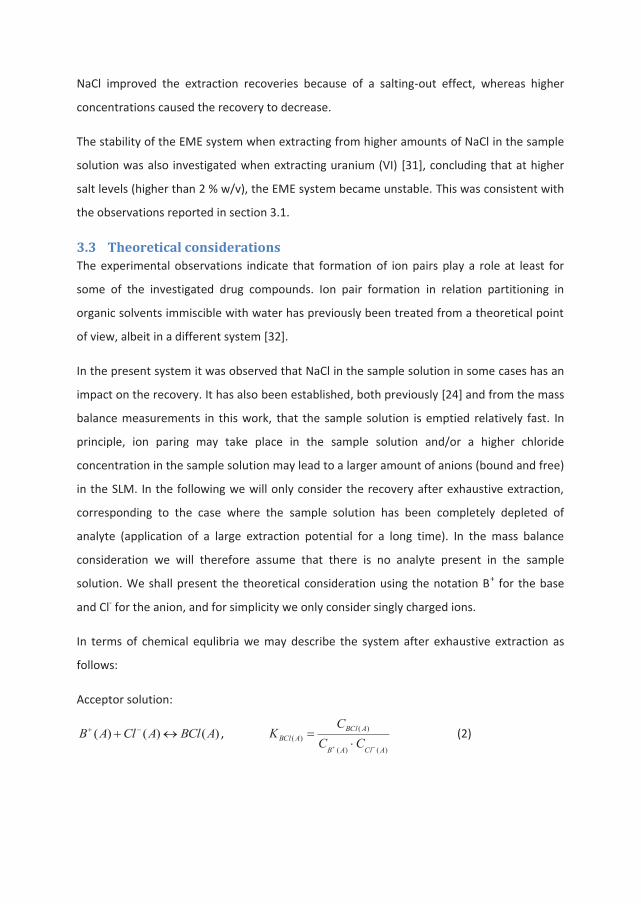
NaCl improved the extraction recoveries because of a salting-out effect, whereas higher
concentrations caused the recovery to decrease.
The stability of the EME system when extracting from higher amounts of NaCl in the sample
solution was also investigated when extracting uranium (VI) [31], concluding that at higher
salt levels (higher than 2 % w/v), the EME system became unstable. This was consistent with
the observations reported in section 3.1.
3.3 Theoretical considerations The experimental observations indicate that formation of ion pairs play a role at least for
some of the investigated drug compounds. Ion pair formation in relation partitioning in
organic solvents immiscible with water has previously been treated from a theoretical point
of view, albeit in a different system [32].
In the present system it was observed that NaCl in the sample solution in some cases has an
impact on the recovery. It has also been established, both previously [24] and from the mass
balance measurements in this work, that the sample solution is emptied relatively fast. In
principle, ion paring may take place in the sample solution and/or a higher chloride
concentration in the sample solution may lead to a larger amount of anions (bound and free)
in the SLM. In the following we will only consider the recovery after exhaustive extraction,
corresponding to the case where the sample solution has been completely depleted of
analyte (application of a large extraction potential for a long time). In the mass balance
consideration we will therefore assume that there is no analyte present in the sample
solution. We shall present the theoretical consideration using the notation B+ for the base
and Cl- for the anion, and for simplicity we only consider singly charged ions.
In terms of chemical equlibria we may describe the system after exhaustive extraction as
follows:
Acceptor solution:
)()()( ABClAClAB , )()(
)()(
AClAB
ABClABCl CC
CK (2)
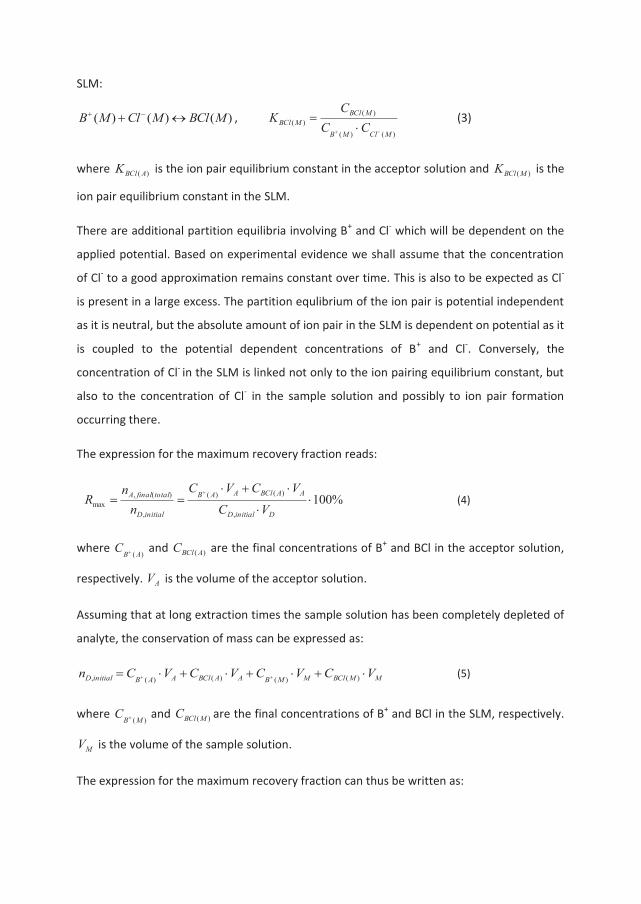
SLM:
)()()( MBClMClMB , )()(
)()(
MClMB
MBClMBCl CC
CK (3)
where )( ABClK is the ion pair equilibrium constant in the acceptor solution and )(MBClK is the
ion pair equilibrium constant in the SLM.
There are additional partition equilibria involving B+ and Cl- which will be dependent on the
applied potential. Based on experimental evidence we shall assume that the concentration
of Cl- to a good approximation remains constant over time. This is also to be expected as Cl-
is present in a large excess. The partition equlibrium of the ion pair is potential independent
as it is neutral, but the absolute amount of ion pair in the SLM is dependent on potential as it
is coupled to the potential dependent concentrations of B+ and Cl-. Conversely, the
concentration of Cl- in the SLM is linked not only to the ion pairing equilibrium constant, but
also to the concentration of Cl- in the sample solution and possibly to ion pair formation
occurring there.
The expression for the maximum recovery fraction reads:
%100,
)()(
,
)(,max
DinitialD
AABClAAB
initialD
totalfinalA
VC
VCVC
nn
R (4)
where )( ABC and )( ABClC are the final concentrations of B+ and BCl in the acceptor solution,
respectively. AV is the volume of the acceptor solution.
Assuming that at long extraction times the sample solution has been completely depleted of
analyte, the conservation of mass can be expressed as:
MMBClMMBAABClAABinitialD VCVCVCVCn )()()()(, (5)
where )(MBC and )(MBClC are the final concentrations of B+ and BCl in the SLM, respectively.
MV is the volume of the sample solution.
The expression for the maximum recovery fraction can thus be written as:
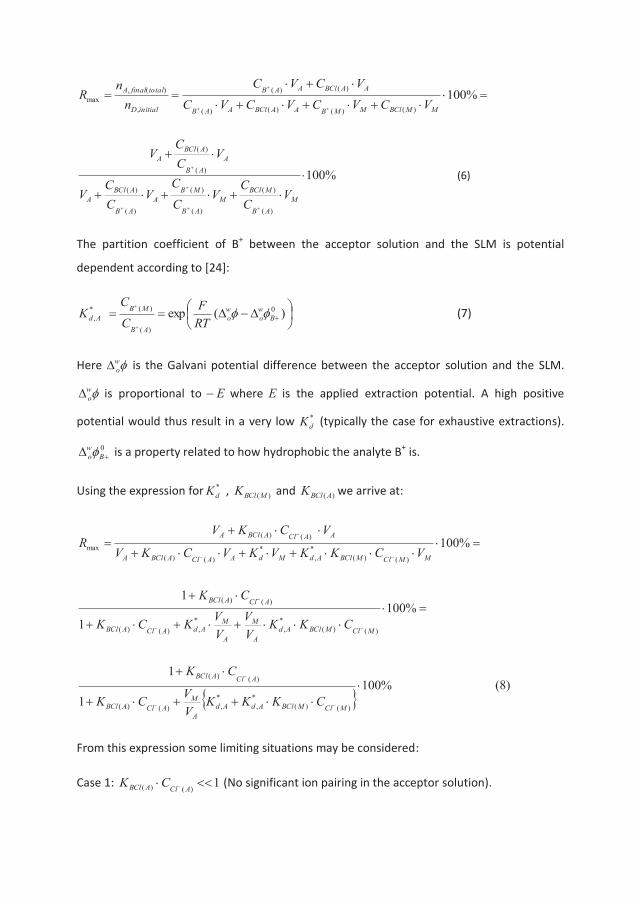
%100)()()()(
)()(
,
)(,max
MMBClMMBAABClAAB
AABClAAB
initialD
totalfinalA
VCVCVCVC
VCVC
nn
R
%100
)(
)(
)(
)(
)(
)(
)(
)(
MAB
MBClM
AB
MBA
AB
ABClA
AAB
ABClA
VCC
VCC
VCC
V
VCC
V
(6)
The partition coefficient of B+ between the acceptor solution and the SLM is potential
dependent according to [24]:
)(exp 0
)(
)(*, B
wo
wo
AB
MBAd RT
FC
CK (7)
Here wo is the Galvani potential difference between the acceptor solution and the SLM.
wo is proportional to E where E is the applied extraction potential. A high positive
potential would thus result in a very low *dK (typically the case for exhaustive extractions).
0B
wo is a property related to how hydrophobic the analyte B+ is.
Using the expression for *dK , )(MBClK and )( ABClK we arrive at:
%1001
1
%100
)()(*
,*
,)()(
)()(
)()(*
,*
)()(
)()(
max
MClMBClAdA
M
A
MAdAClABCl
AClABCl
MMClMBClAdMdAAClABClA
AAClABClA
CKKVV
VVKCK
CK
VCKKVKVCKV
VCKVR
%1001
1
)()(*
,*
,)()(
)()(
MClMBClAdAdA
MAClABCl
AClABCl
CKKKVVCK
CK (8)
From this expression some limiting situations may be considered:
Case 1: 1)()( AClABCl CK (No significant ion pairing in the acceptor solution).
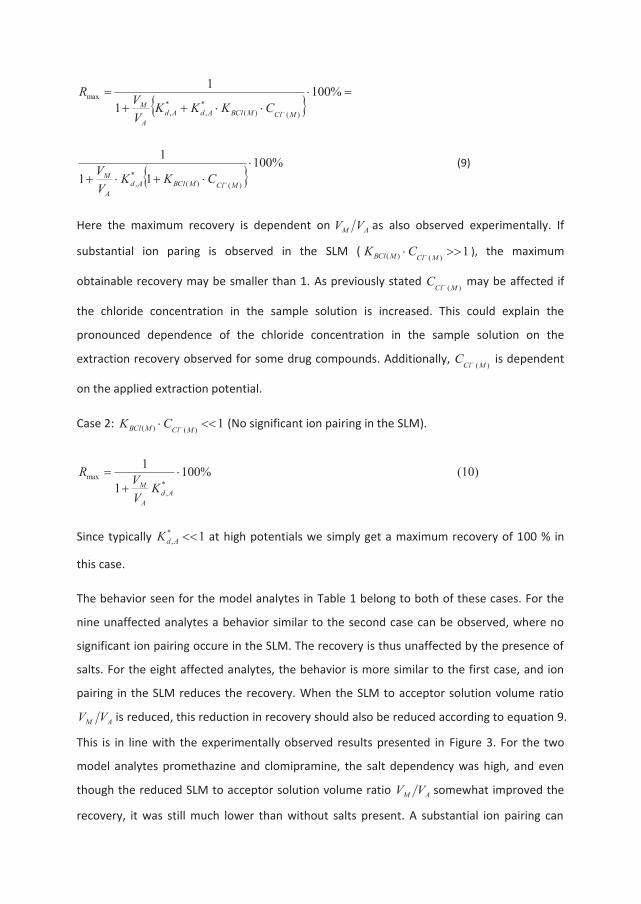
%1001
1
)()(*
,*
,
max
MClMBClAdAdA
M CKKKVVR
%10011
1
)()(*
, MClMBClAdA
M CKKVV (9)
Here the maximum recovery is dependent on AM VV as also observed experimentally. If
substantial ion paring is observed in the SLM ( 1)()( MClMBCl CK ), the maximum
obtainable recovery may be smaller than 1. As previously stated )(MClC may be affected if
the chloride concentration in the sample solution is increased. This could explain the
pronounced dependence of the chloride concentration in the sample solution on the
extraction recovery observed for some drug compounds. Additionally, )(MClC is dependent
on the applied extraction potential.
Case 2: 1)()( MClMBCl CK (No significant ion pairing in the SLM).
%1001
1*
,
max
AdA
M KVVR (10)
Since typically 1*,AdK at high potentials we simply get a maximum recovery of 100 % in
this case.
The behavior seen for the model analytes in Table 1 belong to both of these cases. For the
nine unaffected analytes a behavior similar to the second case can be observed, where no
significant ion pairing occure in the SLM. The recovery is thus unaffected by the presence of
salts. For the eight affected analytes, the behavior is more similar to the first case, and ion
pairing in the SLM reduces the recovery. When the SLM to acceptor solution volume ratio
AM VV is reduced, this reduction in recovery should also be reduced according to equation 9.
This is in line with the experimentally observed results presented in Figure 3. For the two
model analytes promethazine and clomipramine, the salt dependency was high, and even
though the reduced SLM to acceptor solution volume ratio AM VV somewhat improved the
recovery, it was still much lower than without salts present. A substantial ion pairing can
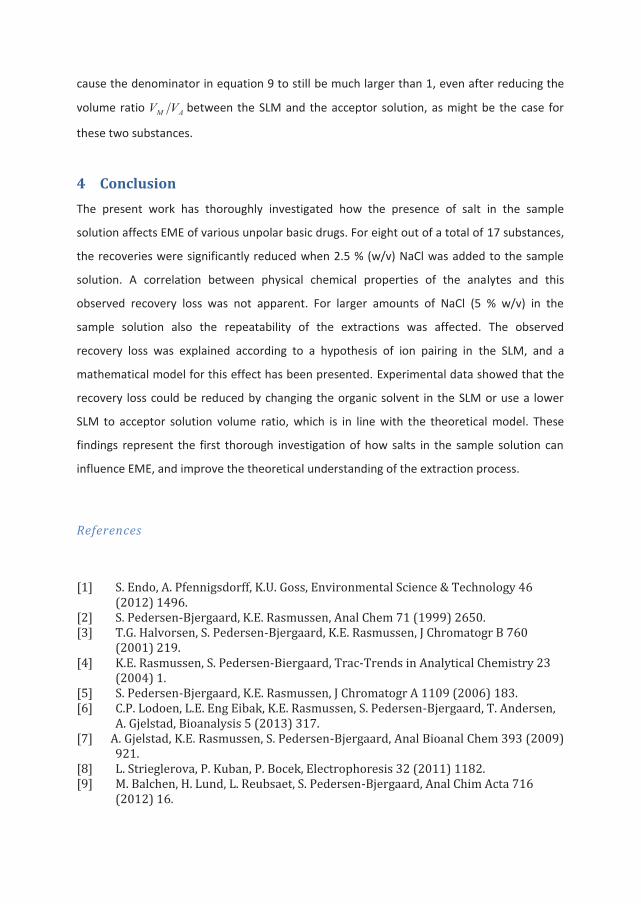
cause the denominator in equation 9 to still be much larger than 1, even after reducing the
volume ratio AM VV between the SLM and the acceptor solution, as might be the case for
these two substances.
4 Conclusion The present work has thoroughly investigated how the presence of salt in the sample
solution affects EME of various unpolar basic drugs. For eight out of a total of 17 substances,
the recoveries were significantly reduced when 2.5 % (w/v) NaCl was added to the sample
solution. A correlation between physical chemical properties of the analytes and this
observed recovery loss was not apparent. For larger amounts of NaCl (5 % w/v) in the
sample solution also the repeatability of the extractions was affected. The observed
recovery loss was explained according to a hypothesis of ion pairing in the SLM, and a
mathematical model for this effect has been presented. Experimental data showed that the
recovery loss could be reduced by changing the organic solvent in the SLM or use a lower
SLM to acceptor solution volume ratio, which is in line with the theoretical model. These
findings represent the first thorough investigation of how salts in the sample solution can
influence EME, and improve the theoretical understanding of the extraction process.
References
[1] S. Endo, A. Pfennigsdorff, K.U. Goss, Environmental Science & Technology 46 (2012) 1496.
[2] S. Pedersen-Bjergaard, K.E. Rasmussen, Anal Chem 71 (1999) 2650. [3] T.G. Halvorsen, S. Pedersen-Bjergaard, K.E. Rasmussen, J Chromatogr B 760
(2001) 219. [4] K.E. Rasmussen, S. Pedersen-Biergaard, Trac-Trends in Analytical Chemistry 23
(2004) 1. [5] S. Pedersen-Bjergaard, K.E. Rasmussen, J Chromatogr A 1109 (2006) 183. [6] C.P. Lodoen, L.E. Eng Eibak, K.E. Rasmussen, S. Pedersen-Bjergaard, T. Andersen,
A. Gjelstad, Bioanalysis 5 (2013) 317. [7] A. Gjelstad, K.E. Rasmussen, S. Pedersen-Bjergaard, Anal Bioanal Chem 393 (2009)
921. [8] L. Strieglerova, P. Kuban, P. Bocek, Electrophoresis 32 (2011) 1182. [9] M. Balchen, H. Lund, L. Reubsaet, S. Pedersen-Bjergaard, Anal Chim Acta 716
(2012) 16.
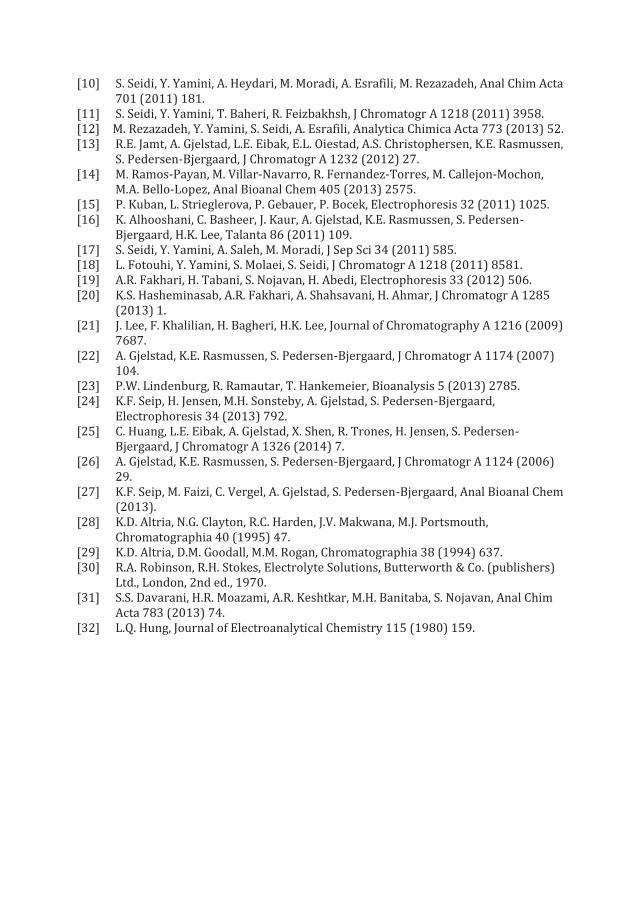
[10] S. Seidi, Y. Yamini, A. Heydari, M. Moradi, A. Esrafili, M. Rezazadeh, Anal Chim Acta 701 (2011) 181.
[11] S. Seidi, Y. Yamini, T. Baheri, R. Feizbakhsh, J Chromatogr A 1218 (2011) 3958. [12] M. Rezazadeh, Y. Yamini, S. Seidi, A. Esrafili, Analytica Chimica Acta 773 (2013) 52. [13] R.E. Jamt, A. Gjelstad, L.E. Eibak, E.L. Oiestad, A.S. Christophersen, K.E. Rasmussen,
S. Pedersen-Bjergaard, J Chromatogr A 1232 (2012) 27. [14] M. Ramos-Payan, M. Villar-Navarro, R. Fernandez-Torres, M. Callejon-Mochon,
M.A. Bello-Lopez, Anal Bioanal Chem 405 (2013) 2575. [15] P. Kuban, L. Strieglerova, P. Gebauer, P. Bocek, Electrophoresis 32 (2011) 1025. [16] K. Alhooshani, C. Basheer, J. Kaur, A. Gjelstad, K.E. Rasmussen, S. Pedersen-
Bjergaard, H.K. Lee, Talanta 86 (2011) 109. [17] S. Seidi, Y. Yamini, A. Saleh, M. Moradi, J Sep Sci 34 (2011) 585. [18] L. Fotouhi, Y. Yamini, S. Molaei, S. Seidi, J Chromatogr A 1218 (2011) 8581. [19] A.R. Fakhari, H. Tabani, S. Nojavan, H. Abedi, Electrophoresis 33 (2012) 506. [20] K.S. Hasheminasab, A.R. Fakhari, A. Shahsavani, H. Ahmar, J Chromatogr A 1285
(2013) 1. [21] J. Lee, F. Khalilian, H. Bagheri, H.K. Lee, Journal of Chromatography A 1216 (2009)
7687. [22] A. Gjelstad, K.E. Rasmussen, S. Pedersen-Bjergaard, J Chromatogr A 1174 (2007)
104. [23] P.W. Lindenburg, R. Ramautar, T. Hankemeier, Bioanalysis 5 (2013) 2785. [24] K.F. Seip, H. Jensen, M.H. Sonsteby, A. Gjelstad, S. Pedersen-Bjergaard,
Electrophoresis 34 (2013) 792. [25] C. Huang, L.E. Eibak, A. Gjelstad, X. Shen, R. Trones, H. Jensen, S. Pedersen-
Bjergaard, J Chromatogr A 1326 (2014) 7. [26] A. Gjelstad, K.E. Rasmussen, S. Pedersen-Bjergaard, J Chromatogr A 1124 (2006)
29. [27] K.F. Seip, M. Faizi, C. Vergel, A. Gjelstad, S. Pedersen-Bjergaard, Anal Bioanal Chem
(2013). [28] K.D. Altria, N.G. Clayton, R.C. Harden, J.V. Makwana, M.J. Portsmouth,
Chromatographia 40 (1995) 47. [29] K.D. Altria, D.M. Goodall, M.M. Rogan, Chromatographia 38 (1994) 637. [30] R.A. Robinson, R.H. Stokes, Electrolyte Solutions, Butterworth & Co. (publishers)
Ltd., London, 2nd ed., 1970. [31] S.S. Davarani, H.R. Moazami, A.R. Keshtkar, M.H. Banitaba, S. Nojavan, Anal Chim
Acta 783 (2013) 74. [32] L.Q. Hung, Journal of Electroanalytical Chemistry 115 (1980) 159.
Figure 1:
Extraction recovery (with RSD) for 8 different basic drugs in a concentration of 100 ng mL-1
after 5 minutes of EME with NPOE in the SLM. The extractions were performed with and
without 2.5 % (w/v) NaCl added to the sample solution (n=5).
Figure 2:
Extraction recovery (with RSD) for 8 different basic drugs after 5 minutes of EME with 6-
undecanone in the SLM. The extractions were performed with and without 2.5 % (w/v) NaCl
added to the sample solution (n=3).
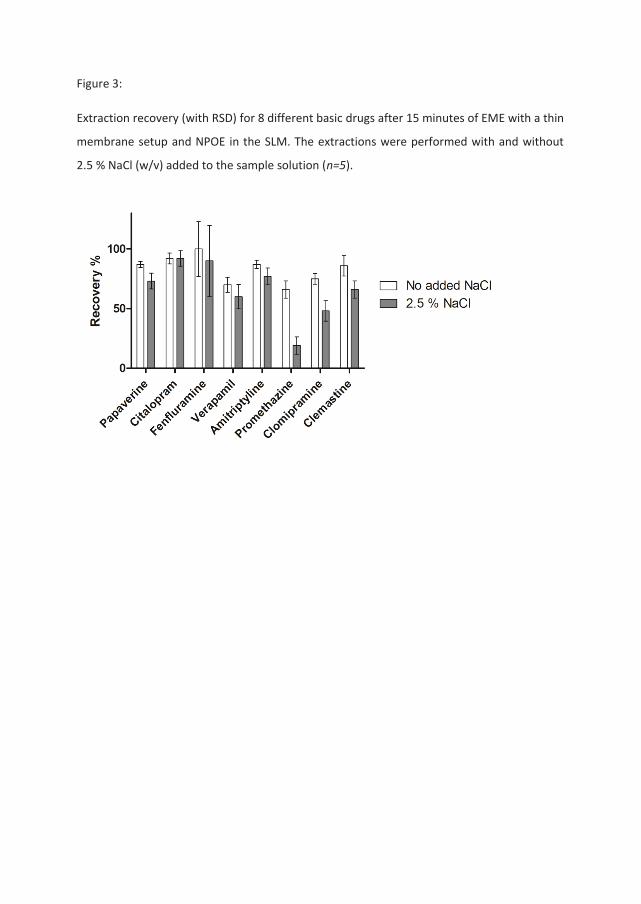
Figure 3:
Extraction recovery (with RSD) for 8 different basic drugs after 15 minutes of EME with a thin
membrane setup and NPOE in the SLM. The extractions were performed with and without
2.5 % NaCl (w/v) added to the sample solution (n=5).
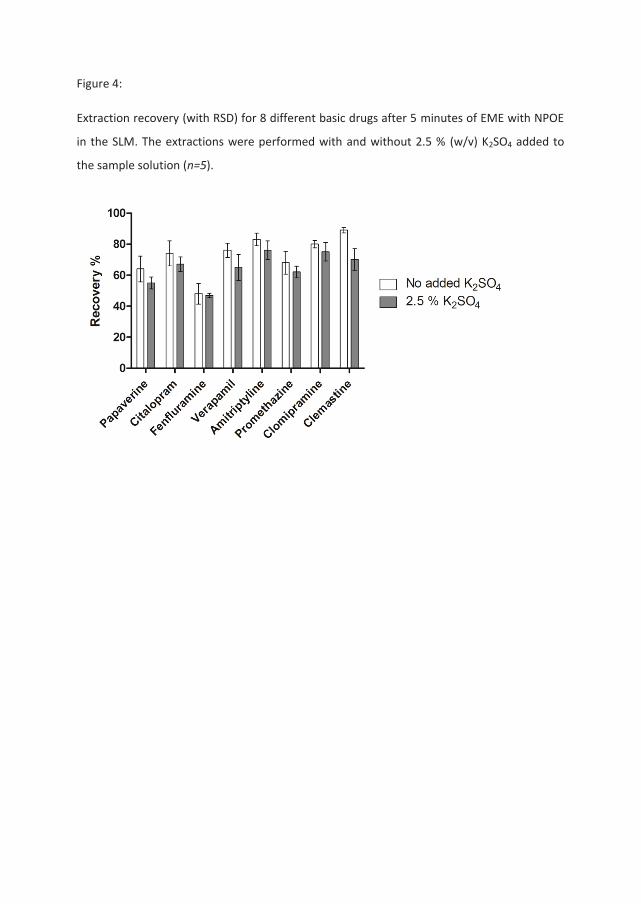
Figure 4:
Extraction recovery (with RSD) for 8 different basic drugs after 5 minutes of EME with NPOE
in the SLM. The extractions were performed with and without 2.5 % (w/v) K2SO4 added to
the sample solution (n=5).
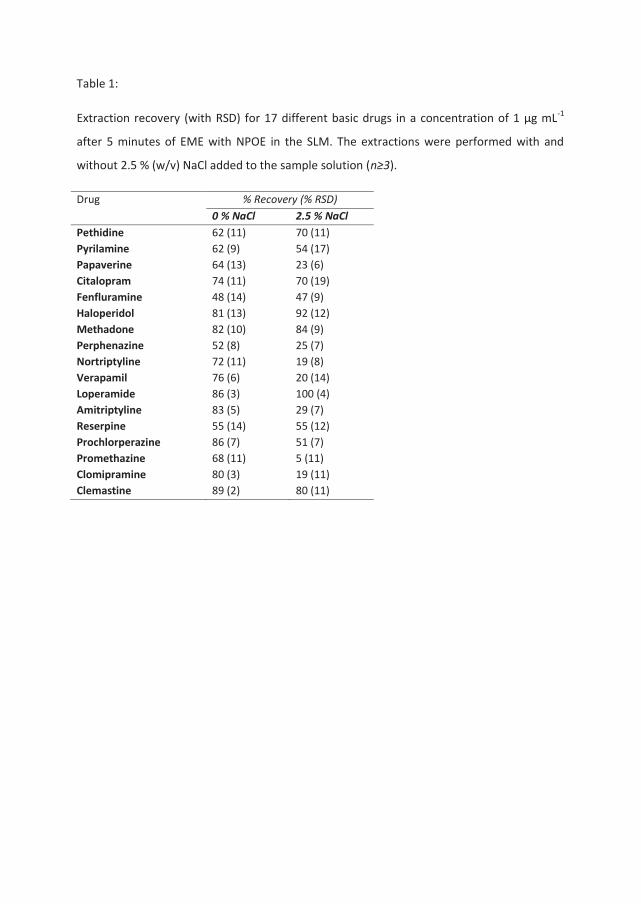
Table 1:
Extraction recovery (with RSD) for 17 different basic drugs in a concentration of 1 μg mL-1
after 5 minutes of EME with NPOE in the SLM. The extractions were performed with and
without 2.5 % (w/v) NaCl added to the sample solution (n≥3).
Drug % Recovery (% RSD) 0 % NaCl 2.5 % NaCl Pethidine 62 (11) 70 (11) Pyrilamine 62 (9) 54 (17) Papaverine 64 (13) 23 (6) Citalopram 74 (11) 70 (19) Fenfluramine 48 (14) 47 (9) Haloperidol 81 (13) 92 (12) Methadone 82 (10) 84 (9) Perphenazine 52 (8) 25 (7) Nortriptyline 72 (11) 19 (8) Verapamil 76 (6) 20 (14) Loperamide 86 (3) 100 (4) Amitriptyline 83 (5) 29 (7) Reserpine 55 (14) 55 (12) Prochlorperazine 86 (7) 51 (7) Promethazine 68 (11) 5 (11) Clomipramine 80 (3) 19 (11) Clemastine 89 (2) 80 (11)


