Electromembrane Extraction of Biologically Active Substances – Investigation of Fundamental Aspects Thesis for the degree Philosophiae Doctor by Knut Fredrik Seip Department of Pharmaceutical Chemistry School of Pharmacy University of Oslo Norway
Transcript
Electromembrane Extraction of Biologically Active Substances –
1.5.1 Introduction to the EME principle ................................................................................. 24
1.5.2 Extraction theory and kinetics ....................................................................................... 25
1.5.3 Factors of importance for extraction ............................................................................. 27
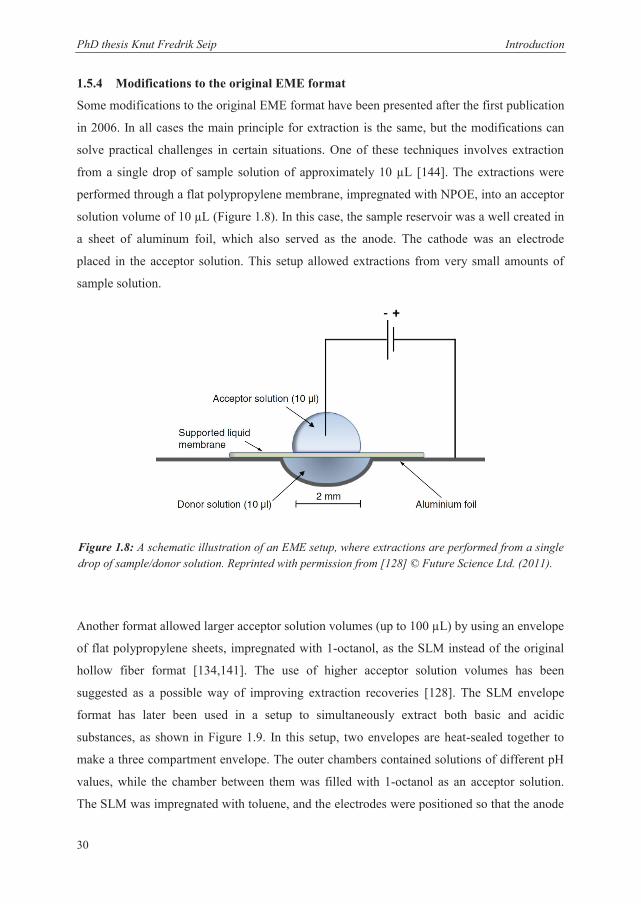
1.5.4 Modifications to the original EME format .................................................................... 30
1.5.5 Applications and performance of EME ......................................................................... 31
2 AIM OF THE STUDY ................................................................................................................ 35
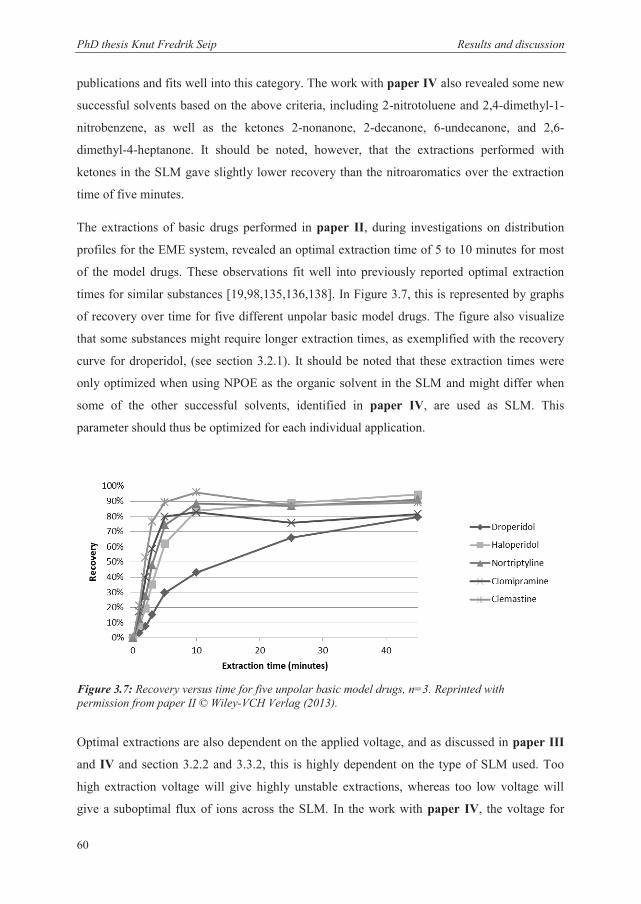
3 RESULTS AND DISCUSSION .................................................................................................. 36
3.1 Selection of model analytes and extraction conditions ..................................................... 36
3.1.1 Extraction conditions and technical setup ..................................................................... 36
3.1.2 Model analytes .............................................................................................................. 37
3.2 Investigation of theoretical aspects of EME ...................................................................... 41
3.2.1 A phenomenological theoretical model for the extraction process ............................... 41
3.2.2 Characteristics of the SLM ............................................................................................ 43
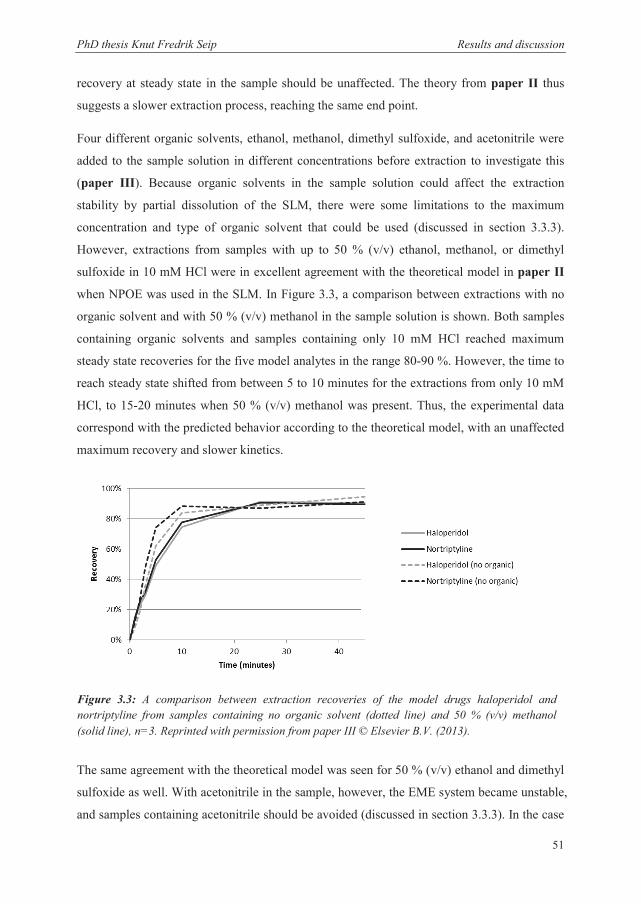
3.2.3 Recovery and kinetics when extracting from partly organic matrices .......................... 50
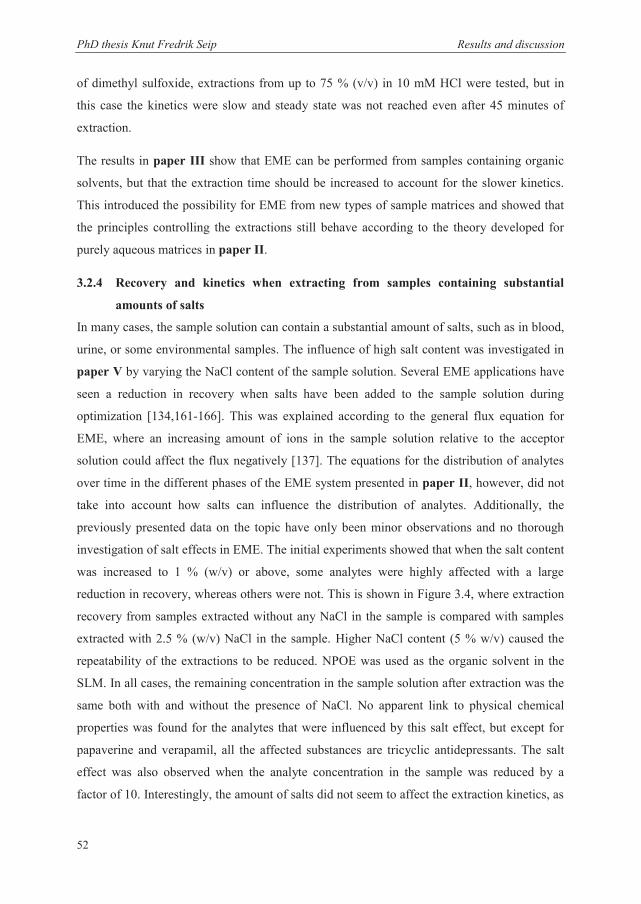
3.2.4 Recovery and kinetics when extracting from samples containing substantial amounts of salts ............................................................................................................. 52
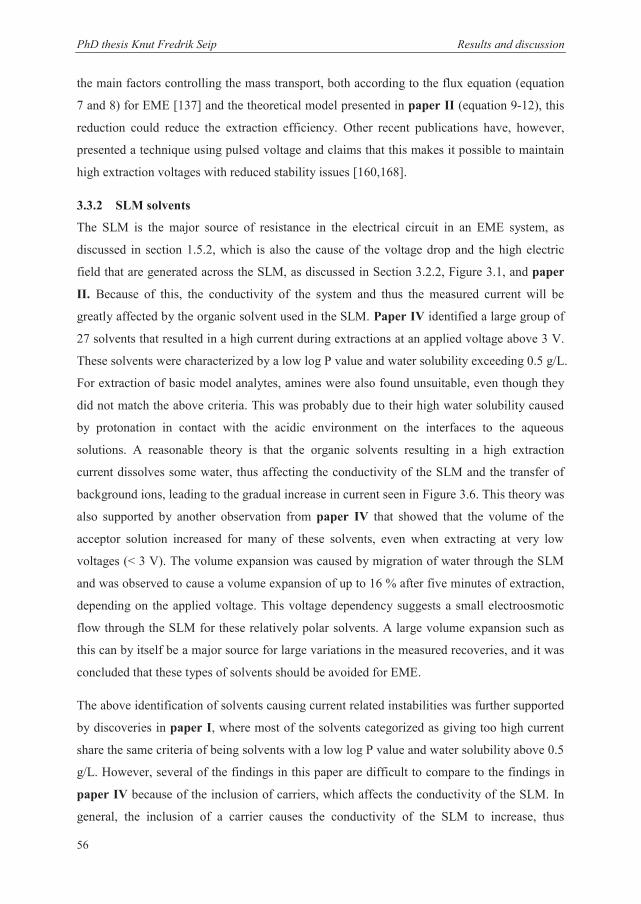
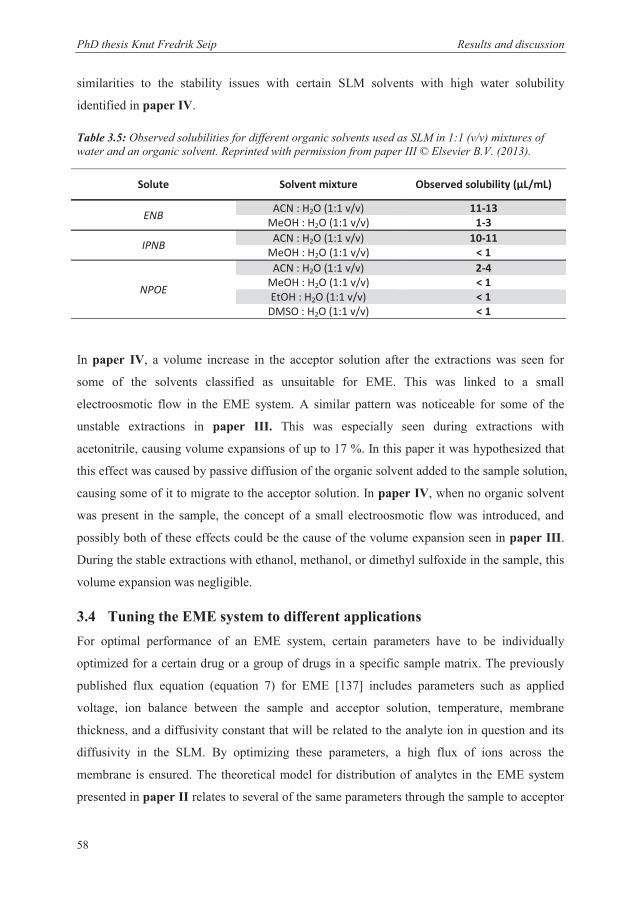
3.3 Stability considerations in EME ........................................................................................ 54
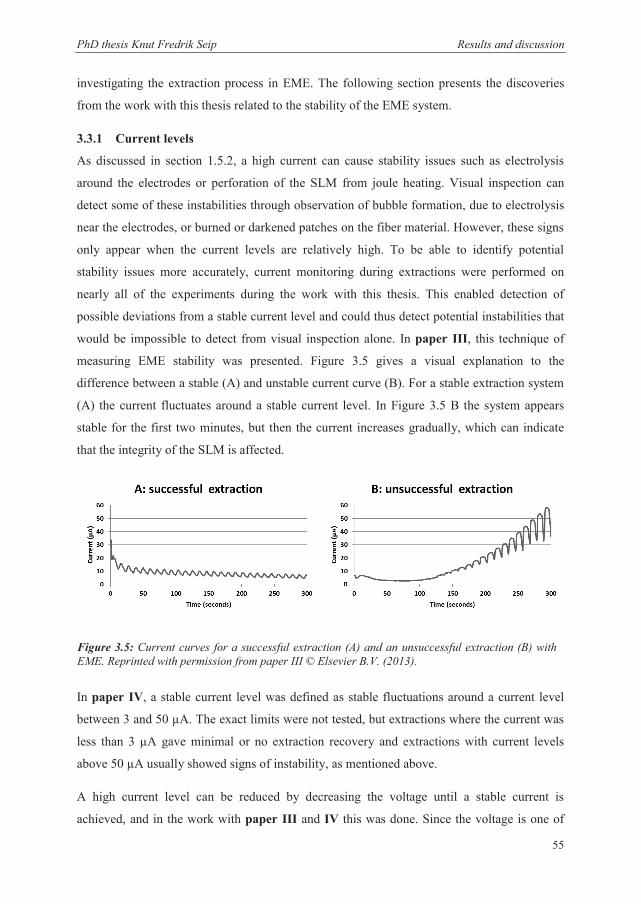
3.3.1 Current levels ................................................................................................................ 55
electromembrane extraction (EME) [19]. Some of these will be discussed further in section
1.4 and 1.5. In the different configurations, the membrane support material usually consists of
polypropylene (PP) or polytetrafluoroethylene (PTFE or Teflon) and is used either as a flat
membrane or a hollow fiber membrane [15,18,28,30,31]. The liquids impregnating the
membrane are water insoluble and non-viscous, and they are classically non-polar organic
liquids such as n-undecane, kerosene, dioctyl phosphate, and di-n-hexyl ether [11,15,30].
However, later applications and modifications have introduced other SLM solvents, such as
toluene, nitroaromatics, 1-octanol, and ionic liquids [19,28,30,32-34].
In the classic SLM extraction setup, the sample is continuously pumped through the donor
chamber while the liquid in the acceptor channel is kept stagnant, and the extraction
efficiency is highly dependent on the flow rate through the donor chamber [11,16]. In another
SLM based system, both the acceptor and donor solution has been pumped through their
respective chambers to monitor real time metabolism of certain drugs [35]. SLM based
extraction techniques have also been performed from systems where the entire sample volume
is located within the donor chamber (HF-LPME, PALME, EME). This setup has been
performed from small sample volumes with and without agitation or stirring [28,36].
1.3 The use of electric fields as a driving force in sample preparation The introduction of an electric field in sample preparation techniques will affect the
movement of charged substances according to the electrical force exerted on them. If the
electric field is constant, this force ( F ) is determined by the equation:
qEF (1)
where q is the charge of the substance and E is the electric field strength. In addition, an
electric field can have several other effects such as affecting the orientation of molecules
according to their dipole moments, electroosmosis, and electrochemical reactions [37,38]. The
effect of electroosmosis is for instance utilized in capillary electrophoresis (CE), where
migration of neutral substances is achieved by an electroosmotic flow [39]. Molecular
orientation can be important for passage through membrane systems and reduce frictional
forces between molecules, and electrochemical reactions can be utilized as a driving force for
molecules across boundaries [37,38,40,41]. All these effects can potentially be used to
facilitate selective extraction of analytes during sample preparation.
PhD thesis Knut Fredrik Seip Introduction
15
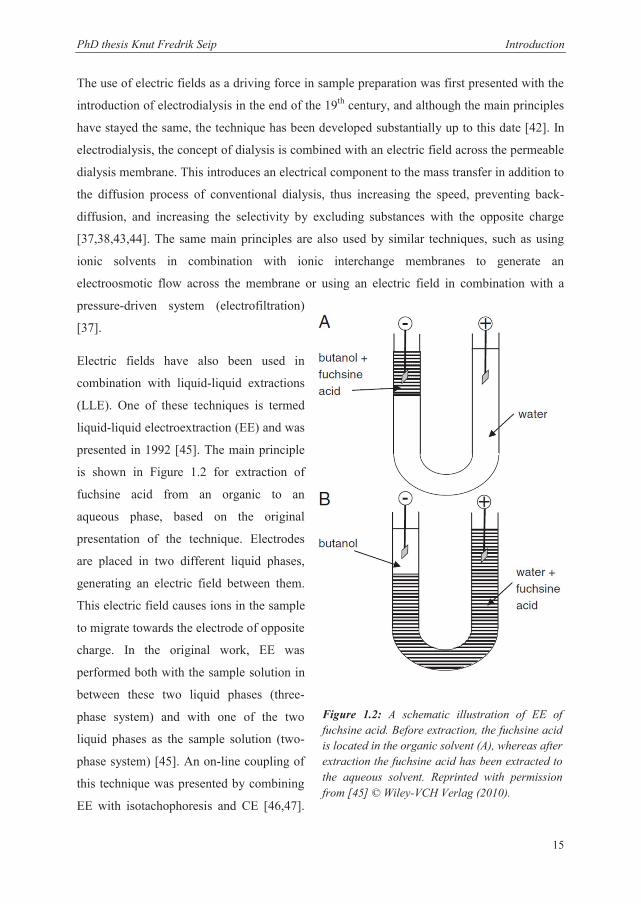
The use of electric fields as a driving force in sample preparation was first presented with the
introduction of electrodialysis in the end of the 19th century, and although the main principles
have stayed the same, the technique has been developed substantially up to this date [42]. In
electrodialysis, the concept of dialysis is combined with an electric field across the permeable
dialysis membrane. This introduces an electrical component to the mass transfer in addition to
the diffusion process of conventional dialysis, thus increasing the speed, preventing back-
diffusion, and increasing the selectivity by excluding substances with the opposite charge
[37,38,43,44]. The same main principles are also used by similar techniques, such as using
ionic solvents in combination with ionic interchange membranes to generate an
electroosmotic flow across the membrane or using an electric field in combination with a
In this technique, a small amount of terminating buffer is introduced in the end of the
capillary. By placing the end of the capillary in the sample solution while applying a voltage
and a counterpressure at the same time, analytes get focused between the terminating buffer
and leading buffer through isotachophoresis. Since the electric field and resulting
electroosmotic flow can destabilize the liquid-liquid interface between the sample and the
buffer, the counterpressure is maintained to stop the sample solution from entering the
capillary. After this step, the analytes can be determined by conventional CE. An on-line
technique was also presented for liquid chromatography by performing electroextraction
through a needle device directly in the autosampler [48]. Although electroextraction
introduced the concept of electric fields in combination with liquid-liquid extractions, few
articles on this technique have been presented during recent years. This has been suggested to
be the result of poor compatibility with aqueous samples, limited extraction efficiency due to
a small area of liquid-liquid interface where extraction occurs, and practical inconvenience
[49].
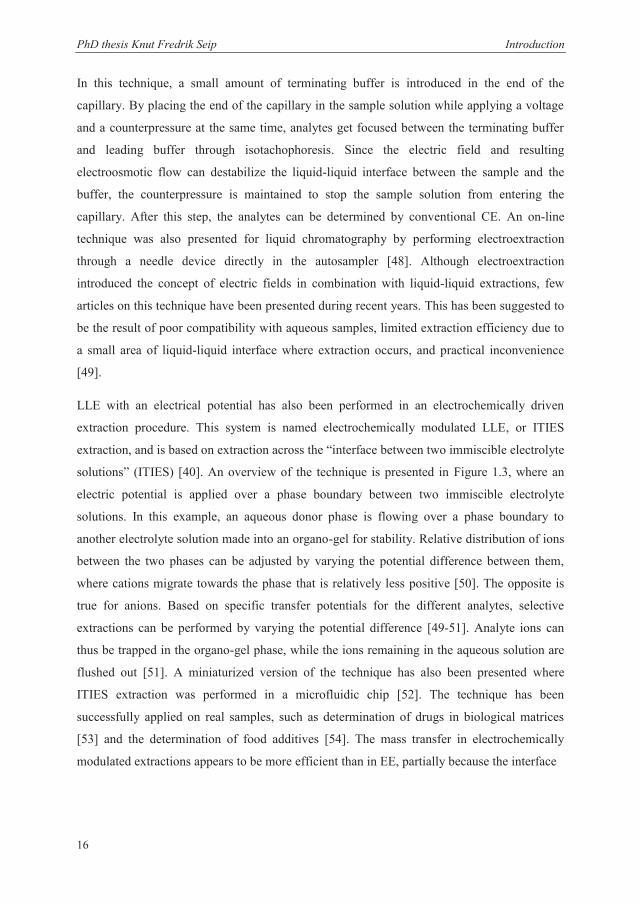
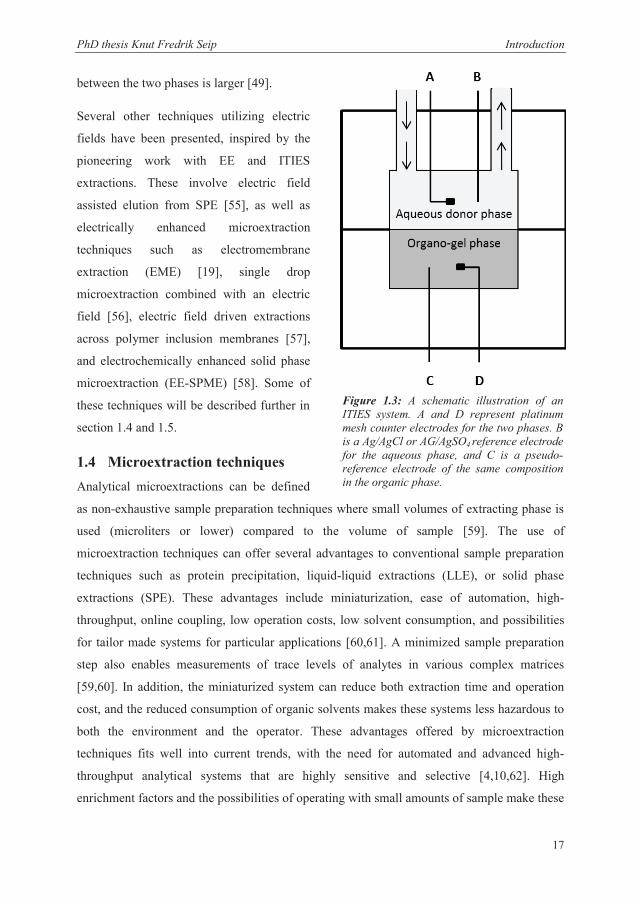
LLE with an electrical potential has also been performed in an electrochemically driven
extraction procedure. This system is named electrochemically modulated LLE, or ITIES
extraction, and is based on extraction across the “interface between two immiscible electrolyte
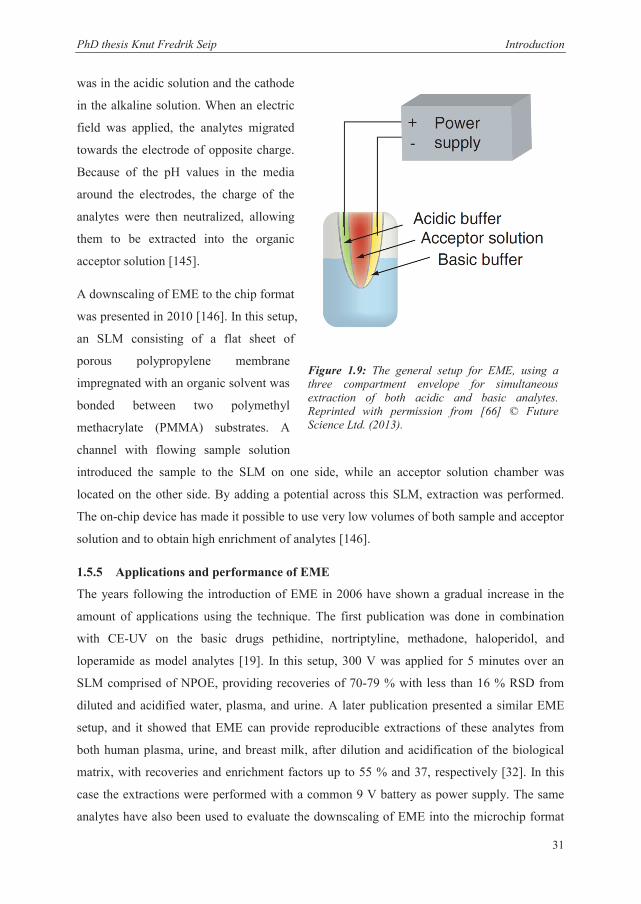
solutions” (ITIES) [40]. An overview of the technique is presented in Figure 1.3, where an
electric potential is applied over a phase boundary between two immiscible electrolyte
solutions. In this example, an aqueous donor phase is flowing over a phase boundary to
another electrolyte solution made into an organo-gel for stability. Relative distribution of ions
between the two phases can be adjusted by varying the potential difference between them,
where cations migrate towards the phase that is relatively less positive [50]. The opposite is
true for anions. Based on specific transfer potentials for the different analytes, selective
extractions can be performed by varying the potential difference [49-51]. Analyte ions can
thus be trapped in the organo-gel phase, while the ions remaining in the aqueous solution are
flushed out [51]. A miniaturized version of the technique has also been presented where
ITIES extraction was performed in a microfluidic chip [52]. The technique has been
successfully applied on real samples, such as determination of drugs in biological matrices
[53] and the determination of food additives [54]. The mass transfer in electrochemically
modulated extractions appears to be more efficient than in EE, partially because the interface
PhD thesis Knut Fredrik Seip Introduction
17
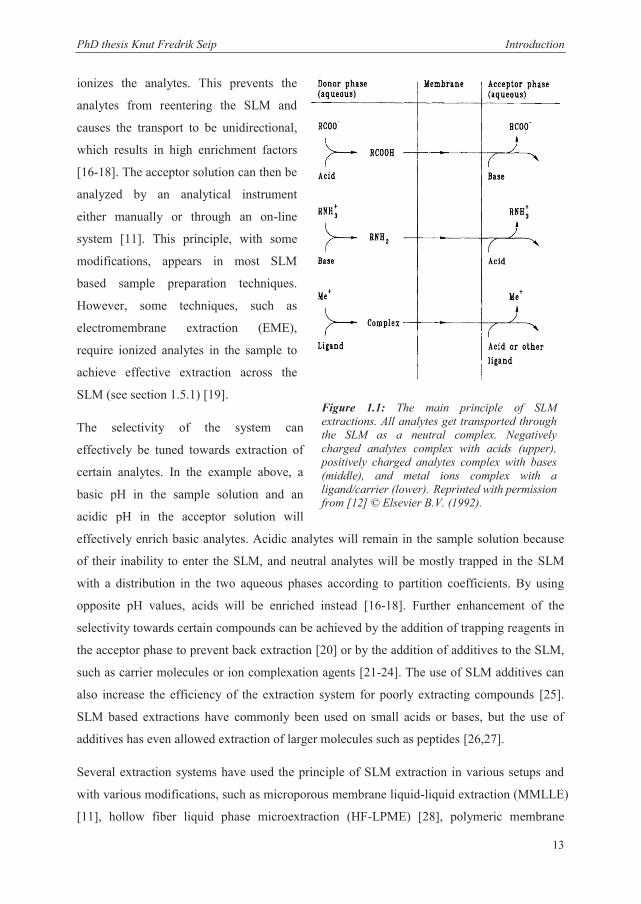
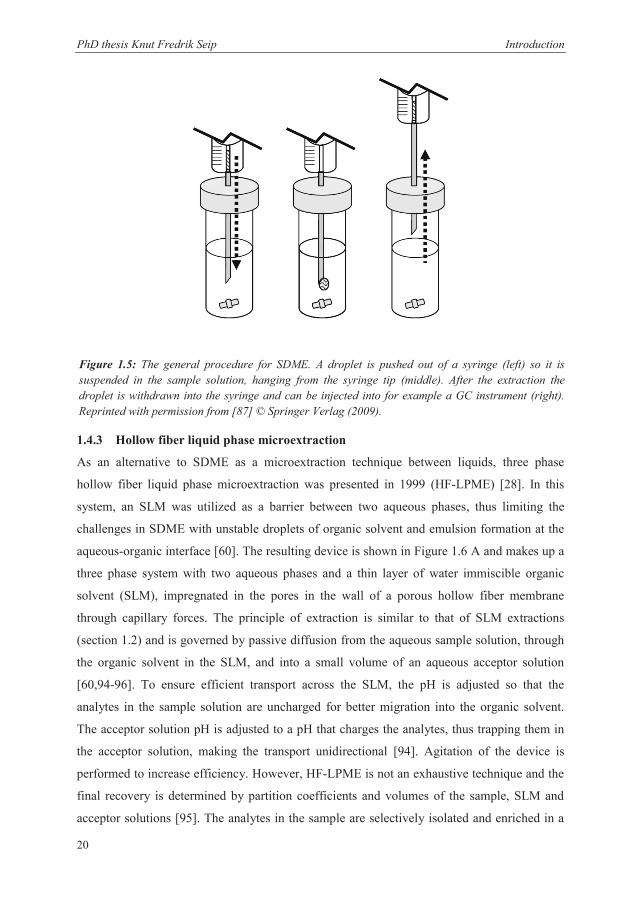
Figure 1.3: A schematic illustration of an ITIES system. A and D represent platinum mesh counter electrodes for the two phases. B is a Ag/AgCl or AG/AgSO4 reference electrode for the aqueous phase, and C is a pseudo-reference electrode of the same composition in the organic phase.
between the two phases is larger [49].
Several other techniques utilizing electric
fields have been presented, inspired by the
pioneering work with EE and ITIES
extractions. These involve electric field
assisted elution from SPE [55], as well as
electrically enhanced microextraction
techniques such as electromembrane
extraction (EME) [19], single drop
microextraction combined with an electric
field [56], electric field driven extractions
across polymer inclusion membranes [57],
and electrochemically enhanced solid phase
microextraction (EE-SPME) [58]. Some of
these techniques will be described further in
section 1.4 and 1.5.
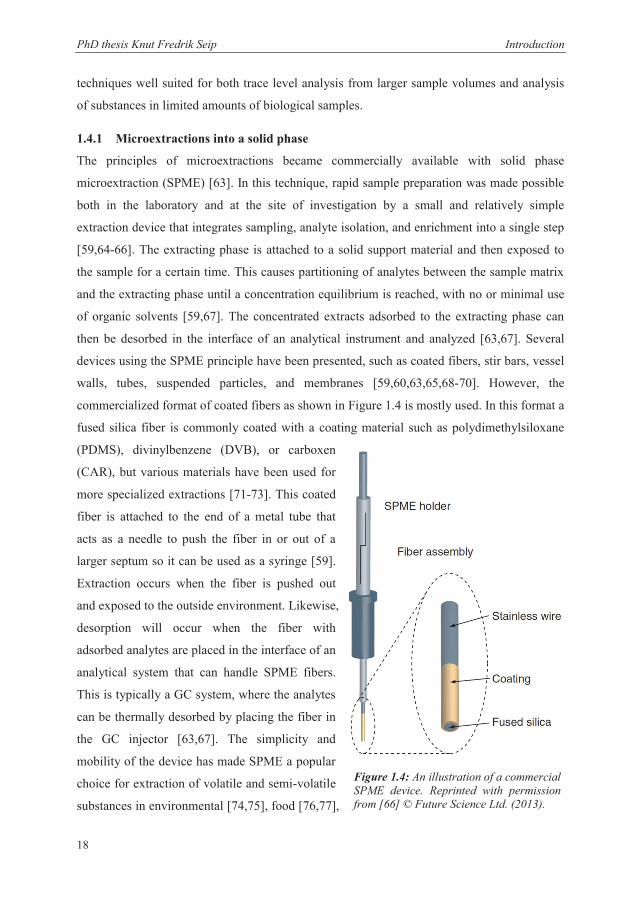
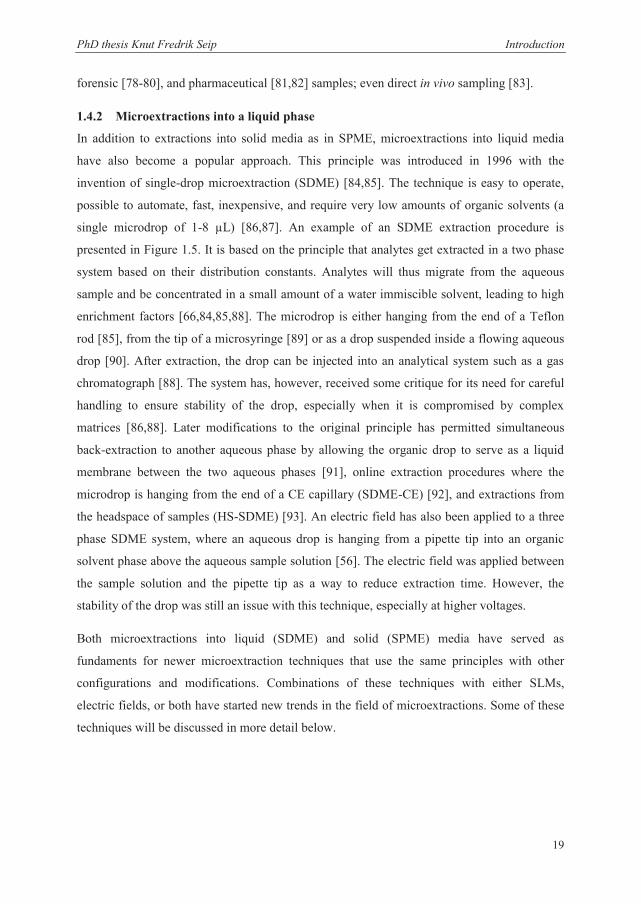
1.4 Microextraction techniques Analytical microextractions can be defined
as non-exhaustive sample preparation techniques where small volumes of extracting phase is
used (microliters or lower) compared to the volume of sample [59]. The use of
microextraction techniques can offer several advantages to conventional sample preparation
techniques such as protein precipitation, liquid-liquid extractions (LLE), or solid phase
extractions (SPE). These advantages include miniaturization, ease of automation, high-
and the drop-to-drop EME format from only 10 μL sample solution (see section 1.5.4)
[144,146]. These extractions were performed by using distilled water and human urine as
sample matrices in the first case, and distilled water, human urine, and plasma in the latter
case. CE-UV was used for analyzing the extracts in both cases.
Basic drugs have also been determined from various sample matrices in other applications. It
has been shown that it was possible to achieve acceptable recoveries (12-22 %) and low
detection limits (0.4-2.3 ng/mL) for parallel extraction of three samples simultaneously,
containing the psychiatric drugs amitriptyline, citalopram, fluoxetine, and fluvoxamine, by
using very short extraction times (1 minute) [36]. LC-MS was used for analyzing the extracts.
The sample matrix was 70 μL untreated human plasma, and the analytes were extracted with
reproducibility in the range 3.2-8.9 % RSD through an SLM filled with ENB. A common 9 V
battery was used as the power source for extraction in a home-made, small, and mobile EME
device. Higher recovery was obtained by using longer extraction times, but this publication
showed that acceptable performance can be achieved from untreated biological samples in a
very short time. This method was also tested on real patient samples, showing that EME
combined with LC-MS was able to detect therapeutic levels of the extracted drugs with results
comparable to other methods. EME from untreated biological matrices have also been
investigated, where seven basic drugs were extracted from untreated human plasma and whole
blood with CE-UV as the method for analysis [135]. In this case, ENB was used as the SLM
solvent, and recoveries ranged from 19 to 51 % after 10 minutes of extraction, with
reproducibility values showing less than 17 % RSD (n=6). Both this and the previous
application showed that EME can be performed at physiological pH from untreated sample
matrices.
The use of EME as a sample preparation step in chiral analysis was presented for extractions
of the enantiomers of the basic drug amlodipine, where EME was performed from acidified
human plasma and urine [140]. NPOE was used as the SLM solvent, and repeatability data in
the range 4.4 to 13.4 % RSD and recovery up to 83 % were obtained. This provided limits of
detection down to 3 ng/mL and enrichment factors up to 124. The EME extracts were
analyzed by cyclodextrin modified CE-UV.
By tuning the extraction parameters towards acidic extractions, it was possible to perform
successful and reproducible extractions of a range of eleven acidic drugs from aqueous
samples with up to 100 % recovery by using 1-heptanol as the organic solvent in the SLM and
PhD thesis Knut Fredrik Seip Introduction
33
CE-UV for analysis of the extracts [132]. This added to the versatility of EME by showing
that both acidic and basic substances can be extracted well by tuning the extraction
parameters. The viability of EME in combination with CE-UV for determination of acidic
drugs was also shown in a more recent publication [145]. In this case ibuprofen, naproxen,
and ketoprofen were used as model analytes together with the basic drugs norephedrine,
alprenolol, and propranolol in a modified setup to extract both acidic and basic drugs
simultaneously (see section 1.5.4). The extraction system showed a repeatability better than
13 % RSD (n=6), recoveries of up to 80 % and enrichment factors up to 370, and it was able
to detect the presence of some of the model analytes in unspiked wastewater samples.
EME has also been applied to some environmental pollutants and investigated in
environmental sample matrices. The nerve agent degradation products methylphosphonic acid
(MPA), ethyl methylphosphonic acid (EMPA), isopropyl methylphosphonic acid (IMPA), and
cyclohexyl methylphosphonic acid (CMPA), were determined in an EME application, in
combination with contactless conductivity detection (CE-C4D), from spiked river water
samples [141]. In this case the sample solution was untreated, and the anaytes were extracted
through an SLM impregnated with 1-octanol. The publication presents recovery data for the
analytes ranging from 1.1-56.7 %, with a variation of 2.2-8.8 % RSD. In addition, an
application for determination of the chlorophenol pesticides 4-Chlorophenol (4CP), 2,4-
dichlorophenol (24DCP), 2,4,6-Trichlorophenol (246TCP), and pentachlorophenol (PCP) in
spiked sea water, also with 1-octanol as the organic solvent in the SLM, has been published
[134]. Recovery values up to 74 % were reported with an RSD of 6.8 % (n=6), giving a
detection limit of 0.1 ng/mL and enrichment factors of up to 23. HPLC was used for
analyzing the extracts in this application.
EME as an extraction technique for heavy metals was introduced in 2008 [133], where lead
ions were extracted from human amniotic fluid, serum, and urine, as well as in lipsticks,
followed by CE-UV analysis. Toluene was used as the SLM solvent, and the method obtained
enrichment factors as high as 557 after 15 minutes of extraction. The detection limits were
reported as 19 ng/L with repeatability of 4.9-15.6 % RSD (n=3).
A slightly modified EME system, utilizing only two aqueous phases, was presented in 2008,
where 1-octanol was used both as the organic solvent in the SLM and as the acceptor solution
to ensure compatibility with GC analysis [147]. The system was operated at 60 V for 4
PhD thesis Knut Fredrik Seip Introduction
34
minutes, and it was used to study the mass transfer of the trace compounds nitrobenzene,
aniline, and phenol between aqueous media and 1-octanol.
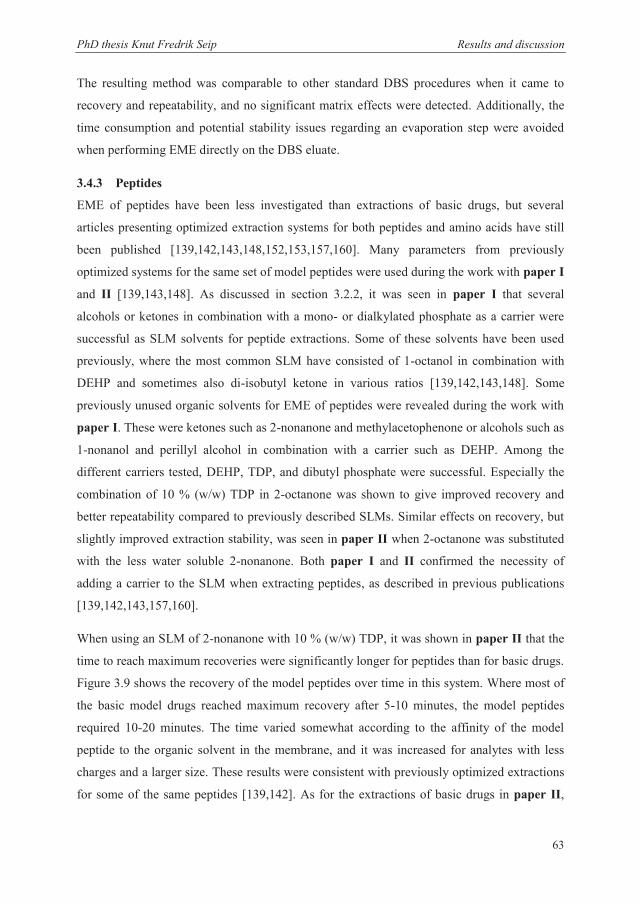
In 2009 the first publication on EME of peptides was presented [139]. In this publication,
eight different peptides with amino acid lengths between three and 13 were extracted and
analyzed by CE-UV. An SLM containing 15 % DEHP in 1-octanol was used, and recoveries
of up to 61 % were obtained after five minutes of extraction. Repeatability data showed less
than 21 % RSD (n=6). The concept of peptide extractions and its principal operational
parameters were further investigated [143], and it lead to an application for determination of
the vasoactive angiotensin peptides angiotensin 1, 2, and 3 from acidified human plasma
[142]. In this setup, an SLM containing 8 % DEHP in 1-octanol was used, and the samples
were extracted for 10 minutes. The optimized extraction method, combined with LC-MS,
generated reproducible data (5.6-11.6 % RSD, n=6), with limits of detection at the pg/mL
level and recoveries up to 43 %. These publications showed a potential for the use of EME for
peptide extractions. Although shown previously as a good way to improve the extraction of
polar basic analytes [136,138], this was the first time an SLM containing DEHP was used in
an EME application to improve extraction performance.
During the work with this thesis, the amount of applications on EME and the theoretical
understanding of the technique have improved substantially. Applications on several new
matrices and analytes have been presented and improvements to the technique have been
suggested. Some of this progress is discussed in section 3 and in the publications this thesis is
based on.
PhD thesis Knut Fredrik Seip Aim of the study
35
2 AIM OF THE STUDY
The main goal of this study has been to further develop the theoretical foundation of EME as
a sample preparation technique for biologically active substances. Previous publications have
identified key parameters for making an efficient EME setup, and some successful SLM
solvents have been used. However, systematic knowledge about several aspects of the EME
process from a theoretical point of view was limited at the start of this study. The focus has
thus been to systematically investigate key aspects of the EME process to establish a better
theoretical platform for selecting optimal extraction parameters. The following key areas have
been investigated to achieve this goal:
Investigation of relevant solvent properties for efficient SLM solvents for extraction of:
o Basic drugs (Paper IV)
o Peptides (Paper I)
Development of a mathematical model for the distribution of analytes throughout the
extraction process based on observed extraction kinetics and analyte distribution in
EME (Paper II)
Investigations of EME stability:
o How to identify and measure stability issues? (Paper III)
o Extraction parameters causing stability issues (Paper III, IV, and V)
Investigations on how samples containing organic solvents affect the extraction
recoveries and kinetics, reproducibility, and membrane current (Paper III)
Investigations on how samples containing substantial amounts of salts in the sample
solution affect extraction recoveries and kinetics, reproducibility, and membrane
current (Paper V)
PhD thesis Knut Fredrik Seip Results and discussion
36
3 RESULTS AND DISCUSSION This section contains key results from the papers included in this thesis, put into context
according to the aim of the study. The results are discussed in more detail in the individual
papers.
3.1 Selection of model analytes and extraction conditions
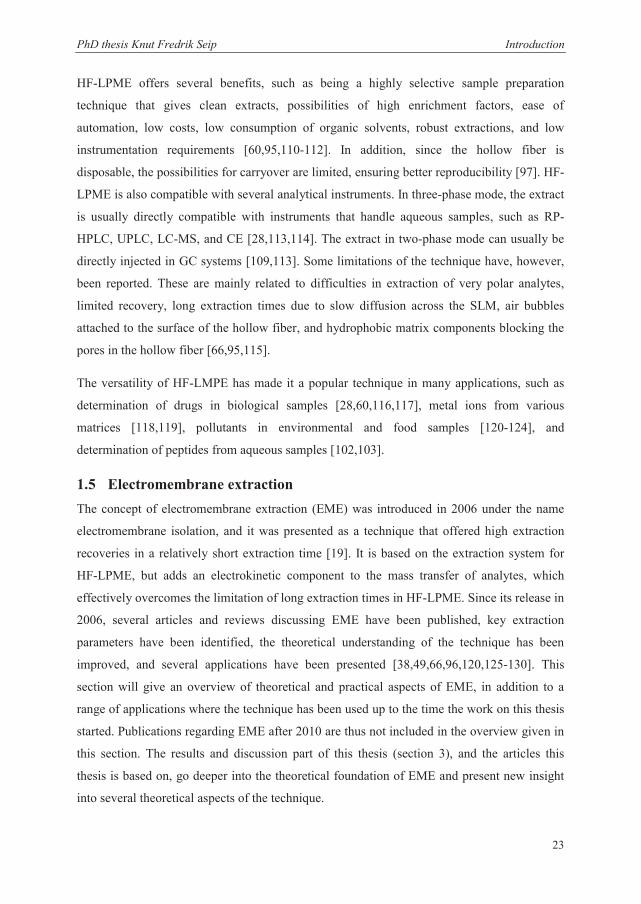
3.1.1 Extraction conditions and technical setup
The extraction conditions and technical setup of the EME system was based on previous
publications and experience from this research group, and is depicted in Figure 1.7
[19,131,135,136,138,139,142,143]. A commercially available porous polypropylene hollow
fiber with a pore size of 0.2 μm, wall thickness of 200 μm, and internal diameter of 1.2 mm
was used as support material for the SLM. This material has been compatible with a broad
range of analytes and organic solvents, without signs of degradation [136,138,142,148,149].
The lumen of the hollow fiber served as a compartment for the acceptor solution. A 2.4 cm
piece of hollow fiber was used for each extraction, mechanically sealed by a pincer in the
lower end, and attached by heat to the 2.1 cm end of a pipette tip in the upper end. The pipette
tip served as a guiding tube for the electrodes and the microsyringe that was used to add or
remove acceptor solution. To make the SLM, the hollow fiber was immersed in an organic
liquid for at least 5 seconds, and excess solvent was wiped off with a medical wipe. Various
compositions of organic liquids, with or without carrier molecules, were tested in the different
papers. After adding the acceptor solution to the lumen of the hollow fiber by a microsyringe,
the hollow fiber was inserted into the sample solution through a punched hole in the lid of its
compartment. The sample compartments were glass vials for drug substances (Paper II-V)
and either polypropylene or polyethylene vials for peptides (Paper I and II) to reduce the
degree of surface binding. The volume of sample solution was usually 1 mL, except in Paper
I where 500 μL was used. The volume of acceptor solution was always 25 μL. The sample
and acceptor solutions were acidified by 10 mM HCl for all basic drug extractions (Paper II-
V) and with 1 mM and 50 mM HCl, respectively, for the peptides (Paper I and II). Platinum
electrodes with a thickness of 0.5 mm were placed in the sample (anode) and acceptor
solution (cathode), and connected to a DC power supply ranging from 1 to 300 V. This setup
resulted in a closed circuit, where the SLM was the main point of electrical resistance.
Extraction was performed by applying a voltage (SLM solvent dependent) over this circuit.
Agitation of the system during the extractions reduced the thickness of the boundary layer in
PhD thesis Knut Fredrik Seip Results and discussion
37
the interface between the sample solution and the SLM [19,131,132]. The current in the
circuit was monitored and plotted over time throughout the extraction as an indication of
system stability. After a predetermined extraction time, the acceptor solution was removed
and transferred to vials for CE (Paper I), HPLC (Paper II-V) or LC-MS (Paper III) analysis.
3.1.2 Model analytes
The model analytes were selected to represent a broad range of physiochemical properties in
their respective categories; unplolar basic drugs (Paper II-V) and peptides (Paper I and II).
Several of the model analytes used during the work with this thesis had already been used in
other fundamental investigations on EME [19,32,35,36,131,135,138,139,142-144,146,150-
155]. The reason for choosing several of the same analytes was to make it easier to compare
the results to previous observations and because these analytes were already established as
good candidates for investigation of the fundamental aspects of EME.
3.1.2.1 Unpolar basic drugs
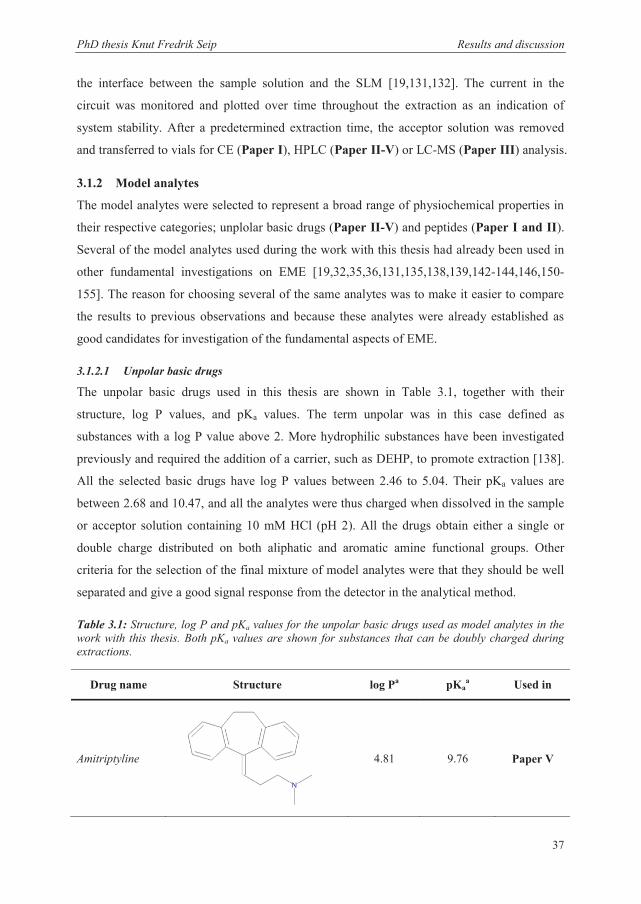
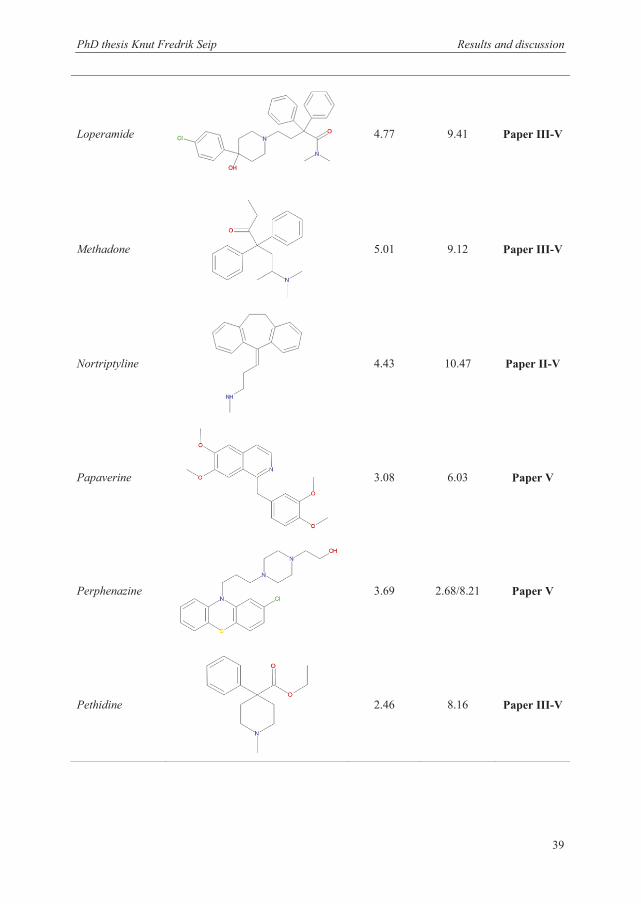
The unpolar basic drugs used in this thesis are shown in Table 3.1, together with their
structure, log P values, and pKa values. The term unpolar was in this case defined as
substances with a log P value above 2. More hydrophilic substances have been investigated
previously and required the addition of a carrier, such as DEHP, to promote extraction [138].
All the selected basic drugs have log P values between 2.46 to 5.04. Their pKa values are
between 2.68 and 10.47, and all the analytes were thus charged when dissolved in the sample
or acceptor solution containing 10 mM HCl (pH 2). All the drugs obtain either a single or
double charge distributed on both aliphatic and aromatic amine functional groups. Other
criteria for the selection of the final mixture of model analytes were that they should be well
separated and give a good signal response from the detector in the analytical method.
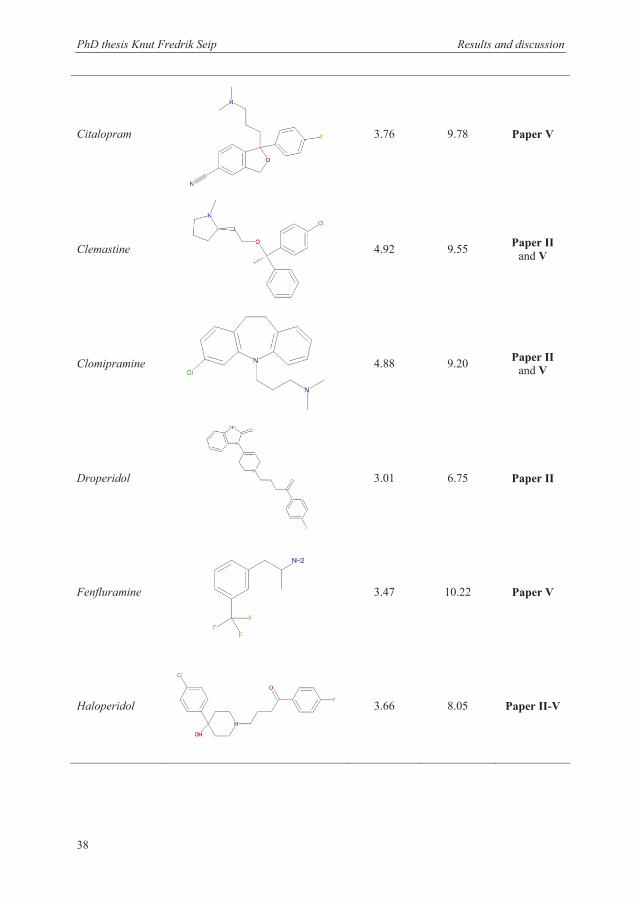
Table 3.1: Structure, log P and pKa values for the unpolar basic drugs used as model analytes in the work with this thesis. Both pKa values are shown for substances that can be doubly charged during extractions.
Drug name Structure log Pa pKaa Used in
Amitriptyline
4.81 9.76 Paper V
PhD thesis Knut Fredrik Seip Results and discussion
38
Citalopram
3.76 9.78 Paper V
Clemastine
4.92 9.55 Paper II and V
Clomipramine
4.88 9.20 Paper II and V
Droperidol
3.01 6.75 Paper II
Fenfluramine
3.47 10.22 Paper V
Haloperidol
3.66 8.05 Paper II-V
PhD thesis Knut Fredrik Seip Results and discussion
39
Loperamide
4.77 9.41 Paper III-V
Methadone
5.01 9.12 Paper III-V
Nortriptyline
4.43 10.47 Paper II-V
Papaverine
3.08 6.03 Paper V
Perphenazine
3.69 2.68/8.21 Paper V
Pethidine
2.46 8.16 Paper III-V
PhD thesis Knut Fredrik Seip Results and discussion
40
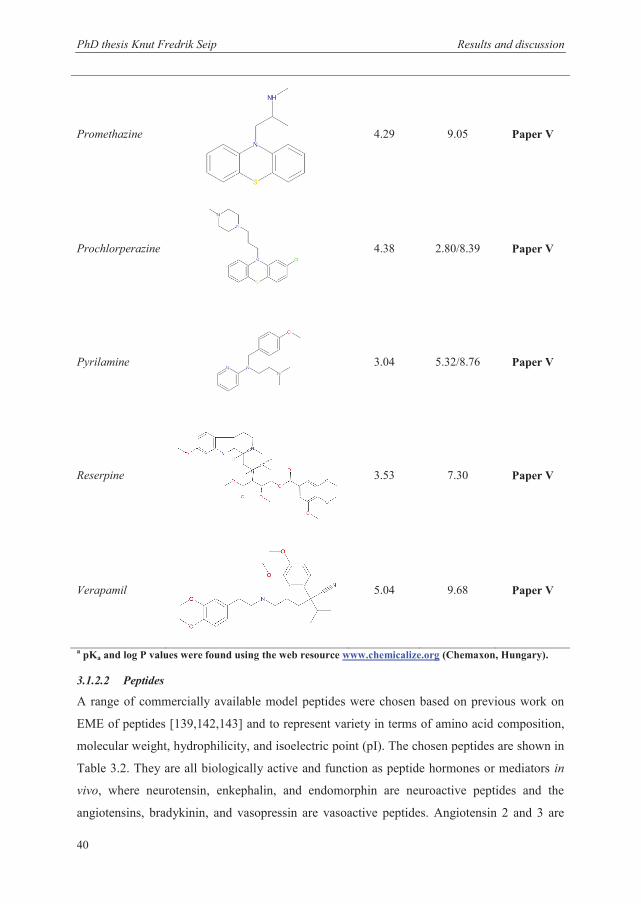
a pKa and log P values were found using the web resource www.chemicalize.org (Chemaxon, Hungary).
3.1.2.2 Peptides
A range of commercially available model peptides were chosen based on previous work on
EME of peptides [139,142,143] and to represent variety in terms of amino acid composition,
molecular weight, hydrophilicity, and isoelectric point (pI). The chosen peptides are shown in
Table 3.2. They are all biologically active and function as peptide hormones or mediators in
vivo, where neurotensin, enkephalin, and endomorphin are neuroactive peptides and the
angiotensins, bradykinin, and vasopressin are vasoactive peptides. Angiotensin 2 and 3 are
Promethazine
4.29 9.05 Paper V
Prochlorperazine
4.38 2.80/8.39 Paper V
Pyrilamine
3.04 5.32/8.76 Paper V
Reserpine
3.53 7.30 Paper V
Verapamil
5.04 9.68 Paper V
PhD thesis Knut Fredrik Seip Results and discussion
41
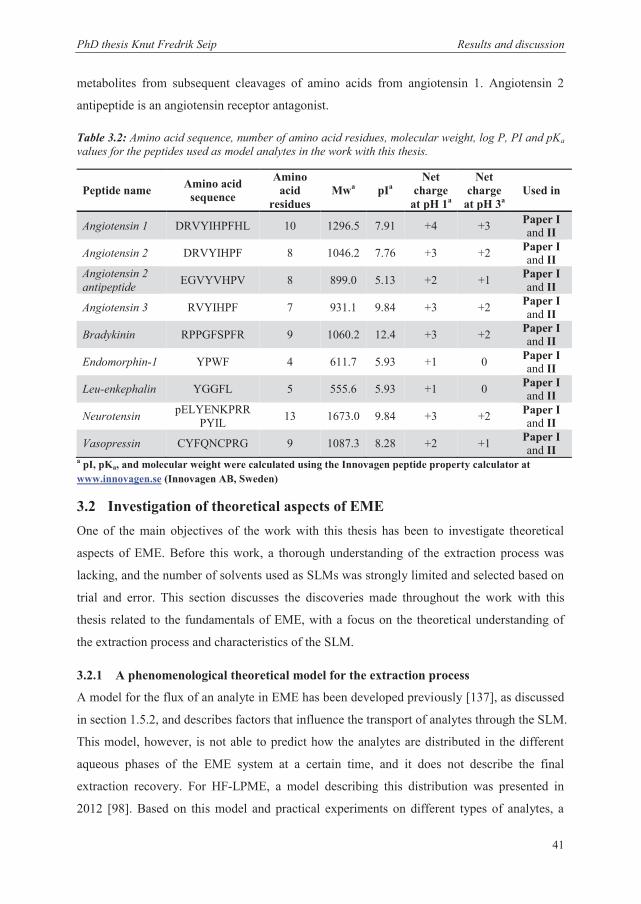
metabolites from subsequent cleavages of amino acids from angiotensin 1. Angiotensin 2
antipeptide is an angiotensin receptor antagonist.
Table 3.2: Amino acid sequence, number of amino acid residues, molecular weight, log P, PI and pKa values for the peptides used as model analytes in the work with this thesis.
a pI, pKa, and molecular weight were calculated using the Innovagen peptide property calculator at www.innovagen.se (Innovagen AB, Sweden)
3.2 Investigation of theoretical aspects of EME One of the main objectives of the work with this thesis has been to investigate theoretical
aspects of EME. Before this work, a thorough understanding of the extraction process was
lacking, and the number of solvents used as SLMs was strongly limited and selected based on
trial and error. This section discusses the discoveries made throughout the work with this
thesis related to the fundamentals of EME, with a focus on the theoretical understanding of
the extraction process and characteristics of the SLM.
3.2.1 A phenomenological theoretical model for the extraction process
A model for the flux of an analyte in EME has been developed previously [137], as discussed
in section 1.5.2, and describes factors that influence the transport of analytes through the SLM.
This model, however, is not able to predict how the analytes are distributed in the different
aqueous phases of the EME system at a certain time, and it does not describe the final
extraction recovery. For HF-LPME, a model describing this distribution was presented in
2012 [98]. Based on this model and practical experiments on different types of analytes, a
Peptide name Amino acid sequence
Amino acid
residues Mwa pIa
Net charge
at pH 1a
Net charge
at pH 3a Used in
Angiotensin 1 DRVYIHPFHL 10 1296.5 7.91 +4 +3 Paper I and II
Angiotensin 2 DRVYIHPF 8 1046.2 7.76 +3 +2 Paper I and II
Angiotensin 2 antipeptide EGVYVHPV 8 899.0 5.13 +2 +1 Paper I
and II
Angiotensin 3 RVYIHPF 7 931.1 9.84 +3 +2 Paper I and II
Bradykinin RPPGFSPFR 9 1060.2 12.4 +3 +2 Paper I and II
Endomorphin-1 YPWF 4 611.7 5.93 +1 0 Paper I and II
Leu-enkephalin YGGFL 5 555.6 5.93 +1 0 Paper I and II
Neurotensin pELYENKPRRPYIL 13 1673.0 9.84 +3 +2 Paper I
and II
Vasopressin CYFQNCPRG 9 1087.3 8.28 +2 +1 Paper I and II
PhD thesis Knut Fredrik Seip Results and discussion
42
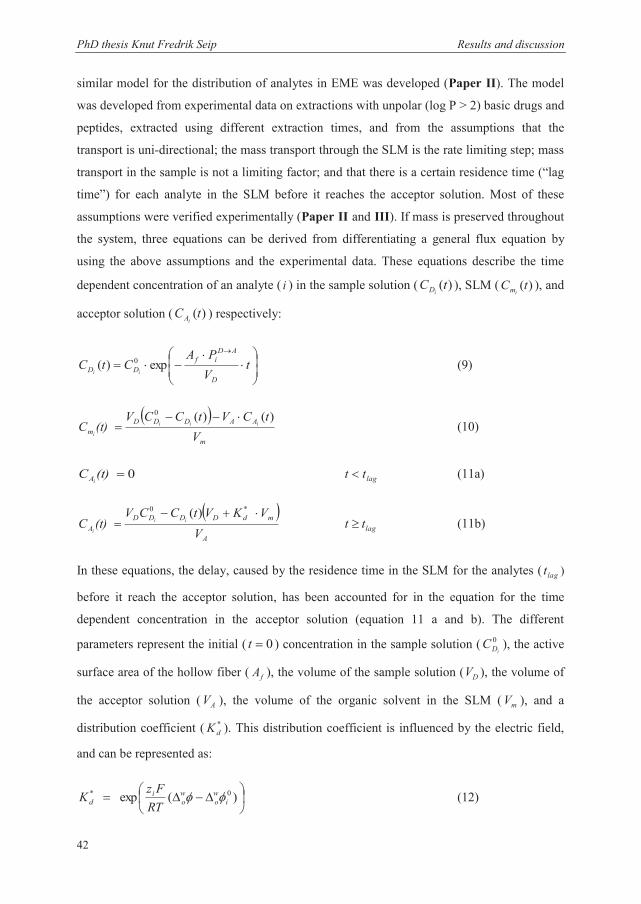
similar model for the distribution of analytes in EME was developed (Paper II). The model
was developed from experimental data on extractions with unpolar (log P > 2) basic drugs and
peptides, extracted using different extraction times, and from the assumptions that the
transport is uni-directional; the mass transport through the SLM is the rate limiting step; mass
transport in the sample is not a limiting factor; and that there is a certain residence time (“lag
time”) for each analyte in the SLM before it reaches the acceptor solution. Most of these
assumptions were verified experimentally (Paper II and III). If mass is preserved throughout
the system, three equations can be derived from differentiating a general flux equation by
using the above assumptions and the experimental data. These equations describe the time
dependent concentration of an analyte ( i ) in the sample solution ( )(tCiD ), SLM ( )(tC
im ), and
acceptor solution ( )(tCiA ) respectively:
tVPA
CtCD
ADif
DD iiexp)( 0 (9)
V
tCVtCCV(t) C
m
AADDDm
iii
i
)()(0
(10)
0(t) CiA lagtt (11a)
A
mdDDDDA V
VKVtCCV(t) C ii
i
*0 )( lagtt (11b)
In these equations, the delay, caused by the residence time in the SLM for the analytes ( lagt )
before it reach the acceptor solution, has been accounted for in the equation for the time
dependent concentration in the acceptor solution (equation 11 a and b). The different
parameters represent the initial ( 0t ) concentration in the sample solution ( 0iDC ), the active
surface area of the hollow fiber ( fA ), the volume of the sample solution ( DV ), the volume of
the acceptor solution ( AV ), the volume of the organic solvent in the SLM ( mV ), and a
distribution coefficient ( *dK ). This distribution coefficient is influenced by the electric field,
and can be represented as:
)(exp 0*i
wo
wo
id RT
FzK (12)
PhD thesis Knut Fredrik Seip Results and discussion
43
where iz is the charge of the analyte, F the faraday constant, R the gas constant, and T the
absolute temperature. The last two terms are related to the hydrophobicity of the analyte
( 0i
wo ) and the Galvani potential difference between the sample solution and the SLM ( w
o ).
The major differences between the distribution model for HF-LPME and EME are
represented by the inclusion of an electric field in EME, and this is reflected by the voltage
dependency of the distribution coefficient. Whereas the only force for mass transfer in HF-
LPME was related to the analytes affinity to the SLM in a distribution process, the
distribution coefficient in EME has been modeled with terms including both an
electrophoretic and distributive component. According to equation 12, the electrical field
plays a major role in affecting the distribution of analytes into the SLM, but if the analytes are
sufficiently hydrophobic, they may also be extracted by passive diffusion, even in the absence
of an electrical force. This was experimentally justified in paper II, where the basic drug
droperidol showed slower kinetics than the other drugs, similar to a previous publication on
the extraction of the same substance by HF-LPME [98]. Since droperidol was less basic than
the other model analytes it was hypothesized that it was also less protonated in the aqueous
solution, and thus went through the SLM in a deprotonated form, mainly by passive diffusion.
The influence from the electric field on the mass transfer in EME was on the other hand
justified through the time it took for trace levels of analyte to enter the acceptor solution
(break-through time). This break-through time was greatly enhanced for both peptides and
basic drugs when an electrical field was present. Additionally, the large contribution from the
electric field can be observed through the short extraction time required to reach maximum
recovery in EME (paper II) compared to HF-LPME [98].
Whereas previous publications on fundamentals of the extraction process has focused on the
applied potential as the driving force for mass transfer in EME [19,131,137], the work with
this model has shown that there is also a component related to passive diffusion that affects
the extraction, especially for hydrophobic analytes.
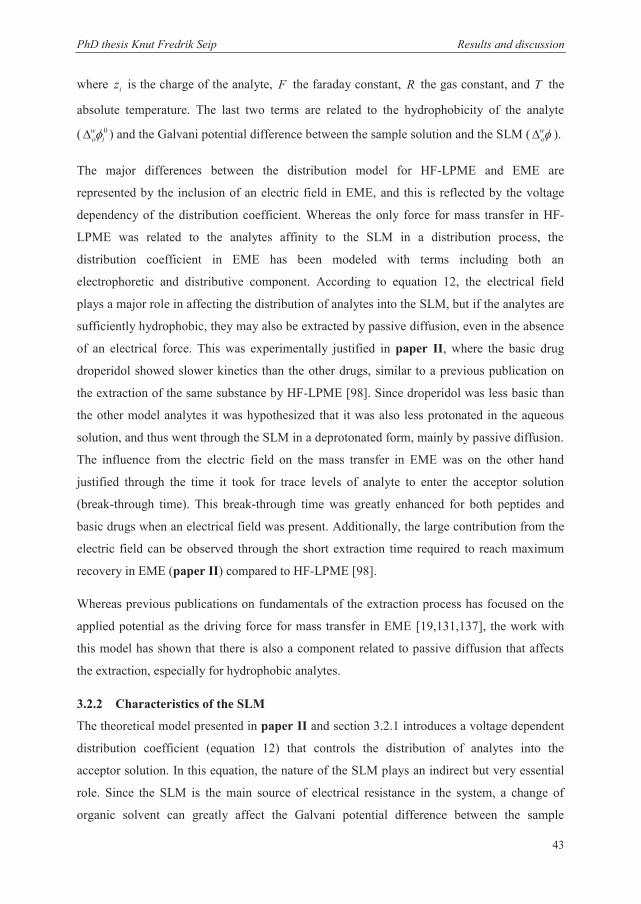
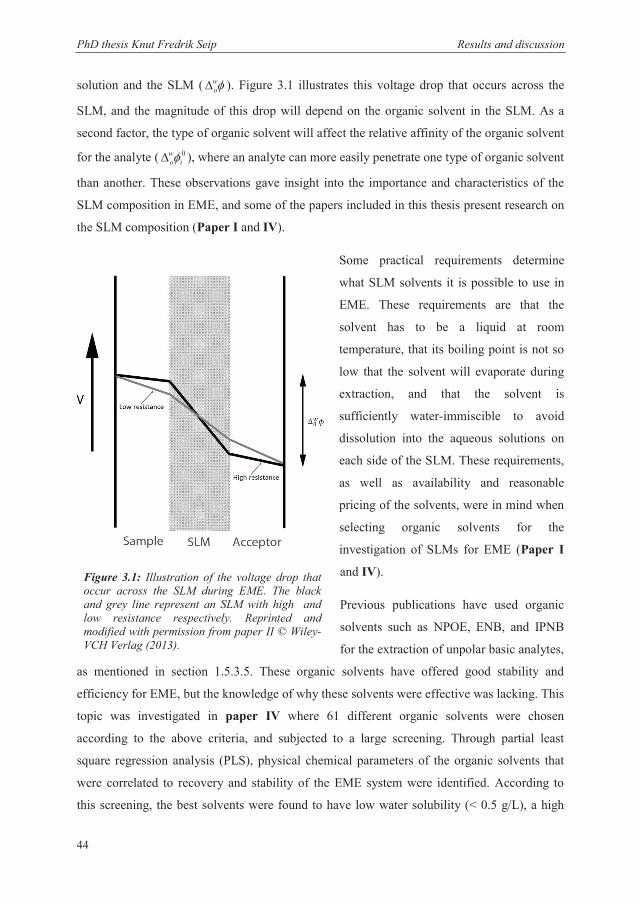
3.2.2 Characteristics of the SLM
The theoretical model presented in paper II and section 3.2.1 introduces a voltage dependent
distribution coefficient (equation 12) that controls the distribution of analytes into the
acceptor solution. In this equation, the nature of the SLM plays an indirect but very essential
role. Since the SLM is the main source of electrical resistance in the system, a change of
organic solvent can greatly affect the Galvani potential difference between the sample
PhD thesis Knut Fredrik Seip Results and discussion
44
solution and the SLM ( wo ). Figure 3.1 illustrates this voltage drop that occurs across the
SLM, and the magnitude of this drop will depend on the organic solvent in the SLM. As a
second factor, the type of organic solvent will affect the relative affinity of the organic solvent
for the analyte ( 0i
wo ), where an analyte can more easily penetrate one type of organic solvent
than another. These observations gave insight into the importance and characteristics of the
SLM composition in EME, and some of the papers included in this thesis present research on
the SLM composition (Paper I and IV).
Some practical requirements determine
what SLM solvents it is possible to use in
EME. These requirements are that the
solvent has to be a liquid at room
temperature, that its boiling point is not so
low that the solvent will evaporate during
extraction, and that the solvent is
sufficiently water-immiscible to avoid
dissolution into the aqueous solutions on
each side of the SLM. These requirements,
as well as availability and reasonable
pricing of the solvents, were in mind when
selecting organic solvents for the
investigation of SLMs for EME (Paper I
and IV).
Previous publications have used organic
solvents such as NPOE, ENB, and IPNB
for the extraction of unpolar basic analytes,
as mentioned in section 1.5.3.5. These organic solvents have offered good stability and
efficiency for EME, but the knowledge of why these solvents were effective was lacking. This
topic was investigated in paper IV where 61 different organic solvents were chosen
according to the above criteria, and subjected to a large screening. Through partial least
square regression analysis (PLS), physical chemical parameters of the organic solvents that
were correlated to recovery and stability of the EME system were identified. According to
this screening, the best solvents were found to have low water solubility (< 0.5 g/L), a high
PhD thesis Knut Fredrik Seip Results and discussion
45
dipole moment, high proton acceptor properties and low proton donor properties. These
characteristics, except for the water solubility, are important factors in cluster 2 of a Kamlet-
Taft-based solvatochromic classification system [156] which can be a good theoretical
starting point for the discovery of new efficient solvents. Previously known organic solvents
for extracting hydrophobic basic drugs with EME comply with these characteristics, and
especially the nitroaromatics are characterized by high proton acceptor capabilities and high
dipole moments. In addition to the previously known effective organic solvents, several
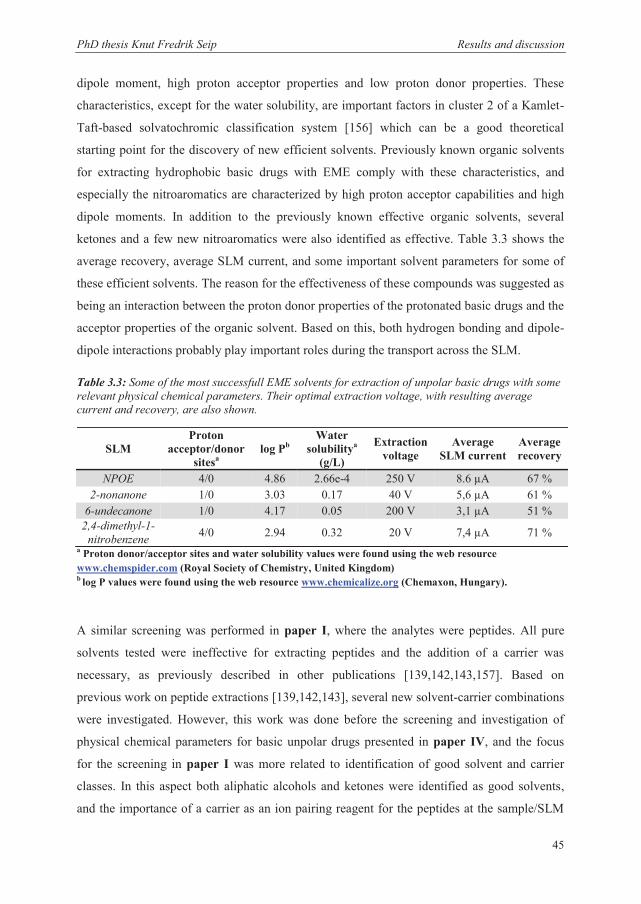
ketones and a few new nitroaromatics were also identified as effective. Table 3.3 shows the
average recovery, average SLM current, and some important solvent parameters for some of
these efficient solvents. The reason for the effectiveness of these compounds was suggested as
being an interaction between the proton donor properties of the protonated basic drugs and the
acceptor properties of the organic solvent. Based on this, both hydrogen bonding and dipole-
dipole interactions probably play important roles during the transport across the SLM.
Table 3.3: Some of the most successfull EME solvents for extraction of unpolar basic drugs with some relevant physical chemical parameters. Their optimal extraction voltage, with resulting average current and recovery, are also shown.
a Proton donor/acceptor sites and water solubility values were found using the web resource www.chemspider.com (Royal Society of Chemistry, United Kingdom) b log P values were found using the web resource www.chemicalize.org (Chemaxon, Hungary).
A similar screening was performed in paper I, where the analytes were peptides. All pure
solvents tested were ineffective for extracting peptides and the addition of a carrier was
necessary, as previously described in other publications [139,142,143,157]. Based on
previous work on peptide extractions [139,142,143], several new solvent-carrier combinations
were investigated. However, this work was done before the screening and investigation of
physical chemical parameters for basic unpolar drugs presented in paper IV, and the focus
for the screening in paper I was more related to identification of good solvent and carrier
classes. In this aspect both aliphatic alcohols and ketones were identified as good solvents,
and the importance of a carrier as an ion pairing reagent for the peptides at the sample/SLM
SLM Proton
acceptor/donor sitesa
log Pb Water
solubilitya (g/L)
Extraction voltage
Average SLM current
Average recovery
NPOE 4/0 4.86 2.66e-4 250 V 8.6 μA 67 % 2-nonanone 1/0 3.03 0.17 40 V 5,6 μA 61 %
PhD thesis Knut Fredrik Seip Results and discussion
46
interface was confirmed. The importance of the interaction with a carrier to get the analytes
into the SLM was also seen in paper II, where the distribution of peptides into the SLM was
highly enhanced when a carrier was present.
In paper I, no clear link between the extraction efficiency and physical chemical properties of
the organic solvents were seen. However, the importance of proton acceptor and dipole
properties were suggested, based on the classification of the successful solvents to group II
and VI in Snyder’s solvent classification system [158,159]. The proton acceptor and dipole
properties of several solvents in these groups are similar to solvents belonging to cluster II in
the previously mentioned Kamlet-Taft-based solvatochromic classification system [156] and
are thus consistent with the discoveries made in paper IV. The aliphatic alcohols also had a
slight effect when extracting hydrophobic basic drugs, but even though they have good proton
acceptor and dipole properties, they also have relatively high proton donor capabilities, which
were suggested as the cause for their limited efficiency. Based on the structural diversity of
peptides, however, this might be beneficial for the interaction between the peptides and the
organic solvent, and could be a reason why aliphatic alcohols were more successful when
extracting peptides in paper I than for hydrophobic basic drugs in paper IV.
Carriers have previously been seen as an effective additive when extracting both peptides and
more polar basic drugs (log P < 2) [136,138,139,143,148,157,160]. Among the carriers tested
in paper I, only mono- and dialkylated phosphates were effective, and in addition to DEHP
that had been used previously, tridecyl phosphate (TDP, a commercial mixture of mono- and
di-tridecyl phosphate) and dibutyl phosphate were highly promising. All of these carriers also
had pKa values which allowed them to be charged at the sample SLM interface at pH 3 and
uncharged at the SLM/acceptor interface at pH 1.3. This confirms the previously suggested
mechanism of complexation between the oppositely charged peptide and carrier at the
sample/SLM interface and the release of peptides when the carrier gets protonated at the
SLM/acceptor interface [139,148]. Especially the introduction of 2-nonanone and TDP as
organic solvent and carrier was superior to the previously used combination of 1-octanol, di-
isobutyl ketone, and DEHP, and this knowledge was used when investigating the extraction
process for peptides in paper II. Table 3.4 shows the structure and some relevant
physiochemical parameters for some of the effective carriers.
PhD thesis Knut Fredrik Seip Results and discussion
47
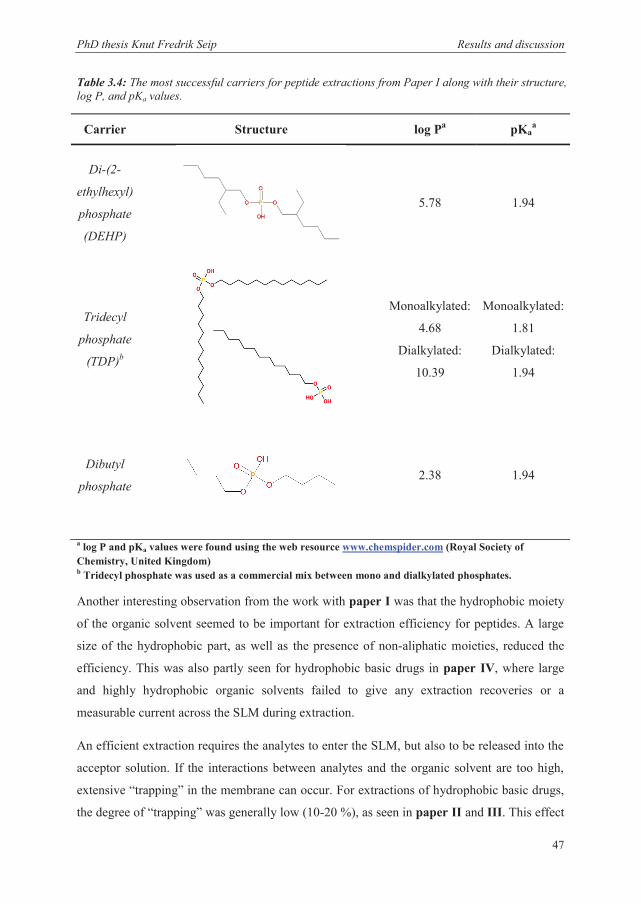
Table 3.4: The most successful carriers for peptide extractions from Paper I along with their structure, log P, and pKa values.
a log P and pKa values were found using the web resource www.chemspider.com (Royal Society of Chemistry, United Kingdom) b Tridecyl phosphate was used as a commercial mix between mono and dialkylated phosphates.
Another interesting observation from the work with paper I was that the hydrophobic moiety
of the organic solvent seemed to be important for extraction efficiency for peptides. A large
size of the hydrophobic part, as well as the presence of non-aliphatic moieties, reduced the
efficiency. This was also partly seen for hydrophobic basic drugs in paper IV, where large
and highly hydrophobic organic solvents failed to give any extraction recoveries or a
measurable current across the SLM during extraction.
An efficient extraction requires the analytes to enter the SLM, but also to be released into the
acceptor solution. If the interactions between analytes and the organic solvent are too high,
extensive “trapping” in the membrane can occur. For extractions of hydrophobic basic drugs,
the degree of “trapping” was generally low (10-20 %), as seen in paper II and III. This effect
Carrier Structure log Pa pKaa
Di-(2-
ethylhexyl)
phosphate
(DEHP)
5.78 1.94
Tridecyl
phosphate
(TDP)b
Monoalkylated:
4.68
Dialkylated:
10.39
Monoalkylated:
1.81
Dialkylated:
1.94
Dibutyl
phosphate
2.38 1.94
PhD thesis Knut Fredrik Seip Results and discussion
48
was also seen in paper II, where the distribution of these analytes between 10 mM HCl and
NPOE completely favored the aqueous phase for most of the analytes. For peptides, however,
the inclusion of a carrier in the membrane causes a high affinity for the analytes to the SLM,
as seen in paper I and II. In paper II this was seen as the major factor limiting extraction
recoveries, and the degree of “trapping” appeared to be reduced with increasing number of
positive charges on the peptides. This was somewhat contradictory to the observation that the
most highly charged peptide, angiotensin 1, was the most extensively trapped peptide in the
work with paper I. However, this observation was based on 5 minute extractions, where
steady state is not yet reached according to paper II. According to the time dependent
concentration in the SLM determined in paper II, this peptide have a high accumulation in
the SLM during the first minutes, before this is gradually reduced, and can thus explain the
high concentration of angiotensin 1 in the SLM observed in paper I. Possibly, more charges
makes it easier for the carrier-peptide complex to penetrate the SLM because of more
extensive binding with carriers, but with a lack of carrier molecules to complex with at the
SLM/acceptor interface and a higher exerted force from the electrical field, these compounds
are more effectively isolated in the acceptor solution as time passes. Based on this there seems
to be a compromise between efficient transport into the SLM, and efficient release into the
acceptor solution. Thus, the affinity of the SLM towards the analyte has to be high, but not
too high, to be efficient. As paper I-III and V show, the degree of “trapping” varies between
analytes, and can thus be a future possibility for creating selective extraction systems in
addition to selectivity induced by the applied voltage [155].
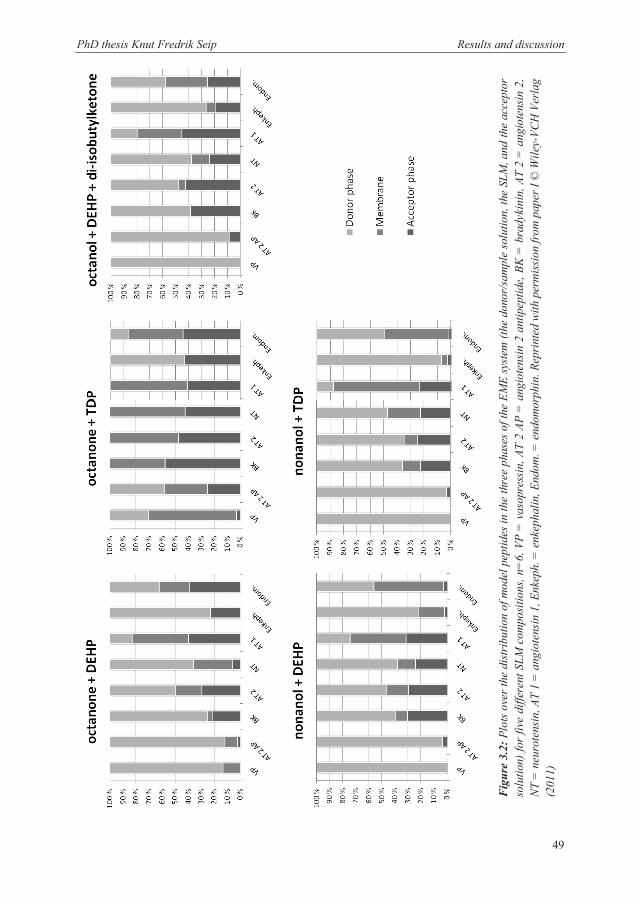
The degree of “trapping” was also highly dependent on the organic solvents used in the SLM.
In paper I, five different compositions of carriers and organic solvents were tested to see the
differences in peptide distribution throughout the sample, SLM, and acceptor solutions. The
resulting plots are shown in Figure 3.2. For nonanol as an organic solvent, substituting
between TDP and DEHP as a carrier caused almost no difference. However, if 2-octanone
was used instead, TDP was superior to DEHP when it came to recovery in the acceptor
solution, but also when it came to the degree of trapping in the SLM. The distribution into the
acceptor solution and SLM was also higher with 2-octanone and TDP than the previously
described composition of octanol, DEHP, and di-isobutylketone. This was suggested as being
caused by both hydrogen bonding and ionic interactions, because of the strong dipole
properties of 2-octanone compared to the strong proton acceptor properties of the alcohols.
PhD thesis Knut Fredrik Seip Results and discussion
CONCLUDING REMARKS In the present thesis, several fundamental aspects of electromembrane extraction (EME) have
been investigated. The theoretical understanding of the extraction process in EME as a sample
preparation technique has been improved through thorough investigations of key aspects
regarding extraction efficiency, stability, and kinetics. These investigations involved
efficiency of different types of supported liquid membranes (SLM), extraction stability under
various conditions, and extractions from samples containing organic solvents or high amounts
of salts. The fundamental aspects investigated in the work with this thesis have been
systematically described in five papers. Some of the key discoveries during the work with this
thesis are summarized below:
The distribution of analytes over time in EME for extractions of unpolar basic drugs
and peptides was described by a phenomenological theoretical model, showing that
the mass transfer across the SLM was governed by both a distributive and
electrophoretic component. The time dependent recovery in the acceptor solution was
affected by factors such as volume of sample, SLM, acceptor solution, a potential
dependent distribution coefficient, effective membrane area, and a permeability
coefficient.
Several organic solvents for the SLM were classified as effective for both extractions
of unpolar basic drugs and peptides. For peptides, these solvents included some
primary alcohols and ketones combined with a mono- or disubstituted phosphate as a
carrier. For unpolar basic drugs, the successful solvents were either nitroaromatics or
ketones with a relatively low water solubility (<0.5 g/L), high proton acceptor
properties, low proton donor properties, and a high dipole moment.
The stability of the EME system was highly dependent on the type of SLM, and
especially SLM solvents with a relatively high water solubility (>0.5 g/L), small
molecular surface area, and low log P were unsuitable for EME because of high
current and water migration across the SLM. Current measurements throughout the
extractions were seen to be an effective tool to monitor potential stability issues.
Extractions with organic solvents in the sample were successfully performed in an
application where dried blood spot eluate was subjected to EME. These extractions
PhD thesis Knut Fredrik Seip Concluding remarks
66
were possible from samples containing up to 50 % (v/v) ethanol or methanol, or up to
75 % (v/v) DMSO in the sample solution. The total extraction recovery of these
samples compared to purely aqueous samples was unaffected, but the extraction
kinetics was slower, resulting in longer extraction times.
Extractions with substantial amounts of NaCl in the sample showed that the recovery
was reduced for some unpolar basic model analytes compared to samples without
NaCl. This effect was hypothesized to be caused by ion pairing in the SLM, and a
mathematical expression for analyte recovery in the presence of salt in the sample
solution was developed. It was seen that the reduction in recovery could be reduced or
eliminated by changing the organic solvent in the SLM or by reducing the SLM to
acceptor solution volume ratio (by using a thinner membrane).
This increased knowledge about the extraction process will hopefully be beneficial for further
development of EME as a promising sample preparation technique and as a way to improve
optimization of the EME system towards specific applications. Currently, several classes of
analytes, such as polar and acidic compounds have been difficult to extract, mainly caused by
a lack of efficient SLM materials. The increased understanding of the role of the SLM during
the extraction process for unpolar basic drugs and peptides described in this thesis might be a
step towards more effective EME systems also for other classes of analytes, and it can thus
broaden the applicability of the technique.
PhD thesis Knut Fredrik Seip References
67
REFERENCES
[1] S.M. Hanash, S.J. Pitteri, V.M. Faca, Nature 452 (2008) 571. [2] I. Neverova, J.E. Van Eyk, Journal of Chromatography B-Analytical Technologies in the
Biomedical and Life Sciences 815 (2005) 51. [3] M. Kandiah, P.L. Urban, Chem Soc Rev 42 (2013) 5299. [4] L. Novakova, J Chromatogr A 1292 (2013) 25. [5] F.M. Lagerwerf, W.D. van Dongen, R.J.J.M. Steenvoorden, M. Honing, J.H.G. Jonkman, Trac-
Trends in Analytical Chemistry 19 (2000) 418. [6] Y. Chen, Z. Guo, X. Wang, C. Qiu, J Chromatogr A 1184 (2008) 191. [7] P.J. Taylor, Clinical Biochemistry 38 (2005) 328. [8] H. Kataoka, Trac-Trends in Analytical Chemistry 22 (2003) 232. [9] L. Novakova, H. Vlckova, Anal Chim Acta 656 (2009) 8. [10] R.N.X. Xu, L.M. Fan, M.J. Rieser, T.A. El-Shourbagy, Journal of Pharmaceutical and Biomedical
Analysis 44 (2007) 342. [11] J.A. Jonsson, L. Mathiasson, J Chromatogr A 902 (2000) 205. [12] J.A. Jonsson, L. Mathiasson, Trac-Trends in Analytical Chemistry 11 (1992) 106. [13] L. Chimuka, E. Cukrowska, J.A. Jonsson, Pure and Applied Chemistry 76 (2004) 707. [14] G. Audunsson, Analytical Chemistry 58 (1986) 2714. [15] J.A. Jonsson, L. Mathiasson, Chromatographia 52 (2000) S8. [16] J.A. Jonsson, P. Lovkvist, G. Audunsson, G. Nilve, Analytica Chimica Acta 277 (1993) 9. [17] J.A. Jonsson, L. Mathiasson, Trac-Trends in Analytical Chemistry 18 (1999) 318. [18] J.A. Jonsson, Chromatographia 57 (2003) S317. [19] S. Pedersen-Bjergaard, K.E. Rasmussen, J Chromatogr A 1109 (2006) 183. [20] E. Thordarson, J.A. Jonsson, J. Emneus, Analytical Chemistry 72 (2000) 5280. [21] P. Wieczorek, J.A. Jonsson, L. Mathiasson, Analytica Chimica Acta 346 (1997) 191. [22] M. Papantoni, N.K. Djane, K. Ndungu, J.A. Jonsson, L. Mathiasson, Analyst 120 (1995) 1471. [23] M. Bryjak, P. Wieczorek, P. Kafarski, B. Lejczak, Journal of Membrane Science 56 (1991) 167. [24] T. Shinbo, T. Yamaguchi, H. Yanagishita, K. Sakaki, D. Kitamoto, M. Sugiura, Journal of
Membrane Science 84 (1993) 241. [25] J.A. Jonsson, L. Mathiasson, Trac-Trends in Analytical Chemistry 18 (1999) 325. [26] A. Poliwoda, N. Llczuk, P.P. Wieezorek, Separation and Purification Technology 57 (2007) 444. [27] A. Drapala, P. Dzygiel, J.A. Jonsson, P. Wieczorek, Acta Biochim Pol 48 (2001) 1113. [28] S. Pedersen-Bjergaard, K.E. Rasmussen, Anal Chem 71 (1999) 2650. [29] A. Gjelstad, K.E. Rasmussen, M.P. Parmer, S. Pedersen-Bjergaard, Bioanalysis 5 (2013) 1377. [30] L. Chimuka, T.A.M. Msagati, E. Cukrowska, H. Tutu, Journal of Chromatography A 1217 (2010)
2318. [31] J.A. Jonsson, J Sep Sci 24 (2001) 493. [32] I.J. Kjelsen, A. Gjelstad, K.E. Rasmussen, S. Pedersen-Bjergaard, J Chromatogr A 1180 (2008) 1. [33] L.J. Lozano, C. Godinez, A.P. de los Rios, F.J. Hernandez-Fernandez, S. Sanchez-Segado, F.J.
Alguacil, Journal of Membrane Science 376 (2011) 1. [34] J. Lezamiz, J.A. Jonsson, Journal of Chromatography A 1152 (2007) 226. [35] N.J. Petersen, S.T. Foss, H. Jensen, S.H. Hansen, C. Skonberg, D. Snakenborg, J.P. Kutter, S.
Pedersen-Bjergaard, Analytical Chemistry 83 (2011) 44. [36] L.E. Eibak, A. Gjelstad, K.E. Rasmussen, S. Pedersen-Bjergaard, J Chromatogr A 1217 (2010)
5050. [37] G. Morales-Cid, S. Cardenas, B.M. Simonet, M. Valcarcel, Trac-Trends in Analytical Chemistry
29 (2010) 158. [38] P. Kuban, A. Slampova, P. Bocek, Electrophoresis 31 (2010) 768. [39] W. Wang, F. Zhou, L. Zhao, J.R. Zhang, J.J. Zhu, Journal of Chromatography A 1170 (2007) 1.
PhD thesis Knut Fredrik Seip References
68
[40] A. Berduque, A. Sherburn, M. Ghita, R.A.W. Dryfe, D.W.M. Arrigan, Analytical Chemistry 77 (2005) 7310.
[41] Y.G. Park, Desalination 191 (2006) 404. [42] V.A. Shaposhnik, K. Kesore, Journal of Membrane Science 136 (1997) 35. [43] Z. Lazarova, W. Serro, Separation Science and Technology 37 (2002) 515. [44] G. Bargeman, G.H. Koops, J. Houwing, I. Breebaart, H.C. van der Horst, M. Wessling,
Desalination 149 (2002) 369. [45] J. Stichlmair, J. Schmidt, R. Proplesch, Chemical Engineering Science 47 (1992) 3015. [46] E. Vandervlis, M. Mazereeuw, U.R. Tjaden, H. Irth, J. Vandergreef, Journal of Chromatography
A 687 (1994) 333. [47] E. Vandervlis, M. Mazereeuw, U.R. Tjaden, H. Irth, J. Vandergreef, Journal of Chromatography
A 712 (1995) 227. [48] E. vanderVlis, M. Mazereeuw, U.R. Tjaden, H. Irth, J. vanderGreef, Journal of
Chromatography A 741 (1996) 13. [49] S. Pedersen-Bjergaard, K.E. Rasmussen, Trac-Trends in Analytical Chemistry 27 (2008) 934. [50] A. Berduque, D.W. Arrigan, Anal Chem 78 (2006) 2717. [51] C.J. Collins, D.W. Arrigan, Anal Bioanal Chem 393 (2009) 835. [52] A. Berduque, J. O'Brien, J. Alderman, D.W.M. Arrigan, Electrochemistry Communications 10
(2008) 20. [53] C.J. Collins, A. Berduque, D.W.M. Arrigan, Analytical Chemistry 80 (2008) 8102. [54] G. Herzog, V. Kam, A. Berduque, D.W.M. Arrigan, Journal of Agricultural and Food Chemistry
56 (2008) 4304. [55] G. Morales-Cid, B.M. Simonet, S. Cardenas, M. Valcarcel, Electrophoresis 29 (2008) 2033. [56] R.J. Raterink, P.W. Lindenburg, R.J. Vreeken, T. Hankemeier, Anal Chem 85 (2013) 7762. [57] H.H. See, P.C. Hauser, Anal Chem 83 (2011) 7507. [58] J.B. Zeng, J. Zou, X.H. Song, J.M. Chen, J.J. Ji, B. Wang, Y.R. Wang, J. Ha, X. Chen, Journal of
Chromatography A 1218 (2011) 191. [59] J. Pawliszyn, S. Pedersen-Bjergaard, Journal of Chromatographic Science 44 (2006) 291. [60] H. Kataoka, Anal Bioanal Chem 396 (2010) 339. [61] Y. Saito, K. Jinno, J Chromatogr A 1000 (2003) 53. [62] J. Pawliszyn, Anal Chem 75 (2003) 2543. [63] C.L. Arthur, J. Pawliszyn, Analytical Chemistry 62 (1990) 2145. [64] G.F. Ouyang, D. Vuckovic, J. Pawliszyn, Chemical Reviews 111 (2011) 2784. [65] C.F. Duan, Z. Shen, D.P. Wu, Y.F. Guan, Trac-Trends in Analytical Chemistry 30 (2011) 1568. [66] A. Namera, T. Saito, Bioanalysis 5 (2013) 915. [67] S. Risticevic, V.H. Niri, D. Vuckovic, J. Pawliszyn, Analytical and Bioanalytical Chemistry 393
(2009) 781. [68] R. Eisert, J. Pawliszyn, Analytical Chemistry 69 (1997) 3140. [69] I. Bruheim, X. Liu, J. Pawliszyn, Anal Chem 75 (2003) 1002. [70] E. Baltussen, P. Sandra, F. David, C. Cramers, Journal of Microcolumn Separations 11 (1999)
737. [71] J. Xu, J. Zheng, J. Tian, F. Zhu, F. Zeng, C. Su, G. Ouyang, TrAC - Trends in Analytical Chemistry
47 (2013) 68. [72] N. Fontanals, R.M. Marce, F. Borrull, J Chromatogr A 1152 (2007) 14. [73] A. Spietelun, M. Pilarczyk, A. Kloskowski, J. Namiesnik, Chem Soc Rev 39 (2010) 4524. [74] G. Ouyang, J. Pawliszyn, Anal Bioanal Chem 386 (2006) 1059. [75] L.J. Krutz, S.A. Senseman, A.S. Sciumbato, Journal of Chromatography A 999 (2003) 103. [76] H.H. Jelen, Journal of Chromatographic Science 44 (2006) 399. [77] W. Wardencki, M. Michulec, J. Curylo, International Journal of Food Science and Technology
39 (2004) 703. [78] F. Pragst, Analytical and Bioanalytical Chemistry 388 (2007) 1393. [79] H. Lai, P. Guerra, M. Joshi, J.R. Almirall, Journal of Separation Science 31 (2008) 402.
PhD thesis Knut Fredrik Seip References
69
[80] A. Kabir, H. Holness, K.G. Furton, J.R. Almirall, Trac-Trends in Analytical Chemistry 45 (2013) 264.
[81] M. Walles, W.M. Mullett, J. Pawliszyn, J Chromatogr A 1025 (2004) 85. [82] T. Kumazawa, X.P. Lee, K. Sato, O. Suzuki, Analytica Chimica Acta 492 (2003) 49. [83] F.M. Musteata, J. Pawliszyn, Journal of Biochemical and Biophysical Methods 70 (2007) 181. [84] H.H. Liu, P.K. Dasgupta, Trac-Trends in Analytical Chemistry 15 (1996) 468. [85] M.A. Jeannot, F.F. Cantwell, Analytical Chemistry 68 (1996) 2236. [86] J.M. Kokosa, Trac-Trends in Analytical Chemistry 43 (2013) 2. [87] C. Nerin, J. Salafranca, M. Aznar, R. Batlle, Anal Bioanal Chem 393 (2009) 809. [88] L. Xu, C. Basheer, H.K. Lee, Journal of Chromatography A 1152 (2007) 184. [89] Y. He, H.K. Lee, Analytical Chemistry 69 (1997) 4634. [90] H.H. Liu, P.K. Dasgupta, Analytical Chemistry 68 (1996) 1817. [91] M.H. Ma, F.F. Cantwell, Analytical Chemistry 71 (1999) 388. [92] K. Choi, S.J. Kim, Y.G. Jin, Y.O. Jang, J.S. Kim, D.S. Chung, Analytical Chemistry 81 (2009) 225. [93] A.L. Theis, A.J. Waldack, S.M. Hansen, M.A. Jeannot, Analytical Chemistry 73 (2001) 5651. [94] K.E. Rasmussen, S. Pedersen-Biergaard, Trac-Trends in Analytical Chemistry 23 (2004) 1. [95] S. Pedersen-Bjergaard, K.E. Rasmussen, J Chromatogr A 1184 (2008) 132. [96] M.A. Bello-Lopez, M. Ramos-Payan, J.A. Ocana-Gonzalez, R. Fernandez-Torres, M. Callejon-
Mochon, Analytical Letters 45 (2012) 804. [97] M. Ghambarian, Y. Yamini, A. Esrafili, Microchimica Acta 177 (2012) 271. [98] A. Gjelstad, H. Jensen, K.E. Rasmussen, S. Pedersen-Bjergaard, Anal Chim Acta 742 (2012) 10. [99] T.S. Ho, T.G. Halvorsen, S. Pedersen-Bjergaard, K.E. Rasmussen, J Chromatogr A 998 (2003)
61. [100] Y. Tao, J.F. Liu, X.L. Hu, H.C. Li, T. Wang, G.B. Jiang, Journal of Chromatography A 1216 (2009)
6259. [101] W. Liu, Z.Y. Wei, Q. Zhang, F. Wu, Z. Lin, Q.M. Lu, F. Lin, G.N. Chen, L. Zhang, Talanta 88 (2012)
43. [102] J.L. Reubsaet, H. Loftheim, A. Gjelstad, J Sep Sci 28 (2005) 1204. [103] J.L. Reubsaet, J.V. Paulsen, J Sep Sci 28 (2005) 295. [104] T.S. Ho, S. Pedersen-Bjergaard, K.E. Rasmussen, J Chromatogr Sci 44 (2006) 308. [105] L.M. Zhao, H.K. Lee, Analytical Chemistry 74 (2002) 2486. [106] S. Cui, S. Tan, G. Ouyang, J. Pawliszyn, J Chromatogr A 1216 (2009) 2241. [107] A. Esrafili, Y. Yamini, M. Ghambarian, B. Ebrahimpour, J Chromatogr A 1262 (2012) 27. [108] A. Esrafili, Y. Yamini, M. Ghambarian, M. Moradi, S. Seidi, J Sep Sci 34 (2011) 957. [109] G. Ouyang, J. Pawliszyn, Analytical Chemistry 78 (2006) 5783. [110] T.S. Ho, S. Pedersen-Bjergaard, K.E. Rasmussen, J Chromatogr A 963 (2002) 3. [111] T.S. Ho, T. Vasskog, T. Anderssen, E. Jensen, K.E. Rasmussen, S. Pedersen-Bjergaard, Anal
Chim Acta 592 (2007) 1. [112] K.F. Bardstu, T.S. Ho, K.E. Rasmussen, S. Pedersen-Bjergaard, J.A. Jonsson, J Sep Sci 30 (2007)
1364. [113] K.E. Rasmussen, S. Pedersen-Bjergaard, M. Krogh, H.G. Ugland, T. Gronhaug, J Chromatogr A
873 (2000) 3. [114] T.G. Halvorsen, S. Pedersen-Bjergaard, J.L.E. Reubsaet, K.E. Rasmussen, Journal of Separation
Science 24 (2001) 615. [115] T.G. Halvorsen, S. Pedersen-Bjergaard, K.E. Rasmussen, J Chromatogr B 760 (2001) 219. [116] M. Saraji, M. Khalili Boroujeni, A.A. Hajialiakbari Bidgoli, Anal Bioanal Chem 400 (2011) 2149. [117] K. Farhadi, M. Hatami, A.A. Matin, Biomedical Chromatography 26 (2012) 972. [118] A.N. Bautista-Flores, E.R.D. Miguel, J. de Gyves, J.A. Jonsson, Journal of Membrane Science
363 (2010) 180. [119] S. Dadfarnia, A.M.H. Shabani, Analytica Chimica Acta 658 (2010) 107. [120] J. Lee, H.K. Lee, K.E. Rasmussen, S. Pedersen-Bjergaard, Anal Chim Acta 624 (2008) 253. [121] C. Basheer, J.P. Obbard, H.K. Lee, Journal of Chromatography A 1068 (2005) 221.
PhD thesis Knut Fredrik Seip References
70
[122] A. Rodriguez, S. Pedersen-Bjergaard, K.E. Rasmussen, C. Nerin, J Chromatogr A 1198-1199 (2008) 38.
[123] M. Diaz-Alvarez, E. Turiel, A. Martin-Esteban, International Journal of Environmental Analytical Chemistry 93 (2013) 727.
[124] R. Romero-Gonzalez, E. Pastor-Montoro, J.L. Martinez-Vidal, A. Garrido-Frenich, Rapid Communications in Mass Spectrometry 20 (2006) 2701.
[125] N.J. Petersen, K.E. Rasmussen, S. Pedersen-Bjergaard, A. Gjelstad, Analytical Sciences 27 (2011) 965.
[126] S. Pedersen-Bjergaard, K.E. Rasmussen, Analytical and Bioanalytical Chemistry 388 (2007) 521.
[127] V. Krishna Marothu, M. Gorrepati, R. Vusa, J Chromatogr Sci 51 (2013) 619. [128] A. Gjelstad, S. Pedersen-Bjergaard, Bioanalysis 3 (2011) 787. [129] A. Gjelstad, S. Pedersen-Bjergaard, Analytical Methods 5 (2013) 4549. [130] P.W. Lindenburg, R. Ramautar, T. Hankemeier, Bioanalysis 5 (2013) 2785. [131] A. Gjelstad, T.M. Andersen, K.E. Rasmussen, S. Pedersen-Bjergaard, J Chromatogr A 1157
(2007) 38. [132] M. Balchen, A. Gjelstad, K.E. Rasmussen, S. Pedersen-Bjergaard, J Chromatogr A 1152 (2007)
220. [133] C. Basheer, S.H. Tan, H.K. Lee, J Chromatogr A 1213 (2008) 14. [134] J. Lee, F. Khalilian, H. Bagheri, H.K. Lee, Journal of Chromatography A 1216 (2009) 7687. [135] A. Gjelstad, K.E. Rasmussen, S. Pedersen-Bjergaard, Anal Bioanal Chem 393 (2009) 921. [136] A. Gjelstad, K.E. Rasmussen, S. Pedersen-Bjergaard, J Chromatogr A 1124 (2006) 29. [137] A. Gjelstad, K.E. Rasmussen, S. Pedersen-Bjergaard, J Chromatogr A 1174 (2007) 104. [138] T.M. Middelthon-Bruer, A. Gjelstad, K.E. Rasmussen, S. Pedersen-Bjergaard, J Sep Sci 31
(2008) 753. [139] M. Balchen, L. Reubsaet, S. Pedersen-Bjergaard, J Chromatogr A 1194 (2008) 143. [140] S. Nojavan, A.R. Fakhari, J Sep Sci 33 (2010) 3231. [141] L. Xu, P.C. Hauser, H.K. Lee, Journal of Chromatography A 1214 (2008) 17. [142] M. Balchen, T.G. Halvorsen, L. Reubsaet, S. Pedersen-Bjergaard, J Chromatogr A 1216 (2009)
6900. [143] M. Balchen, H. Jensen, L. Reubsaet, S. Pedersen-Bjergaard, J Sep Sci 33 (2010) 1665. [144] N.J. Petersen, H. Jensen, S.H. Hansen, K.E. Rasmussen, S. Pedersen-Bjergaard, J Chromatogr A
1216 (2009) 1496. [145] C. Basheer, J. Lee, S. Pedersen-Bjergaard, K.E. Rasmussen, H.K. Lee, J Chromatogr A 1217
(2010) 6661. [146] N.J. Petersen, H. Jensen, S.H. Hansen, S.T. Foss, D. Snakenborg, S. Pedersen-Bjergaard,
Microfluidics and Nanofluidics 9 (2010) 881. [147] Y.G. Guo, Y.Z. Yu, X.J. Liu, E.Q. Tang, Chemistry Letters 37 (2008) 1272. [148] M. Balchen, A.G. Hatterud, L. Reubsaet, S. Pedersen-Bjergaard, J Sep Sci 34 (2011) 186. [149] S. Seidi, Y. Yamini, A. Saleh, M. Moradi, J Sep Sci 34 (2011) 585. [150] M.D. Payan, B. Li, N.J. Petersen, H. Jensen, S.H. Hansen, S. Pedersen-Bjergaard, Anal Chim
Acta 785 (2013) 60. [151] L.E. Eibak, A.B. Hegge, K.E. Rasmussen, S. Pedersen-Bjergaard, A. Gjelstad, Anal Chem 84
(2012) 8783. [152] A. Slampova, P. Kuban, P. Bocek, J Chromatogr A 1234 (2012) 32. [153] M. Balchen, H. Lund, L. Reubsaet, S. Pedersen-Bjergaard, Anal Chim Acta 716 (2012) 16. [154] L.E. Eibak, A. Gjelstad, K.E. Rasmussen, S. Pedersen-Bjergaard, J Pharm Biomed Anal 57 (2012)
33. [155] N.C. Dominguez, A. Gjelstad, A.M. Nadal, H. Jensen, N.J. Petersen, S.H. Hansen, K.E.
Rasmussen, S. Pedersen-Bjergaard, J Chromatogr A 1248 (2012) 48. [156] A. deJuan, G. Fonrodona, E. Casassas, Trac-Trends in Analytical Chemistry 16 (1997) 52. [157] L. Strieglerova, P. Kuban, P. Bocek, J Chromatogr A 1218 (2011) 6248.
PhD thesis Knut Fredrik Seip References
71
[158] L.R. Snyder, Journal of Chromatography 92 (1974) 223. [159] L.R. Snyder, Journal of Chromatographic Science 16 (1978) 223. [160] M. Rezazadeh, Y. Yamini, S. Seidi, A. Esrafili, Analytica Chimica Acta 773 (2013) 52. [161] S. Seidi, Y. Yamini, A. Heydari, M. Moradi, A. Esrafili, M. Rezazadeh, Anal Chim Acta 701 (2011)
181. [162] L. Fotouhi, Y. Yamini, S. Molaei, S. Seidi, J Chromatogr A 1218 (2011) 8581. [163] A.R. Fakhari, H. Tabani, S. Nojavan, H. Abedi, Electrophoresis 33 (2012) 506. [164] S. Seidi, Y. Yamini, T. Baheri, R. Feizbakhsh, J Chromatogr A 1218 (2011) 3958. [165] K.S. Hasheminasab, A.R. Fakhari, A. Shahsavani, H. Ahmar, J Chromatogr A 1285 (2013) 1. [166] S.S. Davarani, H.R. Moazami, A.R. Keshtkar, M.H. Banitaba, S. Nojavan, Anal Chim Acta 783
(2013) 74. [167] C. Huang, L.E. Eibak, A. Gjelstad, X. Shen, R. Trones, H. Jensen, S. Pedersen-Bjergaard, J
Chromatogr A 1326 (2014) 7. [168] M. Rezazadeh, Y. Yamini, S. Seidi, A. Esrafili, Journal of Chromatography A 1262 (2012) 214. [169] M. Rezazadeh, Y. Yamini, S. Seidi, J Sep Sci 35 (2012) 571. [170] S. Seidi, Y. Yamini, M. Rezazadeh, Journal of Chromatography B-Analytical Technologies in
the Biomedical and Life Sciences 913 (2013) 138. [171] A.R. Fakhari, H. Tabani, H. Behdad, S. Nojavan, M. Taghizadeh, Microchemical Journal 106
(2013) 186. [172] C.P. Lodoen, L.E. Eng Eibak, K.E. Rasmussen, S. Pedersen-Bjergaard, T. Andersen, A. Gjelstad,
Bioanalysis 5 (2013) 317.
I
II
III
IV
V
Salt effects in electromembrane extraction
Knut Fredrik Seip1, Henrik Jensen2, Thanh Elisabeth Kieu1, Astrid Gjelstad1, and Stig Pedersen-
Bjergaard1,2*
1School of Pharmacy, University of Oslo, P.O. Box 1068 Blindern, 0316 Oslo, Norway
2Department of Pharmacy, Faculty of Health and Medical Sciences, University of Copenhagen,
prochlorperazine, promethazine, clomipramine, and clemastine.
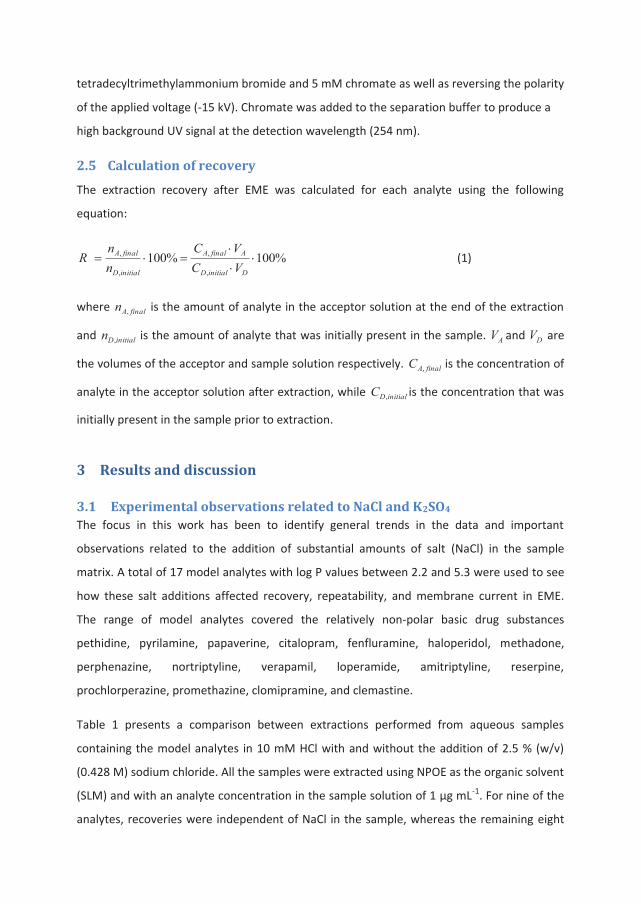
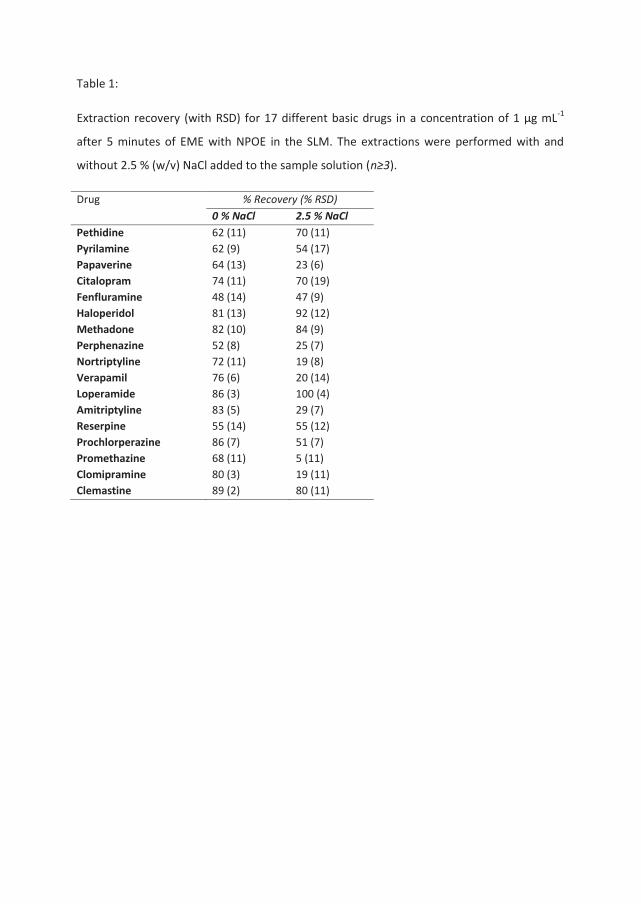
Table 1 presents a comparison between extractions performed from aqueous samples
containing the model analytes in 10 mM HCl with and without the addition of 2.5 % (w/v)
(0.428 M) sodium chloride. All the samples were extracted using NPOE as the organic solvent
(SLM) and with an analyte concentration in the sample solution of 1 μg mL-1. For nine of the
analytes, recoveries were independent of NaCl in the sample, whereas the remaining eight
compounds clearly were affected by the presence of NaCl. A correlation between these
trends and different physical chemical properties of the analytes, such as log P, polar surface
area, pKa, aqueous solubility, polarizability, or molecular surface area was not apparent. It
should be noted, however, that several of the analytes were tricyclic antidepressants (TCA)
and they were all affected by the addition of NaCl.
Subsequently, additional experiments were performed with eight of the model analytes with
both 1 and 5 % (w/v) NaCl added to the sample solution. Even with 1 % NaCl, several of the
model analytes demonstrated reduced recovery as compared to samples with no NaCl. With
5 % (w/v) NaCl the RSD values increased substantially, due to poor repeatability of the data.
The remaining experiments were thus performed by comparing 2.5 % (w/v) NaCl in the
sample solution to no salt addition.
No significant differences in the membrane current were seen when monitoring the
extraction current during EME. This indicates that the additional ions from NaCl in the
sample do not affect the transfer of current in the system. This was also confirmed by an
experiment using CE with indirect UV detection to measure the amount of sodium and
chloride ions in the acceptor solution after extraction. This experiment showed no sign of
penetration of these ions through the SLM when NPOE was used as the organic solvent, and
the EME system with this setup was highly resistant to co-extraction of Na+ and Cl- ions.
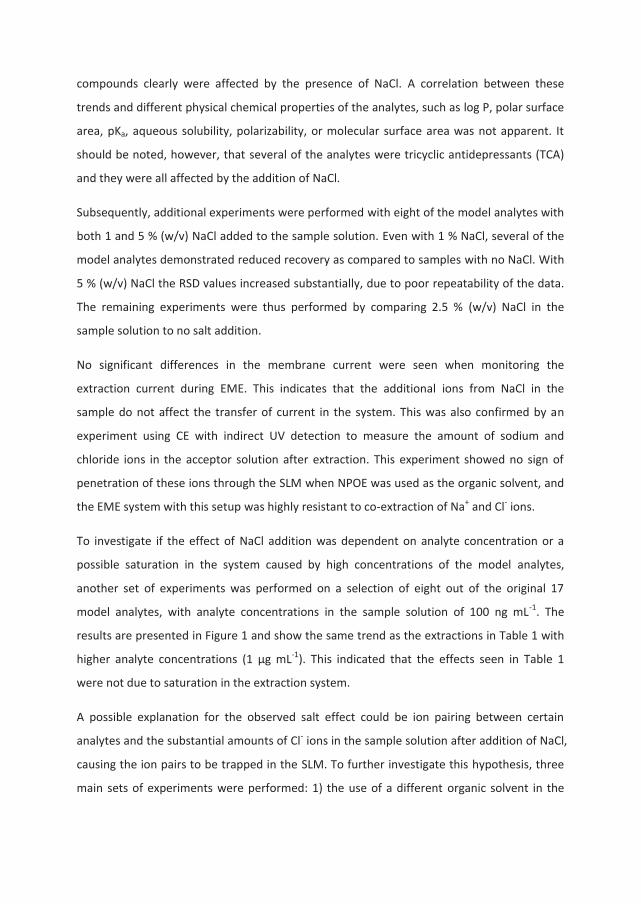
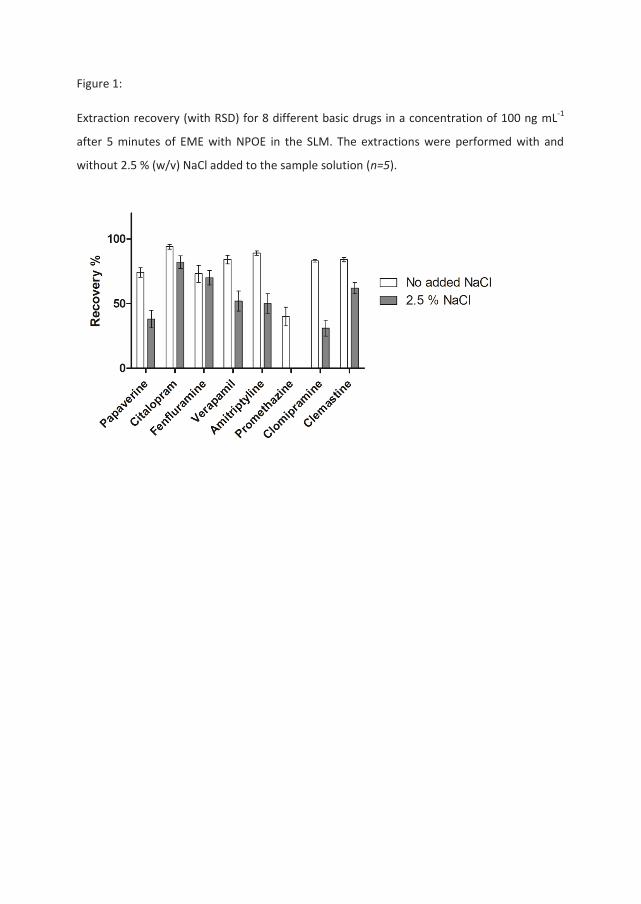
To investigate if the effect of NaCl addition was dependent on analyte concentration or a
possible saturation in the system caused by high concentrations of the model analytes,
another set of experiments was performed on a selection of eight out of the original 17
model analytes, with analyte concentrations in the sample solution of 100 ng mL-1. The
results are presented in Figure 1 and show the same trend as the extractions in Table 1 with
higher analyte concentrations (1 μg mL-1). This indicated that the effects seen in Table 1
were not due to saturation in the extraction system.
A possible explanation for the observed salt effect could be ion pairing between certain
analytes and the substantial amounts of Cl- ions in the sample solution after addition of NaCl,
causing the ion pairs to be trapped in the SLM. To further investigate this hypothesis, three
main sets of experiments were performed: 1) the use of a different organic solvent in the
SLM, 2) the use of a lower SLM to acceptor solution volume ratio (thinner membrane), and 3)
addition of another salt different from NaCl.
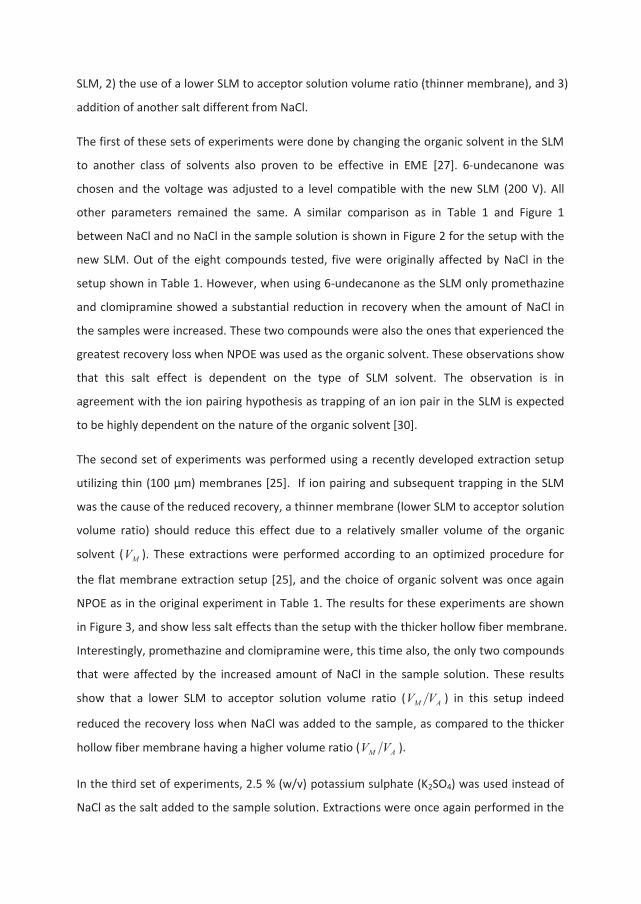
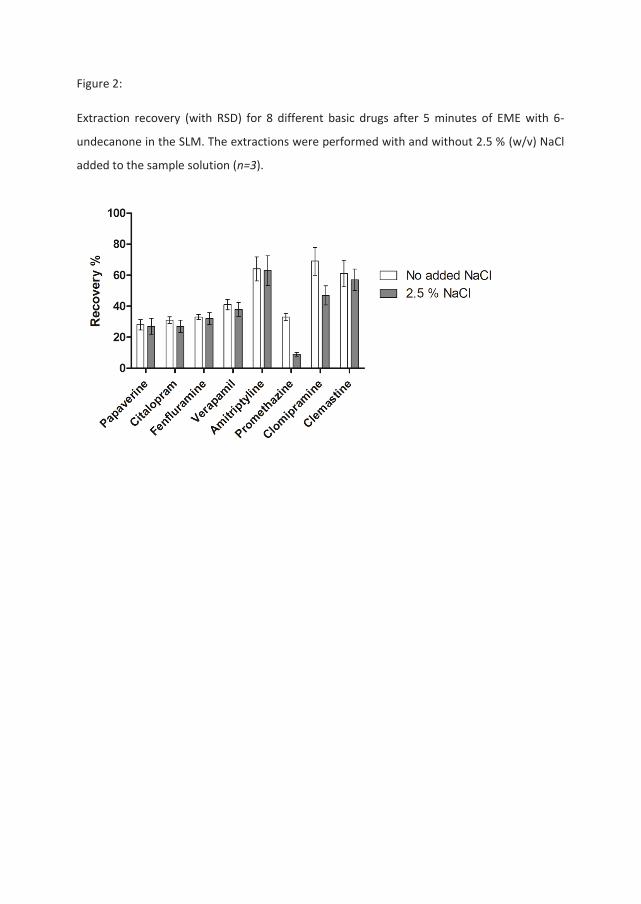
The first of these sets of experiments were done by changing the organic solvent in the SLM
to another class of solvents also proven to be effective in EME [27]. 6-undecanone was
chosen and the voltage was adjusted to a level compatible with the new SLM (200 V). All
other parameters remained the same. A similar comparison as in Table 1 and Figure 1
between NaCl and no NaCl in the sample solution is shown in Figure 2 for the setup with the
new SLM. Out of the eight compounds tested, five were originally affected by NaCl in the
setup shown in Table 1. However, when using 6-undecanone as the SLM only promethazine
and clomipramine showed a substantial reduction in recovery when the amount of NaCl in
the samples were increased. These two compounds were also the ones that experienced the
greatest recovery loss when NPOE was used as the organic solvent. These observations show
that this salt effect is dependent on the type of SLM solvent. The observation is in
agreement with the ion pairing hypothesis as trapping of an ion pair in the SLM is expected
to be highly dependent on the nature of the organic solvent [30].
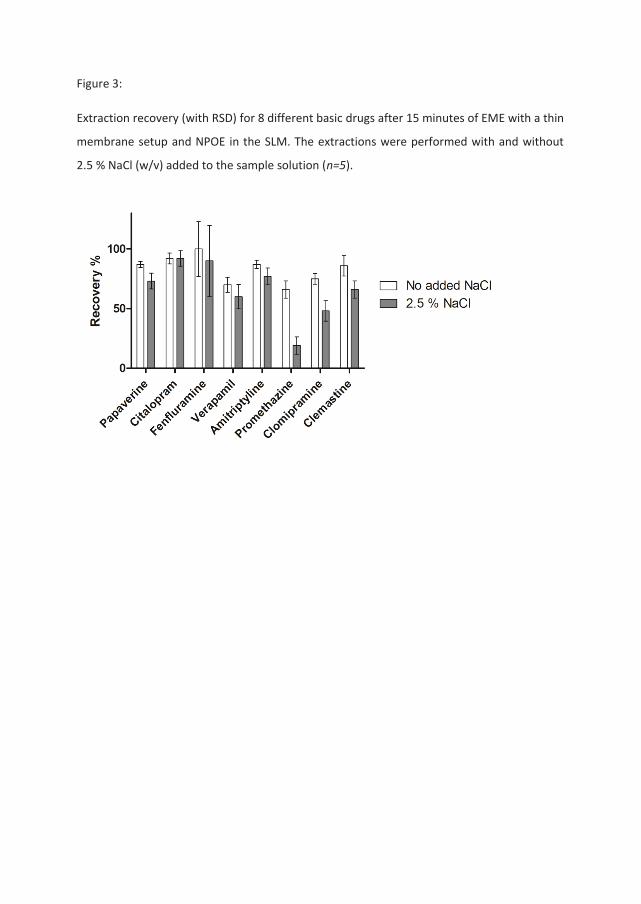
The second set of experiments was performed using a recently developed extraction setup
utilizing thin (100 μm) membranes [25]. If ion pairing and subsequent trapping in the SLM
was the cause of the reduced recovery, a thinner membrane (lower SLM to acceptor solution
volume ratio) should reduce this effect due to a relatively smaller volume of the organic
solvent ( MV ). These extractions were performed according to an optimized procedure for
the flat membrane extraction setup [25], and the choice of organic solvent was once again
NPOE as in the original experiment in Table 1. The results for these experiments are shown
in Figure 3, and show less salt effects than the setup with the thicker hollow fiber membrane.
Interestingly, promethazine and clomipramine were, this time also, the only two compounds
that were affected by the increased amount of NaCl in the sample solution. These results
show that a lower SLM to acceptor solution volume ratio ( AM VV ) in this setup indeed
reduced the recovery loss when NaCl was added to the sample, as compared to the thicker
hollow fiber membrane having a higher volume ratio ( AM VV ).
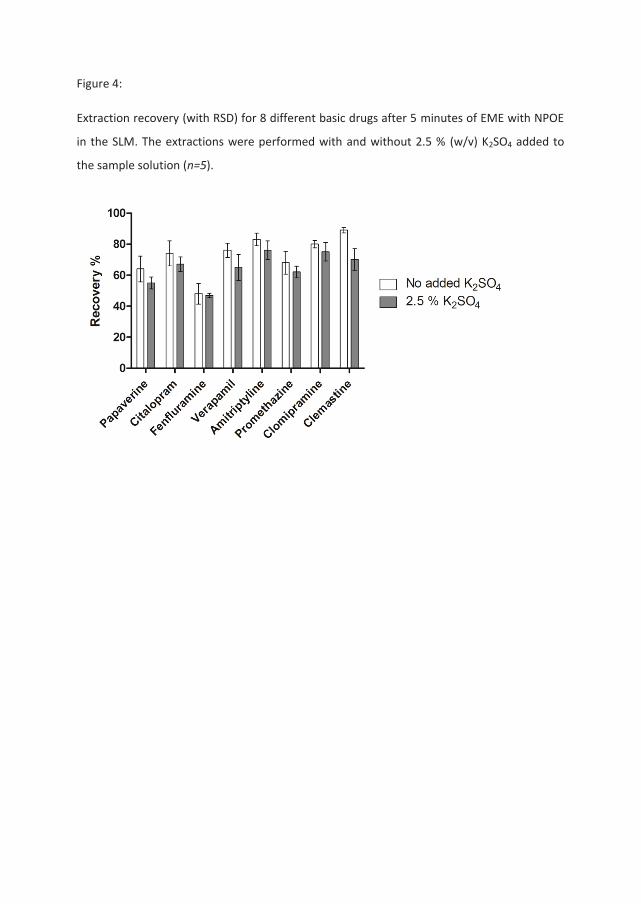
In the third set of experiments, 2.5 % (w/v) potassium sulphate (K2SO4) was used instead of
NaCl as the salt added to the sample solution. Extractions were once again performed in the
hollow fiber system, with NPOE as the organic solvent (SLM). The results of these
experiments are presented in Figure 4, and show no substantial changes in recovery
between the samples with and without K2SO4. This suggests that the type of salt play an
important role. Since efficient ion pairing with the analytes and trapping of the ion pair
complexes are highly dependent on the counter ion, this result also strengthens the
hyphotesis of ion pairing as the cause of reduced recovery when NaCl is present in the
sample. It may also be noted that a 1 to 1 complex between a singly charged base cation and
sulphate will have a charge of -1 and will therefore move across the SLM under the influence
of an applied potential rather than being trapped in the SLM as a neutral species.
In all the experiments, a mass balance was established by analyzing both the sample solution
and the acceptor solution after EME. Also, the inner surfaces of the sample vials were
checked for analyte adsorption or precipitation after the extractions. No measureable
adsorption or precipitation was detected on the vial surfaces, so the amounts unaccounted
for after measurement of the sample and acceptor solution was believed to be trapped in
the SLM. In all the cases of reduced recovery, the additional loss was found to be trapped in
the SLM according to the mass balance measurements. Additional experiments were
performed with increased extraction times but none of these experiments were able to
release any significant amount of the trapped analytes from the SLM.
3.2 Similar experiences from the literature
The reduced recovery for some of the analytes when extracting from samples containing
salts are in line with previously reported experiments with NaCl in EME. These experiments
have not been quantified and were performed during method development to investigate if
large amounts of salts and large changes in the ion balance affect the extraction recovery.
The basic substances thebaine [10], ephedrine [18], trimipramine [19], and several
amphetamine like stimulants [11], as well as the acidic substances ibuprofen, naproxen [20],
and several chlorophenols [21] were extracted with NaCl in the sample commonly ranging
from 5 to 15 % (w/v). All the above results were in agreement with the general flux theory in
EME, where a high amount of ions in the sample solution reduce the efficiency of the
extraction process [22], and concluded that the reason for the lower recovery was because
of the unfavorable ion balance in the system. However, for extractions of some haloacetic
acids and aromatic acetic acids [16] it was concluded that a concentration of up to 5 % (w/v)
NaCl improved the extraction recoveries because of a salting-out effect, whereas higher
concentrations caused the recovery to decrease.
The stability of the EME system when extracting from higher amounts of NaCl in the sample
solution was also investigated when extracting uranium (VI) [31], concluding that at higher
salt levels (higher than 2 % w/v), the EME system became unstable. This was consistent with
the observations reported in section 3.1.
3.3 Theoretical considerations The experimental observations indicate that formation of ion pairs play a role at least for
some of the investigated drug compounds. Ion pair formation in relation partitioning in
organic solvents immiscible with water has previously been treated from a theoretical point
of view, albeit in a different system [32].
In the present system it was observed that NaCl in the sample solution in some cases has an
impact on the recovery. It has also been established, both previously [24] and from the mass
balance measurements in this work, that the sample solution is emptied relatively fast. In
principle, ion paring may take place in the sample solution and/or a higher chloride
concentration in the sample solution may lead to a larger amount of anions (bound and free)
in the SLM. In the following we will only consider the recovery after exhaustive extraction,
corresponding to the case where the sample solution has been completely depleted of
analyte (application of a large extraction potential for a long time). In the mass balance
consideration we will therefore assume that there is no analyte present in the sample
solution. We shall present the theoretical consideration using the notation B+ for the base
and Cl- for the anion, and for simplicity we only consider singly charged ions.
In terms of chemical equlibria we may describe the system after exhaustive extraction as
follows:
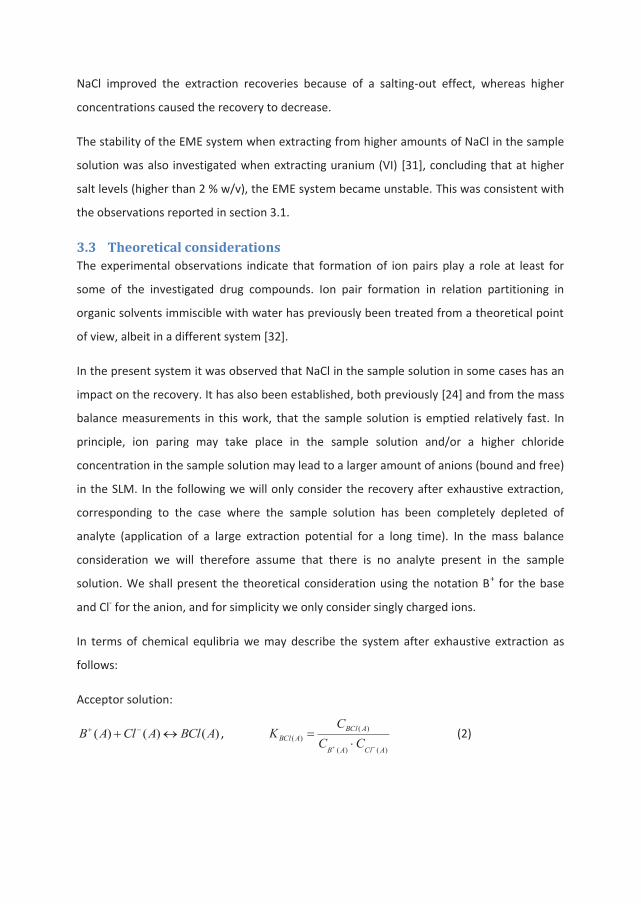
Acceptor solution:
)()()( ABClAClAB , )()(
)()(
AClAB
ABClABCl CC
CK (2)
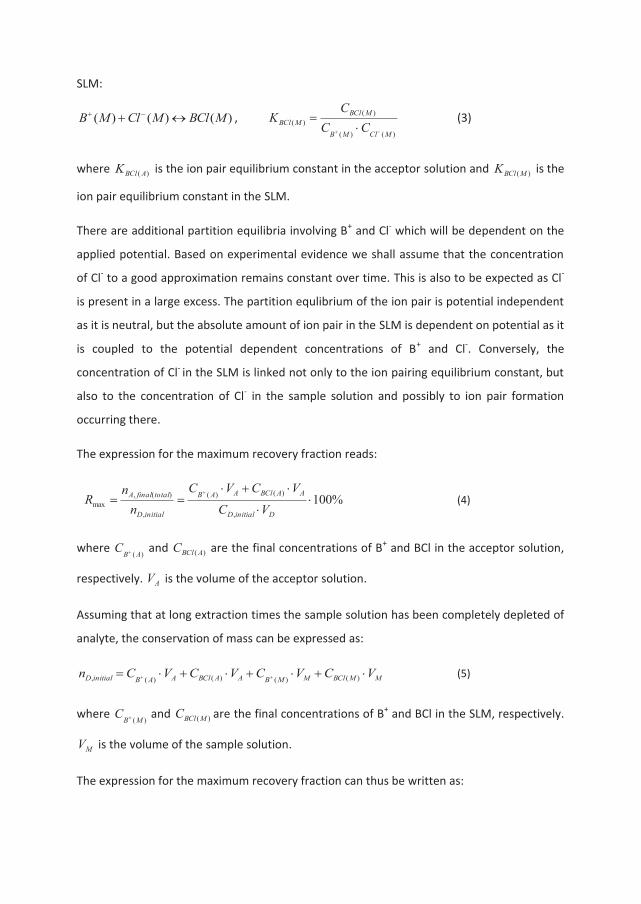
SLM:
)()()( MBClMClMB , )()(
)()(
MClMB
MBClMBCl CC
CK (3)
where )( ABClK is the ion pair equilibrium constant in the acceptor solution and )(MBClK is the
ion pair equilibrium constant in the SLM.
There are additional partition equilibria involving B+ and Cl- which will be dependent on the
applied potential. Based on experimental evidence we shall assume that the concentration
of Cl- to a good approximation remains constant over time. This is also to be expected as Cl-
is present in a large excess. The partition equlibrium of the ion pair is potential independent
as it is neutral, but the absolute amount of ion pair in the SLM is dependent on potential as it
is coupled to the potential dependent concentrations of B+ and Cl-. Conversely, the
concentration of Cl- in the SLM is linked not only to the ion pairing equilibrium constant, but
also to the concentration of Cl- in the sample solution and possibly to ion pair formation
occurring there.
The expression for the maximum recovery fraction reads:
%100,
)()(
,
)(,max
DinitialD
AABClAAB
initialD
totalfinalA
VC
VCVC
nn
R (4)
where )( ABC and )( ABClC are the final concentrations of B+ and BCl in the acceptor solution,
respectively. AV is the volume of the acceptor solution.
Assuming that at long extraction times the sample solution has been completely depleted of
analyte, the conservation of mass can be expressed as:
MMBClMMBAABClAABinitialD VCVCVCVCn )()()()(, (5)
where )(MBC and )(MBClC are the final concentrations of B+ and BCl in the SLM, respectively.
MV is the volume of the sample solution.
The expression for the maximum recovery fraction can thus be written as:
%100)()()()(
)()(
,
)(,max
MMBClMMBAABClAAB
AABClAAB
initialD
totalfinalA
VCVCVCVC
VCVC
nn
R
%100
)(
)(
)(
)(
)(
)(
)(
)(
MAB
MBClM
AB
MBA
AB
ABClA
AAB
ABClA
VCC
VCC
VCC
V
VCC
V
(6)
The partition coefficient of B+ between the acceptor solution and the SLM is potential
dependent according to [24]:
)(exp 0
)(
)(*, B
wo
wo
AB
MBAd RT
FC
CK (7)
Here wo is the Galvani potential difference between the acceptor solution and the SLM.
wo is proportional to E where E is the applied extraction potential. A high positive
potential would thus result in a very low *dK (typically the case for exhaustive extractions).
0B
wo is a property related to how hydrophobic the analyte B+ is.
Using the expression for *dK , )(MBClK and )( ABClK we arrive at:
%1001
1
%100
)()(*
,*
,)()(
)()(
)()(*
,*
)()(
)()(
max
MClMBClAdA
M
A
MAdAClABCl
AClABCl
MMClMBClAdMdAAClABClA
AAClABClA
CKKVV
VVKCK
CK
VCKKVKVCKV
VCKVR
%1001
1
)()(*
,*
,)()(
)()(
MClMBClAdAdA
MAClABCl
AClABCl
CKKKVVCK
CK (8)
From this expression some limiting situations may be considered:
Case 1: 1)()( AClABCl CK (No significant ion pairing in the acceptor solution).
%1001
1
)()(*
,*
,
max
MClMBClAdAdA
M CKKKVVR
%10011
1
)()(*
, MClMBClAdA
M CKKVV (9)
Here the maximum recovery is dependent on AM VV as also observed experimentally. If
substantial ion paring is observed in the SLM ( 1)()( MClMBCl CK ), the maximum
obtainable recovery may be smaller than 1. As previously stated )(MClC may be affected if
the chloride concentration in the sample solution is increased. This could explain the
pronounced dependence of the chloride concentration in the sample solution on the
extraction recovery observed for some drug compounds. Additionally, )(MClC is dependent
on the applied extraction potential.
Case 2: 1)()( MClMBCl CK (No significant ion pairing in the SLM).
%1001
1*
,
max
AdA
M KVVR (10)
Since typically 1*,AdK at high potentials we simply get a maximum recovery of 100 % in
this case.
The behavior seen for the model analytes in Table 1 belong to both of these cases. For the
nine unaffected analytes a behavior similar to the second case can be observed, where no
significant ion pairing occure in the SLM. The recovery is thus unaffected by the presence of
salts. For the eight affected analytes, the behavior is more similar to the first case, and ion
pairing in the SLM reduces the recovery. When the SLM to acceptor solution volume ratio
AM VV is reduced, this reduction in recovery should also be reduced according to equation 9.
This is in line with the experimentally observed results presented in Figure 3. For the two
model analytes promethazine and clomipramine, the salt dependency was high, and even
though the reduced SLM to acceptor solution volume ratio AM VV somewhat improved the
recovery, it was still much lower than without salts present. A substantial ion pairing can
cause the denominator in equation 9 to still be much larger than 1, even after reducing the
volume ratio AM VV between the SLM and the acceptor solution, as might be the case for
these two substances.
4 Conclusion The present work has thoroughly investigated how the presence of salt in the sample
solution affects EME of various unpolar basic drugs. For eight out of a total of 17 substances,
the recoveries were significantly reduced when 2.5 % (w/v) NaCl was added to the sample
solution. A correlation between physical chemical properties of the analytes and this
observed recovery loss was not apparent. For larger amounts of NaCl (5 % w/v) in the
sample solution also the repeatability of the extractions was affected. The observed
recovery loss was explained according to a hypothesis of ion pairing in the SLM, and a
mathematical model for this effect has been presented. Experimental data showed that the
recovery loss could be reduced by changing the organic solvent in the SLM or use a lower
SLM to acceptor solution volume ratio, which is in line with the theoretical model. These
findings represent the first thorough investigation of how salts in the sample solution can
influence EME, and improve the theoretical understanding of the extraction process.
References
[1] S. Endo, A. Pfennigsdorff, K.U. Goss, Environmental Science & Technology 46 (2012) 1496.
[2] S. Pedersen-Bjergaard, K.E. Rasmussen, Anal Chem 71 (1999) 2650. [3] T.G. Halvorsen, S. Pedersen-Bjergaard, K.E. Rasmussen, J Chromatogr B 760
(2001) 219. [4] K.E. Rasmussen, S. Pedersen-Biergaard, Trac-Trends in Analytical Chemistry 23
(2004) 1. [5] S. Pedersen-Bjergaard, K.E. Rasmussen, J Chromatogr A 1109 (2006) 183. [6] C.P. Lodoen, L.E. Eng Eibak, K.E. Rasmussen, S. Pedersen-Bjergaard, T. Andersen,
A. Gjelstad, Bioanalysis 5 (2013) 317. [7] A. Gjelstad, K.E. Rasmussen, S. Pedersen-Bjergaard, Anal Bioanal Chem 393 (2009)
921. [8] L. Strieglerova, P. Kuban, P. Bocek, Electrophoresis 32 (2011) 1182. [9] M. Balchen, H. Lund, L. Reubsaet, S. Pedersen-Bjergaard, Anal Chim Acta 716
(2012) 16.
[10] S. Seidi, Y. Yamini, A. Heydari, M. Moradi, A. Esrafili, M. Rezazadeh, Anal Chim Acta 701 (2011) 181.
[11] S. Seidi, Y. Yamini, T. Baheri, R. Feizbakhsh, J Chromatogr A 1218 (2011) 3958. [12] M. Rezazadeh, Y. Yamini, S. Seidi, A. Esrafili, Analytica Chimica Acta 773 (2013) 52. [13] R.E. Jamt, A. Gjelstad, L.E. Eibak, E.L. Oiestad, A.S. Christophersen, K.E. Rasmussen,
S. Pedersen-Bjergaard, J Chromatogr A 1232 (2012) 27. [14] M. Ramos-Payan, M. Villar-Navarro, R. Fernandez-Torres, M. Callejon-Mochon,
M.A. Bello-Lopez, Anal Bioanal Chem 405 (2013) 2575. [15] P. Kuban, L. Strieglerova, P. Gebauer, P. Bocek, Electrophoresis 32 (2011) 1025. [16] K. Alhooshani, C. Basheer, J. Kaur, A. Gjelstad, K.E. Rasmussen, S. Pedersen-
Bjergaard, H.K. Lee, Talanta 86 (2011) 109. [17] S. Seidi, Y. Yamini, A. Saleh, M. Moradi, J Sep Sci 34 (2011) 585. [18] L. Fotouhi, Y. Yamini, S. Molaei, S. Seidi, J Chromatogr A 1218 (2011) 8581. [19] A.R. Fakhari, H. Tabani, S. Nojavan, H. Abedi, Electrophoresis 33 (2012) 506. [20] K.S. Hasheminasab, A.R. Fakhari, A. Shahsavani, H. Ahmar, J Chromatogr A 1285
(2013) 1. [21] J. Lee, F. Khalilian, H. Bagheri, H.K. Lee, Journal of Chromatography A 1216 (2009)
7687. [22] A. Gjelstad, K.E. Rasmussen, S. Pedersen-Bjergaard, J Chromatogr A 1174 (2007)
104. [23] P.W. Lindenburg, R. Ramautar, T. Hankemeier, Bioanalysis 5 (2013) 2785. [24] K.F. Seip, H. Jensen, M.H. Sonsteby, A. Gjelstad, S. Pedersen-Bjergaard,
Electrophoresis 34 (2013) 792. [25] C. Huang, L.E. Eibak, A. Gjelstad, X. Shen, R. Trones, H. Jensen, S. Pedersen-
Bjergaard, J Chromatogr A 1326 (2014) 7. [26] A. Gjelstad, K.E. Rasmussen, S. Pedersen-Bjergaard, J Chromatogr A 1124 (2006)
29. [27] K.F. Seip, M. Faizi, C. Vergel, A. Gjelstad, S. Pedersen-Bjergaard, Anal Bioanal Chem