

RESEARCH REPORT VTT-R-00140-15
Emission gap to 2 degreepathways– Framework to assess the ambition ofIntended Nationally DeterminedContributions, INDCs
Authors: Tomi J. Lindroos and Tommi Ekholm
Confidentiality: Public

RESEARCH REPORT VTT-R-00140-151 (40)

RESEARCH REPORT VTT-R-00140-152 (40)
Report’s title
Emission gap to 2 degree pathways – Framework to assess the ambition of IntendedNationally Determined Contributions, INDCsCustomer, contact person, address Order reference
Ministry of the Environment of Finland, Magnus Cederlöf
Project name Project number/Short name
EUilmasto 78222Author(s) Pages
Tomi J. Lindroos and Tommi Ekholm 40Keywords Report identification code
2 degree target, pledges, emission gap, ghg projections VTT-R-00140-15Summary
New international climate change agreement is the main target of Paris climatenegotiations in Paris in December 2015. For the agreement, countries will give promises ofemission reductions. Previously these promises have been referred as ‘pledges’ but, for Parisnegotiations, countries will submit Intended Nationally Determined Contributions (INDCs).Three largest greenhouse gas (GHG) emitting countries (China, USA and EU) have givensome indications of their INDCs. This report summarizes existing pledges and preliminaryINDCs for Paris.
Current pledges have varying scopes and coverages. Countries are urged to attachqualitative information to their INDCs, but the level of submitted details is unknown at the timeof the writing. This report provides a framework to assess and compare the existing pledgesand INDCs after country submissions. Report profiles and analyses 8 biggest GHG emittingcountries: China, USA, EU, India, Russia, Indonesia, Brazil and Japan. The rest of the worldis assessed more briefly.
Each country profile includes emission statistics; summary of country’s pledge andpreliminary INDC when available; comparison of the GHG projection under current legislationand the country’s pledge; GHG emission scenarios up to 2050 with different ambition levels;and calculated emission reduction indicators from these scenarios such as GHG per GDP,GHG per capita and renewable energy share.
Based on these national scenarios, we compile three global emission reduction scenariosand compare these three scenarios to the 2 degree target pathways. The GHG developmentunder the current legislation is at too high level compared to the 2 degree target, butambitious GHG reductions may still be sufficient to reach 2 degree target. We need quickaction to reach these emission low carbon pathways.
Confidentiality PublicEspoo 6.2.2015Written by
Tomi J. Lindroos, Researcher
Reviewed by
{Clarification of signature, position}
Accepted by
{Clarification of signature, position}
VTT’s contact addressPL 1000, 02044 VTT, Finland. Tel: +358 20 722 111
Distribution: customer and VTT
The use of the name of the VTT Technical Research Centre of Finland (VTT) in advertising or publication in part ofthis report is only permissible with written authorisation from the VTT Technical Research Centre of Finland.

RESEARCH REPORT VTT-R-00140-153 (40)
Preface
This report analyses the emission reduction pathways to reach 2 degree target, countries’GHG emission projections under different scenarios and gives a framework to assess futurepledges. The research has been done and the report written by Tomi J. Lindroos and TommiEkholm.
The work is a part of a larger research project commissioned by Finnish Ministry of theEnvironment. The steering group for the project comprised Environment Counsellor MagnusCederlöf, Counsellor Harri Laurikka and Senior Adviser Paula Perälä. The authors wish tothank the steering group for their helpful comments regarding the report.
The views expressed in this report are those of the authors, and do not necessarily representthe view of Finnish Ministry of the Environment.
Espoo, 6.2.2015Authors

RESEARCH REPORT VTT-R-00140-154 (40)
Contents
Preface ................................................................................................................................... 3
Contents ................................................................................................................................. 4
1. Introduction ....................................................................................................................... 6
2. Emission reduction pathways for 2 degree target .............................................................. 8
3. Global emissions and current pledges ............................................................................ 11
3.1 Global emissions 1990-2010................................................................................... 113.2 Copenhagen pledges for 2020 (and 2050) .............................................................. 123.3 INDCs for Paris 2015 .............................................................................................. 14
4. Country level analysis ..................................................................................................... 16
4.1 Structure of the country level analysis ..................................................................... 164.2 China ...................................................................................................................... 174.3 United States .......................................................................................................... 194.4 European Union ...................................................................................................... 214.5 India ........................................................................................................................ 234.6 Indonesia ................................................................................................................ 254.7 Brazil ...................................................................................................................... 274.8 Russia .................................................................................................................... 294.9 Japan ...................................................................................................................... 314.10 Rest of the World .................................................................................................... 33
5. Comparing the mitigation scenarios and 2 degree pathways .......................................... 35
6. Summary and conclusions .............................................................................................. 38
RESEARCH REPORT VTT-R-00140-155 (40)

RESEARCH REPORT VTT-R-00140-156 (40)
1. Introduction
Many developed and developing countries have given pledges where they set emissionreduction targets for themselves for 2020 In Copenhagen Accord in 2009 1. The content andconditions of given pledges varies much from country to another2, 3.
The main objective of Cancun agreement from 2010 is to “establish clear objectives forreducing human-generated greenhouse gas emissions over time to keep the global averagetemperature rise below two degrees” 4. This includes compliance with two degree target andclear objectives, which was not always the case with Copenhagen pledges.
The next main climate conference will be held in Paris in 2015. For Paris, countries areinvited to submit their Intended Nationally Determined Contributions (INDCs). PreviousClimate Conferences (COP19, Warsaw and COP20, Lima) invited all countries tocommunicate their INDCs well in advance of Paris Negotiations (COP21). Countries’ INDCswill be submitted to a public web portal5.
Some countries have already given preliminary indications of their INDCs, but at the time ofwriting this, none have submitted the official version. First INDCs are expected by the end ofMarch 2015 and others during the 2015. UNFCCC will provide a summary report of INDCsby the beginning of November 2015.
The COP20 decision further urges countries to include quantified information, asappropriate, on time frames, scopes, coverages, assumptions and methodologicalapproaches. In practice, countries may give more coherent pledges this time or not. There isstill a clear need for a framework to be able to easily assess the level of ambition of differentpledges.
Additionally, it is essential to quantify what level of global emissions would be reached withthese pledges and is that sufficient for 2 degree targets. If the total emission reductions ofpreliminary Paris pledges are not enough to reach two degree target, there should beinternational negotiations to increase the ambition level. For this process, there is a need tocompare preliminary pledges analytically.
The objective of this study is 1) to create a framework to assess and compare the ambitionof national pledges and 2) to estimate the gap between 2 degree pathways and global GHGmitigation scenarios resulting from pledges.
An analytical approach to achieve these objectives require three basic blocks to build on- a summary of the current scientific understanding of global
emission pathways to two degree target (Chapter 2),- a review of countries’ emissions and pledges (Chapter 3) and- projections of the development of countries’ GHG emissions and
energy systems under different mitigation scenarios (Chapter 4)
Chapter 5 compiles three global GHG mitigation scenarios based on the country levelanalysis and compares the total emissions of these scenarios to 2 degree pathways. Resultsare compared also to emission scenarios from Emission gap 2014 report 6. Chapter 6provides a summary and conclusions.
1 http://unfccc.int/meetings/copenhagen_dec_2009/items/5262.php2 http://unfccc.int/meetings/copenhagen_dec_2009/items/5264.php3 http://unfccc.int/meetings/cop_15/copenhagen_accord/items/5265.php4 http://cancun.unfccc.int/cancun-agreements/main-objectives-of-the-agreements/#c335 http://www4.unfccc.int/submissions/indc/Submission%20Pages/submissions.aspx6 http://www.unep.org/publications/ebooks/emissionsgapreport2014/

RESEARCH REPORT VTT-R-00140-157 (40)

RESEARCH REPORT VTT-R-00140-158 (40)
2. Emission reduction pathways for 2 degree target
The two degree target has its roots in scientific studies from 1970s and 1980s 7, 8. TheEuropean Union proposed two degree target as a policy target at 1996 and further stressedthe importance of this target at 2007 9. United Nations Global Climate Change Conferenceagreed on a two degree target in Copenhagen in 2009:
“To achieve the ultimate objective of the Convention to stabilize greenhouse gasconcentration in the atmosphere at a level that would prevent dangerous anthropogenic
interference with the climate system, we shall, recognizing the scientific view that theincrease in global temperature should be below 2 degrees Celsius, ….” 10
There is a vast amount of scientific literature trying to define the amount of emissionsrequired to overstep or keep within the 2 degree target. The best understanding is compiledto the recent IPCC’s fifth assessment report 11. IPCC’s summary for policy makers provide aneasy-to-read summary of this rather complicated topic 12.
The amount of allowed emissions depends crucially on assumed climate sensitivity, whichdefines how much and how fast a certain amount of emissions will warm the planet. Theclimate sensitivity is uncertain and gives us probabilities to achieve two degree target. In thisreport we use two probability categories:
- over 50% chance (medium chance) to keep the globaltemperature rise below 2 degrees and
- over 66% chance (likely chance) to keep the globaltemperature rise below 2 degrees.
Due to practical reasons, the cumulative emissions of two degree target are ofteninterpreted as global emission reduction pathways. In these pathways, one of the mostcritical assumptions is the start year of mitigation actions. In this report we study
- two emission reduction pathways where mitigation actions start at 2010 and- one late action scenario, which has only limited mitigation actions before 2020.
Additionally, we included one pathway for 1.5 degree target, because the Cancunagreement has a “consideration of a 1.5C goal, on the basis of the best scientific knowledgeavailable” 13. In this emission reduction pathway, the emission reduction measures start at2010 and the pathway has likely chance to achieve 1.5 degree target.
UNEP’s emission gap 2014 report provides updated global emission reduction pathways.Figure 1 presents a summary of emission reduction pathways where mitigation measuresstart from 2010. In 2 degree scenarios, drawn with orange and green color, the global GHGemissions stabilize at 2015 and start decreasing towards 2020. In these scenarios, the globalemissions reach 1990 levels by 2030 and decrease from 20% to 30% below 1990 emissionsby 2050. In 1.5 degree scenario, the amount of emissions decreases rapidly andreaches -25% from 1990 emissions by 2030.
7 http://discovery.ucl.ac.uk/111750/8 http://www.jstor.org/discover/10.2307/1885679?sid=21105632263553&uid=2&uid=3737976&uid=49 http://europa.eu/rapid/press-release_MEMO-07-17_en.htm?locale=en10 http://unfccc.int/resource/docs/2009/cop15/eng/l07.pdf11 http://www.ipcc.ch/report/ar5/12 http://www.ipcc.ch/pdf/assessment-report/ar5/wg3/ipcc_wg3_ar5_summary-for-policymakers.pdf13 http://unfccc.int/key_steps/cancun_agreements/items/6132.php
RESEARCH REPORT VTT-R-00140-159 (40)
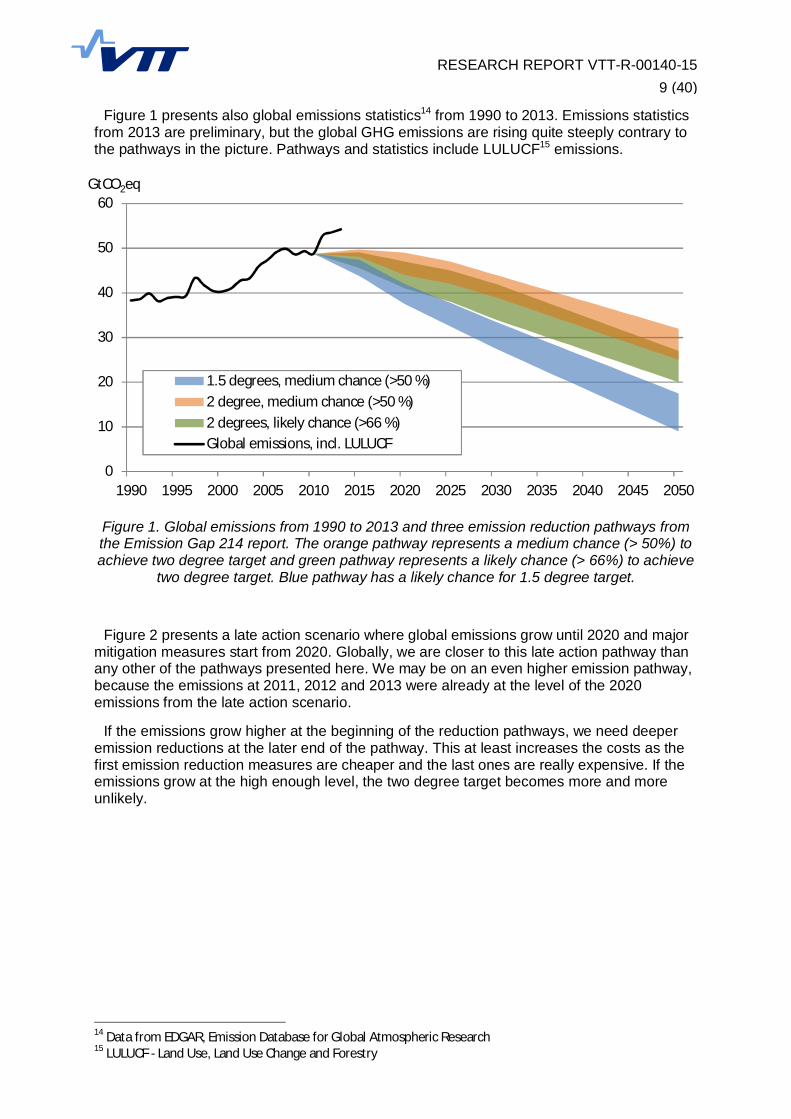
Figure 1 presents also global emissions statistics14 from 1990 to 2013. Emissions statisticsfrom 2013 are preliminary, but the global GHG emissions are rising quite steeply contrary tothe pathways in the picture. Pathways and statistics include LULUCF15 emissions.
Figure 1. Global emissions from 1990 to 2013 and three emission reduction pathways fromthe Emission Gap 214 report. The orange pathway represents a medium chance (> 50%) toachieve two degree target and green pathway represents a likely chance (> 66%) to achieve
two degree target. Blue pathway has a likely chance for 1.5 degree target.
Figure 2 presents a late action scenario where global emissions grow until 2020 and majormitigation measures start from 2020. Globally, we are closer to this late action pathway thanany other of the pathways presented here. We may be on an even higher emission pathway,because the emissions at 2011, 2012 and 2013 were already at the level of the 2020emissions from the late action scenario.
If the emissions grow higher at the beginning of the reduction pathways, we need deeperemission reductions at the later end of the pathway. This at least increases the costs as thefirst emission reduction measures are cheaper and the last ones are really expensive. If theemissions grow at the high enough level, the two degree target becomes more and moreunlikely.
14 Data from EDGAR, Emission Database for Global Atmospheric Research15 LULUCF - Land Use, Land Use Change and Forestry
0
10
20
30
40
50
60
1990 1995 2000 2005 2010 2015 2020 2025 2030 2035 2040 2045 2050
GtCO2eq
1.5 degrees, medium chance (>50 %)2 degree, medium chance (>50 %)2 degrees, likely chance (>66 %)Global emissions, incl. LULUCF

RESEARCH REPORT VTT-R-00140-1510 (40)
Figure 2. Global emissions from 1990 to 2013 and two emission reduction pathways from theEmission Gap 214 report. Green pathway is the same than in previous picture. Red one isotherwise similar to green path, but it has only limited mitigation actions before 2020. This
creates a need for deeper emission reductions in the long term.
0
10
20
30
40
50
60
1990 1995 2000 2005 2010 2015 2020 2025 2030 2035 2040 2045 2050 2055 2060 2065 2070
GtCO2eq
Limited action until 2020 (>66 %)
2 degrees, likely chance (>66 %)
Global emissions, incl. LULUCF

RESEARCH REPORT VTT-R-00140-1511 (40)
3. Global emissions and current pledges
3.1 Global emissions 1990-2010
Table 1 summarizes the GHG emissions of 20 largest countries16 measured by 2010emissions. Table includes also the annual growth rates of emissions and shares of LULUCFemissions. The information is primarily from UNFCCC emission database17, secondarily fromEDGAR database18 and tertiary from FAO land use emission database19.
Table 1. The GHG emissions of 20 largest countries measured by 2010 emissions and GHGemissions of international aviation and maritime.
GHG emissions (GtCO2eq)Annual change LULUCF share
of GHGs (%)1990 2000 2010 '90 - '00 '00 - '10 average '08 - '10
China 3.5 4.7 10.9 +2.9% +8.7% -3%USA 5.4 6.4 5.9 +1.7% -0.8% -16%EU 5.4 4.8 4.4 -1.1% -0.8% -7%India 1.3 1.8 2.6 +3.1% +3.8% -5%Indonesia 1.1 1.4 2.0 +2.0% +3.6% +62%Brazil 1.8 1.9 1.9 +0.9% +0.1% +32%Russia 3.5 1.6 1.7 -7.3% +0.04% -34%Japan 1.2 1.3 1.2 +0.7% -0.6% -6%Congo, Dem. Rep. 1.4 1.0 1.1 -2.8% +0.7% +15%Canada 0.52 0.67 0.78 +2.6% +1.5% +1%Mexico 0.49 0.57 0.66 +1.5% +1.5% +4%South Korea 0.30 0.51 0.65 +5.5% +2.4% -5%Int. Shipping 0.37 0.48 0.61 +2.7% +2.5% -Australia 0.55 0.51 0.57 -0.6% +1.0% +2%Iran 0.28 0.45 0.53 +4.7% +1.7% -1%Central African Rep. 0.25 0.19 0.51 -2.7% +10.4% +3%Saudi Arabia 0.20 0.31 0.50 +4.3% +4.8% 0%Int. Aviation 0.30 0.36 0.47 +1.9% +2.6% -South Africa 0.35 0.39 0.42 +1.3% +0.7% 0%Thailand 0.21 0.28 0.41 +3.1% +3.8% 0%Ukraine 0.87 0.36 0.35 -8.4% -0.4% -6%Turkey 0.14 0.25 0.35 +5.6% +3.4% -18%World total 38 40 50 +0.5% +2.2% +5%
Each country has its unique characteristics and they are hard to group by few simplifyingparameters. For an example, China’s emissions have grown very rapidly since 2000 and ithas been the largest emitting country since 2004. At 2010 China’s emissions were largerthan the USA and EU combined and at 2013 preliminary emission statistics, China’semissions were larger than USA, EU and India combined.
USA has managed to decrease emissions since 2005 and it has large negative emissionsfrom the LULUCF sector. The situation is quite opposite for Indonesia and Brazil which both
16 a country or a group of countries such as the EU.17 http://unfccc.int/di/FlexibleQueries.do18 http://edgar.jrc.ec.europa.eu/19 http://faostat3.fao.org/browse/G2/*/E

RESEARCH REPORT VTT-R-00140-1512 (40)
have growing emissions and large emissions from the LULUCF sector. EU is the only majorcountry which emissions have steadily decreased since 1990.
Twenty largest countries emitted 75% of global emissions at 2010 and 8 largest countriesemitted over 60 % of global emissions in 2010. At 2013, the 8 largest countries wereresponsible already of about 70 % of global emissios.
Emission estimates have relatively large uncertainties in developing countries andespecially in the LULUCF sector, but the trend seems clear. The emissions from the biggestcountries grow relatively faster than from smaller countries.
3.2 Copenhagen pledges for 2020 (and 2050)
In the Kyoto protocol in 1992, developed countries agreed quantified national emissionreduction targets for commitment period from 2008 to 2012. This group of countries has eversince been called ‘Annex I’ countries.
After this, the method of agreeing climate change mitigation targets moved towards anoffering based mechanism where each country may give a promise to mitigate its emissionsby a certain amount. In Copenhagen in 2009 developed countries gave quantified economy-wide emission targets20 and developing countries promised to do Nationally AppropriateMitigation Actions, NAMAs 21. The full list is often referred as a ‘Copenhagen pledges’.Referred documents contain a list of pledges from 62 countries. In total this would be 89countries if EU member states should counted separately.
Table 2 presents Copenhagen pledges from 20 largest countries. The process is notmandatory, but all of the 8 biggest emitters have pledged to reduce their emissions and 14 ofthe 20 biggest emitters have pledged to reduce their emissions.
Smaller part of the pledges are ‘unconditional’ meaning the country will fulfil this promisenevertheless of the global climate policy. Most of the pledges are ‘conditional’ meaning thatcountries will fulfil those only if global climate negotiations advance well enough. Somecountries expect climate funding and some deep enough commitments from other countries.
The content of pledges varies much from a country to another. Pledges were given withfollowing criteria:
- Emission reduction % from year x- Emission reduction % from baseline or business as usual emissions- Reducing the emission intensity of economy (GHG/GDP)- Non-GHG pledges such as reducing deforestation or increasing the forest stock- Other NAMAs
In addition, different pledges cover different emissions. Most pledges are for total GHGs, butsome cover only CO2 from Fossil Fuels and Industry (FF&I) and other exclude LULUCFemissions. The last column of the Table 2 notes if country’s pledge does not coversemissions only partially.
After these, there are difference also in many other aspects. Some pledges allow use ofinternational credits while others don’t. Countries’ pledges may be for a single year or a timeperiod. And finally, to make thing more complicated, pledges are monitored differently. Manydeveloping countries don’t have annual GHG inventories and their emissions are estimatedby international institutes.
20 http://unfccc.int/meetings/copenhagen_dec_2009/items/5264.php21 http://unfccc.int/meetings/cop_15/copenhagen_accord/items/5265.php

RESEARCH REPORT VTT-R-00140-1513 (40)
Table 2. Summary of the Copenhagen pledges for the 20 largest countries (by 2010 GHGemissions). The last row of the table gives additional details on pledges and notes if a pledge
excludes some emission sectors.
2010GHG
emissionsUnconditional
pledge Conditional pledgesDetails on pledgeGtCO2eq 2020 2020 2050
China 10.9 - 4 targets - 1) reduce CO2 intensity(CO2/GDP) -40 % … -45 %compared to 2005.Includes CO2 only fromfossil fuels and industry. 2)Non-fossil share of primaryenergy to 15 %, 3) increaseforest coverage by 40 Mhaand 4) increase forest stockby 1.3 billion m3 from 2005.
USA 5.9 - -17 % -83 % below 2005 emissions. 42%emission reduction by2030.
EU 4.4 -20 % -30 % -80 … -95 % below 1990 emissionsIndia 2.6 - -20 % … - 25% - GHG intensity (GHG/GDP)
below 2005 level, excludingemissions from agricultureand LULUCF
Indonesia 2.0 -26 % -41 % - from BAU. List of NAMAsresulting -26% from BAU.
Brazil 1.9 - -37 % - from BAU. List of NAMAsresulting -37% from BAU.
Russia 1.7 -15 % -25 % -50 % below 1990 emissionsJapan 1.2 -3.8 % - -60 … -80 % below 2005 emissionsCongo, Dem. Rep. 1.1 - - - -Canada 0.73 - -17 % -60%/-70% below 2005 emissionsMexico 0.66 - -30 % -50 % 2020: -30 % from BAU.
2050: -50 % from 2000.
South Korea 0.65 - -30 % - from BAUAustralia 0.63 -5 % -15 % / -25 % -80 % below 2005 emissionsInt. Shipping 0.61 - - - -Iran 0.53 - - - -Central African Rep. 0.51 - - - -Saudi Arabia 0.50 - - - -Int. Aviation 0.47 - - - -South Africa 0.42 -34 % - from BAU excluding
LULUCF. 42% emissionreduction by 2025.
Turkey 0.42 - - - -Thailand 0.41 - - - -Ukraine 0.40 -20 % -50 % below 1990 emissionsWorld total 50

RESEARCH REPORT VTT-R-00140-1514 (40)
3.3 INDCs for Paris 2015
Paris will be the venue for the next big climate change conference22. The aim is to agree ona new international agreement on climate change mitigation. More detailed topics includenew national pledges; adaptation; climate finance; technology development and transfer; andmany other issues.
OECD has written several reports with different aspects to Paris negotiations. Topics rangefor an example from “Establishing and Understanding Post-2020 Climate Change MitigationCommitments 23“ to the different options to account emissions under the UNFCCC24; andfrom scaling up the climate fund25 to tracking and trading of global emission units26. Thesereports serve as a qualitative base for these analyses.
For Paris, countries are invited to submit their Intended Nationally Determined Contributions(INDCs). Previous Climate Conferences (COP19, Warsaw and COP20, Lima) invited allcountries to communicate their INDCs well in advance of Paris Negotiations (COP21).Countries’ INDCs will be submitted to a public web portal27. The COP20 decision furtherurges countries to include quantified information, as appropriate, on time frames, scopes,coverages, assumptions and methodological approaches.
First INDCs are expected by the end of March 2015 and others during the 2015. At the timeof writing, only few countries had given indications of their INDCs, but on the other hand,those few countries are the biggest three emitting countries: China, USA and EU. Table 3presents a summary of the preliminary pledges for the Paris.
Table 3. Summary of the indications of the Independent Nationally DeterminedContributions for the Paris. Official INDCs will be submitted ‘well in advance’ before Paris.
2010GHG
emissionsPreliminarypledge for
Paris Details on pledgeGtCO2eq
China 10.9 2 targets 1) Peak CO2 emissions fromFF&I before 2030 and 2)increase non-fossil share ofTPES to around 20 % by 2030.
USA 5.9 -26% to -28% below 2005 emissions by 2025
EU 4.4 -40 %At least 40% below 1990emissions by 2030
…
World total 50
22 The United Nations Climate Change Conference, COP21 and CMP11, will be held in Paris, France in Decemberin 2015.23 http://www.oecd.org/env/cc/CCXG%20EstablishingandUnderstanding_%20final%20full%20docOct2013.pdf24 http://www.oecd-ilibrary.org/environment-and-sustainable-development/made-to-measure-options-for-emissions-accounting-under-the-unfccc_5jzbb2tp8ptg-en25 http://www.oecd.org/env/cc/Scaling_up_CCXGsentout_May2014_REV.pdf26 http://www.oecd.org/env/cc/49101167.pdf27 http://www4.unfccc.int/submissions/indc/Submission%20Pages/submissions.aspx

RESEARCH REPORT VTT-R-00140-1515 (40)

RESEARCH REPORT VTT-R-00140-1516 (40)
4. Country level analysis
4.1 Structure of the country level analysis
In this chapter we study more closely the eight largest countries and more briefly the rest ofthe world. Each subchapter for each country is made in the same format to maintain thecoherence and to make it easy to compare the country-level results.
On the first page of each sub-chapter, we present country’s GHG statistics, give a summaryof its pledges, report the sources of detailed emission reduction scenarios and compare thecurrent development of the emissions to the country’s pledge at 2020. The second picture onthe first page is calculated the way each country defines its own pledge. For some countriesthis is total GHG emissions and for some this excludes certain emissions sectors, for anexample the LULUCF emissions.
The second page of each country has six pictures. First two present the development ofcountry’s GHG emissions under different GHG mitigation scenarios. The picture on the left iswith the coverage of country’s pledge and the right one is with all GHGs. If the country’spledge is with all GHGs, the picture on right is calculated excluding LULUCF emissions.
The last 4 pictures of each country’s assessment cover various ways which are used toformulate pledges. Top left picture calculates emission intensity (CO2 from Fossil fuels andindustry / GDP), top right picture calculates the GHG emissions per capita, bottom left picturepresents the share of renewable energy sources when information is available and thebottom right picture presents the share of non-fossil fuels when the information is available.There are some country specific exceptions which are listed within the sub-chapter of eachcountry.
RESEARCH REPORT VTT-R-00140-1517 (40)
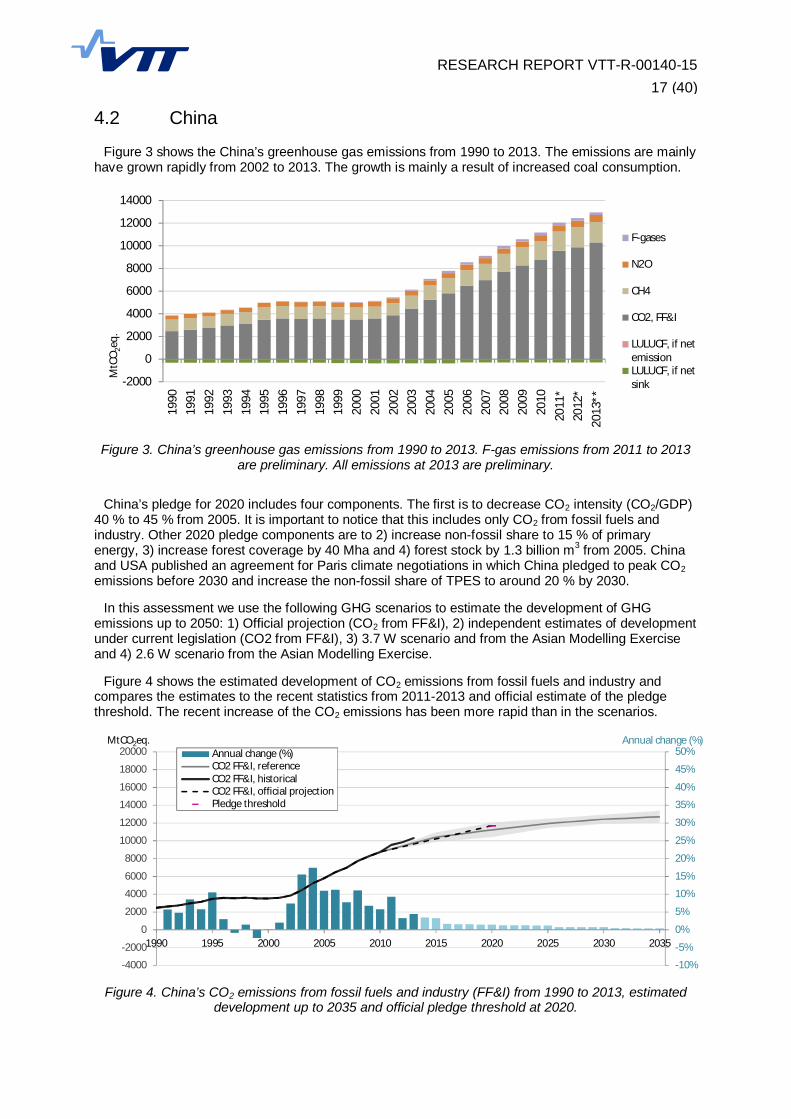
4.2 China
Figure 3 shows the China’s greenhouse gas emissions from 1990 to 2013. The emissions are mainlyhave grown rapidly from 2002 to 2013. The growth is mainly a result of increased coal consumption.
Figure 3. China’s greenhouse gas emissions from 1990 to 2013. F-gas emissions from 2011 to 2013are preliminary. All emissions at 2013 are preliminary.
China’s pledge for 2020 includes four components. The first is to decrease CO2 intensity (CO2/GDP)40 % to 45 % from 2005. It is important to notice that this includes only CO2 from fossil fuels andindustry. Other 2020 pledge components are to 2) increase non-fossil share to 15 % of primaryenergy, 3) increase forest coverage by 40 Mha and 4) forest stock by 1.3 billion m3 from 2005. Chinaand USA published an agreement for Paris climate negotiations in which China pledged to peak CO2emissions before 2030 and increase the non-fossil share of TPES to around 20 % by 2030.
In this assessment we use the following GHG scenarios to estimate the development of GHGemissions up to 2050: 1) Official projection (CO2 from FF&I), 2) independent estimates of developmentunder current legislation (CO2 from FF&I), 3) 3.7 W scenario and from the Asian Modelling Exerciseand 4) 2.6 W scenario from the Asian Modelling Exercise.
Figure 4 shows the estimated development of CO2 emissions from fossil fuels and industry andcompares the estimates to the recent statistics from 2011-2013 and official estimate of the pledgethreshold. The recent increase of the CO2 emissions has been more rapid than in the scenarios.
Figure 4. China’s CO2 emissions from fossil fuels and industry (FF&I) from 1990 to 2013, estimateddevelopment up to 2035 and official pledge threshold at 2020.
-2000
0
2000
4000
6000
8000
10000
12000
14000
1990
1991
1992
1993
1994
1995
1996
1997
1998
1999
2000
2001
2002
2003
2004
2005
2006
2007
2008
2009
2010
2011
*20
12*
2013
**
MtC
O2e
q.
F-gases
N2O
CH4
CO2, FF&I
LULUCF, if netemissionLULUCF, if netsink
-10%
-5%
0%
5%
10%
15%
20%
25%
30%
35%
40%
45%
50%
-4000
-2000
0
2000
4000
6000
8000
10000
12000
14000
16000
18000
20000
1990 1995 2000 2005 2010 2015 2020 2025 2030 2035
Annual change (%)MtCO2eq.Annual change (%)CO2 FF&I, referenceCO2 FF&I, historicalCO2 FF&I, official projectionPledge threshold
RESEARCH REPORT VTT-R-00140-1518 (40)
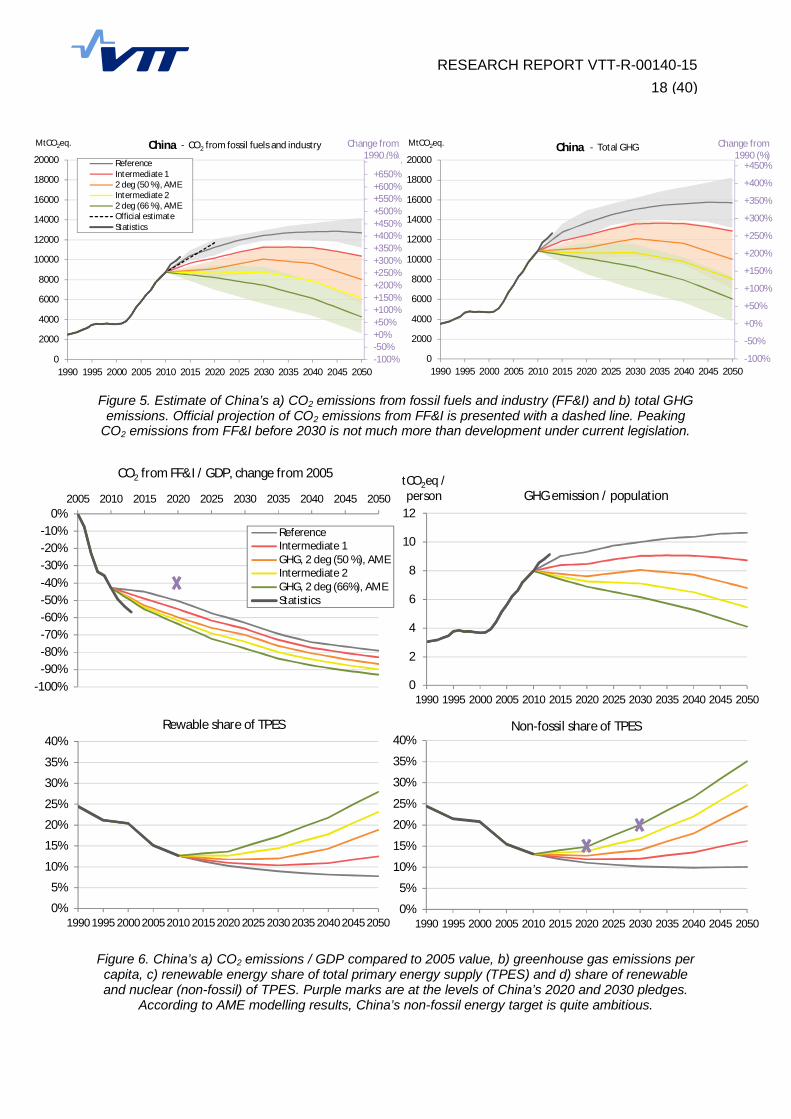
Figure 5. Estimate of China’s a) CO2 emissions from fossil fuels and industry (FF&I) and b) total GHGemissions. Official projection of CO2 emissions from FF&I is presented with a dashed line. Peaking
CO2 emissions from FF&I before 2030 is not much more than development under current legislation.
Figure 6. China’s a) CO2 emissions / GDP compared to 2005 value, b) greenhouse gas emissions percapita, c) renewable energy share of total primary energy supply (TPES) and d) share of renewableand nuclear (non-fossil) of TPES. Purple marks are at the levels of China’s 2020 and 2030 pledges.
According to AME modelling results, China’s non-fossil energy target is quite ambitious.
-100%
-50%
+0%
+50%
+100%
+150%
+200%
+250%
+300%
+350%
+400%
+450%
0
2000
4000
6000
8000
10000
12000
14000
16000
18000
20000
1990 1995 2000 2005 2010 2015 2020 2025 2030 2035 2040 2045 2050
Change from1990 (%)
MtCO2eq. China - Total GHG
-100%-50%+0%+50%+100%+150%+200%+250%+300%+350%+400%+450%+500%+550%+600%+650%+700%
0
2000
4000
6000
8000
10000
12000
14000
16000
18000
20000
1990 1995 2000 2005 2010 2015 2020 2025 2030 2035 2040 2045 2050
Change from1990 (%)
MtCO2eq. ChinaReferenceIntermediate 12 deg (50 %), AMEIntermediate 22 deg (66 %), AMEOfficial estimateStatistics
- CO2 from fossil fuels and industry
0
2
4
6
8
10
12
1990 1995 2000 2005 2010 2015 2020 2025 2030 2035 2040 2045 2050
tCO2eq /person GHG emission / population
-100%-90%-80%-70%-60%-50%-40%-30%-20%-10%
0%2005 2010 2015 2020 2025 2030 2035 2040 2045 2050
CO2 from FF&I / GDP, change from 2005
ReferenceIntermediate 1GHG, 2 deg (50 %), AMEIntermediate 2GHG, 2 deg (66%), AMEStatistics
0%
5%
10%
15%
20%
25%
30%
35%
40%
1990 1995 2000 2005 2010 2015 2020 2025 2030 2035 2040 2045 2050
Rewable share of TPES
0%
5%
10%
15%
20%
25%
30%
35%
40%
1990 1995 2000 2005 2010 2015 2020 2025 2030 2035 2040 2045 2050
Non-fossil share of TPES

RESEARCH REPORT VTT-R-00140-1519 (40)
4.3 United States
Figure 7 shows the USA’s greenhouse gas emissions from 1990 to 2013. The LULUCF sector is arelatively large sink of the emissions at the USA. Emission removals from LULUCF have been from13% to 15% of the total emissions without LULUCF.
Figure 7. USA’s greenhouse gas emissions from 1990 to 2013. Emissions at 2013 are preliminary.
USA’s pledge for 2020 is to reduce total GHG emissions 17% below 2005 emissions. Additionally,the USA pledged to reduce the total GHG emissions 42% by 2030 and 83% by 2050. At the end of the2014, USA and China published an agreement for Paris climate negotiations in which USA pledged toreduce total GHG emissions from 26% to 28% below 2005 emissions by 2025.
In this assessment we use the following GHG scenarios to estimate the development of GHGemissions up to 2050: 1) estimate of development under current legislation, 2) 3.7 W scenario fromthe Asian Modelling Exercise, 3) 2.6 W scenario from the Asian Modelling Exercise and 4) lineartrajectory from 2010 emission to -83 % at 2050.
Figure 8 compares the estimated development of emissions in the WRI current legislation scenarioand USA pledges for 2020 and 2025. Figure includes LULUCF emissions.
Figure 8. USA’s GHG emissions from 1990 to 2013, estimated development up to 2025 under currentlegislation and pledge thresholds at 2020 and 2025. Estimates include LULUCF emissions.
-2000-1000
010002000300040005000600070008000
1990
1991
1992
1993
1994
1995
1996
1997
1998
1999
2000
2001
2002
2003
2004
2005
2006
2007
2008
2009
2010
2011
2012
2013
*
MtC
O2e
q.
F-gases
N2O
CH4
Fossil CO2
LULUCF, if netemissionLULUCF, if netsink
-10%
-5%
0%
5%
10%
15%
20%
25%
30%
35%
40%
45%
50%
-2000
-1000
0
1000
2000
3000
4000
5000
6000
7000
8000
9000
10000
1990 1995 2000 2005 2010 2015 2020 2025
Annual change (%)MtCO2eq.Annual change (%)GHG, referenceGHG, historicalPledge threshold

RESEARCH REPORT VTT-R-00140-1520 (40)
Figure 9. Estimate of USA’s a) GHG emissions excluding LULUCF and b) total GHG emissions from1990 to 2050 in different scenarios. Purple ‘X’s mark USA’s pledges.
Figure 10. USA’s a) CO2 emissions / GDP compared to 2005 value, b) greenhouse gas emissions percapita, c) renewable energy share of total primary energy supply (TPES) and d) share of renewable
and nuclear (non-fossil) of TPES.
-100%-90%-80%-70%-60%-50%-40%-30%-20%-10%+0%+10%+20%
0
1000
2000
3000
4000
5000
6000
7000
8000
1990 1995 2000 2005 2010 2015 2020 2025 2030 2035 2040 2045 2050
Change from2005 (%)
MtCO2eq. USA - Total GHG
-100%
-90%
-80%
-70%
-60%
-50%
-40%
-30%
-20%
-10%
+0%
+10%
0
1000
2000
3000
4000
5000
6000
7000
8000
1990 1995 2000 2005 2010 2015 2020 2025 2030 2035 2040 2045 2050
Change from2005 (%)
MtCO2eq. USA
Reference, WRI2 deg (50 %), AME2 deg (66 %), AMELinear -83%Statistics
- GHG excl. LULUCF
0
5
10
15
20
25
1990 1995 2000 2005 2010 2015 2020 2025 2030 2035 2040 2045 2050
tCO2eq /person GHG emission / population
Reference, WRIGHG, 2 deg (50 %), AMELinear -83%GHG, 2 deg (66%), AMEStatistics
-100%-90%-80%-70%-60%-50%-40%-30%-20%-10%
0%2005 2010 2015 2020 2025 2030 2035 2040 2045 2050
CO2 from FF&I / GDP, change from 2005
0%5%
10%15%20%25%30%35%40%45%50%
1990 1995 2000 2005 2010 2015 2020 2025 2030 2035 2040 2045 2050
Rewable share of TPES
0%5%
10%15%20%25%30%35%40%45%50%
1990 1995 2000 2005 2010 2015 2020 2025 2030 2035 2040 2045 2050
Non-fossil share of TPES
RESEARCH REPORT VTT-R-00140-1521 (40)
4.4 European Union
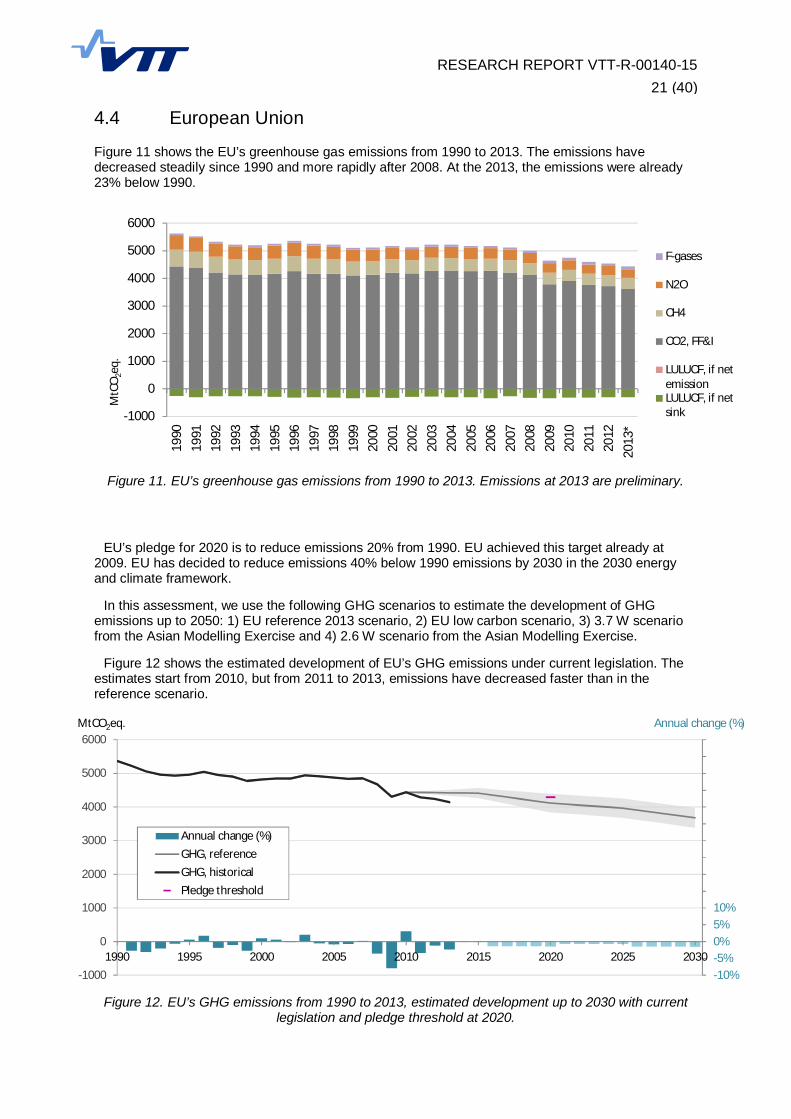
Figure 11 shows the EU’s greenhouse gas emissions from 1990 to 2013. The emissions havedecreased steadily since 1990 and more rapidly after 2008. At the 2013, the emissions were already23% below 1990.
Figure 11. EU’s greenhouse gas emissions from 1990 to 2013. Emissions at 2013 are preliminary.
EU’s pledge for 2020 is to reduce emissions 20% from 1990. EU achieved this target already at2009. EU has decided to reduce emissions 40% below 1990 emissions by 2030 in the 2030 energyand climate framework.
In this assessment, we use the following GHG scenarios to estimate the development of GHGemissions up to 2050: 1) EU reference 2013 scenario, 2) EU low carbon scenario, 3) 3.7 W scenariofrom the Asian Modelling Exercise and 4) 2.6 W scenario from the Asian Modelling Exercise.
Figure 12 shows the estimated development of EU’s GHG emissions under current legislation. Theestimates start from 2010, but from 2011 to 2013, emissions have decreased faster than in thereference scenario.
Figure 12. EU’s GHG emissions from 1990 to 2013, estimated development up to 2030 with currentlegislation and pledge threshold at 2020.
-1000
0
1000
2000
3000
4000
5000
6000
1990
1991
1992
1993
1994
1995
1996
1997
1998
1999
2000
2001
2002
2003
2004
2005
2006
2007
2008
2009
2010
2011
2012
2013
*
MtC
O2e
q.
F-gases
N2O
CH4
CO2, FF&I
LULUCF, if netemissionLULUCF, if netsink
-10%-5%0%5%10%15%20%25%30%35%40%45%50%55%60%
-1000
0
1000
2000
3000
4000
5000
6000
1990 1995 2000 2005 2010 2015 2020 2025 2030
Annual change (%)MtCO2eq.
Annual change (%)GHG, referenceGHG, historicalPledge threshold
RESEARCH REPORT VTT-R-00140-1522 (40)
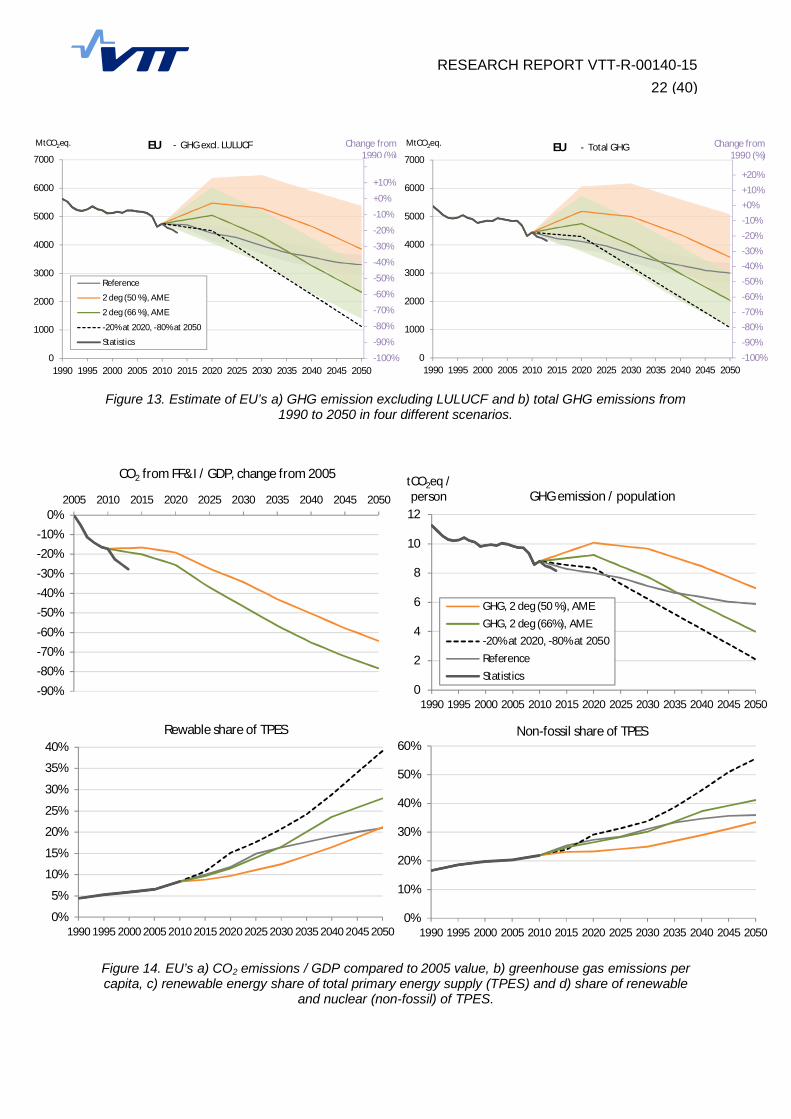
Figure 13. Estimate of EU’s a) GHG emission excluding LULUCF and b) total GHG emissions from1990 to 2050 in four different scenarios.
Figure 14. EU’s a) CO2 emissions / GDP compared to 2005 value, b) greenhouse gas emissions percapita, c) renewable energy share of total primary energy supply (TPES) and d) share of renewable
and nuclear (non-fossil) of TPES.
-100%-90%-80%-70%-60%-50%-40%-30%-20%-10%+0%+10%+20%
0
1000
2000
3000
4000
5000
6000
7000
1990 1995 2000 2005 2010 2015 2020 2025 2030 2035 2040 2045 2050
Change from1990 (%)
MtCO2eq. EU - Total GHG
-100%
-90%
-80%
-70%
-60%
-50%
-40%
-30%
-20%
-10%
+0%
+10%
+20%
0
1000
2000
3000
4000
5000
6000
7000
1990 1995 2000 2005 2010 2015 2020 2025 2030 2035 2040 2045 2050
Change from1990 (%)
MtCO2eq. EU
Reference
2 deg (50 %), AME
2 deg (66 %), AME
-20% at 2020, -80% at 2050
Statistics
- GHG excl. LULUCF
0
2
4
6
8
10
12
1990 1995 2000 2005 2010 2015 2020 2025 2030 2035 2040 2045 2050
tCO2eq /person GHG emission / population
GHG, 2 deg (50 %), AMEGHG, 2 deg (66%), AME-20% at 2020, -80% at 2050ReferenceStatistics
-90%-80%-70%-60%-50%-40%-30%-20%-10%
0%2005 2010 2015 2020 2025 2030 2035 2040 2045 2050
CO2 from FF&I / GDP, change from 2005
0%
5%
10%
15%
20%
25%
30%
35%
40%
1990 1995 2000 2005 2010 2015 2020 2025 2030 2035 2040 2045 2050
Rewable share of TPES
0%
10%
20%
30%
40%
50%
60%
1990 1995 2000 2005 2010 2015 2020 2025 2030 2035 2040 2045 2050
Non-fossil share of TPES

RESEARCH REPORT VTT-R-00140-1523 (40)
4.5 India
Figure 15 shows the India’s greenhouse gas emissions from 1990 to 2013. The total emissions aregrowing rapidly, about 4.5 % annually from 2000 to 2013.
Figure 15. India’s greenhouse gas emissions from 1990 to 2013. F-gas emissions from 2011 t o2013are preliminary. All emissions from 2013 are preliminary.
India’s pledge for 2020 is to reduce its greenhouse gas intensity 20% to 25% compared to 2005value. India defines greenhouse gas intensity as greenhouse gas emissions excluding agriculture andLULUCF and compares the remaining emissions to GDP.
In this assessment we use the following GHG scenarios to estimate the development of GHGemissions up to 2050: 1) Official projection of GHG emission development up to 2020 extrapolatedwith data from Asian Modelling Exercise (AME), 2) 3.7 W scenario from the AME and 4) 2.6 Wscenario from the AME.
Figure 16 compares the estimated development of emissions and the estimated pledge at 2020.India’s emissions are projected to increase steadily and remain below the emission level resulting fromthe pledge. The recent increase of emissions has been slower than estimated.
Figure 16. India’s GHG emissions from 1990 to 2013, estimated development up to 2025 undercurrent legislation and pledge threshold at 2020. Estimates exclude emissions from agriculture and
LULUCF.
-500
0
500
1000
1500
2000
2500
3000
3500
1990
1991
1992
1993
1994
1995
1996
1997
1998
1999
2000
2001
2002
2003
2004
2005
2006
2007
2008
2009
2010
2011
*20
12*
2013
**
MtC
O2e
q.
F-gases
N2O
CH4
CO2, FF&I
LULUCF, if netemissionLULUCF, if netsink
-10%-5%0%5%10%15%20%25%30%35%40%45%50%55%60%
-1000
1000
3000
5000
1990 1995 2000 2005 2010 2015 2020
Annual change (%)MtCO2eq.Annual change (%)ReferenceGHG excl agriculture and LULUCFPledge threshold

RESEARCH REPORT VTT-R-00140-1524 (40)
Figure 17. Estimate of India’s a) GHG emissions excluding agriculture and LULUCF and b) total GHGemissions from 1990 to 2050 in different scenarios. The reference is an official estimate up to 2020
and after that the trend is extrapolated with AME data. Compared to 1990 emissions, India’semissions may increase significantly.
Figure 18. India’s a) GHG emissions excluding agriculture and LULUCF per GDP compared to 2005value, b) greenhouse gas emissions per capita, c) renewable energy share of total primary energy
supply (TPES) and d) share of renewable and nuclear (non-fossil) of TPES. Purple X marks the India’spledge for 2020. India seems to be on track to meet its current pledge.
-100%+0%+100%+200%+300%+400%+500%+600%+700%+800%+900%+1000%+1100%+1200%+1300%+1400%
0
1000
2000
3000
4000
5000
6000
7000
8000
1990 1995 2000 2005 2010 2015 2020 2025 2030 2035 2040 2045 2050
Change from1990 (%)
MtCO2eq. India - Total GHG
-100%
+0%
+100%
+200%
+300%
+400%
+500%
+600%
+700%
+800%
+900%
+1000%
+1100%
0
1000
2000
3000
4000
5000
6000
7000
8000
1990 1995 2000 2005 2010 2015 2020 2025 2030 2035 2040 2045 2050
Change from1990 (%)
MtCO2eq. IndiaReferenceIntermediate 12 deg (50 %), AMEIntermediate 22 deg (66 %), AMEStatistics
- GHG excl. agriculture and LULUCF
0
1
1
2
2
3
3
4
4
1990 1995 2000 2005 2010 2015 2020 2025 2030 2035 2040 2045 2050
tCO2eq /person GHG emission / population
0%5%
10%15%20%25%30%35%40%45%50%
1990 1995 2000 2005 2010 2015 2020 2025 2030 2035 2040 2045 2050
Rewable share of TPES
0%5%
10%15%20%25%30%35%40%45%50%
1990 1995 2000 2005 2010 2015 2020 2025 2030 2035 2040 2045 2050
Non-fossil share of TPES
-100%-90%-80%-70%-60%-50%-40%-30%-20%-10%
0%2005 2010 2015 2020 2025 2030 2035 2040 2045 2050
GHG excl agric. and LULUCF / GDP, change from 2005
ReferenceIntermediate 1GHG, 2 deg (50 %), AMEIntermediate 2GHG, 2 deg (66%), AMEStatistics

RESEARCH REPORT VTT-R-00140-1525 (40)
4.6 Indonesia
Figure 19 shows the Indonesia’s greenhouse gas emissions from 1990 to 2013. Majority of emissionsarise from LULUCF sector. The amount of LULUCF emissions have been increasing since 1990, butthe annual amount vary much from year to year.
Figure 19. Indonesia’s greenhouse gas emissions from 1990 to 2013. F-gas emissions from 2011 to2013 are preliminary. All emissions at 2013 are preliminary.
Indonesia pledged to reduce GHG emissions unconditionally 26% below business as usual (BAU)development by 2020 and conditionally 41% by 2020. The official estimate is that this would equaltotal emissions of 2185 MtCO2eq at 2020. Estimates include LULUCF.
In this assessment we use the following GHG scenarios to estimate the development of GHGemissions up to 2050: 1) Development under current legislation (reference scenario) based onestimates from UNEP emission gap 2014 and Asian Modelling Exercise (AME), 2) 3.7 W scenariofrom the AME and 4) 2.6 W scenario from the AME. In each scenario, we assume that LULUCFemissions stay at the 2010 levels.
Figure 20 compares the estimated development of emissions to 2020 pledge threshold. Estimateddevelopment has large uncertainties due to annual fluctuations and policy assumptions.
Figure 20. Indonesia’s GHG emissions from 1990 to 2013, estimated development up to 2025 undercurrent legislation and pledge threshold at 2020. Estimates include LULUCF emissions.
0
500
1000
1500
2000
2500
3000
1990
1991
1992
1993
1994
1995
1996
1997
1998
1999
2000
2001
2002
2003
2004
2005
2006
2007
2008
2009
2010
2011
*20
12*
2013
**MtC
O2e
q.
F-gases
N2O
CH4
CO2, FF&I
LULUCF, if netemissionLULUCF, if netsink
-20%-15%-10%-5%0%5%10%15%20%25%30%35%40%45%50%55%60%65%70%75%80%
-1000
-500
0
500
1000
1500
2000
2500
3000
3500
4000
1990 1995 2000 2005 2010 2015 2020 2025 2030 2035
Annual change (%)MtCO2eq. Annual change (%)GHG, referenceGHG, historicalPledge threshold

RESEARCH REPORT VTT-R-00140-1526 (40)
Figure 21. Estimate of Indonesia’s a) GHG emissions excluding LULUCF and b) total GHG emissionsfrom 1990 to 2050 in different scenarios.LULUCF emissions are estimated to remain at current levels.
Figure 22. Indonesia’s a) CO2 emissions / GDP compared to 2005 value, b) greenhouse gasemissions per capita, c) renewable energy share of total primary energy supply (TPES) and d) share
of renewable and nuclear (non-fossil) of TPES.
-100%
-50%
+0%
+50%
+100%
+150%
+200%
+250%
0
500
1000
1500
2000
2500
3000
3500
4000
1990 1995 2000 2005 2010 2015 2020 2025 2030 2035 2040 2045 2050
Change from1990 (%)
MtCO2eq. Indonesia - Total GHG
-100%-50%+0%+50%+100%+150%+200%+250%+300%+350%+400%+450%+500%+550%+600%+650%+700%
0
500
1000
1500
2000
2500
3000
3500
4000
1990 1995 2000 2005 2010 2015 2020 2025 2030 2035 2040 2045 2050
Change from1990 (%)
MtCO2eq. Indonesia
Reference2 deg (50 %), AME2 deg (66 %), AMEStatistics
- GHG excl LULUCF
0
2
4
6
8
10
12
14
1990 1995 2000 2005 2010 2015 2020 2025 2030 2035 2040 2045 2050
tCO2eq /person GHG emission / population
ReferenceGHG, 2 deg (50 %), AMEGHG, 2 deg (66%), AMEStatistics
-110%
-90%
-70%
-50%
-30%
-10%
10%2005 2010 2015 2020 2025 2030 2035 2040 2045 2050
CO2 from FF&I / GDP, change from 2005
0%5%
10%15%20%25%30%35%40%45%50%
1990 1995 2000 2005 2010 2015 2020 2025 2030 2035 2040 2045 2050
Rewable share of TPES
0%5%
10%15%20%25%30%35%40%45%50%
1990 1995 2000 2005 2010 2015 2020 2025 2030 2035 2040 2045 2050
Non-fossil share of TPES

RESEARCH REPORT VTT-R-00140-1527 (40)
4.7 Brazil
Figure 23 shows the Brazil’s greenhouse gas emissions from 1990 to 2013. Also in the Brazil, majorityof emissions come from the LULUCF sector. Brazil has managed to reduce the LULUCF emissions,but the amount of other emissions has been increasing steadily.
Figure 23. Brazil’s greenhouse gas emissions from 1990 to 2013. F-gas emissions from 2011 to 2013are preliminary. All emissions at 2013 are preliminary.
Brazil pledged to reduce GHG emissions 37% below business as usual (BAU) development by 2020.The official estimate is that this would equal total emissions of 2070 MtCO2eq at 2020. Estimatesinclude LULUCF.
In this assessment we use the following GHG scenarios to estimate the development of GHGemissions up to 2050: 1) Reference scenario based on estimates from UNEP emission gap 2014 andAsian Modelling Exercise (AME), 2) 3.7 W scenario from the AME and 4) 2.6 W scenario from theAME. In each scenario the LULUCF emissions were assumed to stay at 2010 levels.
Figure 24 compares the estimated development of emissions in the reference scenario to theestimated pledge threshold for 2020. The current estimate is that emissions would be about at thelevel of the pledge, but the estimate of the development of the LULUCF emissions required update.
Figure 24. Brazil’s GHG emissions from 1990 to 2013, estimated development up to 2025 undercurrent legislation and pledge threshold at 2020. Estimates include LULUCF emissions.
0
500
1000
1500
2000
2500
1990
1991
1992
1993
1994
1995
1996
1997
1998
1999
2000
2001
2002
2003
2004
2005
2006
2007
2008
2009
2010
2011
*20
12*
2013
**
MtC
O2e
q.
F-gases
N2O
CH4
CO2, FF&I
LULUCF, if netemissionLULUCF, if netsink
-15%
-10%
-5%
0%
5%
10%
15%
20%
25%
30%
35%
40%
45%
-1000
-500
0
500
1000
1500
2000
2500
3000
1990 1995 2000 2005 2010 2015 2020 2025
Annual change (%)MtCO2eq.
Annual change (%)GHG, referenceGHG, historicalPledge threshold

RESEARCH REPORT VTT-R-00140-1528 (40)
Figure 25. Estimate of Brazil’s a) GHG emissions excluding LULUCF and b) total GHG emissions from1990 to 2050 in different scenarios.
Figure 26. Brazil’s a) CO2 emissions / GDP compared to 2005 value, b) greenhouse gas emissionsper capita, c) renewable energy share of total primary energy supply (TPES) and d) share of
renewable and nuclear (non-fossil) of TPES.
-100%-90%-80%-70%-60%-50%-40%-30%-20%-10%+0%+10%+20%+30%+40%+50%+60%+70%
0
500
1000
1500
2000
2500
3000
1990 1995 2000 2005 2010 2015 2020 2025 2030 2035 2040 2045 2050
Change from1990 (%)
MtCO2eq. Brazil - Total GHG
-100%
-50%
+0%
+50%
+100%
+150%
+200%
+250%
+300%
0
500
1000
1500
2000
2500
3000
1990 1995 2000 2005 2010 2015 2020 2025 2030 2035 2040 2045 2050
Change from1990 (%)
MtCO2eq. Brazil
Reference2 deg (50 %), AME2 deg (66 %), AMEStatistics
- GHG excl LULUCF
0
2
4
6
8
10
12
14
1990 1995 2000 2005 2010 2015 2020 2025 2030 2035 2040 2045 2050
tCO2eq /person GHG emission / population
-100%-90%-80%-70%-60%-50%-40%-30%-20%-10%
0%2005 2010 2015 2020 2025 2030 2035 2040 2045 2050
CO2 from FF&I / GDP, change from 2005
ReferenceGHG, 2 deg (50 %), AMEGHG, 2 deg (66%), AMEStatistics
0%5%
10%15%20%25%30%35%40%45%50%
1990 1995 2000 2005 2010 2015 2020 2025 2030 2035 2040 2045 2050
Rewable share of TPES
0%5%
10%15%20%25%30%35%40%45%50%
1990 1995 2000 2005 2010 2015 2020 2025 2030 2035 2040 2045 2050
Non-fossil share of TPES

RESEARCH REPORT VTT-R-00140-1529 (40)
4.8 Russia
Figure 27 shows the Russia’s greenhouse gas emissions from 1990 to 2013. Russia’s emissionsdecreased sharply at the beginning of 1990s after the collapse of the Soviet Union. This also reducedthe amount of forest used in industry and currently, the Russia’s forest stock is growing rapidly.
Figure 27. Russia’s greenhouse gas emissions from 1990 to 2013. Emissions at 2013 are preliminary.
Russia’s pledge for 2020 is to unconditionally reduce GHG emissions 15% below 1990 emissionsand conditionally 25% below 1990 emissions. Russia’s Copenhagen pledge includes conditionalemission reduction of 50% below 1990 emissions by 2050. In February 2014, Russia started an actionplan to establish measures to reduce emissions 75% below 1990 level by 2050.
In this assessment we use the following GHG scenarios to estimate the development of GHGemissions up to 2050: 1) April 2014 study of GHG development under current legislation (reference)28,2) Scenario for CO2 from the same study and 3) linear trajectory to -75% compared to 1990 by 2050.
Figure 28 compares the pledge and estimated development of emissions under current legislation.Russia’s emissions are likely to increase slightly, but not reach the pledge threshold for 2020.
Figure 28. Russia’s GHG emissions from 1990 to 2013, estimated development up to 2025 undercurrent legislation and pledge threshold at 2020. Estimates include LULUCF emissions.
28 Russia’s Greenhouse Gas Target 2020 - Projections, Trends, and Risks; http://library.fes.de/pdf-files/id-moe/10632.pdf
-1000-500
0500
1000150020002500300035004000
1990
1991
1992
1993
1994
1995
1996
1997
1998
1999
2000
2001
2002
2003
2004
2005
2006
2007
2008
2009
2010
2011
2012
2013
*
MtC
O2e
q.
F-gases
N2O
CH4
CO2, FF&I
LULUCF, if netemissionLULUCF, if netsink
-20%
-15%
-10%
-5%
0%
5%
10%
15%
20%
25%
30%
-2000
-1500
-1000
-500
0
500
1000
1500
2000
2500
3000
1990 1995 2000 2005 2010 2015 2020 2025
Annual change (%)MtCO2eq.
Annual change (%)GHG, referenceGHG, historicalPledge threshold
RESEARCH REPORT VTT-R-00140-1530 (40)
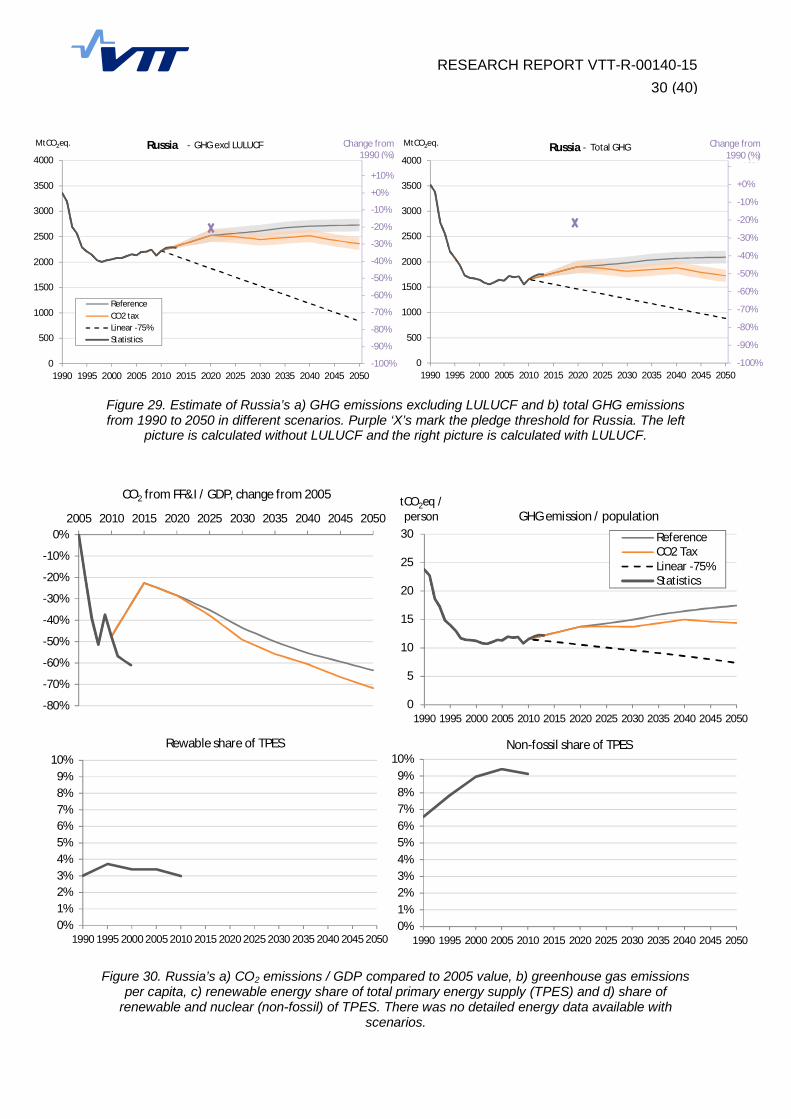
Figure 29. Estimate of Russia’s a) GHG emissions excluding LULUCF and b) total GHG emissionsfrom 1990 to 2050 in different scenarios. Purple ‘X’s mark the pledge threshold for Russia. The left
picture is calculated without LULUCF and the right picture is calculated with LULUCF.
Figure 30. Russia’s a) CO2 emissions / GDP compared to 2005 value, b) greenhouse gas emissionsper capita, c) renewable energy share of total primary energy supply (TPES) and d) share of
renewable and nuclear (non-fossil) of TPES. There was no detailed energy data available withscenarios.
-100%
-90%
-80%
-70%
-60%
-50%
-40%
-30%
-20%
-10%
+0%
+10%
0
500
1000
1500
2000
2500
3000
3500
4000
1990 1995 2000 2005 2010 2015 2020 2025 2030 2035 2040 2045 2050
Change from1990 (%)
MtCO2eq. Russia - Total GHG
-100%
-90%
-80%
-70%
-60%
-50%
-40%
-30%
-20%
-10%
+0%
+10%
0
500
1000
1500
2000
2500
3000
3500
4000
1990 1995 2000 2005 2010 2015 2020 2025 2030 2035 2040 2045 2050
Change from1990 (%)
MtCO2eq. Russia
ReferenceCO2 taxLinear -75%Statistics
- GHG excl LULUCF
0
5
10
15
20
25
30
1990 1995 2000 2005 2010 2015 2020 2025 2030 2035 2040 2045 2050
tCO2eq /person GHG emission / population
ReferenceCO2 TaxLinear -75%Statistics
-80%
-70%
-60%
-50%
-40%
-30%
-20%
-10%
0%2005 2010 2015 2020 2025 2030 2035 2040 2045 2050
CO2 from FF&I / GDP, change from 2005
0%1%2%3%4%5%6%7%8%9%
10%
1990 1995 2000 2005 2010 2015 2020 2025 2030 2035 2040 2045 2050
Rewable share of TPES
0%1%2%3%4%5%6%7%8%9%
10%
1990 1995 2000 2005 2010 2015 2020 2025 2030 2035 2040 2045 2050
Non-fossil share of TPES

RESEARCH REPORT VTT-R-00140-1531 (40)
4.9 Japan
Figure 31 shows the Japan’s greenhouse gas emissions from 1990 to 2013. The share of CO2-emissions is higher than in other countries studied here. Japan’s emissions have grown from since2009, which is two years prior Fukushima accident.
Figure 31. Japan’s greenhouse gas emissions from 1990 to 2013. Emissions at 2013 are preliminary.
Japan updated its pledge after the Fukushima accident to reduce emissions 3.8% below 2005emissions by 2020. Japan may review its pledge second time following further review of energy policy.In the original Copenhagen pledge, Japan pledged to reduce emissions 60% to 80% below 2005emissions by 2050.
In this assessment we use the following GHG scenarios to estimate the development of GHGemissions up to 2050: 1) reference scenario from Emission Gap 2014 report and Asian ModellingExercise (AME), 2) 3.7 W scenario from the AME and 4) 2.6 W scenario from the AME. Figure 32compares the estimated development of emissions and Japan’s revised pledge.
Figure 32. Japan’s GHG emissions from 1990 to 2013, estimated development up to 2025 undercurrent legislation and revised pledge threshold at 2020. Estimates include LULUCF emissions.
-200
0
200
400
600
800
1000
1200
1400
1600
1990
1991
1992
1993
1994
1995
1996
1997
1998
1999
2000
2001
2002
2003
2004
2005
2006
2007
2008
2009
2010
2011
2012
2013
*
MtC
O2e
q.
F-gases
N2O
CH4
CO2, FF&I
LULUCF, if netemissionLULUCF, if netsink
-10%
-5%
0%
5%
10%
15%
20%
25%
30%
35%
40%
-500
-250
0
250
500
750
1000
1250
1500
1750
2000
1990 1995 2000 2005 2010 2015 2020 2025
Annual change (%)MtCO2eq. Annual change (%)GHG, referenceGHG, historicalPledge threshold

RESEARCH REPORT VTT-R-00140-1532 (40)
Figure 33. Estimate of Japan’s a) GHG emissions excluding LULUCF and b) total GHG emissionsfrom 1990 to 2050 in different scenarios.
Figure 34. Japan’s a) CO2 emissions / GDP compared to 2005 value, b) greenhouse gas emissionsper capita and c) renewable energy share of total primary energy supply (TPES).
-100%-90%-80%-70%-60%-50%-40%-30%-20%-10%+0%+10%+20%+30%+40%+50%
0
200
400
600
800
1000
1200
1400
1600
1800
2000
1990 1995 2000 2005 2010 2015 2020 2025 2030 2035 2040 2045 2050
Change from2005 (%)
MtCO2eq. Japan - Total GHG
-100%-90%-80%-70%-60%-50%-40%-30%-20%-10%+0%+10%+20%+30%+40%
0
200
400
600
800
1000
1200
1400
1600
1800
2000
1990 1995 2000 2005 2010 2015 2020 2025 2030 2035 2040 2045 2050
Change from2005 (%)
MtCO2eq. Japan
Reference2 deg (50 %), AME2 deg (66 %), AMELinear -80%Statistics
- GHG excl LULUCF
0%
5%
10%
15%
20%
25%
30%
1990 1995 2000 2005 2010 2015 2020 2025 2030 2035 2040 2045 2050
Rewable share of TPES
0
2
4
6
8
10
12
1990 1995 2000 2005 2010 2015 2020 2025 2030 2035 2040 2045 2050
tCO2eq /person
GHG emission / population
Reference
Linear -80%
GHG, 2 deg (50 %), AME
GHG, 2 deg (66%), AME
Statistics
-90%-80%-70%-60%-50%-40%-30%-20%-10%
0%10%
2005 2010 2015 2020 2025 2030 2035 2040 2045 2050
CO2 from FF&I / GDP, change from 2005
RESEARCH REPORT VTT-R-00140-1533 (40)
4.10 Rest of the World
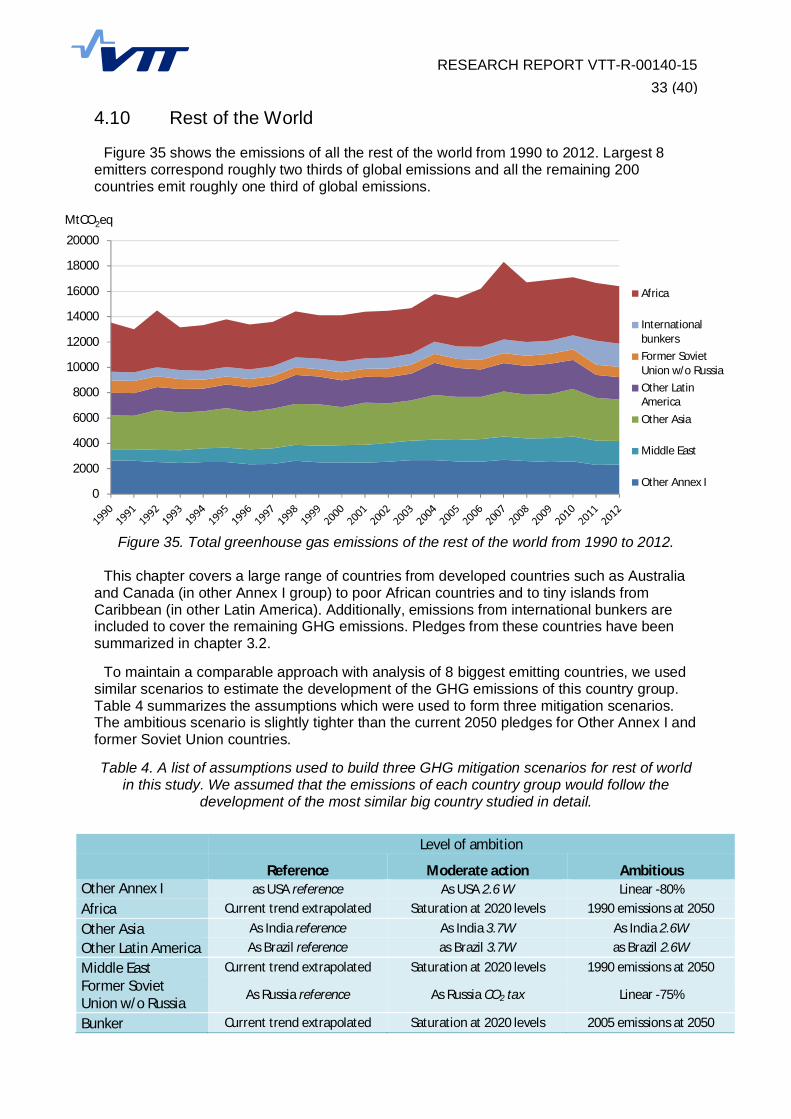
Figure 35 shows the emissions of all the rest of the world from 1990 to 2012. Largest 8emitters correspond roughly two thirds of global emissions and all the remaining 200countries emit roughly one third of global emissions.
Figure 35. Total greenhouse gas emissions of the rest of the world from 1990 to 2012.
This chapter covers a large range of countries from developed countries such as Australiaand Canada (in other Annex I group) to poor African countries and to tiny islands fromCaribbean (in other Latin America). Additionally, emissions from international bunkers areincluded to cover the remaining GHG emissions. Pledges from these countries have beensummarized in chapter 3.2.
To maintain a comparable approach with analysis of 8 biggest emitting countries, we usedsimilar scenarios to estimate the development of the GHG emissions of this country group.Table 4 summarizes the assumptions which were used to form three mitigation scenarios.The ambitious scenario is slightly tighter than the current 2050 pledges for Other Annex I andformer Soviet Union countries.
Table 4. A list of assumptions used to build three GHG mitigation scenarios for rest of worldin this study. We assumed that the emissions of each country group would follow the
development of the most similar big country studied in detail.
Level of ambition
Reference Moderate action AmbitiousOther Annex I as USA reference As USA 2.6 W Linear -80%Africa Current trend extrapolated Saturation at 2020 levels 1990 emissions at 2050Other Asia As India reference As India 3.7W As India 2.6WOther Latin America As Brazil reference as Brazil 3.7W as Brazil 2.6WMiddle East Current trend extrapolated Saturation at 2020 levels 1990 emissions at 2050Former SovietUnion w/o Russia As Russia reference As Russia CO2 tax Linear -75%
Bunker Current trend extrapolated Saturation at 2020 levels 2005 emissions at 2050
0
2000
4000
6000
8000
10000
12000
14000
16000
18000
20000
MtCO2eq
Africa
InternationalbunkersFormer SovietUnion w/o RussiaOther LatinAmericaOther Asia
Middle East
Other Annex I
RESEARCH REPORT VTT-R-00140-1534 (40)
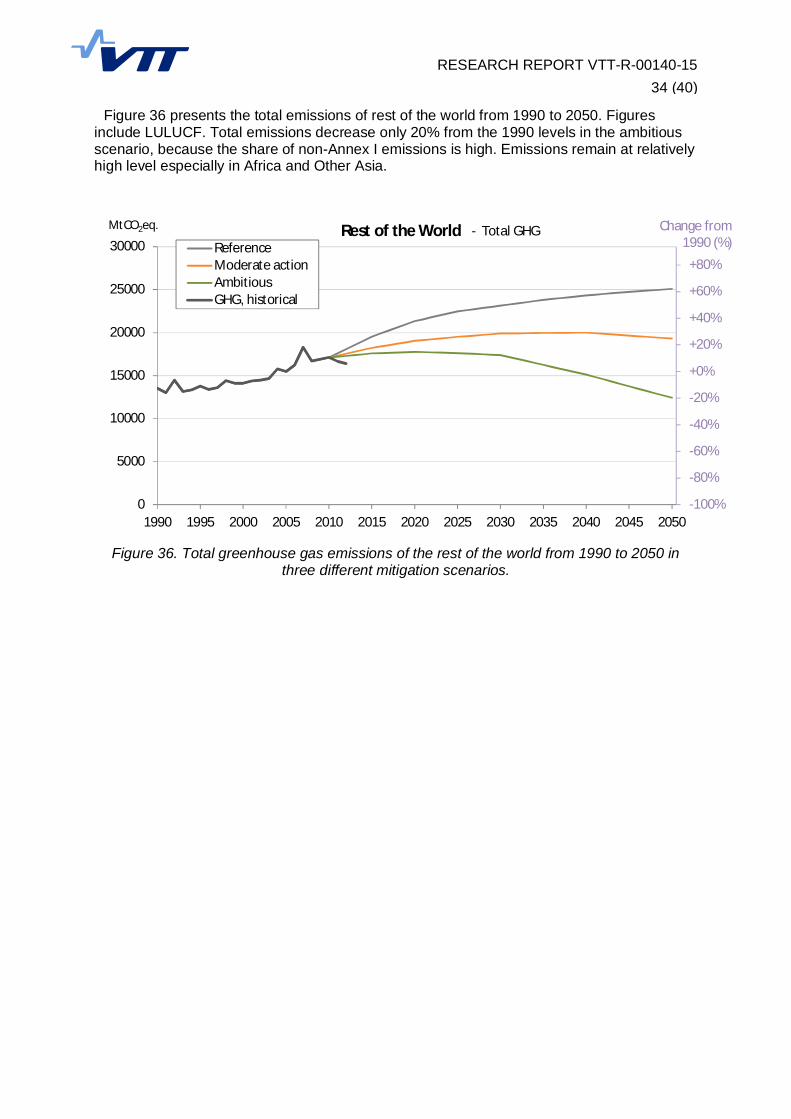
Figure 36 presents the total emissions of rest of the world from 1990 to 2050. Figuresinclude LULUCF. Total emissions decrease only 20% from the 1990 levels in the ambitiousscenario, because the share of non-Annex I emissions is high. Emissions remain at relativelyhigh level especially in Africa and Other Asia.
Figure 36. Total greenhouse gas emissions of the rest of the world from 1990 to 2050 inthree different mitigation scenarios.
-100%
-80%
-60%
-40%
-20%
+0%
+20%
+40%
+60%
+80%
0
5000
10000
15000
20000
25000
30000
1990 1995 2000 2005 2010 2015 2020 2025 2030 2035 2040 2045 2050
Change from1990 (%)
MtCO2eq. Rest of the WorldReferenceModerate actionAmbitiousGHG, historical
- Total GHG

RESEARCH REPORT VTT-R-00140-1535 (40)
5. Comparing the mitigation scenarios and 2 degree pathways
Table 5 presents three global GHG mitigation scenarios based on the country-levelassessments in previous chapter. The first scenario is a reference scenario which projectshow emissions could develop with current legislation and level of ambition. The secondscenario consists of moderate action at country level. The last scenario is ambitious scenariowhere most countries do more than their current pledges for 2020, 2030 and 2050 are.
Table 5. A list of chosen sub-scenarios chosen to build three global GHG mitigationscenarios.
Level of ambition
Reference Moderate action AmbitiousChina Reference 3.7W 2.6W
USA Reference 2.6W Linear -80%
EU Reference Reference up to 2030,2.6W from '30 to '50 1) Linear -83%
India Reference 3.7W 2.6W
Russia Reference CO2 tax Linear -75%
Indonesia Reference 3.7W 2) 2.6W 2)
Brazil Reference 3.7W 2) 2.6W 2)
Japan Reference 2.6W Linear -80%
Other Annex I as USA reference As USA 2.6 W Linear -80%
Africa Current trend extrapolated Saturation at 2020 levels 1990 emissions at 2050
Other Asia As India reference As India 3.7W As India 2.6W
Other LatinAmerica
As Brazil reference as Brazil 3.7W as Brazil 2.6W
Middle East Current trend extrapolated Saturation at 2020 levels 1990 emissions at 2050
Former SovietUnion w/o Russia
As Russia reference As Russia CO2 tax Linear -75%
Intl. bunkers Current trend extrapolated Saturation at 2020 levels 2005 emissions at 2050
1) EU reference scenario has lower emissions than any other EU mitigation scenario at 2020. EU referencehas lower emissions than AME 2.6W scenario until 2030. Chosen combination is stricter than either ofthe scenarios.
2) LULUCF emissions are assumed to remain at 2010 level both in Brazil and Indonesia.
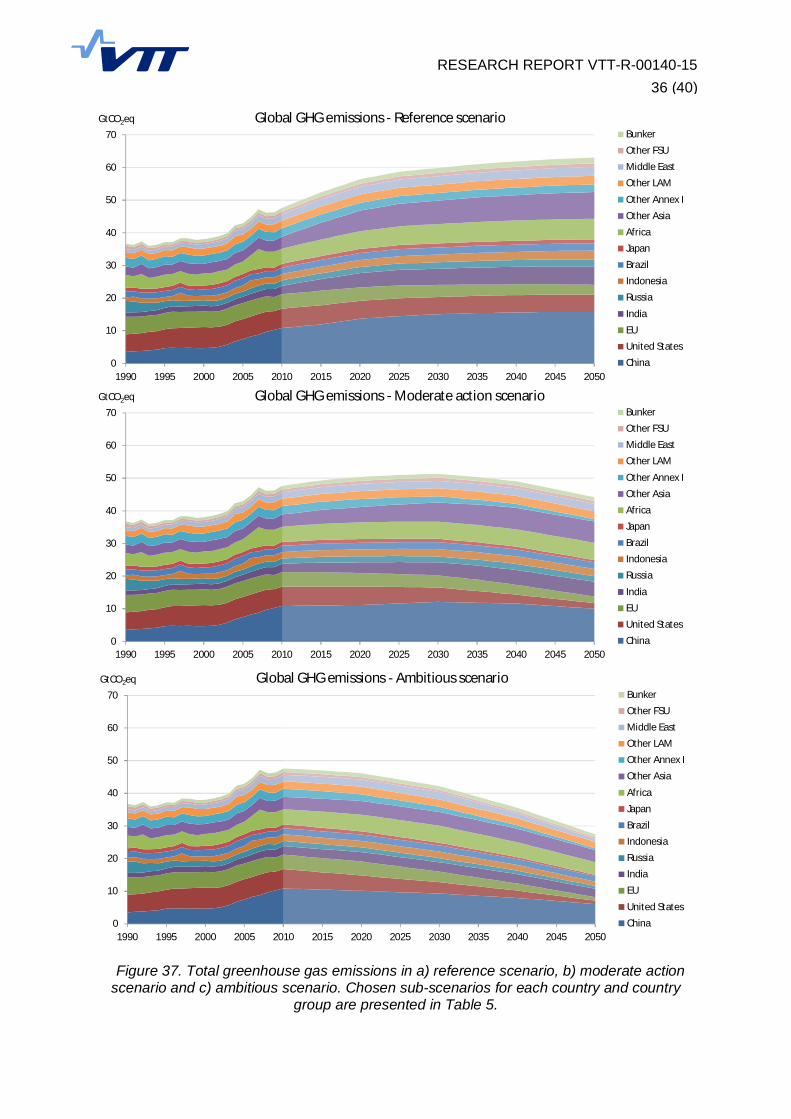
Figure 37 has one emission graph for each scenario. Emissions are presented from 1990 to2050 for each country group. Up to 2010 emissions are statistics and from 2010 to 2050presented emission levels are based on projections.
Figure 38 compares the 2 degree pathways from chapter 2 to total GHG emissions fromthese three scenarios and to ‘Current Pledges’ scenario from Emission Gap 2014 report.Emission Gap report’s Current pledges scenario is in between of this report’s reference andModerate action. The ambitious scenario would have a medium chance to achieve twodegree target, but the emission levels from 2011 to 2013 are much above the required level.
Figure 39 compares the same scenarios to late action pathway to two degree target. In thisscenario, there’s only limited action before 2020 and effective climate reduction targets from2020 to 2050. This scenario is roughly at the level of ‘Moderate action’ and ‘Current pledges’until 2020. Recent emission development and reference scenario are at much higher level.
RESEARCH REPORT VTT-R-00140-1536 (40)
Figure 37. Total greenhouse gas emissions in a) reference scenario, b) moderate actionscenario and c) ambitious scenario. Chosen sub-scenarios for each country and country
group are presented in Table 5.
0
10
20
30
40
50
60
70
1990 1995 2000 2005 2010 2015 2020 2025 2030 2035 2040 2045 2050
GtCO2eq Global GHG emissions - Ambitious scenarioBunker
Other FSU
Middle East
Other LAM
Other Annex I
Other Asia
Africa
Japan
Brazil
Indonesia
Russia
India
EU
United States
China
0
10
20
30
40
50
60
70
1990 1995 2000 2005 2010 2015 2020 2025 2030 2035 2040 2045 2050
GtCO2eq Global GHG emissions - Moderate action scenarioBunker
Other FSU
Middle East
Other LAM
Other Annex I
Other Asia
Africa
Japan
Brazil
Indonesia
Russia
India
EU
United States
China
0
10
20
30
40
50
60
70
1990 1995 2000 2005 2010 2015 2020 2025 2030 2035 2040 2045 2050
GtCO2eq Global GHG emissions - Reference scenarioBunker
Other FSU
Middle East
Other LAM
Other Annex I
Other Asia
Africa
Japan
Brazil
Indonesia
Russia
India
EU
United States
China

RESEARCH REPORT VTT-R-00140-1537 (40)
Figure 38. Four mitigation scenarios for global GHG emissions compared to emissionreduction pathways for 2 degree target. GHG scenarios start from 2010 and statistics reach
up to 2013. 2013 emissions are preliminary.
Figure 39. Four mitigation scenarios for global GHG emissions compared to late actionemission reduction pathway and medium chance pathway for 2 degree target. GHG
scenarios start from 2010 and statistics reach up to 2013. 2013 emissions are preliminary.
0
10
20
30
40
50
60
70
1990 1995 2000 2005 2010 2015 2020 2025 2030 2035 2040 2045 2050
GtCO2eq Global GHG emissions
1.5 degrees, medium chance (>50 %)2 degree, medium chance (>50 %)2 degrees, likely chance (>66 %)ReferenceCurrent pledges [Emission gap 2014]Moderate actionAmbitiousGlobal emissions, incl. LULUCF
0
10
20
30
40
50
60
70
1990 1995 2000 2005 2010 2015 2020 2025 2030 2035 2040 2045 2050
GtCO2eq Global GHG emissions
Limited action until 2020 (>66 %)2 degree, medium chance (>50 %)ReferenceCurrent pledges [Emission gap 2014]Moderate actionAmbitiousGlobal emissions, incl. LULUCF

RESEARCH REPORT VTT-R-00140-1538 (40)
6. Summary and conclusions
Paris 2015The main international agreements to reduce global GHG emissions and mitigate the
climate change have been the Kyoto Protocol from 1992, Copenhagen Accord from 2009and the Cancun Agreement from 2010. The next major climate change agreement is themain target of the climate change negotiations in the Paris in December 2015.
Intended Nationally Determined Contributions (INDCs)In the Kyoto protocol, 38 countries agreed to adopt quantified economy-wide emission
targets. Developing countries did not have quantified targets in the Kyoto protocol. In theCopenhagen Accord and Cancun Agreement, both developed and developing countriespledged to reduce emissions or do other corresponding mitigation actions such as reducedeforestation. In total 90 countries gave pledges.
Copenhagen pledges were hard to compare as they didn’t have uniform structure, countriesdidn’t originally submit all the necessary information to interpret the pledges and the pledgescover different emission sectors. During the following years, most of these details weresorted out and the estimate was that the Copenhagen pledges were not sufficient to achieve2 degree target. UNEP publishes annually an update of emission gap between currentdevelopment of emissions, pledges and 2 degree target emission reduction pathways.
On the road to the Paris climate negotiations, this process is slightly adjusted based onlessons learned. This time, countries should submit their INDCs ‘well in advance’. Countriesare also urged to submit quantified information on necessary details. China, USA and EUhave already given preliminary indications on their INDCs. The first official INDCs areexpected before the end of March 2015. UNFCCC will publish all submitted INDCs on anINDC portal and compile a summary report of submissions by the November 2015.
Framework to compare pledgesThis report gives a summary of Copenhagen pledges and already published preliminary
pledges for Paris. It analyses GHG mitigation scenarios at country-level and gives aframework to compare preliminary pledges for Paris.
Table 6. Summary of pledges and quantification of pledges of 8 biggest GHG emittingcountries
2010GHG
emissionsDetails of pledges and indicative INDCs
Included GHGs
Pledge quantified(compared to
2005 GHGemissions) 1)
GtCO2eq 2020 2030China 10.9 1) Reduce CO2 intensity (CO2/GDP) -40 % …
-45 % compared to 2005. Includes CO2 onlyfrom fossil fuels and industry. 2) Non-fossilshare of primary energy to 15 %, 3)increase forest coverage by 40 Mha and 4)increase forest stock by 1.3 billion m3 from2005.
1st target: CO2
from FF&I. Targets2 to 4 are nonGHG targets
+96% 2)
USA 5.9 Conditional: -17% from 2005 emissions by2020, -26% to -28% by 2025, -42 % by2030 and -80% by 2050.
all GHG -17% -26%… -28%
EU 4.4 Unconditional: -20% from 1990 emissionsby 2020, -40% by 2030. Conditional: -80%by 2050.
all GHG -12% -34%

RESEARCH REPORT VTT-R-00140-1539 (40)
2010GHG
emissionsDetails of pledges and indicative INDCs
Included GHGs
Pledge quantified(compared to
2005 GHGemissions) 1)
GtCO2eq 2020 2030India 2.6 Conditional: decrease GHG intensity
(GHG/GDP) from 20% to 25% below 2005level
all GHG excludingagriculture and
LULUCF
+99% -
Indonesia 2.0 Unconditional: NAMAs resulting -26% fromBAU. Conditional: -41% from BAU by 2020.
all GHG +22% -
Brazil 1.9 Conditional: NAMAs resulting -37% fromBAU by 2020.
all GHG -11% -
Russia 1.7 Unconditional: -15% from 1990 emissionsby 2020. Conditional: -25% by 2020 and -50% by 2050.
-15 % +84% -
Japan 1.2 Unconditional: pledge revised to 3.8%below 2005 emissions by 2020.
all GHG -4% -
World total 50
1) This compares the total GHG emissions of 2005 to estimated pledge threshold of 2020 including all GHGs.2) China’s preliminary 2030 pledge has two targets. The first is to stop the growth of CO2 emissions from
FF&I. This is close to reference level and would result to high GHG emissions. The second target is toincrease the share of non-fossil energy sources up to 20 % of TPES. According to model analysis, this ismuch more ambitious target. The combined effect of these two is not yet analyzed.
Country-level assessments are presented in detail in chapter 4 with as identical structure toeach other as possible. Each analysis consists of emission statistics, at least three emissionscenarios up to 2050 and pre-calculated pledge thresholds from presented scenarios. Thecurrent 2020 pledges and preliminary 2030 pledges are compared to the results from GHGmitigation scenarios. This framework should be clear and easy enough to assess also futurepledges and compare their ambition levels.
Compatibility with 2 degree targetFigure 40 compares four global GHG mitigation scenarios from chapter 5 to the two degree
emission reduction pathways from chapter 2. The reference scenario projects thedevelopment of the emissions under current legislation and ambition level. In the referencescenario, the emissions keep growing and veer far off from the two degree target pathways.
The second scenario is Moderate action scenario which roughly follows the late actionmitigation pathway until 2020. Late action pathway has only limited action until 2020 andrelatively fast emission reductions between 2020 and 2030. Ambitious scenario remains atthe level of medium chance two degree pathway from 2010 to 2050. With these globalemission reductions, we should have medium (> 50%) chance to achieve two degree target.
Emission Gap 2014 report has updated ‘Current Pledges’ scenario which estimates thesituation if all conditional pledges would be adopted. This falls in the between of Referenceand Moderate action Scenarios.

RESEARCH REPORT VTT-R-00140-1540 (40)
Figure 40. Four global GHG mitigation scenarios compared to late action emissionreduction pathway and medium chance pathway for 2 degree target. GHG scenarios start
from 2010 and statistics reach up to 2013. 2013 emissions are preliminary.
Unfortunately, the preliminary emissions statistics from 2011 to 2013 have increased tohigher level than in any of these scenarios. The statistics reach up to 2013, but scenariosstart from the 2010 statistics. This approach makes pictures slightly more confusing, butgives very valuable additional information about the recent progress.
If we don’t manage to curb the rising emissions, we have to do deeper and more expensiveemission reductions closer to 2050.
0
10
20
30
40
50
60
70
1990 1995 2000 2005 2010 2015 2020 2025 2030 2035 2040 2045 2050
GtCO2eq Global GHG emissions
Limited action until 2020 (>66 %)2 degree, medium chance (>50 %)ReferenceCurrent pledges [Emission gap 2014]Moderate actionAmbitiousGlobal emissions, incl. LULUCF


