
SANDIA REPORTSAND2001-3050Unlimited ReleasePrinted October 2001
Energy Efficient Catalytic Reaction andProduction of Cumene
Russell L. Jarek, Steven M. Thornberg, Stacia Barrow, Daniel E. Trudell, andTina M. Nenoff
Prepared bySandia National LaboratoriesAlbuquerque, New Mexico 87185 and Livermore, California 94550
Sandia is a multiprogram laboratory operated by SandiaCorporation,a Lockheed Martin Company, for the United States Department ofEnergy under Contract DE-AC04-94AL85000.
Approved for public release; further dissemination unlimited.
Issued by Sandia National Laboratories, operated for the United States Departmentof Energy by Sandia Corporation.
NOTICE: This report was prepared as an account of work sponsored by an agency ofthe United States Government. Neither the United States Government, nor anyagency thereof, nor any of their employees, nor any of their contractors, subcontractors,or their employees, make any warranty, express or implied, or assume any legalliability or responsibility for the accuracy, completeness, or usefulness of anyinformation, apparatus, product, or process disclosed, or represent that its use wouldnot infringe privately owned rights. Reference herein to any specific commercialproduct, process, or service by trade name, trademark, manufacturer, or otherwise,does not necessarily constitute or imply its endorsement, recommendation, or favoringby the United States Government, any agency thereof, or any of their contractors orsubcontractors. The views and opinions expressed herein do not necessarily state orreflect those of the United States Government, any agency thereof, or any of theircontractors.
Printed in the United States of America. This report has been reproduced directly fromthe best available copy.
Available to DOE and DOE contractors fromU.S. Department of EnergyOffice of Scientific and Technical InformationP.O. Box 62Oak Ridge, TN 37831
Telephone: (865)576-8401Facsimile: (865)576-5728E-Mail: [email protected] ordering: http://www.doe.gov/bridge
Available to the public fromU.S. Department of CommerceNational Technical Information Service5285 Port Royal RdSpringfield, VA 22161
Telephone: (800)553-6847Facsimile: (703)605-6900E-Mail: [email protected] order: http://www.ntis.gov/ordering.htm
- - 3
SAND2001-3050 Unlimited Release
Printed October 2001
Energy Efficient Catalytic Reaction and Production of Cumene
Russell L Jarek and Steven M. Thornberg
Information Discovery, Extraction, and Analysis Stacia Barrow, Daniel E. Trudell and Tina M. Nenoff
Environmental Monitoring and Characterization Sandia National Laboratories
P.O. Box 5800 Albuquerque, NM 87185
Abstract
Alkylation reactions of benzene with propylene using zeolites were studied for their affinity for cumene production. The current process for the production of cumene involves heating corrosive acid catalysts, cooling, transporting, and distillation. This study focused on the reaction of products in a static one-pot vessel using non-corrosive zeolite catalysts, working towards a more efficient one-step process with a potentially large energy savings. A series of experiments were conducted to find the best reaction conditions yielding the highest production of cumene. The experiments looked at cumene formation amounts in two different reaction vessels that had different physical traits. Different zeolites, temperatures, mixing speeds, and amounts of reactants were also investigated to find their affects on the amount of cumene produced. Quantitative analysis of product mixture was performed by gas chromatography. Mass spectroscopy was also utilized to observe the gas phase components during the alkylation process.
- - 4
Contents
Abstract.......................................................................................................................................................................3
Contents......................................................................................................................................................................4
List of Figures............................................................................................................................................................5
Introduction................................................................................................................................................................6
Experimental..............................................................................................................................................................6
Materials and Equipment...............................................................................................................6
Procedures.....................................................................................................................................8
Results.........................................................................................................................................................................9
Discussion...............................................................................................................................................................16
Conclusion...............................................................................................................................................................17
References...............................................................................................................................................................18
Appendix.................................................................................................................................................................17
- - 5
List of Figures
Figure 1. “T” Reactor Schematic..............................................................................................7
Figure 2. Picture of the Parr pot reactor....................................................................................7
Figure 3. Picture of the pot reactor assembly. ..........................................................................8
Figure 4. Comparison of the efficiency of the pot reactor with the “T” reactor.....................10
Figure 5. Results from two separate pot reactor experiments running the H-form of ββββ-zeolite (25:1) in a 7:1 (benzene:propylene) molar ratio. .......................................11
Figure 6. Results from two separate pot reactor experiments running the H-form of ββββ-zeolite (75:1) in a 7:1 (benzene:propylene) and 20:1 molar ratios........................12
Figure 7. Results from pot reactor experiments running the H-form of ββββ-zeolite (300:1) in a 7:1 (benzene:propylene) molar ratio. .................................................................12
Figure 8. Results from two separate pot reactor experiments running the H-Zeolite-Y (4:1) in a 7:1 (benzene:propylene) molar ratio. ........................................................13
Figure 9. Analog mass spectrum from the pot reactor with benzene and residual air............14
Figure 10. Pressure vs. time plot illustrating the conversion of benzene and propylene into cumene...............................................................................................................15
Figure 11. Analog mass spectra taken at 30 and 60 minutes from a 150ºC reaction of H+-form β-zeolite (25:1) in the pot reactor ...............................................................16
- - 6
Introduction
Production of cumene is a major petrochemical product used as feedstock for production of phenol and acetone.1 Most of the current cumene plant production processes utilize a patented supported phosphoric acid catalyst,2 with a few using a Friedel-Crafts reaction with aluminum trichloride.3 Both of these processes generate problems with corrosion and contamination, providing an impetus for the recent exploration of recyclable zeolite catalysts.
The usage of large-pore zeolites for the alkylation of benzene has become preferred, as it does not form significant quantities of n-propyl benzene as the medium-pore zeolites do. The first catalytic alkylation experiments over β-Zeolite, a large-pore zeolite, utilized isopropanol,4 whereas later experiments began utilizing propene.5,6 Optimization of the zeolites and their acidities, as well as experimental conditions of the reaction, are still being done to most effectively produce cumene.
The current study compares different reactants and their efficiency for producing cumene. Four different zeolites [β-Zeolite (300:1[Si:Al ratio]), β-Zeolite (25:1), H-Zeolite-Y (4:1), H-Zeolite-Y (30:1)] were studied with many different experimental conditions. Variable conditions included different concentrations of propylene (14.5% and 33.3% in N2), different mixing rates, and different reaction vessels (“T” reactor and pot reactor) resulting in 21 experiments (see Appendix 1). The experiments carried out in this study are meant to direct the transformation of the current process for producing cumene. This investigation’s particular interest is in finding the most efficient combination of hydrocarbon mixtures and catalysts in order to develop an energy efficient method of producing cumene. At this point, results are presented, though some questions remain to be worked out regarding reproducibility, and discussed regarding optimization of cumene production. The study is part of a larger Sandia investigation into optimized catalytic reactions and separations.7–9
Experimental
Mater ials and Equipment
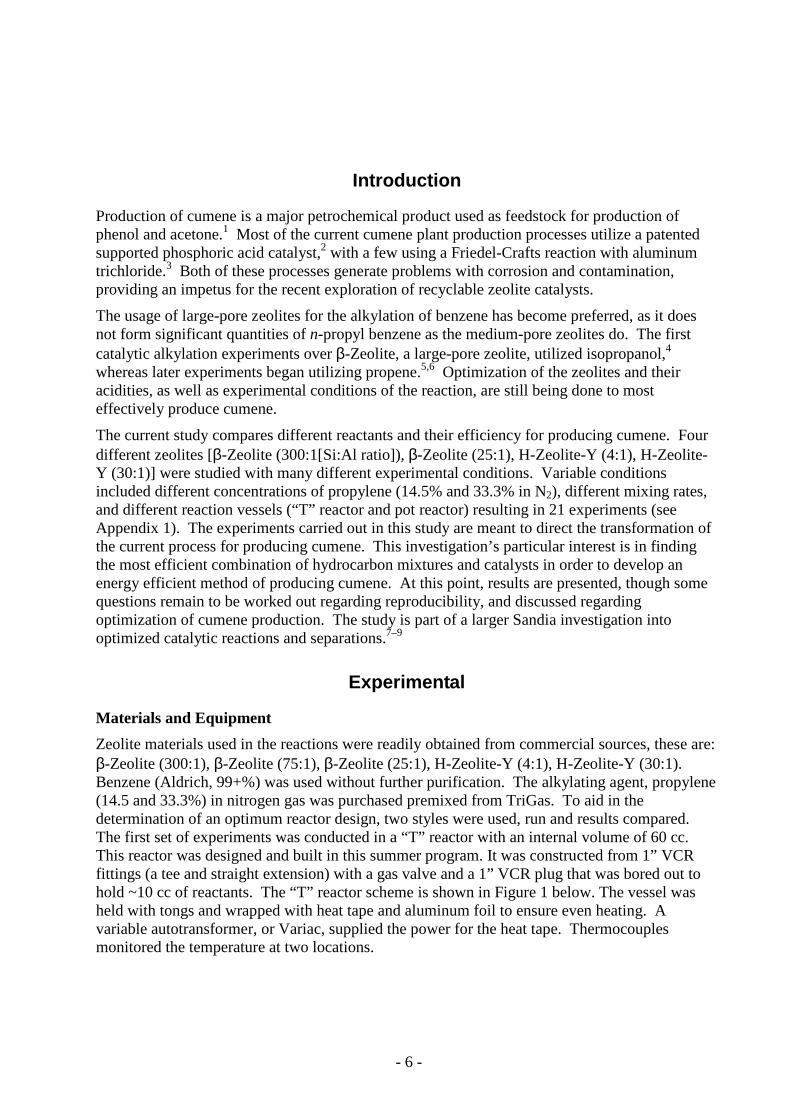
Zeolite materials used in the reactions were readily obtained from commercial sources, these are: β-Zeolite (300:1), β-Zeolite (75:1), β-Zeolite (25:1), H-Zeolite-Y (4:1), H-Zeolite-Y (30:1). Benzene (Aldrich, 99+%) was used without further purification. The alkylating agent, propylene (14.5 and 33.3%) in nitrogen gas was purchased premixed from TriGas. To aid in the determination of an optimum reactor design, two styles were used, run and results compared. The first set of experiments was conducted in a “T” reactor with an internal volume of 60 cc. This reactor was designed and built in this summer program. It was constructed from 1” VCR fittings (a tee and straight extension) with a gas valve and a 1” VCR plug that was bored out to hold ~10 cc of reactants. The “T” reactor scheme is shown in Figure 1 below. The vessel was held with tongs and wrapped with heat tape and aluminum foil to ensure even heating. A variable autotransformer, or Variac, supplied the power for the heat tape. Thermocouples monitored the temperature at two locations.
- - 7
–1” VCR Cap
–1” VCR Tee
–1” VCR Coupling
–1” VCR Bored Plug
Figure 1. “T” Reactor Schematic.
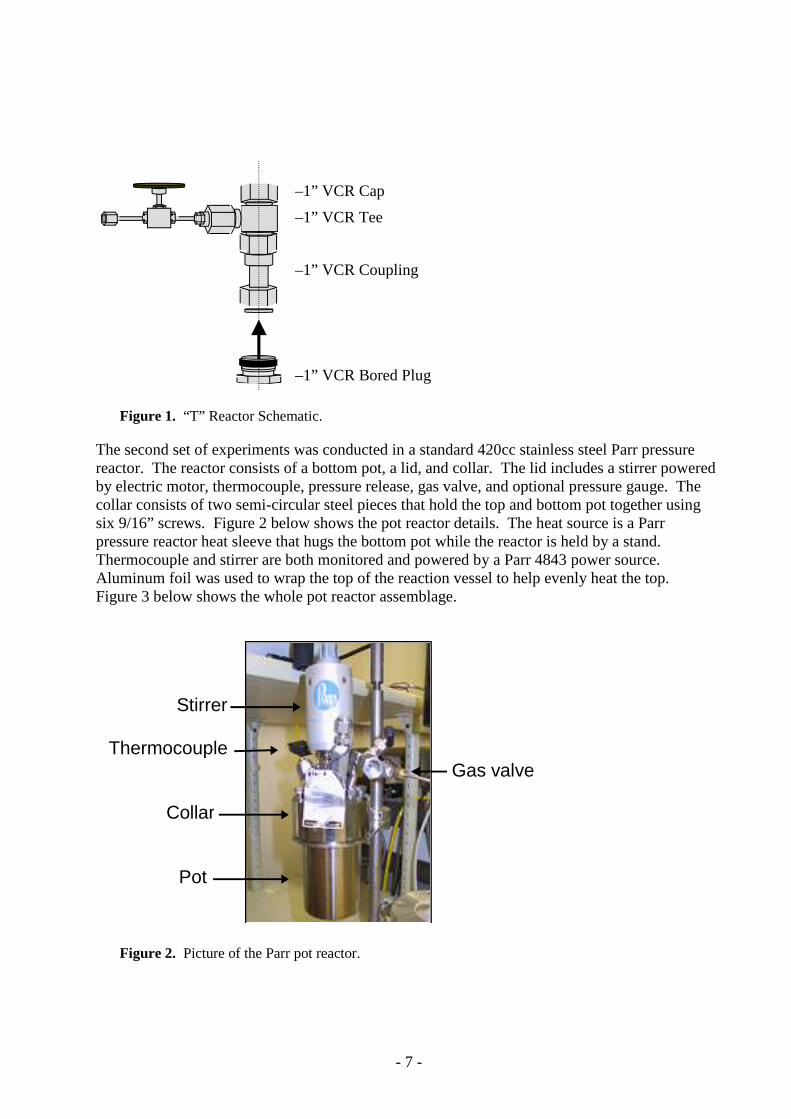
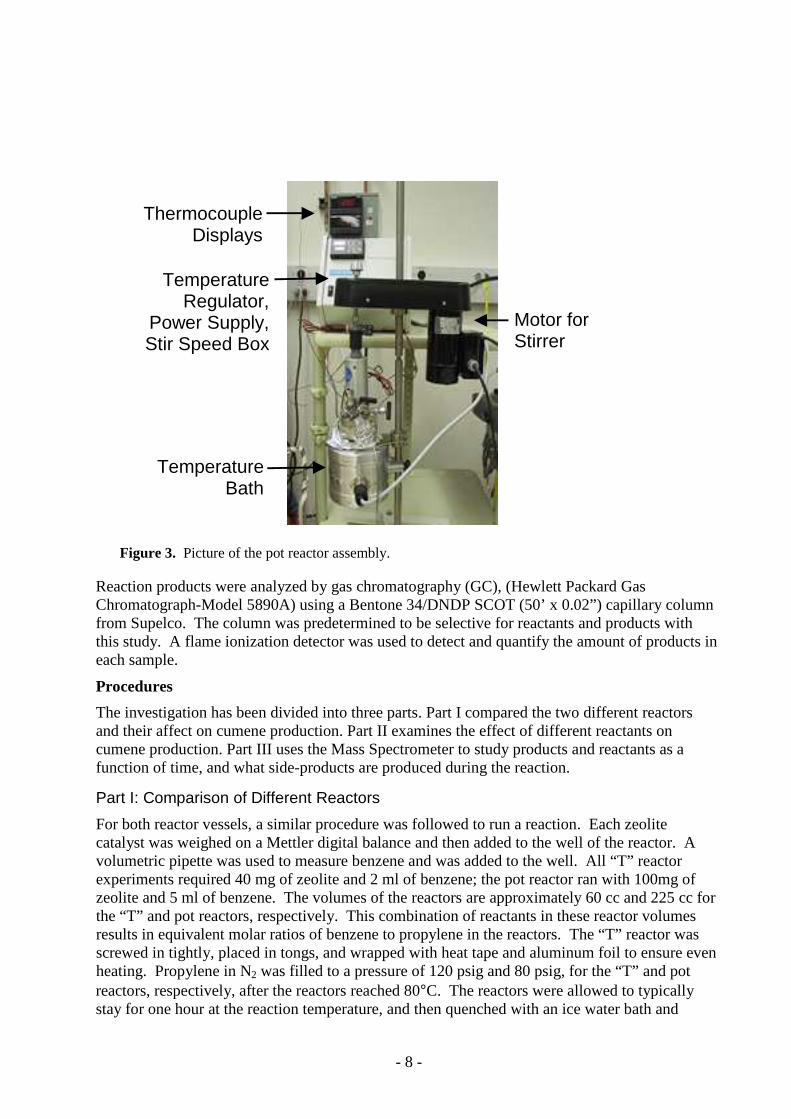
The second set of experiments was conducted in a standard 420cc stainless steel Parr pressure reactor. The reactor consists of a bottom pot, a lid, and collar. The lid includes a stirrer powered by electric motor, thermocouple, pressure release, gas valve, and optional pressure gauge. The collar consists of two semi-circular steel pieces that hold the top and bottom pot together using six 9/16” screws. Figure 2 below shows the pot reactor details. The heat source is a Parr pressure reactor heat sleeve that hugs the bottom pot while the reactor is held by a stand. Thermocouple and stirrer are both monitored and powered by a Parr 4843 power source. Aluminum foil was used to wrap the top of the reaction vessel to help evenly heat the top. Figure 3 below shows the whole pot reactor assemblage.
Figure 2. Picture of the Parr pot reactor.
Gas valve
Stirrer
Thermocouple
Collar
Pot
- - 8
Figure 3. Picture of the pot reactor assembly.
Reaction products were analyzed by gas chromatography (GC), (Hewlett Packard Gas Chromatograph-Model 5890A) using a Bentone 34/DNDP SCOT (50’ x 0.02”) capillary column from Supelco. The column was predetermined to be selective for reactants and products with this study. A flame ionization detector was used to detect and quantify the amount of products in each sample.
Procedures
The investigation has been divided into three parts. Part I compared the two different reactors and their affect on cumene production. Part II examines the effect of different reactants on cumene production. Part III uses the Mass Spectrometer to study products and reactants as a function of time, and what side-products are produced during the reaction.
Part I: Comparison of Different Reactors
For both reactor vessels, a similar procedure was followed to run a reaction. Each zeolite catalyst was weighed on a Mettler digital balance and then added to the well of the reactor. A volumetric pipette was used to measure benzene and was added to the well. All “T” reactor experiments required 40 mg of zeolite and 2 ml of benzene; the pot reactor ran with 100mg of zeolite and 5 ml of benzene. The volumes of the reactors are approximately 60 cc and 225 cc for the “T” and pot reactors, respectively. This combination of reactants in these reactor volumes results in equivalent molar ratios of benzene to propylene in the reactors. The “T” reactor was screwed in tightly, placed in tongs, and wrapped with heat tape and aluminum foil to ensure even heating. Propylene in N2 was filled to a pressure of 120 psig and 80 psig, for the “T” and pot reactors, respectively, after the reactors reached 80°C. The reactors were allowed to typically stay for one hour at the reaction temperature, and then quenched with an ice water bath and
Motor for Stirrer
Temperature Bath
ThermocoupleDisplays
Temperature Regulator,
Power Supply, Stir Speed Box
- - 9
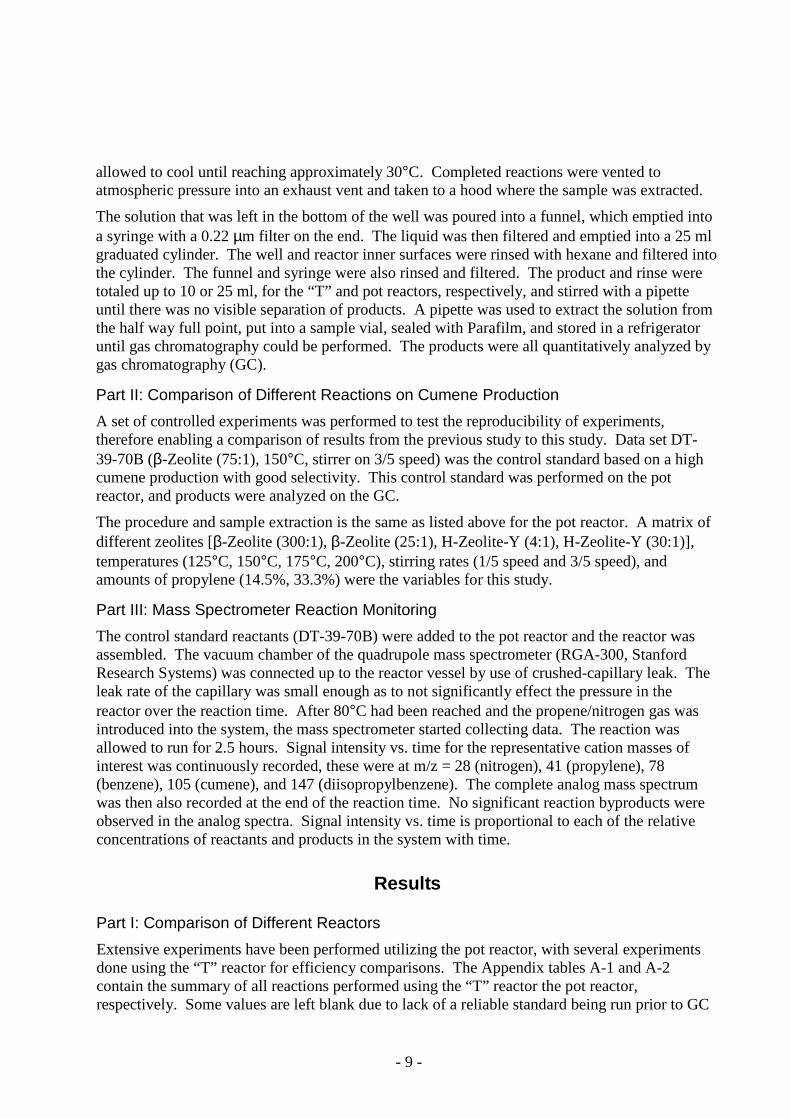
allowed to cool until reaching approximately 30°C. Completed reactions were vented to atmospheric pressure into an exhaust vent and taken to a hood where the sample was extracted.
The solution that was left in the bottom of the well was poured into a funnel, which emptied into a syringe with a 0.22 µm filter on the end. The liquid was then filtered and emptied into a 25 ml graduated cylinder. The well and reactor inner surfaces were rinsed with hexane and filtered into the cylinder. The funnel and syringe were also rinsed and filtered. The product and rinse were totaled up to 10 or 25 ml, for the “T” and pot reactors, respectively, and stirred with a pipette until there was no visible separation of products. A pipette was used to extract the solution from the half way full point, put into a sample vial, sealed with Parafilm, and stored in a refrigerator until gas chromatography could be performed. The products were all quantitatively analyzed by gas chromatography (GC).
Part II: Comparison of Different Reactions on Cumene Production
A set of controlled experiments was performed to test the reproducibility of experiments, therefore enabling a comparison of results from the previous study to this study. Data set DT-39-70B (β-Zeolite (75:1), 150°C, stirrer on 3/5 speed) was the control standard based on a high cumene production with good selectivity. This control standard was performed on the pot reactor, and products were analyzed on the GC.
The procedure and sample extraction is the same as listed above for the pot reactor. A matrix of different zeolites [β-Zeolite (300:1), β-Zeolite (25:1), H-Zeolite-Y (4:1), H-Zeolite-Y (30:1)], temperatures (125°C, 150°C, 175°C, 200°C), stirring rates (1/5 speed and 3/5 speed), and amounts of propylene (14.5%, 33.3%) were the variables for this study.
Part III: Mass Spectrometer Reaction Monitoring
The control standard reactants (DT-39-70B) were added to the pot reactor and the reactor was assembled. The vacuum chamber of the quadrupole mass spectrometer (RGA-300, Stanford Research Systems) was connected up to the reactor vessel by use of crushed-capillary leak. The leak rate of the capillary was small enough as to not significantly effect the pressure in the reactor over the reaction time. After 80°C had been reached and the propene/nitrogen gas was introduced into the system, the mass spectrometer started collecting data. The reaction was allowed to run for 2.5 hours. Signal intensity vs. time for the representative cation masses of interest was continuously recorded, these were at m/z = 28 (nitrogen), 41 (propylene), 78 (benzene), 105 (cumene), and 147 (diisopropylbenzene). The complete analog mass spectrum was then also recorded at the end of the reaction time. No significant reaction byproducts were observed in the analog spectra. Signal intensity vs. time is proportional to each of the relative concentrations of reactants and products in the system with time.
Results
Part I: Comparison of Different Reactors
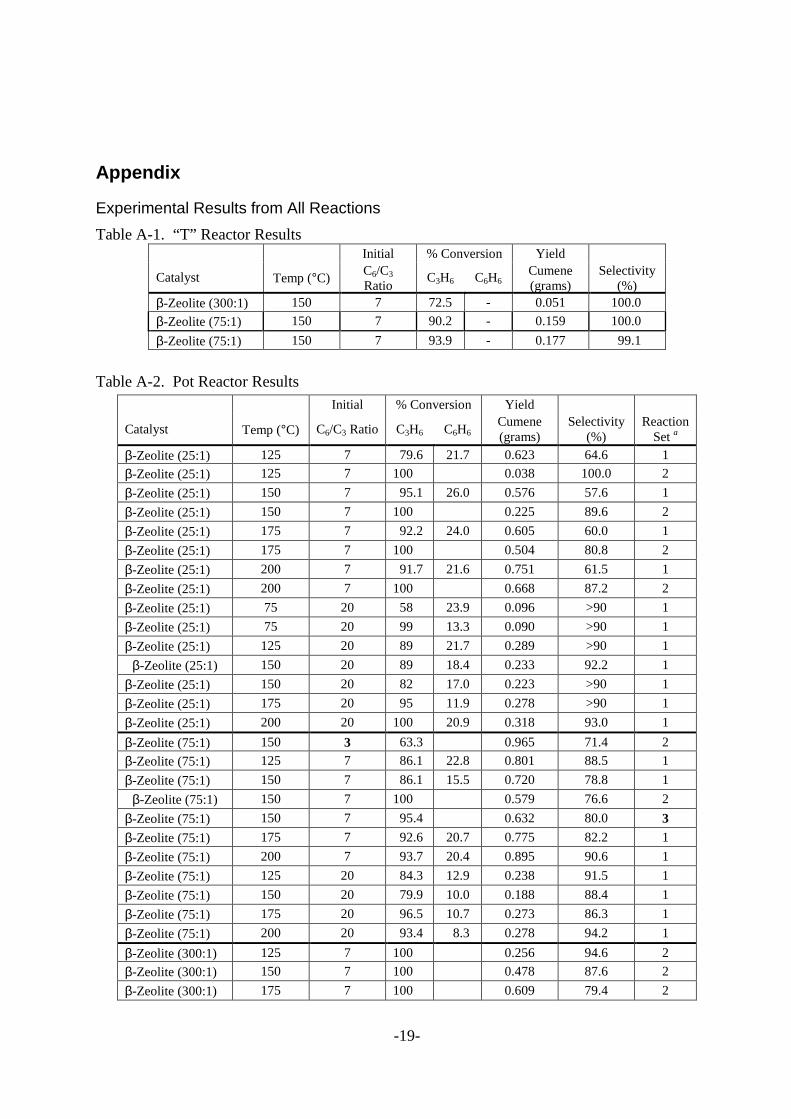
Extensive experiments have been performed utilizing the pot reactor, with several experiments done using the “T” reactor for efficiency comparisons. The Appendix tables A-1 and A-2 contain the summary of all reactions performed using the “T” reactor the pot reactor, respectively. Some values are left blank due to lack of a reliable standard being run prior to GC
- - 10
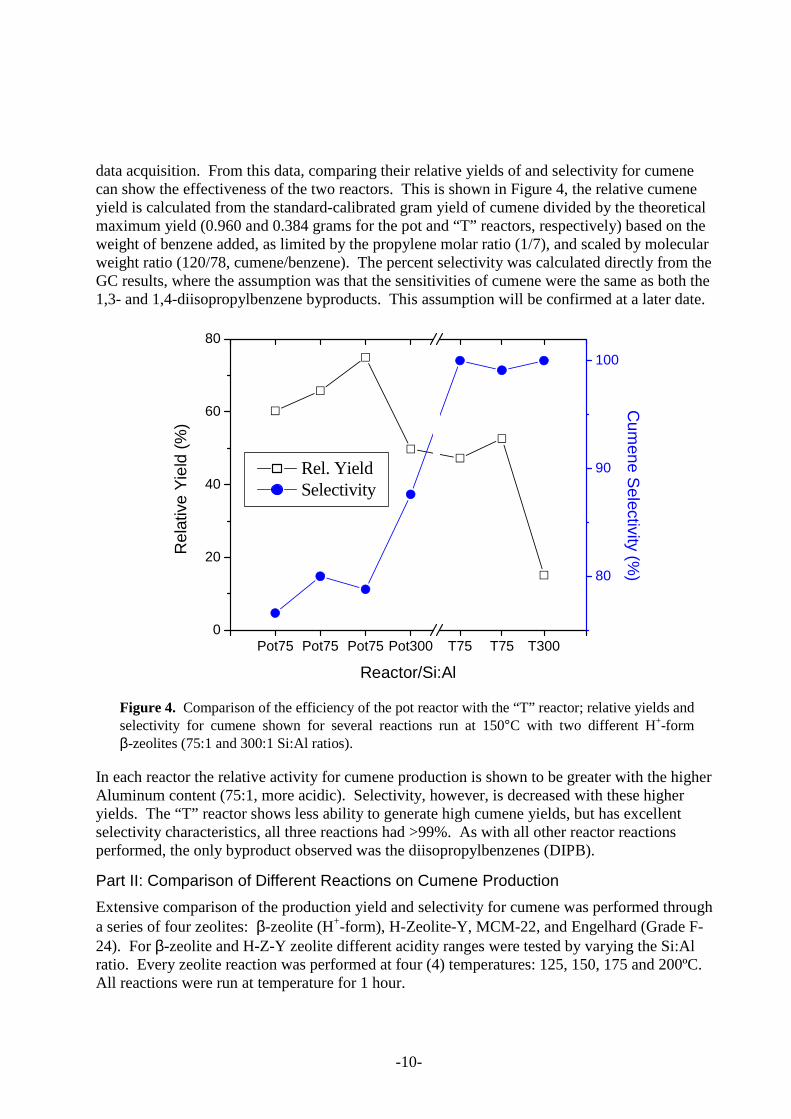
data acquisition. From this data, comparing their relative yields of and selectivity for cumene can show the effectiveness of the two reactors. This is shown in Figure 4, the relative cumene yield is calculated from the standard-calibrated gram yield of cumene divided by the theoretical maximum yield (0.960 and 0.384 grams for the pot and “T” reactors, respectively) based on the weight of benzene added, as limited by the propylene molar ratio (1/7), and scaled by molecular weight ratio (120/78, cumene/benzene). The percent selectivity was calculated directly from the GC results, where the assumption was that the sensitivities of cumene were the same as both the 1,3- and 1,4-diisopropylbenzene byproducts. This assumption will be confirmed at a later date.
Pot75 Pot75 Pot75 Pot300 T75 T75 T3000
20
40
60
80
Rel. Yield Selectivity
Reactor/Si:Al
Rel
ativ
e Y
ield
(%
)
80
90
100
Cum
ene Selectivity (%
)
Figure 4. Comparison of the efficiency of the pot reactor with the “T” reactor; relative yields and selectivity for cumene shown for several reactions run at 150°C with two different H+-form β-zeolites (75:1 and 300:1 Si:Al ratios).
In each reactor the relative activity for cumene production is shown to be greater with the higher Aluminum content (75:1, more acidic). Selectivity, however, is decreased with these higher yields. The “T” reactor shows less ability to generate high cumene yields, but has excellent selectivity characteristics, all three reactions had >99%. As with all other reactor reactions performed, the only byproduct observed was the diisopropylbenzenes (DIPB).
Part II: Comparison of Different Reactions on Cumene Production
Extensive comparison of the production yield and selectivity for cumene was performed through a series of four zeolites: β-zeolite (H+-form), H-Zeolite-Y, MCM-22, and Engelhard (Grade F-24). For β-zeolite and H-Z-Y zeolite different acidity ranges were tested by varying the Si:Al ratio. Every zeolite reaction was performed at four (4) temperatures: 125, 150, 175 and 200ºC. All reactions were run at temperature for 1 hour.
- - 11
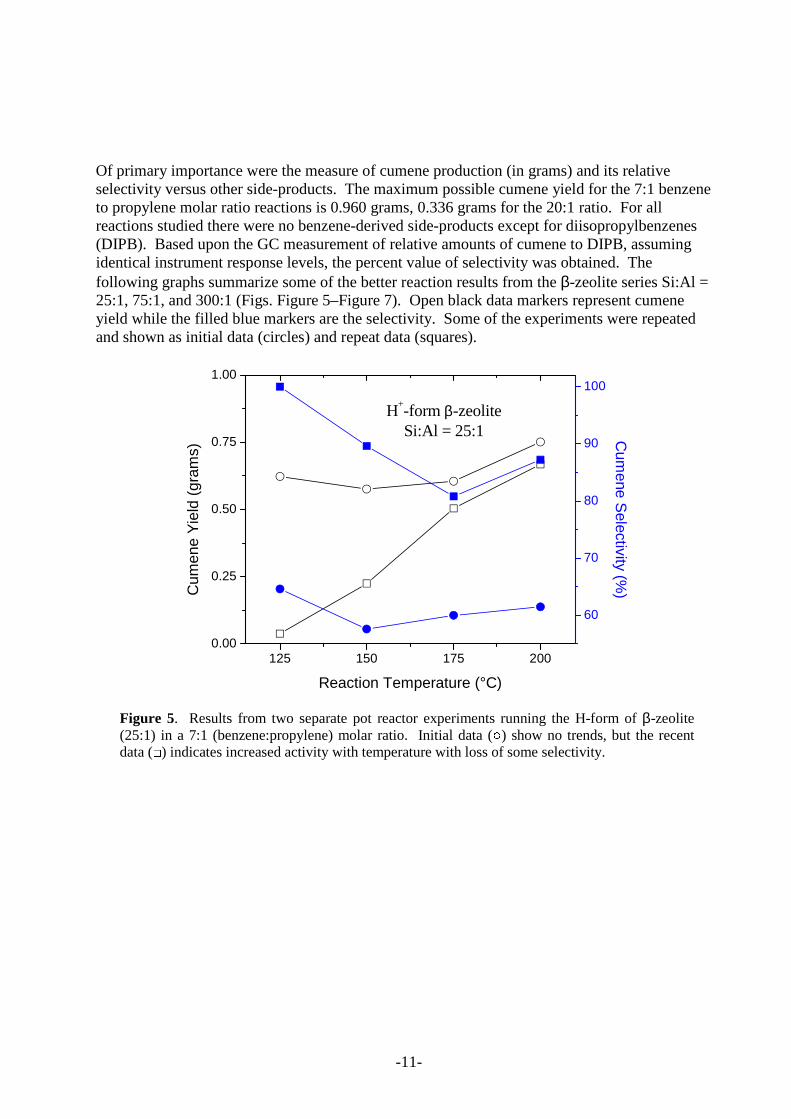
Of primary importance were the measure of cumene production (in grams) and its relative selectivity versus other side-products. The maximum possible cumene yield for the 7:1 benzene to propylene molar ratio reactions is 0.960 grams, 0.336 grams for the 20:1 ratio. For all reactions studied there were no benzene-derived side-products except for diisopropylbenzenes (DIPB). Based upon the GC measurement of relative amounts of cumene to DIPB, assuming identical instrument response levels, the percent value of selectivity was obtained. The following graphs summarize some of the better reaction results from the β-zeolite series Si:Al = 25:1, 75:1, and 300:1 (Figs. Figure 5–Figure 7). Open black data markers represent cumene yield while the filled blue markers are the selectivity. Some of the experiments were repeated and shown as initial data (circles) and repeat data (squares).
125 150 175 2000.00
0.25
0.50
0.75
1.00
Reaction Temperature (°C)
Cum
ene
Yie
ld (
gram
s)
60
70
80
90
100
H+-form β-zeoliteSi:Al = 25:1 C
umene S
electivity (%)
Figure 5. Results from two separate pot reactor experiments running the H-form of β-zeolite (25:1) in a 7:1 (benzene:propylene) molar ratio. Initial data ( � ) show no trends, but the recent data ( � ) indicates increased activity with temperature with loss of some selectivity.
- - 12
125 150 175 2000.00
0.25
0.50
0.75
1.00
Reaction Temperature (ºC)
Cum
ene
Yie
ld (
gram
s)
80
90
100C
umene S
electivity (%)
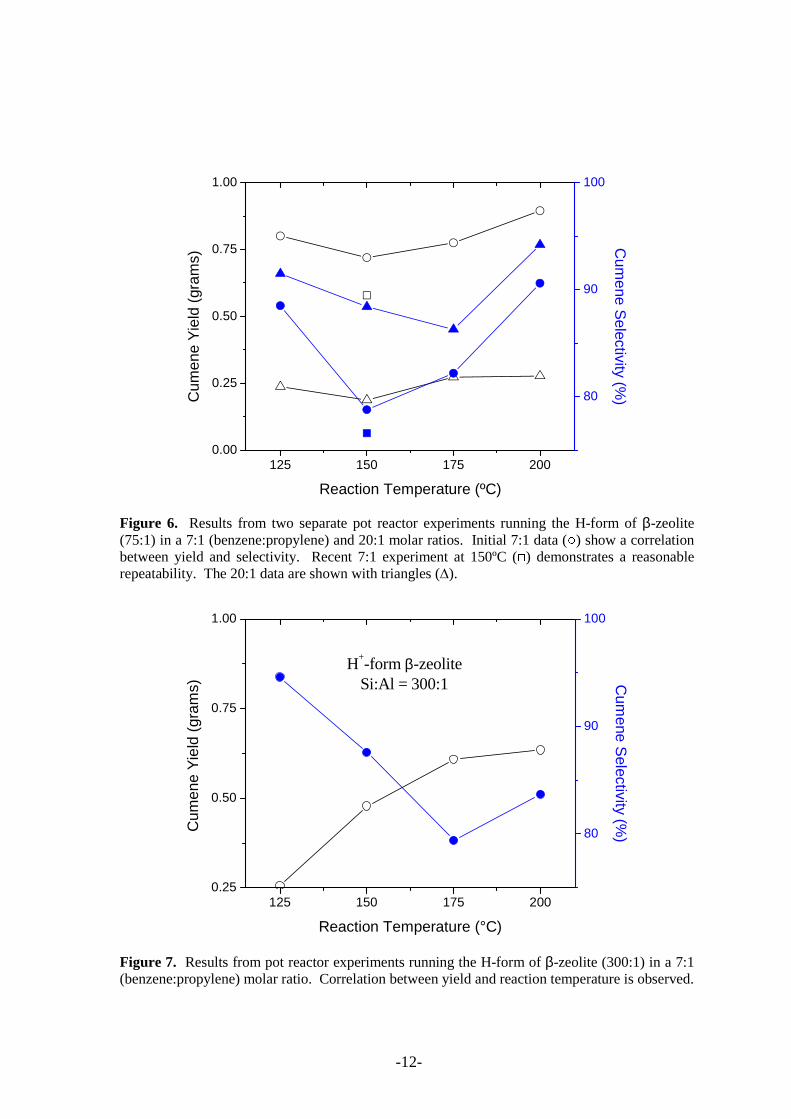
Figure 6. Results from two separate pot reactor experiments running the H-form of β-zeolite (75:1) in a 7:1 (benzene:propylene) and 20:1 molar ratios. Initial 7:1 data ( � )�show�a�correlation�between� yield� and� selectivity.� � Recent� 7:1� experiment� at� 150ºC� ( � )� demonstrates� a� reasonable�repeatability.��The�20:1�data�are�shown�with�triangles�(�).�
125 150 175 2000.25
0.50
0.75
1.00
Reaction�Temperature�(°C)
Cum
ene�
Yie
ld�(
gram
s)
80
90
100
H+-form�β-zeoliteSi:Al�=�300:1 C
umene�S
electivity�(%)
�Figure�7.��Results�from�pot�reactor�experiments�running�the�H-form�of�β-zeolite�(300:1)�in�a�7:1�(benzene:propylene)�molar�ratio.��Correlation�between�yield�and�reaction�temperature�is�observed.�
�������-����-��13��
Very�high�yields�are�seen�with�the�two�most�acidic�β-zeolites�(25:1�and�75:1),�whereas�higher�temperatures�are�required�to�obtain�a�good�cumene�yield�with�the�300:1�β-zeolite.��Quite�different�results�of�the�selectivity�were�obtained�between�the�two�different�experiments�on�β-zeolite�25:1,�as�seen�from�Figure�5.��The�recent�experiments�indicate�quite�good�cumene�selectivity�of�~90%�(i.e.�low�DIPB�production),�while�the�initial�results�showed�poor�selectivity�of�around�60%.��The�reasons�for�this�discrepancy�are�as�yet�unknown�and�will�be�further�investigated.�
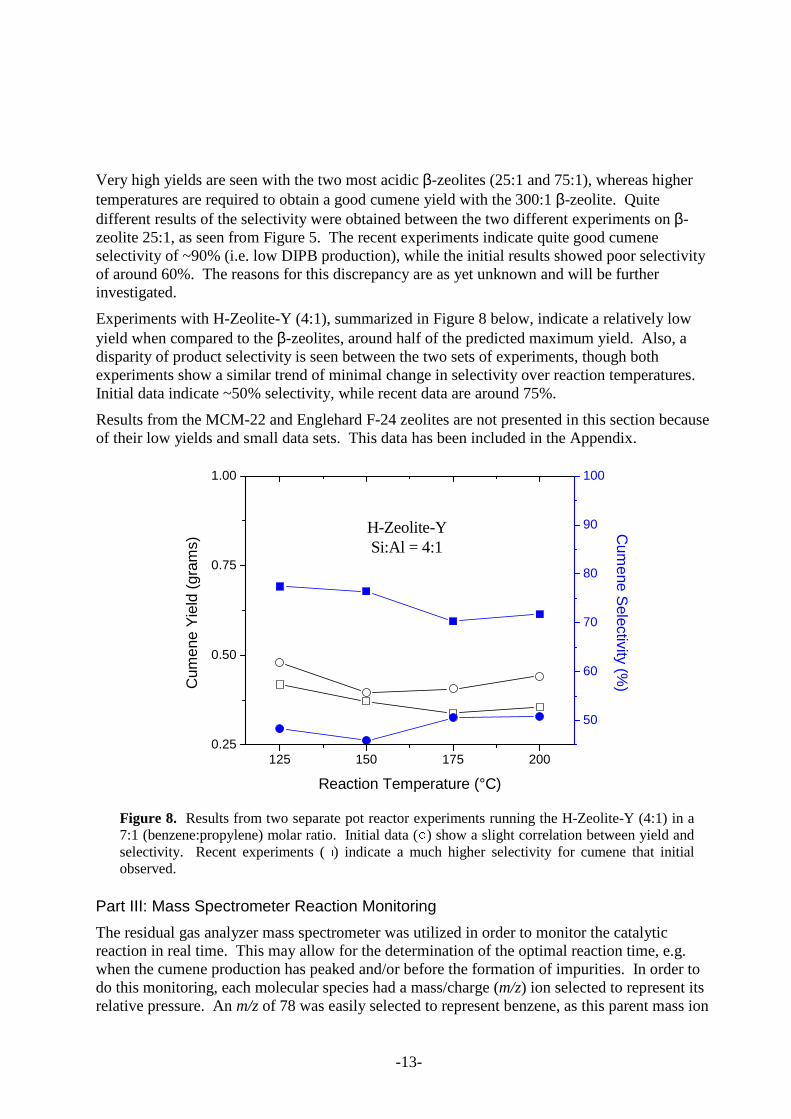
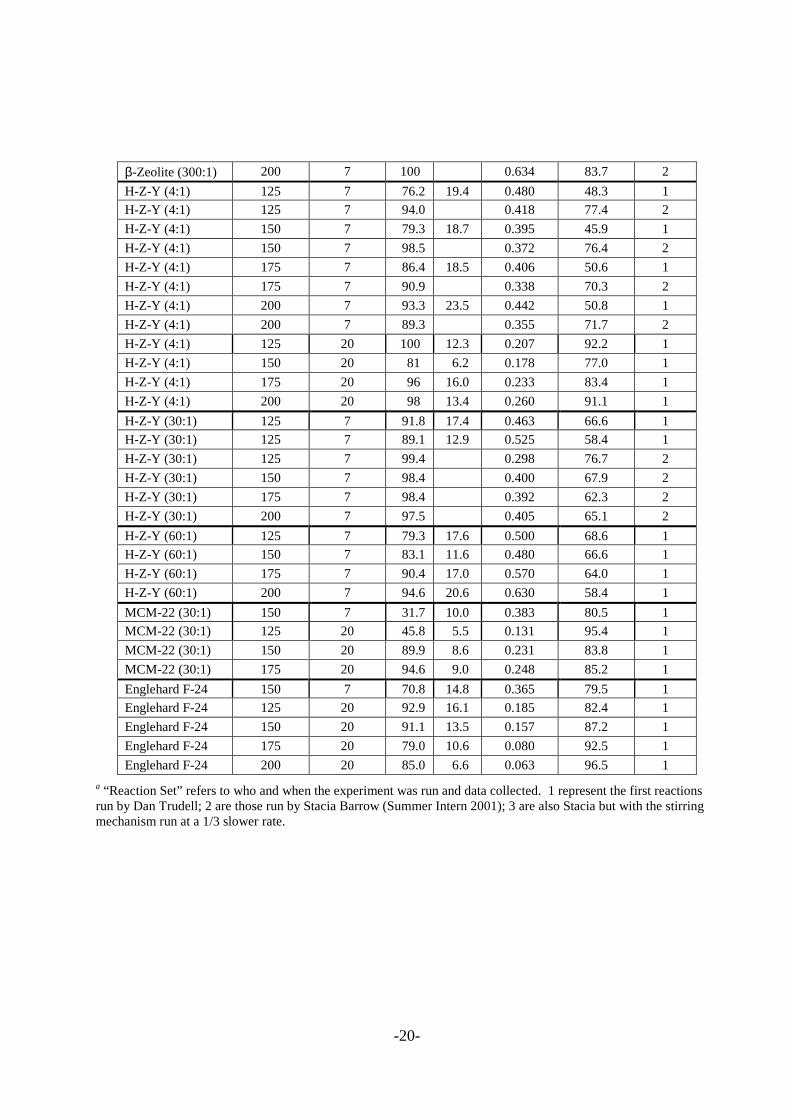
Experiments�with�H-Zeolite-Y�(4:1),�summarized�in�Figure�8�below,�indicate�a�relatively�low�yield�when�compared�to�the�β-zeolites,�around�half�of�the�predicted�maximum�yield.��Also,�a�disparity�of�product�selectivity�is�seen�between�the�two�sets�of�experiments,�though�both�experiments�show�a�similar�trend�of�minimal�change�in�selectivity�over�reaction�temperatures.��Initial�data�indicate�~50%�selectivity,�while�recent�data�are�around�75%.�
Results�from�the�MCM-22�and�Englehard�F-24�zeolites�are�not�presented�in�this�section�because�of�their�low�yields�and�small�data�sets.��This�data�has�been�included�in�the�Appendix.�
125 150 175 2000.25
0.50
0.75
1.00
Reaction�Temperature�(°C)
Cum
ene�
Yie
ld�(
gram
s)
50
60
70
80
90
100
H-Zeolite-YSi:Al�=�4:1
Cum
ene�Selectivity�(%
)
�Figure�8.��Results�from�two�separate�pot�reactor�experiments�running�the�H-Zeolite-Y�(4:1)�in�a�7:1�(benzene:propylene)�molar�ratio.��Initial�data�( � )�show�a�slight�correlation�between�yield�and�selectivity.� � Recent� experiments� ( � )� indicate� a� much� higher� selectivity� for� cumene� that� initial�observed.�
Part�III:�Mass�Spectrometer�Reaction�Monitoring�
The�residual�gas�analyzer�mass�spectrometer�was�utilized�in�order�to�monitor�the�catalytic�reaction�in�real�time.��This�may�allow�for�the�determination�of�the�optimal�reaction�time,�e.g.�when�the�cumene�production�has�peaked�and/or�before�the�formation�of�impurities.��In�order�to�do�this�monitoring,�each�molecular�species�had�a�mass/charge�(m/z)�ion�selected�to�represent�its�relative�pressure.��An�m/z�of�78�was�easily�selected�to�represent�benzene,�as�this�parent�mass�ion�
�������-����-��14��
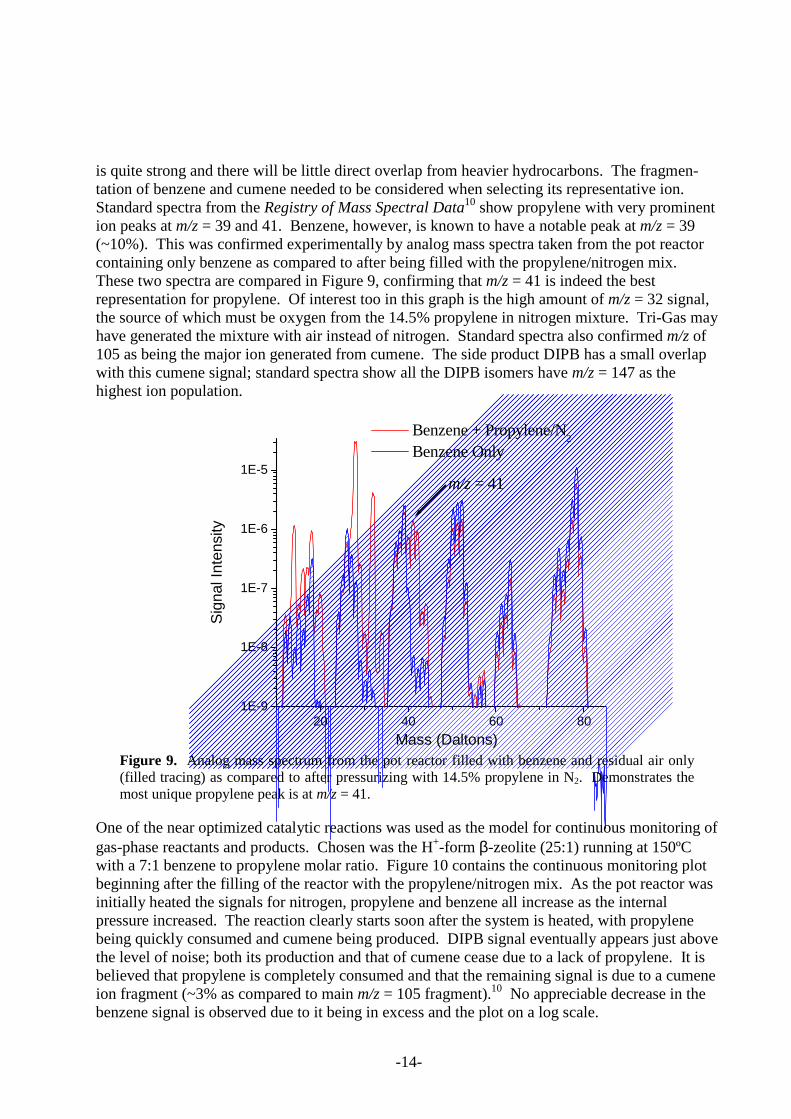
is�quite�strong�and�there�will�be�little�direct�overlap�from�heavier�hydrocarbons.��The�fragmen-tation�of�benzene�and�cumene�needed�to�be�considered�when�selecting�its�representative�ion.��Standard�spectra�from�the�Registry�of�Mass�Spectral�Data10�show�propylene�with�very�prominent�ion�peaks�at�m/z�=�39�and�41.��Benzene,�however,�is�known�to�have�a�notable�peak�at�m/z�=�39�(~10%).��This�was�confirmed�experimentally�by�analog�mass�spectra�taken�from�the�pot�reactor�containing�only�benzene�as�compared�to�after�being�filled�with�the�propylene/nitrogen�mix.��These�two�spectra�are�compared�in�Figure�9,�confirming�that�m/z�=�41�is�indeed�the�best�representation�for�propylene.��Of�interest�too�in�this�graph�is�the�high�amount�of�m/z�=�32�signal,�the�source�of�which�must�be�oxygen�from�the�14.5%�propylene�in�nitrogen�mixture.��Tri-Gas�may�have�generated�the�mixture�with�air�instead�of�nitrogen.��Standard�spectra�also�confirmed�m/z�of�105�as�being�the�major�ion�generated�from�cumene.��The�side�product�DIPB�has�a�small�overlap�with�this�cumene�signal;�standard�spectra�show�all�the�DIPB�isomers�have�m/z�=�147�as�the�highest�ion�population.�
20 40 60 801E-9
1E-8
1E-7
1E-6
1E-5m/z�=�41
�Benzene�+�Propylene/N2
�Benzene�Only
Mass�(Daltons)
Sig
nal�I
nten
sity
�Figure�9.� �Analog�mass�spectrum�from�the�pot�reactor�filled�with�benzene�and�residual�air�only�(filled�tracing)�as�compared�to�after�pressurizing�with�14.5%�propylene�in�N2.��Demonstrates�the�most�unique�propylene�peak�is�at�m/z�=�41.�
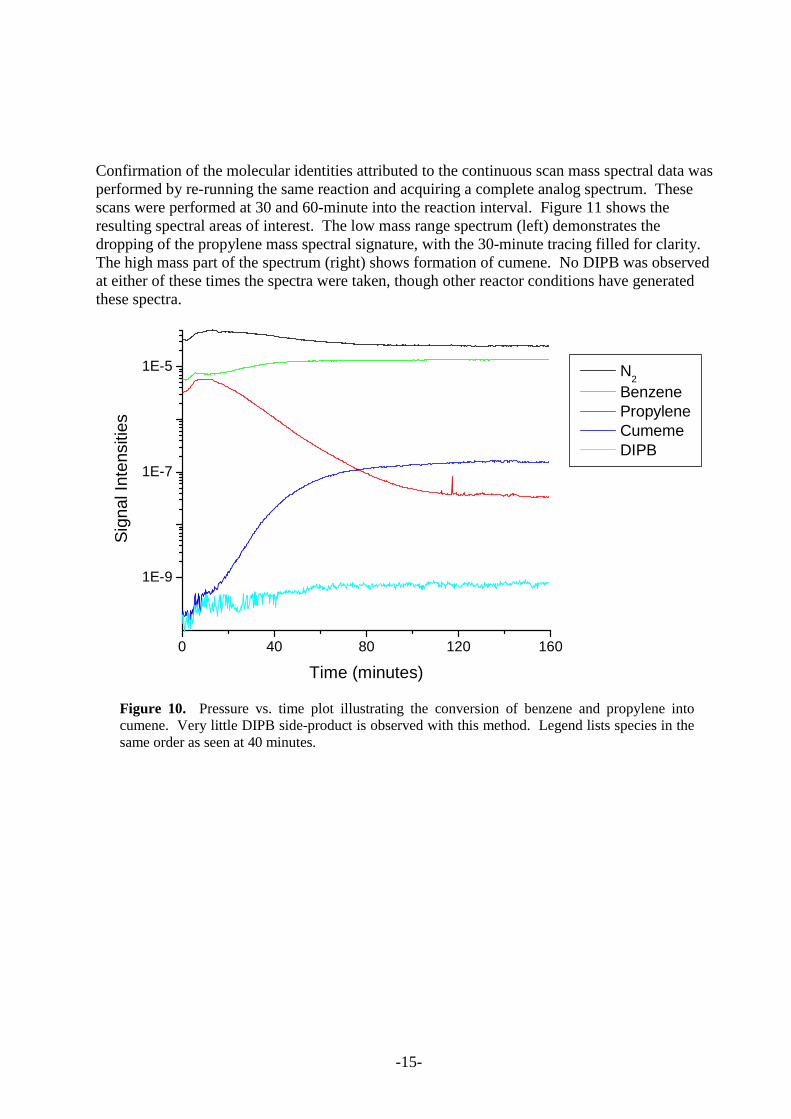
One�of�the�near�optimized�catalytic�reactions�was�used�as�the�model�for�continuous�monitoring�of�gas-phase�reactants�and�products.��Chosen�was�the�H+-form�β-zeolite�(25:1)�running�at�150ºC�with�a�7:1�benzene�to�propylene�molar�ratio.��Figure�10�contains�the�continuous�monitoring�plot�beginning�after�the�filling�of�the�reactor�with�the�propylene/nitrogen�mix.��As�the�pot�reactor�was�initially�heated�the�signals�for�nitrogen,�propylene�and�benzene�all�increase�as�the�internal�pressure�increased.��The�reaction�clearly�starts�soon�after�the�system�is�heated,�with�propylene�being�quickly�consumed�and�cumene�being�produced.��DIPB�signal�eventually�appears�just�above�the�level�of�noise;�both�its�production�and�that�of�cumene�cease�due�to�a�lack�of�propylene.��It�is�believed�that�propylene�is�completely�consumed�and�that�the�remaining�signal�is�due�to�a�cumene�ion�fragment�(~3%�as�compared�to�main�m/z�=�105�fragment).10��No�appreciable�decrease�in�the�benzene�signal�is�observed�due�to�it�being�in�excess�and�the�plot�on�a�log�scale.�
�������-����-��15��
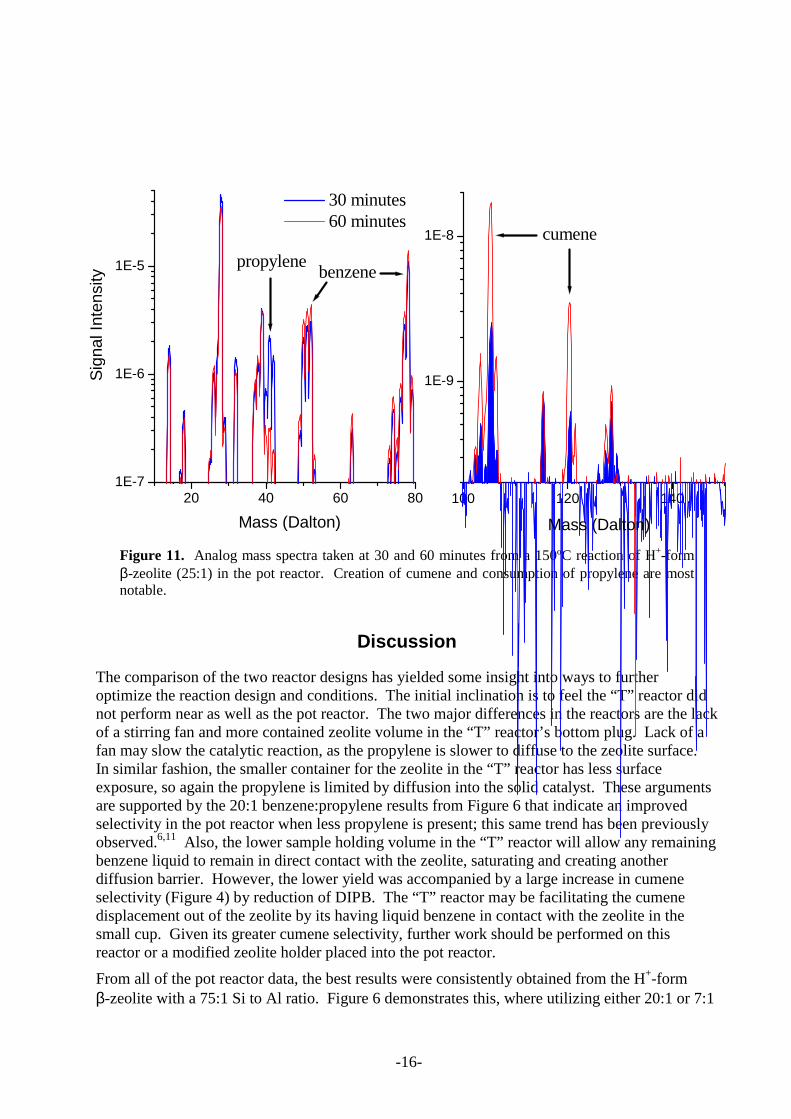
Confirmation�of�the�molecular�identities�attributed�to�the�continuous�scan�mass�spectral�data�was�performed�by�re-running�the�same�reaction�and�acquiring�a�complete�analog�spectrum.��These�scans�were�performed�at�30�and�60-minute�into�the�reaction�interval.��Figure�11�shows�the�resulting�spectral�areas�of�interest.��The�low�mass�range�spectrum�(left)�demonstrates�the�dropping�of�the�propylene�mass�spectral�signature,�with�the�30-minute�tracing�filled�for�clarity.��The�high�mass�part�of�the�spectrum�(right)�shows�formation�of�cumene.��No�DIPB�was�observed�at�either�of�these�times�the�spectra�were�taken,�though�other�reactor�conditions�have�generated�these�spectra.�
0 40 80 120 160
1E-9
1E-7
1E-5 �N2
�Benzene�Propylene�Cumeme�DIPB
Sig
nal�I
nten
sitie
s
Time�(minutes)�
Figure� 10.� � Pressure� vs.� time� plot� illustrating� the� conversion� of� benzene� and� propylene� into�cumene.��Very�little�DIPB�side-product�is�observed�with�this�method.��Legend�lists�species�in�the�same�order�as�seen�at�40�minutes.�
�������-����-��16��
Figure�11.� �Analog�mass�spectra�taken�at�30�and�60�minutes�from�a�150ºC�reaction�of�H+-form�β-zeolite�(25:1)�in�the�pot�reactor.��Creation�of�cumene�and�consumption�of�propylene�are�most�notable.�
Discussion�
The�comparison�of�the�two�reactor�designs�has�yielded�some�insight�into�ways�to�further�optimize�the�reaction�design�and�conditions.��The�initial�inclination�is�to�feel�the�“T” �reactor�did�not�perform�near�as�well�as�the�pot�reactor.��The�two�major�differences�in�the�reactors�are�the�lack�of�a�stirring�fan�and�more�contained�zeolite�volume�in�the�“T” �reactor’s�bottom�plug.��Lack�of�a�fan�may�slow�the�catalytic�reaction,�as�the�propylene�is�slower�to�diffuse�to�the�zeolite�surface.��In�similar�fashion,�the�smaller�container�for�the�zeolite�in�the�“T” �reactor�has�less�surface�exposure,�so�again�the�propylene�is�limited�by�diffusion�into�the�solid�catalyst.��These�arguments�are�supported�by�the�20:1�benzene:propylene�results�from�Figure�6�that�indicate�an�improved�selectivity�in�the�pot�reactor�when�less�propylene�is�present;�this�same�trend�has�been�previously�observed.6,11��Also,�the�lower�sample�holding�volume�in�the�“T” �reactor�will�allow�any�remaining�benzene�liquid�to�remain�in�direct�contact�with�the�zeolite,�saturating�and�creating�another�diffusion�barrier.��However,�the�lower�yield�was�accompanied�by�a�large�increase�in�cumene�selectivity�(Figure�4)�by�reduction�of�DIPB.��The�“T” �reactor�may�be�facilitating�the�cumene�displacement�out�of�the�zeolite�by�its�having�liquid�benzene�in�contact�with�the�zeolite�in�the�small�cup.��Given�its�greater�cumene�selectivity,�further�work�should�be�performed�on�this�reactor�or�a�modified�zeolite�holder�placed�into�the�pot�reactor.�
From�all�of�the�pot�reactor�data,�the�best�results�were�consistently�obtained�from�the�H+-form�β-zeolite�with�a�75:1�Si�to�Al�ratio.��Figure�6�demonstrates�this,�where�utilizing�either�20:1�or�7:1�
100 120 140
1E-9
1E-8 cumene
Mass�(Dalton)
20 40 60 801E-7
1E-6
1E-5 benzenepropylene
�30�minutes�60�minutes
Sig
nal�I
nten
sity
Mass�(Dalton)
�������-����-��17��
benzene�to�propylene�mixtures�typically�results�in�>80%�selectivity�for�cumene,�with�the�best�yield�of�approximately�95%�at�200ºC�reaction�with�91%�selectivity.��A�trend�seen�with�all�the�β-zeolites�is�that�the�selectivity�profile�changes�to�an�increasing�selectivity�when�the�reaction�gets�to�its�highest�temperatures.��Perhaps�this�reflects�cumene’s�ability�to�desorb�more�easily�at�high�temperature�from�the�zeolite�and�allow�it�to�be�replaced�by�the�more�abundant�benzene.��Cumene�leaving�the�zeolite,�either�dissolved�in�liquid�or�vaporizing�into�the�gas�phase,�prevents�further�alkylation�into�the�DIPB�byproduct.��Forbearing�the�appearance�of�new�side�reactions,�there�may�exist�optimum�reaction�temperatures�over�200ºC.�
Comparison�to�the�alkylation�results�of�Siffert�et�al.6�show�similarity�in�the�ranges�of�selectivity,�but�most�of�our�results�here�do�not�indicate�the�temperature�effects�on�yield�(their�conversion�%)�they�observed.��This�likely�due�to�their�usage�of�a�continuous�flowing�system�as�compared�to�the�static�volume�utilized�here.��Figure�10�shows�that�at�a�1-hour�reaction�time�>95%�of�the�propylene�mass�spectral�signature�has�gone.��Even�our�less�active�reactions�may�be�nearing�completion�after�one�hour.��Further�research�is�to�include�the�examination�of�the�reaction�products�at�an�earlier�reaction�time-point�to�improve�the�sensitivity�of�cumene�yield�to�reactor�variables.�
The�real-time�mass�spectral�reactor�monitoring�gives�added�insight�into�the�heterogeneous�catalysis�process.��When�analyzing�this�data�it�is�important�to�know�that�the�intensities�of�the�different�species�cannot�be�directly�compared�as�they�are�affected�not�only�by�ionization�efficiency�but�also�by�their�vapor�pressures.��Propylene,�having�the�largest�vapor�pressure�of�the�organics�here,�will�result�in�the�largest�signals�followed�in�descending�order�by�benzene,�cumene�and�DIPB.��This�being�a�reason�the�gas�chromatography�data�of�the�resulting�liquid�is�used�to�quantify�the�components.��A�close�look�at�the�cumene�production�in�Figure�10�indicates�a�delayed�release�back�into�the�gas�phase�while�the�propylene�is�quickly�absorbed/consumed.��This�observation,�performed�at�150ºC,�leads�credence�to�the�idea�proposed�above�that�cumene�desorption�from�the�zeolite�may�be�slow�when�the�temperature�is�<�200ºC.�
The�analog�mass�spectra�fail�to�show�any�appreciable�propylene�oligomerization,�i.e.�no�increase�in�C4–C6�products,�of�which�hexenes�are�preferred�oligomer�products�formed�from�0.15–0.41%.12��These�and�other�coke�products�generated�from�propene�can�be�readily�adsorbed�into�the�zeolite,�thereby�not�seen,�and�decrease�the�catalytic�efficiency.6,13���
Conclusion�
Production�of�cumene�by�the�H+-form�β-zeolite,�optimally�that�with�a�75:1�Si�to�Al�ratio,�has�been�shown�to�be�efficient�under�many�conditions,�with�up�to�95%�yield�or�99%�selectivity.��For�this�zeolite,�optimization�of�yield�occurs�with�the�higher�acidity�catalysts�(75:1�or�25:1)�and�high�temperature,�whereas�the�selectivity�is�better�with�less�acidic�catalysts�and�either�low�(125ºC)�or�high�(200ºC)�temperatures.��Mass�spectral�component�monitoring�can�show�reaction�rate�information�and�indicate�reaction�completion,�as�well�as�monitor�for�side-product�formation.��This�MS�monitoring�also�identified�cumene�retention�was�occurring�in�the�β-zeolite,�identifying�a�plausible�reason�for�DIPB�production.��This�cumene�retention�is�reduced�in�the�“T” �reactor�design�by�direct�saturation�in�the�liquid�benzene,�resulting�in�less�DIPB�formation.�
Ongoing�research�includes�(1)�use�of�novel�acidified�zeolites�synthesized�at�SNL,�(2)�early�reac-tion�monitoring�by�in-situ�mass�spectral�studies,�and�(3)�improvements�in�bulk�reactor�design.�
�������-����-��18��
�References��
1.� Pujado,�P.R.;�Salazar,�J.R.;�Berger,�C.V.�Hydrocarbon�Process,�1976,�55,�91.�
2.� Jones,�E.K.;�Dettner,�D.D.��U.S.�Patent�2�860�173,�1958.�
3.� Miki,�H.��U.S.�Patent�4�347�393,�1982.�
4.� Reddy,�K.S.N.;�Rao,�B.S.;�Shiralkar,�V.P.��Appl.�Catal.�A,�1993,�95(1),�pp.�53–63.�
5.� Halgeri,�A.B.;�Jagannath,�D.��Appl.�Catal.�A,�1999,�181,�pp.�347–354.�
6.� Siffert,�S.;�Gaillard,�L.;�Su,�B.-L.��J.�Molec.�Catal.�A,�2000,�153,�pp.�267–279.�
7.� Sandia�Laboratory�Directed�Research�and�Development�Project�#01-0261,�2001.�
8.� Thoma,�S.�G.;�Trudell,�D.�E.;�Bonhomme,�F.;�Nenoff,�T.�M.��"Vapor�Phase�Transport�Synthesis�of�un-supported�ZSM-22�Catalytic�Membranes"��Microporous�Mesoporous�Mater.,�2001,�submitted.�
9.� Cornelius,�C.J.;�Thoma,�S.G.;�Nenoff,�T.M.�“ Inorganic�Membranes�for�Separating�C4/C5/C6�Hydrocarbons” �Sandia�National�Laboratories,�SAND2001-1570,�2001.�
10.�Stenhagen,�E.;�Abrahamsson,�S.;�McLafferty,�F.W.��“Registry�of�Mass�Spectral�Data,�vol.�1” �Wiley,�New�York,�1974.�
11.�Keading,�W.W.;�Holland,�R.E.�J.�Catal.,�1988,�109(1),�pp.�212–216.�
12.�Corma,�A.;�Martínez-Soria,�V.;�Schnoeveld,�E.�J.�Catal.,�2000,�192,�pp.�163–173.�
13.�Haw,�J.F.;�Richardson,�B.R.;�Oshiro,�I.S.;�Lazo,�N.D.;�Speed,�J.A.�J.�Am.�Chem.�Soc.,�1989,�111,�pp.�2052–2058.�
������-����-�
�
19
Appendix�
Experimental�Results�from�All�Reactions�
Table�A-1.��“T”�Reactor�Results���
�
Table�A-2.��Pot�Reactor�Results�� � Initial� %�Conversion� Yield� � �
Catalyst� Temp�(°C)� C6/C3�Ratio� C3H6� C6H6�Cumene�(grams)�
Selectivity�(%)�
Reaction�Set�a�
β-Zeolite�(25:1)� 125� 7� 79.6� 21.7� 0.623� 64.6� 1�
β-Zeolite�(25:1)� 125� 7� 100� � 0.038� 100.0� 2�
β-Zeolite�(25:1)� 150� 7� 95.1� 26.0� 0.576� 57.6� 1�
β-Zeolite�(25:1)� 150� 7� 100� � 0.225� 89.6� 2�
β-Zeolite�(25:1)� 175� 7� 92.2� 24.0� 0.605� 60.0� 1�
β-Zeolite�(25:1)� 175� 7� 100� � 0.504� 80.8� 2�
β-Zeolite�(25:1)� 200� 7� 91.7� 21.6� 0.751� 61.5� 1�
β-Zeolite�(25:1)� 200� 7� 100� � 0.668� 87.2� 2�
β-Zeolite�(25:1)� 75� 20� 58� 23.9� 0.096� >90� 1�
β-Zeolite�(25:1)� 75� 20� 99� 13.3� 0.090� >90� 1�
β-Zeolite�(25:1)� 125� 20� 89� 21.7� 0.289� >90� 1�
β-Zeolite�(25:1)� 150� 20� 89� 18.4� 0.233� 92.2� 1�
β-Zeolite�(25:1)� 150� 20� 82� 17.0� 0.223� >90� 1�
β-Zeolite�(25:1)� 175� 20� 95� 11.9� 0.278� >90� 1�
β-Zeolite�(25:1)� 200� 20� 100� 20.9� 0.318� 93.0� 1�
β-Zeolite�(75:1)� 150� 3� 63.3� � 0.965� 71.4� 2�
β-Zeolite�(75:1)� 125� 7� 86.1� 22.8� 0.801� 88.5� 1�
β-Zeolite�(75:1)� 150� 7� 86.1� 15.5� 0.720� 78.8� 1�
β-Zeolite�(75:1)� 150� 7� 100� � 0.579� 76.6� 2�
β-Zeolite�(75:1)� 150� 7� 95.4� � 0.632� 80.0� 3�
β-Zeolite�(75:1)� 175� 7� 92.6� 20.7� 0.775� 82.2� 1�
β-Zeolite�(75:1)� 200� 7� 93.7� 20.4� 0.895� 90.6� 1�
β-Zeolite�(75:1)� 125� 20� 84.3� 12.9� 0.238� 91.5� 1�
β-Zeolite�(75:1)� 150� 20� 79.9� 10.0� 0.188� 88.4� 1�
β-Zeolite�(75:1)� 175� 20� 96.5� 10.7� 0.273� 86.3� 1�
β-Zeolite�(75:1)� 200� 20� 93.4� 8.3� 0.278� 94.2� 1�
β-Zeolite�(300:1)� 125� 7� 100� � 0.256� 94.6� 2�
β-Zeolite�(300:1)� 150� 7� 100� � 0.478� 87.6� 2�
β-Zeolite�(300:1)� 175� 7� 100� � 0.609� 79.4� 2�
� � Initial� %�Conversion� Yield� �
Catalyst� Temp�(°C)�C6/C3�Ratio�
C3H6� C6H6�Cumene�(grams)�
Selectivity�(%)�
β-Zeolite�(300:1)� 150� 7� 72.5� -� 0.051� 100.0�
β-Zeolite�(75:1)� 150� 7� 90.2� -� 0.159� 100.0�
β-Zeolite�(75:1)� 150� 7� 93.9� -� 0.177� 99.1�
������-����-�
�
20
β-Zeolite�(300:1)� 200� 7� 100� � 0.634� 83.7� 2�
H-Z-Y�(4:1)� 125� 7� 76.2� 19.4� 0.480� 48.3� 1�
H-Z-Y�(4:1)� 125� 7� 94.0� � 0.418� 77.4� 2�
H-Z-Y�(4:1)� 150� 7� 79.3� 18.7� 0.395� 45.9� 1�
H-Z-Y�(4:1)� 150� 7� 98.5� � 0.372� 76.4� 2�
H-Z-Y�(4:1)� 175� 7� 86.4� 18.5� 0.406� 50.6� 1�
H-Z-Y�(4:1)� 175� 7� 90.9� � 0.338� 70.3� 2�
H-Z-Y�(4:1)� 200� 7� 93.3� 23.5� 0.442� 50.8� 1�
H-Z-Y�(4:1)� 200� 7� 89.3� � 0.355� 71.7� 2�
H-Z-Y�(4:1)� 125� 20� 100� 12.3� 0.207� 92.2� 1�
H-Z-Y�(4:1)� 150� 20� 81� 6.2� 0.178� 77.0� 1�
H-Z-Y�(4:1)� 175� 20� 96� 16.0� 0.233� 83.4� 1�
H-Z-Y�(4:1)� 200� 20� 98� 13.4� 0.260� 91.1� 1�
H-Z-Y�(30:1)� 125� 7� 91.8� 17.4� 0.463� 66.6� 1�
H-Z-Y�(30:1)� 125� 7� 89.1� 12.9� 0.525� 58.4� 1�
H-Z-Y�(30:1)� 125� 7� 99.4� � 0.298� 76.7� 2�
H-Z-Y�(30:1)� 150� 7� 98.4� � 0.400� 67.9� 2�
H-Z-Y�(30:1)� 175� 7� 98.4� � 0.392� 62.3� 2�
H-Z-Y�(30:1)� 200� 7� 97.5� � 0.405� 65.1� 2�
H-Z-Y�(60:1)� 125� 7� 79.3� 17.6� 0.500� 68.6� 1�
H-Z-Y�(60:1)� 150� 7� 83.1� 11.6� 0.480� 66.6� 1�
H-Z-Y�(60:1)� 175� 7� 90.4� 17.0� 0.570� 64.0� 1�
H-Z-Y�(60:1)� 200� 7� 94.6� 20.6� 0.630� 58.4� 1�
MCM-22�(30:1)� 150� 7� 31.7� 10.0� 0.383� 80.5� 1�
MCM-22�(30:1)� 125� 20� 45.8� 5.5� 0.131� 95.4� 1�
MCM-22�(30:1)� 150� 20� 89.9� 8.6� 0.231� 83.8� 1�
MCM-22�(30:1)� 175� 20� 94.6� 9.0� 0.248� 85.2� 1�
Englehard�F-24� 150� 7� 70.8� 14.8� 0.365� 79.5� 1�
Englehard�F-24� 125� 20� 92.9� 16.1� 0.185� 82.4� 1�
Englehard�F-24� 150� 20� 91.1� 13.5� 0.157� 87.2� 1�
Englehard�F-24� 175� 20� 79.0� 10.6� 0.080� 92.5� 1�
Englehard�F-24� 200� 20� 85.0� 6.6� 0.063� 96.5� 1�
a�“Reaction�Set”�refers�to�who�and�when�the�experiment�was�run�and�data�collected.��1�represent�the�first�reactions�run�by�Dan�Trudell;�2�are�those�run�by�Stacia�Barrow�(Summer�Intern�2001);�3�are�also�Stacia�but�with�the�stirring�mechanism�run�at�a�1/3�slower�rate.�
������-����-�
�
21
Distribution:��1� E.�Dickson�Ozokwelu�� DOE/OIT,�EE-20�� 1000�Independence�Ave�SW�� Washington,�DC�20585-0121�
1� Charles�Sorrell�� �DOE/OIT,�EE-23�1000�Independence�Ave�SW�Washington,�DC�20585�
1� MS�0778� Russell�L�Jarek,�06851�
5� MS�0886� Steven�M.�Thornberg,�01812�
5� MS�0755� Tina�Nenoff,�06233�
1� MS�0755� Genoveva�Buelna,�06233�
1� MS�0886� Nancy�Jackson,�01812�
1� MS�0755� Dan�Horschel,�06233�
1� MS�0753� J.�Bruce�Kelley,�06219�
1� MS�9054� Don�Hardesty,�08360�
1� MS�9054� Bill�McLean,�08300�
1� MS�9018� Central�Technical�Files,�8945-1�
2� MS�0899� Technical�Library,�9616�
2� MS�0612� Review�&�Approval�desk,�9612�� � � for�DOE/OSTI�
��
�


