
Int. J. Environ. Res. Public Health 2014, 11, 1141-1160; doi:10.3390/ijerph110101141
International Journal of
Environmental Research and Public Health
ISSN 1660-4601 www.mdpi.com/journal/ijerph
Article
Estimating Cyanobacteria Community Dynamics and its Relationship with Environmental Factors
Wenhuai Luo 1,†, Huirong Chen 1,†, Anping Lei 1, Jun Lu 1,2 and Zhangli Hu 1,*
1 Shenzhen Key Laboratory of Marine Bioresource and Eco-environmental Science, Shenzhen
Engineering Laboratory of Marine Algal Biotechnology, College of Life Science, Shenzhen
University, Shenzhen 518060, China; E-Mails: [email protected] (W.L.);
[email protected] (H.C.); [email protected] (A.L.); [email protected] (J.L.) 2 Institute for Applied Ecology New Zealand, School of Applied Sciences, and School of
Interprofessional Health Studies, Faculty of Health and Environmental Sciences, and Institute of
Biomedical Technology, Auckland University of Technology, 34 St Paul Street, Auckland 1142,
New Zealand
† These authors contributed equally to this work.
* Author to whom correspondence should be addressed; E-Mail: [email protected];
Tel.: +86-755-2655-7244.
Received: 31 October 2013; in revised form: 7 January 2014 / Accepted: 8 January 2014 /
Published: 20 January 2014
Abstract: The cyanobacteria community dynamics in two eutrophic freshwater bodies
(Tiegang Reservoir and Shiyan Reservoir) was studied with both a traditional microscopic
counting method and a PCR-DGGE genotyping method. Results showed that
cyanobacterium Phormidium tenue was the predominant species; twenty-six cyanobacteria
species were identified in water samples collected from the two reservoirs, among which
fourteen were identified with the morphological method and sixteen with the PCR-DGGE
method. The cyanobacteria community composition analysis showed a seasonal fluctuation
from July to December. The cyanobacteria population peaked in August in both reservoirs,
with cell abundances of 3.78 × 10⁸ cells L-1 and 1.92 × 10⁸ cells L-1 in the Tiegang and
Shiyan reservoirs, respectively. Canonical Correspondence Analysis (CCA) was applied to
further investigate the correlation between cyanobacteria community dynamics and
environmental factors. The result indicated that the cyanobacteria community dynamics was
mostly correlated with pH, temperature and total nitrogen. This study demonstrated that data
OPEN ACCESS
Int. J. Environ. Res. Public 2014, 11 1142
obtained from PCR-DGGE combined with a traditional morphological method could reflect
cyanobacteria community dynamics and its correlation with environmental factors in
eutrophic freshwater bodies.
Keywords: eutrophication; cyanobacteria community composition; PCR-DGGE;
freshwater lakes
1. Introduction
Eutrophication of water bodies and subsequent cyanobacteria blooms have become a worldwide
environmental problem since last century. Toxins produced by some cyanobacteria species pose
a threat to public health [1]. In China, a survey done in 2000 showed that around 37.8 % of its
reservoirs were eutrophic, representing 13.4 % of total water supply capacity [2]. The situation is
worse in Guangdong Province in South China. As shown in a survey done in 132 Guangdong reservoirs
during 2002–2003, two reservoirs were hyper-eutrophic, 12 reservoirs were meso-eutrophic, and most
studied reservoirs (111 out of 132) were eutrophic (total phosphorus concentration around 0.01 to
0.05 mg L-1) [3]. The city of Shenzhen is located in south Guangdong, and its tropical weather and fast
economic development increase the chances of reservoir eutrophication and cyanobacteria blooms. It is
necessary to develop a fast and reliable assessment method to evaluate the phytoplankton community
composition and predict the occurrence of cyanobacteria blooms, which is of economic, health and
environmental importance to Shenzhen City.
Shiyan Reservoir (longitude 99°8’ E, latitude 37°6’ N) is located in Shiyan Town, in the Bao’an
District of Shenzhen. The mean water depth is 36.0 m and the capacity is 31,200,000 m3. Tiegang
Reservoir (longitude 98°8’ E, latitude 30°0’ N) is located in Xixiang Town of Shenzhen. Its capacity is
68,400,000 m3. The two reservoirs are connected by an open channel. Shiyan Reservoir is the major
urban water supply for Bao’an District, providing drinking water for surrounding towns since 1994 [4].
Water quality in both reservoirs was eutrophic [3,5] with visible algal blooms in some areas [4].
However, little study has been done on the phytoplankton community dynamics in these reservoirs.
Currently the traditional morphological observation method using a light microscope is still
commonly used to study the population dynamics of phytoplankton communities in eutrophic water
bodies. It is time consuming and easily influenced by personal error. Some researchers also use high
performance liquid chromatography methods to analyze toxic cyanobacteria blooms, but these
methods needs commercial toxin standards, which are expensive and not easily available [6].
PCR- based denaturing gradient gel electrophoresis (DGGE) is now being used often in cyanobacteria
ecology studies. The PCR-DGGE technique was invented to detect site mutations [7] and incorporated
a microbial ecology method [8]. In the last decade, this technique has been used widely in
environmental microorganism studies [9–12]. Worldwide cyanobacteria bloom events have attracted
researchers to apply PCR-DGGE to study cyanobacteria community composition [13–15]. It is crucial
to choose the most typical gene clusters for PCR amplification and subsequent DGGE analysis.
The most commonly used gene sequences are conservative genes on rRNA, especially on 16S rRNA.
As the intergenic transcribed spacer (ITS) region between 16S-23S rRNA gene is non-coding and
Int. J. Environ. Res. Public 2014, 11 1143
variable, the ITS sequence has become more commonly used in this area [16–18]. In this study, we
applied both an ITS-based PCR-DGGE method and the traditional morphological method to
investigate the cyanobacteria communities in the Tiegang and Shiyan reservoirs of Shenzhen. We also
used Canonical Correspondence Analysis (CCA) to study the relationship between cyanobacteria
community dynamics and environmental factors.
2. Experimental Section
2.1. Sample Collection and Determination of Water Quality
In 2007, surface water samples were collected with a water sampler from the center and outlet of the
Shiyan and Tiegang reservoirs at the beginning of each month. Center and outlet samples were combined
to perform physical-chemical analysis. Transparency was measured with a Secchi disk. Dissolved
oxygen (DO), pH, and temperature were measured in the field with a YSI ProPlus multiparmameter (YSI
Inc., Yellow Springs, OH, USA). Chemical parameters including permanganate index (CODMn), total
nitrogen (TN), ammonia (NH4+-N) and total phosphorus (TP) were determined in the laboratory
according to the National Environmental Quality Standards for Surface Water (GB3838-2002) [19].
Chlorophyll a concentration was measured using an ethanol extraction method modified from
Lorenzen [20].
Phytoplankton samples were collected at the above-mentioned sampling sites and put into 1 L
sample bottles. Lugol’s solution (15 mL) was added to each bottle, and set overnight. Supernatant was
carefully removed, and the final concentrated sample volume was 50 mL. Each sample was vortexed
and one drop of sample was placed on a haemocytometer to be examined under an Olympus-BX51
compound microscope (Olympus, Tokyo, Japan) with 400× magnification. For each sample, five fields
in the haemocytometer were counted and the mean value was used to calculate the biomass.
For colonies or filaments, only the parts within the fields were counted. The phytoplankton biomass
was expressed as cell numbers per liter. For qualitative examination, phytoplankton net #25
(0.064-mm-diameter) tow samples fixed with formaldehyde solution (final concentration 5%) were put
in counting chamber to identify genus or species of bacterium under inverted microscope (Olympus,
Tokyo, Japan) [21].
2.2. DNA Extraction and PCR-DGGE Analysis
Water samples collected from Shiyan and Tiegang reservoirs during July and December 2007 were used
for the ITS based PCR-DGGE analysis. Samples were first filtered through 0.45 μm filter paper and the
filters were then used for DNA extraction with the Wizard Genomic DNA Purification Kit (Promega,
Madison, WI, USA). PCR primers used for this study were CSIF/373R [22] that designed for ITS sequence
of cyanobacteria genome. The sequences of primers were GC-CSIF (5′-G(T/C)C ACG CCC GAA GTC
(G/A)TT AC-3′) and 373R(5′-CTA ACC ACC TGA GCT AAT-3′) with a 40 bp hairpin sequence on
the 5′ (5′-CGC CCG CCG CGC CCC GCG CCC GGCCCG CCG CCC CCG CCC C-3′), size of
the amplification sequence is around 250 bp.
PCR reactions were performed in microcentrifuge tube with total volume of 50 μL containing 8 μL
of 10× buffer (with MgCl2), 1 μL each of reverse and forward primers, 8 μL of dNTP, 0.5 μL of Taq
Int. J. Environ. Res. Public 2014, 11 1144
DNA polymerase, 28.5 μL of double distilled water, 5 μL of BSA, and 1μL of template DNA.
Touchdown PCR amplification performed with 1 cycle of pre-denaturation at 94 °C for 5 min,
23 cycles of touchdown (94 °C for 40 s, 58–55 °C for 30 s with decreasing annealing temperature by
1 °C each consecutive cycle, 72 °C for 30 s), 26 cycles of amplification (94 °C for 40 s, 55 °C for 30 s
and 72 °C for 30 s) and a final extension at 72 °C for 10 min. It was then incubate at 12 °C for 30 min.
DGGE was performed following the protocol provided in the manual for Bio-Rad DCode Universal
Mutation Detection System (Bio-Rad Laboratories, Hercules, CA, USA). Denaturing gradient gel was
8% (wt/vol) polyacrylamide gels in 1× TAE buffer (20 mM Tris-acetate (pH 7.4), 10 mM acetate,
0.5 mM disodium EDTA). The gradient range was 25–45%. Electrophoresis was carried out at 50 V
for 30 min and 120 V for 7 h. Gel was stained for 1 h with 3× GelRed TM Nucleic Acid Gel Stain
(containing 0.1 M NaCl and 30 μL GelRed TM Nucleic Acid Gel Stain, 10,000× in water per100 mL
H2O). Bands on gel were captured using gel image system. A band was considered to be a band when
it provided a signal to noise ratio of over 3:1. After image capture, the gel plug containing a PCR
product was removed with 10 μL pipette tips and placed in 1.5 mL microcentrifuge tube. The gel plug
was then submerged in 50 μL of deionized water and sat at 4 °C overnight. Another DGGE was
performed using excised band and original sample to verify the band. The next day, the solution was
diluted 100× and 1 μL of the diluted extract was used for second PCR amplification (30 cycles,
Ta = 57 °C). The PCR product was directly sequenced. When direct sequencing failed, sequencing was
done after cloning with pUC57 T-vector system according to the manufacturer’s instructions (Takara,
Dalian, China). Again, another DGGE was performed to verify the clone product by running the clone
product with the original sample on one gel. The sequences were compared with GenBank database with
BLAST search. Species was assigned based on the top BLAST hit. DGGE images were analyzed using
software Quantity One (Bio-Rad). After recognition of each band, Un-weighted Pair Group Method
with Arithmetic Averages (UPGMA) analysis was performed. Bands were also quantified and entered
in Excel and used with physical-chemical indices in Canonical Correspondence Analysis (CCA) using
CANOCO (version 4.5), as described in previously published reports [23,24].
3. Results and Discussion
3.1. Eutrophication Levels of Two Reservoirs
Tiegang Reservoir and Shiyan Reservoir are both important drinking water source for Shenzhen.
The rapid economic development and continuous population growth have accelerated eutrophication in
the two reservoirs during the last five years. In this study, nine water quality indices (TN, DO, NH4+-N,
TP, CODMn, pH, temperature, transparency and chlorophyll a) of both reservoirs were monitored
monthly in 2007 and the mean values were shown in Table 1.
Int. J. Environ. Res. Public 2014, 11 1145
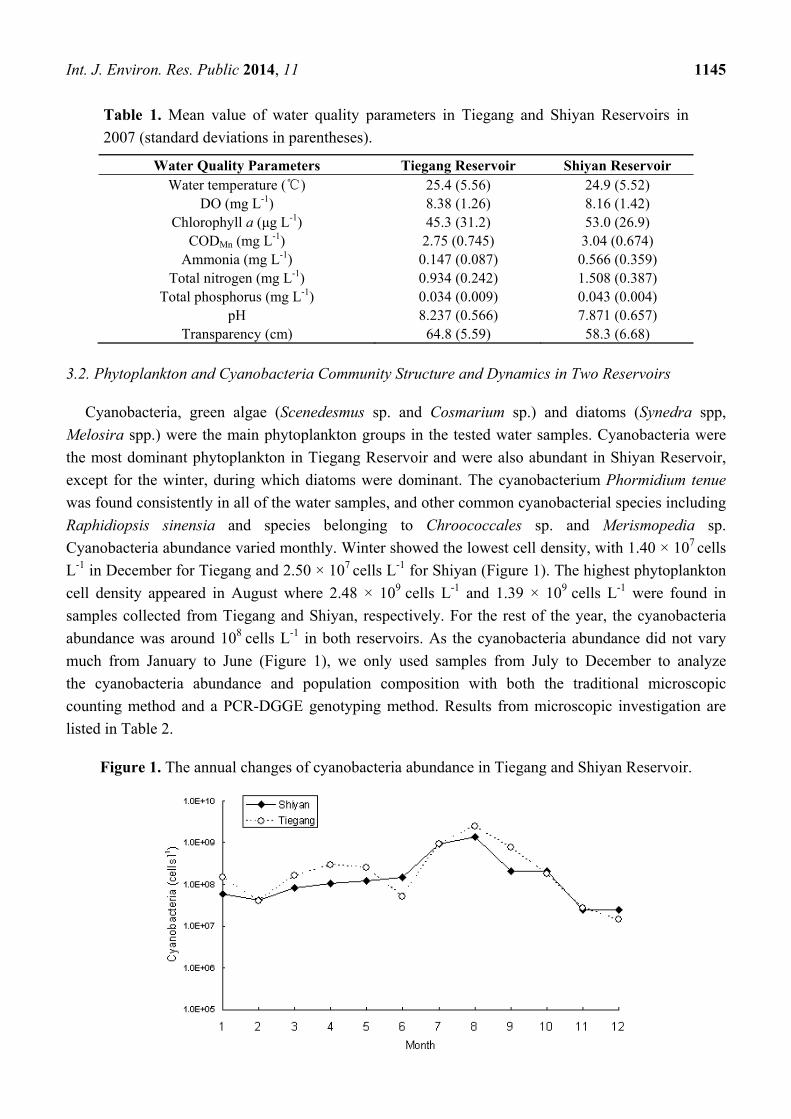
Table 1. Mean value of water quality parameters in Tiegang and Shiyan Reservoirs in
2007 (standard deviations in parentheses).
Water Quality Parameters Tiegang Reservoir Shiyan Reservoir Water temperature (℃) 25.4 (5.56) 24.9 (5.52)
DO (mg L-1) 8.38 (1.26) 8.16 (1.42) Chlorophyll a (μg L-1) 45.3 (31.2) 53.0 (26.9)
CODMn (mg L-1) 2.75 (0.745) 3.04 (0.674) Ammonia (mg L-1) 0.147 (0.087) 0.566 (0.359)
Total nitrogen (mg L-1) 0.934 (0.242) 1.508 (0.387) Total phosphorus (mg L-1) 0.034 (0.009) 0.043 (0.004)
pH 8.237 (0.566) 7.871 (0.657) Transparency (cm) 64.8 (5.59) 58.3 (6.68)
3.2. Phytoplankton and Cyanobacteria Community Structure and Dynamics in Two Reservoirs
Cyanobacteria, green algae (Scenedesmus sp. and Cosmarium sp.) and diatoms (Synedra spp,
Melosira spp.) were the main phytoplankton groups in the tested water samples. Cyanobacteria were
the most dominant phytoplankton in Tiegang Reservoir and were also abundant in Shiyan Reservoir,
except for the winter, during which diatoms were dominant. The cyanobacterium Phormidium tenue
was found consistently in all of the water samples, and other common cyanobacterial species including
Raphidiopsis sinensia and species belonging to Chroococcales sp. and Merismopedia sp.
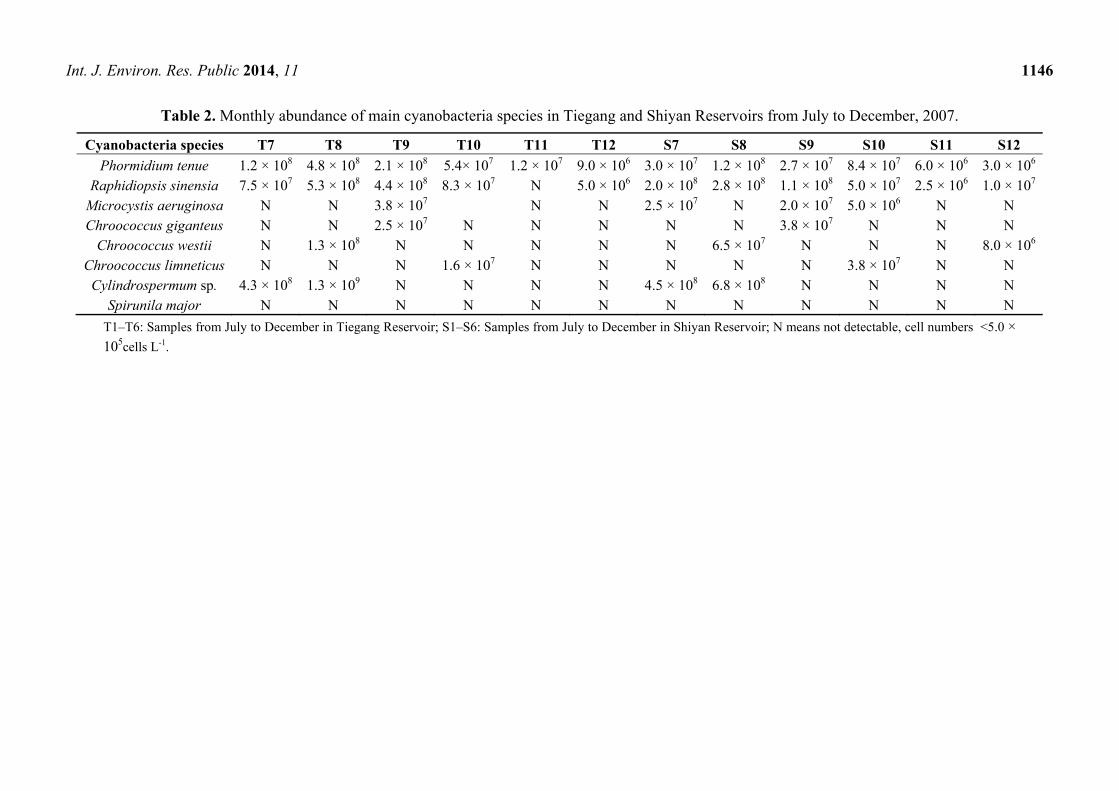
Cyanobacteria abundance varied monthly. Winter showed the lowest cell density, with 1.40 × 10⁷ cells
L-1 in December for Tiegang and 2.50 × 10⁷ cells L-1 for Shiyan (Figure 1). The highest phytoplankton
cell density appeared in August where 2.48 × 10⁹ cells L-1 and 1.39 × 10⁹ cells L-1 were found in
samples collected from Tiegang and Shiyan, respectively. For the rest of the year, the cyanobacteria
abundance was around 108 cells L-1 in both reservoirs. As the cyanobacteria abundance did not vary
much from January to June (Figure 1), we only used samples from July to December to analyze
the cyanobacteria abundance and population composition with both the traditional microscopic
counting method and a PCR-DGGE genotyping method. Results from microscopic investigation are
listed in Table 2.
Figure 1. The annual changes of cyanobacteria abundance in Tiegang and Shiyan Reservoir.
Int. J. Environ. Res. Public 2014, 11 1146
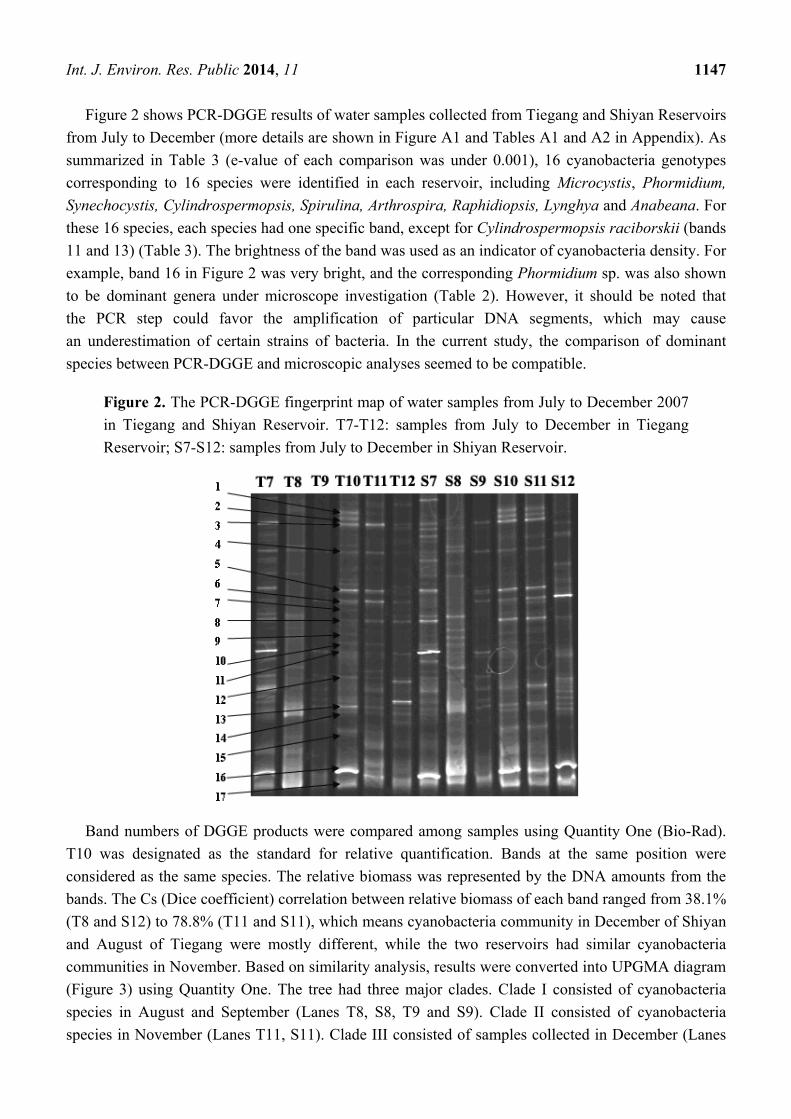
Table 2. Monthly abundance of main cyanobacteria species in Tiegang and Shiyan Reservoirs from July to December, 2007.
Cyanobacteria species T7 T8 T9 T10 T11 T12 S7 S8 S9 S10 S11 S12
Phormidium tenue 1.2 × 10⁸ 4.8 × 10⁸ 2.1 × 10⁸ 5.4× 10⁷ 1.2 × 10⁷ 9.0 × 10⁶ 3.0 × 10⁷ 1.2 × 10⁸ 2.7 × 10⁷ 8.4 × 10⁷ 6.0 × 10⁶ 3.0 × 10⁶ Raphidiopsis sinensia 7.5 × 10⁷ 5.3 × 10⁸ 4.4 × 10⁸ 8.3 × 10⁷ N 5.0 × 10⁶ 2.0 × 10⁸ 2.8 × 10⁸ 1.1 × 10⁸ 5.0 × 10⁷ 2.5 × 10⁶ 1.0 × 10⁷
Microcystis aeruginosa N N 3.8 × 10⁷ N N 2.5 × 10⁷ N 2.0 × 10⁷ 5.0 × 10⁶ N N Chroococcus giganteus N N 2.5 × 10⁷ N N N N N 3.8 × 10⁷ N N N
Chroococcus westii N 1.3 × 10⁸ N N N N N 6.5 × 10⁷ N N N 8.0 × 10⁶ Chroococcus limneticus N N N 1.6 × 10⁷ N N N N N 3.8 × 10⁷ N N
Cylindrospermum sp. 4.3 × 10⁸ 1.3 × 10⁹ N N N N 4.5 × 10⁸ 6.8 × 10⁸ N N N N Spirunila major N N N N N N N N N N N N
T1–T6: Samples from July to December in Tiegang Reservoir; S1–S6: Samples from July to December in Shiyan Reservoir; N means not detectable, cell numbers <5.0 × 10⁵cells L-1.
Int. J. Environ. Res. Public 2014, 11 1147
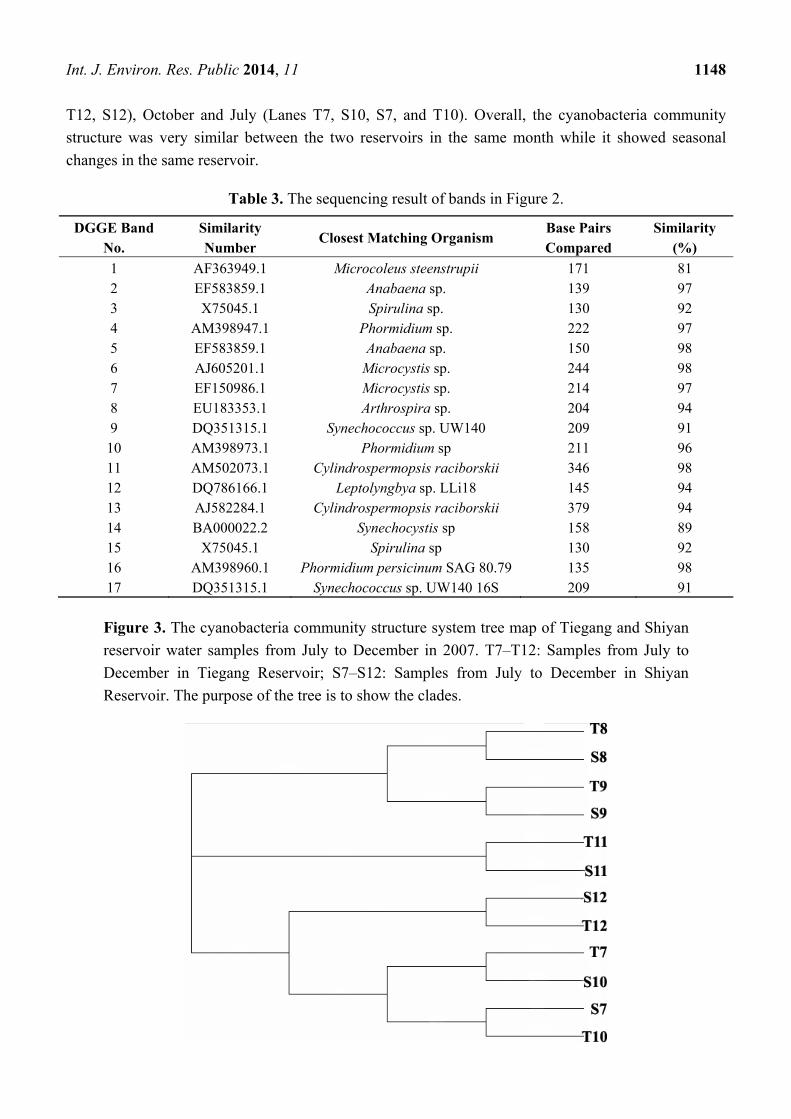
Figure 2 shows PCR-DGGE results of water samples collected from Tiegang and Shiyan Reservoirs
from July to December (more details are shown in Figure A1 and Tables A1 and A2 in Appendix). As
summarized in Table 3 (e-value of each comparison was under 0.001), 16 cyanobacteria genotypes
corresponding to 16 species were identified in each reservoir, including Microcystis, Phormidium,
Synechocystis, Cylindrospermopsis, Spirulina, Arthrospira, Raphidiopsis, Lynghya and Anabeana. For
these 16 species, each species had one specific band, except for Cylindrospermopsis raciborskii (bands
11 and 13) (Table 3). The brightness of the band was used as an indicator of cyanobacteria density. For
example, band 16 in Figure 2 was very bright, and the corresponding Phormidium sp. was also shown
to be dominant genera under microscope investigation (Table 2). However, it should be noted that
the PCR step could favor the amplification of particular DNA segments, which may cause
an underestimation of certain strains of bacteria. In the current study, the comparison of dominant
species between PCR-DGGE and microscopic analyses seemed to be compatible.
Figure 2. The PCR-DGGE fingerprint map of water samples from July to December 2007
in Tiegang and Shiyan Reservoir. T7-T12: samples from July to December in Tiegang
Reservoir; S7-S12: samples from July to December in Shiyan Reservoir.
Band numbers of DGGE products were compared among samples using Quantity One (Bio-Rad).
T10 was designated as the standard for relative quantification. Bands at the same position were
considered as the same species. The relative biomass was represented by the DNA amounts from the
bands. The Cs (Dice coefficient) correlation between relative biomass of each band ranged from 38.1%
(T8 and S12) to 78.8% (T11 and S11), which means cyanobacteria community in December of Shiyan
and August of Tiegang were mostly different, while the two reservoirs had similar cyanobacteria
communities in November. Based on similarity analysis, results were converted into UPGMA diagram
(Figure 3) using Quantity One. The tree had three major clades. Clade I consisted of cyanobacteria
species in August and September (Lanes T8, S8, T9 and S9). Clade II consisted of cyanobacteria
species in November (Lanes T11, S11). Clade III consisted of samples collected in December (Lanes
Int. J. Environ. Res. Public 2014, 11 1148
T12, S12), October and July (Lanes T7, S10, S7, and T10). Overall, the cyanobacteria community
structure was very similar between the two reservoirs in the same month while it showed seasonal
changes in the same reservoir.
Table 3. The sequencing result of bands in Figure 2.
DGGE Band No.
Similarity Number
Closest Matching Organism Base Pairs Compared
Similarity (%)
1 AF363949.1 Microcoleus steenstrupii 171 81 2 EF583859.1 Anabaena sp. 139 97 3 X75045.1 Spirulina sp. 130 92 4 AM398947.1 Phormidium sp. 222 97 5 EF583859.1 Anabaena sp. 150 98 6 AJ605201.1 Microcystis sp. 244 98 7 EF150986.1 Microcystis sp. 214 97 8 EU183353.1 Arthrospira sp. 204 94 9 DQ351315.1 Synechococcus sp. UW140 209 91
10 AM398973.1 Phormidium sp 211 96 11 AM502073.1 Cylindrospermopsis raciborskii 346 98 12 DQ786166.1 Leptolyngbya sp. LLi18 145 94 13 AJ582284.1 Cylindrospermopsis raciborskii 379 94 14 BA000022.2 Synechocystis sp 158 89 15 X75045.1 Spirulina sp 130 92 16 AM398960.1 Phormidium persicinum SAG 80.79 135 98 17 DQ351315.1 Synechococcus sp. UW140 16S 209 91
Figure 3. The cyanobacteria community structure system tree map of Tiegang and Shiyan
reservoir water samples from July to December in 2007. T7–T12: Samples from July to
December in Tiegang Reservoir; S7–S12: Samples from July to December in Shiyan
Reservoir. The purpose of the tree is to show the clades.
Int. J. Environ. Res. Public 2014, 11 1149
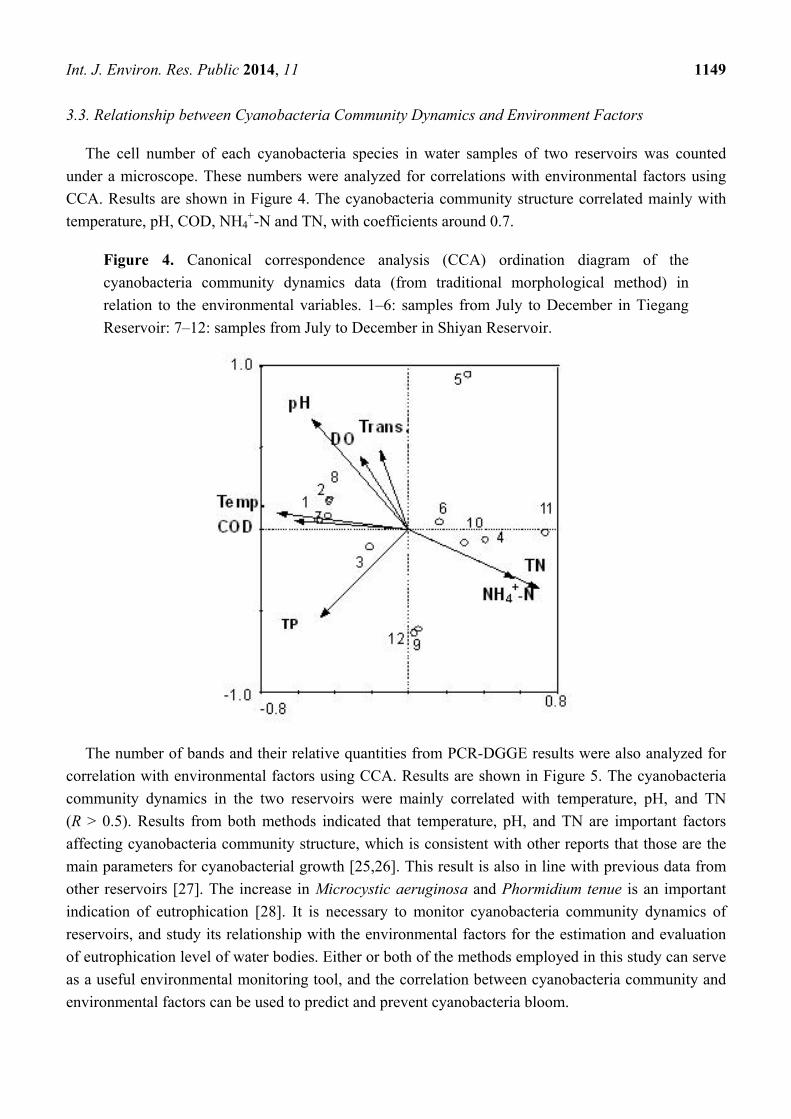
3.3. Relationship between Cyanobacteria Community Dynamics and Environment Factors
The cell number of each cyanobacteria species in water samples of two reservoirs was counted
under a microscope. These numbers were analyzed for correlations with environmental factors using
CCA. Results are shown in Figure 4. The cyanobacteria community structure correlated mainly with
temperature, pH, COD, NH4+-N and TN, with coefficients around 0.7.
Figure 4. Canonical correspondence analysis (CCA) ordination diagram of the
cyanobacteria community dynamics data (from traditional morphological method) in
relation to the environmental variables. 1–6: samples from July to December in Tiegang
Reservoir: 7–12: samples from July to December in Shiyan Reservoir.
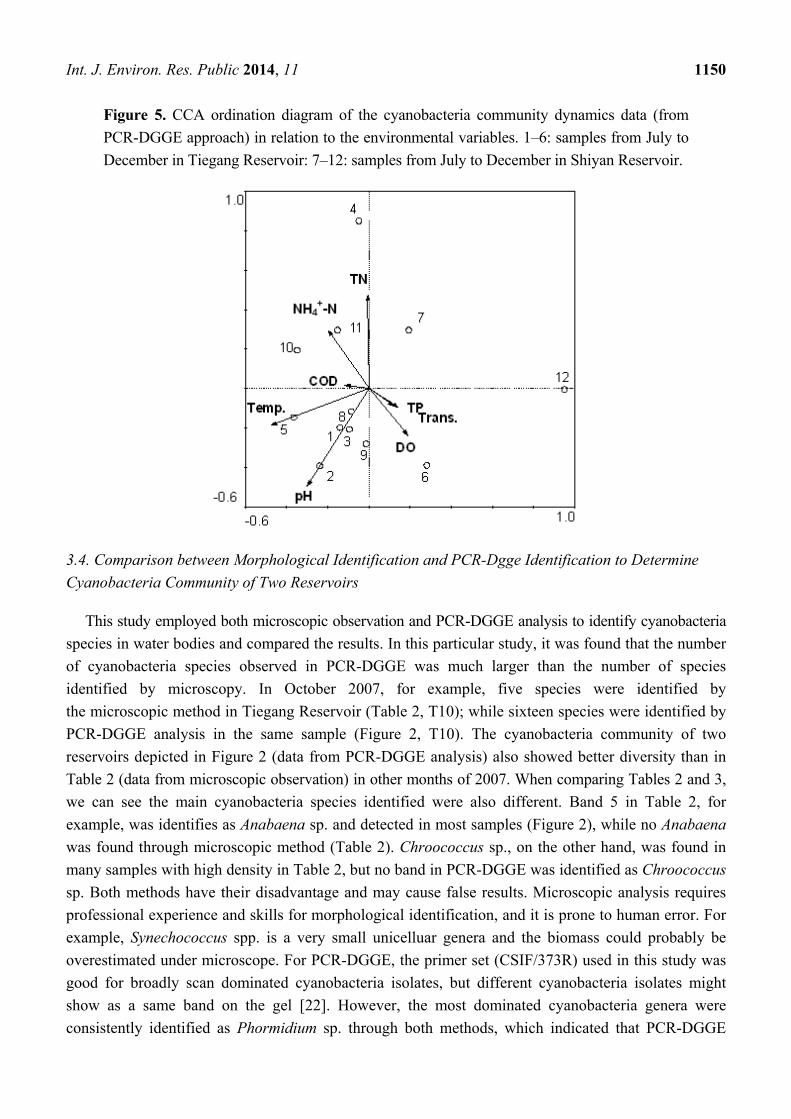
The number of bands and their relative quantities from PCR-DGGE results were also analyzed for
correlation with environmental factors using CCA. Results are shown in Figure 5. The cyanobacteria
community dynamics in the two reservoirs were mainly correlated with temperature, pH, and TN
(R > 0.5). Results from both methods indicated that temperature, pH, and TN are important factors
affecting cyanobacteria community structure, which is consistent with other reports that those are the
main parameters for cyanobacterial growth [25,26]. This result is also in line with previous data from
other reservoirs [27]. The increase in Microcystic aeruginosa and Phormidium tenue is an important
indication of eutrophication [28]. It is necessary to monitor cyanobacteria community dynamics of
reservoirs, and study its relationship with the environmental factors for the estimation and evaluation
of eutrophication level of water bodies. Either or both of the methods employed in this study can serve
as a useful environmental monitoring tool, and the correlation between cyanobacteria community and
environmental factors can be used to predict and prevent cyanobacteria bloom.
Int. J. Environ. Res. Public 2014, 11 1150
Figure 5. CCA ordination diagram of the cyanobacteria community dynamics data (from
PCR-DGGE approach) in relation to the environmental variables. 1–6: samples from July to
December in Tiegang Reservoir: 7–12: samples from July to December in Shiyan Reservoir.
3.4. Comparison between Morphological Identification and PCR-Dgge Identification to Determine
Cyanobacteria Community of Two Reservoirs
This study employed both microscopic observation and PCR-DGGE analysis to identify cyanobacteria
species in water bodies and compared the results. In this particular study, it was found that the number
of cyanobacteria species observed in PCR-DGGE was much larger than the number of species
identified by microscopy. In October 2007, for example, five species were identified by
the microscopic method in Tiegang Reservoir (Table 2, T10); while sixteen species were identified by
PCR-DGGE analysis in the same sample (Figure 2, T10). The cyanobacteria community of two
reservoirs depicted in Figure 2 (data from PCR-DGGE analysis) also showed better diversity than in
Table 2 (data from microscopic observation) in other months of 2007. When comparing Tables 2 and 3,
we can see the main cyanobacteria species identified were also different. Band 5 in Table 2, for
example, was identifies as Anabaena sp. and detected in most samples (Figure 2), while no Anabaena
was found through microscopic method (Table 2). Chroococcus sp., on the other hand, was found in
many samples with high density in Table 2, but no band in PCR-DGGE was identified as Chroococcus
sp. Both methods have their disadvantage and may cause false results. Microscopic analysis requires
professional experience and skills for morphological identification, and it is prone to human error. For
example, Synechococcus spp. is a very small unicelluar genera and the biomass could probably be
overestimated under microscope. For PCR-DGGE, the primer set (CSIF/373R) used in this study was
good for broadly scan dominated cyanobacteria isolates, but different cyanobacteria isolates might
show as a same band on the gel [22]. However, the most dominated cyanobacteria genera were
consistently identified as Phormidium sp. through both methods, which indicated that PCR-DGGE
Int. J. Environ. Res. Public 2014, 11 1151
could objectively reflect main cyanobacteria community dynamics compared with morphological
identification. Pyrosequencing is another tool to perform similar analysis. With the steady decrease of
the cost, this technique may be an alternative or complementary tool for environmental analysis, such
as the one described here. It will certainly improve the reliability of the data.
3.4. Reliability of CCA Based on PCR-DGGE Data
In most microbiology studies, it is common to use relative quantity data of PCR-DGGE bands to
perform CCA [24,29,30]. However, it is not always possible to confirm the correlation between
the relative quantity of DNA bands with the exact number of bacteria because large number of bacteria
exists in water samples and not all of them could be isolated and identified with morphological
methods. It is relatively easier to quantify and identify cyanobacteria species with morphological
methods, so in this study we used data from both PCR-DGGE analysis and a morphological method to
perform CCA in relation to environmental factors. This provides a good chance to check
the reliability of CCA based on PCR-DGGE data of cyanobacteria. Results suggested that
the cyanobacteria community dynamics determined by traditional morphological method showed
better correlation coefficients with temperature, pH, TN and other environmental factors, such as COD
and NH4+-N (Figure 4). Results of CCA from PCR-DGGE data was largely in accordance with
Figure 4 in terms of the correlation with temperature and TN. However, there were also obvious
differences when comparing Figure 4 with Figure 5. For example, CCA results from PCR-DGGE
could not identify the close correlation between cyanobacteria community and COD and NH4+-N.
The lower correlation coefficient from PCR-DGGE data might be due to the DNA band intensity
cannot accurately reflect the quantity of the relevant species. Moreover, the sample distribution in
the CCA analysis was also different (Figures 4 and 5). In general, the relative quantification of
cyanobacteria with PCR-DGGE method using CSIF/373R primers can be applied in CCA as
a reference tool to seek the correlation with environmental factors of water bodies in reservoir.
However, results need be calibrated and verified by traditional morphological methods.
4. Conclusions
We investigated the cyanobacteria community composition in eutrophic water samples with both
the PCR-DGGE method and the traditional microscopic examination method. Both methods provided
useful information and most results were comparable. Both reservoirs were dominated with
cyanobacteria during the summer months, with temperature, precipitation, TN and pH as the main
factors correlated with cyanobacteria abundance. As a tool to study cyanobacteria communities,
PCR-DGGE does have its drawbacks, for example, no primers could amplify specific DNA bands
from all cyanobacterial species, and cyanobacteria DNA sequences in GenBank are limited. Currently,
PCR-DGGE analysis can be used as a semi-quantitative tool to identify algal species, and with the
combination of traditional morphological methods, it could effectively monitor community dynamics of
cyanobacteria in reservoirs.
Int. J. Environ. Res. Public 2014, 11 1152
Acknowledgments
This study was supported by the National Natural Science Foundation of China (Grant No. 41176106,
31200092, 31170491), Guangdong Enterprise Academician Workstation (Grant No. 2011A090700015)
and Shenzhen Grant Plan for Science and Technology to Zhangli Hu.
Conflicts of Interest
The authors declare no conflict of interest.
References
1. Fogg, G.E. Harmful algae—A perspective. Harmful Algae 2002, 1, 1–4.
2. Zhou, H.; Peng, W. Water Pollution and Aquatic Environment Restoration. Chemical Industry
Press: Beijing, China, 2005.
3. Tao, J.; Liu, Z.; Chen, X.; Wang, Z.; Shi, L.; Zhang, L. Assessment of reservoir eutrophication in
Guangdong Province. J. Lake Sci. 2005, 17, 378–382.
4. Wen, M.; Fang, G.; Chen, C.; Li, X. Pollution and prevention measures of Shiyan Reservoir in
Shenzhen city. Trop. Geogr. 2009, 1, 5–10.
5. Xu, N.; Duan, S.; Lin, Q.; Hu, R.; Han, B. Analysis on nitrogen pollution and eutrophication of
the large and medium reservoirs for water supply in Guangdong Province. Chin. J. Ecol. 2004, 3,
63–67.
6. Li, Y.; Yuan, B. Investigation of microcystin-LR and identification of toxic algae strains in a
reservoir. J. Fujian Norm. Univ. 2005, 21, 52–55.
7. Fischer, S.G.; Lerman, L.S. DNA fragments differing by single base-pair substitutions are
separated in denaturing gradient gels: correspondence with melting theory. Proc. Natl. Acad. Sci.
1983, 80, 1579–1583.
8. Muyzer, G.; de Waal, E.C.; Uittrlinden, A.G. Profiling of complex microbial populations by
denaturing gradient gel electrophoresis analysis of polymerase chain reaction amplified genes
coding for 16S rRNA. Appl. Environ. Microbiol. 1993, 59, 695–701.
9. Wawer, C.; Jetten, M.S.; Muyzer, G. Genetic diversity and expression of the [NiFe] hydrogenase
large-subunit gene of Desulfovibrio spp. in environmental samples. Appl. Environ. Microbiol.
1997, 63, 4360–4369.
10. Santegoeds, C.M.; Nold, S.C.; Ward, D.M. Denaturing gradient gel electrophoresis used to
monitor the enrichment culture of aerobic chemoorganotrophic bacteria from a hot spring
cyanobacterial mat. Appl. Environ. Microbiol. 1996, 62, 3922–3928.
11. Komatsoulis, G.A.; Waterman, M.S. A new computational method for detection of chimeric
16S rRNA artifacts generated by PCR amplification from mixed bacterial populations.
Appl. Environ. Microbiol. 1997, 63, 2338–2346.
12. Head, I.M.; Saunders, J.R. Microbial evolution, diversity and ecology: A decade of ribosomal
RNA analysis of uncultivated microorganisms. Microb. Ecol. 1998, 35, 1–21.
13. Boutte, C.; Grubisic, S.; Balthasart, P.; Wilmotte, A. Testing of primers for the study of
cyanobacterial molecular diversity by DGGE. J. Microbiol. Meth. 2006, 65, 542–550.
Int. J. Environ. Res. Public 2014, 11 1153
14. Zwart, G.; Kamst-van Agterveld, M.P.; van der Werff-Staverman, I.; Hagen, F.; Hoogyeld, H.L.;
Gons, H.J. Molecular characterization of cyanobacterial diversity in a shallow eutrophic lake.
Environ. Microbiol. 2005, 7, 365–377.
15. Jing, H.; Aitchison, J.C.; Lacap, D.C.; Peerapornpisal, Y.; Sompong, U.; Pointing, S.B.
Community phylogenetic analysis of moderately thermophilic cyanobacterial mats from China,
the Philippines and Thailand. Extremophiles 2005, 9, 325–332.
16. Nübel, U.; Garcia-Pichel, F.; Muyzer, G. PCR primers to amplify 16S rRNA genes from
cyanobacteria. Appl. Environ. Microbiol. 1997, 63, 3327–3332.
17. Lu, W.; Evans, E.H.; McColl, S.M.; Saunders, V.A. Identification of cyanobacteria by
polymorphisms of PCR-amplified ribosomal DNA spacer region. FEMS Microbiol. Lett. 1997,
153, 141–149.
18. Otsuka, S.; Suda, S.; Li, R.; Watanabe, M.; Oyaizu, H.; Matsumoto, S.; Watanabe, M.M.
Phylogenetic relationships between toxic and non-toxic strains of the genus Microcystis based on
16S to 23S internal transcribed spacer sequence. FEMS Microbiol. Lett. 1999, 172, 15–21.
19. State Environmental Protection Administration of China. Environmental Quality Standard for
Surface Water GB3838-2002; China Environmental Science Press: Beijing, China, 2002.
20. Determination of Chlorophylls and Pheo-Pigments: Spectrophotometric Equations. Available
online: http://aslo.org/lo/toc/vol_12/issue_2/0343.pdf (accessed on 9 January 2014).
21. Hu, H.; Li, Y.; Wei, Y.; Zhu, H.; Chen, J.; Shi, Z. Freshwater Algae in China. Shanghai Science
and Technology Press: Shanghai, China, 1980.
22. Janse, I.; Meima, M.; Kardinaal, W.E.A.; Zwart, G. High-resolution differentiation of
cyanobacteria by using rRNA-internal transcribed spacer denaturing gradient gel electrophoresis.
Appl. Environ. Microbiol. 2003, 69, 6634–6643.
23. Ter Braak, C.J.F. The Analysis of Vegetation-Environment Relationships by Canonical
Correspondence Analysis. In Theory and Models in Vegetation Science; Prentice, I.C., van der
Maarel, E., Eds.; Springer Netherlands: Dordrecht, The Netherlands, 1987, pp. 69–77.
24. Yan, Q.; Yu, Y.; Feng, W.; Yu, Z.; Chen, H. Plankton community composition in the Three
Gorges Reservoir Region revealed by PCR-DGGE and its relationships with environmental
factors. J. Environ. Sci. 2008, 20, 732–738.
25. Shapiro, J. The role of carbon dioxide in the initiation and maintenance of blue-green dominance
in lakes. Freshw. Biol. 1997, 37, 307–323.
26. Huisman, J.; Hulot, F.D. Population Dynamics of Harmful Cyanobacteria. In Harmful
Cyanobacteria; Huisman, J., Mattehijs, H.C.P., Visser P.M., Eds.; Springer Verlag: Berlin,
Germany, 2005, pp.143–176.
27. Lin, Q.; Lei, L.; Han, B. Cyanophyta in south subtropical reservoirs with different trophic levels.
Chin. J. Ecol. 2007, 7, 1027–1033.
28. Reynolds, C.S.; Huszar, V.; Kruk, C.; Naselli-Flores, L.; Melo, S. Towards a functional
classification of the freshwater phytoplankton. J. Plankton Res. 2002, 24, 417–428.
29. Schauer, M.; Massana, R.; Pedros-Allo, C. Spatial differences in bacterioplankton composition
along the Catalan coast (NW Mediterranean) assessed by molecular fingerprinting. FEMS
Microbiol. Ecol. 2000, 33, 51–59.

Int. J. Environ. Res. Public 2014, 11 1154
30. Jackson, C.R.; Churchill, P.F.; Roden, E.E. Successional changes in bacterial assemblage
structure during epilithic biofilm development. Ecology 2001, 82, 555–566.
Appendix
Figure A1. Larger PCR-DGGE fingerprint map for sequencing. Lanes 1-6: samples from
July to December in Tiegang Reservoir; Lanes 7-12: samples from July to December in
Shiyan Reservoir.
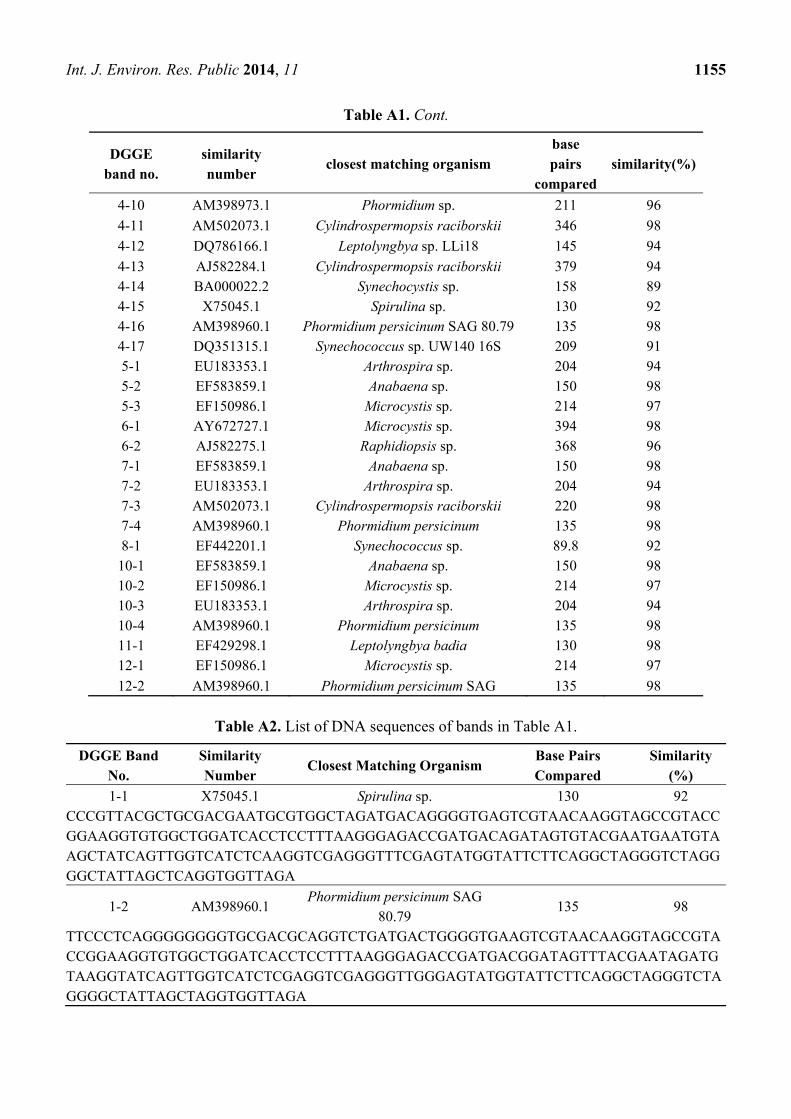
Table A1. List of sequencing results from DGGE bands on Figure A1.
DGGE band no.
similarity number
closest matching organism base pairs compared
similarity(%)
1-1 X75045.1 Spirulina sp. 130 92
1-2 AM398960.1 Phormidium persicinum SAG
80.79 135 98
2-1 BA000022.2 Synechocystis sp. 158 89
4-1 AF363949.1 Microcoleus steenstrupii 171 81
4-2 EF583859.1 Anabaena sp. 139 97
4-3 X75045.1 Spirulina sp. 130 92
4-4 AM398947.1 Phormidium sp. 222 97 4-5 EF583859.1 Anabaena sp. 150 98
4-6 AJ605201.1 Microcystis sp. 244 98
4-7 EF150986.1 Microcystis sp. 214 97
4-8 EU183353.1 Arthrospira sp. 204 94
4-9 DQ351315.1 Synechococcus sp. UW140 209 91
Int. J. Environ. Res. Public 2014, 11 1155
Table A1. Cont.
DGGE band no.
similarity number
closest matching organism base pairs
compared similarity(%)
4-10 AM398973.1 Phormidium sp. 211 96
4-11 AM502073.1 Cylindrospermopsis raciborskii 346 98
4-12 DQ786166.1 Leptolyngbya sp. LLi18 145 94
4-13 AJ582284.1 Cylindrospermopsis raciborskii 379 94 4-14 BA000022.2 Synechocystis sp. 158 89 4-15 X75045.1 Spirulina sp. 130 92 4-16 AM398960.1 Phormidium persicinum SAG 80.79 135 98 4-17 DQ351315.1 Synechococcus sp. UW140 16S 209 91 5-1 EU183353.1 Arthrospira sp. 204 94 5-2 EF583859.1 Anabaena sp. 150 98 5-3 EF150986.1 Microcystis sp. 214 97 6-1 AY672727.1 Microcystis sp. 394 98 6-2 AJ582275.1 Raphidiopsis sp. 368 96 7-1 EF583859.1 Anabaena sp. 150 98 7-2 EU183353.1 Arthrospira sp. 204 94 7-3 AM502073.1 Cylindrospermopsis raciborskii 220 98 7-4 AM398960.1 Phormidium persicinum 135 98 8-1 EF442201.1 Synechococcus sp. 89.8 92
10-1 EF583859.1 Anabaena sp. 150 98 10-2 EF150986.1 Microcystis sp. 214 97 10-3 EU183353.1 Arthrospira sp. 204 94 10-4 AM398960.1 Phormidium persicinum 135 98 11-1 EF429298.1 Leptolyngbya badia 130 98 12-1 EF150986.1 Microcystis sp. 214 97
12-2 AM398960.1 Phormidium persicinum SAG 135 98
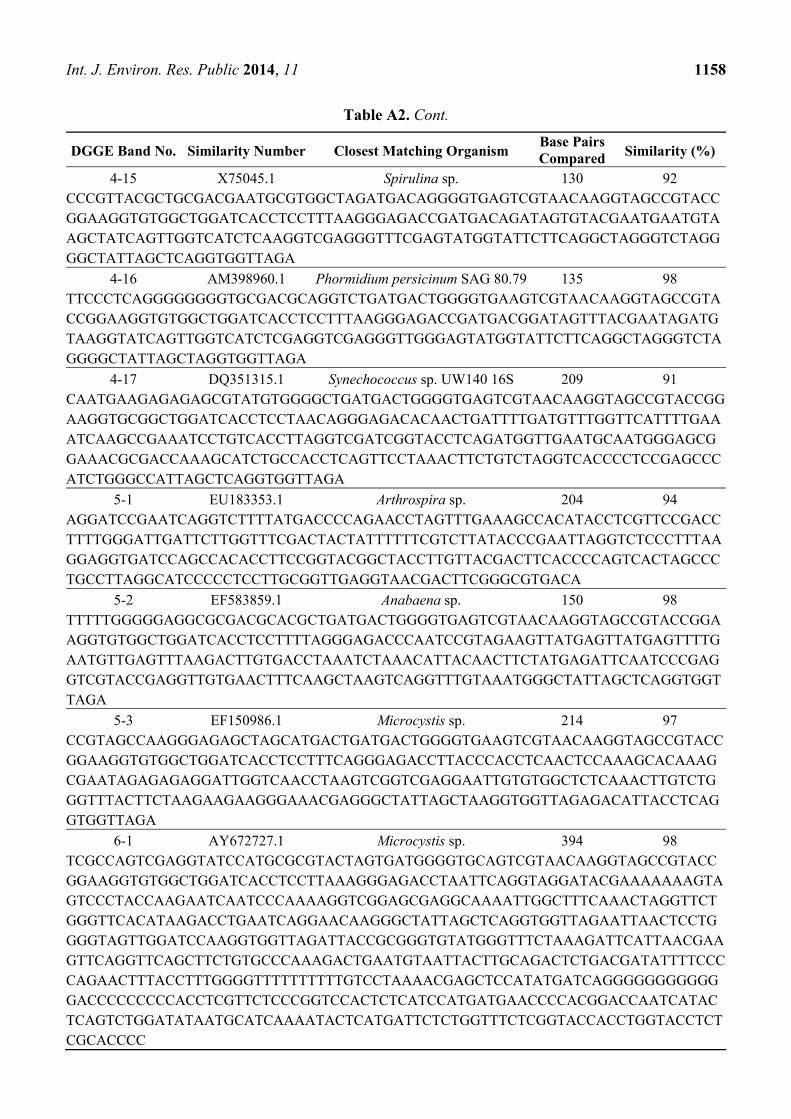
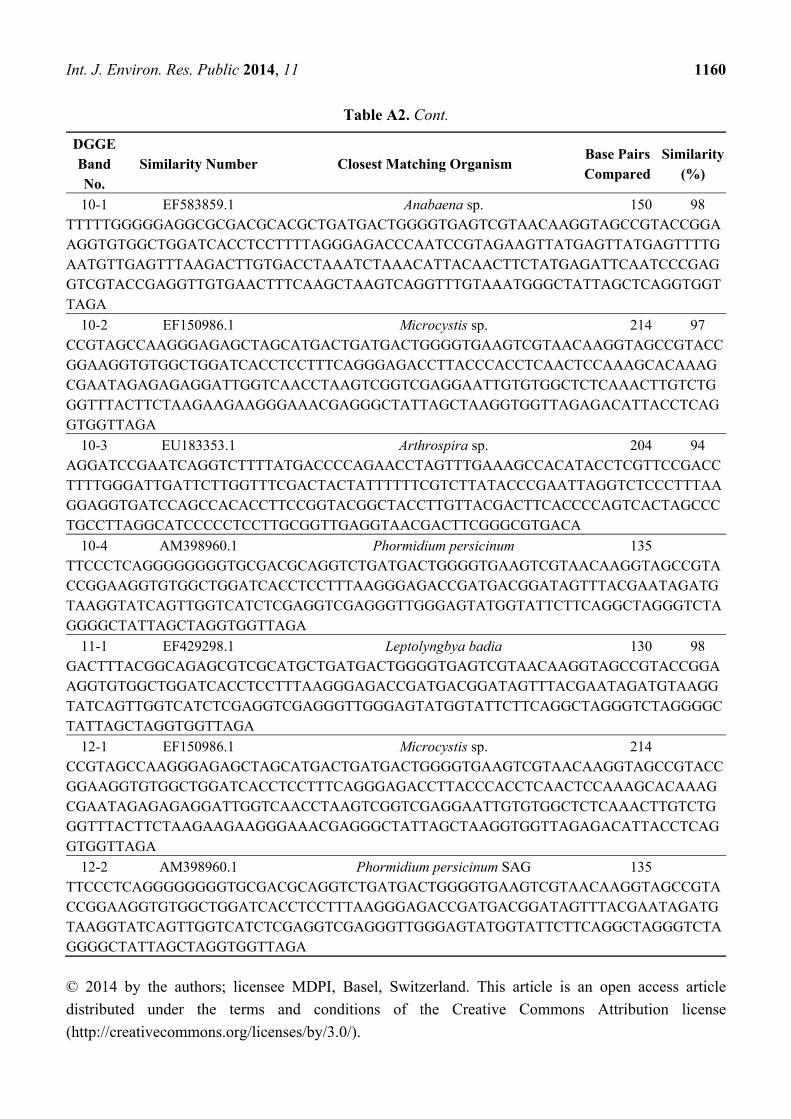
Table A2. List of DNA sequences of bands in Table A1.
DGGE Band No.
Similarity Number
Closest Matching Organism Base Pairs Compared
Similarity (%)
1-1 X75045.1 Spirulina sp. 130 92 CCCGTTACGCTGCGACGAATGCGTGGCTAGATGACAGGGGTGAGTCGTAACAAGGTAGCCGTACCGGAAGGTGTGGCTGGATCACCTCCTTTAAGGGAGACCGATGACAGATAGTGTACGAATGAATGTAAGCTATCAGTTGGTCATCTCAAGGTCGAGGGTTTCGAGTATGGTATTCTTCAGGCTAGGGTCTAGGGGCTATTAGCTCAGGTGGTTAGA
1-2 AM398960.1 Phormidium persicinum SAG
80.79 135 98
TTCCCTCAGGGGGGGGTGCGACGCAGGTCTGATGACTGGGGTGAAGTCGTAACAAGGTAGCCGTACCGGAAGGTGTGGCTGGATCACCTCCTTTAAGGGAGACCGATGACGGATAGTTTACGAATAGATGTAAGGTATCAGTTGGTCATCTCGAGGTCGAGGGTTGGGAGTATGGTATTCTTCAGGCTAGGGTCTAGGGGCTATTAGCTAGGTGGTTAGA
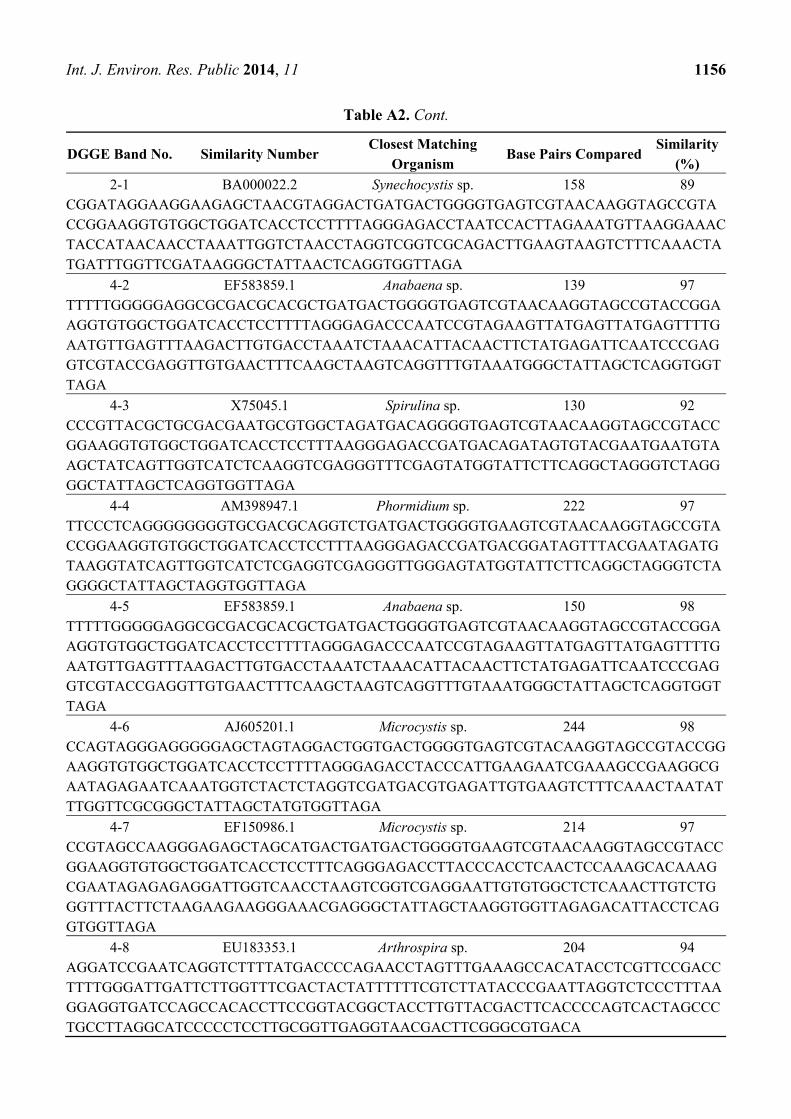
Int. J. Environ. Res. Public 2014, 11 1156
Table A2. Cont.
DGGE Band No. Similarity Number Closest Matching
Organism Base Pairs Compared
Similarity (%)
2-1 BA000022.2 Synechocystis sp. 158 89 CGGATAGGAAGGAAGAGCTAACGTAGGACTGATGACTGGGGTGAGTCGTAACAAGGTAGCCGTACCGGAAGGTGTGGCTGGATCACCTCCTTTTAGGGAGACCTAATCCACTTAGAAATGTTAAGGAAACTACCATAACAACCTAAATTGGTCTAACCTAGGTCGGTCGCAGACTTGAAGTAAGTCTTTCAAACTATGATTTGGTTCGATAAGGGCTATTAACTCAGGTGGTTAGA
4-2 EF583859.1 Anabaena sp. 139 97 TTTTTGGGGGAGGCGCGACGCACGCTGATGACTGGGGTGAGTCGTAACAAGGTAGCCGTACCGGAAGGTGTGGCTGGATCACCTCCTTTTAGGGAGACCCAATCCGTAGAAGTTATGAGTTATGAGTTTTGAATGTTGAGTTTAAGACTTGTGACCTAAATCTAAACATTACAACTTCTATGAGATTCAATCCCGAGGTCGTACCGAGGTTGTGAACTTTCAAGCTAAGTCAGGTTTGTAAATGGGCTATTAGCTCAGGTGGTTAGA
4-3 X75045.1 Spirulina sp. 130 92 CCCGTTACGCTGCGACGAATGCGTGGCTAGATGACAGGGGTGAGTCGTAACAAGGTAGCCGTACCGGAAGGTGTGGCTGGATCACCTCCTTTAAGGGAGACCGATGACAGATAGTGTACGAATGAATGTAAGCTATCAGTTGGTCATCTCAAGGTCGAGGGTTTCGAGTATGGTATTCTTCAGGCTAGGGTCTAGGGGCTATTAGCTCAGGTGGTTAGA
4-4 AM398947.1 Phormidium sp. 222 97 TTCCCTCAGGGGGGGGTGCGACGCAGGTCTGATGACTGGGGTGAAGTCGTAACAAGGTAGCCGTACCGGAAGGTGTGGCTGGATCACCTCCTTTAAGGGAGACCGATGACGGATAGTTTACGAATAGATGTAAGGTATCAGTTGGTCATCTCGAGGTCGAGGGTTGGGAGTATGGTATTCTTCAGGCTAGGGTCTAGGGGCTATTAGCTAGGTGGTTAGA
4-5 EF583859.1 Anabaena sp. 150 98 TTTTTGGGGGAGGCGCGACGCACGCTGATGACTGGGGTGAGTCGTAACAAGGTAGCCGTACCGGAAGGTGTGGCTGGATCACCTCCTTTTAGGGAGACCCAATCCGTAGAAGTTATGAGTTATGAGTTTTGAATGTTGAGTTTAAGACTTGTGACCTAAATCTAAACATTACAACTTCTATGAGATTCAATCCCGAGGTCGTACCGAGGTTGTGAACTTTCAAGCTAAGTCAGGTTTGTAAATGGGCTATTAGCTCAGGTGGTTAGA
4-6 AJ605201.1 Microcystis sp. 244 98 CCAGTAGGGAGGGGGAGCTAGTAGGACTGGTGACTGGGGTGAGTCGTACAAGGTAGCCGTACCGGAAGGTGTGGCTGGATCACCTCCTTTTAGGGAGACCTACCCATTGAAGAATCGAAAGCCGAAGGCGAATAGAGAATCAAATGGTCTACTCTAGGTCGATGACGTGAGATTGTGAAGTCTTTCAAACTAATATTTGGTTCGCGGGCTATTAGCTATGTGGTTAGA
4-7 EF150986.1 Microcystis sp. 214 97 CCGTAGCCAAGGGAGAGCTAGCATGACTGATGACTGGGGTGAAGTCGTAACAAGGTAGCCGTACCGGAAGGTGTGGCTGGATCACCTCCTTTCAGGGAGACCTTACCCACCTCAACTCCAAAGCACAAAGCGAATAGAGAGAGGATTGGTCAACCTAAGTCGGTCGAGGAATTGTGTGGCTCTCAAACTTGTCTGGGTTTACTTCTAAGAAGAAGGGAAACGAGGGCTATTAGCTAAGGTGGTTAGAGACATTACCTCAGGTGGTTAGA
4-8 EU183353.1 Arthrospira sp. 204 94 AGGATCCGAATCAGGTCTTTTATGACCCCAGAACCTAGTTTGAAAGCCACATACCTCGTTCCGACCTTTTGGGATTGATTCTTGGTTTCGACTACTATTTTTTCGTCTTATACCCGAATTAGGTCTCCCTTTAAGGAGGTGATCCAGCCACACCTTCCGGTACGGCTACCTTGTTACGACTTCACCCCAGTCACTAGCCCTGCCTTAGGCATCCCCCTCCTTGCGGTTGAGGTAACGACTTCGGGCGTGACA
Int. J. Environ. Res. Public 2014, 11 1157
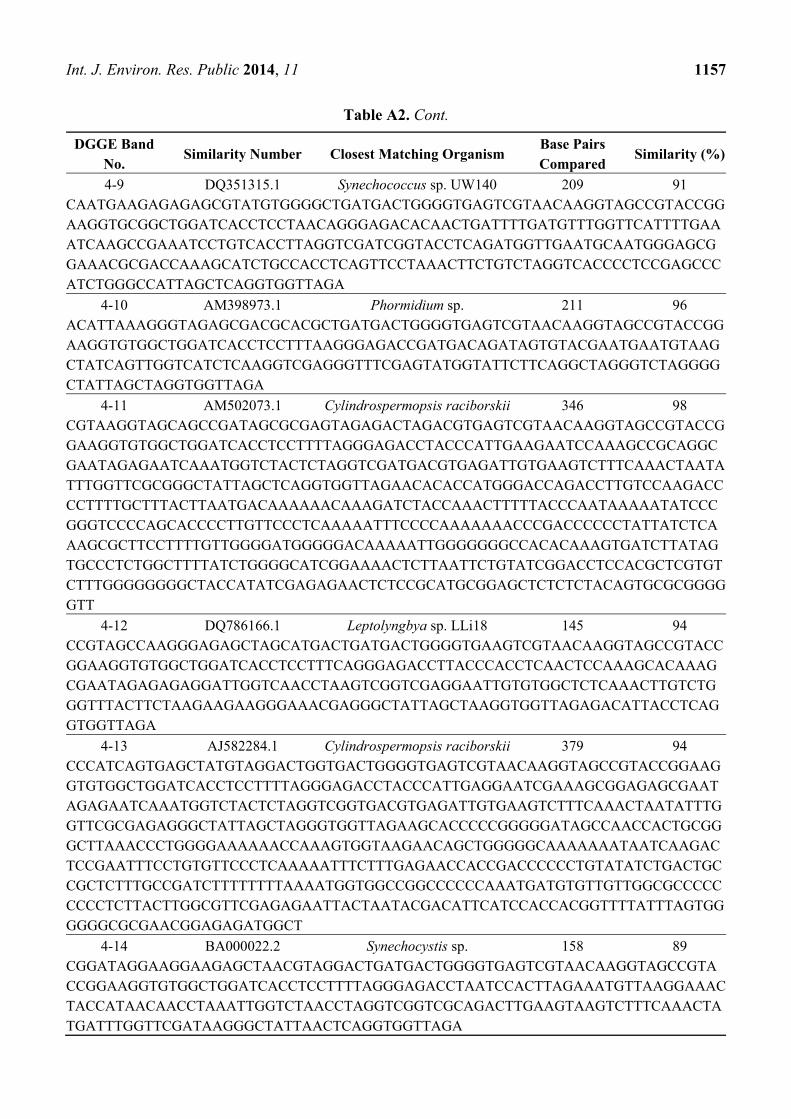
Table A2. Cont.
DGGE Band No.
Similarity Number Closest Matching OrganismBase Pairs Compared
Similarity (%)
4-9 DQ351315.1 Synechococcus sp. UW140 209 91 CAATGAAGAGAGAGCGTATGTGGGGCTGATGACTGGGGTGAGTCGTAACAAGGTAGCCGTACCGGAAGGTGCGGCTGGATCACCTCCTAACAGGGAGACACAACTGATTTTGATGTTTGGTTCATTTTGAAATCAAGCCGAAATCCTGTCACCTTAGGTCGATCGGTACCTCAGATGGTTGAATGCAATGGGAGCGGAAACGCGACCAAAGCATCTGCCACCTCAGTTCCTAAACTTCTGTCTAGGTCACCCCTCCGAGCCCATCTGGGCCATTAGCTCAGGTGGTTAGA
4-10 AM398973.1 Phormidium sp. 211 96 ACATTAAAGGGTAGAGCGACGCACGCTGATGACTGGGGTGAGTCGTAACAAGGTAGCCGTACCGGAAGGTGTGGCTGGATCACCTCCTTTAAGGGAGACCGATGACAGATAGTGTACGAATGAATGTAAGCTATCAGTTGGTCATCTCAAGGTCGAGGGTTTCGAGTATGGTATTCTTCAGGCTAGGGTCTAGGGGCTATTAGCTAGGTGGTTAGA
4-11 AM502073.1 Cylindrospermopsis raciborskii 346 98 CGTAAGGTAGCAGCCGATAGCGCGAGTAGAGACTAGACGTGAGTCGTAACAAGGTAGCCGTACCGGAAGGTGTGGCTGGATCACCTCCTTTTAGGGAGACCTACCCATTGAAGAATCCAAAGCCGCAGGCGAATAGAGAATCAAATGGTCTACTCTAGGTCGATGACGTGAGATTGTGAAGTCTTTCAAACTAATATTTGGTTCGCGGGCTATTAGCTCAGGTGGTTAGAACACACCATGGGACCAGACCTTGTCCAAGACCCCTTTTGCTTTACTTAATGACAAAAAACAAAGATCTACCAAACTTTTTACCCAATAAAAATATCCCGGGTCCCCAGCACCCCTTGTTCCCTCAAAAATTTCCCCAAAAAAACCCGACCCCCCTATTATCTCAAAGCGCTTCCTTTTGTTGGGGATGGGGGACAAAAATTGGGGGGGCCACACAAAGTGATCTTATAGTGCCCTCTGGCTTTTATCTGGGGCATCGGAAAACTCTTAATTCTGTATCGGACCTCCACGCTCGTGTCTTTGGGGGGGGCTACCATATCGAGAGAACTCTCCGCATGCGGAGCTCTCTCTACAGTGCGCGGGGGTT
4-12 DQ786166.1 Leptolyngbya sp. LLi18 145 94 CCGTAGCCAAGGGAGAGCTAGCATGACTGATGACTGGGGTGAAGTCGTAACAAGGTAGCCGTACCGGAAGGTGTGGCTGGATCACCTCCTTTCAGGGAGACCTTACCCACCTCAACTCCAAAGCACAAAGCGAATAGAGAGAGGATTGGTCAACCTAAGTCGGTCGAGGAATTGTGTGGCTCTCAAACTTGTCTGGGTTTACTTCTAAGAAGAAGGGAAACGAGGGCTATTAGCTAAGGTGGTTAGAGACATTACCTCAGGTGGTTAGA
4-13 AJ582284.1 Cylindrospermopsis raciborskii 379 94 CCCATCAGTGAGCTATGTAGGACTGGTGACTGGGGTGAGTCGTAACAAGGTAGCCGTACCGGAAGGTGTGGCTGGATCACCTCCTTTTAGGGAGACCTACCCATTGAGGAATCGAAAGCGGAGAGCGAATAGAGAATCAAATGGTCTACTCTAGGTCGGTGACGTGAGATTGTGAAGTCTTTCAAACTAATATTTGGTTCGCGAGAGGGCTATTAGCTAGGGTGGTTAGAAGCACCCCCGGGGGATAGCCAACCACTGCGGGCTTAAACCCTGGGGAAAAAACCAAAGTGGTAAGAACAGCTGGGGGCAAAAAAATAATCAAGACTCCGAATTTCCTGTGTTCCCTCAAAAATTTCTTTGAGAACCACCGACCCCCCTGTATATCTGACTGCCGCTCTTTGCCGATCTTTTTTTTAAAATGGTGGCCGGCCCCCCAAATGATGTGTTGTTGGCGCCCCCCCCCTCTTACTTGGCGTTCGAGAGAATTACTAATACGACATTCATCCACCACGGTTTTATTTAGTGGGGGGCGCGAACGGAGAGATGGCT
4-14 BA000022.2 Synechocystis sp. 158 89 CGGATAGGAAGGAAGAGCTAACGTAGGACTGATGACTGGGGTGAGTCGTAACAAGGTAGCCGTACCGGAAGGTGTGGCTGGATCACCTCCTTTTAGGGAGACCTAATCCACTTAGAAATGTTAAGGAAACTACCATAACAACCTAAATTGGTCTAACCTAGGTCGGTCGCAGACTTGAAGTAAGTCTTTCAAACTATGATTTGGTTCGATAAGGGCTATTAACTCAGGTGGTTAGA
Int. J. Environ. Res. Public 2014, 11 1158
Table A2. Cont.
DGGE Band No. Similarity Number Closest Matching Organism Base Pairs Compared Similarity (%)
4-15 X75045.1 Spirulina sp. 130 92 CCCGTTACGCTGCGACGAATGCGTGGCTAGATGACAGGGGTGAGTCGTAACAAGGTAGCCGTACCGGAAGGTGTGGCTGGATCACCTCCTTTAAGGGAGACCGATGACAGATAGTGTACGAATGAATGTAAGCTATCAGTTGGTCATCTCAAGGTCGAGGGTTTCGAGTATGGTATTCTTCAGGCTAGGGTCTAGGGGCTATTAGCTCAGGTGGTTAGA
4-16 AM398960.1 Phormidium persicinum SAG 80.79 135 98 TTCCCTCAGGGGGGGGTGCGACGCAGGTCTGATGACTGGGGTGAAGTCGTAACAAGGTAGCCGTACCGGAAGGTGTGGCTGGATCACCTCCTTTAAGGGAGACCGATGACGGATAGTTTACGAATAGATGTAAGGTATCAGTTGGTCATCTCGAGGTCGAGGGTTGGGAGTATGGTATTCTTCAGGCTAGGGTCTAGGGGCTATTAGCTAGGTGGTTAGA
4-17 DQ351315.1 Synechococcus sp. UW140 16S 209 91 CAATGAAGAGAGAGCGTATGTGGGGCTGATGACTGGGGTGAGTCGTAACAAGGTAGCCGTACCGGAAGGTGCGGCTGGATCACCTCCTAACAGGGAGACACAACTGATTTTGATGTTTGGTTCATTTTGAAATCAAGCCGAAATCCTGTCACCTTAGGTCGATCGGTACCTCAGATGGTTGAATGCAATGGGAGCGGAAACGCGACCAAAGCATCTGCCACCTCAGTTCCTAAACTTCTGTCTAGGTCACCCCTCCGAGCCCATCTGGGCCATTAGCTCAGGTGGTTAGA
5-1 EU183353.1 Arthrospira sp. 204 94 AGGATCCGAATCAGGTCTTTTATGACCCCAGAACCTAGTTTGAAAGCCACATACCTCGTTCCGACCTTTTGGGATTGATTCTTGGTTTCGACTACTATTTTTTCGTCTTATACCCGAATTAGGTCTCCCTTTAAGGAGGTGATCCAGCCACACCTTCCGGTACGGCTACCTTGTTACGACTTCACCCCAGTCACTAGCCCTGCCTTAGGCATCCCCCTCCTTGCGGTTGAGGTAACGACTTCGGGCGTGACA
5-2 EF583859.1 Anabaena sp. 150 98 TTTTTGGGGGAGGCGCGACGCACGCTGATGACTGGGGTGAGTCGTAACAAGGTAGCCGTACCGGAAGGTGTGGCTGGATCACCTCCTTTTAGGGAGACCCAATCCGTAGAAGTTATGAGTTATGAGTTTTGAATGTTGAGTTTAAGACTTGTGACCTAAATCTAAACATTACAACTTCTATGAGATTCAATCCCGAGGTCGTACCGAGGTTGTGAACTTTCAAGCTAAGTCAGGTTTGTAAATGGGCTATTAGCTCAGGTGGTTAGA
5-3 EF150986.1 Microcystis sp. 214 97 CCGTAGCCAAGGGAGAGCTAGCATGACTGATGACTGGGGTGAAGTCGTAACAAGGTAGCCGTACCGGAAGGTGTGGCTGGATCACCTCCTTTCAGGGAGACCTTACCCACCTCAACTCCAAAGCACAAAGCGAATAGAGAGAGGATTGGTCAACCTAAGTCGGTCGAGGAATTGTGTGGCTCTCAAACTTGTCTGGGTTTACTTCTAAGAAGAAGGGAAACGAGGGCTATTAGCTAAGGTGGTTAGAGACATTACCTCAGGTGGTTAGA
6-1 AY672727.1 Microcystis sp. 394 98 TCGCCAGTCGAGGTATCCATGCGCGTACTAGTGATGGGGTGCAGTCGTAACAAGGTAGCCGTACCGGAAGGTGTGGCTGGATCACCTCCTTAAAGGGAGACCTAATTCAGGTAGGATACGAAAAAAAGTAGTCCCTACCAAGAATCAATCCCAAAAGGTCGGAGCGAGGCAAAATTGGCTTTCAAACTAGGTTCTGGGTTCACATAAGACCTGAATCAGGAACAAGGGCTATTAGCTCAGGTGGTTAGAATTAACTCCTGGGGTAGTTGGATCCAAGGTGGTTAGATTACCGCGGGTGTATGGGTTTCTAAAGATTCATTAACGAAGTTCAGGTTCAGCTTCTGTGCCCAAAGACTGAATGTAATTACTTGCAGACTCTGACGATATTTTCCCCAGAACTTTACCTTTGGGGTTTTTTTTTTGTCCTAAAACGAGCTCCATATGATCAGGGGGGGGGGGGACCCCCCCCCACCTCGTTCTCCCGGTCCACTCTCATCCATGATGAACCCCACGGACCAATCATACTCAGTCTGGATATAATGCATCAAAATACTCATGATTCTCTGGTTTCTCGGTACCACCTGGTACCTCTCGCACCCC

Int. J. Environ. Res. Public 2014, 11 1159
Table A2. Cont.
DGGE Band No. Similarity Number Closest Matching
Organism Base Pairs Compared
Similarity (%)
6-2 AJ582275.1 Raphidiopsis sp. 368 96 CCCATCAGTGAGCTATGTAGGACTGGTGACTGGGGTGAGTCGTAACAAGGTAGCCGTACCGGAAGGTGTGGCTGGATCACCTCCTTTTAGGGAGACCTACCCATTGAGGAATCGAAAGCGGAGAGCGAATAGAGAATCAAATGGTCTACTCTAGGTCGGTGACGTGAGATTGTGAAGTCTTTCAAACTAATATTTGGTTCGCGAGAGGGCTATTAGCTAGGGTGGTTAGAAGCACCCCCGGGGGATAGCCAACCACTGCGGGCTTAAACCCTGGGGAAAAAACCAAAGTGGTAAGAACAGCTGGGGGCAAAAAAATAATCAAGACTCCGAATTTCCTGTGTTCCCTCAAAAATTTCTTTGAGAACCACCGACCCCCCTGTATATCTGACTGCCGCTCTTTGCCGATCTTTTTTTTAAAATGGTGGCCGGCCCCCCAAATGATGTGTTGTTGGCGCCCCCCCCCTCTTACTTGGCGTTCGAGAGAATTACTAATACGACATTCATCCACCACGGTTTTATTTAGTGGGGGGCGCGAACGGAGAGATGGCT
7-1 EF583859.1 Anabaena sp. 150 98 TTTTTGGGGGAGGCGCGACGCACGCTGATGACTGGGGTGAGTCGTAACAAGGTAGCCGTACCGGAAGGTGTGGCTGGATCACCTCCTTTTAGGGAGACCCAATCCGTAGAAGTTATGAGTTATGAGTTTTGAATGTTGAGTTTAAGACTTGTGACCTAAATCTAAACATTACAACTTCTATGAGATTCAATCCCGAGGTCGTACCGAGGTTGTGAACTTTCAAGCTAAGTCAGGTTTGTAAATGGGCTATTAGCTCAGGTGGTTAGA
7-2 EU183353.1 Arthrospira sp. 204 94 AGGATCCGAATCAGGTCTTTTATGACCCCAGAACCTAGTTTGAAAGCCACATACCTCGTTCCGACCTTTTGGGATTGATTCTTGGTTTCGACTACTATTTTTTCGTCTTATACCCGAATTAGGTCTCCCTTTAAGGAGGTGATCCAGCCACACCTTCCGGTACGGCTACCTTGTTACGACTTCACCCCAGTCACTAGCCCTGCCTTAGGCATCCCCCTCCTTGCGGTTGAGGTAACGACTTCGGGCGTGACA
7-3 AM502073.1 Cylindrospermopsis raciborskii 220 98 CGTAAGGTAGCAGCCGATAGCGCGAGTAGAGACTAGACGTGAGTCGTAACAAGGTAGCCGTACCGGAAGGTGTGGCTGGATCACCTCCTTTTAGGGAGACCTACCCATTGAAGAATCCAAAGCCGCAGGCGAATAGAGAATCAAATGGTCTACTCTAGGTCGATGACGTGAGATTGTGAAGTCTTTCAAACTAATATTTGGTTCGCGGGCTATTAGCTCAGGTGGTTAGAACACACCATGGGACCAGACCTTGTCCAAGACCCCTTTTGCTTTACTTAATGACAAAAAACAAAGATCTACCAAACTTTTTACCCAATAAAAATATCCCGGGTCCCCAGCACCCCTTGTTCCCTCAAAAATTTCCCCAAAAAAACCCGACCCCCCTATTATCTCAAAGCGCTTCCTTTTGTTGGGGATGGGGGACAAAAATTGGGGGGGCCACACAAAGTGATCTTATAGTGCCCTCTGGCTTTTATCTGGGGCATCGGAAAACTCTTAATTCTGTATCGGACCTCCACGCTCGTGTCTTTGGGGGGGGCTACCATATCGAGAGAACTCTCCGCATGCGGAGCTCTCTCTACAGTGCGCGGGGGTT
7-4 AM398960.1 Phormidium persicinum 135 98 TTCCCTCAGGGGGGGGTGCGACGCAGGTCTGATGACTGGGGTGAAGTCGTAACAAGGTAGCCGTACCGGAAGGTGTGGCTGGATCACCTCCTTTAAGGGAGACCGATGACGGATAGTTTACGAATAGATGTAAGGTATCAGTTGGTCATCTCGAGGTCGAGGGTTGGGAGTATGGTATTCTTCAGGCTAGGGTCTAGGGGCTATTAGCTAGGTGGTTAGA
8-1 EF442201.1 Synechococcus sp. 89.8 92 CAATGAAGAGAGAGCGTATGTGGGGCTGATGACTGGGGTGAGTCGTAACAAGGTAGCCGTACCGGAAGGTGCGGCTGGATCACCTCCTAACAGGGAGACACAACTGATTTTGATGTTTGGTTCATTTTGAAATCAAGCCGAAATCCTGTCACCTTAGGTCGATCGGTACCTCAGATGGTTGAATGCAATGGGAGCGGAAACGCGACCAAAGCATCTGCCACCTCAGTTCCTAAACTTCTGTCTAGGTCACCCCTCCGAGCCCATCTGGGCCATTAGCTCAGGTGGTTAGA
Int. J. Environ. Res. Public 2014, 11 1160
Table A2. Cont.
DGGE Band No.
Similarity Number Closest Matching Organism Base Pairs Compared
Similarity (%)
10-1 EF583859.1 Anabaena sp. 150 98 TTTTTGGGGGAGGCGCGACGCACGCTGATGACTGGGGTGAGTCGTAACAAGGTAGCCGTACCGGAAGGTGTGGCTGGATCACCTCCTTTTAGGGAGACCCAATCCGTAGAAGTTATGAGTTATGAGTTTTGAATGTTGAGTTTAAGACTTGTGACCTAAATCTAAACATTACAACTTCTATGAGATTCAATCCCGAGGTCGTACCGAGGTTGTGAACTTTCAAGCTAAGTCAGGTTTGTAAATGGGCTATTAGCTCAGGTGGTTAGA
10-2 EF150986.1 Microcystis sp. 214 97 CCGTAGCCAAGGGAGAGCTAGCATGACTGATGACTGGGGTGAAGTCGTAACAAGGTAGCCGTACCGGAAGGTGTGGCTGGATCACCTCCTTTCAGGGAGACCTTACCCACCTCAACTCCAAAGCACAAAGCGAATAGAGAGAGGATTGGTCAACCTAAGTCGGTCGAGGAATTGTGTGGCTCTCAAACTTGTCTGGGTTTACTTCTAAGAAGAAGGGAAACGAGGGCTATTAGCTAAGGTGGTTAGAGACATTACCTCAGGTGGTTAGA
10-3 EU183353.1 Arthrospira sp. 204 94 AGGATCCGAATCAGGTCTTTTATGACCCCAGAACCTAGTTTGAAAGCCACATACCTCGTTCCGACCTTTTGGGATTGATTCTTGGTTTCGACTACTATTTTTTCGTCTTATACCCGAATTAGGTCTCCCTTTAAGGAGGTGATCCAGCCACACCTTCCGGTACGGCTACCTTGTTACGACTTCACCCCAGTCACTAGCCCTGCCTTAGGCATCCCCCTCCTTGCGGTTGAGGTAACGACTTCGGGCGTGACA
10-4 AM398960.1 Phormidium persicinum 135 TTCCCTCAGGGGGGGGTGCGACGCAGGTCTGATGACTGGGGTGAAGTCGTAACAAGGTAGCCGTACCGGAAGGTGTGGCTGGATCACCTCCTTTAAGGGAGACCGATGACGGATAGTTTACGAATAGATGTAAGGTATCAGTTGGTCATCTCGAGGTCGAGGGTTGGGAGTATGGTATTCTTCAGGCTAGGGTCTAGGGGCTATTAGCTAGGTGGTTAGA
11-1 EF429298.1 Leptolyngbya badia 130 98 GACTTTACGGCAGAGCGTCGCATGCTGATGACTGGGGTGAGTCGTAACAAGGTAGCCGTACCGGAAGGTGTGGCTGGATCACCTCCTTTAAGGGAGACCGATGACGGATAGTTTACGAATAGATGTAAGGTATCAGTTGGTCATCTCGAGGTCGAGGGTTGGGAGTATGGTATTCTTCAGGCTAGGGTCTAGGGGCTATTAGCTAGGTGGTTAGA
12-1 EF150986.1 Microcystis sp. 214 CCGTAGCCAAGGGAGAGCTAGCATGACTGATGACTGGGGTGAAGTCGTAACAAGGTAGCCGTACCGGAAGGTGTGGCTGGATCACCTCCTTTCAGGGAGACCTTACCCACCTCAACTCCAAAGCACAAAGCGAATAGAGAGAGGATTGGTCAACCTAAGTCGGTCGAGGAATTGTGTGGCTCTCAAACTTGTCTGGGTTTACTTCTAAGAAGAAGGGAAACGAGGGCTATTAGCTAAGGTGGTTAGAGACATTACCTCAGGTGGTTAGA
12-2 AM398960.1 Phormidium persicinum SAG 135 TTCCCTCAGGGGGGGGTGCGACGCAGGTCTGATGACTGGGGTGAAGTCGTAACAAGGTAGCCGTACCGGAAGGTGTGGCTGGATCACCTCCTTTAAGGGAGACCGATGACGGATAGTTTACGAATAGATGTAAGGTATCAGTTGGTCATCTCGAGGTCGAGGGTTGGGAGTATGGTATTCTTCAGGCTAGGGTCTAGGGGCTATTAGCTAGGTGGTTAGA
© 2014 by the authors; licensee MDPI, Basel, Switzerland. This article is an open access article
distributed under the terms and conditions of the Creative Commons Attribution license
(http://creativecommons.org/licenses/by/3.0/).


