

EU Climate and Energy Policy Package and Climate Policy developments until 2050
Mr Zsolt Lengyel, Team Leader & Key Expert 1
9 April 2014, Moscow

2
A competitive low carbon roadmap until 2050
2

Policy context: European Council 2011– Science (IPCC) : global emissions to be reduced by -
50% by 2050 compared to 1990
– EU objective of reducing greenhouse gas emissions by 80-95% by 2050 compared to 1990, in the context of necessary reductions by developed countries as a group
– Need for a low carbon 2050 strategy providing certainty: predictability for longer term action
– Need to fix intermediary milestones (2030, 2040) towards reaching the 2050 objective
3

4
The 2050 Low carbon economy roadmap in a nutshell: process
• Coordinated analytical framework (Europe 2020 Resource efficient Europe flagship initiative)
• Framework also used for sectoral initiatives, e.g. – Transport 2050 White Paper– Energy Roadmap 2050
• Based on extensive economy-wide global and EU level model-based scenario analysis
4

5
Developed Countries
0%
20%
40%
60%
80%
100%
1990 2000 2010 2020 2030 2040 2050
Baseline Global action
EU
0%
20%
40%
60%
80%
100%
1990 2000 2010 2020 2030 2040 2050
Baseline Global action
Global climate action
EU objective: 80 to 95% reductions
largely through domestic measures:
around -80% internal reductions in 2050
compared to 1990
Developed Countries:
similar effort
Developing Countries:
-5% compared to 1990
Equivalent to -
80% compared
to business as
usual
no cheap
offsets by 2050
Developing Countries
0%
100%
200%
300%
400%
500%
1990 2000 2010 2020 2030 2040 2050
Baseline Global action5

6
The 2050 Low carbon economy roadmap in a nutshell: contents
• strategy responds to interlinked policy objectives: – avoiding dangerous climate change,
– improving energy security
– overcoming barriers to the development of low carbon technologies which are at the heart of sustainable growth
• identifies cost-effective pathway, with intermediate milestones
• identifies key technologies guiding R&D
• identifies investments needs and benefits
• identifies opportunities and trade-offs
• guides EU, national and regional policies
• gives direction to private sector and private households for long term investments
6

7
Efficient pathway:-25% in 2020-40% in 2030-60% in 2040
Cost-efficient EU pathway towards 2050
80% domestic GHG reduction in 2050 is feasiblewith currently available
technologies,
with behavioural change
only induced through
prices
If all economic sectors
contribute (energy: 85%)
0%
20%
40%
60%
80%
100%
1990 2000 2010 2020 2030 2040 2050
0%
20%
40%
60%
80%
100%
Current policy
Power Sector
Residential & Tertiary
Non CO2 Other Sectors
Industry
Transport
Non CO2 Agriculture
7

8
Energy Efficiency will be key
• Energy efficiency is the single most important contribution, especially until 2020
– Current policies only result in 10% energy efficiency improvement
– roadmap confirms key role of efficiency up to 2020 and beyond
– efforts towards 20% efficiency target would deliver 25% GHG reduction
– ETS is one instrument to deliver additional efficiency
8

9
Roadmap 2050:Investing in the EU economy
• Additional domestic investment: € 270 billion annually during 2010-2050, equivalent to 1.5% of GDP, of which
– built environment (buildings and appliances): € 75 bn
– transport (vehicles and infrastructure): € 150 bn
– power (electricity generation, grid): € 30 bn
Note:
• Investment in the EU economy and EU jobs, not cost
• delaying action increases overall investment requirements
• R&D and early demonstration/deployment crucial
9

10
Roadmap 2050:Benefits for EU economic
growth• Significant increase in domestic investment
– Shift from fuel costs to investment expenditure money stays in the EU
GDP and GHG decoupling
40
60
80
100
120
140
160
180
200
220
1990 2000 2010 2020 2030
19
90
= 1
00
%
GDP GHG emissions
Innovation in key growth sectors
crucial for future
competitiveness
GDP growth decoupled from
GHG emissions also after 2020
GDP more secure from energy
price shocks
10

11
Roadmap 2050: Benefits for EU energy security and air quality
• Fuel savings: € 175 to 320 billion on average annually during 2010-2050 (compared to € 270 billion investments)
• Primary energy consumption about 30% below 2005 without negatively affecting energy services
• Making EU economy more energy secure: – Halves imports of oil and gas compared to today
– Saving € 400 billion of EU oil and gas import bill in 2050, equivalent to > 3% of today’s GDP
– Safeguard against macro-economic impacts of future energy price hikes
• Air quality and health benefits: € 27 billion in 2030 and € 88 billion in 2050
11

12
• Sources of new jobs– Short term: e.g. in renovation of buildings, production of
insulation materials, renewables industry– Potential net job creation up to 1.5 million by 2020 if
revenues from auctioning of ETS allowances and CO2 taxation are used to reduce labour costs and increase in investments and R&D
– Getting on track to achieve the 20% energy efficiency improvement in 2020 has the potential to boost net employment by 400,000 jobs.
– Long term job prospects depend on favourable economic framework conditions, e.g. expenditure on research & technology development, innovation, entrepreneurship, new skills, investment
Roadmap 2050:Benefits for EU jobs
12

13
Roadmaps of international competitors
• Several emerging economies (e.g. Korea, China, Brasil, India) develop low emission
and green growth strategies
• Main drivers: innovation, leading in new growth sectors, energy security & resource
efficiency, clean air
• For example: China’s 12th 5-Year Plan (2011-2015):
– increase carbon and energy intensity targets
– pilot emission trading systems
– develop low carbon zones
– invest 5 trillion yuan (€ 570 billion) in new energy
– increase renewable energy by 65% by 2015
– invest 100 billion yuan (€11.5 billion) in alternative vehicles
13

Roadmap 2050: the way forward
• Presidency conclusions and European Parliament responses on the Low carbon roadmap 2050
• Member States, Candidate Countries and Potential Candidates to develop long-term national and regional low emission development strategies
14

15
2030Framework
15

• Investments today need long term horizon to avoid carbon lock in
• Focus R&D and innovation activities in new growth sectors
• Prepare for EU position in the international negotiations
16
Why consider 2030 Framework?
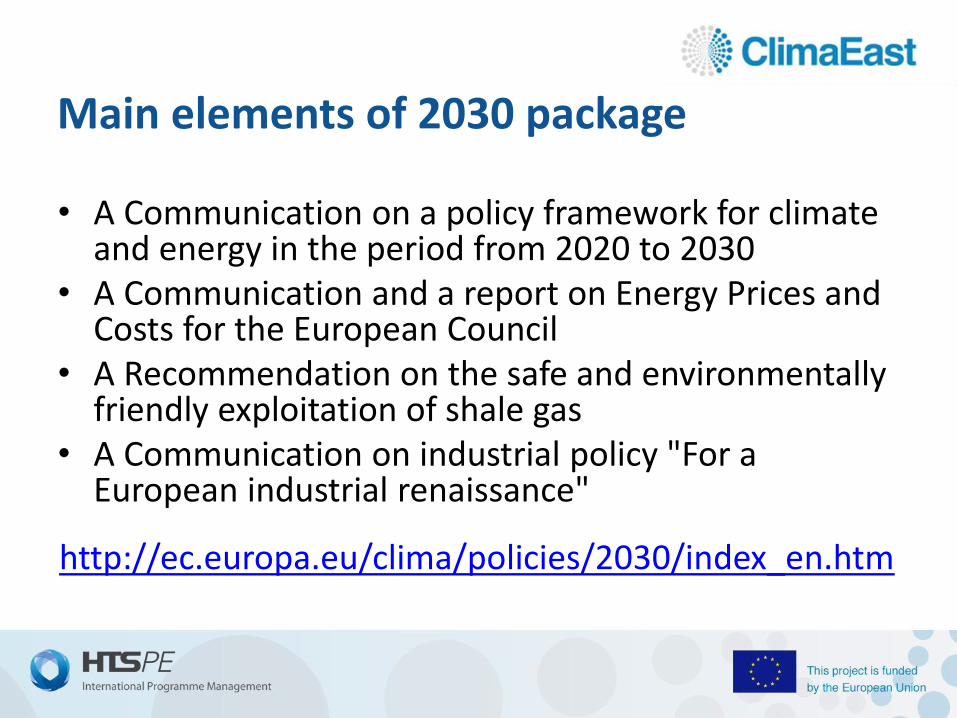
Main elements of 2030 package
• A Communication on a policy framework for climate and energy in the period from 2020 to 2030
• A Communication and a report on Energy Prices and Costs for the European Council
• A Recommendation on the safe and environmentally friendly exploitation of shale gas
• A Communication on industrial policy "For a European industrial renaissance"
http://ec.europa.eu/clima/policies/2030/index_en.htm


2050 Roadmaps
2030 Green Paper
Proposal for the 2030
framework for climate and energy
policies
2011 March 2013 January 2014
The 2030 framework builds on the 2050 Roadmap
On-going discussions with Member States, EU institutions and stakeholders

"No Regrets" options from the EnergyRoadmap 2050
More EnergyEfficiency
Higher sharesof
Renewables
Better and smarterInfrastructure

Increased certainty for Member States and reducedregulatory risks for investors
Growth and jobs throughdemand for efficient and low-
carbon technologies
Definition of EU ambitions in view of a new international climate change agreement
(Early) agreement on the 2030 framework isessential
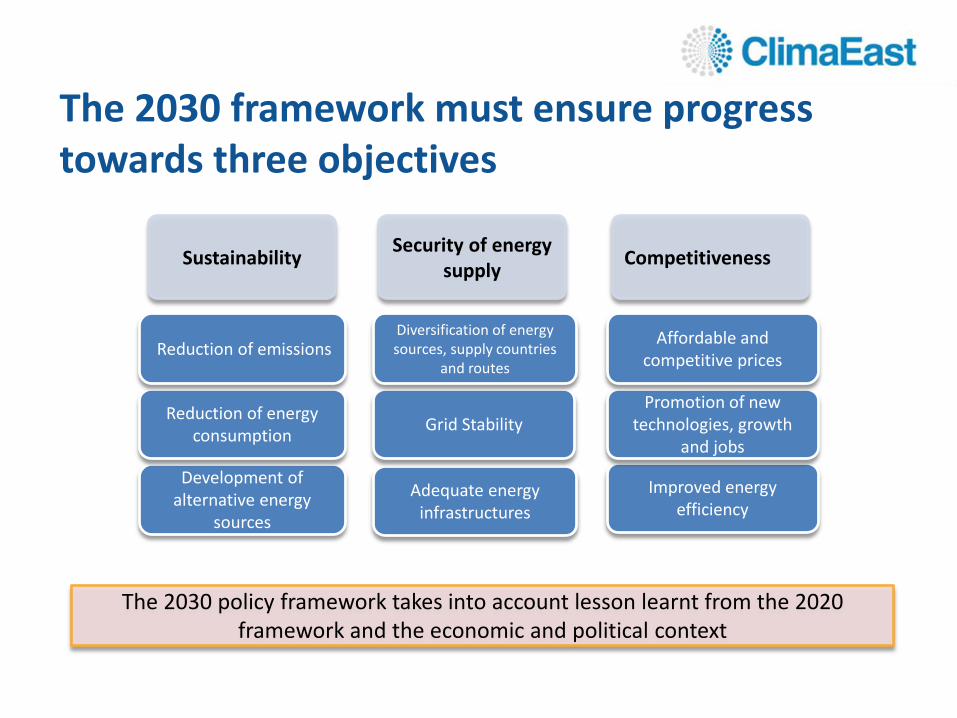
Improved energy efficiency
Promotion of new technologies, growth
and jobs
Affordable and competitive prices
Competitiveness
Adequate energy infrastructures
Grid Stability
Diversification of energy sources, supply countries
and routes
Security of energy supply
Development of alternative energy
sources
Reduction of energy consumption
Reduction of emissions
Sustainability
The 2030 policy framework takes into account lesson learnt from the 2020 framework and the economic and political context
The 2030 framework must ensure progress towards three objectives

• EU emissions reduced by 15.5% 1990 -2010
• EU GDP grew >40%
• EU as a whole on track towards 20% target
• For half of the MS, existing policies and measures are sufficient to reach their Effort Sharing target domestically80.0
90.0
100.0
110.0
120.0
130.0
140.0
150.0
19
90
19
91
19
92
19
93
19
94
19
95
19
96
19
97
19
98
19
99
20
00
20
01
20
02
20
03
20
04
20
05
20
06
20
07
20
08
20
09
20
10
GHG emissions
Population
Real GDP
Primary energy
GHG emissions are decreasing in the EU compared to other countries
Sourc
e:
Euro
pean C
om
mis
sio
n

The EU is making good progress towards meeting the 2020 RES target - But most Member States are still some distance away
Renewable sources accounted for 12.7% of the EU's energy consumption in 2010Sourc
e:
Euro
sta
t
0%
10%
20%
30%
40%
50%
60%RES in 2010
2020 RES Target
2020 target for the EU: 20%

EU energy consumption is going down, but 2020 target likely to be missed with current policies
projections
Sourc
e:
Euro
pean C
om
mis
sio
n
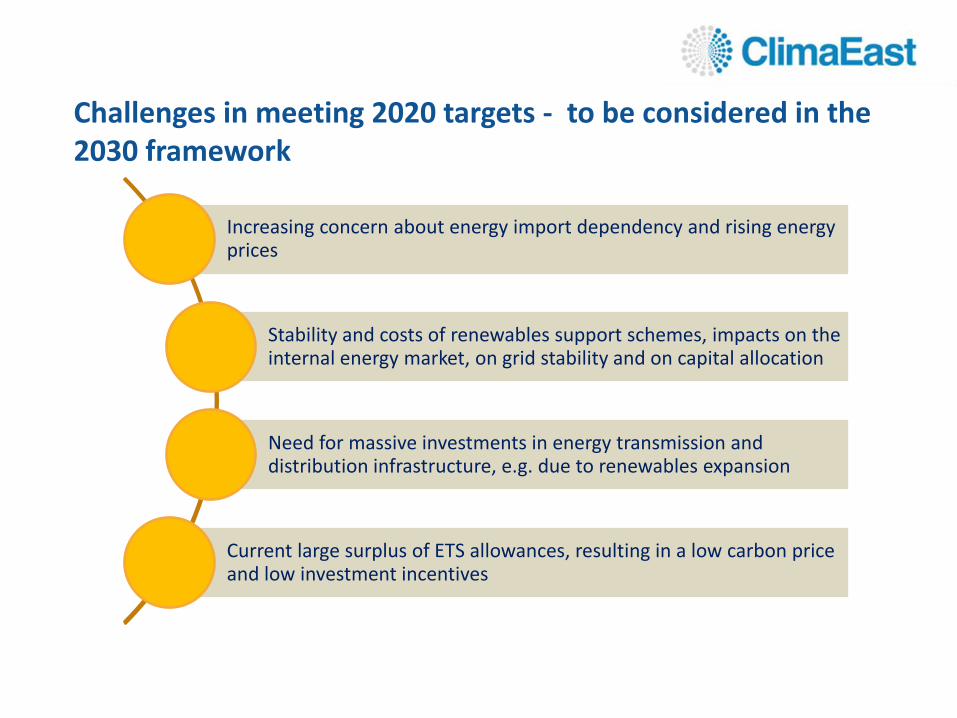
Increasing concern about energy import dependency and rising energy prices
Stability and costs of renewables support schemes, impacts on the internal energy market, on grid stability and on capital allocation
Need for massive investments in energy transmission and distribution infrastructure, e.g. due to renewables expansion
Current large surplus of ETS allowances, resulting in a low carbon price and low investment incentives
Challenges in meeting 2020 targets - to be considered in the 2030 framework

• Which targets for 2030 would be most effective in driving the objectives of climate and energy policy?
• At what level should they apply (EU, MS, sectors?), and should they be legally binding?
Targets
• Which are the most appropriate policy instruments to meet potential new targets for the period up to 2030?
• How can Research and Innovation best support the 2030 framework?
Instruments
• How can EU policies take account of international developments? E.g. Climate negotiations
• How can internationally competitive and affordable energy prices be ensured?
Competitiveness & Security of Supply
• How can an equitable distribution of efforts be ensured among Member States?
• How to best consider the different investment capacities of industry sectors and consumer groups?
Effort Sharing
Main issues considered in the 2030 framework

Electricity prices – the US is increasing its advantage…
OECD Europe, 137.7
USA, 95.9
Japan, 116.2
80
90
100
110
120
130
140
150
2005 2006 2007 2008 2009 2010 2011 Q3 2012
Sourc
e:
IEA, Energ
y P
rices a
nd T
axes, 4th
quart
er
2012
Evolution of end-user electricity prices for industry (2005 = Index 100)

29
…in part due to the shale gas boom
- US wholesale prices for gas are 3-4 times lower than in the EU
Sourc
e:
Euro
pean C
om
mis
sio
n

Retail electricity prices paid by households and industry in 2012
Note: Euro/kWh, first half of 2012, consumption bands DC and IC, all taxes includedSource of data: Eurostat

2006 2007 2008 2009 2010 2011 2012 2013 2014 2015
01/2007Commission proposal for
2020 climate and energy package
12/ 2008Heads of State and
Government reached
agreement on the package
10/2012Adoption of the Energy
Efficiency Directive
11/2010Commission
Communication"Energy 2020 Strategy"
12/2011Commission Communication
"Energy Roadmap 2050"
04/2009Adoption of the Renewables
Directive
03/20132030 Green
Paper
2015 Global Climate Change
Agreement
More concrete proposals for the 2030 framework
Window of opportunity
Towards the 2015 Agreement
07/2009Adoption of the 3rd
package on the Liberalization of
electricity and gas market
11/2012Commission Communication
"Internal Energy Market"
03/ 2013Adoption of the
EnergyInfrastructure
Regulation
= EU legislation = Commission Communications = Council Counclusions

How to contact us
The project team can be contacted at personal e-mail addresses and :
[email protected] East Office
c/o Milieu LtdRue Blanche n 15
1050 Brussels, Belgium
The full project website is available in English and Russian:
www.climaeast.eu


