
September 2016
OIES PAPER: NG 112
European gas grid through the eye of the TIGER:
investigating bottlenecks in pipeline flows by modelling history
Beatrice Petrovich & Howard Rogers, OIES
Harald Hecking & Florian Weiser, ewi Energy Research & Scenarios
September 2016: European gas grid through the eye of the TIGER
ii
The contents of this paper are the authors’ sole responsibility. They do not
necessarily represent the views of the Oxford Institute for Energy Studies or any of
its members.
Copyright © 2016
Oxford Institute for Energy Studies & ewi Energy Research and Scenarios
(Registered Charity, No. 286084)
This publication may be reproduced in part for educational or non-profit purposes without special
permission from the copyright holder, provided acknowledgment of the source is made. No use of this
publication may be made for resale or for any other commercial purpose whatsoever without prior
permission in writing from the Oxford Institute for Energy Studies.
ISBN 978-1-78467-068-9
September 2016: European gas grid through the eye of the TIGER
iii
Authors’ Foreword
This joint study was conducted by Harald Hecking and Florian Weiser, researchers at ewi Energy
Research & Scenarios and Beatrice Petrovich and Howard Rogers, research fellows at the Oxford
Institute for Energy Studies.
September 2016: European gas grid through the eye of the TIGER
iv
Preface
Academic collaboration is arguably most successful when different skills are brought together to
address a research question which overlaps core areas of competency in an even manner. If the
chemistry of the combined team works well, the results are truly synergistic. In such a spirit, this paper
brings together findings from previous leading edge OIES research on European gas hub price
correlation by Beatrice Petrovich with demonstrated excellence in European gas transmission system
modelling by Harald Hecking and Florian Weiser at ewi Energy Research and Scenarios at the EWI
Institute in Cologne.
The paper compares the evidence for periodic bottlenecks in Europe’s gas transmission systems,
indicated by price correlation de-linkage - and supporting evidence of apparent physical or
contractual flow constraints - with the results obtained by ‘re-running history’ using the EWI TIGER
model. The modelled view of history presumes ‘perfect market’ behaviour in respect of agents
making the best use of infrastructure (‘lowest cost’ objective function) to move gas from A to B given
data on tariff costs.
A ‘tidy’ confirmation that modelled and actual flows were broadly in line would have been welcomed
by those regulatory bodies tasked with achieving the Gas Target Model. The findings of this paper
suggest that much more work is necessary to ensure that: critical route capacities are increased,
capacities each side of specific interconnector points are better harmonised and that capacity held
under long term contracts is made available on a shorter time horizon. The forensic investigation
contained in this paper is to be highly commended and is an excellent starting point for regulatory
bodies.
This is far from merely an interesting academic study. Europe’s gas flow patterns will markedly
change over the next ten years as domestic production declines, leaving a growing import
requirement to be met by the imminent surge of global LNG supply and/or Russian pipeline gas. The
‘problem areas’ of linkage between North and Southern France and the corridors between Germany
and Italy via Austria and Switzerland, complicated by new flows to Ukraine, will need to achieve a
robust level of responsiveness in this timescale. This paper provides both a timely reminder of the
work required and an excellent indication of where such work should be focussed.
Howard Rogers
Oxford
September 2016

September 2016: European gas grid through the eye of the TIGER
v
Contents
Authors’ Foreword ............................................................................................................................... iii
Preface .................................................................................................................................................. iv
1. Background, the research question and its relevance ................................................................ 6
2. Methodology ...................................................................................................................................... 8
3. Data .................................................................................................................................................. 10
4. Re-running history in a fully competitive world ......................................................................... 14
4.1 NCG to PSV ................................................................................................................................ 14
4.2 NCG to CEGH ............................................................................................................................. 17
4.3 PEGN to PEGS ........................................................................................................................... 21
5. Conclusions .................................................................................................................................... 24
Appendix I: Natural Gas Infrastructure in the TIGER model .......................................................... 26
Appendix II: Simplified representation and maps of Wallbach, Gries Pass and Oberkappel IPs
.............................................................................................................................................................. 27
Glossary ............................................................................................................................................... 30
References ........................................................................................................................................... 32
Figures
Figure 1: OTC day-ahead Gas Prices (€/MWh) in different Market Areas .............................................................. 7
Figure 2: Import flows that are exogenously fixed in the model, either on a daily or yearly basis ......................... 10
Figure 3: Assumption on Take-Or-Pay-Levels in bcm ........................................................................................... 11
Figure 4: Existing regasification terminals in Europe............................................................................................. 11
Figure 5: Assumption on Demand Level per country in bcm (annual) ................................................................... 12
Figure 6: Illustration of assumed transportation fees in Europe (€/MWh) .............................................................. 13
Figure 7: Simulated and historical utilization flows from NCG to Switzerland in 2014 (GWh) ............................... 15
Figure 8: Simulated and historical utilization rate from NCG to Switzerland in 2014 (%) ...................................... 15
Figure 9: Simulated gas flows from NCG to Switzerland in 2014 and Italian regasification terminals send-out (GWh/day) ............................................................................................................................................................. 16
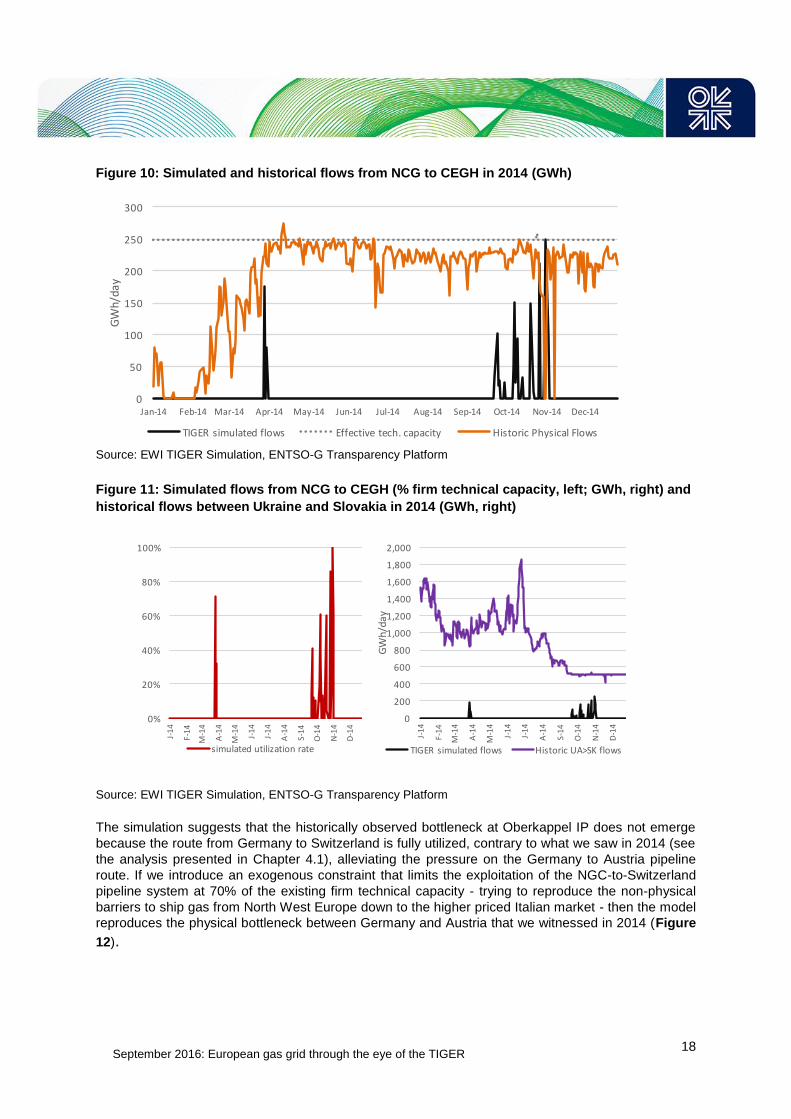
Figure 10: Simulated and historical flows from NCG to CEGH in 2014 (GWh) ..................................................... 18
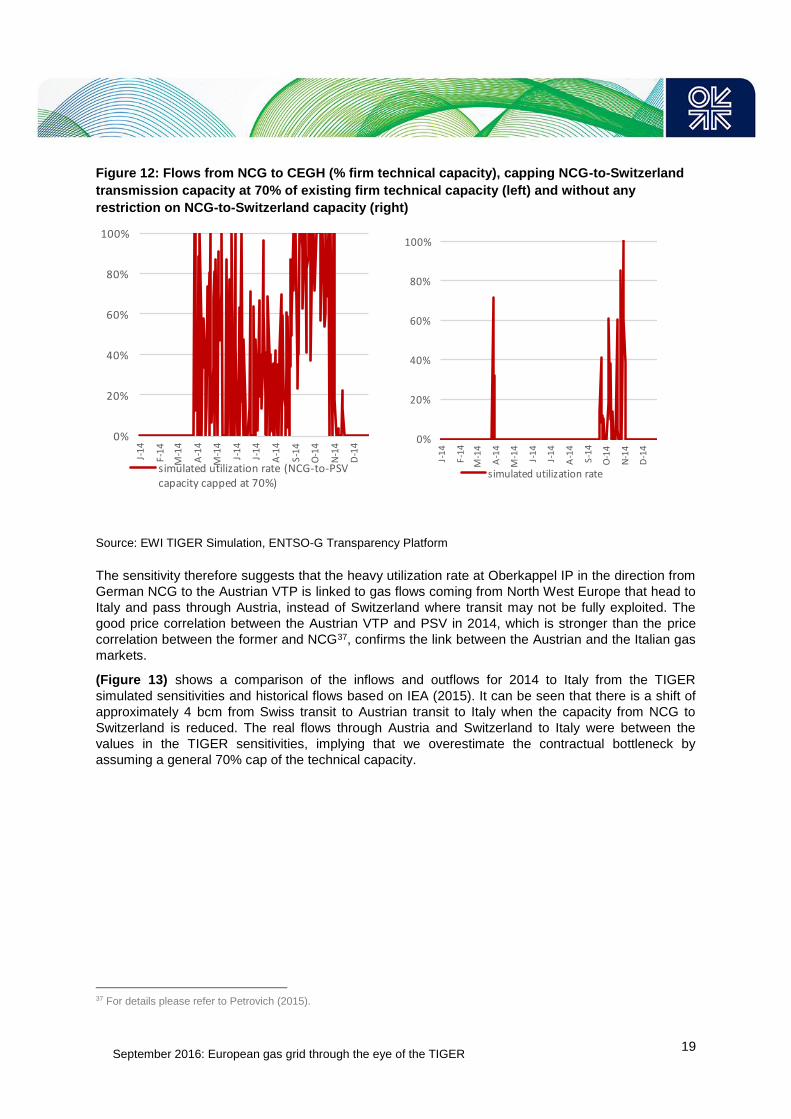
Figure 11: Simulated flows from NCG to CEGH (% firm technical capacity, left; GWh, right) and historical flows between Ukraine and Slovakia in 2014 (GWh, right) ............................................................................................. 18
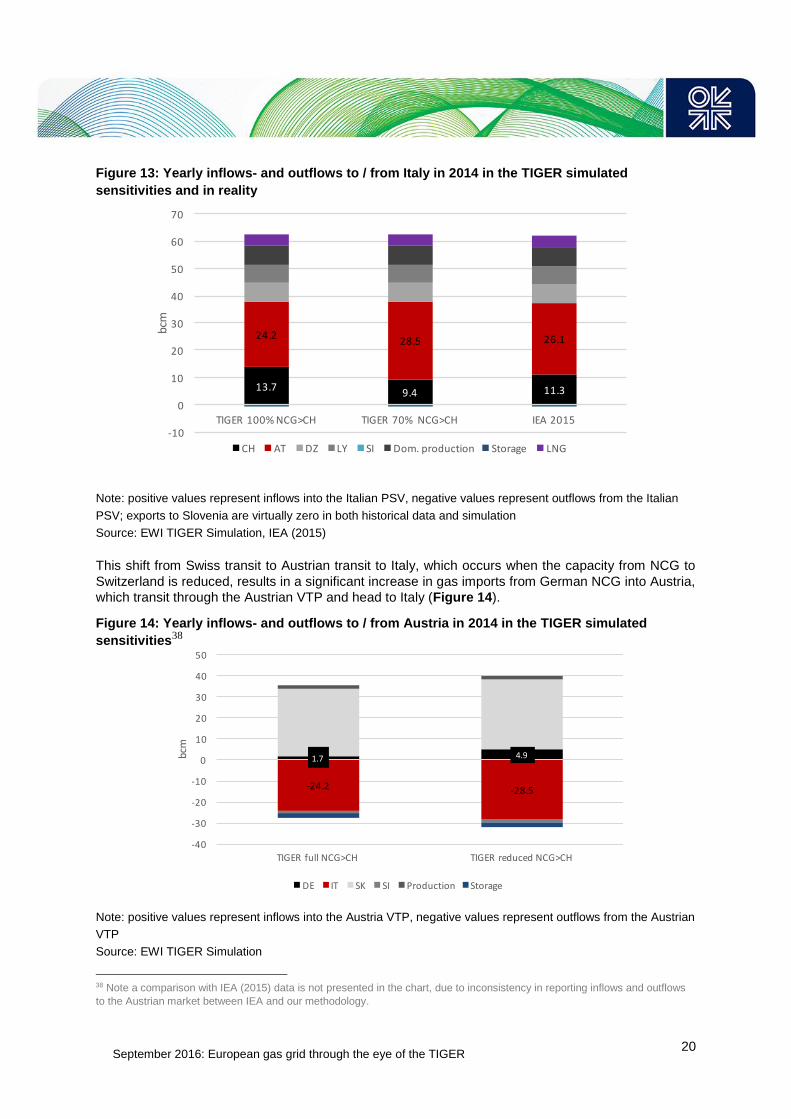
Figure 12: Flows from NCG to CEGH (% firm technical capacity), capping NCG-to-Switzerland transmission capacity at 70% of existing firm technical capacity (left) and without any restriction on NCG-to-Switzerland capacity (right)....................................................................................................................................................... 19
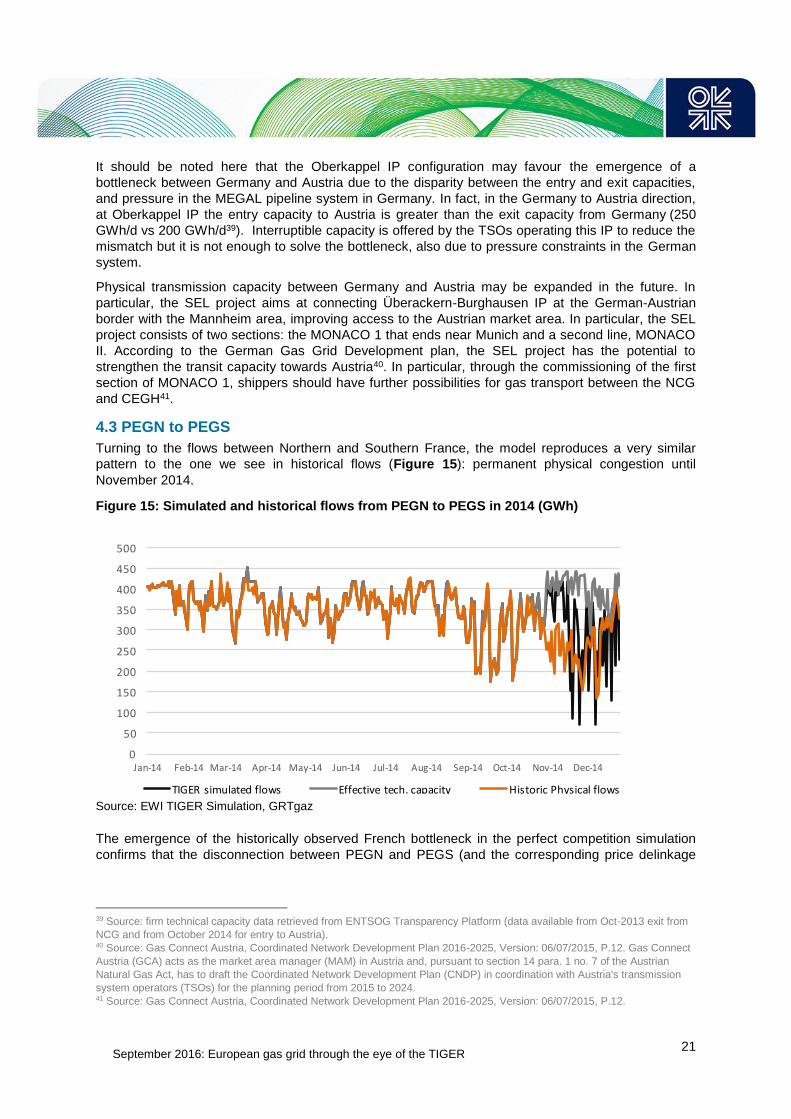
Figure 13: Yearly inflows- and outflows to / from Italy in 2014 in the TIGER simulated sensitivities and in reality 20
Figure 14: Yearly inflows- and outflows to / from Austria in 2014 in the TIGER simulated sensitivities................. 20
Figure 15: Simulated and historical flows from PEGN to PEGS in 2014 (GWh) ................................................... 21
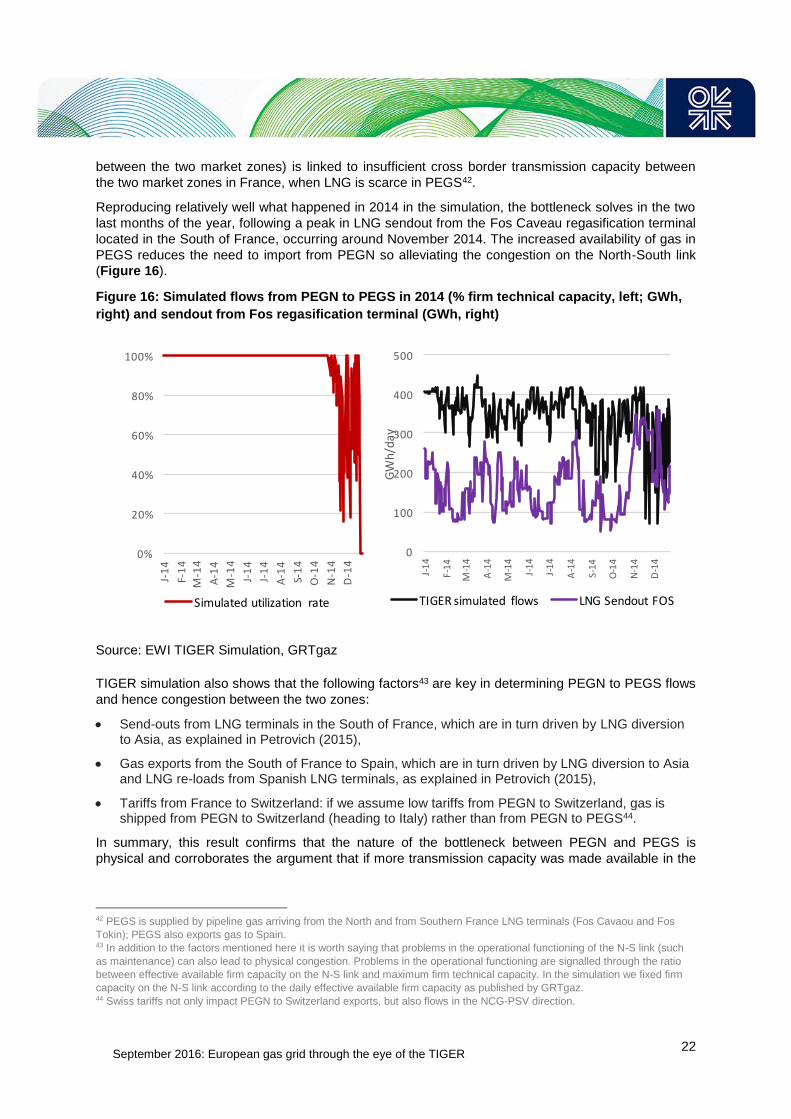
Figure 16: Simulated flows from PEGN to PEGS in 2014 (% firm technical capacity, left; GWh, right) and sendout from Fos regasification terminal (GWh, right) ........................................................................................................ 22
Figure 17: PEGS-PEGN exchange day ahead spread against utilization rate of the N-S link, direction PEGN to PEGS/TRS, in 2015 .............................................................................................................................................. 23
Figure 18: Natural gas infrastructure in TIGER ..................................................................................................... 26
Figure 19: Simplified representation of Wallbach IP and Gries Pass IPs .............................................................. 27
Figure 20: Simplified representation of Oberkappel IP .......................................................................................... 27
Figure 21: Maps of NCG-to-Austria pipeline system ............................................................................................. 28
Figure 22: Map of NCG-Switzerland-PSV pipeline system ................................................................................... 29
September 2016: European gas grid through the eye of the TIGER
6
1. Background, the research question and its relevance
Work by OIES in September 20151 monitored the alignment between European hub prices in 2014
with the aim of identifying the remaining barriers to the free trade of gas between the main European
gas hubs 2 , and their underlying drivers. Although prices were overall well aligned in 2014, the
persistence of some price disconnection suggests that all price arbitrage opportunities could not be
exploited through short term trading as some physical or contractual constraints remained, these
being an obstacle to a truly integrated European gas market.
In particular, in 2014, we observed 3 cases of barriers to free trade, or “bottlenecks”:
1) PEG Sud (PEGS) hub delinking from PEG Nord (PEGN) hub, driven by physical congestion at
the North/South link in France. This was fostered by a lack of –affordable - LNG imports in the
South of France and high exports from PEG TIGF to Spain, in turn leading to a high requirement
for gas to be shipped southwards from the more liquid hub in the north that could not be
supported by the existing transmission capacity connecting PEGN to PEGS.
2) the Austrian hub (CEGH) delinking from the German NCG hub, driven by increasing the
requirement to ship gas eastwards, due in part to reverse flow to Ukraine, and Russia not meeting
nominations in the summer of 2014, that led to a frequent saturation of transmission capacity to
exit Germany at the Oberkappel IP on the Austrian border. Such a physical bottleneck was
especially accentuated by physical constraints on the German side (disparity between entry and
exit capacity, plus pressure constraints in the MEGAL system).
3) the Italian PSV hub delinking from NCG and other North West European hubs, supported by
under-utilisation of the existing transmission capacity linking PSV to the more liquid markets in the
North. Such underutilization of cross border transmission capacity on the NCG-Switzerland-PSV
pipeline route reflects other than physical barriers to trade and has been partially alleviated by re-
sales of pre-booked capacity on an interruptible basis carried out by TSOs and by ENI’s release
of long term booked capacity through periodical auctions.
Figure 1 shows the price delinkages in the course of the calendar year 2014: PSV, PEGS and CEGH
prices, in fact, are not perfectly aligned to the other European gas markets.
1 Petrovich (2015). 2 A gas hub is the location, physical or virtual, where a traded market for gas is established. In what follows gas hubs and gas
markets are synonymous.
September 2016: European gas grid through the eye of the TIGER
7
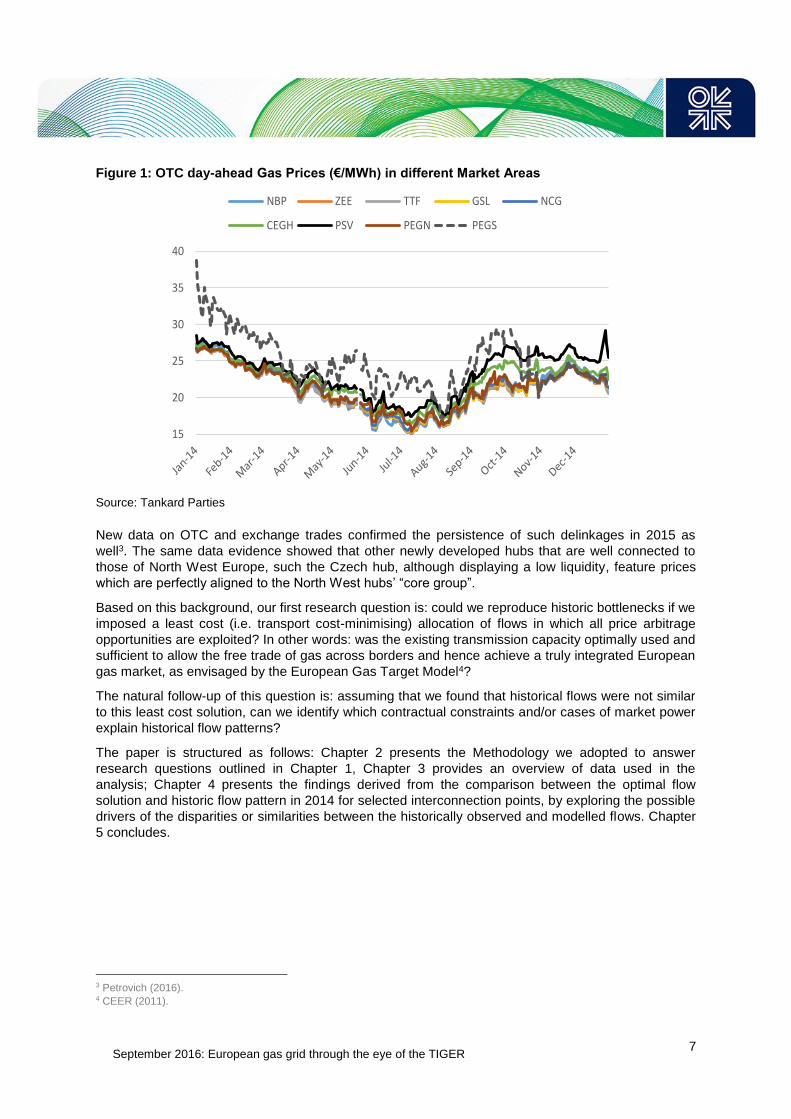
Figure 1: OTC day-ahead Gas Prices (€/MWh) in different Market Areas
Source: Tankard Parties
New data on OTC and exchange trades confirmed the persistence of such delinkages in 2015 as
well3. The same data evidence showed that other newly developed hubs that are well connected to
those of North West Europe, such the Czech hub, although displaying a low liquidity, feature prices
which are perfectly aligned to the North West hubs’ “core group”.
Based on this background, our first research question is: could we reproduce historic bottlenecks if we
imposed a least cost (i.e. transport cost-minimising) allocation of flows in which all price arbitrage
opportunities are exploited? In other words: was the existing transmission capacity optimally used and
sufficient to allow the free trade of gas across borders and hence achieve a truly integrated European
gas market, as envisaged by the European Gas Target Model4?
The natural follow-up of this question is: assuming that we found that historical flows were not similar
to this least cost solution, can we identify which contractual constraints and/or cases of market power
explain historical flow patterns?
The paper is structured as follows: Chapter 2 presents the Methodology we adopted to answer
research questions outlined in Chapter 1, Chapter 3 provides an overview of data used in the
analysis; Chapter 4 presents the findings derived from the comparison between the optimal flow
solution and historic flow pattern in 2014 for selected interconnection points, by exploring the possible
drivers of the disparities or similarities between the historically observed and modelled flows. Chapter
5 concludes.
3 Petrovich (2016). 4 CEER (2011).
15
20
25
30
35
40
NBP ZEE TTF GSL NCG
CEGH PSV PEGN PEGS
September 2016: European gas grid through the eye of the TIGER
8
2. Methodology
In order to answer our research questions we compare historical flow patterns within the European
grid5 against the results of a least cost gas flow model dispatching in a fully competitive setting with
fixed gas intakes into Europe (hereafter: “perfect competition solution or simulation”), obtained by:
considering the existing structure of the network (see Appendix I for a detailed representation) and related transmission tariffs,
fixing the key supply volumes to Europe (i.e. pipeline imports, LNG imports, domestic gas production) and consumed volumes in each regional market at the levels historically observed in 2014,
assuming that at all gas suppliers to Europe are price-takers (perfect competition hypothesis),
choosing the combination of gas flows within the European grid that minimizes transport costs and at the same time meets all demand requirements across Europe.
In order to derive the perfect competition solution we used the European supply-demand transmission
model TIGER. The TIGER model was developed by EWI at the University of Cologne; it works using
as inputs demand, production capacities of major gas suppliers, European domestic production,
information on long term contracts, transmission tariffs data and gives as an output a pattern of
physical gas flows within Europe. TIGER is a cost minimizing model: the whole system is optimized
with regard to the cost for the gas supply, subject to several infrastructure constraints, e. g. capacity
limits of pipelines or injection/withdrawal storage curves. Consequently, TIGER simulated flows are
the optimal ones, meaning that such flows are "as if" every arbitrage opportunity were exploited to the
extent that available infrastructure allows. For a technical model description, please refer to Lochner
(2011).
The nature of our research question requires that we use TIGER to “re-run” history, i.e. we use
TIGER in the following way: given the actual daily data on demand, domestic production, storage
inventory levels at certain dates, the most important import-export flows to/from pipeline and LNG
imports to Europe and data on transmission tariffs; we ask the TIGER model to simulate the least cost
pattern of flows within the European grid geography (that is basically the flow pattern within Europe
that minimizes the transport costs, subject to capacity constraints).
More specifically, we fix the following quantities in the model based on historic data for 2014
described in Chapter 3:
Send-outs from LNG terminals: we fix send-outs from LNG terminals on a daily basis for Italy, France and Spain (by terminal). Other LNG send-outs are fixed on a yearly basis (by country) on the basis of historic import data.
Pipeline imports to the EU: the flows from Norway to PEG Nord, and from Ukraine to Slovakia are fixed on a daily level. Other imports are fixed either on a yearly level (Algeria to Spain, Algeria to Italy, Russia to Germany via Nord Stream, Poland to Germany), or indirectly by fixing take-or-pay levels6. We take into account that Russia stopped sales to Ukraine on July 14th 2014.
Demand: we fix demand on a daily basis for key countries (Italy, France, Netherlands, Germany, Austria, Czech Republic, United Kingdom) or on a yearly level (all other European countries).
5 The coverage of the model includes all countries that are geographically in Europe and are connected by gas pipelines,
including Turkey, Ukraine and Belarus. The modelled pipelines are the transmission system for gas. The distribution system is
not included. 6 Take or pay levels are estimated based on EWI research.
September 2016: European gas grid through the eye of the TIGER
9
Production: European domestic production is fixed at historical levels on a yearly basis (by country).
Storage: storage optimization is endogenous but storage stocks at given points in time are fixed at historical levels at country level (January 1st, November 1st, December 31st 2014)
It is worth noticing that in this exercise, import contract pricing details are not relevant.7 In particular,
we simply assume that the price of gas injected into the European grid, although coming from
different sources, is the same and therefore what matters is matching daily demand with a mix of
sources that minimises the cost of shipping gas from the point where the gas is ‘injected’ into the
system, up to the virtual trading points where consumption will take place. Unless transmission tariffs
are very different across IPs (a point which will be discussed in Chapter 3), minimizing the cost of
shipping gas to centres of consumption means minimising the shipping distance: the fewer entry/exit
points8 the gas volume has to pass through, the fewer entry/exit tariffs are charged on the volume. In
this environment, markets that are more distant from the gas source pay a higher price for delivering
their gas, due to an effect which is also known as tariff “pancaking”9.
We focus on the calendar year 2014 which is the most recent year to date we have final flow data
available for.
The predictions for the comparison between real flow decisions and the result of the perfect
competition solution10 are:
1) If an historical bottleneck also emerges in the perfect competition simulation, this confirms the
physical nature of the bottleneck and suggests that, assuming that the policy target is closer price
alignment, there is a need for more transmission capacity at that interconnection, as cross border
capacity is not sufficient to connect adjacent markets.
2) Divergences between reality and the perfect competition simulation in terms of the emergence of
bottlenecks signal that suboptimal utilization of existing capacity is occurring (i.e. non-physical
barriers to trade)
The match between historical and simulated daily flows, is therefore especially interesting at the three
links described in Chapter 1 (i.e. PEGS/PEGN, CEGH/NCG, PSV/NCG), namely those where
bottlenecks have historically been observed. Our purpose is to see whether the perfect competition
simulation reproduces the physical bottlenecks identified in the price delinkage analysis, or not. If the
result is ‘yes’ (prediction 1), this would suggest the need of additional investment to upgrade existing
cross border capacity at such interconnection points, provided that supply/demand patterns do not
radically change and the policy target is closer price alignment.
For points where the price delinkage analysis concluded that contractual congestion was possibly
occurring (PSV/NCG), the comparison may confirm this (prediction 2) and shed some light also on
whether the existing physical capacity would have been sufficient to avert the bottleneck if it was fully
exploited. If not, this would suggest that, on top of solving the existing non-physical barriers to trade,
additional investment to upgrade existing cross border capacity at such interconnection points would
be required (provided, of course, that supply/demand patterns do not radically change and that the
policy target is closer price alignment).
7 We assume some contractual obligations in the model. Take-or-pay volumes define minimum cross-border flows between
countries. So, fixing take-or-pay volumes is an alternative to fixing the historic volumes that leaves the model with some degree
of freedom at a specific cross-border point. 8 European gas transport tariffs are determined using the entry/exit approach. For details on this system: Hunt (2008). 9 See amongst others LECG (2011), P.1 and ERGEG (2006), P.10. 10 At a later stage, these simulated flows will also serve as a benchmark for future scenario model runs (where we change
assumptions on demand and supply patterns to see the effect on flow geography).
September 2016: European gas grid through the eye of the TIGER
10
After this assessment, we explored the reasons behind any deviations between the simulation and
reality. In order to do so we added some constraints on the TIGER historic simulation in order to move
from a “fully competitive” world to one where some contractual congestions exist, e. g. we simulated a
reduction in available transmission capacity. By including such constraints, we expected to obtain
resulting simulated gas flow patterns which were more similar to what we observed in reality.
3. Data
Historical daily gas flows between European hubs
Using the ENTSOG Transparency platform11 and information publicity available on TSOs’ websites,
data on daily historical gas flows and daily technically available transmission capacity for 2014 were
collected. Real daily interconnection capacity ‘utilization rates’ (or ‘load factor’) were computed for the
Interconnection Points (IP) where de-linkages occurred in 2014.
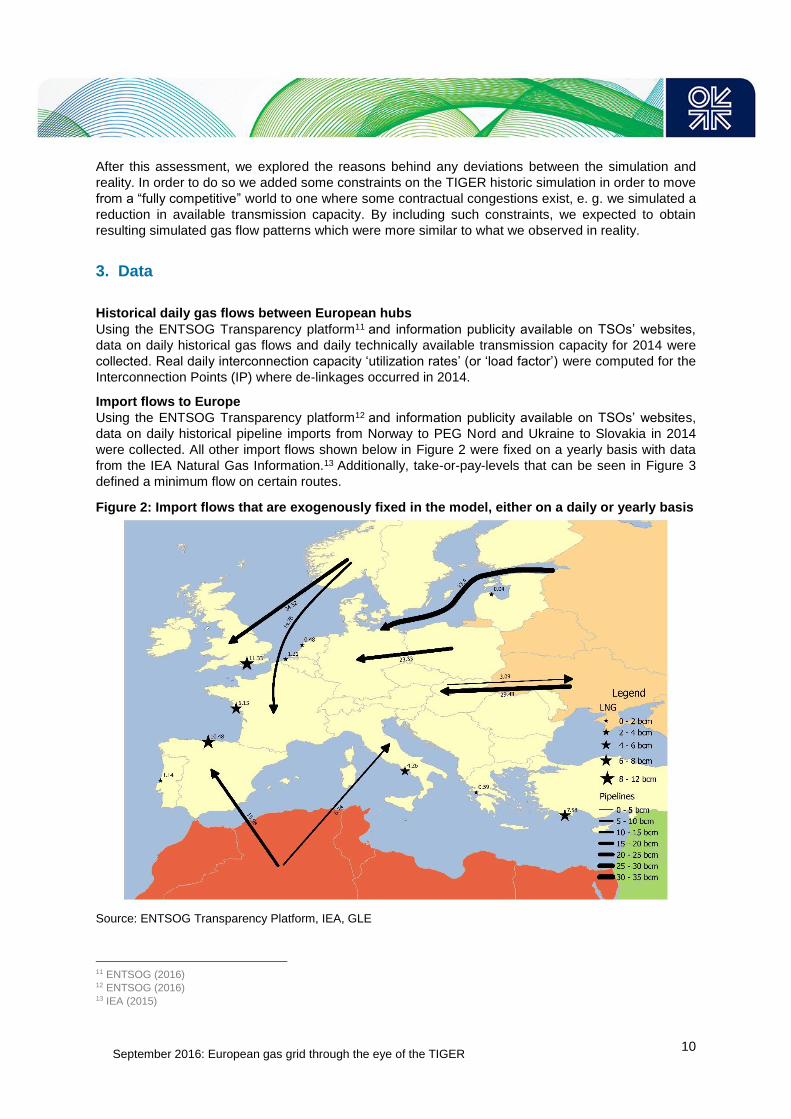
Import flows to Europe
Using the ENTSOG Transparency platform12 and information publicity available on TSOs’ websites,
data on daily historical pipeline imports from Norway to PEG Nord and Ukraine to Slovakia in 2014
were collected. All other import flows shown below in Figure 2 were fixed on a yearly basis with data
from the IEA Natural Gas Information.13 Additionally, take-or-pay-levels that can be seen in Figure 3
defined a minimum flow on certain routes.
Figure 2: Import flows that are exogenously fixed in the model, either on a daily or yearly basis
Source: ENTSOG Transparency Platform, IEA, GLE
11 ENTSOG (2016) 12 ENTSOG (2016) 13 IEA (2015)
September 2016: European gas grid through the eye of the TIGER
11
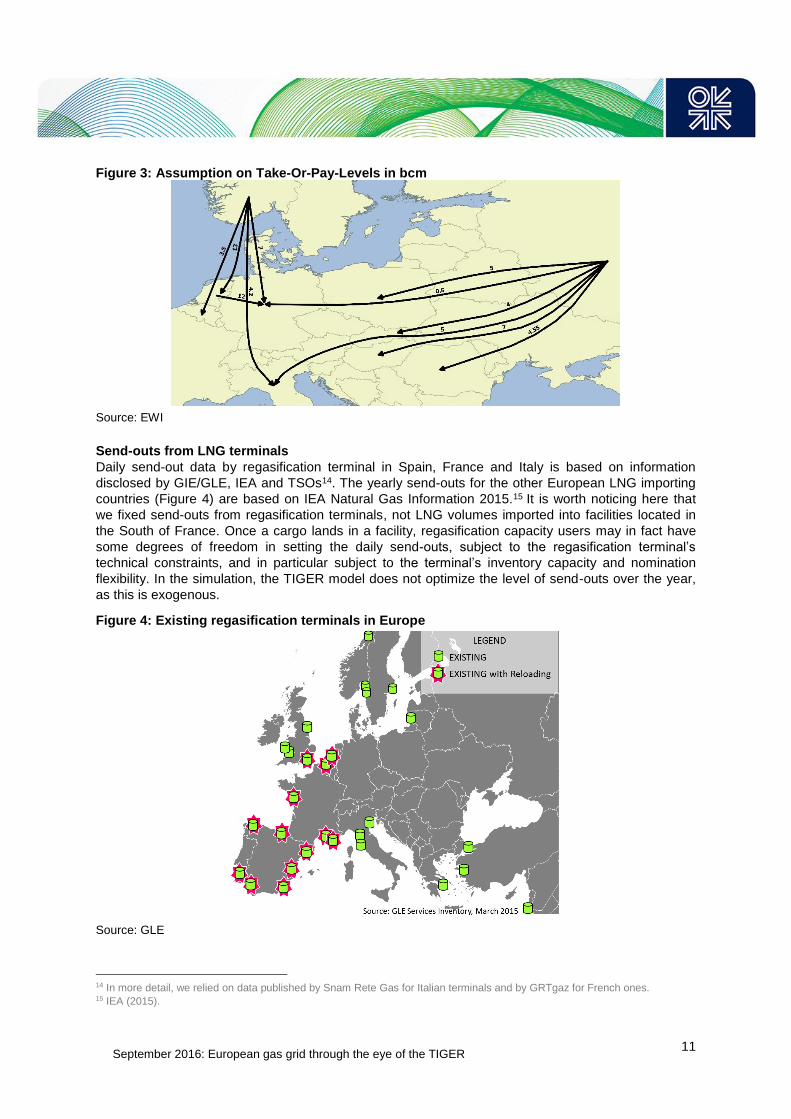
Figure 3: Assumption on Take-Or-Pay-Levels in bcm
Source: EWI
Send-outs from LNG terminals
Daily send-out data by regasification terminal in Spain, France and Italy is based on information
disclosed by GIE/GLE, IEA and TSOs14. The yearly send-outs for the other European LNG importing
countries (Figure 4) are based on IEA Natural Gas Information 2015.15 It is worth noticing here that
we fixed send-outs from regasification terminals, not LNG volumes imported into facilities located in
the South of France. Once a cargo lands in a facility, regasification capacity users may in fact have
some degrees of freedom in setting the daily send-outs, subject to the regasification terminal’s
technical constraints, and in particular subject to the terminal’s inventory capacity and nomination
flexibility. In the simulation, the TIGER model does not optimize the level of send-outs over the year,
as this is exogenous.
Figure 4: Existing regasification terminals in Europe
Source: GLE
14 In more detail, we relied on data published by Snam Rete Gas for Italian terminals and by GRTgaz for French ones. 15 IEA (2015).
September 2016: European gas grid through the eye of the TIGER
12
Storage injection/withdrawals
Storage levels at given points in time (January 1st, November 1st, December 31st 2014) were fixed
based on Gas Storage Europe daily data gas stocks at hub/site level.
Yearly domestic production
We use yearly production volumes based on IEA’s Natural Gas Information 2015. 16 The exact
production profile is endogenous to the model.
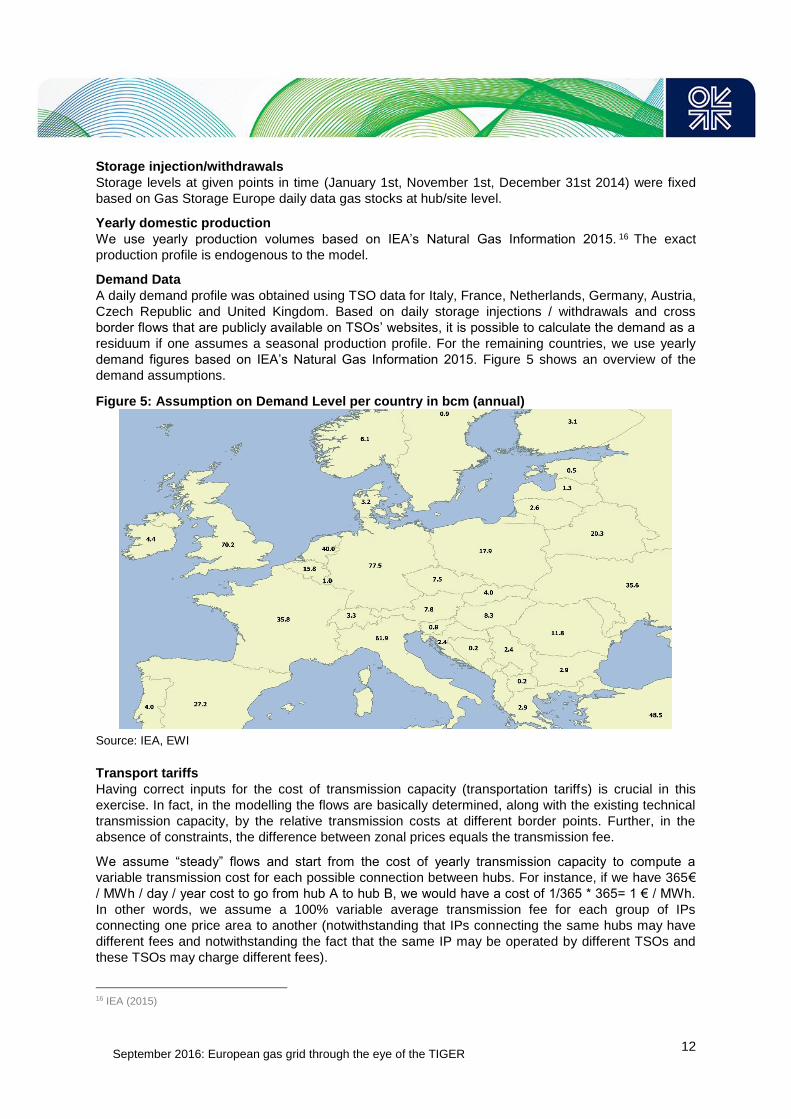
Demand Data
A daily demand profile was obtained using TSO data for Italy, France, Netherlands, Germany, Austria,
Czech Republic and United Kingdom. Based on daily storage injections / withdrawals and cross
border flows that are publicly available on TSOs’ websites, it is possible to calculate the demand as a
residuum if one assumes a seasonal production profile. For the remaining countries, we use yearly
demand figures based on IEA’s Natural Gas Information 2015. Figure 5 shows an overview of the
demand assumptions.
Figure 5: Assumption on Demand Level per country in bcm (annual)
Source: IEA, EWI
Transport tariffs
Having correct inputs for the cost of transmission capacity (transportation tariffs) is crucial in this
exercise. In fact, in the modelling the flows are basically determined, along with the existing technical
transmission capacity, by the relative transmission costs at different border points. Further, in the
absence of constraints, the difference between zonal prices equals the transmission fee.
We assume “steady” flows and start from the cost of yearly transmission capacity to compute a
variable transmission cost for each possible connection between hubs. For instance, if we have 365€
/ MWh / day / year cost to go from hub A to hub B, we would have a cost of 1/365 * 365= 1 € / MWh.
In other words, we assume a 100% variable average transmission fee for each group of IPs
connecting one price area to another (notwithstanding that IPs connecting the same hubs may have
different fees and notwithstanding the fact that the same IP may be operated by different TSOs and
these TSOs may charge different fees).
16 IEA (2015)
September 2016: European gas grid through the eye of the TIGER
13
Data on the cost of yearly transmission capacity are mainly based on the ACER Market Monitoring
Report 2013 (MMR).17 For those not included we researched using information disclosed by TSOs
and Energy Regulators. ACER 2013 MMR presents a simulation of cross-border charges for flowing 1
GWh/day/year by entry/exit IP, based on published tariffs and a “certain consumption profile”. Figures
provided by ACER are average charges, weighted by IP capacity level for those borders featuring
more than one IP or operated by more than one TSO applying different charges.
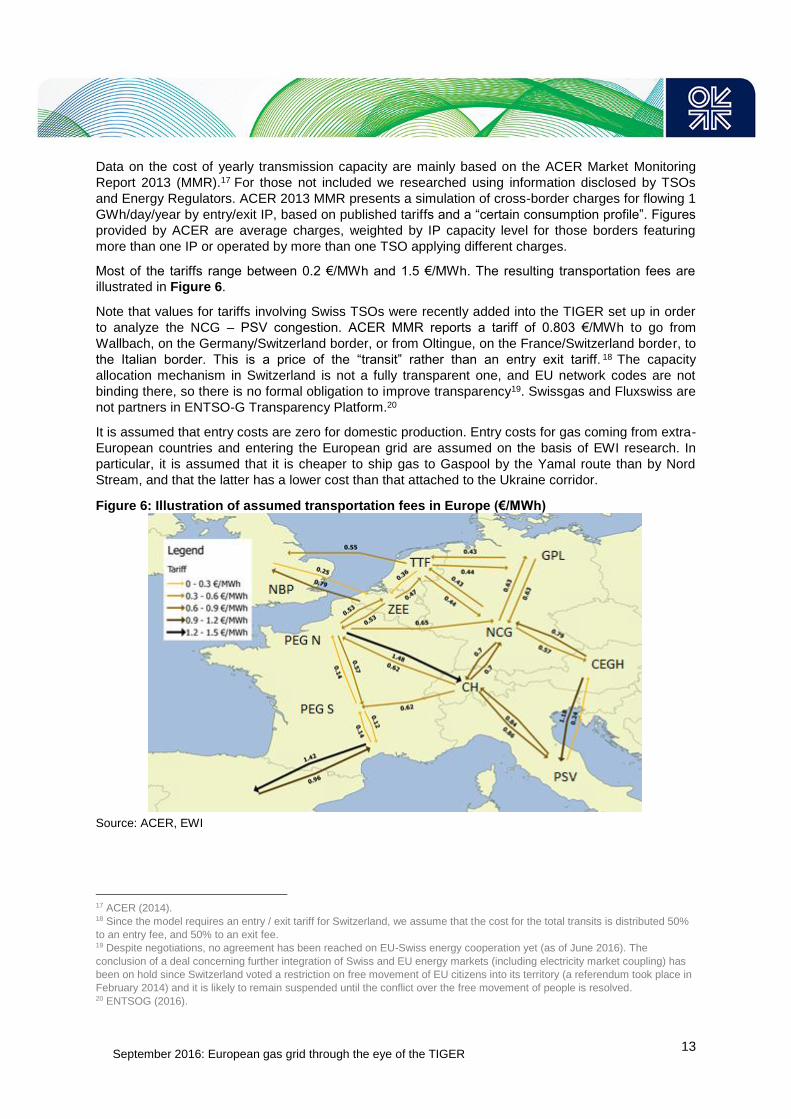
Most of the tariffs range between 0.2 €/MWh and 1.5 €/MWh. The resulting transportation fees are
illustrated in Figure 6.
Note that values for tariffs involving Swiss TSOs were recently added into the TIGER set up in order
to analyze the NCG – PSV congestion. ACER MMR reports a tariff of 0.803 €/MWh to go from
Wallbach, on the Germany/Switzerland border, or from Oltingue, on the France/Switzerland border, to
the Italian border. This is a price of the “transit” rather than an entry exit tariff. 18 The capacity
allocation mechanism in Switzerland is not a fully transparent one, and EU network codes are not
binding there, so there is no formal obligation to improve transparency19. Swissgas and Fluxswiss are
not partners in ENTSO-G Transparency Platform.20
It is assumed that entry costs are zero for domestic production. Entry costs for gas coming from extra-
European countries and entering the European grid are assumed on the basis of EWI research. In
particular, it is assumed that it is cheaper to ship gas to Gaspool by the Yamal route than by Nord
Stream, and that the latter has a lower cost than that attached to the Ukraine corridor.
Figure 6: Illustration of assumed transportation fees in Europe (€/MWh)
Source: ACER, EWI
17 ACER (2014). 18 Since the model requires an entry / exit tariff for Switzerland, we assume that the cost for the total transits is distributed 50%
to an entry fee, and 50% to an exit fee. 19 Despite negotiations, no agreement has been reached on EU-Swiss energy cooperation yet (as of June 2016). The
conclusion of a deal concerning further integration of Swiss and EU energy markets (including electricity market coupling) has
been on hold since Switzerland voted a restriction on free movement of EU citizens into its territory (a referendum took place in
February 2014) and it is likely to remain suspended until the conflict over the free movement of people is resolved. 20 ENTSOG (2016).
September 2016: European gas grid through the eye of the TIGER
14
Regasification costs
We do not take account of terminal specific regasification costs. This is in line with the assumption
that all gas supplies enter the European pipeline grid at the same cost. It also resembles a situation
where the cost of regasification capacity is regarded as a sunk cost for the user.
4. Re-running history in a fully competitive world
In this Chapter we analyse disparities and similarities between the historically observed and simulated
flows, focusing on the three IPs where bottlenecks were identified in 2014 using the price delinkage
approach21:
1) Wallbach IP, connecting NCG to Switzerland, on the route from the German NCG to the Italian PSV (Chapter 4.1); according to the price delinkage analysis the nature of the congestion at this border point is non-physical.
2) Oberkappel IP, at the German-Austrian border, in the direction towards Austria (Chapter 4.2), according to the price delinkage analysis the nature of the congestion at this border point is physical.
3) North-South Link connecting the Northern French gas market, the PEGN, to the Southern one, the PEGS (Chapter 4.3); according to the price delinkage analysis the nature of the congestion at this border point is physical.
4.1 NCG to PSV
As expected, the least cost simulation exploits capacity on the NCG-Switzerland-PSV pipeline
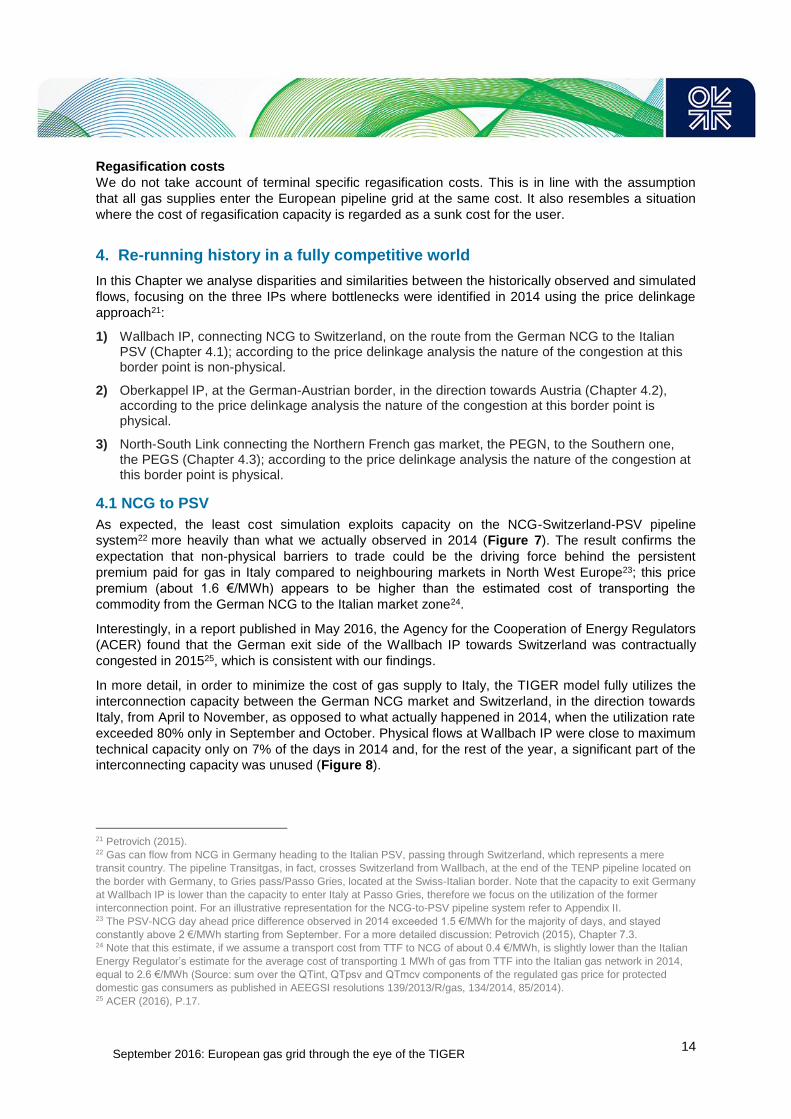
system22 more heavily than what we actually observed in 2014 (Figure 7). The result confirms the
expectation that non-physical barriers to trade could be the driving force behind the persistent
premium paid for gas in Italy compared to neighbouring markets in North West Europe23; this price
premium (about 1.6 €/MWh) appears to be higher than the estimated cost of transporting the
commodity from the German NCG to the Italian market zone24.
Interestingly, in a report published in May 2016, the Agency for the Cooperation of Energy Regulators
(ACER) found that the German exit side of the Wallbach IP towards Switzerland was contractually
congested in 201525, which is consistent with our findings.
In more detail, in order to minimize the cost of gas supply to Italy, the TIGER model fully utilizes the
interconnection capacity between the German NCG market and Switzerland, in the direction towards
Italy, from April to November, as opposed to what actually happened in 2014, when the utilization rate
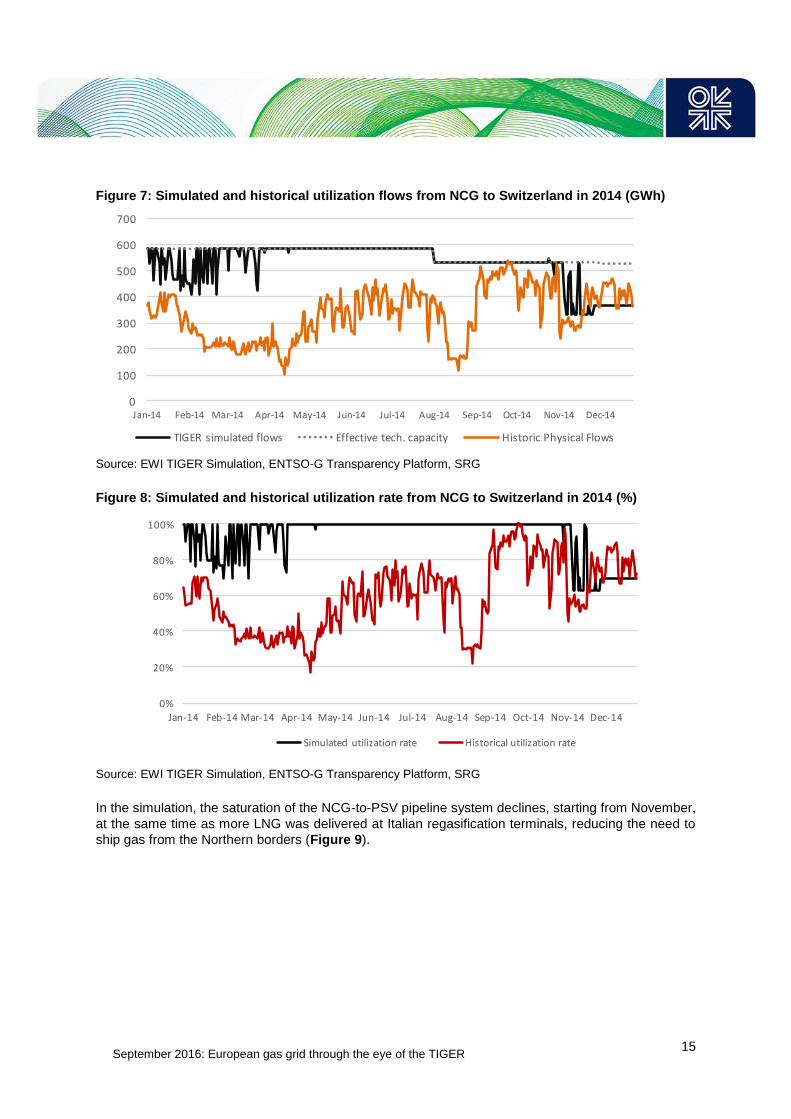
exceeded 80% only in September and October. Physical flows at Wallbach IP were close to maximum
technical capacity only on 7% of the days in 2014 and, for the rest of the year, a significant part of the
interconnecting capacity was unused (Figure 8).
21 Petrovich (2015). 22 Gas can flow from NCG in Germany heading to the Italian PSV, passing through Switzerland, which represents a mere
transit country. The pipeline Transitgas, in fact, crosses Switzerland from Wallbach, at the end of the TENP pipeline located on
the border with Germany, to Gries pass/Passo Gries, located at the Swiss-Italian border. Note that the capacity to exit Germany
at Wallbach IP is lower than the capacity to enter Italy at Passo Gries, therefore we focus on the utilization of the former
interconnection point. For an illustrative representation for the NCG-to-PSV pipeline system refer to Appendix II. 23 The PSV-NCG day ahead price difference observed in 2014 exceeded 1.5 €/MWh for the majority of days, and stayed
constantly above 2 €/MWh starting from September. For a more detailed discussion: Petrovich (2015), Chapter 7.3. 24 Note that this estimate, if we assume a transport cost from TTF to NCG of about 0.4 €/MWh, is slightly lower than the Italian
Energy Regulator’s estimate for the average cost of transporting 1 MWh of gas from TTF into the Italian gas network in 2014,
equal to 2.6 €/MWh (Source: sum over the QTint, QTpsv and QTmcv components of the regulated gas price for protected
domestic gas consumers as published in AEEGSI resolutions 139/2013/R/gas, 134/2014, 85/2014). 25 ACER (2016), P.17.
September 2016: European gas grid through the eye of the TIGER
15
Figure 7: Simulated and historical utilization flows from NCG to Switzerland in 2014 (GWh)
Source: EWI TIGER Simulation, ENTSO-G Transparency Platform, SRG
Figure 8: Simulated and historical utilization rate from NCG to Switzerland in 2014 (%)
Source: EWI TIGER Simulation, ENTSO-G Transparency Platform, SRG
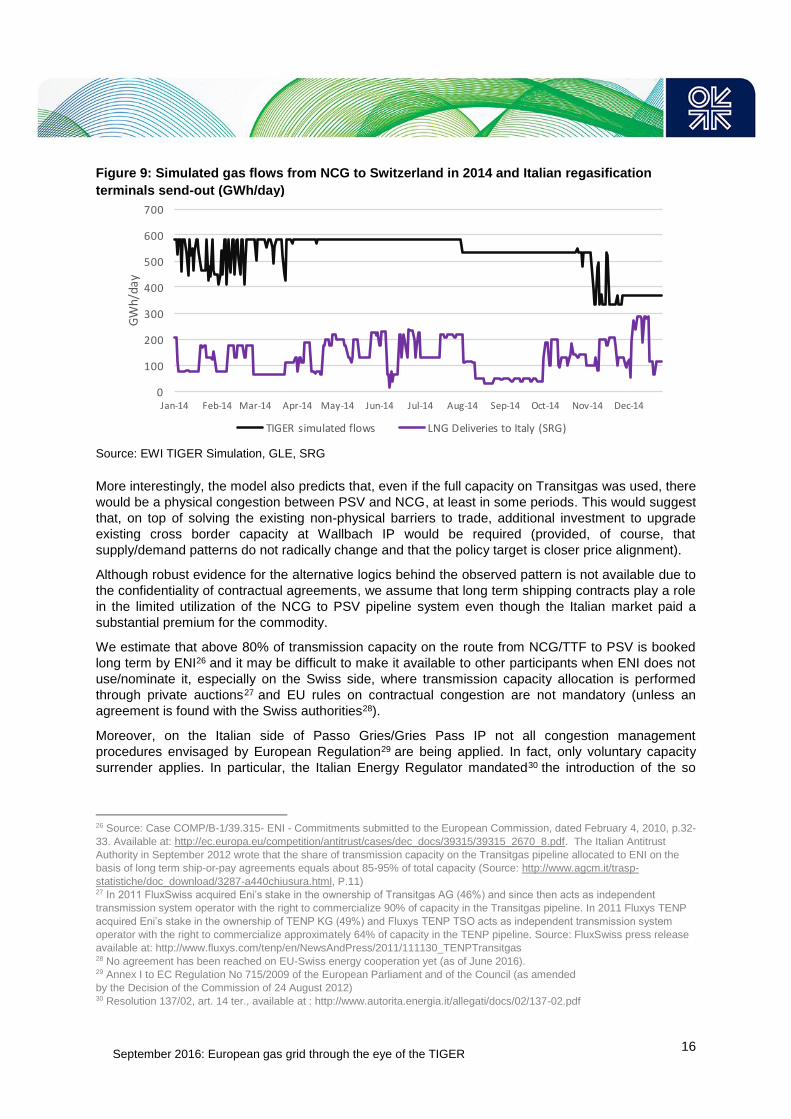
In the simulation, the saturation of the NCG-to-PSV pipeline system declines, starting from November,
at the same time as more LNG was delivered at Italian regasification terminals, reducing the need to
ship gas from the Northern borders (Figure 9).
0
100
200
300
400
500
600
700
Jan-14 Feb-14 Mar-14 Apr-14 May-14 Jun-14 Jul-14 Aug-14 Sep-14 Oct-14 Nov-14 Dec-14
GWh/day
NCG>CH
TIGERsimulatedflows Effectivetech.capacity HistoricPhysicalFlows
0%
20%
40%
60%
80%
100%
Jan-14 Feb-14 Mar-14 Apr-14 May-14 Jun-14 Jul-14 Aug-14 Sep-14 Oct-14 Nov-14 Dec-14
Simulatedutilizationrate Historicalutilizationrate
September 2016: European gas grid through the eye of the TIGER
16
Figure 9: Simulated gas flows from NCG to Switzerland in 2014 and Italian regasification
terminals send-out (GWh/day)
Source: EWI TIGER Simulation, GLE, SRG
More interestingly, the model also predicts that, even if the full capacity on Transitgas was used, there
would be a physical congestion between PSV and NCG, at least in some periods. This would suggest
that, on top of solving the existing non-physical barriers to trade, additional investment to upgrade
existing cross border capacity at Wallbach IP would be required (provided, of course, that
supply/demand patterns do not radically change and that the policy target is closer price alignment).
Although robust evidence for the alternative logics behind the observed pattern is not available due to
the confidentiality of contractual agreements, we assume that long term shipping contracts play a role
in the limited utilization of the NCG to PSV pipeline system even though the Italian market paid a
substantial premium for the commodity.
We estimate that above 80% of transmission capacity on the route from NCG/TTF to PSV is booked
long term by ENI26 and it may be difficult to make it available to other participants when ENI does not
use/nominate it, especially on the Swiss side, where transmission capacity allocation is performed
through private auctions27 and EU rules on contractual congestion are not mandatory (unless an
agreement is found with the Swiss authorities28).
Moreover, on the Italian side of Passo Gries/Gries Pass IP not all congestion management
procedures envisaged by European Regulation29 are being applied. In fact, only voluntary capacity
surrender applies. In particular, the Italian Energy Regulator mandated30 the introduction of the so
26 Source: Case COMP/B-1/39.315- ENI - Commitments submitted to the European Commission, dated February 4, 2010, p.32-
33. Available at: http://ec.europa.eu/competition/antitrust/cases/dec_docs/39315/39315_2670_8.pdf. The Italian Antitrust
Authority in September 2012 wrote that the share of transmission capacity on the Transitgas pipeline allocated to ENI on the
basis of long term ship-or-pay agreements equals about 85-95% of total capacity (Source: http://www.agcm.it/trasp-
statistiche/doc_download/3287-a440chiusura.html, P.11) 27 In 2011 FluxSwiss acquired Eni’s stake in the ownership of Transitgas AG (46%) and since then acts as independent
transmission system operator with the right to commercialize 90% of capacity in the Transitgas pipeline. In 2011 Fluxys TENP
acquired Eni’s stake in the ownership of TENP KG (49%) and Fluxys TENP TSO acts as independent transmission system
operator with the right to commercialize approximately 64% of capacity in the TENP pipeline. Source: FluxSwiss press release
available at: http://www.fluxys.com/tenp/en/NewsAndPress/2011/111130_TENPTransitgas 28 No agreement has been reached on EU-Swiss energy cooperation yet (as of June 2016). 29 Annex I to EC Regulation No 715/2009 of the European Parliament and of the Council (as amended
by the Decision of the Commission of 24 August 2012) 30 Resolution 137/02, art. 14 ter., available at : http://www.autorita.energia.it/allegati/docs/02/137-02.pdf
0
100
200
300
400
500
600
700
Jan-14 Feb-14 Mar-14 Apr-14 May-14 Jun-14 Jul-14 Aug-14 Sep-14 Oct-14 Nov-14 Dec-14
GWh/day
NCG>CH
TIGERsimulatedflows LNGDeliveriestoItaly(SRG)
September 2016: European gas grid through the eye of the TIGER
17
called “long term use-it-or-loose-it (LT UIOLI)” congestion management procedure31 in 2013, which
should have been implemented at all the Northern entry points to the Italian gas grid (namely Passo
Gries/Gries Pass at the Swiss border, Tarvisio at the Austrian border and Gorizia at the border with
Slovenia). However, this procedure has not been implemented yet (as of June 2016). In June 2014
the Italian gas TSO Snam Rete Gas published and launched an open consultation on a first proposal
to review its Network Code in order to introduce LT UIOLI32 that still remained on paper. A new
proposal on the same procedure was then presented by the Italian gas TSO to the Regulator in
December 2014, who in turn opened another consultation on it, expiring at the end of March 201633.
Notwithstanding the absence of a mandatory release of unused capacity on the Swiss-Italian border,
in response to an antitrust competition inquiry, ENI committed to release part of its transmission
capacity booked on a long term basis on the TENP-Transitgas route, through subsequent system-
marginal-price auctions34 to be held from September 2012 to October 2017. However, it is possible
that some of these auctions did not clear as no player was interested in getting that capacity at the
minimum prices requested by ENI. The results of such auctions are not publicly available, but they
concern gas year and six-month capacity products and their reserve price is equal to transmission
tariffs paid by ENI to TSOs involved in the TENP-Transitgas, plus a "reasonable margin"35.
Even if the capacity release programme was not successful, some long term booked capacity, when
not used by ENI, may have been made available to the market either on the secondary market, or by
means of sales of interruptible capacity by the TSOs involved. However, insufficiently flexible capacity
allocation procedures may have been a further obstacle to ship gas from Germany to Italy, via
Switzerland, so explaining why existing flows do not conform to 'pure economic logic' on the Germany
to Italy route.
The partial exploitation of the Transitgas pipeline system, allowed by long term capacity booking and
lack of coordination in the allocation procedures, has repercussions on other portions of the European
grid, a fact that is assessed in the next Chapter.
4.2 NCG to CEGH
The comparison between history and simulation for Oberkappel IP36 suggests that existing flows do
not conform to 'pure economic logic' on the Germany to Austria route. In fact, while in 2014 Germany-
to-Austria cross border capacity at this border point was constantly near to saturation starting from
April, the model does not reproduce this physical bottleneck (Figure 10). In fact, the cost minimising
model never ships gas from Germany to Austria, unless it is necessary to compensate for the
cessation of Russian supply to Ukraine, as happened in October and November (Figure 11).
31 EC Regulation No 715/2009, paragraph 2.2.5. of Annex 1 mandates that regulatory authorities require TSOs to partly or fully
withdraw contracted capacity that is systematically underutilized on an interconnection point by a network user where the latter
has not offered his unutilized capacity under reasonable conditions and where other network users request firm capacity. 32 Proposal to amend Snam Rete Gas Network Code n.29, available at:
http://www.snamretegas.it/it/servizi/Codice_di_rete/Aree/aggiornamento.html 33 AEEGSI consultation document 60/2016/R/gas, available at: http://www.autorita.energia.it/it/docs/dc/16/060-16.jsp (unofficial
English translation available at: http://www.autorita.energia.it/allegati/inglese/060-16eng.pdf) 34 The commitment was undertaken in 2012 by ENI in response to an antitrust competition inquiry carried out by the Italian
Antitrust Authority for alleged abuse of dominant position. Source: http://www.agcm.it/trasp-statistiche/doc_download/3287-
a440chiusura.html 35 Source: http://www.agcm.it/trasp-statistiche/doc_download/3287-a440chiusura.html . 36 Please refer to Appendix II for an illustrative representation of Oberkappel IP. Note that gas may flow from Austria to
Germany passing via Oberkappel IP (technical capacity equal to 159.9 GWh/d), Überackern ABG/ Burghausen IP (technical
capacity equal to 54.3 GWh/d) and Überackern SUDAL / Burghausen IP (technical capacity equal to 230.1 GWh/d) (Source:
ENTSO-G Capacity Map June 2014). Flows at Überackern ABG/ Burghausen IP and Überackern SUDAL / Burghausen IP are
influenced by the fact that they are connected to large gas storage facilities in Austria (please refer to Appendix II for details).
September 2016: European gas grid through the eye of the TIGER
18
Figure 10: Simulated and historical flows from NCG to CEGH in 2014 (GWh)
Source: EWI TIGER Simulation, ENTSO-G Transparency Platform
Figure 11: Simulated flows from NCG to CEGH (% firm technical capacity, left; GWh, right) and
historical flows between Ukraine and Slovakia in 2014 (GWh, right)
Source: EWI TIGER Simulation, ENTSO-G Transparency Platform
The simulation suggests that the historically observed bottleneck at Oberkappel IP does not emerge
because the route from Germany to Switzerland is fully utilized, contrary to what we saw in 2014 (see
the analysis presented in Chapter 4.1), alleviating the pressure on the Germany to Austria pipeline
route. If we introduce an exogenous constraint that limits the exploitation of the NGC-to-Switzerland
pipeline system at 70% of the existing firm technical capacity - trying to reproduce the non-physical
barriers to ship gas from North West Europe down to the higher priced Italian market - then the model
reproduces the physical bottleneck between Germany and Austria that we witnessed in 2014 (Figure
12).
0
50
100
150
200
250
300
Jan-14 Feb-14 Mar-14 Apr-14 May-14 Jun-14 Jul-14 Aug-14 Sep-14 Oct-14 Nov-14 Dec-14
GWh/day
TIGERsimulatedflows Effectivetech.capacity HistoricPhysicalFlows
0%
20%
40%
60%
80%
100%
J-14
F-14
M-14
A-14
M-14
J-14
J-14
A-14
S-14
O-14
N-14
D-14
simulatedutilizationrate
0
200
400
600
800
1,000
1,200
1,400
1,600
1,800
2,000
J-14
F-14
M-14
A-14
M-14
J-14
J-14
A-14
S-14
O-14
N-14
D-14
GWh/day
TIGERsimulatedflows HistoricUA>SKflows
September 2016: European gas grid through the eye of the TIGER
19
Figure 12: Flows from NCG to CEGH (% firm technical capacity), capping NCG-to-Switzerland
transmission capacity at 70% of existing firm technical capacity (left) and without any
restriction on NCG-to-Switzerland capacity (right)
Source: EWI TIGER Simulation, ENTSO-G Transparency Platform
The sensitivity therefore suggests that the heavy utilization rate at Oberkappel IP in the direction from
German NCG to the Austrian VTP is linked to gas flows coming from North West Europe that head to
Italy and pass through Austria, instead of Switzerland where transit may not be fully exploited. The
good price correlation between the Austrian VTP and PSV in 2014, which is stronger than the price
correlation between the former and NCG37, confirms the link between the Austrian and the Italian gas
markets.
(Figure 13) shows a comparison of the inflows and outflows for 2014 to Italy from the TIGER
simulated sensitivities and historical flows based on IEA (2015). It can be seen that there is a shift of
approximately 4 bcm from Swiss transit to Austrian transit to Italy when the capacity from NCG to
Switzerland is reduced. The real flows through Austria and Switzerland to Italy were between the
values in the TIGER sensitivities, implying that we overestimate the contractual bottleneck by
assuming a general 70% cap of the technical capacity.
37 For details please refer to Petrovich (2015).
0%
20%
40%
60%
80%
100%
J-14
F-14
M-14
A-14
M-14
J-14
J-14
A-14
S-14
O-14
N-14
D-14
simulatedutilizationrate(NCG-to-PSVcapacitycappedat70%)
0%
20%
40%
60%
80%
100%
J-14
F-14
M-14
A-14
M-14
J-14
J-14
A-14
S-14
O-14
N-14
D-14
simulatedutilizationrate
September 2016: European gas grid through the eye of the TIGER
20
Figure 13: Yearly inflows- and outflows to / from Italy in 2014 in the TIGER simulated
sensitivities and in reality
Note: positive values represent inflows into the Italian PSV, negative values represent outflows from the Italian
PSV; exports to Slovenia are virtually zero in both historical data and simulation
Source: EWI TIGER Simulation, IEA (2015)
This shift from Swiss transit to Austrian transit to Italy, which occurs when the capacity from NCG to
Switzerland is reduced, results in a significant increase in gas imports from German NCG into Austria,
which transit through the Austrian VTP and head to Italy (Figure 14).
Figure 14: Yearly inflows- and outflows to / from Austria in 2014 in the TIGER simulated
sensitivities38
Note: positive values represent inflows into the Austria VTP, negative values represent outflows from the Austrian
VTP
Source: EWI TIGER Simulation
38 Note a comparison with IEA (2015) data is not presented in the chart, due to inconsistency in reporting inflows and outflows
to the Austrian market between IEA and our methodology.
13.79.4 11.3
24.228.5 26.1
-10
0
10
20
30
40
50
60
70
TIGER100%NCG>CH TIGER70%NCG>CH IEA2015
bcm
CH AT DZ LY SI Dom.production Storage LNG
1.7 4.9
-24.2 -28.5
-40
-30
-20
-10
0
10
20
30
40
50
TIGERfullNCG>CH TIGERreducedNCG>CH
bcm
DE IT SK SI Production Storage
September 2016: European gas grid through the eye of the TIGER
21
It should be noted here that the Oberkappel IP configuration may favour the emergence of a
bottleneck between Germany and Austria due to the disparity between the entry and exit capacities,
and pressure in the MEGAL pipeline system in Germany. In fact, in the Germany to Austria direction,
at Oberkappel IP the entry capacity to Austria is greater than the exit capacity from Germany (250
GWh/d vs 200 GWh/d39). Interruptible capacity is offered by the TSOs operating this IP to reduce the
mismatch but it is not enough to solve the bottleneck, also due to pressure constraints in the German
system.
Physical transmission capacity between Germany and Austria may be expanded in the future. In
particular, the SEL project aims at connecting Überackern-Burghausen IP at the German-Austrian
border with the Mannheim area, improving access to the Austrian market area. In particular, the SEL
project consists of two sections: the MONACO 1 that ends near Munich and a second line, MONACO
II. According to the German Gas Grid Development plan, the SEL project has the potential to
strengthen the transit capacity towards Austria40. In particular, through the commissioning of the first
section of MONACO 1, shippers should have further possibilities for gas transport between the NCG
and CEGH41.
4.3 PEGN to PEGS
Turning to the flows between Northern and Southern France, the model reproduces a very similar
pattern to the one we see in historical flows (Figure 15): permanent physical congestion until
November 2014.
Figure 15: Simulated and historical flows from PEGN to PEGS in 2014 (GWh)
Source: EWI TIGER Simulation, GRTgaz
The emergence of the historically observed French bottleneck in the perfect competition simulation
confirms that the disconnection between PEGN and PEGS (and the corresponding price delinkage
39 Source: firm technical capacity data retrieved from ENTSOG Transparency Platform (data available from Oct-2013 exit from
NCG and from October 2014 for entry to Austria). 40 Source: Gas Connect Austria, Coordinated Network Development Plan 2016-2025, Version: 06/07/2015, P.12. Gas Connect
Austria (GCA) acts as the market area manager (MAM) in Austria and, pursuant to section 14 para. 1 no. 7 of the Austrian
Natural Gas Act, has to draft the Coordinated Network Development Plan (CNDP) in coordination with Austria's transmission
system operators (TSOs) for the planning period from 2015 to 2024. 41 Source: Gas Connect Austria, Coordinated Network Development Plan 2016-2025, Version: 06/07/2015, P.12.
0
50
100
150
200
250
300
350
400
450
500
Jan-14 Feb-14 Mar-14 Apr-14 May-14 Jun-14 Jul-14 Aug-14 Sep-14 Oct-14 Nov-14 Dec-14
GWh/day
TIGERsimulatedflows Effectivetech.capacity HistoricPhysicalflows
September 2016: European gas grid through the eye of the TIGER
22
between the two market zones) is linked to insufficient cross border transmission capacity between
the two market zones in France, when LNG is scarce in PEGS42.
Reproducing relatively well what happened in 2014 in the simulation, the bottleneck solves in the two
last months of the year, following a peak in LNG sendout from the Fos Caveau regasification terminal
located in the South of France, occurring around November 2014. The increased availability of gas in
PEGS reduces the need to import from PEGN so alleviating the congestion on the North-South link
(Figure 16).
Figure 16: Simulated flows from PEGN to PEGS in 2014 (% firm technical capacity, left; GWh,
right) and sendout from Fos regasification terminal (GWh, right)
Source: EWI TIGER Simulation, GRTgaz
TIGER simulation also shows that the following factors43 are key in determining PEGN to PEGS flows
and hence congestion between the two zones:
Send-outs from LNG terminals in the South of France, which are in turn driven by LNG diversion to Asia, as explained in Petrovich (2015),
Gas exports from the South of France to Spain, which are in turn driven by LNG diversion to Asia and LNG re-loads from Spanish LNG terminals, as explained in Petrovich (2015),
Tariffs from France to Switzerland: if we assume low tariffs from PEGN to Switzerland, gas is shipped from PEGN to Switzerland (heading to Italy) rather than from PEGN to PEGS44.
In summary, this result confirms that the nature of the bottleneck between PEGN and PEGS is
physical and corroborates the argument that if more transmission capacity was made available in the
42 PEGS is supplied by pipeline gas arriving from the North and from Southern France LNG terminals (Fos Cavaou and Fos
Tokin); PEGS also exports gas to Spain. 43 In addition to the factors mentioned here it is worth saying that problems in the operational functioning of the N-S link (such
as maintenance) can also lead to physical congestion. Problems in the operational functioning are signalled through the ratio
between effective available firm capacity on the N-S link and maximum firm technical capacity. In the simulation we fixed firm
capacity on the N-S link according to the daily effective available firm capacity as published by GRTgaz. 44 Swiss tariffs not only impact PEGN to Switzerland exports, but also flows in the NCG-PSV direction.
0%
20%
40%
60%
80%
100%
J-14
F-14
M-14
A-14
M-14
J-14
J-14
A-14
S-14
O-14
N-14
D-14
Simulatedutilizationrate
0
100
200
300
400
500
J-14
F-14
M-14
A-14
M-14
J-14
J-14
A-14
S-14
O-14
N-14
D-14
GWh/day
TIGERsimulatedflows LNGSendoutFOS
September 2016: European gas grid through the eye of the TIGER
23
North to South direction this would most likely favour the creation of a single price for natural gas
within France in times of LNG scarcity in the South of France and high exports to Spain.
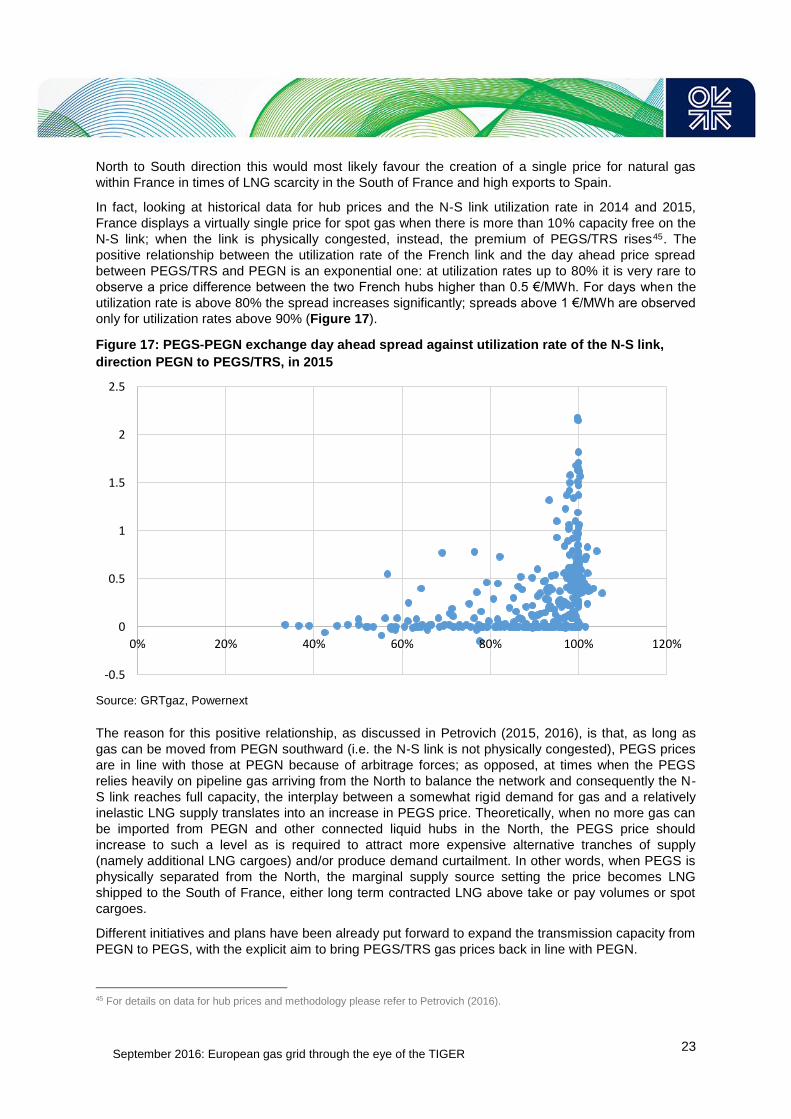
In fact, looking at historical data for hub prices and the N-S link utilization rate in 2014 and 2015,
France displays a virtually single price for spot gas when there is more than 10% capacity free on the
N-S link; when the link is physically congested, instead, the premium of PEGS/TRS rises45. The
positive relationship between the utilization rate of the French link and the day ahead price spread
between PEGS/TRS and PEGN is an exponential one: at utilization rates up to 80% it is very rare to
observe a price difference between the two French hubs higher than 0.5 €/MWh. For days when the
utilization rate is above 80% the spread increases significantly; spreads above 1 €/MWh are observed
only for utilization rates above 90% (Figure 17).
Figure 17: PEGS-PEGN exchange day ahead spread against utilization rate of the N-S link,
direction PEGN to PEGS/TRS, in 2015
Source: GRTgaz, Powernext
The reason for this positive relationship, as discussed in Petrovich (2015, 2016), is that, as long as
gas can be moved from PEGN southward (i.e. the N-S link is not physically congested), PEGS prices
are in line with those at PEGN because of arbitrage forces; as opposed, at times when the PEGS
relies heavily on pipeline gas arriving from the North to balance the network and consequently the N-
S link reaches full capacity, the interplay between a somewhat rigid demand for gas and a relatively
inelastic LNG supply translates into an increase in PEGS price. Theoretically, when no more gas can
be imported from PEGN and other connected liquid hubs in the North, the PEGS price should
increase to such a level as is required to attract more expensive alternative tranches of supply
(namely additional LNG cargoes) and/or produce demand curtailment. In other words, when PEGS is
physically separated from the North, the marginal supply source setting the price becomes LNG
shipped to the South of France, either long term contracted LNG above take or pay volumes or spot
cargoes.
Different initiatives and plans have been already put forward to expand the transmission capacity from
PEGN to PEGS, with the explicit aim to bring PEGS/TRS gas prices back in line with PEGN.
45 For details on data for hub prices and methodology please refer to Petrovich (2016).
-0.5
0
0.5
1
1.5
2
2.5
0% 20% 40% 60% 80% 100% 120%
September 2016: European gas grid through the eye of the TIGER
24
In particular, for the winter 2014/15 backhaul capacity at the Jura interconnection point, located at the
Swiss-French border, provided additional access to the French South zone from either Oltingue
(PEGN) or Wallbach (NCG) entry points to the Swiss network, provided that the physical flows in the
direction from France towards Switzerland are positive. This contractual solution was in fact designed
in order to reduce price tension in the South of France; however, despite this attempt, according to
GRTgaz, no capacity in the Switzerland to France direction was offered at Jura IP in 2014. This said,
capacity at Jura IP accounts for 5 GWh/d, compared to 438 GWh/d firm capacity on the N-S link.
The N-S link remains therefore the main infrastructure linking PEGS to PEGN and, indirectly, other
liquid hubs in North West Europe46. For this reason, the ENTSOG Ten Year Network Development
Plan (TYNDP) 2015 includes projects aiming at the reinforcement of the North-South link: the Arc de
Dierrey47 project and the Val de Saone48 projects. According to the TYNDP in fact “the purpose of the
Val de Saône project (along with the Gascogne-Midi project) is to remove the constraints on North to
South gas flows in France, thus enabling to increase the potential share of gas imported by pipelines
from the North of Europe within the South-Western part of the European market. In terms of market
design, the Val de Saône project allows the creation of a single market area in France. This will bring
a final solution to higher prices of gas in South of France and Iberian Peninsula”.49
Finally, although this is out of the scope of this exercise, it is worth pointing out that, in a global gas
market connected by flexible LNG cargoes50, the spread between European hub gas prices may be
cancelled out through arbitrage via LNG, provided that there are no barriers in access to regasification
capacity.
In this regard it could be observed that, even when the PEGS price is at a significant premium
compared to PEGN, LNG supply remains rather rigid, and the utilization rate of the existing
regasification capacity in the South of France remains low (in 2015, the Fos terminals’ utilization rate
exceeded 60% only in April and September51), signalling that there is either no possibility or no
incentive to send a spot LNG cargo to the terminal to exploit the differential. The reason for the
underutilization of LNG regasification capacity at times when PEGS was physically separated from
the North, and priced at a significant premium, was most likely the existence of more attractive resale
options (diversion to Asia or indeed re-loading LNG from storage tanks to resell in Asia). Since mid-
2014, with the significant drop in Asian LNG spot prices52, the persistence of a high PEGS premium,
an underutilization of the Fos Cavaou and Fos Tokin terminals and relatively high inventory levels in
the French LNG facilities may suggest that there are some rigidities/barriers in procuring
regasification capacity for spot cargoes and/or maximising send out.
5. Conclusions
Barriers remain to the free trade of gas between some of the main European gas hubs, as shown by
recurrent price misalignment between relatively large and mature gas consuming zones: between
Northern and Southern France, between Germany and Austria and between North West European
hubs and the Italian market.
Our analysis aims to explore the driving forces behind such disconnections, and in particular whether
these would be present in a fully competitive setting where all gas suppliers to Europe are price takers
46 Source: http://www.grtgaz.com/fileadmin/newsletter/shiponline/shiponline_80_site_EN.html 47 http://www.grtgaz.com/en/press/press-releases/arc-de-dierrey-pipeline.html?fb_locale=fr_FR 48 http://www.grtgaz.com/en/major-projects/val-de-saone-project/presentation/news/val-de-saone-project.html 49 Source: sheet “expected benefits” in of annex A in the TYNDP 2015 available at:
http://www.entsog.eu/publications/tyndp#ENTSOG-TEN-YEAR-NETWORK-DEVELOPMENT-PLAN-2015. 50 Availability of flexible LNG cargoes is a plausible situation in a global gas market where LNG supply is not tight. For details
on scenarios for LNG imports to Europe please refer to Rogers (2015). 51 Calculation of Southern France regasification terminal usage is based on GIE LNG map and GRTgaz data. 52 For details on global gas pricing: Rogers (2015).
September 2016: European gas grid through the eye of the TIGER
25
and the use of cross-border transmission capacity is optimized (i.e. where the existing infrastructure is
exploited to the limit to carry out arbitrage activities and the transport costs are minimized).
Our analysis adopts as a benchmark the least cost flow pattern within the European grid determined
by the TIGER model created by EWI, for a selected calendar year (2014) once we fix key
import/export flows, domestic production and demand at historically observed levels.
By ‘re-running history’, we verified the physical nature of the bottleneck within the French grid and the
sub-optimal utilization of transmission capacity on the NCG-Switzerland-Italy route, which in turn
contributes to heavy gas flows in the Germany to Austria direction that do not conform to 'pure
economic logic' and lead to recurrent disconnection of the Austrian market.
In more detail, the presence of long term shipping contracts on the Transitgas route, difficulties in
making transmission capacity available to other participants when not nominated by the original
owner and insufficiently flexible capacity allocation procedures appear to be obstacles to shipping gas
on a spot basis from Germany to Italy, via Switzerland. However, the confidentiality of shipping
contract terms and bookings on this route does not allow to us to establish robust evidence for this
argument.
The somewhat limited possibility to fully exploit the Transitgas pipeline system creates a case for
shipping gas from the liquid gas markets to Italy through Austria. This alternative route to the PSV
puts pressure on the Oberkappel IP and increases the need to ship gas eastward from German via
Austria. This situation was exacerbated when the cessation of Russian supply to Ukraine in the
second half of 2014 led to substantial reverse (eastward) flow. The request to move significant
volumes from NCG to the Austrian VTP led to the saturation of the transmission capacity at
Oberkappel and hence to physical congestion between Germany and Austria.
Turning to the French case study, the comparison between reality and simulation for gas flow
between the two main French market zones corroborates the argument that if more transmission
capacity was made available in the North to South direction this would most likely favour the creation
of a single price for natural gas within France in times of LNG scarcity in the South of France and high
exports to Spain.
This work complements and corroborates the findings of the price delinkage analysis carried out by
OIES to identify the remaining barriers to free trade of natural gas in Europe. Further, it paves the way
for projecting this historic analysis into a relevant forward looking exercise. More specifically, a natural
follow up would be to use the TIGER model to simulate future bottlenecks in the European gas grid in
the possible scenarios for key global gas fundamentals post 2015, as identified by recent OIES
research53.
OIES research proved that even in a mature and well integrated European gas market, it may happen
that for some periods, as a consequence of changes in gas flow patterns across Europe, a hub may
split from the others and display a price dynamic which is completely different compared to the others,
possibly resulting in higher costs.
Anticipating the future bottlenecks would help to assess whether there is a case for developing
suitable frameworks/incentives aimed at mitigating the potential future factors reducing price
integration in the European gas market.
53 Rogers (2015)
September 2016: European gas grid through the eye of the TIGER
26
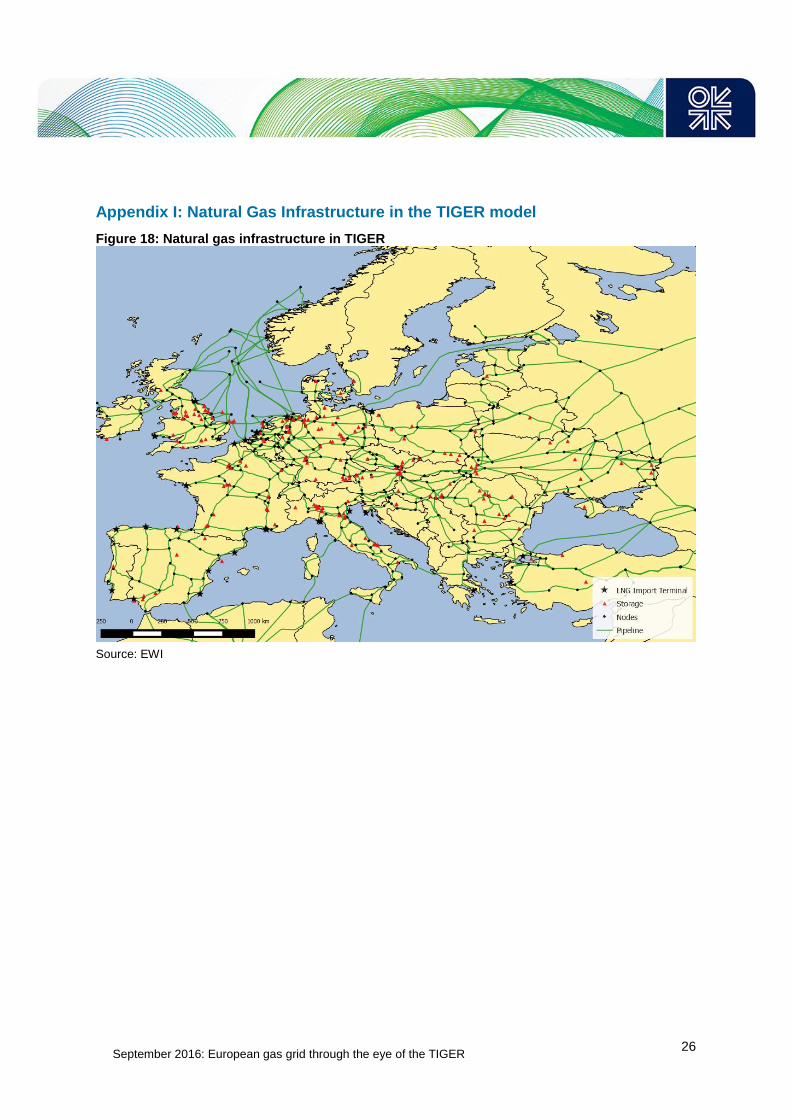
Appendix I: Natural Gas Infrastructure in the TIGER model
Figure 18: Natural gas infrastructure in TIGER
Source: EWI
September 2016: European gas grid through the eye of the TIGER
27
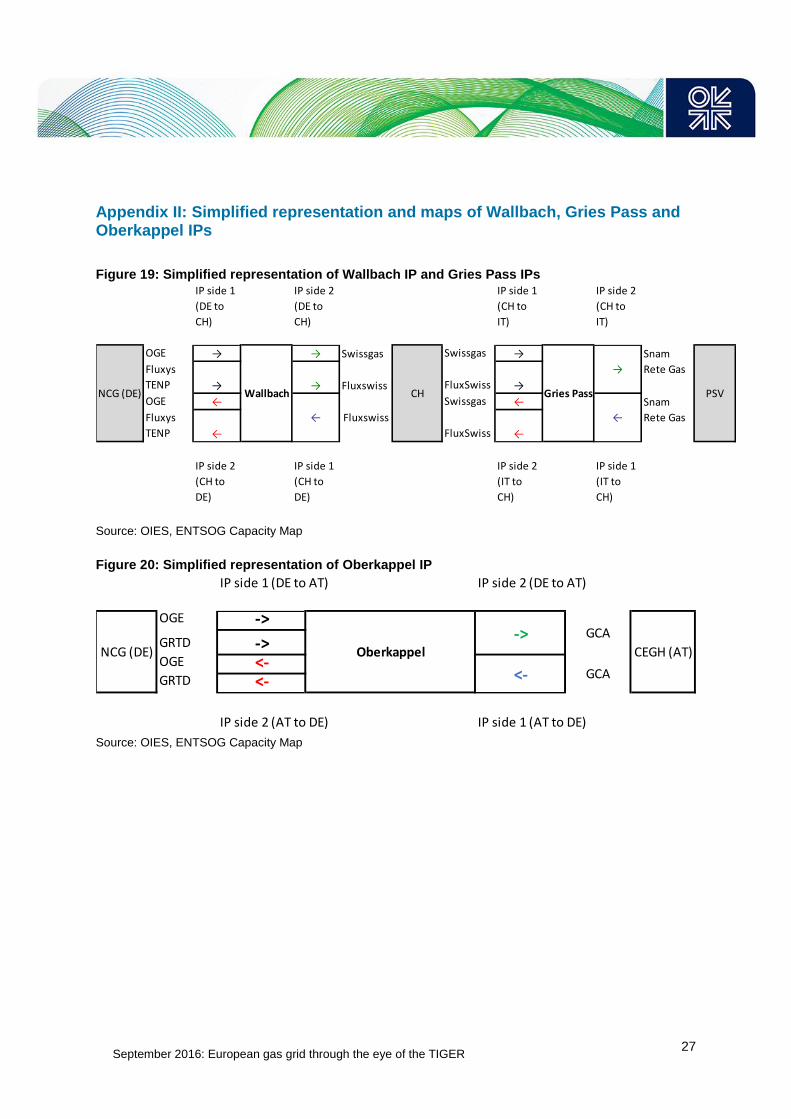
Appendix II: Simplified representation and maps of Wallbach, Gries Pass and Oberkappel IPs
Figure 19: Simplified representation of Wallbach IP and Gries Pass IPs
Source: OIES, ENTSOG Capacity Map
Figure 20: Simplified representation of Oberkappel IP
Source: OIES, ENTSOG Capacity Map
IP side 1
(DE to
CH)
IP side 2
(DE to
CH)
IP side 1
(CH to
IT)
IP side 2
(CH to
IT)
OGE → → Swissgas Swissgas →
Fluxys
TENP → → Fluxswiss FluxSwiss →
OGE ← Swissgas ←
Fluxys
TENP ← FluxSwiss ←
IP side 2
(CH to
DE)
IP side 1
(CH to
DE)
IP side 2
(IT to
CH)
IP side 1
(IT to
CH)
PSVGries Pass
Snam
Rete Gas
Snam
Rete Gas
NCG (DE) Wallbach CH
→
←← Fluxswiss
IP side 1 (DE to AT) IP side 2 (DE to AT)
OGE ->
GRTD ->OGE <-GRTD <-
IP side 2 (AT to DE) IP side 1 (AT to DE)
NCG (DE) CEGH (AT)Oberkappel->
<- GCA
GCA
September 2016: European gas grid through the eye of the TIGER
28
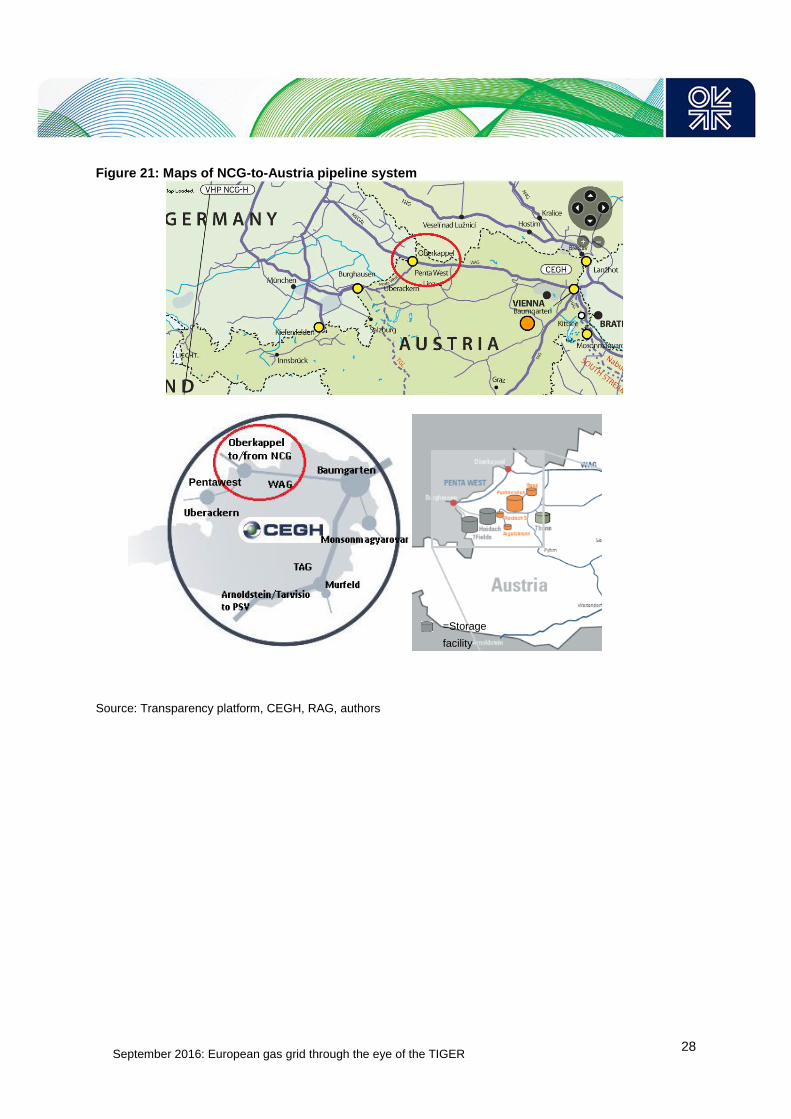
Figure 21: Maps of NCG-to-Austria pipeline system
Source: Transparency platform, CEGH, RAG, authors
Pentawest
=Storage
facility
September 2016: European gas grid through the eye of the TIGER
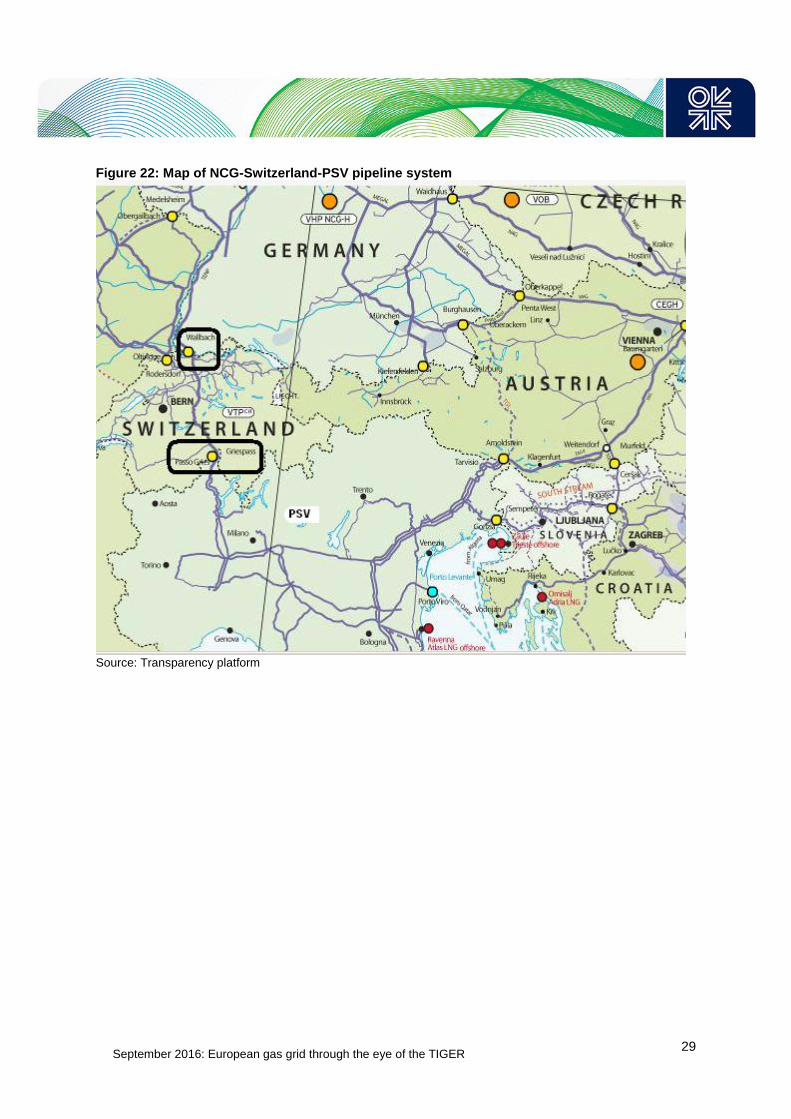
29
Figure 22: Map of NCG-Switzerland-PSV pipeline system
Source: Transparency platform
September 2016: European gas grid through the eye of the TIGER
30
Glossary
ACER: Agency for the Cooperation of Energy Regulators
Bcm: One billion cubic metres.
Capacity hoarding: an action aiming to prevent access to capacity available on the transport
network, deemed as an abuse of dominant position.
CEGH: Central European Gas Hub. For the sake of easy comparison to previous papers by OIES we
simply name the Austrian gas hub CEGH. However it should be noted that strictly speaking CEGH is
only the name of the exchange operator now, not the name of the trading hub/point, which is VTP.
More specifically, with the launch of the new Austrian Gas Act in January 2013, trading within the
Austrian market changed from a flange-based system to an Entry/Exit regime and trading activities
began to be centralized at the Virtual Trading Point (VTP), which is operated by CEGH. The market
operator CEGH offers trading activities and services for different markets: CEGH OTC (over-the-
counter) Market, CEGH Gas Exchange Spot Market of Wiener Boerse (Day-Ahead and Within-Day
Market), CEGH Gas Exchange Futures Market of Wiener Boerse (Front Month, Quarter, Season,
Year), CEGH Czech Gas Exchange in cooperation with PXE (Spot and Futures Market).
CMP: Congestion management procedures
Congestion Management Procedures (CMP) Guidelines: Commission Decision of 24 August 2012
on amending Annex I to Regulation (EC) No 715/2009 of the European Parliament and of the Council
on conditions for access to the natural gas transmission networks (2012/490/EU), OJL 213/16,
28.8.2012
Day ahead (DA) contract/product: Contract for the purchase or sale of gas to be delivered the day
after the trading date.
Entry-exit system A system where gas can be traded independently of its location in the pipeline
system, with the possibility for network users to book entry and exit capacity independently, creating
gas transport through zones instead of along contractual paths.
ENTSOG: Association of European gas TSOs.
GSL: Gaspool, gas hub based in Germany.
GTM (Gas Target Model): Conceptual model for the single European gas markets originally
developed by CEER in 2011, and updated in 2015.
GWh: A unit of energy equivalent to a Gigawatt of power for the duration of one hour.
Hub (gas hub): A virtual or physical location within the grid where the exchange of gas volumes takes
place. In fact a gas hub is a market for gas, where the commodity is traded on a standardized basis
between market participants. In this paper each hub represents a different price area.
Interconnection Point (IP): Means a location, whether it is physical or virtual, between two or more
EU Member States as well as between two adjacent entry-exit-systems within the same Member
State, where the pipeline systems of the two adjacent Member States or entry exit systems join.
kWh: A unit of energy equivalent to a Kilowatt of power for the duration of one hour.
Long Term Use it or Lose it: see Use it or Lose it
mcm: One million cubic metres.
MWh: A unit of energy equivalent to a Megawatt of power for the duration of one hour.
NBP: National Balancing Point, gas hub based in Great Britain.
September 2016: European gas grid through the eye of the TIGER
31
NCG: Net Connect Germany, gas hub based in Germany.
OTC (over the counter) trades: Bilateral non-regulated trade however involving standardized
physical and financial deals. Such trades are based on standard agreements defining the point of
delivery for gas along with other technical and legal terms. They can be for standard volumes of clip
sizes of gas and multiples thereof.
PEGN: Point d’Echange de Gaz Nord (Peg North), gas hub based in the North of France, coinciding
with the GRTgaz network.
PEGS: Point d’Echange de Gaz Sud (Peg South), gas hub based in the South of France. On April 1,
2015, the PEG TIGF and PEG Sud hubs merged to form a single gas hub to be named Trading
Region South (TRS).
PEGT: Point d’Echange de Gaz TIGF (Peg South), gas hub based in the South of France. On April 1,
2015, the PEG TIGF and PEG Sud hubs merged to form a single gas hub to be named Trading
Region South (TRS).
Price correlation: When prices move closely in parallel over time.
Price de-linkage: Period of low price correlation.
PSV: Punto di Scambio Virtuale, the Italian gas hub.
TENP: The gas pipeline that runs across German territory from Bocholtz, at the Dutch border, to the
Swiss border, close to Wallbach, where it joins Transitgas.
TIGER Model: The European supply-demand transmission model TIGER was developed by EWI at
the University of Cologne; it works using as inputs demand, production capacities of major gas
suppliers, European domestic production, information on long term contracts, transmission tariffs data
and gives as an output a pattern of gas physical flows within Europe. TIGER is a cost minimizing
model: the whole system is optimized with regard to the cost for the gas supply, subject to several
infrastructure constraints, e. g. capacity limits of pipelines or injection/withdrawal storage curves. For
a technical model description, please refer to Lochner (2011).
Transitgas: The gas pipeline that crosses Switzerland from Wallbach at the German border to Passo
Gries (Gries Pass) at the Italian border. At Wallbach Transitgas joins the Trans Europa Naturgas
Pipeline (TENP), at Passo Gries it joins the Italian network.
Transmission System Operator (TSO): the company responsible for transmission system operation.
Some countries have one gas TSO, others have several TSOs.
TRS: Trading Region South, French hub located in the South of France. On April 1, 2015, the PEG
TIGF and PEG Sud hubs merged to form a single gas hub to be named Trading Region South (TRS).
TTF: Title Transfer Facility, gas hub based in the Netherlands.
Use-it-or-lose-it (UIOLI): Congestion management provision whereby the transmission capacity
which is not nominated (used) by the original owner is made available (lost by the original owner) to
other shippers. European rules foresee a “long term” UIOLI and a “day ahead” UIOLI.
September 2016: European gas grid through the eye of the TIGER
32
References
ACER (2014): ACER Market Monitoring Report (2014), Annual report on the results of monitoring in
the internal electricity and natural gas markets in 2014
(http://www.acer.europa.eu/en/Pages/default.aspx
ACER (2016): ACER 2016 Report on Congestion at IPs in 2015, 31 May 2016
CEER (2011): CEER Vision for a European Gas Target Model. Conclusions Paper, Ref: C11-GWG-
82-03, 1 December 2011. Available at http://www.energy-
regulators.eu/portal/page/portal/EER_HOME/EER_PUBLICATIONS/CEER_PAPERS/Gas/Tab/C11-
GWG-82-03_GTM%20vision_Final.pdf
ENTSOG (2016): ENTSOG transparency platform. Available at: https://transparency.entsog.eu/
ERGEG (2006): ERGEG, Report on the transmission pricing (for Transit) and how it interacts with
Entry-Exit Systems, December 2006.
http://www.ceer.eu/portal/page/portal/EER_HOME/EER_PUBLICATIONS/CEER_PAPERS/Gas/2006/
E06-GFG-18-03_Pricing-Transit_2006-12-06_Published%20versi.pdf
Hunt (2008): Hunt, P., Entry–exit transmission pricing with notional hubs can it deliver a pan-european
wholesale market in gas?, OIES, February 2008. https://www.oxfordenergy.org/wpcms/wp-
content/uploads/2010/11/NG23-Entry-
ExitTransmissionPricingwithNotionalHubsCanItDeliverAPanEuropeanWholesaleMarketInGas-
PaulHunt-2008.pdf
IEA (2015): Natural Gas Information, https://www.iea.org/bookshop/665-
Natural_Gas_Information_2015
LECG (2011): LECG, Market design for natural gas: the Target Model for the Internal Market Report
for Ofgem, March 2011.
http://www.ceer.eu/portal/page/portal/EER_HOME/EER_CONSULT/CLOSED%20PUBLIC%20CONS
ULTATIONS/GAS/GTM_CfE/Tab1/LECG%20Gas_Target_Model_0700311.pdf
Lochner (2011) Lochner, S., Nodal prices, capacity valuation and investments in natural gas markets -
Overview and Analytical Framework, Energy, 2011, vol. 36, issue 5, pages 2483-2492.
(http://www.ewi.uni-koeln.de/fileadmin/user_upload/Publikationen/Working_Paper/EWI_WP_09-
02_Nodal-Prices-in-Natural-Gas-Markets.pdf)
Petrovich (2015): Petrovich, B., The cost of price de-linkages between European gas hubs, NG101,
OIES, September 2015. https://www.oxfordenergy.org/publications/the-cost-of-price-de-linkages-
between-european-gas-hubs/
Petrovich (2016): Petrovich, B., Do we have aligned and reliable gas Exchange prices in Europe?,
OIES Comment Paper, April 2016. https://www.oxfordenergy.org/wpcms/wp-
content/uploads/2016/04/Do-we-have-aligned-and-reliable-gas-exchange-prices-in-Europe.pdf
Rogers, H. (2015): Rogers, Howard, The Impact of Lower Gas and Oil Prices on Global Gas and LNG
Markets’, NG 99, OIES, July 2015, http://www.oxfordenergy.org/2015/07/the-impact-of-lower-gas-and-
oil-prices-on-global-gas-and-lng-markets/


![Eye of the Tiger [Sullivan]](https://static.documents.pub/doc/80x56/577c77c11a28abe0548d5e64/eye-of-the-tiger-sullivan.jpg)