
International Journal of Scientific and Research Publications, Volume 5, Issue 3, March 2015 1 ISSN 2250-3153
www.ijsrp.org
Exploring the critical factors for improving customers’
perceived food quality of casual-dining restaurants
Ying-Tsai Lin1, Hsin-Lan Liu
2, Ya-Yuan Chang
3, Ching-Chan Cheng
4*
1Lecturer, Department of Food & Beverage Management, Taipei College of Maritime Technology, Address: No.212, Yen Ping N. Rd., Sec. 9, Taipei
City, Taiwan, 111, R.O.C. 2Assistant Professor, Department of Applied Science of Living, Chinese Culture University, Address: No.55, Hwa-Kang Road, Yang-Ming-Shan,
Taipei City, Taiwan, 11114, R.O. C. 3Ph.D., Department of business administration, National Chung Hsing University, Address: No.250, Kuo Kuang Rd., Taichung City, Taiwan, 402,
R.O.C. E-mail: [email protected], Tel: +886-2-28102292; Fax: +886-2-2810-6688.
4*Ching-Chan Cheng , Associate Professor and Corresponding Author, Department of Food & Beverage Management, Taipei College of Maritime
Technology, Address: No.212, Yen Ping N. Rd., Sec. 9, Taipei City, Taiwan, 111, R.O.C., E-mail: [email protected], Tel: +886-2-
28102292; Fax: +886-2-2810-6688.
(*Corresponding Author)
Abstract- This study intends to integrate IPGA with the
DEMATEL model in order to determine food quality core factors
demanding restaurants’ most urgent improvement, as well as the
highest effect for resource investment. It is hoped that such
information can be provided as reference for casual-dining
restaurants to develop food quality improvement and resource
reallocation strategies under limited resources. 562 valid
questionnaires were returned in Taipei City. The results showed
that, from the perspective of customers, casual-dining restaurants
should give priority to improving the quality dimensions of
“hygiene” and “cooking.” Among various quality dimensions,
experts suggested that “cooking” is the core factor with the
highest effect of resource investment affecting food quality, such
as visual appeal, taste, and hygiene. Moreover, this study further
analyzed and found that a total of 15 quality items are located in
the area of “Concentrate here”.
Index Terms- Food quality, Casual-dining restaurant, IPGA,
DEMATEL
I. INTRODUCTION
conomic growth and increased national income have led to a
rapid increase of demands for service industry markets, thus,
increasing its competition. Jang, Ha, and Silkes (2009) indicated
that the quality of a product is a key factor affecting consumers’
decision-making for the service industry. Regarding the
hospitality industry, food quality is ranked as one of the most
important determinants of a customer’s decision to return. This
element is significantly more important than cleanliness, value,
price, or convenience (Kim, Ng, and Kim, 2009). Casual-dining
restaurants are important restaurant types. In the US, in 2010, the
volume of business accounted for approximately 22% (USD$ 83
billion) of the overall restaurant industry (Darden, 2011). The
majority of restaurants in Taiwan are casual dining, as most
restaurants in this category are small businesses (USDA, 2012).
The facts show that casual-dining restaurants are the most
representative restaurant type in the restaurant industry in
developed countries. Food quality was the most important reason
for respondents to patronize a casual-dining restaurant (Mattila,
2001). As a result, food quality has a significant effect on the
operation and sustainable development of casual-dining
restaurants, and how to effectively and precisely assess their food
quality has become an important research issue.
Lin, Chan, and Tsai (2009) integrated the concept of
traditional IPA with that of quality gap, and developed
Importance-Performance & Gap Analysis (IPGA) through
function conversion. The IPGA model converted the axes of the
traditional IPA matrix into relative importance (RI) and relative
performance (RP). In addition to reflecting quality gap, IPGA
can assist enterprises to develop strategies meeting customers’
needs. Some scholars have used the IPGA model to investigate
the service quality of different service industries (Tsai and Lin,
2010; Tsai, Chan, and Lin, 2011; Cheng, Chen, Hsu, and Hu,
2012). Cheng, Lin, Liu, Hu, and Lin (2011) used IPGA to
investigate the food quality of fine-dining restaurants. The above
show that IPGA is an effective research method used in the
research field of quality management.
According to the resource-based view (RBV), as proposed
by Wernerfelt (1984), a competitive advantage of a firm is the
result of optimal resource allocation and combinations.
Regarding casual-dining restaurants, the best approach to fulfill
the resource investment utility of food quality under limited
resources is to determine the dependent (cause-and-effect)
relationships between the quality attributes of the highest
efficiency and other quality attributes. When quality
characteristics are shown to have a cause-effect relationship, the
traditional IPA and IPGA model are unable to correctly analyze
priority level of importance and performance (Hu, Chiu, Cheng,
and Yen, 2011; Cheng et al., 2012). However, the methodology
of the decision making trial and evaluation laboratory
(DEMATEL) can change a complicated system into a causal
relationship with a clear structure, and determine the core issues
and improvement directions in a complicated system through
interaction levels between quality characteristics (Cheng et al.,
2012). Many scholars used DEMATEL to solve problems of
different fields (Nanayo and Toshiaki, 2002; Tamura et al., 2006;
Tseng, 2009; Hu et al., 2011). Tsai et al. (2011) and Cheng et al.
E
International Journal of Scientific and Research Publications, Volume 5, Issue 3, March 2015 2
ISSN 2250-3153
www.ijsrp.org
(2012) combined the perspectives of customers with those of
experts and used a two-stage decision-making model integrating
IPGA with DEMATEL to investigate the cause-and-effect
relationships between improvement priorities and resource
investments in service quality as important guidelines for service
quality improvement strategies. Obviously, the decision-making
model integrating IPGA with DEMATEL is an effective
approach to develop quality improvement and resource
investment strategies. Food quality improvement strategies of
casual-dining restaurants also involve the issues of “quality gap”
and “effective allocation of resources,” which have never been
discussed in previous studies. Therefore, the use of a quality
improvement decision-making model integrating IPGA with
DEMATEL in the investigation of quality improvement
strategies for casual-dining restaurants is of significant practical
contribution and value.
The purposes of this study are to use IPGA model to
investigate the food quality of casual-dining restaurants and to
understand the core factors for improving food quality, as well as
their priority. In addition, this study interviewed restaurant chefs
and scholars, and used DEMATEL to analyze the effect of
resource investment and dependent relationships (cause-and-
effect relationship) of various dimensions of food quality of
casual-dining restaurants, as well as to identify critical quality
attributes in order to improve overall food quality under
resource-limited conditions. Based on the research results of
IPGA and DEMATEL, this study intended to determine the
critical factors affecting food quality that demand the most
urgent improvements, and the highest effect of resource
investment, and provide such information as reference for casual-
dining restaurants to develop food quality improvements and
resource reallocation strategies, in order to significantly improve
the food quality of casual-dining restaurants.
II. LITERATURE REVIEW
Food quality
Palmer (1985) suggested that food is a product constrained
by culture, as it is the most fundamental and profound consumer
culture affecting daily life. Compared with other products, it is
harder to change the behavior consumption of food from among
various consumer behaviors. From a commercial perspective,
food quality is the phenomenon developed for commercial
products based on perceptual/evaluative construe assessment on
any factors concerning people, place, and time, which can affect
expectation factors, as assessed by sensory perception (Cardello,
1995). Food quality refers to quality that is acceptable to both the
producers and consumers, namely, it is producers’ production of
the quality most desirable to consumers at the most rational price
under limited economic conditions (Cheng et al., 2011). With the
development of economy, consumers’ demand for quality of
food has gradually increased. They not only intend to meet their
physical needs, but also take food quality, health, and safety into
account (Barbas, 2003; Henson, Majowicz, Masakure, Sockett,
Jones, Hart, Carr, and Knowles, 2006). Therefore, food quality
attributes have begun to attract the attention of consumers.
Moreover, food quality becomes one of the most important
factors affecting customer satisfaction (Pettijohn, Pettijohn, and
Luke, 1997). Mattila (2001) confirmed that food quality is the
most important reason for respondents to patronize a casual-
dining restaurant. Kim et al. (2009) indicated that food quality is
the strongest predictor of customer satisfaction, as well as revisit
intention. Improvement of visual appeal, food taste, freshness,
and nutritional content might help food service operators meet or
exceed customer expectations and improve intention to return.
In terms of the evaluation indicators of food quality,
Molnaar (1995) indicated that the characteristics of food quality
evaluation include sensory attitude, chemical and physical
aspects, microbiological hazard, texture damage, and the labeling
of package and appearance. For the food quality of the meals
provided by the army and public groups, consumers will consider
the factors of taste, texture, and nutritional value (Cardello, Bell,
and Matthew, 1996). Verbeke and Lopez (2005) used nine food
attributes as evaluation indicators for preference and attitude,
including price, color, appeal, taste, spiciness, convenience,
leanness, safety, and healthiness, in order to analyze the attitude
and behavior of Belgians and Belgian Spanish for ethnic food.
Tsai et al. (2006) found that, the evaluation factors for food
quality of fast food industry mainly include three dimensions,
“freshness and hygiene,” “menus and menu content,” and
“attractiveness of food,” with a total of 16 items. Jang et al.
(2009) developed 20 main attributes of Asian food, and used
such attributes to determine 6 Asian foods as the new constructs
of food attributes from the perspective of American consumers.
Kim et al. (2009) used four items, taste of food, eye appeal of
food, freshness of food, and overall quality of food, to assess the
food quality of restaurants. Cheng et al. (2011) also summarized
relevant previous studies to obtain five major dimensions,
including appeal of food, taste, cooking, hygiene, and other
factors, for 22 items in order to assess consumers’ satisfaction
with food quality of fine-dining restaurants. This study found
that, such restaurants should give priority to the improvement of
“hygiene” and “taste.” Based on the above, this study suggested
that the dimensions and items of the food quality assessment, as
proposed by Cheng et al. (2011), are more specific and complete.
Moreover, the empirical validity for restaurant food quality
assessment is acceptable. Consequently, this study intended to
use the food quality scale developed by Cheng et al. (2011) as
the basis for the evaluation of food quality of casual-dining
restaurants.
Importance-performance and gap analysis (IPGA)
Importance-Performance Analysis (IPA) is regarded by
scholars and managers as an effective tool for improving service
quality and customer satisfaction. Its analysis results can provide
enterprises with relevant information for planning resource
allocation. The IPA model, as proposed by Martilla and James
(1977), is an analysis technique for determining whether to
strengthen or adjust the resource allocation for analyzed
strategies. The vertical and horizontal axes of a strategy matrix is
constructed to denote respondents’ perceived degrees of
“importance” and “satisfaction.” The overall average importance
and satisfaction can be regarded as the intersecting point of two
axes to facilitate the division of the coordinate matrix into four
quadrants. Managers can understand enterprise performance
based on IPA analysis, which facilitates the development of
revitalization strategies in the future. Although the IPA model
has been regarded as a convenient tool for assessing quality, it
International Journal of Scientific and Research Publications, Volume 5, Issue 3, March 2015 3
ISSN 2250-3153
www.ijsrp.org
has several deficiencies in terms of practical application. For
example, the IPA model can neither distinguish properties
(Tarrant and Smith, 2002) in the same quadrant, nor integrate the
concepts of quality gap (the difference between customers’
expectations and perceptions) (Lin et al., 2009). Moreover, the
assessment of means may easily lead to subjective conflict
(Cheng et al., 2012).
IPGA was extended and developed from IPA as a model
integrating the traditional IPA model with a resource reallocation
analysis model for gap analysis (Importance-Performance and
Gap Analysis; IPGA), as developed by Lin et al. (2009), and
based on function conversion. IPGA converts the axes of
traditional IPA matrix into relative importance (RI) and relative
performance (RP). The vertical axis of the amended matrix is
relative importance of the evaluated attributes, while the
horizontal axis is the relative performance of the evaluated
attributes. The resource allocation strategies, as denoted by the
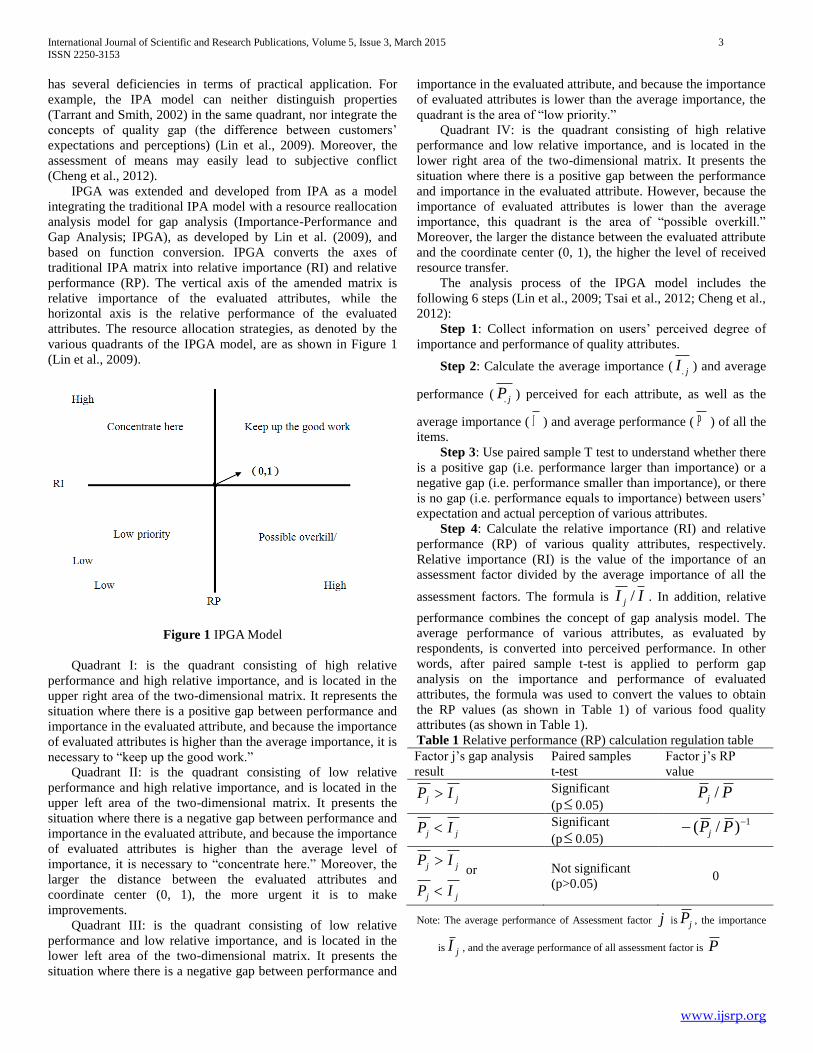
various quadrants of the IPGA model, are as shown in Figure 1
(Lin et al., 2009).
Figure 1 IPGA Model
Quadrant I: is the quadrant consisting of high relative
performance and high relative importance, and is located in the
upper right area of the two-dimensional matrix. It represents the
situation where there is a positive gap between performance and
importance in the evaluated attribute, and because the importance
of evaluated attributes is higher than the average importance, it is
necessary to “keep up the good work.”
Quadrant II: is the quadrant consisting of low relative
performance and high relative importance, and is located in the
upper left area of the two-dimensional matrix. It presents the
situation where there is a negative gap between performance and
importance in the evaluated attribute, and because the importance
of evaluated attributes is higher than the average level of
importance, it is necessary to “concentrate here.” Moreover, the
larger the distance between the evaluated attributes and
coordinate center (0, 1), the more urgent it is to make
improvements.
Quadrant III: is the quadrant consisting of low relative
performance and low relative importance, and is located in the
lower left area of the two-dimensional matrix. It presents the
situation where there is a negative gap between performance and
importance in the evaluated attribute, and because the importance
of evaluated attributes is lower than the average importance, the
quadrant is the area of “low priority.”
Quadrant IV: is the quadrant consisting of high relative
performance and low relative importance, and is located in the
lower right area of the two-dimensional matrix. It presents the
situation where there is a positive gap between the performance
and importance in the evaluated attribute. However, because the
importance of evaluated attributes is lower than the average
importance, this quadrant is the area of “possible overkill.”
Moreover, the larger the distance between the evaluated attribute
and the coordinate center (0, 1), the higher the level of received
resource transfer.
The analysis process of the IPGA model includes the
following 6 steps (Lin et al., 2009; Tsai et al., 2012; Cheng et al.,
2012):
Step 1: Collect information on users’ perceived degree of
importance and performance of quality attributes.
Step 2: Calculate the average importance ( jI. ) and average
performance ( jP. ) perceived for each attribute, as well as the
average importance ( I ) and average performance ( P ) of all the
items.
Step 3: Use paired sample T test to understand whether there
is a positive gap (i.e. performance larger than importance) or a
negative gap (i.e. performance smaller than importance), or there
is no gap (i.e. performance equals to importance) between users’
expectation and actual perception of various attributes.
Step 4: Calculate the relative importance (RI) and relative
performance (RP) of various quality attributes, respectively.
Relative importance (RI) is the value of the importance of an
assessment factor divided by the average importance of all the
assessment factors. The formula is II j / . In addition, relative
performance combines the concept of gap analysis model. The
average performance of various attributes, as evaluated by
respondents, is converted into perceived performance. In other
words, after paired sample t-test is applied to perform gap
analysis on the importance and performance of evaluated
attributes, the formula was used to convert the values to obtain
the RP values (as shown in Table 1) of various food quality
attributes (as shown in Table 1).
Table 1 Relative performance (RP) calculation regulation table
Factor j’s gap analysis
result
Paired samples
t-test
Factor j’s RP
value
j jP I Significant
(p 0.05) PPj /
j jP I Significant
(p 0.05)
1)/( PPj
j jP I or
j jP I
Not significant
(p>0.05) 0
Note: The average performance of Assessment factor j is jP , the importance
is jI , and the average performance of all assessment factor is P
International Journal of Scientific and Research Publications, Volume 5, Issue 3, March 2015 4
ISSN 2250-3153
www.ijsrp.org
Step 5: Draw the IPGA strategy matrix (as shown in Figure
1), where relative importance (RI) and relative performance (RP)
are used as vertical axis and horizontal axis, respectively. The
intersecting point of the horizontal and vertical axes is (0, 1). The
resource allocation strategy and management definitions of
various quadrants of IPGA strategy matrix are as follows:
Step 6: Determine the priority of resource allocation for
attributes requiring improvement in quadrant II, namely, the
larger the distance, the higher the priority for improvement. The
formula is:
2
..
2
. )]1(max/)1[(](max/[)(
rqr
jrqr
jq RIRIRPRPjD
Decision Making Trial and Evaluation Laboratory
(DEMATEL)
The decision making trial and evaluation laboratory
(DEMATEL) was developed by the Battelle Memorial
Association in Geneva (Gabus and Fontela, 1973; Fontela and
Gabus, 1976). At the time, the DEMATEL method was used to
research complex, and difficult to solve, global problems,
including ethnic issues, hunger, energy, environmental
protection, etc. (Fontela and Gabus, 1976). The DEMATEL
method takes complicated systems and directly compares the
relative relationships between different quality characteristics,
using a matrix to calculate all direct and indirect cause and effect
relationships, as well as the level of influence between quality
characteristics, especially through the use of a visual structure
cause-effect diagram to determine the core questions of a
complex system, thus, simplifying decision making (Cheng et al.,
2012). Measurements are separated into four levels (0, 1, 2, 3),
which are labeled ‘‘no influence’’, ‘‘low level of influence’’,
‘‘high level of influence’’, and ‘‘extremely high level of
influence’’ (Lin and Wu, 2008). Recent studies have
comprehensively used DEMATEL to solve the problems of
different fields. For example, Nanayo and Toshiaki (2002) used
amended DEMATEL to conduct an integrated assessment on a
medical care system. Tamura et al. (2006) used DEMATEL to
investigate the factors leading to customers’ sense of insecurity
regarding food and its improvement. Tseng (2009) combined the
Fuzzy set theory with DEMATEL to evaluate the
interrelationships of service quality evaluation criteria and to
compare group perceptions for a cause-and-effect model
regarding uncertainties. Hu et al. (2011) used DEMATEL to
improve the order-winner criteria in the network communication
equipment manufacturing industry. Tsai et al. (2011) used
DEMATEL to determine the critical factors affecting customers’
needs for quality of an online tax-filing system. Cheng et al.
(2012) used DEMATEL to investigate the priority of
improvements in the service quality of fine-dining restaurants.
However, such a research method has never been used in
previous studies to resolve issues concerning food quality
improvement strategies and resource allocation of casual-dining
restaurants.
This study adopted the explanation of the steps of
DEMATEL, as described by Tsai et al. (2011) and Cheng et al.
(2012), as follows:
Step 1: Build the initial average direct-relation matrix
Suppose n is the number of experts consulted, and p is the
number of practices that each expert considers. The integer score k
ijx refers to the degree that practice i affects practice j for the k-
th expert. The p×p average matrix A is realized by averaging all
expert scores, and can be represented mathematically by the
following equation:
pp
n
k
k
ijppij xn
aA
1
1
(1)
Step 2: Calculate the normalized direct-relation matrix
The normalized direct-relation matrix Z is obtained by
normalizing the direct-relation matrix A, and can be represented
mathematically by the following equation:
AZ 1 , where )max,maxmax(1
11
1
p
i
ijpj
p
j
ijpi
aa (2)
Since the sum of each row i of matrix A represents the direct
effects that practice i gives to the other practices, and the sum of
each column j of matrix A represents the direct effects that
practice i receives from the other practices; therefore,
)max,maxmax(1
11
1
p
i
ijpj
p
j
ijpi
aa represents the direct effects of
the practice with the most directly given and received effects on
others.
Step 3: Derive the total relation matrix
The total relation effects include both the indirect effects and
direct effects. Since there is a continuous decrease of the indirect
effects of problems along the powers of matrix Z, the total
relation matrix, T, is defined as a p×p matrix, and I is the p×p
identity matrix. The mathematical equation can be represented,
as follows: 12 )()(lim
ZIZZZZT k
k (3)
Step 4: Calculate the total effects and net effects.
Define r and c’ as p×1 vectors as the sum of rows and the
sum of columns, respectively, of the total relation matrix T. The
mathematical equations can be represented, as follows:
11
1
p
p
j
ijpi trr (4)
p
p
i
ijpj tcc
111
(5)
The sum ir shows the total given effects, both directly and
indirectly, that practice i has on the other practices. The sum jc
shows the total received effects, both directly and indirectly, that
International Journal of Scientific and Research Publications, Volume 5, Issue 3, March 2015 5
ISSN 2250-3153
www.ijsrp.org
all the other practices have on practice j. Thus, the sum
)( ii cr gives us an index representing the total effects (i.e.
prominence) both given and received by practice i. In addition,
the difference )( ii cr shows the net effects or the net
contribution by practice i on the system. In other word,
)( ii cr is defined as the cause and represents the level of
influence and being influenced of this specific quality
characteristic.
III. METHODOLOGY
Research Procedures for the Improvement of Food Quality of
Casual-dining Restaurants
This study reformed the two-stage decision-making model
integrating IPGA with DEMATEL, as proposed by Tsai et al.
(2011), and used a questionnaire survey for customers’ opinions
and expert interviews to perform analyses. Firstly, this study
conducted a questionnaire survey on customers to obtain
information regarding the degree of importance and satisfaction
with various food attributes, and calculated the RI and RP. IPGA
was applied to determine the quality attributes (i.e. critical
factors) requiring improvement. Secondly, After identifying the
key factors of customer’s perception, by applying IPGA, experts
further analyze the critical factors of these practices, as based on
their practical experiences and professional judgment, to achieve
the cost effective target for resource allocation of food quality of
casual-dining restaurants. Therefore, this study further used a
DEMATEL questionnaire to investigate cause-and-effect
relationships and total effects of various food quality attributes of
casual-dining restaurants. Lastly, the analysis results of IPGA
(perspective of customers) and DEMATEL (perspective of
experts) questionnaires were integrated in order to determine
critical food quality factors with the most urgent demand for
improvement and for the highest effect of resource investment as
reference for improving food quality strategies of casual-dining
restaurants.
Measurement
The questionnaire used in this study was developed based on
food quality, and the characteristics of food quality, of casual-
dining restaurants. The content of the preliminary questionnaire
included five major dimensions, visual appeal, taste, cooking,
hygiene, and other factors, with 25 items totally. This study
mainly investigated the importance and performance of various
attributes of food quality, and used a 5-point Likert scale for
measurement. The respondents completed the questionnaires
anonymously. Before the formal questionnaires were distributed,
50 pre-test questionnaires were distributed to analyze reliability
(Cronbach’s α). The results showed that the reliability of various
dimensions of the questionnaire was larger than 0.7, which
suggested that there is internal consistency among the various
dimensions (importance and performance). Moreover, regarding
expert questionnaire, this study developed the DEMATEL expert
questionnaire, as based on the five dimensions of restaurant food
quality, and the measurement was separated into four levels (0, 1,
2, 3), labeled ‘‘no influence,’’ ‘‘low level of influence,’’ ‘‘high
level of influence,’’ and ‘‘extremely high level of influence.’’
Research samples and data collection
The majority of restaurants in Taiwan are casual dining
(USDA, 2012), which suggests that casual-dining restaurants
play an important role in the hospitality industry in Taiwan.
Taipei City is the largest international city in Taiwan, and in
2011, there were 16,764 restaurants, ranking it the highest in
Taiwan (Financial Data Center, Ministry of Finance, Taiwan,
2012), thus, market competition in the hospitality industry will
inevitably become more intense in Taipei City. In order to attract
customers and maintain sustainable operation, operators in the
hospitality industry must provide good food quality. Therefore,
the priority of food quality evaluation and food quality resource
investment has become an important research issue for casual-
dining restaurants in Taipei City.
By customer questionnaire survey, this study selected the
customers of 10 casual-dining restaurants in Taipei City as the
subjects. A systematic sampling method was utilized to collect
the questionnaires. Questionnaires were distributed to customers
willing to participate in this research after their dining
experience. The questionnaires were distributed once for every
10 customers dining in the restaurants. The questionnaires were
distributed for 3 months, from January 1 to March 31, 2012, with
600 questionnaires distributed. After invalid questionnaires (e.g.
incomplete questionnaires) were removed, 562 valid
questionnaires were returned, for a valid return rate of 93.67%.
In terms of expert questionnaire, this study interviewed 12
experts (6 executive chefs of restaurants and 6 scholars that had
studied restaurant food quality in Taiwan) as the respondents to
complete the DEMATEL questionnaires.
Data analysis methods
The data collected from the questionnaires were analyzed
using SPSS version 12.0 for descriptive statistical analysis on the
effective questionnaires. Second, this study then assessed the
properties of measurement scales for convergent validity and
discriminant validity, and constructed composite reliability by
confirmatory factor analysis (CFA) using maximum likelihood to
estimate parameters. Third, the allocated quadrant of restaurant
food quality attributes, with the two dimensional matrix
constructed by RI and RP through IPGA analysis, was examined
to understand the strategy meaning of food quality attributes of
casual-dining restaurants. Through expert questionnaire, this
study analyzed the total effects and dependent (cause-effect)
relationships among 5 dimensions of food quality of casual-
dining restaurants by using the DEMATEL method.
IV. RESULTS
Profile of the respondents
This study selected the customers of 10 casual-dining
restaurants in Taipei City as the subjects, and successfully
retrieved 562 valid samples. The sample structure distribution is
as shown in Table 2. Most of the respondents are females
(56.57%), aged 31-40 (34.16%), followed by 21-30 (32.74%),
have junior college education (46.98%), are married (50.53%),
have an average monthly income of NTD 20,001~40,000
(35.23%), followed by NTD 40,001~60,000 (32.38%), work in
the service (34.52%) and manufacturing industries (23.49%), and
International Journal of Scientific and Research Publications, Volume 5, Issue 3, March 2015 6
ISSN 2250-3153
www.ijsrp.org
have dined in restaurants twice or less (40.93%) or for 3~5 times
(38.08%) within the past 3 months.
Table 2 Profile of the respondents
Characteristics Items Frequency Percentage
Gender Male 266 47.33%
Female 296 52.67%
Age
Below 20 78 13.88%
21-30 184 32.74%
31-40 192 34.16%
41-50 86 15.30%
More than 51 22 3.91%
Education
Junior high or
lower 57 10.14%
Senior high or
vocational school 152 27.05%
University or
college 264 46.98%
Graduate school
or above 89 15.84%
Marital status Unmarried 278 49.47%
Married 284 50.53%
Monthly income
(NT$)
Below $20,000 54 9.61%
$20,001-$40,000 198 35.23%
$40,001-$60,000 182 32.38%
More than
$60,001 108 22.78%
Occupation
Student 60 10.68%
Industrial and
commercial
industry 132 23.49%
Service industry 194 34.52%
Public sector 89 15.84%
Housewives or
retirees 67 11.92%
Others 20 3.56%
Number of
meals within
three months
Below 2 230 40.93%
3-5 214 38.08%
6-8 86 15.30%
More than 9 32 5.69%
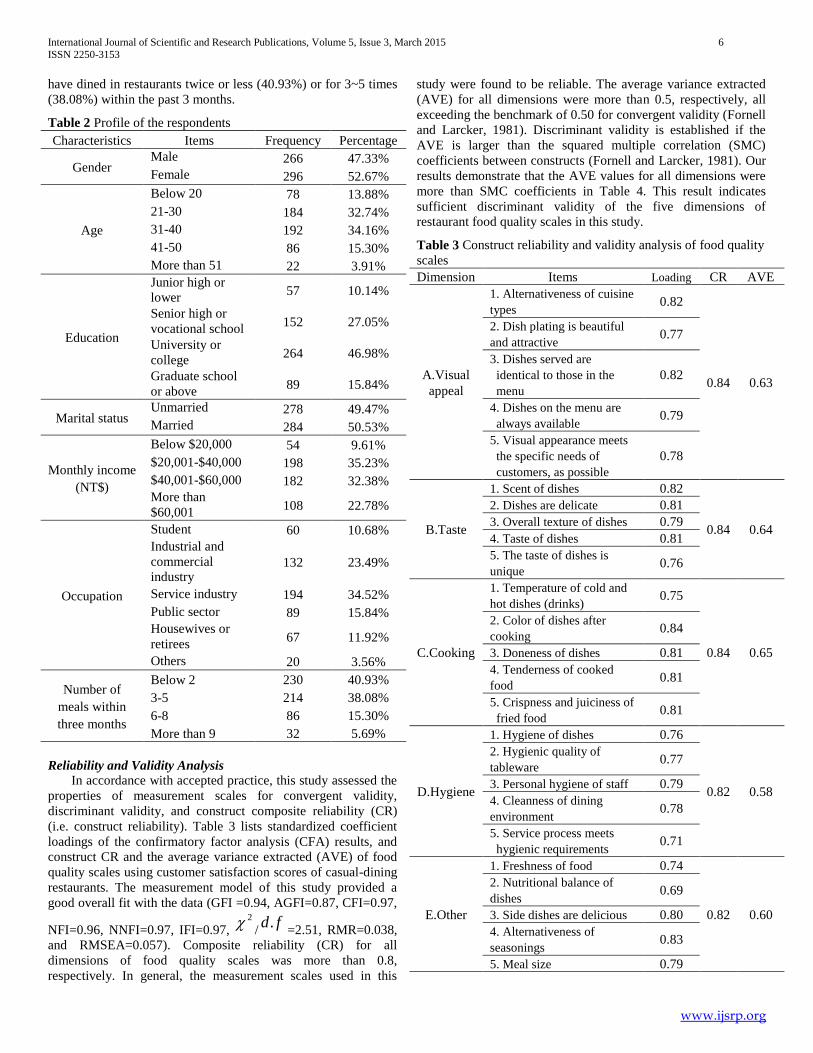
Reliability and Validity Analysis
In accordance with accepted practice, this study assessed the
properties of measurement scales for convergent validity,
discriminant validity, and construct composite reliability (CR)
(i.e. construct reliability). Table 3 lists standardized coefficient
loadings of the confirmatory factor analysis (CFA) results, and
construct CR and the average variance extracted (AVE) of food
quality scales using customer satisfaction scores of casual-dining
restaurants. The measurement model of this study provided a
good overall fit with the data (GFI =0.94, AGFI=0.87, CFI=0.97,
NFI=0.96, NNFI=0.97, IFI=0.97, 2
/fd.
=2.51, RMR=0.038,
and RMSEA=0.057). Composite reliability (CR) for all
dimensions of food quality scales was more than 0.8,
respectively. In general, the measurement scales used in this
study were found to be reliable. The average variance extracted
(AVE) for all dimensions were more than 0.5, respectively, all
exceeding the benchmark of 0.50 for convergent validity (Fornell
and Larcker, 1981). Discriminant validity is established if the
AVE is larger than the squared multiple correlation (SMC)
coefficients between constructs (Fornell and Larcker, 1981). Our
results demonstrate that the AVE values for all dimensions were
more than SMC coefficients in Table 4. This result indicates
sufficient discriminant validity of the five dimensions of
restaurant food quality scales in this study.
Table 3 Construct reliability and validity analysis of food quality
scales
Dimension Items Loading CR AVE
A.Visual
appeal
1. Alternativeness of cuisine
types 0.82
0.84 0.63
2. Dish plating is beautiful
and attractive 0.77
3. Dishes served are
identical to those in the
menu
0.82
4. Dishes on the menu are
always available 0.79
5. Visual appearance meets
the specific needs of
customers, as possible
0.78
B.Taste
1. Scent of dishes 0.82
0.84 0.64
2. Dishes are delicate 0.81
3. Overall texture of dishes 0.79
4. Taste of dishes 0.81
5. The taste of dishes is
unique 0.76
C.Cooking
1. Temperature of cold and
hot dishes (drinks) 0.75
0.84 0.65
2. Color of dishes after
cooking 0.84
3. Doneness of dishes 0.81
4. Tenderness of cooked
food 0.81
5. Crispness and juiciness of
fried food 0.81
D.Hygiene
1. Hygiene of dishes 0.76
0.82 0.58
2. Hygienic quality of
tableware 0.77
3. Personal hygiene of staff 0.79
4. Cleanness of dining
environment 0.78
5. Service process meets
hygienic requirements 0.71
E.Other
1. Freshness of food 0.74
0.82 0.60
2. Nutritional balance of
dishes 0.69
3. Side dishes are delicious 0.80
4. Alternativeness of
seasonings 0.83
5. Meal size 0.79
International Journal of Scientific and Research Publications, Volume 5, Issue 3, March 2015 7
ISSN 2250-3153
www.ijsrp.org
Table 4 Discriminant validity of the five dimensions of food
quality scales
Dimensions Mean S.D. A B C D E
A.Visual
appeal 4.03 0.54 0.63
a
B.Taste 4.08 0.55 0.52 0.64b
C.Cooking 4.07 0.55 0.36 0.51 0.65c
D.Hygiene 4.50 0.50 0.02 0.01 0.07 0.58d
E.Other 4.05 0.52 0.35 0.38 0.42 0.02 0.60e
a,b,c,d,e, represent AVE of each dimension. Other numbers
represent SMC coefficients between dimensions
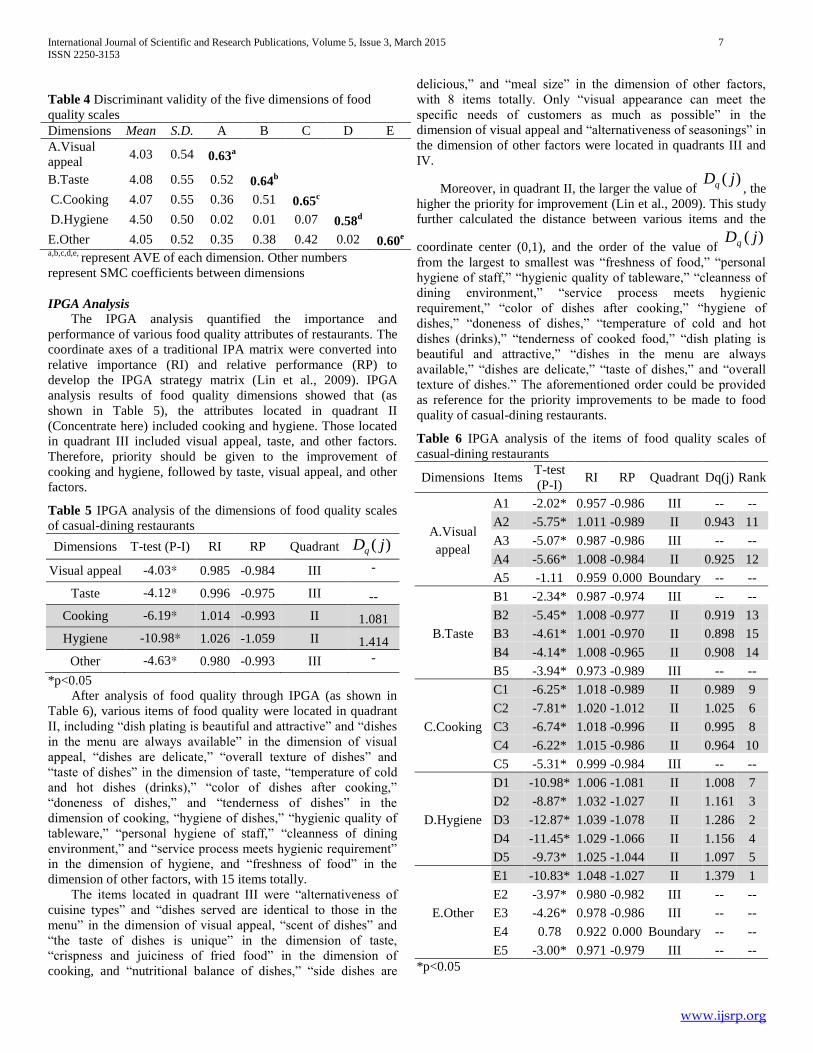
IPGA Analysis
The IPGA analysis quantified the importance and
performance of various food quality attributes of restaurants. The
coordinate axes of a traditional IPA matrix were converted into
relative importance (RI) and relative performance (RP) to
develop the IPGA strategy matrix (Lin et al., 2009). IPGA
analysis results of food quality dimensions showed that (as
shown in Table 5), the attributes located in quadrant II
(Concentrate here) included cooking and hygiene. Those located
in quadrant III included visual appeal, taste, and other factors.
Therefore, priority should be given to the improvement of
cooking and hygiene, followed by taste, visual appeal, and other
factors.
Table 5 IPGA analysis of the dimensions of food quality scales
of casual-dining restaurants
Dimensions T-test (P-I) RI RP Quadrant )( jDq
Visual appeal -4.03* 0.985 -0.984 III -
Taste -4.12* 0.996 -0.975 III --
Cooking -6.19* 1.014 -0.993 II 1.081
Hygiene -10.98* 1.026 -1.059 II 1.414
Other -4.63* 0.980 -0.993 III -
*p<0.05
After analysis of food quality through IPGA (as shown in
Table 6), various items of food quality were located in quadrant
II, including “dish plating is beautiful and attractive” and “dishes
in the menu are always available” in the dimension of visual
appeal, “dishes are delicate,” “overall texture of dishes” and
“taste of dishes” in the dimension of taste, “temperature of cold
and hot dishes (drinks),” “color of dishes after cooking,”
“doneness of dishes,” and “tenderness of dishes” in the
dimension of cooking, “hygiene of dishes,” “hygienic quality of
tableware,” “personal hygiene of staff,” “cleanness of dining
environment,” and “service process meets hygienic requirement”
in the dimension of hygiene, and “freshness of food” in the
dimension of other factors, with 15 items totally.
The items located in quadrant III were “alternativeness of
cuisine types” and “dishes served are identical to those in the
menu” in the dimension of visual appeal, “scent of dishes” and
“the taste of dishes is unique” in the dimension of taste,
“crispness and juiciness of fried food” in the dimension of
cooking, and “nutritional balance of dishes,” “side dishes are
delicious,” and “meal size” in the dimension of other factors,
with 8 items totally. Only “visual appearance can meet the
specific needs of customers as much as possible” in the
dimension of visual appeal and “alternativeness of seasonings” in
the dimension of other factors were located in quadrants III and
IV.
Moreover, in quadrant II, the larger the value of )( jDq , the
higher the priority for improvement (Lin et al., 2009). This study
further calculated the distance between various items and the
coordinate center (0,1), and the order of the value of )( jDq
from the largest to smallest was “freshness of food,” “personal
hygiene of staff,” “hygienic quality of tableware,” “cleanness of
dining environment,” “service process meets hygienic
requirement,” “color of dishes after cooking,” “hygiene of
dishes,” “doneness of dishes,” “temperature of cold and hot
dishes (drinks),” “tenderness of cooked food,” “dish plating is
beautiful and attractive,” “dishes in the menu are always
available,” “dishes are delicate,” “taste of dishes,” and “overall
texture of dishes.” The aforementioned order could be provided
as reference for the priority improvements to be made to food
quality of casual-dining restaurants.
Table 6 IPGA analysis of the items of food quality scales of
casual-dining restaurants
Dimensions Items T-test
(P-I) RI RP Quadrant Dq(j) Rank
A.Visual
appeal
A1 -2.02* 0.957 -0.986 III -- --
A2 -5.75* 1.011 -0.989 II 0.943 11
A3 -5.07* 0.987 -0.986 III -- --
A4 -5.66* 1.008 -0.984 II 0.925 12
A5 -1.11 0.959 0.000 Boundary -- --
B.Taste
B1 -2.34* 0.987 -0.974 III -- --
B2 -5.45* 1.008 -0.977 II 0.919 13
B3 -4.61* 1.001 -0.970 II 0.898 15
B4 -4.14* 1.008 -0.965 II 0.908 14
B5 -3.94* 0.973 -0.989 III -- --
C.Cooking
C1 -6.25* 1.018 -0.989 II 0.989 9
C2 -7.81* 1.020 -1.012 II 1.025 6
C3 -6.74* 1.018 -0.996 II 0.995 8
C4 -6.22* 1.015 -0.986 II 0.964 10
C5 -5.31* 0.999 -0.984 III -- --
D.Hygiene
D1 -10.98* 1.006 -1.081 II 1.008 7
D2 -8.87* 1.032 -1.027 II 1.161 3
D3 -12.87* 1.039 -1.078 II 1.286 2
D4 -11.45* 1.029 -1.066 II 1.156 4
D5 -9.73* 1.025 -1.044 II 1.097 5
E.Other
E1 -10.83* 1.048 -1.027 II 1.379 1
E2 -3.97* 0.980 -0.982 III -- --
E3 -4.26* 0.978 -0.986 III -- --
E4 0.78 0.922 0.000 Boundary -- --
E5 -3.00* 0.971 -0.979 III -- --
*p<0.05
International Journal of Scientific and Research Publications, Volume 5, Issue 3, March 2015 8
ISSN 2250-3153
www.ijsrp.org
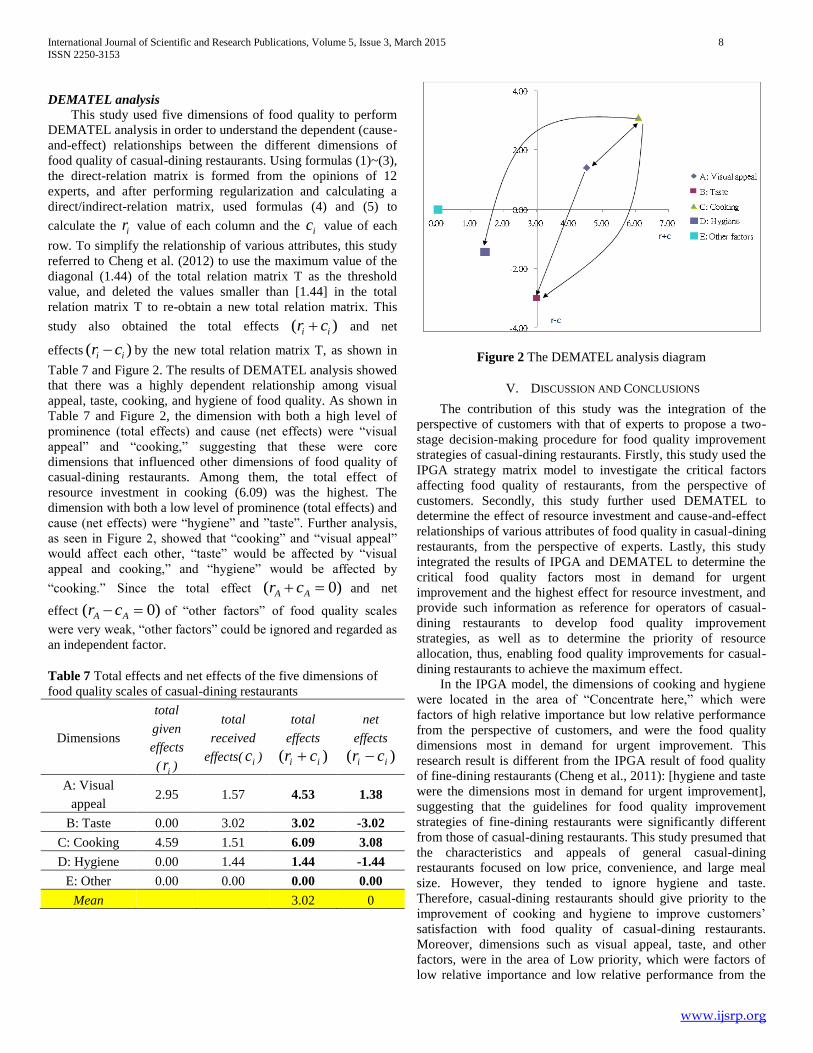
DEMATEL analysis
This study used five dimensions of food quality to perform
DEMATEL analysis in order to understand the dependent (cause-
and-effect) relationships between the different dimensions of
food quality of casual-dining restaurants. Using formulas (1)~(3),
the direct-relation matrix is formed from the opinions of 12
experts, and after performing regularization and calculating a
direct/indirect-relation matrix, used formulas (4) and (5) to
calculate the ir value of each column and the ic value of each
row. To simplify the relationship of various attributes, this study
referred to Cheng et al. (2012) to use the maximum value of the
diagonal (1.44) of the total relation matrix T as the threshold
value, and deleted the values smaller than [1.44] in the total
relation matrix T to re-obtain a new total relation matrix. This
study also obtained the total effects )( ii cr and net
effects )( ii cr by the new total relation matrix T, as shown in
Table 7 and Figure 2. The results of DEMATEL analysis showed
that there was a highly dependent relationship among visual
appeal, taste, cooking, and hygiene of food quality. As shown in
Table 7 and Figure 2, the dimension with both a high level of
prominence (total effects) and cause (net effects) were “visual
appeal” and “cooking,” suggesting that these were core
dimensions that influenced other dimensions of food quality of
casual-dining restaurants. Among them, the total effect of
resource investment in cooking (6.09) was the highest. The
dimension with both a low level of prominence (total effects) and
cause (net effects) were “hygiene” and ”taste”. Further analysis,
as seen in Figure 2, showed that “cooking” and “visual appeal”
would affect each other, “taste” would be affected by “visual
appeal and cooking,” and “hygiene” would be affected by
“cooking.” Since the total effect )0( AA cr and net
effect )0( AA cr of “other factors” of food quality scales
were very weak, “other factors” could be ignored and regarded as
an independent factor.
Table 7 Total effects and net effects of the five dimensions of
food quality scales of casual-dining restaurants
Dimensions
total
given
effects
( ir )
total
received
effects( ic )
total
effects
)( ii cr
net
effects
)( ii cr
A: Visual
appeal 2.95 1.57 4.53 1.38
B: Taste 0.00 3.02 3.02 -3.02
C: Cooking 4.59 1.51 6.09 3.08
D: Hygiene 0.00 1.44 1.44 -1.44
E: Other 0.00 0.00 0.00 0.00
Mean 3.02 0
Figure 2 The DEMATEL analysis diagram
V. DISCUSSION AND CONCLUSIONS
The contribution of this study was the integration of the
perspective of customers with that of experts to propose a two-
stage decision-making procedure for food quality improvement
strategies of casual-dining restaurants. Firstly, this study used the
IPGA strategy matrix model to investigate the critical factors
affecting food quality of restaurants, from the perspective of
customers. Secondly, this study further used DEMATEL to
determine the effect of resource investment and cause-and-effect
relationships of various attributes of food quality in casual-dining
restaurants, from the perspective of experts. Lastly, this study
integrated the results of IPGA and DEMATEL to determine the
critical food quality factors most in demand for urgent
improvement and the highest effect for resource investment, and
provide such information as reference for operators of casual-
dining restaurants to develop food quality improvement
strategies, as well as to determine the priority of resource
allocation, thus, enabling food quality improvements for casual-
dining restaurants to achieve the maximum effect.
In the IPGA model, the dimensions of cooking and hygiene
were located in the area of “Concentrate here,” which were
factors of high relative importance but low relative performance
from the perspective of customers, and were the food quality
dimensions most in demand for urgent improvement. This
research result is different from the IPGA result of food quality
of fine-dining restaurants (Cheng et al., 2011): [hygiene and taste
were the dimensions most in demand for urgent improvement],
suggesting that the guidelines for food quality improvement
strategies of fine-dining restaurants were significantly different
from those of casual-dining restaurants. This study presumed that
the characteristics and appeals of general casual-dining
restaurants focused on low price, convenience, and large meal
size. However, they tended to ignore hygiene and taste.
Therefore, casual-dining restaurants should give priority to the
improvement of cooking and hygiene to improve customers’
satisfaction with food quality of casual-dining restaurants.
Moreover, dimensions such as visual appeal, taste, and other
factors, were in the area of Low priority, which were factors of
low relative importance and low relative performance from the
International Journal of Scientific and Research Publications, Volume 5, Issue 3, March 2015 9
ISSN 2250-3153
www.ijsrp.org
perspective of customers, and were the food quality dimensions
less in demand for improvement. Thus, the operators of casual-
dining restaurants do not have to excessively invest resources in
improving food quality attributes, such as visual appeal, taste,
and other factors, and can adequately allocate investment
resources in visual appeal, taste, and other factors to the
dimensions of “hygiene” and “cooking,” to meet customers’
needs for food quality of casual-dining restaurants. Furthermore,
worthy of note, in the research results of IPGA, none of the food
quality dimensions of casual-dining restaurants was located in
the area of [Keep up the good work]. The investigation showed
that, although the importance of some of the quality dimensions
was higher than the average importance, there was no [positive
gap (i.e. satisfaction—importance were both>0)] in the
dimensions of food quality. Consequently, the food quality of
casual-dining restaurants must be continuously improved to
increase customers’ satisfaction to a degree higher than
importance, in order to develop substantial competitive
advantage of food quality.
Among the 25 items of food quality, further IPGA analysis
(perspective of customers) showed that a total of 15 items were
located in the area of “Concentrate here,” including 2 items in the
dimension of visual appeal, 3 items in the dimension of taste, 4
items in the dimension of cooling, 5 items in the dimension of
hygiene, and 1 factor in the dimension of other factors. From the
perspective of customers, operators of casual-dining restaurants
should give priority to the improvement of the 15 items
mentioned above. The priority, from the highest to the lowest,
was “freshness of food,” “personal hygiene of staff,” “hygienic
quality of tableware,” “cleanness of dining environment,”
“service process meets hygienic requirement,” “color of dishes
after cooking,” “hygiene of dishes,” “doneness of dishes,”
“temperature of cold and hot dishes (drinks),” “tenderness of
cooked food,” “dish plating is beautiful and attractive,” “dishes
in the menu are always available,” “dishes are delicate,” “taste of
dishes,” and “overall texture of dishes.” Moreover, a total of 8
items were in the area of Low priority, including 2 items
(alternativeness of cuisine types and dishes served are identical
to those in the menu) in the dimension of visual appeal, 2 items
(scent of dishes and the taste of dishes is unique) in the
dimension of taste, 1 item (crispness and juiciness of fried food)
in the dimension of cooking, and 3 items (nutritional balance,
side dishes are delicious, and meal size) in the dimension of other
factors. There was 1 item (visual appearance can meet the
specific needs of customers as much as possible) in the
dimension of visual appeal, and 1 item (alternativeness of
seasonings) in the dimension of other factors, which were located
on the boundary between low priority and possible overkill. This
study suggested that operators of casual-dining restaurants
should not excessively invest resources in the quality items on
the boundary between “Low priority” area and “Low priority and
Possible overkill” area.
However, the priority for quality improvement, as obtained
from IPGA results mentioned above, was from the perspective of
customers. In terms of the practical priority of quality
improvement, there remains a need to consider the total effect of
resource investment and cause-and-effect relationships, in order
to obtain actual effect. Therefore, based on the results of the
DEMATEL model, this study further found that, among the five
dimensions of food quality of casual-dining restaurants, the
dimension of the highest total effect of resource investment was
“cooking.” In addition, this critical quality factor had an effect on
visual appeal, hygiene, and taste. Moreover, although the total
effect of resource investment in “visual appeal” was not the
highest, it would also affect “cooking” and “taste.” The results of
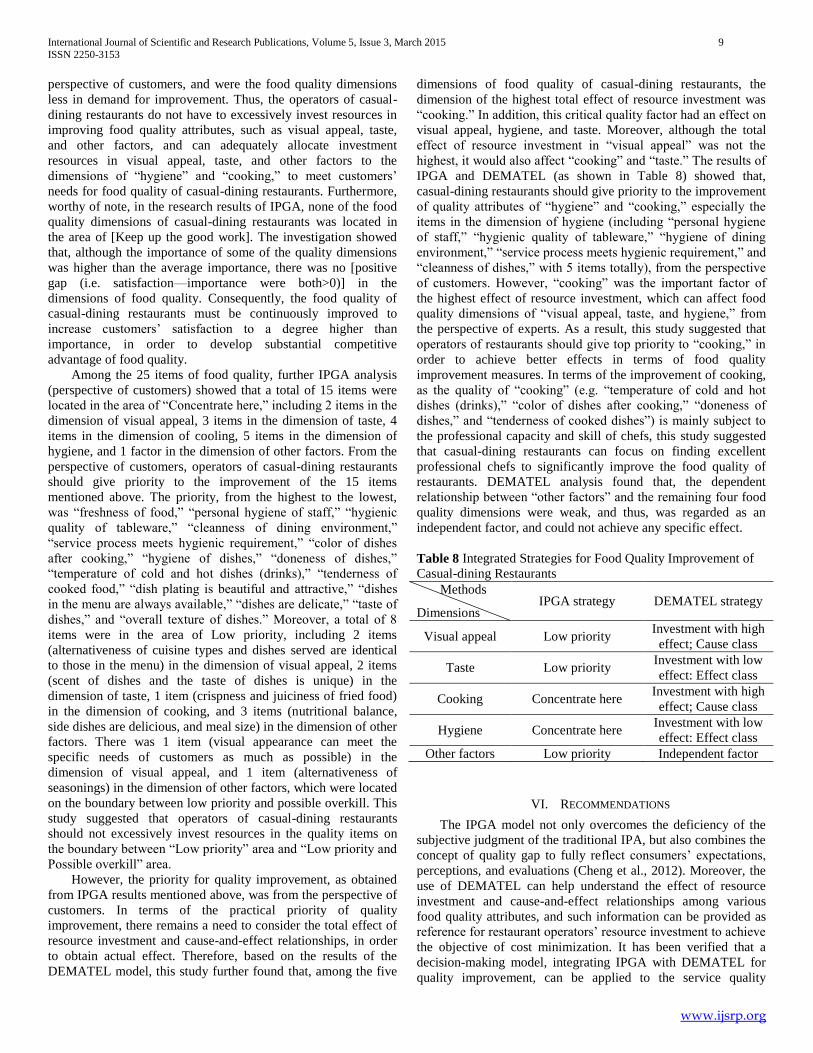
IPGA and DEMATEL (as shown in Table 8) showed that,
casual-dining restaurants should give priority to the improvement
of quality attributes of “hygiene” and “cooking,” especially the
items in the dimension of hygiene (including “personal hygiene
of staff,” “hygienic quality of tableware,” “hygiene of dining
environment,” “service process meets hygienic requirement,” and
“cleanness of dishes,” with 5 items totally), from the perspective
of customers. However, “cooking” was the important factor of
the highest effect of resource investment, which can affect food
quality dimensions of “visual appeal, taste, and hygiene,” from
the perspective of experts. As a result, this study suggested that
operators of restaurants should give top priority to “cooking,” in
order to achieve better effects in terms of food quality
improvement measures. In terms of the improvement of cooking,
as the quality of “cooking” (e.g. “temperature of cold and hot
dishes (drinks),” “color of dishes after cooking,” “doneness of
dishes,” and “tenderness of cooked dishes”) is mainly subject to
the professional capacity and skill of chefs, this study suggested
that casual-dining restaurants can focus on finding excellent
professional chefs to significantly improve the food quality of
restaurants. DEMATEL analysis found that, the dependent
relationship between “other factors” and the remaining four food
quality dimensions were weak, and thus, was regarded as an
independent factor, and could not achieve any specific effect.
Table 8 Integrated Strategies for Food Quality Improvement of
Casual-dining Restaurants
Methods
Dimensions IPGA strategy DEMATEL strategy
Visual appeal Low priority Investment with high
effect; Cause class
Taste Low priority Investment with low
effect: Effect class
Cooking Concentrate here Investment with high
effect; Cause class
Hygiene Concentrate here Investment with low
effect: Effect class
Other factors Low priority Independent factor
VI. RECOMMENDATIONS
The IPGA model not only overcomes the deficiency of the
subjective judgment of the traditional IPA, but also combines the
concept of quality gap to fully reflect consumers’ expectations,
perceptions, and evaluations (Cheng et al., 2012). Moreover, the
use of DEMATEL can help understand the effect of resource
investment and cause-and-effect relationships among various
food quality attributes, and such information can be provided as
reference for restaurant operators’ resource investment to achieve
the objective of cost minimization. It has been verified that a
decision-making model, integrating IPGA with DEMATEL for
quality improvement, can be applied to the service quality
International Journal of Scientific and Research Publications, Volume 5, Issue 3, March 2015 10
ISSN 2250-3153
www.ijsrp.org
improvement of IT and hospitality industries (Tsai et al., 2011;
Cheng et al., 2012). However, as food quality improvement
strategies of restaurants continue to involve issues concerning
[quality gap] and “effective resource allocation,” a decision-
making model integrating IPGA with DEMATEL for quality
improvement can combine the perspectives of customers and
experts to effectively determine the critical factors most in
demand for urgent improvement and of the highest effect of
resource investment. The research results can be provided as
reference for restaurant operators to develop more adequate
guidelines for quality improvement strategies and resource
allocation. The research results may have a considerable practical
contribution and value to the food quality improvement strategies
of casual-dining restaurants, which will be beneficial to the
enhancement of casual-dining restaurants’ competitiveness in the
market, and thus, the development of sustainable operation.
Owing to restrictive factors, such as cost and geography, the
main research limitations of this study were that only customers
in 10 casual-dining restaurants in Taipei City were selected as the
subjects, and the opinions from customers in other areas or
dining at restaurants of other price levels could not be reflected.
Therefore, future researchers are advised to expand the research
scope to restaurant customers in different areas and countries, or
even use other research methods (e.g. Kano model, ANP), to
investigate food quality improvement strategies for restaurants
from different perspectives in order to effectively analyze factors
affecting the food quality of restaurants.
REFERENCES
[1] Barbas S 2003. I’ll take chop suey: restaurants as agents of culinary and cultural change. Journal of Popular Culture, 36(4): 669-686.
[2] Cardello AV 1995. Food quality, context and consumer expectation. Food quality and Prefernce, 6(3): 163-170.
[3] Cardello AV, Bell R, Matthew FK 1996. Attitudes of Consumers Toward Military and Other Institutional Foods. Food quality and Preference, 7(1): 7-20.
[4] Cheng CC, Lin EC, Liu SL, Hu HY, Lin, CY 2011. Exploration on Food quality of Fine-dining restaurants by using IPGA. Journal of sustainable development and management strategy, 3(2): 1-22.
[5] Cheng CC, Chen CT, Hsu FS, Hu HY 2012. Enhancing service quality improvement strategies of fine-dining restaurants: New insights from integrating a two-phase decision-making model of IPGA and DEMATEL analysis. International Journal of Hospitality Management, 31(4): 1155-1166.
[6] Darden 2011. Key Consumer Challenges and Restaurant Trends for 2011. Accessed July 1, 2012. http://www.beefusa.org/CMDocs/BeefUSA/resources/CC2011-Trends-and-Trendsetters-Darden.pdf.
[7] Financial Data Center, Ministry of Finance, Taiwan, R.O.C. 2012. 2011 Number of annual operating profit business, Accessed June 14, 2012, http://www.fdc.gov.tw/ct.asp?xItem=2284&ctNode=668&mp=1
[8] Fontela E, Gabus A 1976. The DEMATEL observer, DEMATEL 1976 Report. Switzerland, Geneva, Battelle Geneva Research Center.
[9] Fornell C, Larcker DF 1981. Structural equation models with unobservable variables and measurement error: Algebra and statistics. Journal of Marketing Research, 18(1): 382-388.
[10] Gabus A, Fontela E 1973. Perceptions of the World Problematique: Communication Procedure, Communicating with Those Bearing Collective Responsibility, DEMATEL Report No. 1, Battelle Geneva Research Center, Geneva, Switzerland.
[11] Hansen E, Bush RJ 1999. Understanding Customer Quality Requirements. Industrial Marketing Management, 28(2): 119-130.
[12] Henson S, Majowicz S, Masakure O, Sockett P, Jones A, Hart R, Carr D, Knowles L. 2006. Consumer assessment of the safety of restaurants: the role of inspection notices and other information cues. Journal of Food Safety, 26(4): 275-301.
[13] Hu HY, Chiu SI, Cheng CC, Yen TM 2011. Applying the IPA and DEMATEL models to improve the order-winner criteria: A case study of Taiwan’s network communication equipment manufacturing industry. Expert systems with applications, 38(8): 9674-9683.
[14] Jang S, Ha A, Silkes CA 2009. Perceived attributes of Asian foods: From the perspective of the American customers. International Journal of Hospitality Management, 28(1): 63-70.
[15] Kim WG, Ng CYN, Kim YS 2009. Influence of institutional DINESERV on customer satisfaction, return intention and word-of-mouth. International Journal of Hospitality Management, 28(1): 10-17.
[16] Lin CJ, Wu WW 2008. A causal analytical method for group decision-making under fuzzy environment. Expert System with Applications, 34(1): 205-213.
[17] Lin SP, Chan YH, Tsai MC 2009. A transformation function corresponding to IPA and gap analysis. Total Quality Management & Business Excellence, 20(8): 829-846.
[18] Marr JW 1986. Letting the Customer Be the Judge of Quality. Quality Progress, 19(10): 46-49.
[19] Martilla JA, James JC 1977. Importance-Performance Analyses. Journal of Marketing, 41(1): 77-79.
[20] Mattila AS 2001. Emotional bonding and restaurant loyalty. Cornell Hotel and Restaurant Administration Quarterly, 42(6): 73-79.
[21] Molnaar PJ 1995. A Model for Overall Description of Food Quality. Food Qualtiy and Preference, 6(3): 185-190.
[22] Nanayo F, Toshiaki T 2002. A New Method of Paired Comparison by Improved DEMATEL Method: Application to the Integrated Evaluation of a Medical Information Which has Multiple Factors. Japan Journal of Medical Informatics, 22(2): 211-216.
[23] Palmer JD 1985. Consumer service industry exports: New attitudes and concepts needed for a neglected sector. Columbia Journal of World Business, 20: 69-74.
[24] Pettijohn LS, Pettijohn CE, Luke RH 1997. An evaluation of fast food restaurant satisfaction: determinants, competitive comparisons and impact on future patronage. Journal of Restaurant and Foodservice Marketing, 2(3): 3-20.
[25] Tarrant MA, Smith EK 2002. The use of a modified importance-performance framework to examine visitor satisfaction with attributes of outdoor recreation settings. Managing Leisure, 7(2): 69-82.
[26] Tamura H, Okanishi H, Akazawa K 2006. Decision Support for Extracting and Dissolving Consumers’ Uneasiness over Foods Using Stochastic DEMATEL. Journal of Telecommunications and Information Technology, 4: 91-95.
[27] Tseng ML 2009. Using the extension of DEMATEL to integrate hotel service quality perceptions into a cause–effect model in uncertainty. Expert Systems with Applications, 36(5): 9015-9023.
[28] Tsai MC, Liu SY, Chang JL, Chen YC, Wu SC 2006. A Comparative Study on Food Quality of Domestic Fast-food Restaurant. Journal of Performance and Strategy Research, 3(2): 95-111.
[29] Tsai MC, Lin CL 2010. Expectations and Perceptions in Restaurant Services: Three Dimension Gap Analysis. International Conference on Business and Information, Kitakyushu, Japan.
[30] Tsai MC, Lin SP, Chan YH 2011. Service Failures Identification: The Involvement of the Interrelation Effect in Service Practices. African Journal of Business Management, 5(6): 2301-2311.
[31] United States Department of Agriculture(USDA) 2012. Foreign Agricultural Service, Global Agricultural Information Network. Food Service - Hotel Restaurant Institutional, Food Service Sector Enjoys Strong Growth in Taiwan. Accessed July 1, 2012. http://gain.fas.usda.gov/Recent%20GAIN%20Publications/Food%20Service%20-%20Hotel%20Restaurant%20Institutional_Taipei%20ATO_Taiwan_6-25-2012.pdf
[32] Verbeke W, Lopez GP 2005. Ethnic food attitudes and behavior among Belgians and Hispanics living in Belgium. British Food Journal, 107(11): 823-840.
International Journal of Scientific and Research Publications, Volume 5, Issue 3, March 2015 11
ISSN 2250-3153
www.ijsrp.org
[33] Wernerfelt B 1984. A resource-based view of the firm. Strategic Management Journal, 5(1): 57-91.
AUTHORS
First Author – Ying-Tsai Lin, Lecturer, Department of Food &
Beverage Management, Taipei College of Maritime Technology,
Address: No.212, Yen Ping N. Rd., Sec. 9, Taipei City, Taiwan,
111, R.O.C. E-mail: [email protected], Tel: +886-2-
28102292, Fax: +886-2-28106688.
Second Author – Hsin-Lan Liu, Assistant Professor, Department
of Applied Science of Living, Chinese Culture University,
Address:No.55, Hwa-Kang Road, Yang-Ming-Shan, Taipei
City, Taiwan, 11114, R.O. C. E-mail: [email protected],
Tel: +886-2-28610511; Fax: +886-2-2862-4393.
Third Author – Ya-Yuan Chang, Ph.D., Department of business
administration, National Chung Hsing University, Address:
No.250, Kuo Kuang Rd., Taichung City, Taiwan, 402, R.O.C. E-
mail: [email protected], Tel: +886-2-28102292; Fax:
+886-2-2810-6688.
Fourth Author – Ching-Chan Cheng*, Associate Professor,
Department of Food & Beverage Management, Taipei College of
Maritime Technology, Address: No.212, Yen Ping N. Rd., Sec.
9, Taipei City, Taiwan, 111, R.O.C., E-mail:
[email protected], Tel: +886-2-28102292; Fax: +886-
2-2810-6688. (*Corresponding Author)

International Journal of Scientific and Research Publications, Volume 5, Issue 3, March 2015 12
ISSN 2250-3153
12


