

Factoring Reimbursement Factoring Reimbursement
Into the Deal Into the DealMay 2, 2005May 2, 2005
AgendaAgenda
• Tag overview
• Who pays for health care
• What is reimbursement
• How reimbursement affects deal’s value
• Developments and trends
• How Medicare is changing biotech market
• Building reimbursement analysis into deal process
• U.S. reimbursement planning and problem solving since 1998
• Former owner S&FA; Exec VP PAREXEL
• Payer research; strategic planning
• Reimbursement forecasting
• Competitive analysis
• Advocacy with major payers

Tag Client MixTag Client Mix
Pharmaceuti-cals20%
Biotech/ Biologicals
40%
Investors/ Advisors
15%
Ad/ PR/ PA Agencies
10%
Devices/ Diagnostics
15%

Who Pays for Health CareWho Pays for Health Care
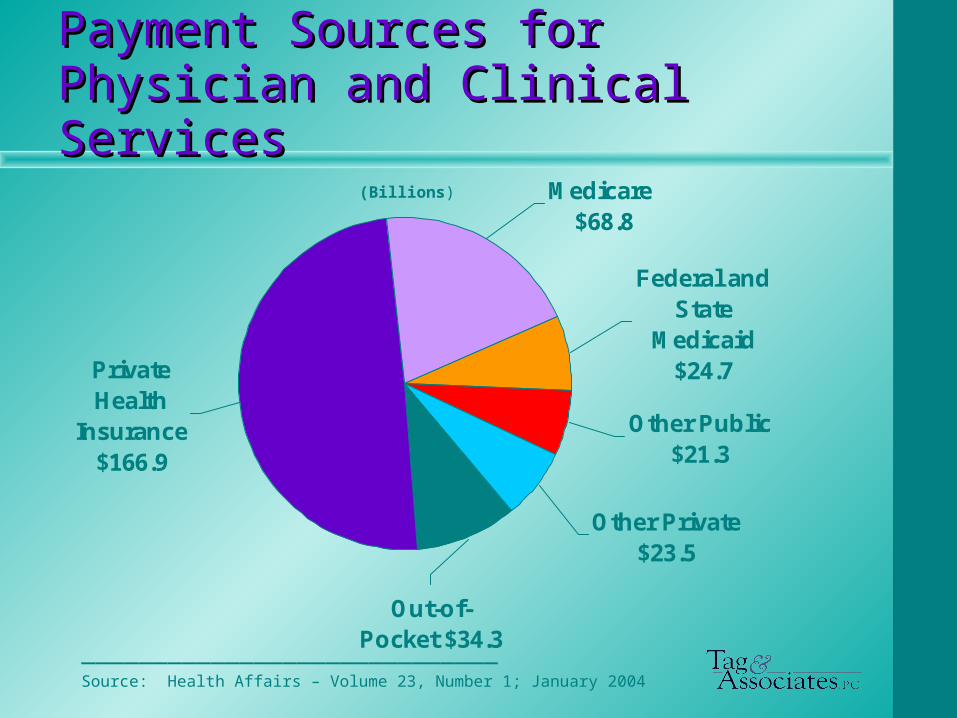
Payment Sources forPayment Sources forPhysician and Clinical ServicesPhysician and Clinical Services
Other Private $23.5
Medicare $68.8
Other Public $21.3
Private Health
Insurance $166.9
Federal and State
Medicaid $24.7
Out-of-Pocket $34.3
_____________________________Source: Health Affairs – Volume 23, Number 1; January 2004
(Billions)

Payment Sources for Prescription Payment Sources for Prescription DrugsDrugs
Federal and State
Medicaid $28.6
Medicare $2.6
Private Health
Insurance $77.6
Out-of-Pocket $48.6
Other Public $5.0
_____________________________Source: Health Affairs – Volume 23, Number 1; January 2004
(Billions)
Reimbursement andReimbursement andHow It Affects Deal’s Value How It Affects Deal’s Value

Know Whether “Reimbursement” Know Whether “Reimbursement” Means Coverage or PaymentMeans Coverage or Payment
Coverage
• Is the product or related service an insured benefit?
– Under what circumstances?
Payment
• How much will the insurer reimburse?
– To whom?

Many Factors Affect Many Factors Affect ReimbursementReimbursement
• Tech category (e.g. Rx, OTC, DME, supply, diagnostic, screen)
• Payer• Tx setting• Dosage form• Admin method• Labeling (on/off)• Diagnosis• Safety & efficacy
• Product cost (price)• Related costs (e.g. lab)• Uniqueness• Alternative cost• Cost offsets• Prescribing Dr.• Abuse potential• Political/social• Evidence-based
outcomes

Reimbursement Winners Reimbursement Winners
• Norplant – Medicaid; not an OC
• Lupron depot – Clinician administered
• EPO – Cover as sub Q or we do trials as IV only
• Drug eluting stents – Showed payers cost impact, good and bad
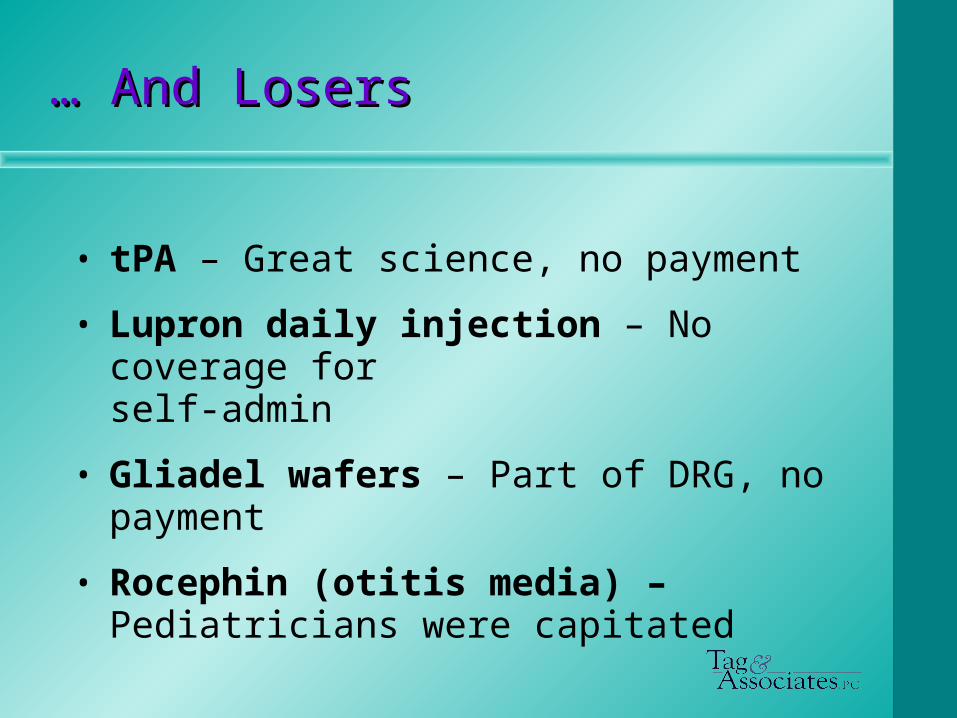
… … And LosersAnd Losers
• tPA – Great science, no payment
• Lupron daily injection – No coverage for self-admin
• Gliadel wafers – Part of DRG, no payment
• Rocephin (otitis media) – Pediatricians were capitated

Take AwayTake Away
• Great medicine (tPA) will trump poor reimbursement …
• But not every good technology is great medicine
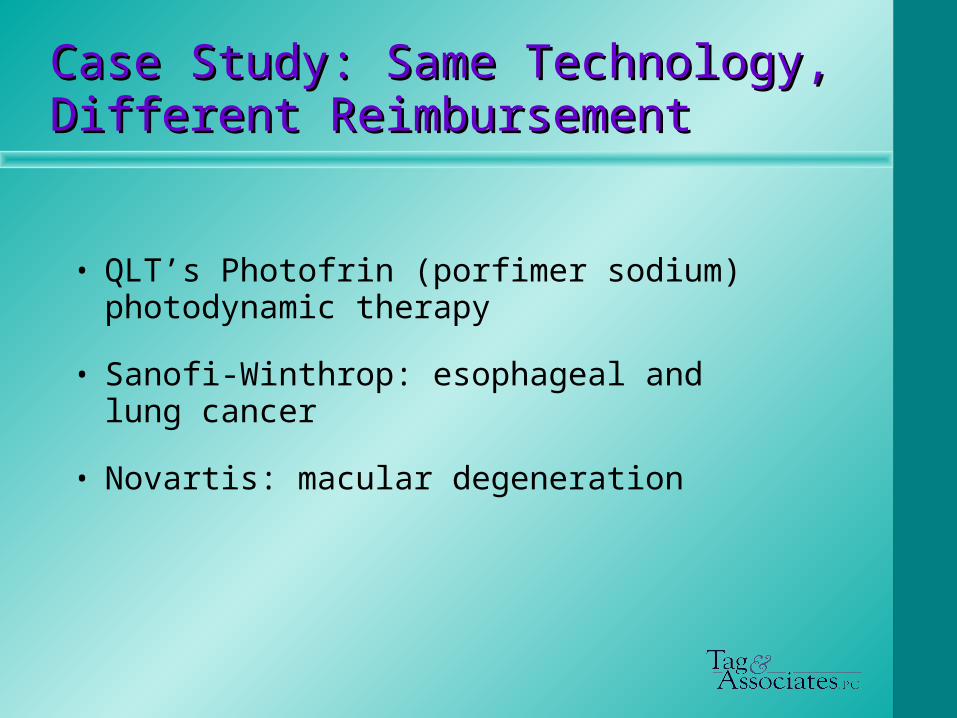
Case Study: Same Technology, Case Study: Same Technology, Different ReimbursementDifferent Reimbursement
• QLT’s Photofrin (porfimer sodium) photodynamic therapy
• Sanofi-Winthrop: esophageal and lung cancer
• Novartis: macular degeneration

Poor Return for Sanofi-Poor Return for Sanofi-WinthropWinthrop
• Hospital O/P procedure in era of poor hospital reimbursement
• Endoscope/bronchoscope procedures under-reimbursed based on simple tech
• 2 year wait for drug reimbursement code
Because of reimbursement, procedure viewed as last resort despite good clinical outcomes

Winner For Novartis Winner For Novartis
• Decent reimbursement for physician office single eye procedure– Strategy developed to deal with subpar
reimbursement of 2nd eye procedure
• Good drug reimbursement year 1
• No therapeutic alternative Robust uptake, despite mediocre
clinical results

Developments and TrendsDevelopments and Trends

OverviewOverview
• Evolving payer objectives: Cost avoidance > Cost benefit > Value > Affordability
• Utilization control via patient cost sharing
• Federal government becoming largest customer for Rx drugs
• Medicare evolving: payer > national heath policy and treatment manager
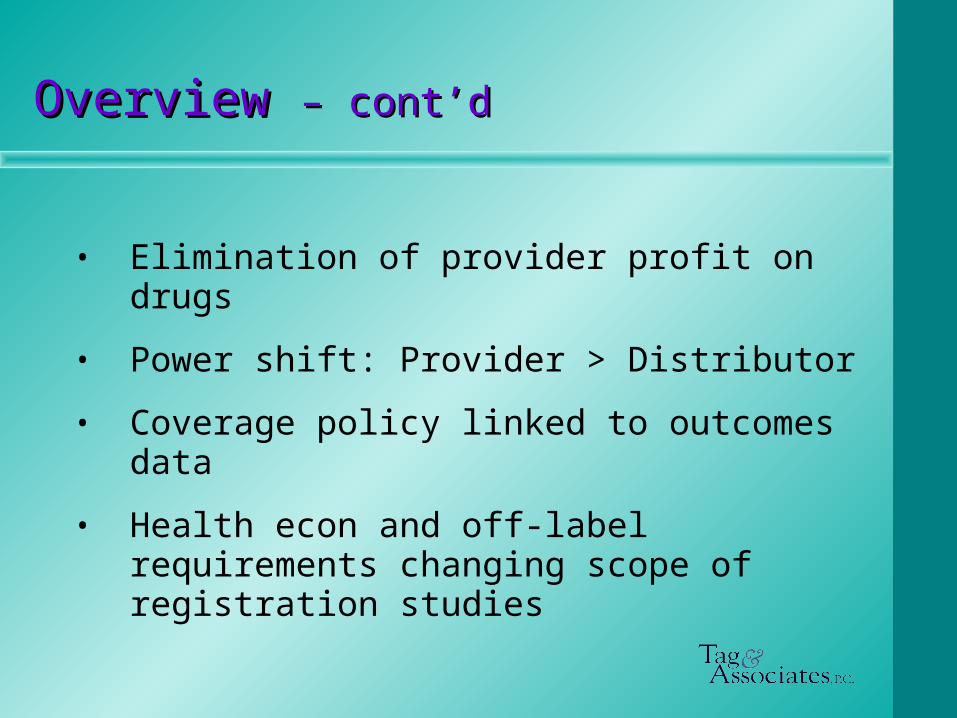
OverviewOverview – cont’d– cont’d
• Elimination of provider profit on drugs
• Power shift: Provider > Distributor
• Coverage policy linked to outcomes data
• Health econ and off-label requirements changing scope of registration studies
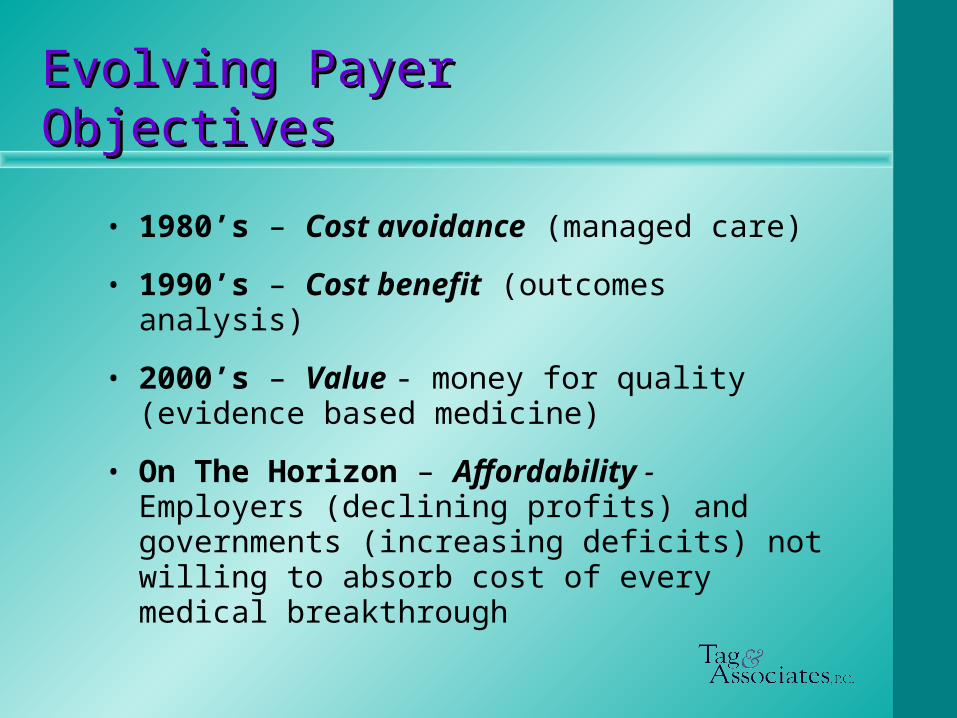
Evolving Payer ObjectivesEvolving Payer Objectives
• 1980’s – Cost avoidance (managed care)
• 1990’s – Cost benefit (outcomes analysis)
• 2000’s – Value - money for quality (evidence based medicine)
• On The Horizon – Affordability - Employers (declining profits) and governments (increasing deficits) not willing to absorb cost of every medical breakthrough
Utilization Control ViaUtilization Control ViaPatient Cost SharingPatient Cost Sharing
• “Get more beneficiary skin in the game and better utilization decisions will result”
• Co-insurance (30%) for self-administered injectables
– “Do I really need Enbrel for my psoriasis?”
• $30 difference between 2nd and 3rd tier brands
– “Maybe this other drug is just as good as Prozac.”

Federal Government Will Control Federal Government Will Control 40% of Rx Market40% of Rx Market (White Dots)(White Dots)
Medicaid$30
Out of Pocket
$60
Other Public $10
Medicare $65
Private Ins $95
2002 Rx Payment Sources (bil)2002 Rx Payment Sources (bil) 2008 Projected (bil)2008 Projected (bil)
Other Public $5.0
Private Ins
$77.6
Medicaid $28.6 Out of
Pocket $48.6
Medicare $2.6
___________________________Source: 2002 data: Health Affairs Volume 23, Number 1; January 2004. 2008 data: Tag & Associates estimate.
Total = $162.4 Total = $260

Medicare Evolving to Be NationalMedicare Evolving to Be NationalTreatment Policy ManagerTreatment Policy Manager
• CMS process for evaluating new technology is rigorous and willing to embrace new costs– Implanted automatic defibrillators
– Drug eluting stents
• Adverse Medicare coverage policy decision is routinely followed by private payers

Elimination of Provider Profit on Elimination of Provider Profit on Clinician-Administered DrugsClinician-Administered Drugs
• Medicare: AWP > ASP; CAP
• Medicaid: National “reform” on the horizon
Elimination of Provider Profit on Elimination of Provider Profit on Clinician-Administered DrugsClinician-Administered Drugs – – cont’d.cont’d.
• Private insurers: Feb 2005 interview of 15 medical/pharmacy directors (100 mil. lives)
– “How will ASP influence your 2006 reimbursement?”• 4 will convert• 9 are studying• 2 no influence
– 10/15 have direct supply program
Power Shift to DistributorsPower Shift to Distributors
• CAP, direct supply shifts power to distributor
– Ability to control access via formulary
– Reflected in M&A activity
• Medco/Accredo
• AmeriSource Bergen/US BioServices
• Caremark/Advance PCS
Coverage Policy linked to Coverage Policy linked to Outcomes DataOutcomes Data
• New in 2005: Medicare expands coverage for selected technologies only if manufacturer agrees to data collection per CMS spec
– Implanted defibrillators
– Off label use of 4 new Ca drugs

Coverage Policy Linked to Coverage Policy Linked to Outcomes Data Outcomes Data – cont’d.– cont’d.
• Since late 1990s: Private tech evaluators become more influential each year– BC/BS TEC
– Wilkerson Group
• Globalization: UK NICE influence spreads across EU

Broad Registration Studies Needed Broad Registration Studies Needed to Support Reimbursementto Support Reimbursement
• Traditional FDA strategy of “path of least resistance” still OK for FDA but no longer viable for payer success
– Payers demanding health econ data for coverage
– Clamping down on off label uses not supported by scientifically rigorous data

How Medicare Is Changing How Medicare Is Changing the Biotech Marketthe Biotech Market

Clinician-Administered Clinician-Administered DrugsDrugs
• Physician office and hospital O/P drugs are a pass-through expense rather than a profit center
• First time ever formulary as a result of CAP
– Some categories need only 1 drug

Clinician-Administered Drugs Clinician-Administered Drugs – – cont’d.cont’d.
• Coverage of new tech will require 1 of the following:
– Lower price
– Impressive safety or efficacy
– Favorable outcomes data
– Widespread socio-political demand

Self-Administered DrugsSelf-Administered Drugs
• Part D establishes a de facto national baseline formulary of ~250 drugs
• Beneficiaries have strong $ incentive to keep total Rx spending <$2,250
– Between $2,250 and $5,100, patient pays 100%

Building Reimbursement Into Building Reimbursement Into Deal Process Deal Process

Make It Fundamental to the Make It Fundamental to the Go/No Go DecisionGo/No Go Decision
• Immediately identify reimbursement issues
• Can development decisions be used to fix problem or gain advantage?
• If problem can’t be fixed, how will it impact the value of the technology?

Take the Payers’ Take the Payers’ PerspectivePerspective
• Which payer has the biggest stake?
• To whom are they beholden?
• What/who influences their decision making?
• How will technology impact them?
• What happens if they say “No?”
Do Not Rely On the Downstream Do Not Rely On the Downstream PartnerPartner
• Regardless of size and general competence, they are wrong as often as they are right
• They will under-value the technology b/c of easily manageable reimbursement problem
• To the person you are dealing with, it always looks “just like this other product we had 2 years ago in this other category ….”

Teach Your ClientTeach Your Client
• Most technology developers are unaware of reimbursement issues or have the wrong information
• Help them understand why payers are as much a customer as clinicians
Bring a Reimbursement POA Bring a Reimbursement POA to the Discussion Tableto the Discussion Table
• Show prospective partners that you
– Expect them to invest at an appropriate level to conquer or capitalize on the reimbursement issues
– Will not allow reimbursement to be a red herring that distracts from other more significant issues


