

2019 Annual Report 2019
EXCELSIOR CAPITAL LIMITED
For
per
sona
l use
onl
y
02MESSAGE FROM THE CHAIRMAN
04DIRECTORS’ REPORT
10 REMUNERATION REPORT
18FINANCIAL STATEMENTS
18STATEMENT OF PROFIT OR LOSS
19STATEMENT OF COMPREHENSIVE INCOME
20STATEMENT OF FINANCIAL POSITION
21STATEMENT OF CHANGES IN EQUIT Y
22STATEMENT OF CASH FLOWS
01 0
2
Contents
For
per
sona
l use
onl
y

2019 ANNUAL REPORT 1
23NOTES TO THE CONSOLIDATED
FINANCIAL STATEMENTS
61DIRECTOR’S DECL ARATION
62INDEPENDENT AUDITOR’S REPORT
69ASX ADDITIONAL INFORMATION
71CORPORATE INFORMATION0
3 04
For
per
sona
l use
onl
y

DEAR SHAREHOLDERS,I am delighted to report the financial results for FY19 representing the underlying strength of Excelsior Capital Limited.
Excelsior Capital has expanded its development of our Minto Industrial Product; building our future product pipeline through a strong Research and development program; and is progressing well with a program of operational efficiencies.
Financial resultsExcelsior Capital posted a statutory Net Profit after Tax (NPAT) result of $4.1 million and a fully franked final dividend of 3.0 cents per share.
Total Group revenue grew by 22% to $59.3 million, driven by strong sales in mining plugs and couplers as a result of the increase in local production and continued strong export sales to Mongolia and Indonesia.
The continued focus on cost efficiencies has contributed to the Electrical operations business increasing its pre-tax profit by 24% to $7.2 million.
The relocation of the two Sydney plants has been delayed by two years due to the extension of the current lease arrangement being exercised in April this year. The relocation will now take place in 2021.
Share buybackThe company successfully completed the off-market share buy-back of ordinary fully paid shares in Excelsior that was announced on 23 August 2018.
Under the terms of the buy-back, the Company bought back 2,372,902 shares, being approximately 7.56% of Excelsior’s issued capital, at a price of $1.44 per share for a total of $3,416,979. Payment for shares bought back was made on 23 November 2018.
The Share Buy-Back was funded from existing cash and the company continues to maintain a strong debt free balance sheet and capital position following the buy-back.
Message from the Chairman
EXCELSIOR CAPITAL LIMITED2
For
per
sona
l use
onl
y

2019 ANNUAL REPORT 3
OutlookThere continues to be pressure on margins as the mix of sales changes with revenue growth coming from lower margin cable sales. The Directors expect low single-digit growth in revenue.
With the current economic uncertainty and the potential for a slowdown in both the US and China the company has recently moved most of its investment portfolio to cash.
Change of company nameFollowing approval of a special resolution by shareholders at the 2018 Annual General Meeting, the Company changed its name from CMI Limited to Excelsior Capital Limited in November 2018. The ASX trading code changed from CMI to ECL in December 2018.
With thanksThe last 12 months have been a great success for Excelsior Capital and we are proud of what we have achieved. I wish to thank the Board, management team and staff for their ongoing commitment to our organisation.
In addition, I’d also like to thank my fellow Board members for their support and strategic focus over the last 12 months.
Yours faithfully,
Michael Glennon Non-Executive Chairman
Message from the Chairman
For
per
sona
l use
onl
y

Directors’ report
4 EXCELSIOR CAPITAL LIMITED
Your directors submit their report for the year ended 30 June 2019.
Directors
The names and details of the Company’s directors in office during the financial year and until the date of this report are set out below. Directors were in office for this entire period unless otherwise stated.
Names, qualifications, experience and special responsibilities
M.X. Glennon, B.Comm (Non-executive Chair)
Mr Glennon has over 20 years’ experience in financial markets and is the founder of Glennon Capital Pty Ltd. He has extensive experience in investing, building and operating businesses and strategic exiting of those businesses. His experience and contacts in small listed companies is extensive and he has gained a detailed understanding of many industries and business models over his time in the market. He has served on the boards of private and public companies.
Mr Glennon joined Excelsior Capital Limited as Director in December 2016 and was appointed as Executive Chairman in February 2017. He moved to non-executive Chairman on 8 April 2019.
He is a member of both the Group’s audit committee and the remuneration committees, together with Ms Catelan and Mr Green below mentioned. During the past three years, Mr Glennon currently serves as a director of the following listed companies:
Glennon Small Companies Limited* – appointed 29 April 2015
Benjamin Hornigold Limited* – appointed 12 June 2019
* Denotes current directorship
L.J. Catelan (Executive Director)
Ms Catelan is a member of the Australian Institute of Company Directors. She is an experienced company director with exposure to both listed and private companies. Ms Catelan is also a director of Excelsior Asset Management Pty Ltd and Catelan Securities Pty Ltd.
Ms Catelan has experience in property development and mezzanine debt financing. She has been involved in asset sales, corporate restructuring and a range of activities within private and public companies.
C.D. Green, LL.B
Mr Green is a solicitor with more than 38 years’ experience in banking and property law. Mr Green as a lawyer acts primarily for banks and other financial institutions on a range of property, commercial, business and residential transactions. He has a comprehensive understanding of both sides of large financial and business transactions. As the former managing partner of a mid-tier national law firm and currently a section leader of a
top 10 national law firm, Mr Green has extensive management, marketing and business development experience.
Mr Green is a former director, Life Member and Fellow of the Mortgage and Finance Association of Australia and current member of the Australian Institute of Company Directors.
Mr Green has combined his work as a practising solicitor with his role as a non-executive director of the Company since 2016.
Company Secretary
M.J. Copeland, B.Bus, M.Com, CPA
M. Copeland has been the Company Secretary since May 2019. He has been a CPA for over 14 years.
Interests in the shares and options of the Company and related bodies corporate
As at the date of this report, the interests of the directors in the shares and options of Excelsior Capital Limited were:
Number of ordinary
shares
Number of options
over ordinary
shares
M.X. Glennon
L.J. Catelan
C.D. Green
122,076
13,829,800
25,000
Nil
Nil
Nil
Principal activities
The principal activities during the year of entities within the consolidated group were:
• Manufacture and distribution of electrical cables and associated components for industrial, mining, infrastructure, commercial, petrochemical and information technology applications throughout South East Asia and Oceania; and
• Management of a substantial investment portfolio.
There have been no significant changes in the nature of these activities during the year.
Operating and financial review
The purpose of this section is to:
• Provide an overview of our business model;
• Discuss our strategy (including the risks associated with our strategy);
• Outline the significant changes in the state of affairs; and
• Provide a review of our financial condition.
For
per
sona
l use
onl
y

52019 ANNUAL REPORT
Excelsior Capital Limited – Expertise and precision is our purpose
CMI Operations Pty Limited, a subsidiary of Excelsior Capital Limited has a long and proud history of providing innovative electrical cables and components. From our beginnings in 1991, as a local manufacturer of electrical cable serving the Queensland market, we have expanded to supply a range of innovative electrical products to customers around the globe. Today, we have operations in four states and employ 60 people, supplying the industrial, mining, infrastructure, commercial, petrochemical and information technology sectors with electrical solutions.
High value coupler and receptacle products are exported to the mining sectors in Indonesia, Papua New Guinea, and China. Operations are conducted from several manufacturing and distribution facilities in Australia. The division’s primary manufacturing plant is located at Meadowbank in Sydney. This plant operates to international quality standards ISO9001 and ISO14001, AS/NZS 4801.
The CMI Operations business is divided into two key areas:
1. Electrical cables
Leading cable brands dedicated to the requirements of all segments of the electrical industry including:
• XLPE Cables: supplying power in low and high voltage applications such as commercial and industrial sub-mains, factories, utility infrastructure, and variable speed drive (VSD) motors and control systems.
• Hartland Cables: synonymous in Australia since 1954 for its leading range of Audio, Coaxial, Control, Data, Instrumentation, UL Approved Connecting Wire, Copper Braid, Screened and Unscreened Multicore and Multipair cables.
• Aflex Cables: offering flexible cables for use in applications where tight or difficult access is restrictive or where movement occurs. These cables are generally supplied for switchboards, generators, sound & lighting, batteries, VSD motors, submersible pumps and low voltage control systems.
• The Group’s customised cable division also manufactured locally flexible cords and cable assemblies to cover a comprehensible range of types for applications such as medical, technology, lighting & entertainment as well as traditional original manufacture equipment (OEM) markets. This includes combining wiring and connectors such as basic cable assemblies and complex wiring harnesses to a customised requirements.
2. Minto Industrial Products
Minto Industrial Products is synonymous with the mining industry in particular with its class leading couplers and receptacle products. When power and safety are required in a complex and hazardous environment Minto is the class leader in most applications. The reputation of Minto is now global with the exports to mining installations in Indonesia, Papua New Guinea, and China.
Market drivers
Technological change: drives demand for new and improved technology and creates the possibility for lower cost mass market electrical solutions. There is the potential for disruptive market entrants from the technology sector.
Increased safety expectations: new regulatory requirements in domestic and overseas markets drive demand for mass market solutions. Requirement for mining and infrastructure to maintain best practice solutions drive demand for innovative tailored products. This also means that existing solutions become obsolete more quickly and innovation and speed to market are now necessities, while price pressures continue to grow.
Globalisation: allows access to new, high growth markets. There is the potential for competition from new market entrants from developing countries, with lower cost base.
Strategic pillars
Innovation
We need to stay at the forefront of technology if we are to find new ways of staying ahead of the competition, and to meet emerging risks in the mining and construction industry. To help us meet this challenge, we have a substantial research and development (R&D) program that creates innovative solutions to electrical issues.
For the value of that innovation to be realised for our customers and our shareholders, solutions need to be developed and brought to market as quickly as possible. Our business is focused on building a pipeline of solutions from our leading edge, tailored offerings to affordable, mass market products.
Client focus
Excelsior Capital Limited has a proud history of collaboration with our clients in mining and infrastructure to create cutting-edge solutions. Through our involvement in industry sector associations, including our support of the Mine Electrical Safety Association (MESA), we continue to build strong relationships across these sectors backed by our own client relationship program.
Efficiency
To meet the challenges of a rapidly changing market, last year the Board announced the investment of $500,000 to develop a new mining plug. We have implemented a set of initiatives focusing our business on continuous improvement and enabling us to adapt to the changing needs of our customers for new, lower cost products. Key initiatives are:
• Engagement with external consultants to develop more effective management of our working capital; and
• Improving our product development processes to increase our speed to market for new mass market products.
For
per
sona
l use
onl
y

Directors’ report
6 EXCELSIOR CAPITAL LIMITED
Enablers
People
Our people, their experience, enthusiasm and dedication, are the foundation of our business.
Technology
We ensure our people have the tools they need to deliver value.
Relationships
Strong relationships with suppliers and business partners help us to deliver on our promise of expertise and precision.
The market opportunity
Electrical components continues to be a growing market globally, driven by rapidly changing technology, increasingly stringent regulation, and continuing expectation from our clients and their stakeholders that they will be provided with expertise and precision in each product we design and manufacture. In particular, we see great opportunities in emerging markets as consumption of our products increase in line with economic growth.
At the same time, electrical componentry is a highly competitive business. We now compete on a global basis with manufacturers from emerging markets such as China and India. We also face the potential of disruptive market entrants from the technology sector, building on their existing customer base and technology platforms to deliver electrical products.
Our strategy
Operational
In order to respond to these challenges, we are focusing our business on the development of our Minto Industrial product. We are building our future product pipeline through a combination of strategic acquisitions and a strong R&D program.
We consider our strategy to be sufficiently agile to deal with the increasing demand for sophisticated electrical products. Our R&D programs are set to deliver customised and mass market products to our customers on a timely basis.
As we begin to recognise revenue from products developed in previous years, we are confident that our ongoing investment in R&D will continue to deliver sustainable returns in the future.
Risks relating to Electrical and divested operations:
• Exposure to the domestic resource industry impacting revenues and margin;
• Key third party suppliers interrupting the supply chain;
• Failure of the product designs to meet a specified level of quality or conformance; and
• Warranties and indemnities given relating to the TJM divestment.
Investment portfolio
The Group’s primary investment strategy is to achieve long term dividend returns and capital appreciation, whilst managing risk through a portfolio approach to investing. The Group invests in a diversified portfolio of businesses where the Group may provide capital and strategic advice to those businesses to gain long term investment returns and capital appreciation. The capital is allocated to both listed and unlisted businesses, in the form of equity, debt or a combination of the two.
Risks relating to the investment portfolio:
• Termination of Management Agreement or Sub-Management Agreement;
• Loss of Australian financial service licence by the Sub-Manager;
• Manager and Sub-Manager performance;
• The market risk of investments declining in value because of economic developments or other events that affect the share market;
• The liquidity risk of being unable to sell investments at a fair price at times the Group requires cash; and
• Share price volatility caused by lack of diversity within the portfolio.
The Group manages risk by identifying risks and mitigating them through a combination of internal controls and management of a diversified portfolio.
Significant changes in the state of affairs
There was no significant changes in the state of affairs during the year.
Review of financial condition
Profit from continuing operations
The Group reported a profit before tax of $6.3 million for the year ended 30 June 2019, an increase of 10% from the prior year. The increase in profit before tax from was substantially driven from the contribution of the Electrical Components division of $7.7 million.
Liquidity and capital resources
The consolidated cash flow statement illustrates that there was a decrease in cash and cash equivalents in the year ended 30 June 2019 of $2.0 million (2018: $1.1 million decrease). Operating activities generated $10.5 million (2018: $3.7 million) of net cash flows.
The increase in cash inflow in comparison with the prior year is largely due to the improved working capital management strategies implemented by the Board. It is also consistent with the current phase of Excelsior Capital’s capital cycle, with revenues resulting from the development of products in previous years now beginning to be realised. This primarily includes revenues from the sale of Minto Industrial products.
For
per
sona
l use
onl
y

72019 ANNUAL REPORT
This net increase in the cash flows from operating activities has been offset by net cash used for investing activities of $7.4 million (2018: $2.9 million). This reflects the repositioning of the investment portfolio, in line with the investment mandate to achieve long term dividend returns and capital appreciation.
There was also a $5.1 million outflow (2018:$1.9 million cash outflow) from financing activities, with the current period increase in cash outflow attributable to the off-market share buy back in December 2018.
Business divisions
Electrical
The Group has been an assertive player in the electrical components market over the last 12 months. Revenue in the electrical component segment was $59.3 million for the year compared to $48.5 million in the previous year. The focus on cost efficiencies has contributed to segment profit before tax increasing by 11% to $7.7 million.
Investment portfolio
The investment portfolio produced a pre-tax loss of $0.3 million on a total revenue of $0.2 million, as well as comprehensive loss before tax of $0.5 million.
Environmental regulation and performance
The Group holds licences issued by the relevant environmental protection authorities in Australia. These licences specify the conditions imposed by the licence or regulation. The Group has an Environmental Management System at the Meadowbank operations and is certified to AS-NZS ISO 14001:2004.
There have been no known breaches of the consolidated entity’s licence conditions or any environmental regulations to which it is subject.
Share options
There were no options granted to or exercised by executives or employees during the year.
Indemnification of auditors
To the extent permitted by law, the Company has agreed to indemnify its auditors, Ernst & Young Australia, as part of the terms of its audit engagement agreement against claims by third parties arising from the audit (for an unspecified amount). No payment has been made to indemnify Ernst & Young during or since the financial year.
Indemnification and insurance of directors and officers
During or since the financial year, the Company has paid premiums in respect of a contract insuring all the directors of Excelsior Capital Limited against legal costs incurred in defending proceedings for conduct other than:
a. A wilful breach of duty; or
b. A contravention of sections 182 or 183 of the Corporations Act 2001, as permitted by section 199B of the Corporations Act 2001.
c. To the extent permitted by law, the Group has agreed to indemnify its Directors against a liability incurred as such a director to the extent permitted by the Corporations Act 2001 (Cth).
No payment has been made in relation to that indemnity during or since the financial year.
The contract of insurance prohibits disclosure of the nature of the liability and the amount of the premium.
Significant events after the balance date
Final dividend declared
On 28 August 2019, the directors of Excelsior Capital Limited declared a final dividend on ordinary shares in respect of the 2019 financial year. The total amount of the dividend is $869,834 which represents a fully franked dividend of 3.0 cents per share. The dividend has not been provided for in the 30 June 2019 financial statements.
Likely developments and expected results
Information on the strategy, prospects and risks of the Group is included in the Operating and Financial review.
Rounding off of amounts
The amounts contained in the financial report have been rounded to the nearest $1,000 (where rounding is applicable) where noted ($000) under the option available to the Company under ASIC Corporations (Rounding in Financial/Directors’ Reports) Instrument 2016/191. The Company is an entity to which this legislative instrument applies.
For
per
sona
l use
onl
y

Directors’ report
8 EXCELSIOR CAPITAL LIMITED
Directors’ meetings
The number of meetings of directors (including meetings of committees of directors) held during the year and the number of meetings attended by each director were as follows:
Meetings of committees
Directors’ meetings Audit Remuneration
Number of meetings held: 11 2 2
Number of meetings attended:
M.X. Glennon 11 2 2
L.J. Catelan 11 2 2
C.D. Green 10 2 2
All directors were eligible to attend all meetings.
Committee membership
As at the date of this report, the Company had an:
• audit committee, and
• a remuneration committee of the board of directors.
Members acting on the committees of the board during the year were:
Audit Remuneration
C.D. Green (c) C.D Green (c)
M.X. Glennon M.X. Glennon
L.J. Catelan L.J. Catelan
Notes
(c) Designates the chair of the committee
Dividends
Cents $’000
Final dividend recommended:Ordinary shares 3.00 869
Dividends paid in the year:Interim for the year
• on ordinary shares 3.00 869
Final for 2018 shown as recommended in the 2018 financial report
• on ordinary shares 3.00 941For
per
sona
l use
onl
y

92019 ANNUAL REPORT
Auditor’s independence declaration and non-audit services
The directors received the following declaration from the auditor of Excelsior Capital Limited.
Non-audit services
The following non-audit services were provided by the entity’s auditor, Ernst & Young. The directors are satisfied that the provision of non-audit services is compatible with the general standard of independence for auditors imposed by the Corporations Act 2001. The nature and scope of each type of non-audit service provided means that auditor independence was not compromised.
Ernst & Young received or are due to receive the following amounts for the provision of non-audit services:
$
Tax compliance services 15,952
Tax consulting 56,537
Assurance related 738
73,227
For
per
sona
l use
onl
y
Remuneration report
10 EXCELSIOR CAPITAL LIMITED
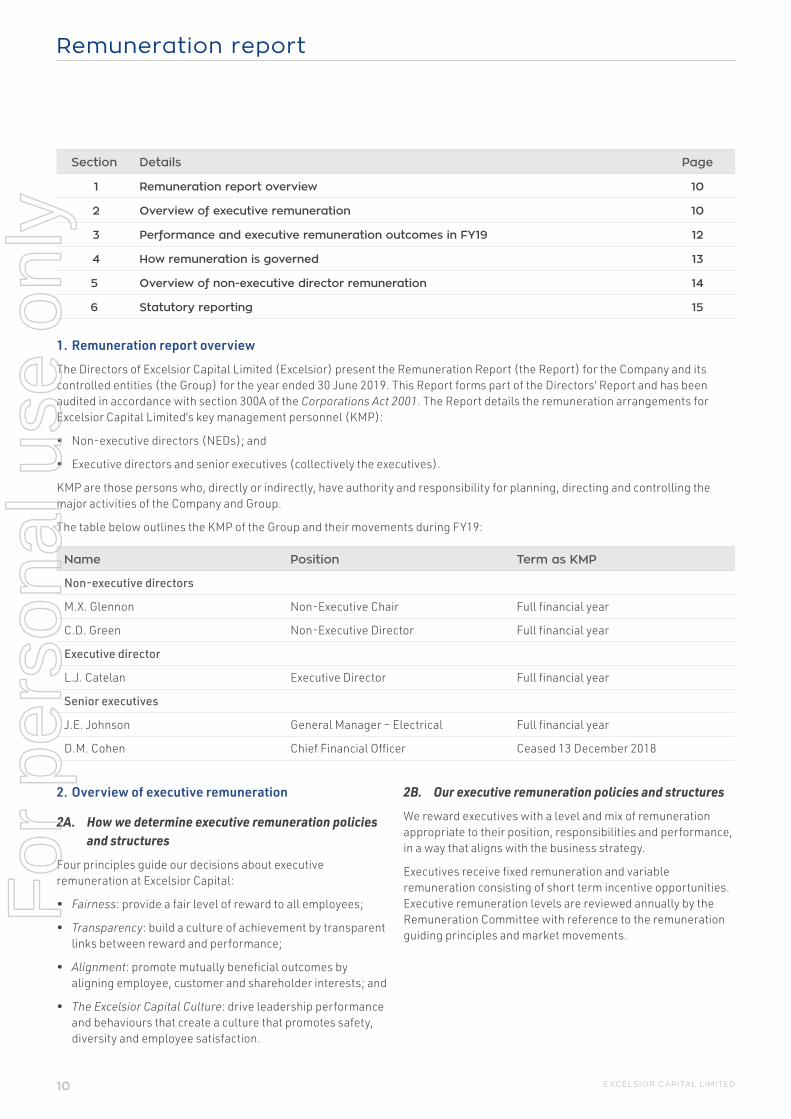
Section Details Page
1 Remuneration report overview 10
2 Overview of executive remuneration 10
3 Performance and executive remuneration outcomes in FY19 12
4 How remuneration is governed 13
5 Overview of non-executive director remuneration 14
6 Statutory reporting 15
1. Remuneration report overview
The Directors of Excelsior Capital Limited (Excelsior) present the Remuneration Report (the Report) for the Company and its controlled entities (the Group) for the year ended 30 June 2019. This Report forms part of the Directors’ Report and has been audited in accordance with section 300A of the Corporations Act 2001. The Report details the remuneration arrangements for Excelsior Capital Limited’s key management personnel (KMP):
• Non-executive directors (NEDs); and
• Executive directors and senior executives (collectively the executives).
KMP are those persons who, directly or indirectly, have authority and responsibility for planning, directing and controlling the major activities of the Company and Group.
The table below outlines the KMP of the Group and their movements during FY19:
Name Position Term as KMP
Non-executive directors
M.X. Glennon Non-Executive Chair Full financial year
C.D. Green Non-Executive Director Full financial year
Executive director
L.J. Catelan Executive Director Full financial year
Senior executives
J.E. Johnson General Manager – Electrical Full financial year
D.M. Cohen Chief Financial Officer Ceased 13 December 2018
2. Overview of executive remuneration
2A. How we determine executive remuneration policies and structures
Four principles guide our decisions about executive remuneration at Excelsior Capital:
• Fairness: provide a fair level of reward to all employees;
• Transparency: build a culture of achievement by transparent links between reward and performance;
• Alignment: promote mutually beneficial outcomes by aligning employee, customer and shareholder interests; and
• The Excelsior Capital Culture: drive leadership performance and behaviours that create a culture that promotes safety, diversity and employee satisfaction.
2B. Our executive remuneration policies and structures
We reward executives with a level and mix of remuneration appropriate to their position, responsibilities and performance, in a way that aligns with the business strategy.
Executives receive fixed remuneration and variable remuneration consisting of short term incentive opportunities. Executive remuneration levels are reviewed annually by the Remuneration Committee with reference to the remuneration guiding principles and market movements.
For
per
sona
l use
onl
y

112019 ANNUAL REPORT
2C. Elements of remuneration
Fixed remuneration
Fixed remuneration consists of base salary, superannuation and other non-monetary benefits and is designed to reward for:
• The scope of the executive’s role;
• The executive’s skills, experience and qualifications; and
• Individual performance.
It is set with reference to comparable roles in similar companies.
Short-term incentive (STI)
Under the STI, the General Manager – Electrical has the opportunity to earn an annual incentive award which is delivered in cash. The STI recognises and rewards annual performance.
How is it paid? 100% of any STI award is paid in cash after the assessment of annual performance.
How much can the executive earn?
A maximum STI opportunity of 20% of fixed remuneration.
Target STI is awarded for achieving the challenging objectives set prior to the beginning of each year.
How is performance measured?
The STI performance measures were chosen as they reflect the core drivers of short-term performance and also provide a framework for delivering sustainable value to the Group, its shareholders and customers.
We measure four key performance indicators (KPIs) covering financial and non-financial, Group and business unit measures of performance. For each KPI, a target and stretch objective is set. A summary of the measures and weightings are set out in the table below:
Financial Non-Financial
Business Unit PBT Growth1
Business unit KPIs
Business unit leader 50% 25% 25%
1. Net revenue and gross margin
Business unit profit before tax (PBT) are the measures against which management and the Board assess the short-term financial performance of the General Manager – Electrical.
The non-financial measures in the STI plan are:
• Safety
• Implementation of key growth and diversification initiatives
• Merger and acquisition opportunities
When is it paid? The STI award is determined after the end of the financial year following a review of performance over the year against the STI performance measures by the Board. The Board approves the final STI award based on this assessment of performance and 100% is paid in cash three months after the end of the performance period.
What happens if the executive leaves?
If an executive resigns or is terminated for cause before the end of the financial year, no STI is awarded for that year.
If an executive ceases employment during the performance period by reason of redundancy, ill health, death, or other circumstances approved by the Board, the executive will be entitled to a pro-rata cash payment based on assessment of performance up to the date of ceasing employment for that year (subject to Board discretion).
What happens if there is a change of control?
In the event of a change of control, a pro-rata cash payment will be made based on assessment of performance up to the date of the change of control.
For
per
sona
l use
onl
y

Remuneration report
12 EXCELSIOR CAPITAL LIMITED
Long-term incentives (LTI)
The LTI is an equity arrangement of either options or performance shares and an allocation is considered each year. The aim of the LTI is both:
• Retention; and
• To align to long term company performance.
No LTI was provided with respect to the full year ended 30 June 2019 (2018: nil).
2E. Changes for FY20
The Board does not anticipate any changes to the STI and LTI Plans for FY20.
Further details will be provided in the FY20 remuneration report.
3. Performance and executive remuneration outcomes in FY19
3A. Actual remuneration earned by executives in FY19
The actual remuneration earned by executives in FY19 is set out in section 6 of this Remuneration report. This provides shareholders with a view of the remuneration actually paid to executives for performance in FY19.
3B. Performance against STI measures
A combination of financial and non-financial measures is used to measure performance for STI awards.
Business unit performance against those measures is as follows for FY19:
Financial Non- Financial
Business Unit PBT Growth Safety Discretionary
Electrical Business
Below threshold hurdle
At target
Between threshold and target
Between target and stretch
3C. Overview of company performance
The table below sets out information about Excelsior Capital’s earnings and movements in shareholder wealth for the past five years up to and including the current financial year.
2019 2018 2017 2016 2015
NPAT ($’000) 4,132 4,245 2,754 3,446 5,450
Share price at year end ($) 1.21 1.36 1.03 0.895 1.60
Basic EPS (cents) 14.21 13.53 8.27 9.90 15.77
Total dividends (cents per share) 6.00 6.00 6.00 6.00 9.00
+
For
per
sona
l use
onl
y

132019 ANNUAL REPORT
4. How remuneration is governed
4A. Remuneration decision making
The following diagram represents the Group’s remuneration decision making framework:
Board
Review and approval
Remuneration Committee
Company-wide remuneration framework and policy
Executive & NED remuneration outcomes
Executive Director
Recommendations on remuneration outcomes for executive team
Management
Implementing remuneration policies
The composition of the Remuneration Committee is set out on page 8. Further information on the Remuneration Committee’s role, responsibilities and membership can be seen at www.cmilimited.com.au
4B. Use of remuneration advisors
The Remuneration Committee may engage external advisers to provide remuneration recommendations regarding the remuneration mix and quantum for executives.
Any remuneration recommendations are provided to the Committee as an input into decision making only. The Remuneration Committee considers the recommendations, along with other factors, in making its remuneration decisions.
There were no fees paid during the year to remuneration advisers (2018: $nil).
4C. Clawback of remuneration
In the event of serious misconduct or a material misstatement in the Group’s financial statements, the Board has the discretion to reduce, cancel or clawback any unvested STI.
4D. Share trading policy
The Group securities trading policy applies to all NEDs and executives. The policy prohibits employees from dealing in Excelsior Capital Limited securities while in possession of material non-public information relevant to the Group.
The Group would consider a breach of this policy as gross misconduct, which may lead to disciplinary action and potentially dismissal.
4E. Executive employment agreements
Remuneration arrangements for executives are formalised in employment agreements. The following outlines the details of contracts with executives:
General Manager – Electrical Business
The General Manager is employed on an individual open ended employment contract which can be terminated with notice by either the Group or the individual.
Under the terms of the present contract:
• Receives fixed remuneration of $300,665 per annum; and
• Maximum STI opportunity is 20% of fixed remuneration.
For
per
sona
l use
onl
y

Remuneration report
14 EXCELSIOR CAPITAL LIMITED
Termination provisions
Resignation Termination
for cause
Termination in case of death,
disablement, redundancy or notice without
cause Termination
payment
GM 3 months None 6 months 3 months
Termination payments
The following arrangements applied to outgoing executives in office during FY19:
D.M. Cohen
Due to redundancy, effective 13 December 2018, Mr Cohen received a termination payment of $19,230, in accordance with the terms of his employment contract.
5. Overview of non-executive director remuneration
Excelsior Capital’s NED fee policy is designed to attract and retain high calibre directors who can discharge the roles and responsibilities required in terms of good governance, strong oversight, independence and objectivity. NEDs receive fees only and do not participate in any performance-related incentive awards. NED fees reflect the demands and responsibilities of the directors.
The Remuneration Committee reviews NED remuneration annually against comparable companies. The Board also considers advice from external advisors when undertaking the review process.
NED fees consist of base fees and committee fees. The chair of the Board attends all committee meetings but does not receive any additional committee fees in addition to base fees.
The table below summarises Board and Committee fees payable to NEDs for FY19 (inclusive of superannuation):
Board fees2019
$2018
$
Chair 1 98,550 -
NED 76,650 76,650
Committee fees
Audit 2 Chair N/A N/A
Member N/A N/A
Remuneration 2 Chair N/A N/A
Member N/A N/A
1. Chairman fees reduced from $158,778 to $98,550 when M.X. Glennon moved from Executive Chairman to Non- Executive Chairman in May 2019.
2. NEDs do not receive additional fees for participation in the Audit or the Remuneration Committee.
NEDs may be reimbursed for expenses reasonably incurred in attending to the Group’s affairs. They do not receive retirement benefits.
The Board has confirmed there will be no increases in Board or committee fees for FY20.
Maximum aggregate NED fee pool
NED fees are determined within an aggregate NED fee pool limit, which is periodically approved by shareholders. The maximum aggregate amount that may be paid to NEDs for their services is $390,000 during any financial year, as approved by shareholders at a general meeting.
The Board will not seek an increase to the aggregate NED fee pool limit at the 2019 AGM.
For
per
sona
l use
onl
y

152019 ANNUAL REPORT
6. Statutory reporting
6A. Executive KMP remuneration for the years ended 30 June 2019 and 30 June 2018
Short-term benefits
Post-employ-
ment
Long-term
benefits
Salary & fees
Short-term incentive Other
Super- annuation
Employeeentitle-ments
Termi-nation
payments
Totalremun-eration
Perform-
ance related
($) ($) ($) ($) ($) ($) ($) (%)
M.X. Glennon1
2019 120,833 - - 11,479 - - 132,313 -
2018 145,003 - - 13,775 - - 158,778 -
L.J. Catelan
2019 70,000 - - 6,650 - - 76,650 -
2018 70,000 - - 6,650 - - 76,650 -
J.E. Johnson
2019 252,767 49,491 25,000 28,210 4,148 - 359,116 14%
2018 247,251 20,625 25,000 25,448 - - 318,324 6%
D.M. Cohen2
2019 118,560 - - 10,726 - 19,230 148,516 -
2018 168,592 - - 16,016 - - 184,608 -
A.M. Sandham3
2019 - - - - - - - -
2018 25,575 - - - - - 25,575 -
S. Ho4
2019 - - - - - - - -
2018 111,623 - - - - - 111,623 -
Total
2019 561,660 49,491 25,000 57,065 4,148 19,230 716,594
2018 768,044 20,625 25,000 61,889 - - 875,558
1. M.X. Glennon moved from Executive Chairman to Non-executive Chairman on 8 April 2019
2. D.M. Cohen ceased employment on 13 December 2018
3. A.M. Sandham ceased as a contractor on 30 October 2017
4. S. Ho ceased as a contractor on 15 November 2017
The following table outlines the proportion of maximum STI earned in relation to the FY19 financial year.
Maximum STI opportunity (% of fixed remuneration)
% of maximum earned
J.E. Johnson 20% 100%
For
per
sona
l use
onl
y
Remuneration report
16 EXCELSIOR CAPITAL LIMITED
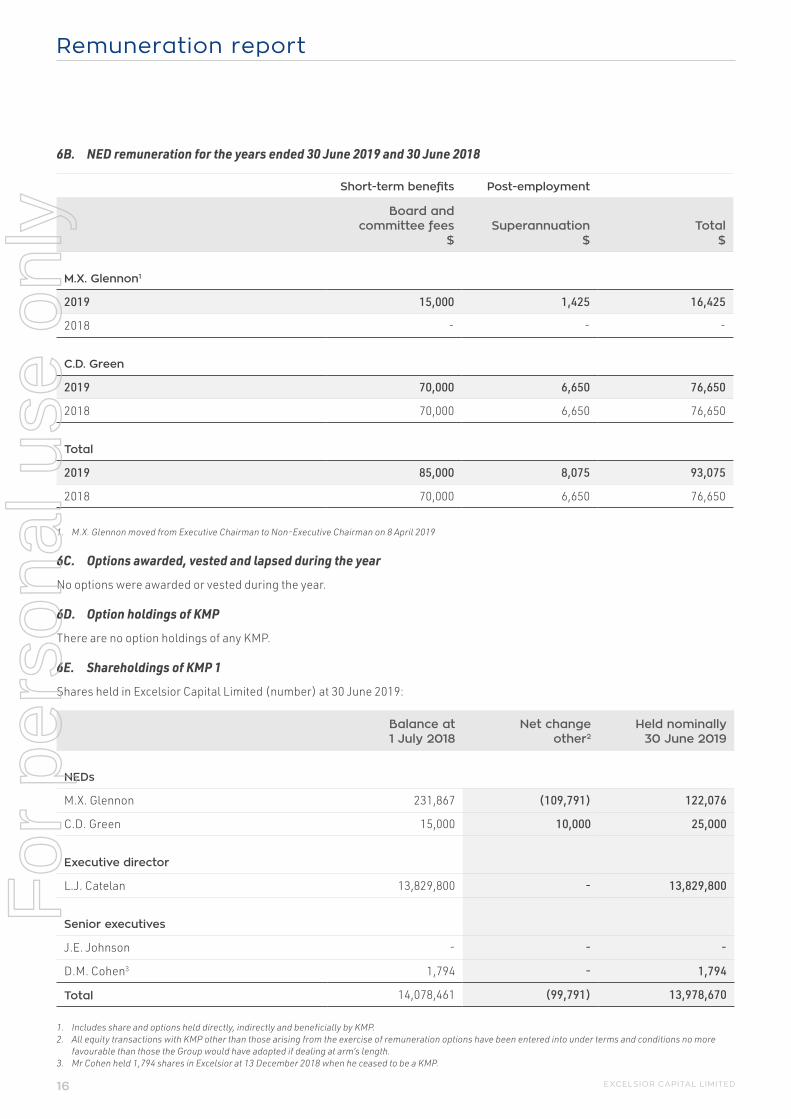
6B. NED remuneration for the years ended 30 June 2019 and 30 June 2018
Short-term benefits Post-employment
Board and committee fees
$Superannuation
$Total
$
M.X. Glennon1
2019 15,000 1,425 16,425
2018 - - -
C.D. Green
2019 70,000 6,650 76,650
2018 70,000 6,650 76,650
Total
2019 85,000 8,075 93,075
2018 70,000 6,650 76,650
1. M.X. Glennon moved from Executive Chairman to Non-Executive Chairman on 8 April 2019
6C. Options awarded, vested and lapsed during the year
No options were awarded or vested during the year.
6D. Option holdings of KMP
There are no option holdings of any KMP.
6E. Shareholdings of KMP 1
Shares held in Excelsior Capital Limited (number) at 30 June 2019:
Balance at 1 July 2018
Net change other2
Held nominally 30 June 2019
NEDs
M.X. Glennon 231,867 (109,791) 122,076
C.D. Green 15,000 10,000 25,000
Executive director
L.J. Catelan 13,829,800 - 13,829,800
Senior executives
J.E. Johnson - - -
D.M. Cohen3 1,794 - 1,794
Total 14,078,461 (99,791) 13,978,670
1. Includes share and options held directly, indirectly and beneficially by KMP.2. All equity transactions with KMP other than those arising from the exercise of remuneration options have been entered into under terms and conditions no more
favourable than those the Group would have adopted if dealing at arm’s length.3. Mr Cohen held 1,794 shares in Excelsior at 13 December 2018 when he ceased to be a KMP.
For
per
sona
l use
onl
y

172019 ANNUAL REPORT
6F. Loans from KMP and their related parties
(i) Details of aggregate of loans from KMP and their related parties:
Name
Balance at beginning of period
$
Interest charged during the year
$
Balance at end of period
$
Highest balance during period
$
M.X Glennon - - 20,000 20,000
(i) Terms and conditions of other transactions with KMP and their related parties:
During the year, a short-term trading cash flow facility of $20,000 was provided from Glennon Capital Pty Ltd, a company controlled by M.X. Glennon to Excelsior Asset Management Pty Ltd, a subsidiary of Excelsior Capital Limited. The loan is repayable on demand. No amount was repaid during the year. Refer to the Terms and conditions in Note 23.1.
6G. Other transactions and balances with KMP and their related parties
(i) Details and terms and conditions of other transactions with KMP and their related parties:
Purchases
During the year, management and performance fees totalling $295,671 (excluding GST) were paid from Excelsior Asset Management Pty Ltd to Glennon Capital Pty Ltd, of which M.X. Glennon is a director and controlling shareholder. $16,667 (excluding GST) was outstanding at 30 June 2019 (2018: $95,313).
During the financial year, Excelsior Capital leased office space from Glennon Capital. During the year, no amount was charged to the company (2018: $66,866).
Signed in accordance with a resolution of the directors
M.X. Glennon Chairman
Sydney 28 August 2019
For
per
sona
l use
onl
y

Consolidated statement of profit or lossFOR THE YEAR ENDED 30 JUNE
18 EXCELSIOR CAPITAL LIMITED
Note2019
$’0002018
$’000
Revenue from contracts with customers 1 59,273 48,471
Changes in inventories of finished goods and costs to fulfil a contract 2,271 261
Raw materials and consumables used (43,549) (32,210)
Gross profit 17,995 16,570
Other income 2 505 719
Employee benefits expense 3 (6,455) (5,644)
Repairs, maintenance and consumables expense (267) (362)
Occupancy expense 3 (2,037) (2,076)
Travel and communication expense (279) (301)
Freight and cartage expense (1,182) (854)
Depreciation and amortisation expense 3 (386) (430)
Finance costs (0) (7)
Investment portfolio management and administration expenses (417) (532)
Other expenses 3 (1,198) (1,299)
Profit before tax 6,279 5,736
Income tax expense 4 (2,147) (1,491)
PROFIT FOR THE PERIOD 4,132 4,245
Attributable to:
• Equity holders of the parent 4,253 4,247
• Non-controlling interests (121) (2)
4,132 4,245
For
per
sona
l use
onl
y

Consolidated statement of comprehensive incomeFOR THE YEAR ENDED 30 JUNE
192019 ANNUAL REPORT
Note2019
$’0002018
$’000
PROFIT FOR THE PERIOD 4,132 4,245
Other comprehensive income
Other comprehensive income that will not be reclassified to profit or loss in subsequent periods (net of tax):
Net (loss)/gain on equity instruments measured at fair value through OCI 15.2 (457) 345
Other comprehensive (loss)/income, net of tax (457) 345
TOTAL COMPREHENSIVE INCOME, NET OF TAX 3,675 4,590
Attributable to:
• Equity holders of the parent 3,796 4,592
• Non-controlling interests (121) (2)
3,675 4,590
Earnings per share (in cents) Basic and diluted earnings per share attributable to ordinary equity holders of the parent 16 $0.14 $0.14
For
per
sona
l use
onl
y

Consolidated statement of financial positionAS AT 30 JUNE
20 EXCELSIOR CAPITAL LIMITED
Note2019
$’0002018
$’000
ASSETS
Current assets
Cash and cash equivalents 5 4,751 6,751
Trade and other receivables 6 13,329 9,810
Current tax receivable 39 -
Inventories 7 15,830 11,514
Other financial assets 18 2,358 12,725
36,307 40,800
Non-current assets
Other financial assets 18 11,297 5,193
Plant and equipment 8 258 299
Goodwill 9,10 6,850 6,850
Intangible assets 9 1,751 1,739
20,156 14,081
TOTAL ASSETS 56,463 54,881
LIABILITIES and EQUITY
Current liabilities
Trade and other payables 11 7,560 4,548
Current tax liabilities 4 - 441
Provisions 12 695 578
8,255 5,567
Non-current liabilities
Provisions 12 76 64
Deferred tax liabilities 4 298 15
374 79
TOTAL LIABILITIES 8,629 5,646
EQUITY
Issued capital 15 28,270 31,687
Retained earnings 19,692 17,248
Reserves (170) 287
Equity attributable to equity holders of the parent 47,792 49,222
Non-controlling interests 15 42 13
TOTAL EQUITY 47,834 49,235
TOTAL LIABILITIES AND EQUITY 56,463 54,881
For
per
sona
l use
onl
y

Consolidated statement of changes in equityFOR THE YEAR ENDED 30 JUNE
212019 ANNUAL REPORT
Issued capital
Retained earnings Reserves
Attribu-table to owners
of the parent
Non-controlling
interests Total
$’000 $’000 $’000 $’000 $’000 $’000
As at 1 July 2017 31,687 14,884 (58) 46,513 15 46,528
Profit for the period - 4,246 - 4,246 (2) 4,244
Other comprehensive income - - 345 345 - 345
Total comprehensive income - 4,246 345 4,591 (2) 4,589
Dividends paid - (1,882) - (1,882) - (1,882)
At 30 June 2018 31,687 17,248 287 49,222 13 49,235
As at 1 July 2018 31,687 17,248 287 49,222 13 49,235
Profit for the period - 4,253 - 4,253 (121) 4,132
Other comprehensive income - - (457) (457) - (457)
Total comprehensive income - 4,253 (457) 3,796 (121) 3,675
Share buy-back (3,417) - - (3,417) - (3,417)
Dividends paid - (1,811) - (1,811) - (1,811)
Issue of convertible note - - - - 150 150
At 30 June 2019 28,270 19,692 (170) 47,790 42 47,834
For
per
sona
l use
onl
y

Consolidated statement of cash flowsFOR THE YEAR ENDED 30 JUNE
22 EXCELSIOR CAPITAL LIMITED
Note2019
$’0002018
$’000
Operating activities
Receipts from customers 56,105 54,349
Payments to suppliers (54,399) (49,672)
Interest received 124 199
Dividends received 403 511
Purchase of debt financial instruments (480) (4,969)
Proceeds from sale of debt financial instruments 10,972 4,907
Income tax paid (2,268) (1,652)
Net cash from operating activities 10,457 3,673
Investing activities
Payment for plant and equipment (35) (23)
Purchase of equity financial instruments (25,425) (3,442)
Proceeds from sale of equity financial instruments 18,385 721
Development expenditures 9 (322) (187)
Net cash used in investing activities (7,399) (2,931)
Financing activities
Payment for share buy-back 15 (3,417) -
Proceeds from issue of convertible note 150 -
Loan from related parties 23 20 -
Dividends paid to equity holders of the parent 14 (1,811) (1,882)
Net cash used in financing activities (5,058) (1,882)
Net decrease in cash and cash equivalents (2,000) (1,140)
Cash and cash equivalents at 1 July 6,751 7,891
Cash and cash equivalents at 30 June 5 4,751 6,751
For
per
sona
l use
onl
y

Notes to the consolidated financial statements | About this report
FOR THE YEAR ENDED 30 JUNE 2019
232019 ANNUAL REPORT
1. Corporate information
The consolidated financial statements of Excelsior Capital Limited and its subsidiaries (collectively, the Group) for the year ended 30 June 2019 were authorised for issue in accordance with a resolution of the directors on 28 August 2019.
Excelsior Capital Limited (the Company or the parent) is a for profit company limited by shares incorporated in Australia whose shares are publicly traded on the Australian Stock Exchange (ASX).
The Group is principally engaged in the design and distribution of electrical components and cables for resource infrastructure applications and the management of an investment portfolio (see segment information note).
The registered office is located at 18-20 Railway Road, Meadowbank, NSW, Australia.
Further information on the nature of the operations and principal activities of the Group is provided in the directors’ report. Information on the Group’s structure is provided in Note 19. Information on other related party relationships of the Group is provided in Note 23.
2. Basis of preparation
The financial report is a general purpose financial report which:
• Has been prepared in accordance with the requirements of the Corporations Act 2001, Australian Accounting Standards and other authoritative pronouncements of the Australian Accounting Standards Board;
• Has been prepared on a historical cost basis, except for debt and equity financial instruments which have been measured at fair value; and
• Is presented in Australian dollars and all values are rounded to the nearest thousand ($000), except when otherwise indicated under the option available to the company under ASIC Corporations (Rounding in Financial/Directors’ Reports) Instrument 2016/191. The Company is an entity to which this legislative instrument applies.
Compliance with International Financial Reporting Standards (IFRS)
The financial report also complies with International Financial Reporting Standards (IFRS) as issued by the International Accounting Standards Board.
3. Significant accounting judgements, estimates and assumptions
The preparation of the Group’s consolidated financial statements requires management to make judgements, estimates and assumptions that affect the reported amounts of revenues, expenses, assets and liabilities, and the accompanying disclosures, and the disclosure of contingent liabilities. Uncertainty about these assumptions and estimates
could result in outcomes that require a material adjustment to the carrying amount of assets or liabilities affected in future periods.
Other disclosures relating to the Group’s exposure to risks and uncertainties includes:
• Financial instruments risk management and policies (Note 18.5)
• Sensitivity analyses disclosures (Note 18.5)
Judgements, estimates and assumptions
In the process of applying the Group’s accounting policies, management has made judgements, estimates and assumptions which have the most significant effect on the amounts recognised in the consolidated financial statements.
Estimates and assumptions
The key assumptions concerning the future and other key sources of estimation uncertainty at the reporting date, that have a significant risk of causing a material adjustment to the carrying amounts of assets and liabilities within the next financial year, are described in the disclosures below.
• Impairment of non-financial assets (Note 10)
• Provision for expected credit losses of trade receivables and contract assets (Note 18)
• Taxes (Note 4)
• Fair value measurement of financial instruments (Note 18.7)
• Development costs (Note 9)
The Group based its assumptions and estimates on parameters available when the consolidated financial statements were prepared. Existing circumstances and assumptions about future developments, however, may change due to market changes or circumstances arising that are beyond the control of the Group. Such changes are reflected in the assumptions when they occur.
Basis of consolidation
The consolidated financial statements comprise the financial statements of the Company and its subsidiaries as at 30 June 2019. Control is achieved when the Group is exposed, or has rights, to variable returns from its involvement with the investee and has the ability to affect those returns through its power over the investee. Specifically, the Group controls an investee if, and only if, the Group has:
• Power over the investee (i.e., existing rights that give it the current ability to direct the relevant activities of the investee);
• Exposure, or rights, to variable returns from its involvement with the investee; and
• The ability to use its power over the investee to affect its returns.
For
per
sona
l use
onl
y

Notes to the consolidated financial statements | About this report
FOR THE YEAR ENDED 30 JUNE 2019
24 EXCELSIOR CAPITAL LIMITED
Generally, there is a presumption that a majority of voting rights results in control. To support this presumption and when the Group has less than a majority of the voting or similar rights of an investee, the Group considers all relevant facts and circumstances in assessing whether it has power over an investee, including:
• The contractual arrangement(s) with the other vote holders of the investee;
• Rights arising from other contractual arrangements; and
• The Group’s voting rights and potential voting rights.
The Group re-assesses whether or not it controls an investee if facts and circumstances indicate that there are changes to one or more of the three elements of control. Consolidation of a subsidiary begins when the Group obtains control over the subsidiary and ceases when the Group loses control of the subsidiary.
Assets, liabilities, income and expenses of a subsidiary acquired or disposed of during the year are included in the consolidated financial statements from the date the Group gains control until the date the Group ceases to control the subsidiary.
Profit or loss and each component of OCI are attributed to the equity holders of the parent of the Group and to the non-controlling interests, even if this results in the non-controlling interests having a deficit balance. When necessary, adjustments are made to the financial statements of subsidiaries to bring their accounting policies in line with the Group’s accounting policies.
All intra-group assets and liabilities, equity, income, expenses and cash flows relating to transactions between members of the Group are eliminated in full on consolidation.
A change in the ownership interest of a subsidiary, without a loss of control, is accounted for as an equity transaction.
If the Group loses control over a subsidiary, it derecognises the related assets (including goodwill), liabilities, non-controlling interest and other components of equity, while any resultant gain or loss is recognised in profit or loss. Any investment retained is recognised at fair value.
Current versus non-current classification
The Group presents assets and liabilities in the statement of financial position based on current/non-current classification. An asset is current when it is:
• Expected to be realised or intended to be sold or consumed in the normal operating cycle;
• Held primarily for the purpose of trading;
• Expected to be realised within twelve months after the reporting period; or
• Cash or cash equivalent unless restricted from being exchanged or used to settle a liability for at least twelve months after the reporting period.
All other assets are classified as non-current.
A liability is current when:
• It is expected to be settled in the normal operating cycle;
• It is held primarily for the purpose of trading;
• It is due to be settled within twelve months after the reporting period; or
• There is no unconditional right to defer the settlement of the liability for at least twelve months after the reporting period.
The Group classifies all other liabilities as non-current.
Deferred tax assets and liabilities are classified as non-current assets and liabilities.
Goods and services tax (GST)
Revenues, expenses and assets are recognised net of the amount of GST except:
• where the GST incurred on a purchase of goods and services is not recoverable from the taxation authority, in which case the GST is recognised as part of the costs of acquisition of the asset or as part of the expense item as applicable; and
• receivables and payables which are stated with the amount of GST included.
The net amount of GST recoverable from, or payable to, the taxation authority is included as part of receivables or payables in the statement of financial position.
Cash flows are included in the statement of cash flows on a gross basis and the GST component of cash flows arising from investing and financing activities, which is recoverable from, or payable to, the taxation authority is classified as operating cash flows.
Commitments and contingencies are disclosed net of the amount of GST recoverable from, or payable to, the taxation authority.
Other accounting policies
Significant and other accounting policies that summarise the measurement basis used are relevant to an understanding of the financial statements and are provided throughout the notes to the financial statements.
For
per
sona
l use
onl
y

252019 ANNUAL REPORT
The notes to the financial statements
The notes include information which is required to understand the financial statements and is material and relevant to the operations, financial position and performance of the Group. Information is considered material and relevant if, for example:
• the amount in question is significant because of its size or nature;
• it is important for understanding the results of the Group;
• it helps to explain the impact of significant changes in the Group’s business – for example, acquisitions and impairment write-downs; or
• it relates to an aspect of the Group’s operations that is important to its future performance.
The notes are organised into the following sections:
Key numbers: provides a breakdown of individual line items in the financial statements that the Directors consider most relevant and summarises the accounting policies, judgements and estimates relevant to understanding these line items;
Capital: provides information about the capital management practices of the Group and shareholder returns for the year;
Risk: discusses the Group’s exposure to various financial risks, explains how these affect the Group’s financial position and performance and what the Group does to manage these risks;
Group structure: explains aspects of the Group structure and how changes have affected the financial position and performance of the Group;
Unrecognised items: provides information about items that are not recognised in the financial statements but could potentially have an impact on the Group’s financial position and performance; and
Other disclosures: provides information on items which require disclosure to comply with Australian Accounting Standards and other regulatory pronouncements however, are not considered critical in understanding the financial performance or position of the Group.
For
per
sona
l use
onl
y

Notes to the consolidated financial statements | Segment information
FOR THE YEAR ENDED 30 JUNE 2019
26 EXCELSIOR CAPITAL LIMITED
For management purposes, the Group is organised into business units based on its products and services and has two reportable segments, as follows:
• The electronics segment, which is a supplier of electronic equipment for defence, aviation, electrical safety markets and consumer electronic equipment for home use. It offers products and services in the areas of electronics, safety, thermal and electrical architecture; and
• The investment portfolio segment, which invests in listed and unlisted equity instruments and quoted debt instruments.
No operating segments have been aggregated to form the above reportable operating segments.
The Group’s reportable segments under AASB 8 are therefore as follows:
Electrical components
Represents the design and distribution of electrical components and cables. The business is divided into two key areas:
1) Electrical cables
This is currently captured under the following primary brands:
• XLPE Cables;
• Hartland Cables; and
• Aflex Cables.
2) Minto Industrial Products
This specialises in couplers and receptacle products in the mining industry.
Investment portfolio
Represents investing in listed and unlisted equity instruments and quoted debt instruments to achieve long term dividend returns and capital appreciation.
Investments are acquired for long term holding for dividends and short term holding for revenue generation.
The Board of Directors is the Chief Operating Decision Maker (CODM) and monitors the operating results of its business units separately for the purpose of making decisions about resource allocation and performance assessment. Segment performance is evaluated based on profit or loss and is measured consistently with profit or loss in the consolidated financial statements.
Transfer prices between operating segments are on an arm’s length basis in a manner similar to transactions with third parties.
For
per
sona
l use
onl
y

272019 ANNUAL REPORT
The following table presents revenue and results information for the Group’s operating segments at 30 June 2019 and 30 June 2018, respectively:
Electrical components
Investment portfolio
Adjustments and eliminations Consolidated
Year ended 30 June:
2019 $’000
2018 $’000
2019 $’000
2018 $’000
2019 $’000
2018 $’000
2019 $’000
2018 $’000
Revenue
External customers 59,273 48,471 - - - - 59,273 48,471
Other income 134 48 332 671 39 - 505 719
Total revenue and other income 59,407 48,519 332 671 39 - 59,778 49,190
Results
Segment profit before tax 7,721 6,975 (1,141) 16 (301) (1,255) 6,279 5,736
The following table presents assets and liabilities information for the Group’s operating segments at 30 June 2019 and 30 June 2018, respectively:
2019 $’000
2018 $’000
2019 $’000
2018 $’000
2019 $’000
2018 $’000
2019 $’000
2018 $’000
Total assets 38,090 30,287 15,983 20,750 2,390 3,844 56,463 54,881
Total liabilities (20,917) (18,987) (76) (92) 12,364 13,433 (8,629) (5,646)
Adjustments and eliminations
Finance costs, certain employee benefits and operating expenses are not allocated to individual segments as these are managed on an overall group basis. These are included in corporate in the segment disclosures.
For
per
sona
l use
onl
y

Notes to the consolidated financial statements | Key numbers
FOR THE YEAR ENDED 30 JUNE 2019
28 EXCELSIOR CAPITAL LIMITED
1. Revenue from contracts with customers
Disaggregated revenue information
Set out below is the disaggregation of the Group’s revenue from contracts with customers:
Segments: Electrical components
2019 $’000
2018 $’000
Type of goods or service
Sale of electrical components and cables 59,273 48,471
Total revenue from contracts with customers 59,273 48,471
Geographical markets
New South Wales 15,763 13,131
Victoria 7,301 6,784
Queensland 20,590 16,912
Western Australia 15,619 11,644
Total revenue from contracts with customers 59,273 48,471
Timing of revenue recognition
Goods transferred at point in time 59,273 48,471
Total revenue from contracts with customers 59,273 48,471
2. Other income
2019 $’000
2018 $’000
Fair value gain/(loss) on hybrid securities at fair value through profit or loss 126 (194)
(Loss)/gain on sale of debt and equity instruments (282) 148
Interest received 124 199
Dividend income from equity instruments 370 518
Sale of scrap (Operations) 134 48
Other 33 -
505 719
Recognition and measurement
Interest receivedInterest received is accrued on a time basis, by reference to the principal outstanding and at the effective interest rate applicable.
Dividends income from equity instrumentsDividend income is recorded when the Group’s right to receive the dividend is established.
(Loss)/gain on sale of debt and equity instruments Net gain/(loss) on financial assets held at fair value through profit and loss are calculated as the difference between the fair value at the end of the reporting period and the fair value at the previous valuation point. Net gains/(losses) do not include interest or dividend / distribution income.
For
per
sona
l use
onl
y

292019 ANNUAL REPORT
3. Expenses
Note 2019
$’0002018
$’000
Employee benefits
Wages and salaries 5,978 5,210
Pension costs 458 406
Termination benefits 19 28
6,455 5,644
Occupancy expense
Minimum lease payments as an operating lease expense 1,582 1,248
Other 455 828
2,037 2,076
Depreciation and amortisation
Depreciation of plant and equipment 8 76 110
Amortisation of intangible assets 9 310 320
386 430
Other
Legal expenses 20 14
Insurances, professional services and IT 917 888
Other administrative expenses 261 397
1,198 1,299
Recognition and measurement
Employee benefits
Employee benefits expenses includes wages and salaries including bonuses, annual and long service leave and associated on-costs as incurred, pensions costs, and termination benefits.
Occupancy expense
Occupancy expenses premises operating leases and other occupancy expenses (e.g.: utilities, cleaning and security which are expensed as incurred.
Other administrative expenses
This mainly comprises:
• bank fees;
• licence fees and permits;
• ASX and share registry expenses; and
• general administration expenses.
These items are expensed when incurred.
For
per
sona
l use
onl
y

Notes to the consolidated financial statements | Key numbers
FOR THE YEAR ENDED 30 JUNE 2019
30 EXCELSIOR CAPITAL LIMITED
4. Income tax
The major components of income tax expense for the years ended 30 June 2019 and 2018 are:
Consolidated profit or loss 2019
$’0002018
$’000
Current income tax:
Current income tax charge 1,861 1,716
Adjustments in respect of current income tax of previous year (19) (114)
Franking credit from investments (173) (182)
Deferred tax:
Relating to origination and reversal of temporary differences 478 71
Income tax expense reported in the statement of profit or loss 2,147 1,491
Consolidated statement of other comprehensive income
Deferred tax related to items recognised in OCI during the year (196) -
(196) -
Reconciliation of tax expense and the accounting profit multiplied by Australia’s domestic tax rate for 2019 and 2018:
Accounting profit before tax 6,279 5,736
At Australia’s statutory income tax rate of 30% (2018: 30%) 1,884 1,721
Adjustments in respect of current income tax of previous years (19) (114)
Other items 282 (116)
Income tax expense reported in the statement of profit or loss 2,147 1,491
For
per
sona
l use
onl
y

312019 ANNUAL REPORT
4. Income tax (continuation)
Deferred tax
Deferred tax relates to the following:
Opening balance
Current year recognised
in profit or loss
Charged to OCI
Closing balance
2019 $’000 $’000 $’000 $’000
DTA in relation to:
Receivables (13) 3 - (10)
Plant and equipment 44 21 - 65
Provisions 435 (71) - 364
Accrued expenses 6 (8) - (2)
Other 108 (36) - 73
580 (90) - 490
DTL in relation to:
Unrealised gains (101) (385) 196 (290)
Intangible assets (494) (4) - (498)
(595) (389) 196 (788)
Net deferred tax balances (liabilities) (15) (479) 196 (298)
Opening balance
Current year recognised in profit or
lossCharged to
OCIClosing
balance
2018 $’000 $’000 $’000 $’000
DTA in relation to:
Receivables 4 (17) - (13)
Inventories 228 (228) - -
Plant and equipment 67 (23) - 44
Provisions 193 242 - 435
Accrued expenses 69 (63) - 6
Other 112 (4) - 108
673 (93) - 580
DTL in relation to:
Unrealised gains - 22 (123) (101)
Intangible assets (494) - - (494)
(494) 22 (123) (595)
Net deferred tax balances (liabilities) 179 (71) (123) (15)
For
per
sona
l use
onl
y

Notes to the consolidated financial statements | Key numbers
FOR THE YEAR ENDED 30 JUNE 2019
32 EXCELSIOR CAPITAL LIMITED
4. Income tax (continuation)
Reflected in the statement of financial position as follows:
2019 $’000
2018 $’000
Deferred tax assets 490 580
Deferred tax liabilities (788) (595)
Deferred tax liabilities (net) (298) (15)
Recognition and measurement
Current income tax
Current income tax assets and liabilities are measured at the amount expected to be recovered from or paid to the taxation authorities. The tax rates and tax laws used to compute the amount are those that are enacted or substantively enacted at the reporting date in the countries where the Group operates and generates taxable income.
Current income tax relating to items recognised directly in equity is recognised in equity and not in the statement of profit or loss. Management periodically evaluates positions taken in the tax returns with respect to situations in which applicable tax regulations are subject to interpretation and establishes provisions where appropriate.
Deferred tax
Deferred tax is provided using the liability method on temporary differences between the tax bases of assets and liabilities and their carrying amounts for financial reporting purposes at the reporting date.
Deferred tax liabilities are recognised for all taxable temporary differences, except:
• When the deferred tax liability arises from the initial recognition of goodwill or an asset or liability in a transaction that is not a business combination and, at the time of the transaction, affects neither the accounting profit nor taxable profit or loss; and
• In respect of taxable temporary differences associated with investments in subsidiaries, associates and interests in joint arrangements, when the timing of the reversal of the temporary differences can be controlled and it is probable that the temporary differences will not reverse in the foreseeable future.
Deferred tax assets are recognised for all deductible temporary differences, the carry forward of unused tax credits and any unused tax losses to the extent that it is probable that taxable profit will be available against which the deductible temporary differences, and the carry forward of unused tax credits and unused tax losses can be utilised, except:
• When the deferred tax asset relating to the deductible temporary difference arises from the initial recognition of an asset or liability in a transaction that is not a business combination and, at the time of the transaction, affects neither the accounting profit nor taxable profit or loss; and
• In respect of deductible temporary differences associated with investments in subsidiaries, associates and interests in joint arrangements, deferred tax assets are recognised only to the extent that it is probable that the temporary differences will reverse in the foreseeable future and taxable profit will be available against which the temporary differences can be utilised
The carrying amount of deferred tax assets is reviewed at each reporting date and reduced to the extent that it is no longer probable that sufficient taxable profit will be available to allow all or part of the deferred tax asset to be utilised. Unrecognised deferred tax assets are re-assessed at each reporting date and are recognised to the extent that it has become probable that future taxable profits will allow the deferred tax asset to be recovered.
Deferred tax assets and liabilities are measured at the tax rates that are expected to apply in the year when the asset is realised or the liability is settled, based on tax rates (and tax laws) that have been enacted or substantively enacted at the reporting date.
Deferred tax relating to items recognised outside profit or loss is recognised outside profit or loss. Deferred tax items are recognised in correlation to the underlying transaction either in OCI or directly in equity.
Tax benefits acquired as part of a business combination, but not satisfying the criteria for separate recognition at that date, are recognised subsequently if new information about facts and circumstances change.
The adjustment is either treated as a reduction in goodwill (as long as it does not exceed goodwill) if it reflects new information obtained about facts and circumstances that exist at the acquisition date that, if known, would have affected the amount recognised at that date where recognised during the measurement period.
For
per
sona
l use
onl
y

332019 ANNUAL REPORT
The Group offsets deferred tax assets and deferred tax liabilities if and only if it has a legally enforceable right to set off current tax assets and current tax liabilities and the deferred tax assets and deferred tax liabilities relate to income taxes levied by the same taxation authority on either the same taxable entity or different taxable entities which intend either to settle current tax liabilities and assets on a net basis, or to realise the assets and settle the liabilities simultaneously, in each future period in which significant amounts of deferred tax liabilities or assets are expected to be settled or recovered.
Tax consolidation
(i) Members of the tax consolidated group and the tax sharing arrangement
Excelsior Capital Limited Limited and its 100% owned Australian resident subsidiaries formed a tax consolidated group with effect from 1 July 2002. Excelsior Capital Limited Limited is the head entity of the tax consolidated group. Members of the tax consolidated group have entered into a tax sharing agreement that provides for the allocation of income tax liabilities between the entities should the head entity default on its tax payment obligations. No amounts have been recognised in the financial statements in respect of this agreement on the basis that the possibility of default is remote.
(ii) Tax effect accounting by members of the tax consolidated group
Measurement method adopted under AASB Interpretation 1052 Tax Consolidation Accounting
The head entity and the controlled entities in the tax consolidated group continue to account for their own current and deferred tax amounts. The Group has applied the group allocation approach in determining the appropriate amount of current taxes and deferred taxes to allocate to members of the tax consolidated group. The current and deferred tax amounts are measured in a systematic manner that is consistent with the broad principles in AASB 112 Income Taxes. The nature of the tax funding agreement is discussed further below.
In addition to its own current and deferred tax amounts, the head entity also recognises current tax liabilities (or assets) and the deferred tax assets arising from unused tax losses and unused tax credits assumed from controlled entities in the tax consolidated group.
Nature of the tax funding agreement
Members of the tax consolidated group have entered into a tax funding agreement. Under the funding agreement, the funding of tax within the Group is based on accounting profit. The tax funding agreement requires payments to/from the head entity to be recognised via an inter-entity receivable (payable) which is at call. To the extent that there is a difference between the amount charged under the tax funding agreement and the allocation under AASB Interpretation 1052, the head entity accounts for these as equity transactions with the subsidiaries.
Key estimates and assumptions
Deferred tax assets are recognised for unused tax losses to the extent that it is probable that taxable profit will be available against which the losses can be utilised. Significant management judgement is required to determine the amount of deferred tax assets that can be recognised, based upon the likely timing and the level of future taxable profits, together with future tax planning strategies.
The Group has $32.4 million (2018: $32.4 million) of tax losses carried forward. These losses relate to subsidiaries that have a history of losses, do not expire, and may not be used to offset taxable income elsewhere in the Group. The subsidiaries neither have any taxable temporary difference nor any tax planning opportunities available that could partly support the recognition of these losses as deferred tax assets. On this basis, the Group has determined that it cannot recognise deferred tax assets on the tax losses carried forward.
For
per
sona
l use
onl
y

Notes to the consolidated financial statements | Key numbers
FOR THE YEAR ENDED 30 JUNE 2019
34 EXCELSIOR CAPITAL LIMITED
5. Cash and cash equivalents
For the purpose of the statement of cash flows, cash and cash equivalents comprise the following at 30 June:
Note 2019
$’0002018
$’000
Cash at bank and on hand 2,534 3,965
Investment trading account 2,217 2,786
4,751 6,751
Cash at banks earn interest at floating rates based on daily bank deposit rates.
At 30 June 2019, the Group had available $3,562,000 (FY18: $3,562,000) of undrawn committed borrowing facilities.
Cash flow reconciliation
Reconciliation of profit after tax to net cash flows from operations
Profit after tax 4,132 4,244
Adjustments to reconcile profit after tax to net cash flows
Depreciation of plant and equipment 3 76 110
Amortisation of intangible assets 3 310 320
Gain on disposal of property, plant and equipment - 1
(Increase)/decrease in current financial assets 10,367 132
(Increase)/decrease in deferred tax liability 286 99
Increase/(decrease) in current tax liability (18) (260)
Movement in provisions 129 -
Working capital adjustments:
(Increase)/decrease in trade and other receivables and prepayments (3,520) 755
(Increase)/decrease in inventories (4,316) (973)
Increase/(decrease) in trade and other payables 3,011 (755)
Net cash flows from operating activities 10,457 3,673
For
per
sona
l use
onl
y

352019 ANNUAL REPORT
6. Trade receivables
2019 $’000
2018 $’000
Current
Trade receivables 13,213 9,666
Allowance for expected credit losses (21) (24)
13,192 9,642
Prepayments 137 168
13,329 9,810
Recognition and measurement
A receivable represents the Group’s right to an amount of consideration that is unconditional (i.e., only the passage of time is required before payment of the consideration is due). Refer to accounting policies of financial assets in Note 18 Financial instruments – initial recognition and subsequent measurement.
Terms and conditions relating to the above
As at 30 June 2019, the Group has trade receivables of $13,191,790 (2018: $9,642,000) which is net of an allowance for expected credit losses of $20,727 (2018: $24,000).
Set out below is the movement in the allowance for expected credit losses of trade receivables:
2019 $’000
2018 $’000
As at 1 July 24 24
Provision(recovery) for expected credit losses - 24
Utilisation of provision (3) (24)
As at 30 June 21 24
The significant changes in the balances of trade receivables are disclosed in Note 18.1 while the information about the credit exposures are disclosed in Note 18.5.
Past due but not impaired
There was a past due balance greater than 90 days at 30 June 2019, however this has been assessed as not being impaired. This balance is expected to be fully recoverable ($89,171).
For
per
sona
l use
onl
y

Notes to the consolidated financial statements | Key numbers
FOR THE YEAR ENDED 30 JUNE 2019
36 EXCELSIOR CAPITAL LIMITED
7. Inventories
2019 $’000
2018 $’000
Raw materials 1,609 1,277
Work in progress 290 197
Finished goods 13,931 10,040
Total inventories at the lower of cost and net realisable value 15,830 11,514
Recognition and measurement
Inventories are valued at the lower of cost and net realisable value.
Costs incurred in bringing each product to its present location and condition are accounted for, as follows:
• Raw materials: purchase cost on a first-in/first-out basis; and
• Finished goods and work in progress: cost of direct materials and labour and a proportion of manufacturing overheads based on the normal operating capacity, but excluding borrowing costs.
Net realisable value is the estimated selling price in the ordinary course of business, less estimated costs of completion and the estimated costs necessary to make the sale.
There was no write down of net realisable value during the year.
For
per
sona
l use
onl
y

372019 ANNUAL REPORT
8. Plant and equipment
$’000
Cost or valuation
At 1 July 2017 2,865
Additions 47
Disposals (61)
At 30 June 2018 2,851
Additions 35
At 30 June 2019 2,886
Depreciation and impairment
At 1 July 2017 2,499
Depreciation charge for the year 109
Disposals (56)
At 30 June 2018 2,552
Depreciation charge for the year 76
At 30 June 2019 2,628
Net book value
At 30 June 2019 258
At 30 June 2018 299
Recognition and measurement
Plant and equipment is stated at cost, net of accumulated depreciation and accumulated impairment losses, if any.
Depreciation is calculated on a straight-line basis over the estimated useful lives of the assets, as follows:
Plant and machinery 3-20 years
An item of plant and equipment and any significant part initially recognised is derecognised upon disposal (i.e., at the date the recipient obtains control) or when no future economic benefits are expected from its use or disposal. Any gain or loss arising on derecognition of the asset (calculated as the difference between the net disposal proceeds and the carrying amount of the asset) is included in the statement of profit or loss when the asset is derecognised.
The residual values, useful lives and methods of depreciation of plant and equipment are reviewed at each financial year end and adjusted prospectively, if appropriate.
For
per
sona
l use
onl
y
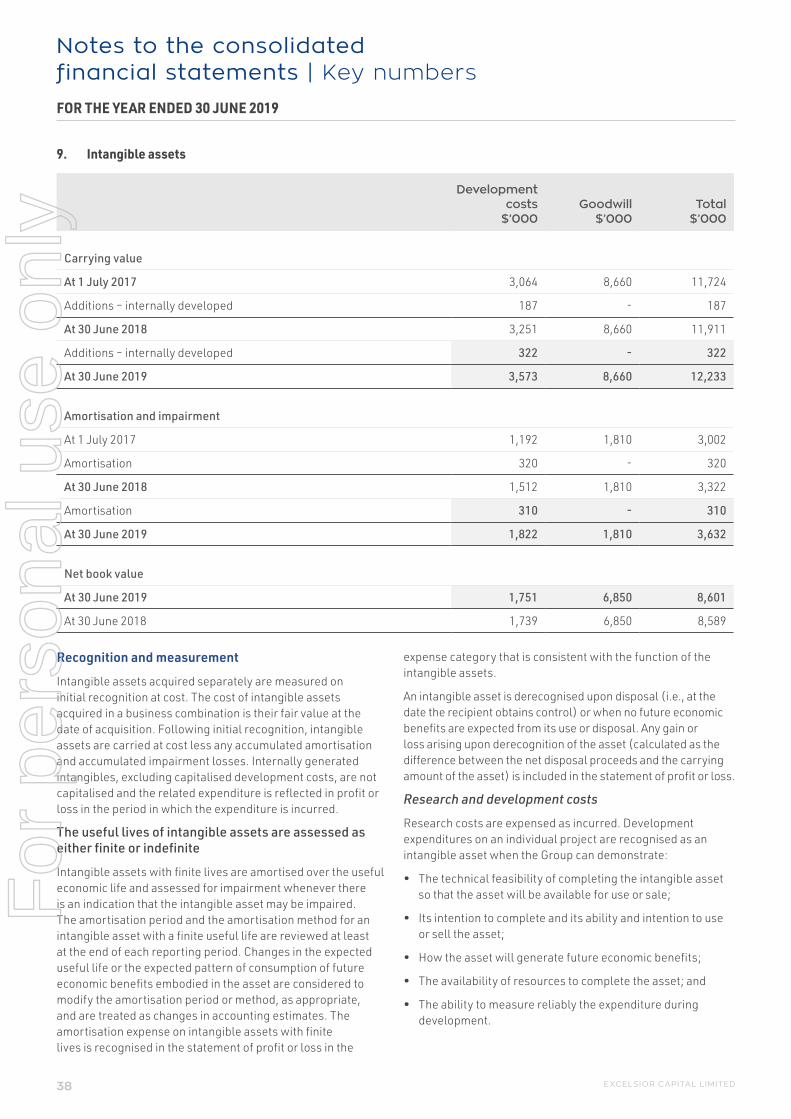
Notes to the consolidated financial statements | Key numbers
FOR THE YEAR ENDED 30 JUNE 2019
38 EXCELSIOR CAPITAL LIMITED
9. Intangible assets
Development costs
$’000Goodwill
$’000Total
$’000
Carrying value
At 1 July 2017 3,064 8,660 11,724
Additions – internally developed 187 - 187
At 30 June 2018 3,251 8,660 11,911
Additions – internally developed 322 - 322
At 30 June 2019 3,573 8,660 12,233
Amortisation and impairment
At 1 July 2017 1,192 1,810 3,002
Amortisation 320 - 320
At 30 June 2018 1,512 1,810 3,322
Amortisation 310 - 310
At 30 June 2019 1,822 1,810 3,632
Net book value
At 30 June 2019 1,751 6,850 8,601
At 30 June 2018 1,739 6,850 8,589
Recognition and measurement
Intangible assets acquired separately are measured on initial recognition at cost. The cost of intangible assets acquired in a business combination is their fair value at the date of acquisition. Following initial recognition, intangible assets are carried at cost less any accumulated amortisation and accumulated impairment losses. Internally generated intangibles, excluding capitalised development costs, are not capitalised and the related expenditure is reflected in profit or loss in the period in which the expenditure is incurred.
The useful lives of intangible assets are assessed as either finite or indefinite
Intangible assets with finite lives are amortised over the useful economic life and assessed for impairment whenever there is an indication that the intangible asset may be impaired. The amortisation period and the amortisation method for an intangible asset with a finite useful life are reviewed at least at the end of each reporting period. Changes in the expected useful life or the expected pattern of consumption of future economic benefits embodied in the asset are considered to modify the amortisation period or method, as appropriate, and are treated as changes in accounting estimates. The amortisation expense on intangible assets with finite lives is recognised in the statement of profit or loss in the
expense category that is consistent with the function of the intangible assets.
An intangible asset is derecognised upon disposal (i.e., at the date the recipient obtains control) or when no future economic benefits are expected from its use or disposal. Any gain or loss arising upon derecognition of the asset (calculated as the difference between the net disposal proceeds and the carrying amount of the asset) is included in the statement of profit or loss.
Research and development costs
Research costs are expensed as incurred. Development expenditures on an individual project are recognised as an intangible asset when the Group can demonstrate:
• The technical feasibility of completing the intangible asset so that the asset will be available for use or sale;
• Its intention to complete and its ability and intention to use or sell the asset;
• How the asset will generate future economic benefits;
• The availability of resources to complete the asset; and
• The ability to measure reliably the expenditure during development.
For
per
sona
l use
onl
y

392019 ANNUAL REPORT
Following initial recognition of the development expenditure as an asset, the asset is carried at cost less any accumulated amortisation and accumulated impairment losses. Amortisation of the asset begins when development is complete and the asset is available for use. It is amortised over the period of expected future benefit. During the period of development, the asset is tested for impairment annually.
There are two design and development projects:
• Cable coupling devices; and
• Components for mining
Key estimates and assumptions –
Development costs
The Group capitalises costs for product development projects. Initial capitalisation of costs is based on management’s judgement that technological and economic feasibility is confirmed, usually when a product development project has reached a defined milestone according to an established project management model.
At 30 June 2019, the carrying amount of capitalised development costs was $1,751,580 (2018: $1,739,189).
The remaining amortisation period is:
Within one year – $290,862
After one year but not more than five years – $1,172,729
Under development not completed – $287,989
For
per
sona
l use
onl
y

Notes to the consolidated financial statements | Key numbers
FOR THE YEAR ENDED 30 JUNE 2019
40 EXCELSIOR CAPITAL LIMITED
10. Goodwill
For impairment testing, goodwill acquired through business combinations are allocated to the electronics components CGU, which is also an operating and reportable segment.
Carrying amount of goodwill allocated to the CGU:
Electrical components
2019 $’000
2018 $’000
Goodwill 6,850 6,850
The Group performed its annual impairment test in June 2019. The Group considers the relationship between its market capitalisation and its book value, among other factors, when reviewing for indicators of impairment.
As at 30 June 2019, the market capitalisation of the Group was below the book value of its equity, indicating a potential impairment of goodwill and impairment of the assets of the operating segment.
Electrical components CGU
The recoverable amount of the electrical components CGU, as at 30 June 2019, has been determined based on a value in use calculation using cash flow projections from financial budgets approved by senior management covering a five-year period.
The pre-tax discount rate applied to cash flow projections is 15.9% (2018: 17.9%) and cash flows beyond the five-year period are extrapolated using a 2.5% growth rate (2018: 2.5%) that is the same as the long-term average growth rate for the electrical components industry.
It was concluded that the book value of the CGU did not exceed the value in use. As a result of this analysis, management determined that there is no impairment charge in the current year against goodwill with a carrying amount of $6,850,000 as at 30 June 2019.
Key assumptions used in value in use calculations and sensitivity to changes in assumptions
The calculation of value in use for the electrical components unit is most sensitive to the following assumptions:
• Discount rates; and
• Growth rate estimates used to extrapolate cash flows beyond the forecast period.
Discount rates – Discount rates represent the current market assessment of the risks specific to the CGU, taking into consideration the time value of money and individual risks of the underlying assets that have not been incorporated in the cash flow estimates. The discount rate calculation is based on the specific circumstances of the Group and its operating segment and is derived from the cost of equity. The cost of equity is derived from the expected return on investment by the Group’s investors.
The cost of debt is nil as the Group has no debt.
Adjustments to the discount rate are made to factor in the specific amount and timing of the future tax flows in order to reflect a pre-tax discount rate.
A rise in the pre-tax discount rate to 26.7% (i.e. +10.8%) in the electrical components unit would result in nil headroom from impairment.
Growth rate estimates – Rates are based on published industry research. These have been updated for the current economic outlook.
Management recognises that the speed of technological change and the possibility of new entrants can have a significant impact on growth rate assumptions. The effect of new entrants is not expected to have an adverse impact on the forecasts, but could yield a reasonably possible alternative to the estimated long-term growth rate of 2.5% for the electrical components unit.
A reduction by 18.6% in the long-term growth rate in the electrical components unit from +2.5% to -16.1% would result in nil headroom from impairment.
Key estimates and assumptions – Impairment of non-financial assetsImpairment exists when the carrying value of an asset or cash generating unit exceeds its recoverable amount, which is the higher of its fair value less costs of disposal and its value in use. The fair value less costs of disposal calculation is based on available data from binding sales transactions, conducted at arm’s length, for similar assets or observable market prices less incremental costs of disposing of the asset. The value in use calculation is based on a DCF model.
The cash flows are derived from the budget for the next five years and do not include restructuring activities that the Group is not yet committed to or significant future investments that will enhance the performance of the assets of the CGU being tested.
The recoverable amount is sensitive to the discount rate used for the DCF model as well as the expected future cash-inflows and the growth rate used for extrapolation purposes. These estimates are most relevant to goodwill recognised by the Group. The key assumptions used to determine the recoverable amount for the different CGUs, including a sensitivity analysis, are disclosed and explained above.
For
per
sona
l use
onl
y

412019 ANNUAL REPORT
11. Trade and other payables
Note 2019
$’0002018
$’000
Trade payables 4,877 2,530
Creditors and accruals 2,663 2,017
Related parties 23 20 -
18 7,560 4,548
Current 7,560 4,548
Recognition and measurement
Trade and other payables and other accounts payable are recognised when the Group becomes obliged to make future payments resulting from the purchase of goods and services.
Terms and conditions of the above financial liabilities:
• Trade payables are non-interest bearing and are normally settled on 30-60 day terms;
• For terms and conditions with related parties, refer to Note 23; and
• For explanations on the Group’s liquidity risk management processes, refer to Note 18.5.
For
per
sona
l use
onl
y

Notes to the consolidated financial statements | Key numbers
FOR THE YEAR ENDED 30 JUNE 2019
42 EXCELSIOR CAPITAL LIMITED
12. Provisions
Annual and long service
leave$’000
At 1 July 2018 641
Arising during the year 396
Utilised (266)
At 30 June 2019 771
Current 695
Non-current 76
At 1 July 2017 602
Arising during the year 342
Utilised (302)
At 30 June 2018 642
Current 578
Non-current 64
Recognition and measurement
General
Provisions are recognised when the Group has a present obligation (legal or constructive) as a result of a past event, it is probable that an outflow of resources embodying economic benefits will be required to settle the obligation and a reliable estimate can be made of the amount of the obligation. When the Group expects some or all of a provision to be reimbursed, for example, under an insurance contract, the reimbursement is recognised as a separate asset, but only when the reimbursement is virtually certain. The expense relating to a provision is presented in the statement of profit or loss net of any reimbursement.
If the effect of the time value of money is material, provisions are discounted using a current pre-tax rate that reflects, when appropriate, the risks specific to the liability. When discounting is used, the increase in the provision due to the passage of time is recognised as a finance cost.
Long service leave and annual leave
The Group recognises a liability for long service leave and annual leave measured as the present value of expected future payments to be made in respect of services provided by employees up to the reporting date using the projected unit credit method.
Consideration is given to expected future wage and salary levels, experience of employee departures, and periods of service.
Expected future payments are discounted using market yields at the reporting date on high quality corporate bonds with terms to maturity and currencies that match, as closely as possible, the estimated future cash outflows.F
or p
erso
nal u
se o
nly
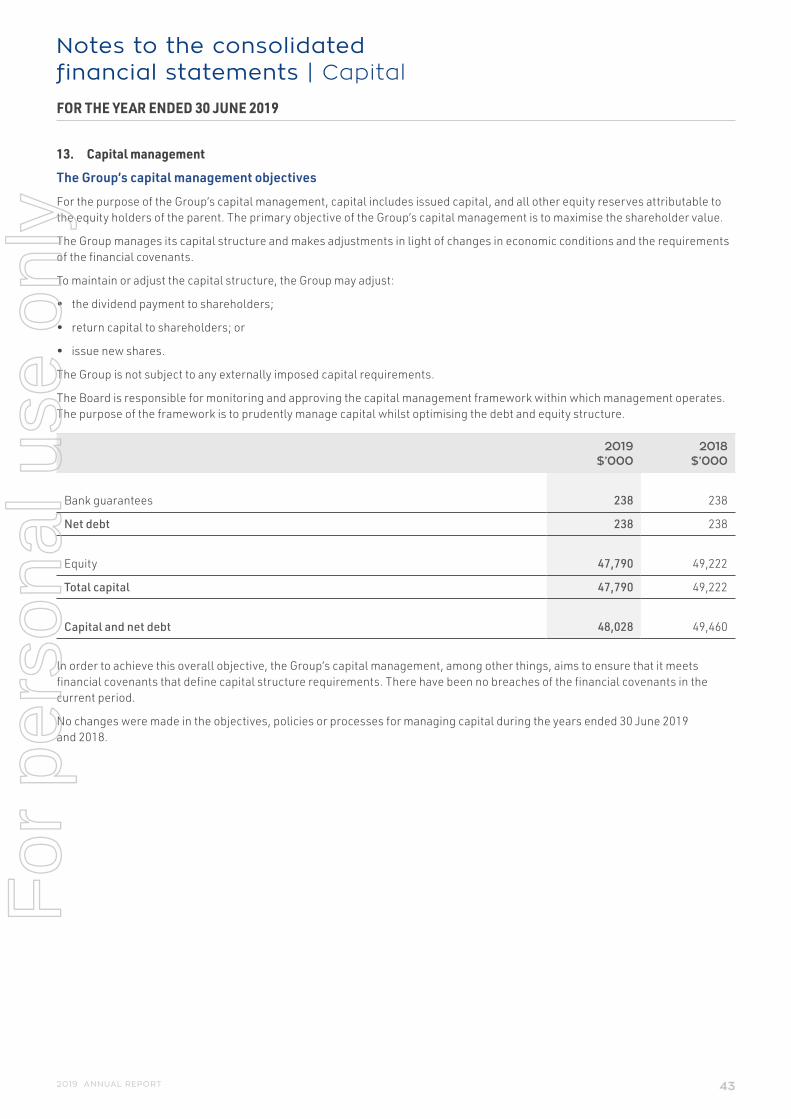
Notes to the consolidated financial statements | Capital
FOR THE YEAR ENDED 30 JUNE 2019
432019 ANNUAL REPORT
13. Capital management
The Group’s capital management objectives
For the purpose of the Group’s capital management, capital includes issued capital, and all other equity reserves attributable to the equity holders of the parent. The primary objective of the Group’s capital management is to maximise the shareholder value.
The Group manages its capital structure and makes adjustments in light of changes in economic conditions and the requirements of the financial covenants.
To maintain or adjust the capital structure, the Group may adjust:
• the dividend payment to shareholders;
• return capital to shareholders; or
• issue new shares.
The Group is not subject to any externally imposed capital requirements.
The Board is responsible for monitoring and approving the capital management framework within which management operates. The purpose of the framework is to prudently manage capital whilst optimising the debt and equity structure.
2019 $’000
2018 $’000
Bank guarantees 238 238
Net debt 238 238
Equity 47,790 49,222
Total capital 47,790 49,222
Capital and net debt 48,028 49,460
In order to achieve this overall objective, the Group’s capital management, among other things, aims to ensure that it meets financial covenants that define capital structure requirements. There have been no breaches of the financial covenants in the current period.
No changes were made in the objectives, policies or processes for managing capital during the years ended 30 June 2019 and 2018.
For
per
sona
l use
onl
y

Notes to the consolidated financial statements | Capital
FOR THE YEAR ENDED 30 JUNE 2019
44 EXCELSIOR CAPITAL LIMITED
14. Dividends
2019 $’000
2018 $’000
Cash dividends on ordinary shares declared and paid:
Final dividend for 2018: 3.0 cents per share (2017: 3.0 cents per share) 941 941
Interim dividend for 2019: 3.0 cents per share (2018: 3.0 cents per share) 870 941
1,811 1,882
Proposed dividends on ordinary shares
Final cash dividend for 2019: 3.0 cents per share (2018: 3.0 cents per share) 870 941
Franking credit balance
The amount of franking credits available for the subsequent financial year are:
• Franking account balance as at the end of the financial year at 30% (2018: 30%) 24,430 23,255
• Franking debits that will arise from the payment of dividends as at the end of the financial year 373 403
15. Issued capital, reserves and non-controlling interest
15.1 Issued shares
2019 2018
Thousands
Ordinary shares 28,994 31,367
28,994 31,367
Thousands $’000
At 1 July 2018 and 30 June 2018 31,367 31,687
Share buy-back on 23 November 2018 (2,373) (3,417)
At 30 June 2019 28,994 28,270
During the year, the issued capital was decreased by $3,416,679 by the off-market buy back of 2,372,902 shares.
For
per
sona
l use
onl
y
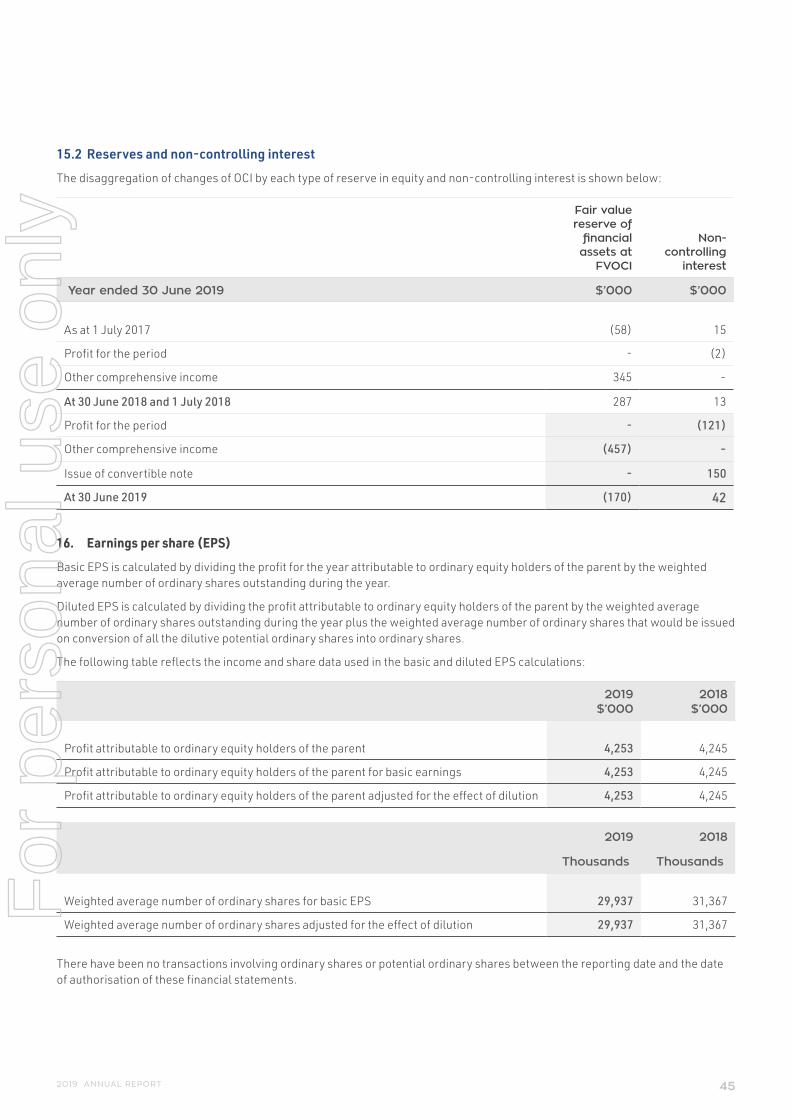
452019 ANNUAL REPORT
15.2 Reserves and non-controlling interest
The disaggregation of changes of OCI by each type of reserve in equity and non-controlling interest is shown below:
Fair value reserve of
financial assets at
FVOCI
Non-controlling
interest
Year ended 30 June 2019 $’000 $’000
As at 1 July 2017
(58)
15
Profit for the period - (2)
Other comprehensive income 345 -
At 30 June 2018 and 1 July 2018 287 13
Profit for the period - (121)
Other comprehensive income (457) -
Issue of convertible note - 150
At 30 June 2019 (170) 42
16. Earnings per share (EPS)
Basic EPS is calculated by dividing the profit for the year attributable to ordinary equity holders of the parent by the weighted average number of ordinary shares outstanding during the year.
Diluted EPS is calculated by dividing the profit attributable to ordinary equity holders of the parent by the weighted average number of ordinary shares outstanding during the year plus the weighted average number of ordinary shares that would be issued on conversion of all the dilutive potential ordinary shares into ordinary shares.
The following table reflects the income and share data used in the basic and diluted EPS calculations:
2019$’000
2018$’000
Profit attributable to ordinary equity holders of the parent 4,253 4,245
Profit attributable to ordinary equity holders of the parent for basic earnings 4,253 4,245
Profit attributable to ordinary equity holders of the parent adjusted for the effect of dilution 4,253 4,245
2019 2018
Thousands Thousands
Weighted average number of ordinary shares for basic EPS 29,937 31,367
Weighted average number of ordinary shares adjusted for the effect of dilution 29,937 31,367
There have been no transactions involving ordinary shares or potential ordinary shares between the reporting date and the date of authorisation of these financial statements.
For
per
sona
l use
onl
y

Notes to the consolidated financial statements | Risk
FOR THE YEAR ENDED 30 JUNE 2019
46 EXCELSIOR CAPITAL LIMITED
17. Fair value measurement
The following table provides the fair value measurement hierarchy of the Group’s assets and liabilities.
17.1 Fair value measurement hierarchy for assets as at 30 June 2019:
Fair value measurement using
Date of
valuation Total
Quoted prices in active markets(Level 1)
Significant observable
inputs(Level 2)
Significant unobservable
inputs(Level 3)
$’000 $’000 $’000 $’000
Assets measured at fair value
Quoted equity shares (Note 18) 30 June 2019 10,597 10,439 158 -
Unquoted equity shares (Note 18) 30 June 2019 700 - - 700
Quoted hybrid securities (Note 18) 30 June 2019 2,358 1,878 480 -
There was a transfer of the following from Level 1 to Level 2 during the year:
• Axsess Today Limited entered voluntary administration in April 2019. A sale process is currently taking place which would involve recapitalisation of the business. Management have assessed that the investment is fully recoverable ($480,000); and
• GO2 People Limited was suspended from trading on the 10 April 2019 pending the release of announcement regarding an acquisition and a capital raising. It is expected the company will recommence trading on the ASX on the 14 August 2019 ($158,147).
There were no transfers between Level 1 and 2 to or from Level 3 during 2019.
17.2 Fair value measurement hierarchy for assets as at 30 June 2018:
Fair value measurement using
Date of
valuation Total
Quote prices in active markets(Level 1)
Significant observable
inputs(Level 2)
Significant unobservable
inputs(Level 3)
$’000 $’000 $’000 $’000
Assets measured at fair value
Quoted equity shares (Note 18) 30 June 2018 4,449 4,449 - -
Unquoted equity shares (Note 18) 30 June 2018 744 - - 744
Quoted hybrid securities (Note 18) 30 June 2018 12,725 12,725 - -
There were no transfers between Level 1, 2 or 3 during 2018.For
per
sona
l use
onl
y

472019 ANNUAL REPORT
17.3 Fair value measurement hierarchy for liabilities as at 30 June 2019 and 30 June 2018
There is no liabilities in the Group that are subject to fair value measurement for 30 June 2019 and 2018.
17.4 Fair value measurement
The Group measures financial instruments such as investments, at fair value at each balance sheet date.
Fair value is the price that would be received to sell an asset or paid to transfer a liability in an orderly transaction between market participants at the measurement date. The fair value measurement is based on the presumption that the transaction to sell the asset or transfer the liability takes place either:
• In the principal market for the asset or liability; or
• In the absence of a principal market, in the most advantageous market for the asset or liability.
The principal or the most advantageous market must be accessible by the Group.
The fair value of an asset or a liability is measured using the assumptions that market participants would use when pricing the asset or liability, assuming that market participants act in their economic best interest.
A fair value measurement of a non-financial asset takes into account a market participant’s ability to generate economic benefits by using the asset in its highest and best use or by selling it to another market participant that would use the asset in its highest and best use.
The Group uses valuation techniques that are appropriate in the circumstances and for which sufficient data are available to measure fair value, maximising the use of relevant observable inputs and minimising the use of unobservable inputs.
All assets and liabilities for which fair value is measured or disclosed in the financial statements are categorised within the fair value hierarchy, described as follows, based on the lowest level input that is significant to the fair value measurement as a whole:
• Level 1 – Quoted (unadjusted) market prices in active markets for identical assets or liabilities;
• Level 2 – Valuation techniques for which the lowest level input that is significant to the fair value measurement is directly or indirectly observable; and
• Level 3 – Valuation techniques for which the lowest level input that is significant to the fair value measurement is unobservable.
For assets and liabilities that are recognised in the financial statements at fair value on a recurring basis, the Group determines whether transfers have occurred between levels in the hierarchy by re-assessing categorisation (based on the lowest level input that is significant to the fair value measurement as a whole) at the end of each reporting period.
The Board determines the policies and procedures for both recurring fair value measurement, such as unquoted financial assets.
At each reporting date, the Board analyses the movements in the values of assets and liabilities which are required to be remeasured or re-assessed as per the Group’s accounting policies. For this analysis, the Board verifies the major inputs applied in the latest valuation by agreeing the information in the valuation computation to contracts and other relevant documents.
The Board also compares the change in the fair value of each asset and liability with relevant external sources to determine whether the change is reasonable.
The Manager of the Group’s investment portfolio presents the valuation results to the Audit Committee and the Group’s independent auditors. This includes a discussion of the major assumptions used in the valuations.
For the purpose of fair value disclosures, the Group has determined classes of assets and liabilities on the basis of the nature, characteristics and risks of the asset or liability and the level of the fair value hierarchy, as explained above.
For
per
sona
l use
onl
y

Notes to the consolidated financial statements | Risk
FOR THE YEAR ENDED 30 JUNE 2019
48 EXCELSIOR CAPITAL LIMITED
18 Financial assets and financial liabilities
18.1 Financial assets
Note2019
$’0002018
$’000
Financial assets at fair value through profit or loss
Quoted hybrid securities 17 2,358 12,725
Financial assets at fair value through OCI
Quoted equity shares 17 10,597 4,449
Unquoted equity shares 17 700 744
Financial assets at amortised cost
Cash and cash equivalents 5 4,751 6,751
Trade receivables 6 13,329 9,810
Total financial assets 31,735 34,479
Total current
20,438
29,286
Total non-current 11,297 5,193
Recognition and measurement
Initial recognition and measurement
Financial assets are classified, at initial recognition, as subsequently measured at amortised cost, fair value through other comprehensive income (OCI), or fair value through profit or loss.
The classification of financial assets at initial recognition depends on the financial asset’s contractual cash flow characteristics and the Group’s business model for managing them. With the exception of trade receivables that do not contain a significant financing component or for which the Group has applied the practical expedient, the Group initially measures a financial asset at its fair value plus, in the case of a financial asset not at fair value through profit or loss, transaction costs. Trade receivables that do not contain a significant financing component or for which the Group has applied the practical expedient are measured at the transaction price determined under AASB 15.
In order for a financial asset to be classified and measured at amortised cost or fair value through OCI, it needs to give rise to cash flows that are ‘solely payments of principal and interest (SPPI)’ on the principal amount outstanding. This assessment is referred to as the SPPI test and is performed at an instrument level.
The Group’s business model for managing financial assets refers to how it manages its financial assets in order to generate cash flows. The business model determines whether cash flows will result from collecting contractual cash flows, selling the financial assets, or both.
Purchases or sales of financial assets that require delivery of assets within a time frame established by regulation or convention in the market place (regular way trades) are recognised on the trade date, i.e., the date that the Group commits to purchase or sell the asset.
Subsequent measurement
For purposes of subsequent measurement, financial assets are classified in three categories:
• Financial assets at fair value through OCI with no recycling of cumulative gains and losses upon derecognition (equity instruments);
• Financial assets at fair value through profit or loss (quoted hybrid securities); and
• Trade receivables at amortised cost.
For
per
sona
l use
onl
y
492019 ANNUAL REPORT
Financial assets measured at fair value through OCI (equity instruments)
Upon initial recognition, the Group can elect to classify irrevocably its equity investments at fair value through OCI when they meet the definition of equity under AASB 132 Financial Instruments: Presentation and are not held for trading. The classification is determined on an instrument-by-instrument basis.
Gains and losses on these financial assets are never recycled to profit or loss.
Dividends are recognised as other income in the statement of profit or loss when the right of payment has been established.
Equity instruments designated at fair value through OCI are not subject to impairment assessment.
The Group elected to classify irrevocably its quoted and unquoted equity investments under this category as the Group considers these investments to be strategic in nature.
Financial assets at fair value through profit or loss (quoted hybrid securities)
Financial assets at fair value through profit or loss include financial assets held for trading, financial assets designated upon initial recognition at fair value through profit or loss, or financial assets mandatorily required to be measured at fair value.
Financial assets are classified as held for trading if they are acquired for the purpose of selling or repurchasing in the near term.
Financial assets with cash flows that are not solely payments of principal and interest are classified and measured at fair value through profit or loss, irrespective of the business model. Notwithstanding the criteria for debt instruments to be classified at amortised cost or at fair value through OCI, as described above, debt instruments may be designated at fair value through profit or loss on initial recognition if doing so eliminates, or significantly reduces, an accounting mismatch.
Financial assets at fair value through profit or loss are carried in the statement of financial position at fair value with net changes in fair value recognised in the statement of profit or loss.
This category includes quoted hybrid debt securities which the Group had irrevocably elected to classify at fair value through profit or loss.
Interest received on quoted hybrid securities is accrued on a time basis, by reference to the principal outstanding and at the effective interest rate applicable.
Fair values of the quoted hybrid securities are determined by reference to published price quotations in an active market.
Derecognition
A financial asset (or, where applicable, a part of a financial asset or part of a group of similar financial assets) is primarily derecognised (i.e., removed from the Group’s consolidated statement of financial position) when:
• The rights to receive cash flows from the asset have expired; or
• The Group has transferred its rights to receive cash flows from the asset or has assumed an obligation to pay the received cash flows in full without material delay to a third party under a ‘pass-through’ arrangement; and either (a) the Group has transferred substantially all the risks and rewards of the asset, or (b) the Group has neither transferred nor retained substantially all the risks and rewards of the asset, but has transferred control of the asset.
When the Group has transferred its rights to receive cash flows from an asset or has entered into a pass-through arrangement, it evaluates if, and to what extent, it has retained the risks and rewards of ownership. When it has neither transferred nor retained substantially all of the risks and rewards of the asset, nor transferred control of the asset, the Group continues to recognise the transferred asset to the extent of its continuing involvement. In that case, the Group also recognises an associated liability. The transferred asset and the associated liability are measured on a basis that reflects the rights and obligations that the Group has retained.
Impairment of financial assets
Further disclosures relating to impairment of financial assets are also provided in the following notes:
• Trade receivables (Note 6)
Trade receivables
For trade receivables, the Group applies a simplified approach in calculating ECLs. Therefore, the Group does not track changes in credit risk, but instead recognises a loss allowance based on lifetime ECLs at each reporting date. This was based on the Group’s historical credit loss experience, adjusted for forward-looking factors specific to the debtors.
The Group considers a financial asset in default when contractual payments are 90 days past due. However, in certain cases, the Group may also consider a financial asset to be in default when internal or external information indicates that the Group is unlikely to receive the outstanding contractual amounts in full before taking into account any credit enhancements held by the Group. A financial asset is written off when there is no reasonable expectation of recovering the contractual cash flows.
For
per
sona
l use
onl
y

Notes to the consolidated financial statements | Risk
FOR THE YEAR ENDED 30 JUNE 2019
50 EXCELSIOR CAPITAL LIMITED
18.2 Financial liabilities
Note2019
$’0002018
$’000
Financial liabilities at amortised cost
Trade and other payables 11 7,560 4,548
Total financial liabilities 7,560 4,548
Total current 7,560 4,548
Recognition and measurement
Initial recognition and measurement
The Group’s financial liabilities include trade and other payables only. These are classified, at initial recognition as payables, net of directly attributable transaction costs as appropriate.
Derecognition
A financial liability is derecognised when the obligation under the liability is discharged or cancelled or expires. When an existing financial liability is replaced by another from the same lender on substantially different terms, or the terms of an existing liability are substantially modified, such an exchange or modification is treated as the derecognition of the original liability and the recognition of a new liability. The difference in the respective carrying amounts is recognised in the statement of profit or loss.
Offsetting of financial instruments
Financial assets and financial liabilities are offset and the net amount is reported in the consolidated statement of financial position if there is a currently enforceable legal right to offset the recognised amounts and there is an intention to settle on a net basis or to realise the assets and settle the liabilities simultaneously.
18.3 Fair values
Set out below is a comparison, by class, of the carrying amounts and fair values of the Group’s financial instruments:
2019 2018
Carrying amount $’000
Fair value $’000
Carrying amount $’000
Fair value $’000
Financial assets
Unquoted equity shares 700 700 744 744
Quoted equity shares 10,597 10,597 4,449 4,449
Quoted hybrid securities 2,358 2,358 12,725 12,725
13,655 13,655 17,918 17,918For
per
sona
l use
onl
y

512019 ANNUAL REPORT
18.4 Fair values measurements and valuation processes
Management assessed that the fair values of:
• cash deposits;
• trade receivables; and
• trade payables
approximate their carrying amounts largely due to the short-term maturities of these instruments.
The following methods and assumptions were used to estimate the fair values:
• The fair values of the quoted hybrid securities are based on price quotations at the reporting date.
• In addition to being sensitive to a change in the forecast cash flows or the discount rate, the fair value of the unquoted equity instruments is also sensitive to a reasonably possible change in the growth rates. The valuation requires management to use unobservable inputs in the model. Management regularly assesses a range of reasonably possible alternatives for those significant unobservable inputs and determines their impact on the total fair value.
• There is an active market for the Group’s quoted equity shares and quoted hybrid securities.
18.5 Financial instruments risk management objectives and policies
The Group’s principal financial liabilities, comprise trade and other payables only. The Group’s principal financial assets include trade receivables, and cash that derive directly from its operations. The Group also holds investments in hybrid debt and equity instruments.
The Group is exposed to:
• market risk,
• credit risk; and
• liquidity risk.
The Board of Directors oversees the management of these risks. The Board of Directors advises on financial risks and the appropriate financial risk governance framework for the Group. The Board of Directors reviews and agrees policies for managing each of these risks, which are summarised below.
Market risk
Market risk is the risk that the fair value or future cash flows of a financial instrument will fluctuate because of changes in market prices. Market risk comprises three types of risk:
• interest rate risk;
• currency risk; and
• other price risk, such as equity price risk.
Financial instruments affected by market risk include deposits and debt and equity investments.
Interest rate risk
Interest rate risk is the risk that the fair value or future cash flows of a financial instrument will fluctuate because of changes in market interest rates. The Group’s exposure to the risk of changes in market interest rates relates primarily to the Group’s cash.
Foreign currency risk
Foreign currency risk is the risk that the fair value or future cash flows of an exposure will fluctuate because of changes in foreign exchange rates. The Group’s exposure to the risk of changes in foreign exchange rates relates primarily to the Group’s operating activities (when revenue or expense is denominated in a foreign currency).
The Group does not have a defined policy on foreign currency derivatives, however the Board assesses the risk of individual transactions as they arise for the requirement to use currency derivative instruments.
Equity price risk
The Group’s listed and non-listed equity investments are susceptible to market price risk arising from uncertainties about future values of the investment securities. The Group manages the equity price risk through diversification and by placing limits on individual and total equity instruments. Reports on the equity portfolio are submitted to the Group’s Board of Directors on a regular basis. The Group’s Board of Directors reviews and approves all equity and hybrid investment decisions.
At the reporting date, the exposure to non-listed equity investments at fair value was $700,000 (2018: $744,000).
At the reporting date, the exposure to equity and hybrid investments at fair value listed on the ASX was $12,955,114 (2018: $17,173,897). Given that the changes in fair values of the equity investments held are strongly positively correlated with changes of the ASX market index, the Group has determined that an increase/(decrease) of 10% on the ASX market index could have an impact of approximately $906,858 (2018: $388,653) increase/(decrease) on the income and equity attributable to the Group.
For
per
sona
l use
onl
y

Notes to the consolidated financial statements | Risk
FOR THE YEAR ENDED 30 JUNE 2019
52 EXCELSIOR CAPITAL LIMITED
Credit risk
Credit risk is the risk that a counterparty will not meet its obligations under a financial instrument or customer contract, leading to a financial loss. The Group is exposed to credit risk from its operating activities (primarily trade receivables) and from its financing activities, including deposits with banks and financial institutions, foreign exchange transactions and other financial instruments.
Trade receivables
Customer credit risk is managed by each business unit subject to the Group’s established policy, procedures and control relating to customer credit risk management. Credit quality of a customer is assessed based on an extensive credit rating scorecard and individual credit limits are defined in accordance with this assessment. Outstanding customer receivables and contract assets are regularly monitored and any shipments to major customers are generally covered by letters of credit.
At 30 June 2019, the Group had 28 customers (2018: 20) that owed the Group more than $100,000 each and accounted for approximately 75% (2018: 71%) of all the receivables outstanding. There were 8 customers (2018: 5 customers) with balances greater than $500,000 accounting for just over 42% (2018: 36%) of the total amounts of trade receivables.
An impairment analysis is performed at each reporting date using a provision matrix to measure expected credit losses. The provision rates are based on days past due for groupings of various customer segments with similar loss patterns (i.e., by geographical region, product type, customer type and rating, and coverage by letters of credit or other forms of credit insurance). The calculation reflects the probability-weighted outcome, the time value of money and reasonable and supportable information that is available at the reporting date about past events, current conditions and forecasts of future economic conditions. Generally, trade receivables are written-off if past due for more than one year and are not subject to enforcement activity. The maximum exposure to credit risk at the reporting date is the carrying value of each class of financial assets disclosed in Note 6. The Group does not hold collateral as security. The letters of credit are considered integral part of trade receivables and considered in the calculation of impairment.
The Group evaluates the concentration of risk with respect to trade receivables as low, as its customers are located in several jurisdictions and industries and operate in largely independent markets.
Set out below is the information about the credit risk exposure on the Group’s trade receivables using a provision matrix:
Days past due
Current <30 days 30-60 days 61-90 days Total
$’000 $’000 $’000 $’000 $’000
30 June 2019
Expected credit loss rate 0.10% 0.15% 0.20% 5%
Estimated total gross carrying amount at default 6,043 5,794 1,280 96 13,213
Expected credit loss 6 9 2 4 21
30 June 2018
Expected credit loss rate 0.10% 0.20% 0.25% 9%
Estimated total gross carrying amount at default 4,756 3,453 1,358 99 9,666
Expected credit loss 5 7 3 9 24For
per
sona
l use
onl
y

532019 ANNUAL REPORT
Financial instruments
The Group invests only in quoted hybrid securities with very low credit risk. The Group’s debt instruments at fair value through profit or loss comprised solely of quoted hybrid securities that are graded in the top investment category (Very Good and Good) credit rating agencies and, therefore, are considered to be low credit risk investments.
Liquidity risk
The Group monitors its risk of a shortage of funds using a liquidity planning tool.
The Group’s objective is to maintain a balance between continuity of funding and flexibility through the use of a bank guarantee and finance lease facility. The Group has access to a sufficient variety of sources of funding within 12 months can be rolled over with existing lenders.
The table below summarises the maturity profile of the Group’s financial liabilities based on contractual undiscounted payments:
Financial liabilities
On demand
$’000
< 3 months
$’000
3-12 months
$’000 1-5 years
$’000 >5 years
$’000Total
$’000
2019
Non-derivatives
Trade and other payables 7,560 - - - - 7,560
7,560 - - - - 7,560
2018
Non-derivatives
Trade and other payables 4,548 - - - - 4,548
4,548 - - - - 4,548
Financing facilities
2019$’000
2018$’000
Finance lease facility which may be extended by mutual agreement annually
• Amount unused 2,000 2,000
2,000 2,000
Bank guarantee facility which may be extended by mutual agreement annually
• Amount used 238 238
• Amount unused 1,562 1,562
1,800 1,800For
per
sona
l use
onl
y
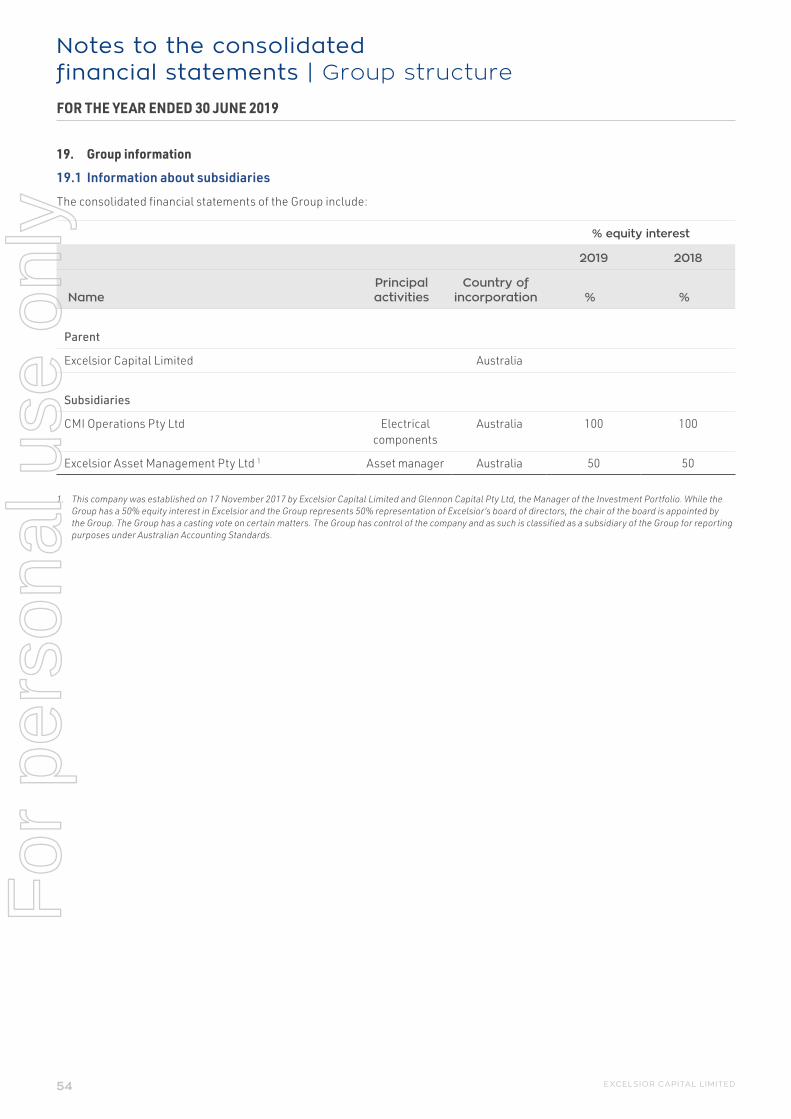
Notes to the consolidated financial statements | Group structure
FOR THE YEAR ENDED 30 JUNE 2019
54 EXCELSIOR CAPITAL LIMITED
19. Group information
19.1 Information about subsidiaries
The consolidated financial statements of the Group include:
% equity interest
2019 2018
Name Principal activities
Country ofincorporation % %
Parent
Excelsior Capital Limited Australia
Subsidiaries
CMI Operations Pty Ltd Electrical components
Australia 100 100
Excelsior Asset Management Pty Ltd 1 Asset manager Australia 50 50
1. This company was established on 17 November 2017 by Excelsior Capital Limited and Glennon Capital Pty Ltd, the Manager of the Investment Portfolio. While the Group has a 50% equity interest in Excelsior and the Group represents 50% representation of Excelsior’s board of directors, the chair of the board is appointed by the Group. The Group has a casting vote on certain matters. The Group has control of the company and as such is classified as a subsidiary of the Group for reporting purposes under Australian Accounting Standards.
For
per
sona
l use
onl
y

Notes to the consolidated financial statements | Unrecognised items
FOR THE YEAR ENDED 30 JUNE 2019
552019 ANNUAL REPORT
20. Commitments and contingencies
Operating lease commitments – Group as lessee
The Group has entered into operating leases on certain items of property and machinery, with lease terms between one and five years.
Future minimum rentals payable under non-cancellable operating leases as at 30 June 2019 are, as follows:
2019 $’000
2018 $’000
Within one year 1,636 1,451
After one year but not more than five years 2,022 1,074
3,658 2,525
Recognition and measurement
Group as a lessee
A lease is classified at the inception date as a finance lease or an operating lease. A lease that transfers substantially all the risks and rewards incidental to ownership to the Group is classified as a finance lease.
Finance leases are capitalised at the commencement of the lease at the inception date fair value of the leased property or, if lower, at the present value of the minimum lease payments. Lease payments are apportioned between finance charges and reduction of the lease liability so as to achieve a constant rate of interest on the remaining balance of the liability. Finance charges are recognised in finance costs in the statement of profit or loss.
A leased asset is depreciated over the useful life of the asset. However, if there is no reasonable certainty that the Group will obtain ownership by the end of the lease term, the asset is depreciated over the shorter of the estimated useful life of the asset and the lease term.
An operating lease is a lease other than a finance lease. Operating lease payments are recognised as an operating expense in the statement of profit or loss on a straight-line basis over the lease term.
20.1 Commitments
At 30 June 2019, the Group had no commitments (2018: Nil).
20.2 Guarantees
The Group has provided the following guarantee at 30 June 2019:
• Leases over several of its premises of $238,000 (2018: $238,000)
20.3 Contingent liabilities
The Company has issued the following guarantees in relation to the debts of its subsidiaries:
• Pursuant to ASIC Corporations (Wholly-owned Companies) Instrument 2016/785, Excelsior Capital Limited has entered
into a deed of cross guarantee. The effect of the deed is that Excelsior Capital Limited has guaranteed to pay any deficiency in the event of winding up of any controlled entity or if they do not meet their obligations under the terms of overdrafts, loans, leases or other liabilities subject to the guarantee.
• The controlled entities have also given a similar guarantee in the event that Excelsior Capital Limited is wound up or if it does not meet its obligations under the terms of overdrafts, loans, leases or other liabilities subject to the guarantee.
Guarantees on lease of premises
The company has a contingent liability whereby arising as a result of guarantees made directly to lease of premises. The amount disclosed represents the aggregate amount of such guarantees. The extent to which an outflow of funds will be required is dependent on the satisfaction of the obligations under the terms of the leases.
Disposal of TJM products division
The Group sold the TJM business in March 2015.
The Group has given certain warranties and indemnities to the purchaser of TJM that are contained and specified in the Share Sale Agreement. These indemnities relate to potential and yet unknown liabilities that could be attributable to CMI before the business was sold to the purchaser. These are standard terms and conditions in the market sale of a business with various expiry dates up to 5 years from completion with the expiry date in March 2020.
There have been no claims to date.
21. Events after the reporting period
21.1 Final dividend declared
On 28 August 2019, the directors of Excelsior Capital Limited declared a final dividend on ordinary shares in respect of the 2019 financial year. The total amount of the dividend is $869,834 which represents a fully franked dividend of 3.0 cents per share. The dividend has not been provided for in the 30 June 2019 financial statements.
For
per
sona
l use
onl
y

Notes to the consolidated financial statements | Other disclosures
FOR THE YEAR ENDED 30 JUNE 2019
56 EXCELSIOR CAPITAL LIMITED
22. Auditor’s remuneration
The auditor of Excelsior Capital Limited is Ernst & Young Australia.
Amounts received or due and receivable by Ernst & Young Australia for:2019
$2018
$
An audit or review of the financial report of the entity and any other entity in the consolidated group 200,200 166,650
Other services in relation to the entity and any other entity in the consolidated group:
• Tax compliance 15,952 20,000
• Tax consulting 56,537 116,403
• Other 738 20,542
73,227 156,945
Total paid to auditors 273,427 323,595
23. Related party disclosures
Note 19 provides information about the Group’s structure, including details of the subsidiaries and the holding company. The following table provides the total amount of transactions that have been entered into with related parties for the relevant financial year.
Sales to related parties
Purchases from related
parties
Amounts owed to related parties
$ $ $
Key management personnel of the Group:
Other directors’ interests 2019 - 295,671 36,666
2018 - 205,919 95,313
23.1 Terms and conditions of transactions with related parties
The sales to and purchases from related parties are made on terms equivalent to those that prevail in arm’s length transactions. Outstanding balances at the year-end are unsecured and interest free and settlement occurs in cash. There have been no guarantees provided or received for any related party receivables or payables. For the year ended 30 June 2019, the Group has not recognised any provision for expected credit losses relating to amounts owed by related parties (2018: $Nil).
23.2 Other directors’ interests
Purchases
During the year, management and performance fees totalling $295,671 (excluding GST) were paid from Excelsior Asset Management Pty Ltd to Glennon Capital Pty Ltd, of which M.X. Glennon is a director and controlling shareholder. $16,667 (excluding GST) was outstanding at 30 June 2019.
For
per
sona
l use
onl
y

572019 ANNUAL REPORT
Amounts owed to related parties
During the year, a short-term trading cash flow facility of $20,000 was provided from Glennon Capital Pty Ltd, a company controlled by M.X. Glennon to Excelsior Asset Management Pty Ltd, a subsidiary of Excelsior Capital Limited. The loan is repayable on demand. No amount was repaid during the year.
23.3 Compensation of key management personnel of the Group
2019 $
2018 $
Short-term employee benefits 721,151 890,319
Post-employment benefits 69,288 61,889
Termination benefits 19,230 -
Total compensation paid to key management personnel 809,669 952,208
Reconciliation to Remuneration report
Executives 716,594 875,558
NED’s 93,075 76,650
Total compensation paid to key management personnel 809,669 952,208
The amounts disclosed in the table are the amounts recognised as an expense during the reporting period related to key management personnel.
24. Information relating to Excelsior Capital Limited (the Parent)
The table represents the legal parent entity, which is Excelsior Capital Limited.
2019 $’000
2018 $’000
Current assets 19,626 32,896
Total assets 31,117 38,138
Current liabilities 182 1,496
Total liabilities 587 673
Issued capital 28,270 31,687
Retained earnings 2,627 5,490
Reserves (367) 287
30,530 37,464
Loss after tax (1,053) (566)
Total comprehensive income (457) 345
Refer to Note 20 for guarantees that the Parent has issued in relation to the debts of its subsidiaries.
For
per
sona
l use
onl
y
Notes to the consolidated financial statements | Other disclosures
FOR THE YEAR ENDED 30 JUNE 2019
58 EXCELSIOR CAPITAL LIMITED
25. Changes in accounting policies and disclosures
25.1 New and amended standards and interpretations
The Group applied AASB 15 and AASB 9 from 1 July 2018. The nature and effect of the changes as a result of adoption of these new accounting standards are described below.
Several other amendments and interpretations apply for the first time in 2019, but do not have an impact on the consolidated financial statements of the Group. The Group has not early adopted any standards, interpretations or amendments that have been issued but are not yet effective.
AASB 15 Revenue from Contracts with Customers
AASB 15 supersedes AASB 111 Construction Contracts, AASB 118 Revenue and related Interpretations and it applies, with limited exceptions, to all revenue arising from contracts with its customers. AASB 15 establishes a five-step model to account for revenue arising from contracts with customers and requires that revenue be recognised at an amount that reflects the consideration to which an entity expects to be entitled in exchange for transferring goods or services to a customer.
AASB 15 requires entities to exercise judgement, taking into consideration all of the relevant facts and circumstances when applying each step of the model to contracts with their customers. The standard also specifies the accounting for the incremental costs of obtaining a contract and the costs directly related to fulfilling a contract. In addition, the standard requires extensive disclosures.
The Group adopted AASB 15 using the modified retrospective method of adoption. There was no impact on transition to AASB 15.
The Group is in the business of:
• designing and distribution of electrical components and cables for resource infrastructure applications; and
• management of an investment portfolio.
The electrical components are sold both on their own or in separately identified contracts with customers.
(a) Sale of goods
The Group’s contracts with customers for the sale of electrical components generally include one performance obligation.
The Group has concluded that revenue from sale of equipment will continue to be recognised at the point in time when control of the asset is transferred to the customer, on delivery of the components.
Therefore, the adoption of AASB 15 did not have an impact on the timing of revenue recognition or the amount of revenue to be recognised.
Under AASB 15, any earned but unbilled amount is recognised as a contract asset rather than a trade receivable.
(b) Investment income
The investment portfolio generates income in the forms of interest, dividends; and gains on financial instruments which are outside the scope of AASB 15.
The adoption of AASB 15 did not have an impact on the timing of revenue recognition or the amount of revenue to be recognised.
Presentation and disclosure requirements
As required for the consolidated financial statements, the Group disaggregated revenue recognised from contracts with customers into categories that depict how the nature, amount, timing and uncertainty of revenue and cash flows are affected by economic factors.
The Group also disclosed information about the relationship between the disclosure of disaggregated revenue and revenue information disclosed for each reportable segment. Refer to Note 1 for the disclosure on disaggregated revenue.
AASB 9 Financial Instruments
AASB 9 Financial Instruments replaces AASB 139 Financial Instruments: Recognition and Measurement for annual periods beginning on or after 1 January 2018, bringing together all three aspects of the accounting for financial instruments:
• classification and measurement;
• impairment; and
• hedge accounting.
The Group has applied AASB 9 retrospectively, with the initial application date of 1 July 2018.
The effect of adopting AASB 9 is, as follows:
• there was no impact on the statement of profit or loss for the twelve months ended 30 June 2018;
• there was no impact on the statement of financial position as at 1 July 2018. However, quoted and unquoted equity shares (total carrying value of $5,193,000) were reclassified from available-for-sale to financial assets measured at fair value through other comprehensive income. There was no impact to reserves as at 1 July 2018; and
• there was no impact on the Group’s operating, investing and financing cash flows and the basic and diluted EPS.
(a) Classification and measurement
The Group initially measures a financial asset at its fair value plus, in the case of a financial asset not at fair value through profit or loss, less transaction costs.
Under AASB 9, debt financial instruments are subsequently measured at:
• fair value through profit or loss (FVPL);
• amortised cost; or
• fair value through other comprehensive income (FVOCI).
For
per
sona
l use
onl
y
592019 ANNUAL REPORT
The classification is based on two criteria:
• the Group’s business model for managing the assets; and
• whether the instruments’ contractual cash flows represent ‘solely payments of principal and interest’ on the principal amount outstanding (the ‘SPPI criterion’).
The new classification and measurement of the Group’s financial assets are, as follows:
• Debt instruments at FVPL, with gains or losses recognised to profit or loss. Financial assets in this category are the Group’s quoted hybrid securities.
• Equity instruments at FVOCI, with no recycling of gains or losses to profit or loss. This category only includes equity instruments, which the Group has irrevocably elected to so classify upon initial recognition or transition. Equity instruments at FVOCI are not subject to an impairment under AASB 9. Under AASB 139, the Group’s quoted and unquoted equity instruments were classified as Available-for-sale (AFS) financial assets. There were no impairment losses recognised in profit or loss for these investments in prior periods.
The assessment of the Group’s business models was made as of the date of initial application, 1 July 2018, and then applied to those financial assets that were not derecognised before 1 July 2018. The assessment of whether contractual cash flows on debt instruments are solely comprised of principal and interest was made based on the facts and circumstances as at the initial recognition of the assets.
The Group has not designated any financial liabilities as at fair value through profit or loss. There are no changes in classification and measurement for the Group’s financial liabilities.
(b) Impairment
The adoption of AASB 9 has changed the Group’s accounting for impairment losses for financial assets by replacing AASB 139’s incurred loss approach with a forward-looking expected credit loss (ECL) approach.
AASB 9 requires the Group to record an allowance for ECLs for all debt financial assets not held at FVPL.
ECLs are based on the difference between the contractual cash flows due in accordance with the contract and all the cash flows that the Group expects to receive. The shortfall is then discounted at an approximation to the asset’s original effective interest rate.
The Group has applied the standard’s simplified approach and has calculated ECLs based on lifetime expected credit losses. This was based on the Group’s historical credit loss experience, adjusted for forward-looking factors specific to the debtors.
The Group considers a financial asset in default when contractual payment are 90 days past due. However, in certain cases, the Group may also consider a financial asset to be in default when internal or external information indicates that
the Group is unlikely to receive the outstanding contractual amounts in full before taking into account any credit enhancements held by the Group.
The adoption of the ECL requirements of AASB 9 did not result in any material impact on transition.
For the Group’s debt financial assets which are measured at FVPL these assets are not subject to an impairment assessment under AASB 9.
(c) Hedge accounting
The Group does not apply hedge accounting.
26. Standards issued but not yet effective
Australian Accounting Standards and Interpretations that are issued, but are not yet effective, up to the date of issuance of the Group’s financial statements are disclosed below. The Group intends to adopt these new standards and interpretations, if applicable, when they become effective.
AASB 16 Leases
AASB 16 was issued in January 2016 and it replaces AASB 117 Leases, AASB Interpretation 4 Determining whether an Arrangement contains a Lease, AASB Interpretation-115 Operating Leases-Incentives and AASB Interpretation 127 Evaluating the Substance of Transactions Involving the Legal Form of a Lease.
AASB 16 sets out the principles for the recognition, measurement, presentation and disclosure of leases and requires lessees to account for all leases under a single on-balance sheet model similar to the accounting for finance leases under AASB 117.
The standard includes two recognition exemptions for lessees – leases of ’low-value’ assets (e.g., personal computers) and short-term leases (i.e., leases with a lease term of 12 months or less). At the commencement date of a lease, a lessee will recognise a liability to make lease payments (i.e., the lease liability) and an asset representing the right to use the underlying asset during the lease term (i.e., the right-of-use asset). Lessees will be required to separately recognise the interest expense on the lease liability and the depreciation expense on the right-of-use asset.
Lessees will be also required to remeasure the lease liability upon the occurrence of certain events (e.g., a change in the lease term, a change in future lease payments resulting from a change in an index or rate used to determine those payments). The lessee will generally recognise the amount of the remeasurement of the lease liability as an adjustment to the right-of-use asset.
AASB 16, which is effective for annual periods beginning on or after 1 January 2019, requires lessees to make more extensive disclosures than under AASB 117.
For
per
sona
l use
onl
y
Notes to the consolidated financial statements | Other disclosures
FOR THE YEAR ENDED 30 JUNE 2019
60 EXCELSIOR CAPITAL LIMITED
Transition to AASB 16
The Group plans to adopt AASB 16 using the first variation of the modified retrospective approach, where the right-of-use-asset at the date of initial application (1 July 2019) is measured at an amount equal to the lease liability, using the assets incremental borrowing rate. Comparative figures are not restated.
The Group will elect to apply the standard to contracts that were previously identified as leases applying AASB 117 and AASB Interpretation 4. The Group will therefore not apply the standard to contracts that were not previously identified as containing a lease applying AASB 117 and AASB Interpretation 4.
The Group will elect to use the exemptions proposed by the standard on lease contracts for which:
• the lease terms ends within 12 months as of the date of initial application; and
• lease contracts for which the underlying asset is of low value. The Group has leases of certain office equipment (i.e., personal computers, printing and photocopying machines) that are considered of low value of less than $10,000.
During 2019, the Group has performed a detailed impact assessment of AASB 16. In summary, the impact of AASB 16 adoption is expected to range from $3,000,000 to $4,000,000 grossing up the asset (right of use assets in Property, plant and equipment) and liabilities (lease liabilities). These effects will be noted in the next half-year financial statements prepared by the Group.
Due to the adoption of AASB 16, the Group’s operating profit will improve, while its interest expense will increase. This is due to the change in the accounting for expenses of leases that were classified as operating leases under AASB 117.
AASB Interpretation 23 Uncertainty over Income Tax Treatment
The Interpretation addresses the accounting for income taxes when tax treatments involve uncertainty that affects the application of AASB 112 and does not apply to taxes or levies outside the scope of AASB 112, nor does it specifically include requirements relating to interest and penalties associated with uncertain tax treatments. The Interpretation specifically addresses the following:
• whether an entity considers uncertain tax treatments separately;
• the assumptions an entity makes about the examination of tax treatments by taxation authorities;
• how an entity determines taxable profit (tax loss), tax bases, unused tax losses, unused tax credits and tax rates; and
• how an entity considers changes in facts and circumstances.
An entity has to determine whether to consider each uncertain tax treatment separately or together with one or more other uncertain tax treatments. The approach that better predicts the resolution of the uncertainty should be followed. The interpretation is effective for annual reporting periods beginning on or after 1 January 2019, but certain transition reliefs are available. The Group will apply the interpretation from its effective date. The Group may need to establish processes and procedures to obtain information that is necessary to apply the Interpretation on a timely basis.
For
per
sona
l use
onl
y

Signed reports
Directors’ declaration
612019 ANNUAL REPORT
In accordance with a resolution of the directors of Excelsior Capital Limited, I state that:
1. In the opinion of the directors:
(a) the financial statements and notes of Excelsior Capital Limited for the financial year ended 30 June 2019 are in accordance with the Corporations Act 2001, including:
(i) giving a true and fair view of the consolidated entity’s financial position as at 30 June 2019 and of its performance for the year ended on that date; and
(ii) complying with Accounting Standards and the Corporations Regulations 2001.
(b) the financial statements and notes also comply with International Financial Reporting Standards as disclosed on page 23; and
(c) there are reasonable grounds to believe that the Company will be able to pay its debts as and when they become due and payable.
2. This declaration has been made after receiving the declarations required to be made to the directors in accordance with section 295A of the Corporations Act 2001 for the financial year ended 30 June 2019.
On behalf of the board
M.X. GLENNON Chairman
28 August 2019
For
per
sona
l use
onl
y

Signed reports
Independent auditor’s report
62 EXCELSIOR CAPITAL LIMITED
EXCELSIOR CAPITAL LIMITED FINANCIAL REPORT 2019 69
For
per
sona
l use
onl
y
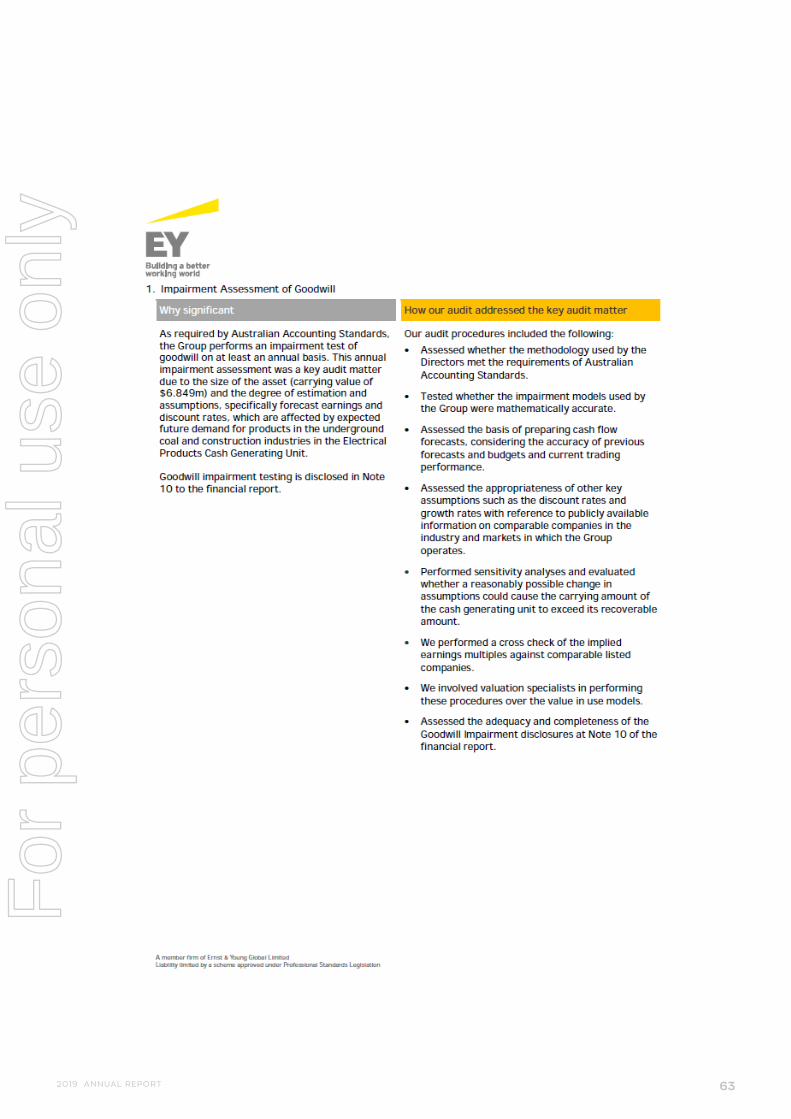
632019 ANNUAL REPORT
EXCELSIOR CAPITAL LIMITED FINANCIAL REPORT 2019 70
For
per
sona
l use
onl
y

Signed reports
Independent auditor’s report
64 EXCELSIOR CAPITAL LIMITED
EXCELSIOR CAPITAL LIMITED FINANCIAL REPORT 2019 71
For
per
sona
l use
onl
y

652019 ANNUAL REPORT
EXCELSIOR CAPITAL LIMITED FINANCIAL REPORT 2019 72
For
per
sona
l use
onl
y

Signed reports
Independent auditor’s report
66 EXCELSIOR CAPITAL LIMITED
EXCELSIOR CAPITAL LIMITED FINANCIAL REPORT 2019 73
For
per
sona
l use
onl
y

672019 ANNUAL REPORT
EXCELSIOR CAPITAL LIMITED FINANCIAL REPORT 2019 74
For
per
sona
l use
onl
y

Signed reports
Independent auditor’s report
68 EXCELSIOR CAPITAL LIMITED
EXCELSIOR CAPITAL LIMITED FINANCIAL REPORT 2019 75
For
per
sona
l use
onl
y
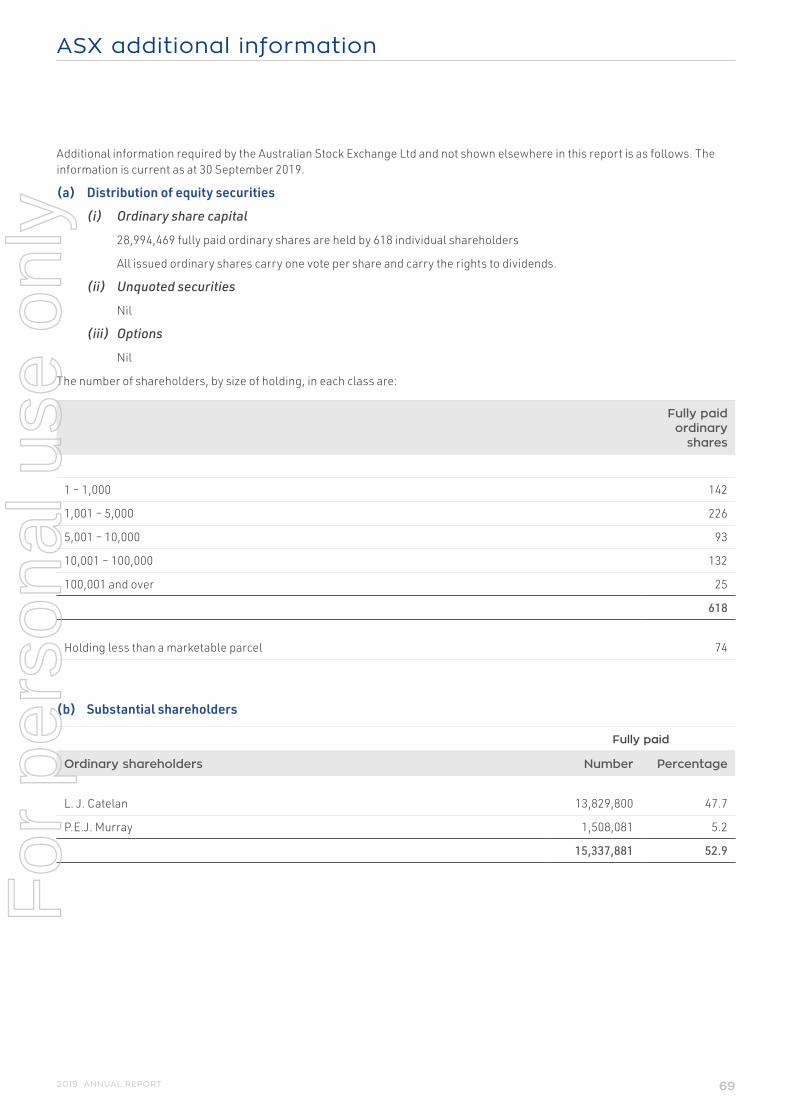
ASX additional information
692019 ANNUAL REPORT
Additional information required by the Australian Stock Exchange Ltd and not shown elsewhere in this report is as follows. The information is current as at 30 September 2019.
(a) Distribution of equity securities
(i) Ordinary share capital
28,994,469 fully paid ordinary shares are held by 618 individual shareholders
All issued ordinary shares carry one vote per share and carry the rights to dividends.
(ii) Unquoted securities
Nil
(iii) Options
Nil
The number of shareholders, by size of holding, in each class are:
Fully paid ordinary
shares
1 – 1,000 142
1,001 – 5,000 226
5,001 – 10,000 93
10,001 – 100,000 132
100,001 and over 25
618
Holding less than a marketable parcel 74
(b) Substantial shareholders
Fully paid
Ordinary shareholders Number Percentage
L. J. Catelan 13,829,800 47.7
P.E.J. Murray 1,508,081 5.2
15,337,881 52.9
For
per
sona
l use
onl
y

ASX additional information
70 EXCELSIOR CAPITAL LIMITED
(c) Twenty largest holders of quoted equity securities
Fully paid
Rank Ordinary shareholders Number Percentage
1 Catelan Securities Pty Ltd 12,420,484 42.84
2 BNP Paribas Nominees Pty Ltd 2,016,903 6.96
3 HSBC Custody Nominees (Australia) Limited 1,589,060 5.48
4 Leanne Catelan Superannuation Fund Pty Ltd 1,409,316 4.86
5 National Nominees Limited 1,245,561 4.30
6 Mr Philip Gordon Greenham 650,000 2.24
7 The Irish Buffett Pty Ltd 429,380 1.48
8 Leropela Pty Ltd 400,000 1.38
9 London City Equities Limited 388,904 1.34
10 BNP Paribas Noms Pty Ltd 374,767 1.29
11 HSBC Custody Nominees (Australia) Limited – GSCO ECA 357,736 1.23
12 London City Equities Limited 233,145 0.80
13 Mrs Vera Kalabric 224,451 0.77
14 Imperial Pacific Limited 204,584 0.71
15 Mast Financial Pty Ltd 200,000 0.69
15 Mr Kim Bee Tan and Mrs Verna Suat Wah Tan 200,000 0.69
16 Mr Warwick Sauer 195,000 0.67
17 Capel Court Corporation Pty Limited 156,025 0.54
18 Mr Peter Edward John Murray 146,652 0.51
19 ADC (Investing) Pty Ltd 125,000 0.43
20 Jet Invest Pty Ltd 117,941 0.41
23,084,909 79.62
For
per
sona
l use
onl
y

Corporate information
712019 ANNUAL REPORT
ABN 98 050 542 443
Directors
M.X. Glennon, ChairL.J. Catelan, Executive DirectorC.D. Green
Company Secretary
M.J. Copeland
Registered office
18-20 Railway RoadMeadowbankAustralia
Principal place of business
18-20 Railway RoadMeadowbankAustraliaPhone: 61 2 9807 6155
Share register
Link Market Services LimitedLocked Bag A14Sydney South AustraliaPhone: 61 2 8280 7454
Excelsior Capital Limited shares are listed on the Australian Stock Exchange (ASX)
Solicitors
GadensLevel 11111 Eagle StreetBrisbaneAustralia
Bankers
National Australia BankLevel 20100 Creek StreetBrisbaneAustralia
Auditors
EY200 George StreetSydneyAustralia
For
per
sona
l use
onl
y

This page has been intentionally left blank.
For
per
sona
l use
onl
y

This page has been intentionally left blank.
For
per
sona
l use
onl
y

2019 Annual Report
EXCELSIOR CAPITAL LIMITED
For
per
sona
l use
onl
y


