

EMISSION MEASUREMENT CENTERGUIDELINE DOCUMENT (GD-043)
PREPARATION AND REVIEW
OF
EMISSION TEST REPORTS
December 1998

PREFACE
This guideline document is made available to promote consistency in the preparation andreview of site-specific emission test reports for emission test programs performed for the U. S.Environmental Protection Agency (EPA), State and local agencies, and private sector interests.

TABLE OF CONTENTS
Section Page
Purpose and Use of the Guideline . . . . . . . . . . . . . . . . . . . . . . . . . . . . . . . . . . . . . . . . . . . . . . . . . i
Sections
1.0 Introduction . . . . . . . . . . . . . . . . . . . . . . . . . . . . . . . . . . . . . . . . . . . . . . . . . . . . 1-1
2.0 Plant and Sampling Location Description . . . . . . . . . . . . . . . . . . . . . . . . . . . . . 2-1
3.0 Summary and Discussion of Results . . . . . . . . . . . . . . . . . . . . . . . . . . . . . . . . . 3-1
4.0 Sampling and Analytical Procedures . . . . . . . . . . . . . . . . . . . . . . . . . . . . . . . . . 4-1
5.0 QA/QC Activities . . . . . . . . . . . . . . . . . . . . . . . . . . . . . . . . . . . . . . . . . . . . . . . 5-1

i
EMISSION TEST REPORT FORMAT
PURPOSE AND USE OF GUIDELINE
The purpose of this guideline is to promote consistency in the preparation and review oftest reports for emission test programs sponsored by the U. S. Environmental Protection Agency(EPA), state and local agencies, and the private sector.
The emission test report must provide the information necessary to document theobjectives of the test and determine whether proper procedures were used to accomplish theseobjectives.
The emission test report presents the information gathered according to an emission testplan. Therefore, the contents of the test plan serve as the foundation for the test report.
This guideline presents a standard format for preparing the emission test report. Thestandard test report contains a table of contents, six sections, and appendices. Rather thandiscussing the standard format, this guideline lists the contents for each section. Then anexample is given to illustrate the intent of each list. The list at the beginning of each sectionserves a dual purpose: (1) as a guide to the preparer and (2) as a checklist for both the preparerand the reviewer of the test report.
Readers may reproduce any part of this guideline.

1-1
1.0 INTRODUCTION
1.1 SUMMARY OF TEST PROGRAM
In this section, write a brief summary that identifies or states, as applicable, thefollowing:
C Responsible groups (participating organizations)C Overall purpose of the emission testC Regulations, if applicableC IndustryC Name of plantC Plant locationC Processes of interestC Air pollution control equipment, if applicableC Emission points and sampling locationsC Pollutants to be measuredC Dates of emission testing
EXAMPLE:4444444444444444444444444444444444444444444444444444444444444444
1.1 SUMMARY OF TEST PROGRAM
The U.S. Environmental Protection Agency (EPA), Office of Air QualityPlanning and Standards (OAQPS), Emission Factor and Inventory Group (EFIG)is responsible for developing and maintaining air pollution emission factors forindustrial processes. The EFIG, in collaboration with the [Trade Organization],is presently studying the wood products industry. The purpose of this study is todevelop emission factors for oriented strand board (OSB) production facilities. The Emission Measurement Center (EMC) of OAQPS coordinated the emissionmeasurement activities at this plant. [Contractor] and [Trade Organization]conducted the emission measurements.
EPA/EFIG and [Trade Organization] considered the [Plant] in [City, State] to beone of four facilities that represent the diversity in wood species and dryer controldevices. This test was the second of the four and was conducted [Dates]. Simultaneousmeasurements were conducted at the inlet and outlet of the electrified filter bed (EFB) forthe No. 1 wood wafer dryer exhaust and at the press vents. Pollutants measured were:particulate matter (PM), condensible particulate matter (CPM), carbon monoxide (CO),nitrogen oxides (NOX), hydrocarbons (HC), formaldehyde (plus other aldehydes andketones), and volatile and semivolatile organic compounds.

1-2
1.2 KEY PERSONNEL
In this section, include the following:
C Names, affiliations, and telephone numbers of key personnel
EXAMPLE:44444444444444444444444444444444444444444444444444444444444444444
1.2 KEY PERSONNEL
The key personnel who coordinated the test program and their phonenumbers are:
C [Contractor] Project Manager XXX/XXX-XXXXC Environmental Agency Technical Representative[if any]
XXX/XXX-XXXXC [Plant] Contact XXX/XXX-XXXXC [Trade Organization] Representative XXX/XXX-XXXXC [Contractor] Process Monitor XXX/XXX-XXXX

2-1
2.0 PLANT AND SAMPLING LOCATION DESCRIPTIONS
2.1 PROCESS DESCRIPTION AND OPERATION
In this section, include the following:
C General description of the basic processC Flow diagram (indicate emission and process test points)C Discussion of typical process operations, such as:
- Production rates- Feed material and feed rates or batch sizes- Equipment sizes and capacities (ratings)- Production schedules (hours/day, days/week, weeks/year, peak periods)
In the flow diagram, trace the process from beginning to end. Identify the majoroperations. Show only those gas, liquid, and solid flow streams that relate to the emission test.
EXAMPLE:44444444444444444444444444444444444444444444444444444444444444444
2.1 PROCESS DESCRIPTION
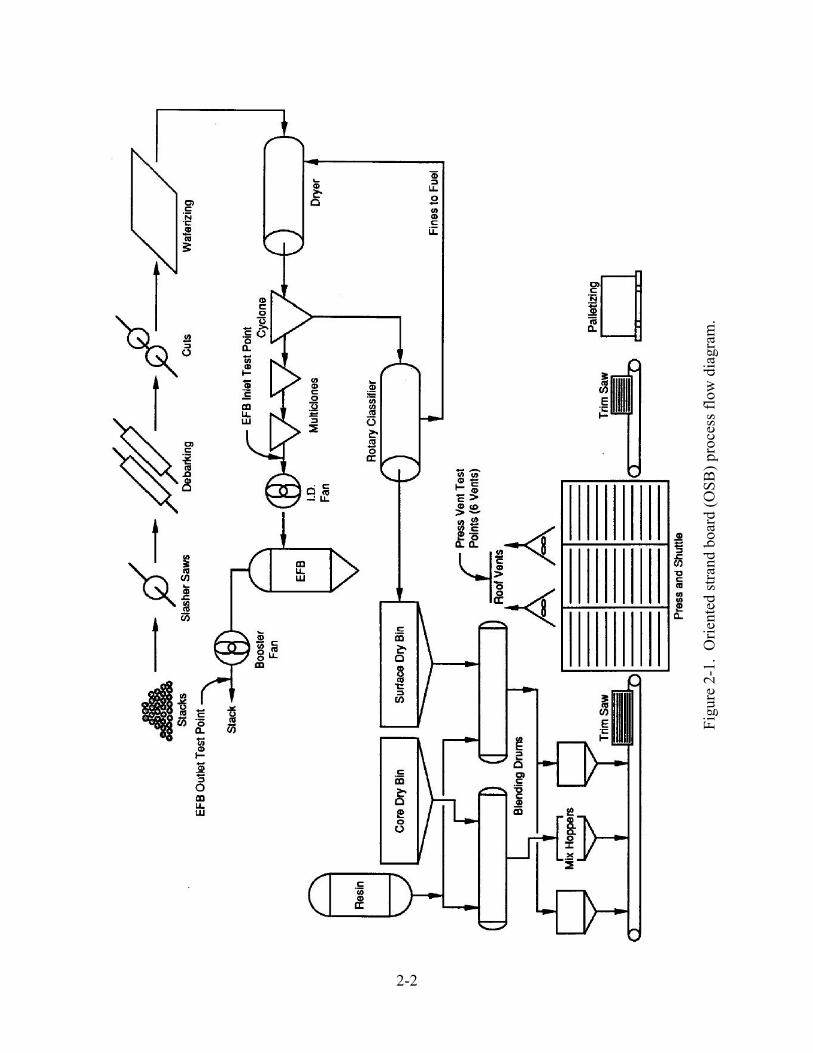
Figure 2-1 illustrates the basic processing steps for OSB production. Thesteps are:
C Logs are slashed, debarked, cut into shorter lengths, and sliced into thinwafers.
C The wafers are dried, classified, blended and mixed with resin, oriented,and formed into a mat.
C The formed mats are separated into desired lengths, heated, and pressedto activate the resin and bond the wafers into a solid sheet.
C Sheets are trimmed, edge treated, and packaged for shipping.
At [Plant], the wood mix during the test was 60 percent soft wood (e.g.,pine), 30 percent soft hardwood (e.g., sweet gum), and 10 percent hardwood. Two 12-foot diameter dryers processed 30,500 lb/hr of flakes. The moisturecontent of the flakes leaving the dryer was 3 percent. Inlet temperature to thedryer ran at 900°F and the exit temperature was 255°F. A McConnel burnerfiring recycled waste (wood trim, fines, and resinated sander dust) heated thedryers. An oil-fired Wellens burner served as a backup, but was not used duringthe test.
The emission test points were EFB inlet and outlet (stack) and the roofvents from the press.
2-2
Figu
re 2
-1.
Orie
nted
stra
nd b
oard
(OSB
) pro
cess
flow
dia
gram
.
2-3
2.2 CONTROL EQUIPMENT DESCRIPTION
In this section, include the following:
C Description of all air pollution control systems, if applicableC Discussion of typical control equipment operation and, if necessary, a schematic
EXAMPLE:44444444444444444444444444444444444444444444444444444444444444444
2.2 ELECTRIFIED FILTER BED DESCRIPTION
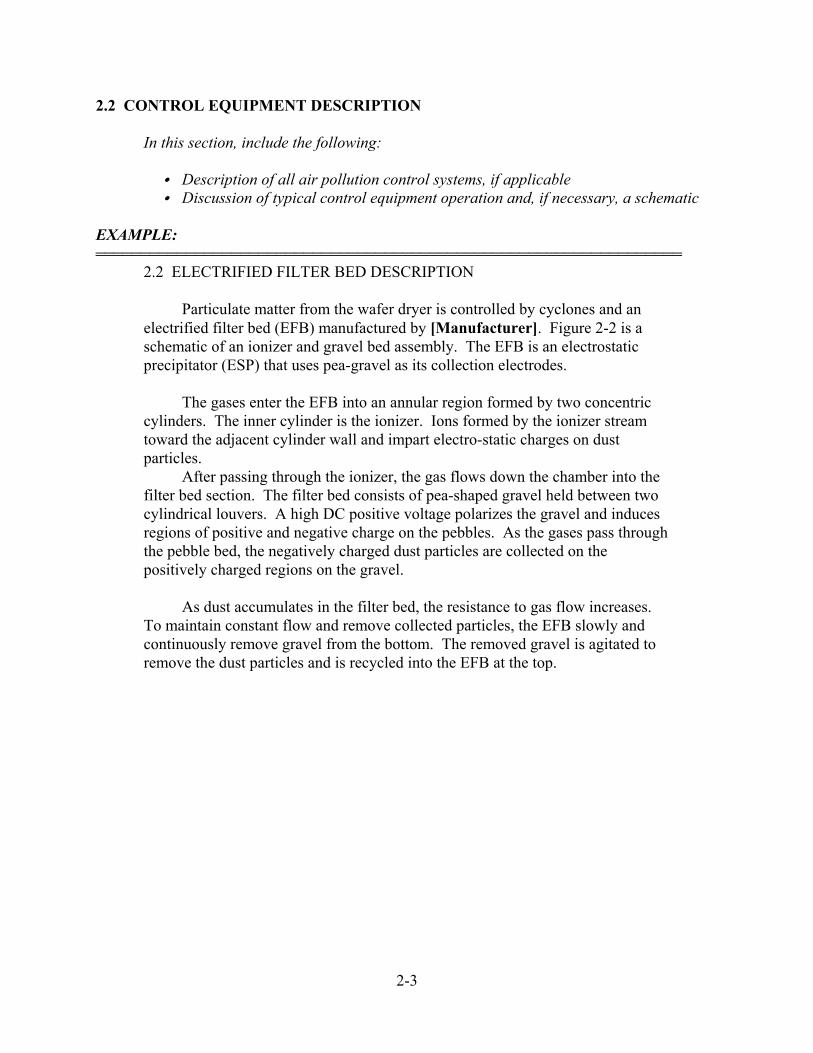
Particulate matter from the wafer dryer is controlled by cyclones and anelectrified filter bed (EFB) manufactured by [Manufacturer]. Figure 2-2 is aschematic of an ionizer and gravel bed assembly. The EFB is an electrostaticprecipitator (ESP) that uses pea-gravel as its collection electrodes.
The gases enter the EFB into an annular region formed by two concentriccylinders. The inner cylinder is the ionizer. Ions formed by the ionizer streamtoward the adjacent cylinder wall and impart electro-static charges on dustparticles.
After passing through the ionizer, the gas flows down the chamber into thefilter bed section. The filter bed consists of pea-shaped gravel held between twocylindrical louvers. A high DC positive voltage polarizes the gravel and inducesregions of positive and negative charge on the pebbles. As the gases pass throughthe pebble bed, the negatively charged dust particles are collected on thepositively charged regions on the gravel.
As dust accumulates in the filter bed, the resistance to gas flow increases. To maintain constant flow and remove collected particles, the EFB slowly andcontinuously remove gravel from the bottom. The removed gravel is agitated toremove the dust particles and is recycled into the EFB at the top.

2-4
Figure 2-2. Ionizer and gravel bed assembly.

2-5
2.3 FLUE GAS SAMPLING LOCATIONS
In this section:
C Provide a schematic of each location. Include:- duct diameter- direction of flow- dimensions to nearest upstream and downstream
disturbances (include number of duct diameters)- location and configuration of the sampling ports- nipple length and port diameters- number and configuration of traverse points
C Confirm that the sampling location met the EPA criteria - If not, give reasons anddiscuss effect on results
C Discuss any special traversing or measurement schemes
EXAMPLE:44444444444444444444444444444444444444444444444444444444444444444
2.3 FLUE GAS SAMPLING LOCATIONS
Emission sampling was conducted at: (1) the EFB inlet on dryer No. 1, (2)the EFB outlet stack on dryer No. 1, and (3) the press vents. Figures 2-3, 2-4, and2.5 are schematics of these sampling locations.
2.3.1 EFB Inlet. Four 4-inch ports were installed at Sections XX and YYas shown in Figure 2-3. Because of obstructions around the site, Section XX wasthe only practical location for Methods 202 and 0011. Method 1 requires thatSection XX have 24 traverse points; each point was sampled for 2.5 minutes for atotal time of 60 minutes. One train traversed into the duct while the othertraversed out. At Section YY, about 2 feet below Section XX, one port was usedfor the paired Method 25 single-point sampling and the second for Method 25Aand Method 3.
2.3.2 EFB Outlet. The outlet stack for the EFB has two 4-inch samplingports A and B as shown in Figure 2-4. Additional 4-inch ports C through H wereinstalled as shown. Methods 202, 0011, and MM5 were conducted at Section XXat 24 points (2.5 minutes at each point), the VOST train were conducted at port E,and Methods 25 (dual), 10, 7E, and 3 were conducted at Section YY.
2.3.3 Press Vents. The press has eight roof vents as shown in Figure 2-5. The two vents on the ends (1 and 8) were not tested because they were notdirectly over the press and little or no emissions were expected from these vents. Different pairs of the other six vents were sampled for formaldehyde emissions(Method 0011) during each of the three test runs.

2-6
Figure 2-3. Schematic of Unit No, 1EFB inlet sampling location.

2-7
Figure 2-4 Schematic of Unit 1 EFB outlet stack sampling location.

2-8
Figure 2-5 Press Vents sampling location configuration and testing scheme.

2-9
At this location, a 4-foot stack extension to improve flow conditions wasconstructed. The extension contained one 4-inch port. Each vent "stack" wastraversed (12 points) in only one direction. The traverse of the second vent of apair was in the direction perpendicular to the first vent traverse. Although thelocation did not meet Method 1 requirements, the results will not be affected sinceno particulate sampling was conducted at the press vents. The flow check fornon-parallel flow before the test showed that the flow conditions were acceptable,i.e., the flow was not cyclonic.
(((((((((((((((((((((((((((((((((((((((((((((((((((((((((((((((((
2.4 PROCESS SAMPLING LOCATIONS
If process stream samples were taken, include the following:
C Schematic of locations, if helpfulC Description of each sampling or measurement locationC Description of procedure used to obtain samples or measurementsC Discussion on the representativeness of each of the process stream sampling
locations and samples
EXAMPLE: No process samples were required to be taken during the OSB test. Therefore, theexample below is from a site-specific test plan for a drum mix asphalt plant. At this plant, a tankof waste fuel was used to supply the burners for the drum mixer. The plan required one grabsample per run of the waste fuel.44444444444444444444444444444444444444444444444444444444444444444
2.4 WASTE FUEL SAMPLING LOCATION
The sample for each test run was taken from a tap at the outlet of the wastefuel supply tank to the burners. The sample at this point was expected to behomogeneous. However, to ensure representativeness of the sample for each run,equal volumes of sample were taken at the beginning, middle, and end of the run.

3-1
3.0 SUMMARY AND DISCUSSION OF TEST RESULTS
3.1 OBJECTIVES AND TEST MATRIX
In this section:
C Restate the overall purpose of the test program.C List the specific objectives.C Include a test matrix table showing the following (include schematics, if helpful):
- Run no. and date- Sample type/pollutant- Test method- Sampling locations- Clock time- Sampling time
EXAMPLE:44444444444444444444444444444444444444444444444444444444444444444
3.1 OBJECTIVES AND TEST MATRIX
The purpose of the test program was to develop emission factors for OSBproduction facilities from the wood products industry.
The specific objectives were:
C Measure the emissions of PM, CPM, CO, NOX, THC, formaldehyde,other aldehydes, and ketones, and volatile and semi-volatile organicsat the wood wafer dryer EFB inlet and outlet locations.
C Measure formaldehyde, other aldehydes, and ketones emissions fromthe press vents.
C Determine the relationship between Method 25 and Method 25A forHC, and between Method 202 and the Oregon Department ofEnvironmental Quality (ODEQ) Method 7 for particulates (PM andCPM).
C Assess the suitability of deriving a correction factor for Method 25A.
C Obtain production rates, inlet and outlet dryer temperatures, dryingrates, belt speed, EFB bed voltage and current, and EFB voltage andionizer current.
Table 3-1 presents the sampling and analytical matrix and sampling log.

3-2
TABLE 3-1. SAMPLING MATRIX
RUN NO.DATE
SAMPLETYPE
TESTMETHOD
LOCATION/CLOCK TIME/SAMPLINGTIME
EFBINLET
EFBOUTLET
PRESS VENTS
17/30/98
PM/CPMO2/CO2F/A/KSVOCVOC
TGNMOTHCNOXCO
M5/202M3
M0011MM5
M0030M25
M25AM7EM10
1130-1420606060
6060
1130-1428606060606060606060
1123-1233
60 (Vents 2/3)
27/30/98 F/A/K M0011
1410-123360 (Vents 4/5)
27/31/98
PM/CPMO2/CO2F/A/KSVOCVOC
TGNMOTHCNOXCO
M5/202M3
M0011MM5
M0030M25
M25AM7EM10
1215-1327 404040
4040
1215-1349454545454545454545
37/31/98
PM/CPMO2/CO2F/A/KSVOCVOC
TGNMOTHCNOXCO
M5/202M3
M0011MM5
M0030M25
M25AM7EM10
1800-1933 606060
6060
1800-1947606060606060606060
800-?
60 (Vents 6/7)

3-3
3.2 FIELD TEST CHANGES AND PROBLEMS
If no field test changes or problems occurred, this section may be omitted. In this section,include the following items:
C List and discussion of any changes in sampling and analytical methods for emissions orprocess information
EXAMPLE:44444444444444444444444444444444444444444444444444444444444444444
3.2 FIELD TEST CHANGES AND PROBLEMS
3.2.1 Percent Isokinetics. Three of the 18 runs exceeded the percent isokineticrequirements of ±10 percent as a result of incorrect data input. The magnitude of theexceedances all occurring at the EFB outlet were as follows:
C Run 1, MM5 train for SVOC: 83.3%C Run 2, M0011 train for formaldehyde/aldehydes 112.1%C Run 3, M0011 train for formaldehyde/aldehydes 112.1%
Since the sample analyses involved the gaseous (formaldehyde/aldehydes)components and semi-volatile components at the EFB outlet, these deviations are notexpected to affect the results.
3.2.2 Shortened Sampling Time. Run No. 2 had a sampling time of 40-45minutes rather than 60 minutes. The plant went down at 2:47 p.m. The EMB testcoordinator determined this run to be adequate.

3-4
3.3 PRESENTATION OF RESULTS
In this section and subsequent sections (one section for each objective):
C Address each of the specific objectives and present a summary of the results in tabularform
C Discuss the data
EXAMPLE: This example is for only one of the objectives. Subsequent sections should be similar incontent.44444444444444444444444444444444444444444444444444444444444444444
3.3 FLOW RATES FROM EFB AND PRESS VENTS
To determine mass emission rates and EFB collection efficiency, flow rate is animportant component. In this test program, three separate trains providedsimultaneous measurements of velocities, temperatures, and moisture contents. Table3-2 summarizes the flow rate data. Method 3 data for O2 and CO2 are added to thistable.
The following observations are made:
C The temperature measurements of the EFB inlet and outlet compare towithin ±2°F of each other, except for Run I-1, which is within ±4°F.
C The moisture contents of the EFB inlet and outlet compare to within ±1percent moisture of each other.
C The flow rate from M5/202, Run I-2 appears to be high, and all three runsfrom M5/202 outlet appear to be too low when compared to flow ratesfrom the other trains. According to the O2/CO2 data, the flow rate at theoutlet should be slightly higher than that of the inlet.
Based on the above observations, Runs I-2 and the measurements made at thestack (EFB outlet) for M5/202 were deleted from the averages. The average flow ratesas shown in Table 3-2 were considered to provide the best data and, therefore, wereused to calculate the mass emission rates.

3-5
TABLE 3-2. VOLUMETRIC FLOW RATE DATA
RUNNO.
FLOW RATE, dscmh TEMPERATURE, °F MOISTURE, %H2O ORSAT, %
M5/202 M0011 MM5 Average M5/202 M0011 MM5 M5/202 M0011 MM5 O2 CO2
I-1I-2I-3
Avg
54,58660,80655,510
56,967
54,33453,13154,874
54,113
54,46053,131a
55,192
225225224
225
233228226
229
23.422.722.8
23.0
24.424.524.4
24.4
16.816.517.0
16.8
4.04.43.8
4.1
S-1S-2S-3
Avg
51,05452,48952,398
51,980
54,87155,80355,165
55,280
55,34255,15357,063
55,853
55,106b
56,433b
56,114b
227222227
225
226223225
225
227226227
227
23.323.323.4
23.3
22.523.422.9
22.9
23.824.024.0
23.9
17.617.116.8
17.2
3.23.84.0
3.7
V-1V-2V-3
Avg
32,16331,32439,087
34,191
32,16331,32439,087
111130133
125
2.23.63.3
3.0
a Does not include M5/202b Does not include M5/202 runs
3-5

4-1
4.0 SAMPLING AND ANALYTICAL PROCEDURES
4.1 TEST METHODS
In this section, include the following:
C Schematic of each sampling trainC Flow diagram of the sample recoveryC Flow diagram of sample analysisC Description of any modificationsC Discussion of any problematic sampling or analytical conditions
If a non-EPA method was used in place of an EPA method, explain the reason. Place acopy of all methods in Appendix A to the report. Be sure that non-EPA methods are written indetail similar to that of the EPA methods.
EXAMPLE: This example is for just one of the test methods. The test report should includesimilar schematics and flow diagrams for each of the test methods.44444444444444444444444444444444444444444444444444444444444444444
4.1 TEST METHODS
4.1.1 Particulate Matter/Condensible Particulate Matter. PM/CPM at theinlet and outlet of the EFB were determined by Method 202. One of theobjectives of this test was to compare Method 202 with ODEQ Method 7, whichis identical to Method 202 except for the following:
C A second filter is placed just before the silica gel impinger.C Acetone rather than methylene chloride is used in the final rinse of the
impingers and connecting glassware.C An optional out-of-stack filter is used before the impingers.
Because of space limitations, Method 202 was modified by inserting asecond filter in the same position as that in the ODEQ Method 7. This back-upfilter was analyzed gravimetrically according to the ODEQ procedure. All otherprocedures were those of Method 202. Figures 4-1 and 4-2 are schematics ofMethod 202 (showing modification) and ODEQ Method 7, respectively.
Figures 4-3 and 4-4 illustrate the sample recovery procedure and analysisschemes, respectively.

4-2
Figu
re 4
-1.
EPA
Met
hod
202
(mod
ified
with
bac
k fil
ter)
con
dens
able
par
ticul
ate
sam
plin
g tra
in.

4-3
Figu
re 4
-2.
Ore
gon
DEQ
Met
hod
7sam
plin
g tra
in.

4-4
Figu
re 4
-3.
Sam
ple
reco
very
sche
me
for p
artic
ulat
e/co
nden
sabl
es sa
mpl
es.

4-5
Figu
re 4
-4.
Ana
lytic
al sc
hem
e fo
r par
ticul
ate/
cond
ensa
bles
sam
ples
.

4-6
4.2 PROCESS TEST METHODS
In this section, include the following:
C Description of procedures used to obtain process stream and control equipmentdata
C Calibration procedures for any test equipment, if appropriate
EXAMPLE:44444444444444444444444444444444444444444444444444444444444444444
4.2 PROCEDURES FOR OBTAINING PROCESS DATA
The [Process Monitor] counted the number of press loads for each testperiod, and obtained the dryer data from the central control panel, amount ofwafer flakes dried from digital meters calibrated to measure the amount of flakesleaving the dryer, and the EFB data from the EFB control panel.

5-1
5.0 INTERNAL QA/QC ACTIVITIES
5.1 QA/QC PROBLEMS
In this section, discuss:
C QA/QC problems that occurred during the testC Sample identification and custody problems
EXAMPLE:44444444444444444444444444444444444444444444444444444444444444444
5.1 QA/QC PROBLEMS
One field spike was performed at the EFB outlet location as a check offield handling and recovery procedures. The field spike consisted of introducing200 :l (0.80 mg) of the Field Spike Standard into an impinger containing 200 mlof the DNPH solution and following normal recovery procedures.
Only 0.094 mg out of 0.802 mg was recovered. A check of the DNPHsolution revealed that the cause of the poor recovery was due to the deteriorationof the solution.
5.2 QA AUDITS
For each of the test methods for which an audit was conducted, list (if applicable) thefollowing:
C Type of audit conductedC Limits of acceptabilityC Supplier of audit materialC Audit procedureC Summary of results
EXAMPLE: An example for Method 5 dry gas meter audit is provided below.44444444444444444444444444444444444444444444444444444444444444444
5.2 METERING SYSTEM AUDIT
An on-site audit of the meterbox calibrations was conducted usingcalibrated critical orifices supplied by EPA. The procedure that accompanied theorifices were used. The results of this audit are presented in Table 5-1. All auditvalues were within the acceptable range of 5%.

5-2
Table 5-1. Meter Box Calibration AuditMeter Box
NumberPre-Audit
Value Allowable Error Calculated Yc Acceptable
EN-1 0.9247 0.8877 <Y<0.9617 0.9498 Yes
EN-2 0.9968 0.9569<Y<1.0367 1.0164 Yes
NU-7 0.9900 0.9504<Y<1.0296 0.9712 Yes
RAC-1 1.0437 1.0020<Y<1.0854 1.0601 Yes
RAC-2 1.0183 0.9776<Y<1.0590 1.0386 Yes
RAC-3 1.1330 1.0877<Y<1.1783 1.1393 Yes
RAC-5 1.0450 1.0032<Y<1.0868 1.0367 Yes


