
© 2016 IHS Markit. All Rights Reserved. © 2016 IHS Markit. All Rights Reserved.
Global Energy Markets & Alberta Leveraging the Alberta legacy to attract new waves of petrochemical industry investment
BUILDING ALBERTA'S INNOVATION AND INVESTMENT 18th Annual Stakeholder Luncheon Thursday, January 19, 2017 Edmonton, Alberta, Canada
Mark Eramo, VP Global Business Development Oil / Midstream / Downstream & Chemicals Houston, TX [email protected]
© 2016 IHS Markit
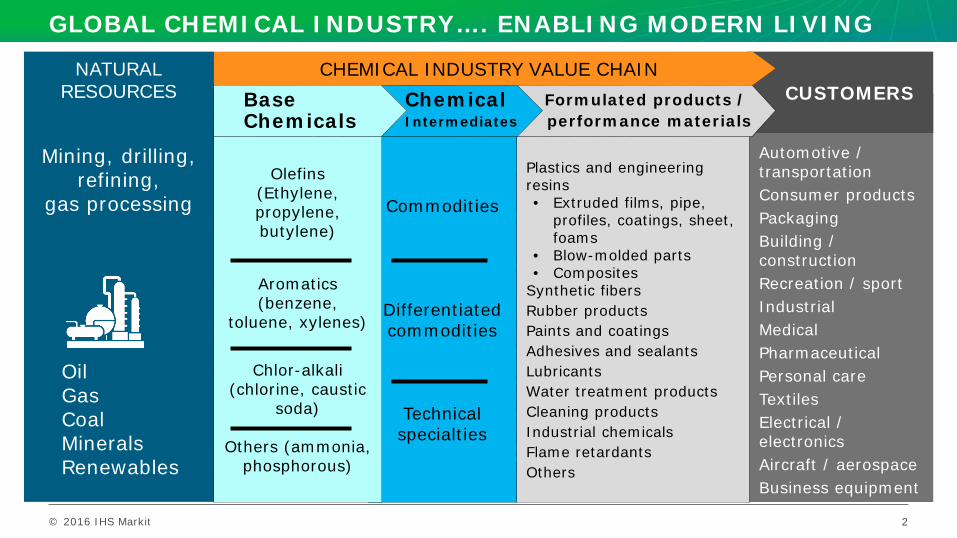
Automotive / transportation Consumer products Packaging Building / construction Recreation / sport Industrial Medical Pharmaceutical Personal care Textiles Electrical / electronics Aircraft / aerospace Business equipment
GLOBAL CHEMICAL INDUSTRY…. ENABLING MODERN LIVING
CUSTOMERS CHEMICAL INDUSTRY VALUE CHAIN NATURAL
RESOURCES
Mining, drilling, refining,
gas processing
Oil Gas Coal Minerals Renewables
Plastics and engineering resins • Extruded films, pipe,
profiles, coatings, sheet, foams
• Blow-molded parts • Composites
Synthetic fibers Rubber products Paints and coatings Adhesives and sealants Lubricants Water treatment products Cleaning products Industrial chemicals Flame retardants Others
Formulated products / performance materials
Commodities
Differentiated commodities
Technical specialties
Chemical Intermediates
Olefins (Ethylene, propylene, butylene)
Aromatics (benzene,
toluene, xylenes)
Chlor-alkali
(chlorine, caustic soda)
Others (ammonia,
phosphorous)
Base Chemicals
2
© 2016 IHS Markit
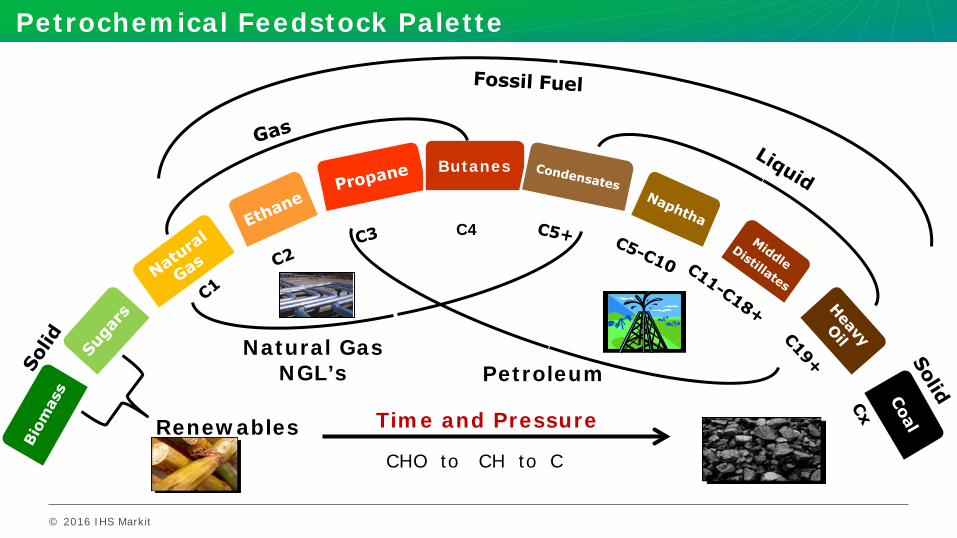
Petrochemical Feedstock Palette
Butanes
Renewables Time and Pressure
CHO to CH to C
Natural Gas NGL’s Petroleum
C4
© 2016 IHS Markit
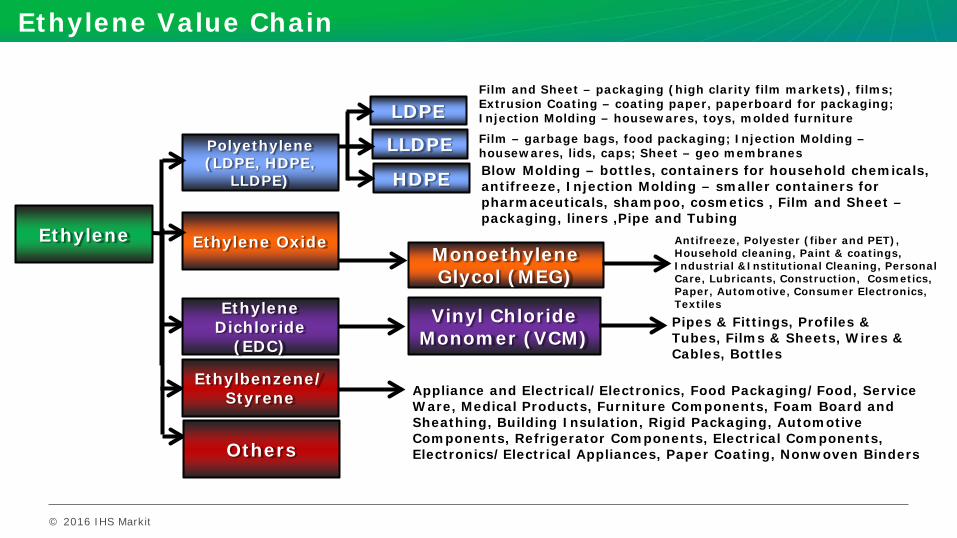
Ethylene Value Chain
Polyethylene (LDPE, HDPE,
LLDPE)
Monoethylene Glycol (MEG)
Ethylene Oxide Ethylene
Ethylbenzene/ Styrene
Others
Antifreeze, Polyester (fiber and PET), Household cleaning, Paint & coatings, Industrial &Institutional Cleaning, Personal Care, Lubricants, Construction, Cosmetics, Paper, Automotive, Consumer Electronics, Textiles Ethylene
Dichloride (EDC)
Vinyl Chloride Monomer (VCM)
Pipes & Fittings, Profiles & Tubes, Films & Sheets, Wires & Cables, Bottles
Appliance and Electrical/Electronics, Food Packaging/Food, Service Ware, Medical Products, Furniture Components, Foam Board and Sheathing, Building Insulation, Rigid Packaging, Automotive Components, Refrigerator Components, Electrical Components, Electronics/Electrical Appliances, Paper Coating, Nonwoven Binders
LLDPE
LDPE
HDPE
Film and Sheet – packaging (high clarity film markets), films; Extrusion Coating – coating paper, paperboard for packaging; Injection Molding – housewares, toys, molded furniture Film – garbage bags, food packaging; Injection Molding – housewares, lids, caps; Sheet – geo membranes Blow Molding – bottles, containers for household chemicals, antifreeze, Injection Molding – smaller containers for pharmaceuticals, shampoo, cosmetics , Film and Sheet – packaging, liners ,Pipe and Tubing
© 2016 IHS Markit
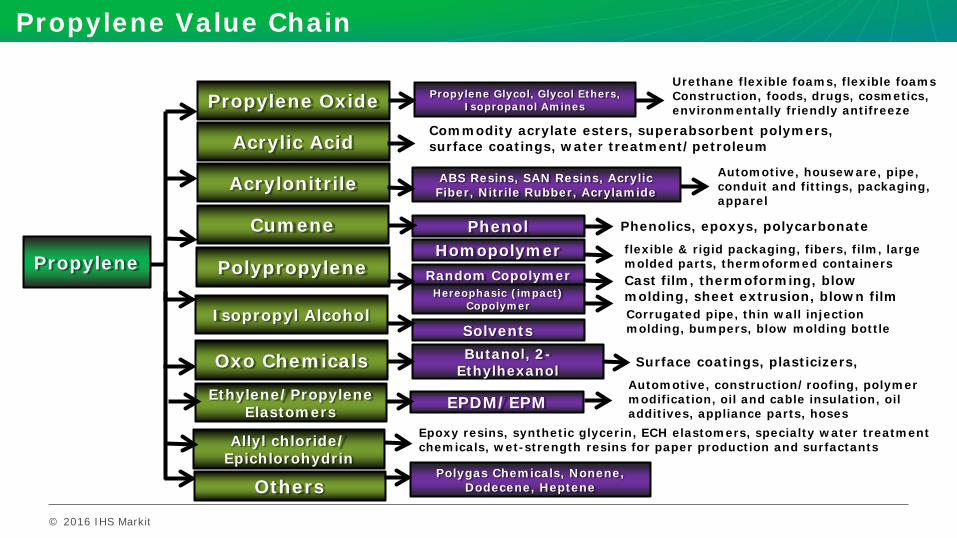
Propylene Value Chain
Propylene Oxide
Acrylonitrile
Acrylic Acid
Propylene
Cumene
Polypropylene Random Copolymer
Oxo Chemicals
Isopropyl Alcohol
Ethylene/Propylene Elastomers
Homopolymer
Hereophasic (impact) Copolymer
flexible & rigid packaging, fibers, film, large molded parts, thermoformed containers Cast film, thermoforming, blow molding, sheet extrusion, blown film Corrugated pipe, thin wall injection molding, bumpers, blow molding bottle
Phenol Phenolics, epoxys, polycarbonate
ABS Resins, SAN Resins, Acrylic Fiber, Nitrile Rubber, Acrylamide
Propylene Glycol, Glycol Ethers, Isopropanol Amines
Solvents Butanol, 2-
Ethylhexanol
EPDM/EPM
Others Polygas Chemicals, Nonene,
Dodecene, Heptene
Urethane flexible foams, flexible foams Construction, foods, drugs, cosmetics, environmentally friendly antifreeze
Commodity acrylate esters, superabsorbent polymers, surface coatings, water treatment/petroleum
Automotive, houseware, pipe, conduit and fittings, packaging, apparel
Surface coatings, plasticizers, Automotive, construction/roofing, polymer modification, oil and cable insulation, oil additives, appliance parts, hoses
Allyl chloride/ Epichlorohydrin
Epoxy resins, synthetic glycerin, ECH elastomers, specialty water treatment chemicals, wet-strength resins for paper production and surfactants
© 2016 IHS Markit
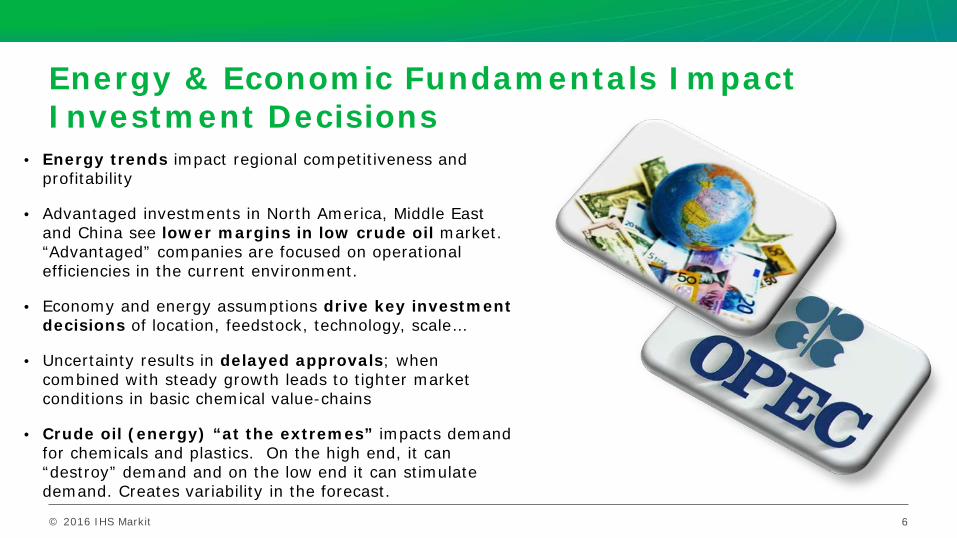
Energy & Economic Fundamentals Impact Investment Decisions
• Energy trends impact regional competitiveness and profitability
• Advantaged investments in North America, Middle East and China see lower margins in low crude oil market. “Advantaged” companies are focused on operational efficiencies in the current environment.
• Economy and energy assumptions drive key investment decisions of location, feedstock, technology, scale…
• Uncertainty results in delayed approvals; when combined with steady growth leads to tighter market conditions in basic chemical value-chains
• Crude oil (energy) “at the extremes” impacts demand for chemicals and plastics. On the high end, it can “destroy” demand and on the low end it can stimulate demand. Creates variability in the forecast.
6
© 2016 IHS Markit
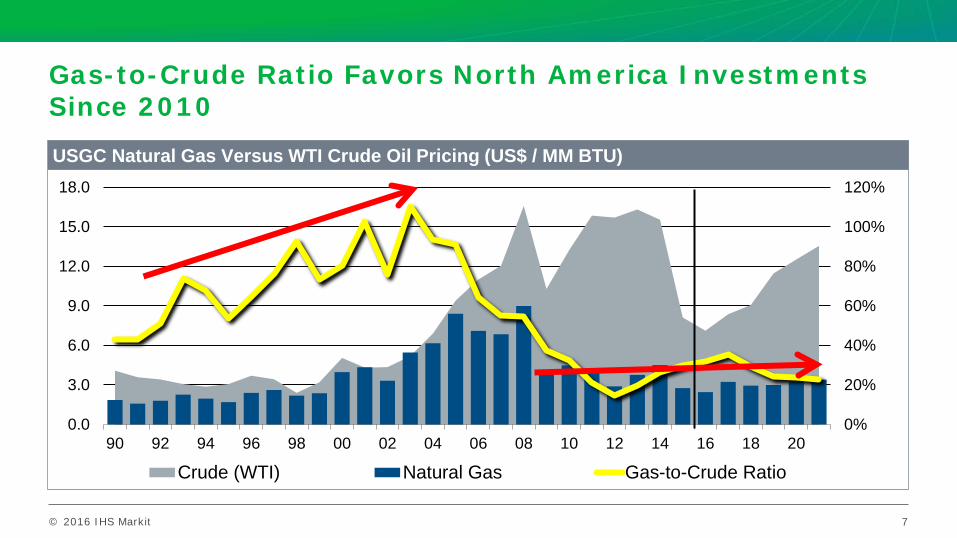
Gas-to-Crude Ratio Favors North America Investments Since 2010
0%
20%
40%
60%
80%
100%
120%
0.0
3.0
6.0
9.0
12.0
15.0
18.0
90 92 94 96 98 00 02 04 06 08 10 12 14 16 18 20
Crude (WTI) Natural Gas Gas-to-Crude Ratio
USGC Natural Gas Versus WTI Crude Oil Pricing (US$ / MM BTU)
Source: IHS
Gas
-to-C
rude
7

© 2016 IHS Markit
Impact of Changing Energy Dynamics On Regional Chemical Capacity Additions
-30%
0%
30%
60%
90%
120%
-10
0
10
20
30
40
91 93 95 97 99 01 03 05 07 09 11 13 15 17 19 21
Gas
-to
-Cru
de
Oil
BTU
Rat
io,
%
Mill
ion
Met
ric
Ton
s
China Asia Less China (with India)Middle East North AmericaWest Europe Gas-To-Crude BTU Ratio, %
Annual Change - Total Basic Chemicals Capacity: Ethylene, Propylene, Methanol, Benzene, Paraxylene, Chlorine
8
© 2016 IHS Markit
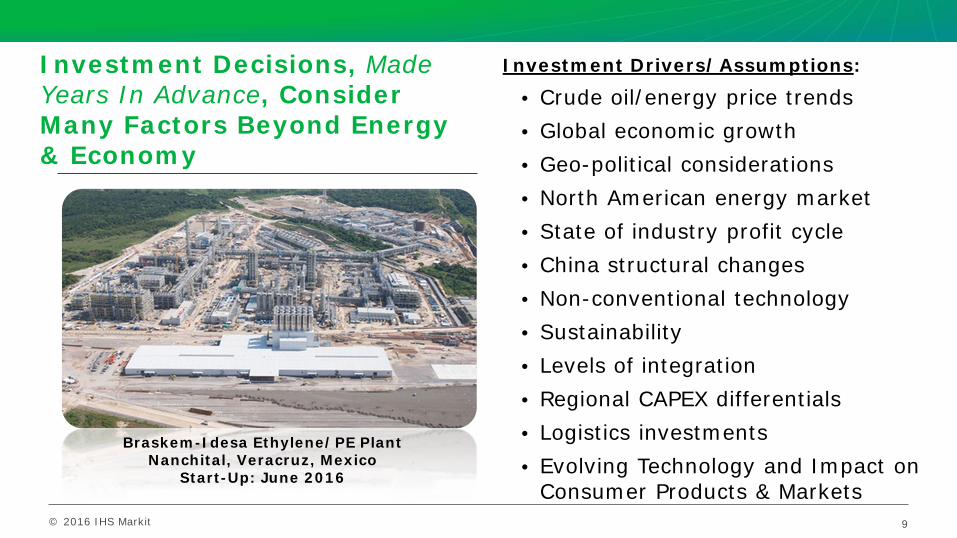
Investment Decisions, Made Years In Advance, Consider Many Factors Beyond Energy & Economy
9
Investment Drivers/Assumptions:
• Crude oil/energy price trends • Global economic growth • Geo-political considerations • North American energy market • State of industry profit cycle • China structural changes • Non-conventional technology • Sustainability • Levels of integration • Regional CAPEX differentials • Logistics investments • Evolving Technology and Impact on
Consumer Products & Markets
Braskem-Idesa Ethylene/PE Plant Nanchital, Veracruz, Mexico
Start-Up: June 2016
© 2016 IHS Markit
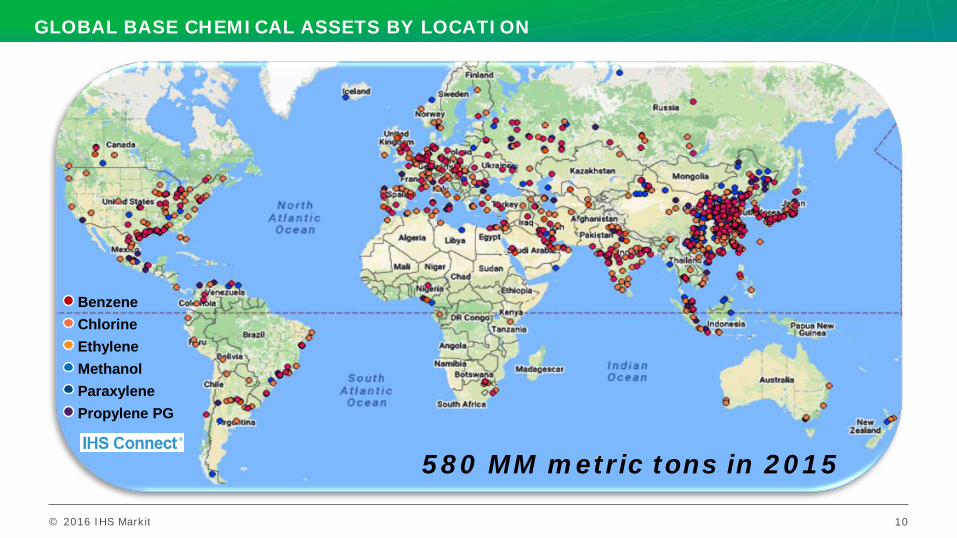
GLOBAL BASE CHEMICAL ASSETS BY LOCATION
10
Benzene Chlorine Ethylene Methanol Paraxylene Propylene PG
580 MM metric tons in 2015
© 2016 IHS Markit
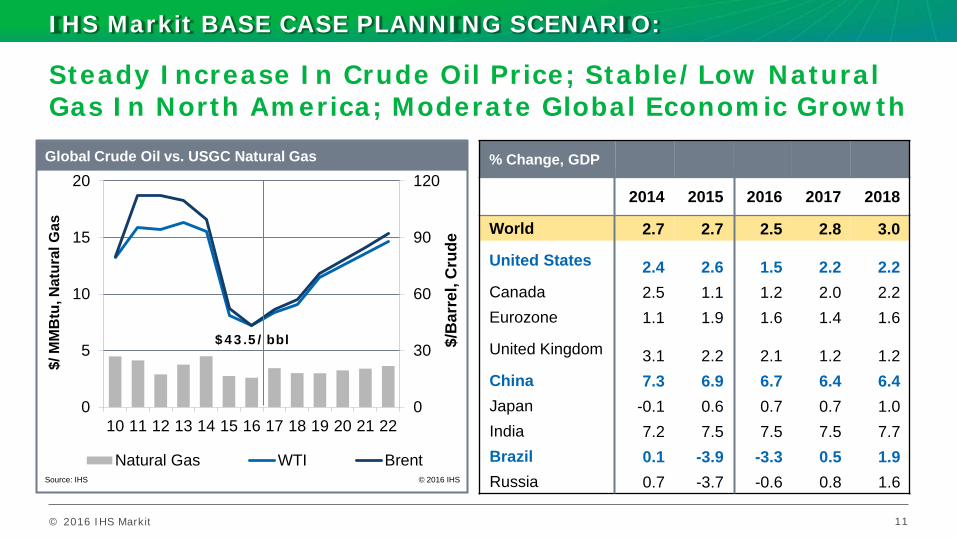
Steady Increase In Crude Oil Price; Stable/Low Natural Gas In North America; Moderate Global Economic Growth
11
% Change, GDP
2014 2015 2016 2017 2018
World 2.7 2.7 2.5 2.8 3.0
United States 2.4 2.6 1.5 2.2 2.2 Canada 2.5 1.1 1.2 2.0 2.2 Eurozone 1.1 1.9 1.6 1.4 1.6
United Kingdom 3.1 2.2 2.1 1.2 1.2 China 7.3 6.9 6.7 6.4 6.4 Japan -0.1 0.6 0.7 0.7 1.0 India 7.2 7.5 7.5 7.5 7.7 Brazil 0.1 -3.9 -3.3 0.5 1.9 Russia 0.7 -3.7 -0.6 0.8 1.6
0
30
60
90
120
0
5
10
15
20
10 11 12 13 14 15 16 17 18 19 20 21 22
Crude Oil vs. Natural Gas
Natural Gas WTI Brent
Global Crude Oil vs. USGC Natural Gas
Source: IHS © 2016 IHS
$/B
arre
l, C
rude
$/ M
MB
tu, N
atur
al G
as
$43.5/bbl
IHS Markit BASE CASE PLANNING SCENARIO:
© 2016 IHS Markit
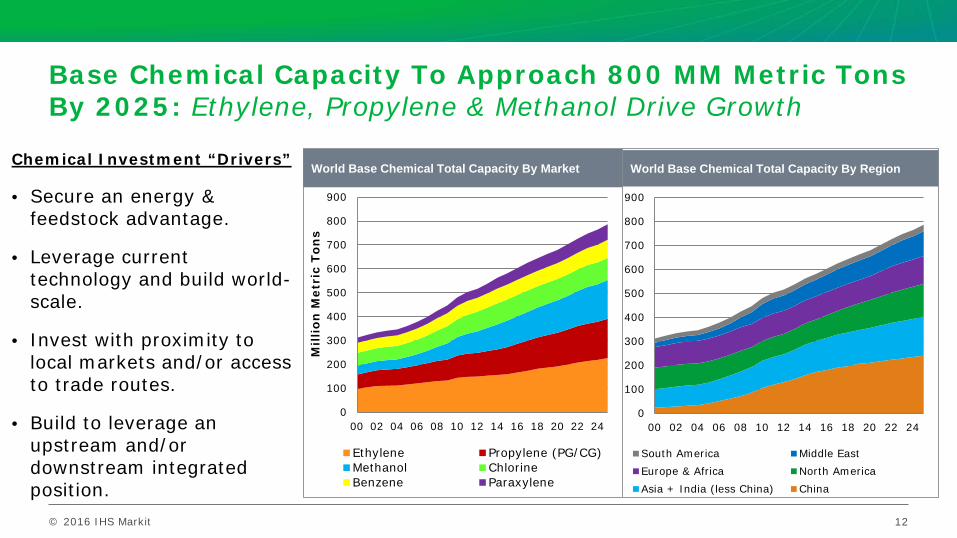
Base Chemical Capacity To Approach 800 MM Metric Tons By 2025: Ethylene, Propylene & Methanol Drive Growth
Chemical Investment “Drivers”
• Secure an energy & feedstock advantage.
• Leverage current technology and build world-scale.
• Invest with proximity to local markets and/or access to trade routes.
• Build to leverage an upstream and/or downstream integrated position.
0
100
200
300
400
500
600
700
800
900
00 02 04 06 08 10 12 14 16 18 20 22 24
Mil
lion
Met
ric
Ton
s
Ethylene Propylene (PG/CG)Methanol ChlorineBenzene Paraxylene
World Base Chemical Total Capacity By Market
12
0
100
200
300
400
500
600
700
800
900
00 02 04 06 08 10 12 14 16 18 20 22 24
South America Middle EastEurope & Africa North AmericaAsia + India (less China) China
World Base Chemical Total Capacity By Region
© 2016 IHS Markit
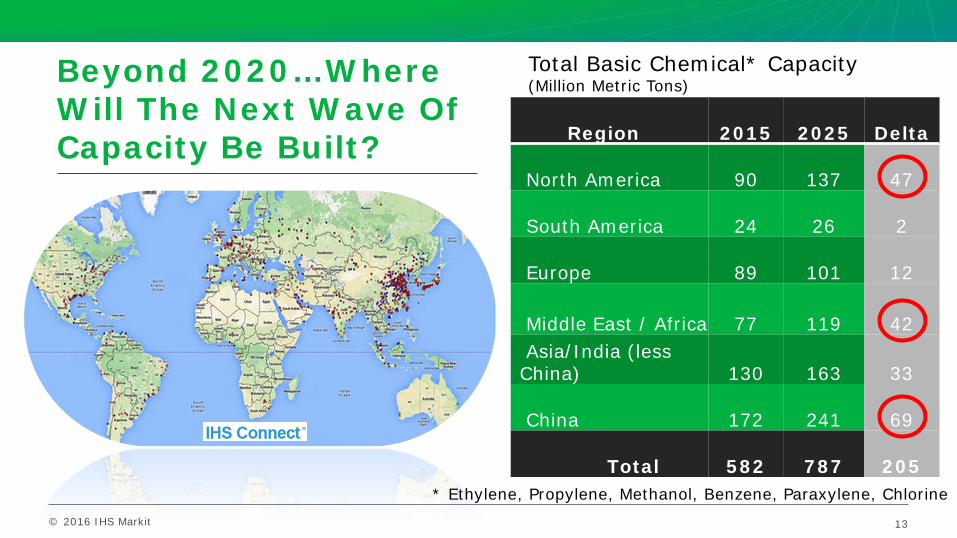
Beyond 2020…Where Will The Next Wave Of Capacity Be Built? Region 2015 2025 Delta
North America
90
137
47
South America
24
26 2
Europe
89
101
12
Middle East / Africa
77
119
42 Asia/India (less China)
130
163
33
China
172
241
69
Total
582
787
205
Total Basic Chemical* Capacity (Million Metric Tons)
* Ethylene, Propylene, Methanol, Benzene, Paraxylene, Chlorine
13
© 2016 IHS Markit
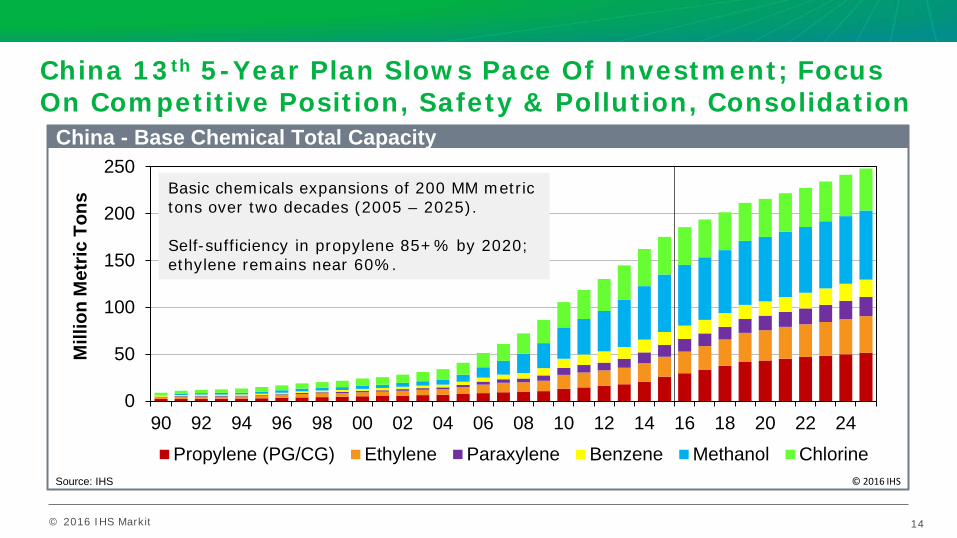
China 13th 5-Year Plan Slows Pace Of Investment; Focus On Competitive Position, Safety & Pollution, Consolidation
0
50
100
150
200
250
90 92 94 96 98 00 02 04 06 08 10 12 14 16 18 20 22 24
Propylene (PG/CG) Ethylene Paraxylene Benzene Methanol Chlorine
China - Base Chemical Total Capacity
Source: IHS © 2016 IHS
Mill
ion
Met
ric T
ons
14
Basic chemicals expansions of 200 MM metric tons over two decades (2005 – 2025). Self-sufficiency in propylene 85+% by 2020; ethylene remains near 60%.
14
© 2016 IHS Markit
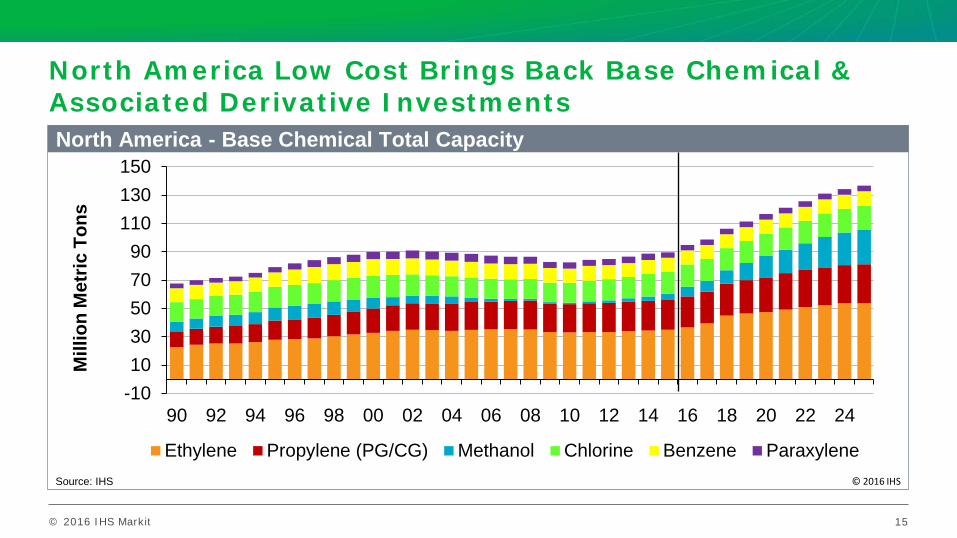
North America Low Cost Brings Back Base Chemical & Associated Derivative Investments
-101030507090
110130150
90 92 94 96 98 00 02 04 06 08 10 12 14 16 18 20 22 24
Ethylene Propylene (PG/CG) Methanol Chlorine Benzene Paraxylene
North America - Base Chemical Total Capacity
Source: IHS © 2016 IHS
Mill
ion
Met
ric T
ons
15
© 2016 IHS Markit
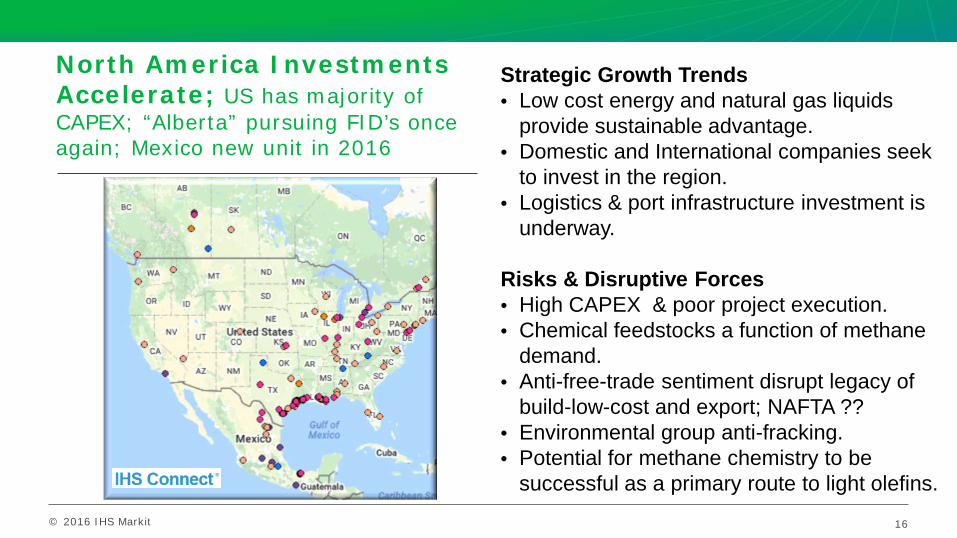
North America Investments Accelerate; US has majority of CAPEX; “Alberta” pursuing FID’s once again; Mexico new unit in 2016
Strategic Growth Trends • Low cost energy and natural gas liquids
provide sustainable advantage. • Domestic and International companies seek
to invest in the region. • Logistics & port infrastructure investment is
underway. Risks & Disruptive Forces • High CAPEX & poor project execution. • Chemical feedstocks a function of methane
demand. • Anti-free-trade sentiment disrupt legacy of
build-low-cost and export; NAFTA ?? • Environmental group anti-fracking. • Potential for methane chemistry to be
successful as a primary route to light olefins.
16
© 2016 IHS Markit
Propylene
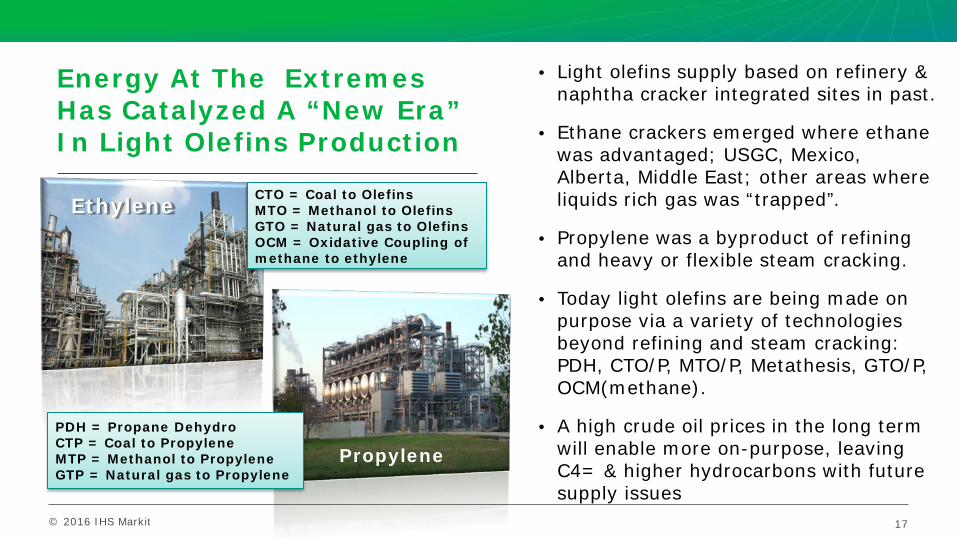
Energy At The Extremes Has Catalyzed A “New Era” In Light Olefins Production
17
• Light olefins supply based on refinery & naphtha cracker integrated sites in past.
• Ethane crackers emerged where ethane was advantaged; USGC, Mexico, Alberta, Middle East; other areas where liquids rich gas was “trapped”.
• Propylene was a byproduct of refining and heavy or flexible steam cracking.
• Today light olefins are being made on purpose via a variety of technologies beyond refining and steam cracking: PDH, CTO/P, MTO/P, Metathesis, GTO/P, OCM(methane).
• A high crude oil prices in the long term will enable more on-purpose, leaving C4= & higher hydrocarbons with future supply issues
Ethylene CTO = Coal to Olefins MTO = Methanol to Olefins GTO = Natural gas to Olefins OCM = Oxidative Coupling of methane to ethylene
PDH = Propane Dehydro CTP = Coal to Propylene MTP = Methanol to Propylene GTP = Natural gas to Propylene
© 2016 IHS Markit
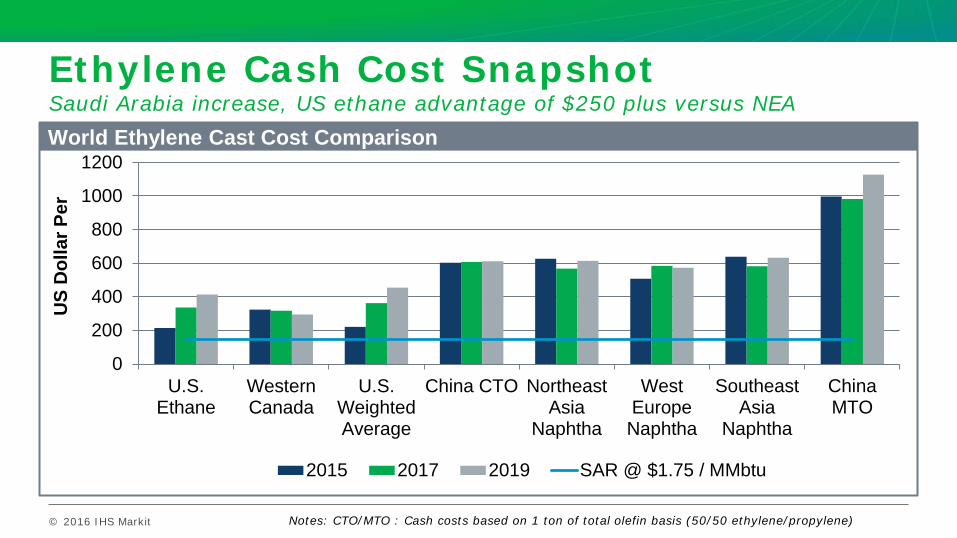
Ethylene Cash Cost Snapshot Saudi Arabia increase, US ethane advantage of $250 plus versus NEA
0
200
400
600
800
1000
1200
U.S.Ethane
WesternCanada
U.S.WeightedAverage
China CTO NortheastAsia
Naphtha
WestEuropeNaphtha
SoutheastAsia
Naphtha
ChinaMTO
2015 2017 2019 SAR @ $1.75 / MMbtu
World Ethylene Cast Cost Comparison
US
Dol
lar P
er
Notes: CTO/MTO : Cash costs based on 1 ton of total olefin basis (50/50 ethylene/propylene)
© 2016 IHS Markit
Ethylene Market Key Issues
19
• New Ethylene Capacity: delayed start up timing of all “first wave” US ethylene units. Pushed out and/or removed MTO, CTO) in China
• Build-cycle Disruption: under investing new capacity during 2020-21 period; supporting margin “up-cycle” .
• Effective Global Operating Rates: expected high over the next 5 years assuming steady economic growth, current new-build profile, unplanned outages.
• Naphtha crackers: required to balance demand; increasing cash cost combined with need for naphtha cracking, push ethylene prices higher.
© 2016 IHS Markit
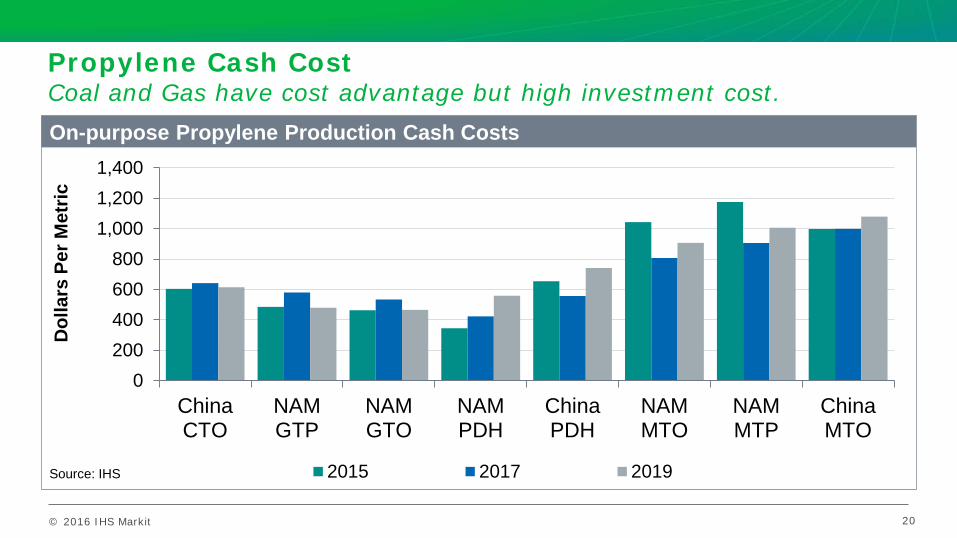
Propylene Cash Cost Coal and Gas have cost advantage but high investment cost.
20
0200400600800
1,0001,2001,400
ChinaCTO
NAMGTP
NAMGTO
NAMPDH
ChinaPDH
NAMMTO
NAMMTP
ChinaMTO
2015 2017 2019
On-purpose Propylene Production Cash Costs
Source: IHS
Dol
lars
Per
Met
ric
© 2016 IHS Markit
Propylene Market Key Issues
Propylene Requires On-Purpose Investment: margins for incremental supply will have to support new investments On-Purpose Technology Will Vary: dependent on regional feedstock advantage - PDH in U.S., Middle East, and Asia along with coal to olefins in China; Chinese PDH units based on propane imports that compete into fuels market. MTP is high cost. Build phase is delayed: investment in North American on-purpose propylene production delayed as questions over energy and the economy persist; “GTP under study”. Regional imbalance causes price volatility: overcapacity in propylene will cause major price shifts regionally but balance out over time. US monomer balance is long, derivatives are tighter. Low prices stimulate demand: propylene demand growth is seeing strength due to ample low cost supplies.
21
© 2016 IHS Markit © 2016 IHS Markit. All Rights Reserved.
Global Energy Markets & Alberta Leveraging the Alberta legacy to attract new waves of petrochemical industry investment
BUILDING ALBERTA'S INNOVATION AND INVESTMENT 18th Annual Stakeholder Luncheon Thursday, January 19, 2017 Edmonton, Alberta, Canada
Mark Eramo, VP Global Business Development Oil / Midstream / Downstream & Chemicals Houston, TX [email protected]
THANK YOU !!


