

Globalisation and the Knowledge Economy – the Case of Ireland
Andrew McDowell
Chief Economist
October 2006

2
MAY 1997MAY 1997
►
1988 1997 2004
The Development of the Irish Economy
3
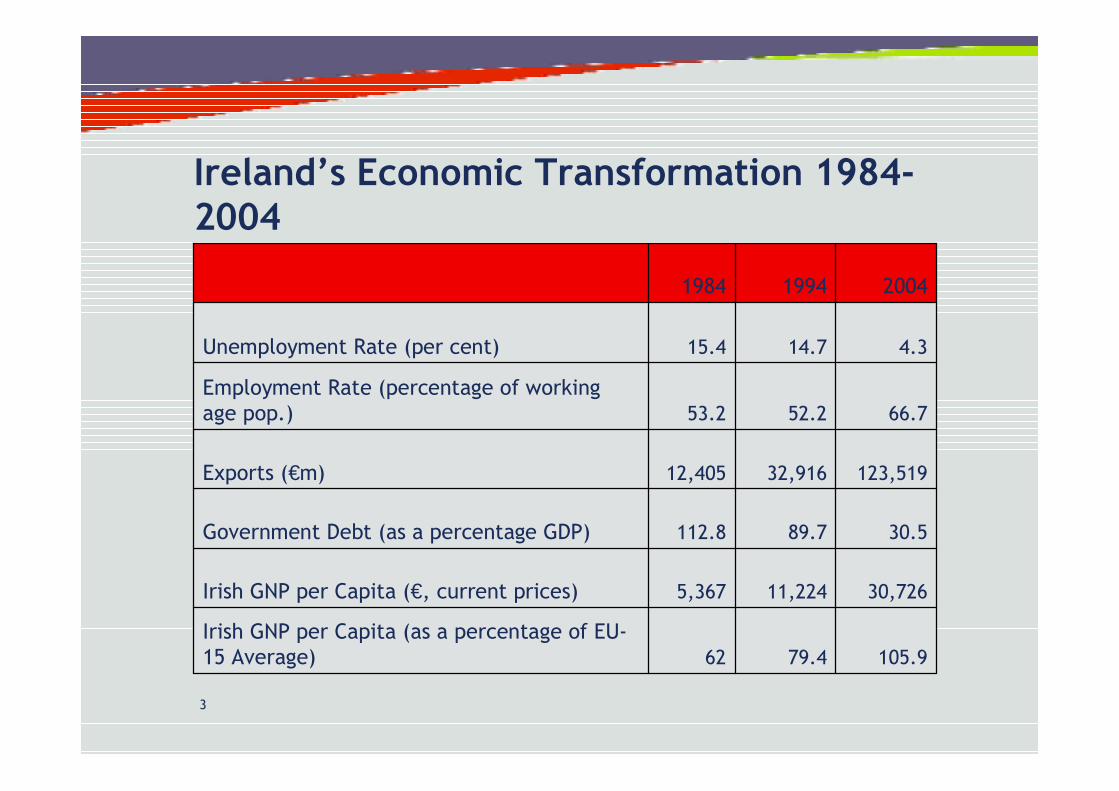
Ireland’s Economic Transformation 1984-2004
105.979.462Irish GNP per Capita (as a percentage of EU-15 Average)
30,72611,2245,367Irish GNP per Capita (€, current prices)
30.589.7112.8Government Debt (as a percentage GDP)
123,51932,91612,405Exports (€m)
66.752.253.2Employment Rate (percentage of working age pop.)
4.314.715.4Unemployment Rate (per cent)
200419941984

4
The Global Economic Landscape is Changing More Rapidly than Ever Before
► Increasing share of services in output and employment, and declining roles of manufacturing and agriculture
► Growing importance of knowledge flows as a driver of economic growth
► Greater foreign ownership► Greater people mobility (skilled and unskilled)► Offshoring

5
The Global Economic Landscape is Changing More Rapidly than Ever Before
► How are these trends affecting Ireland, and how is Irish economic policy responding?
6
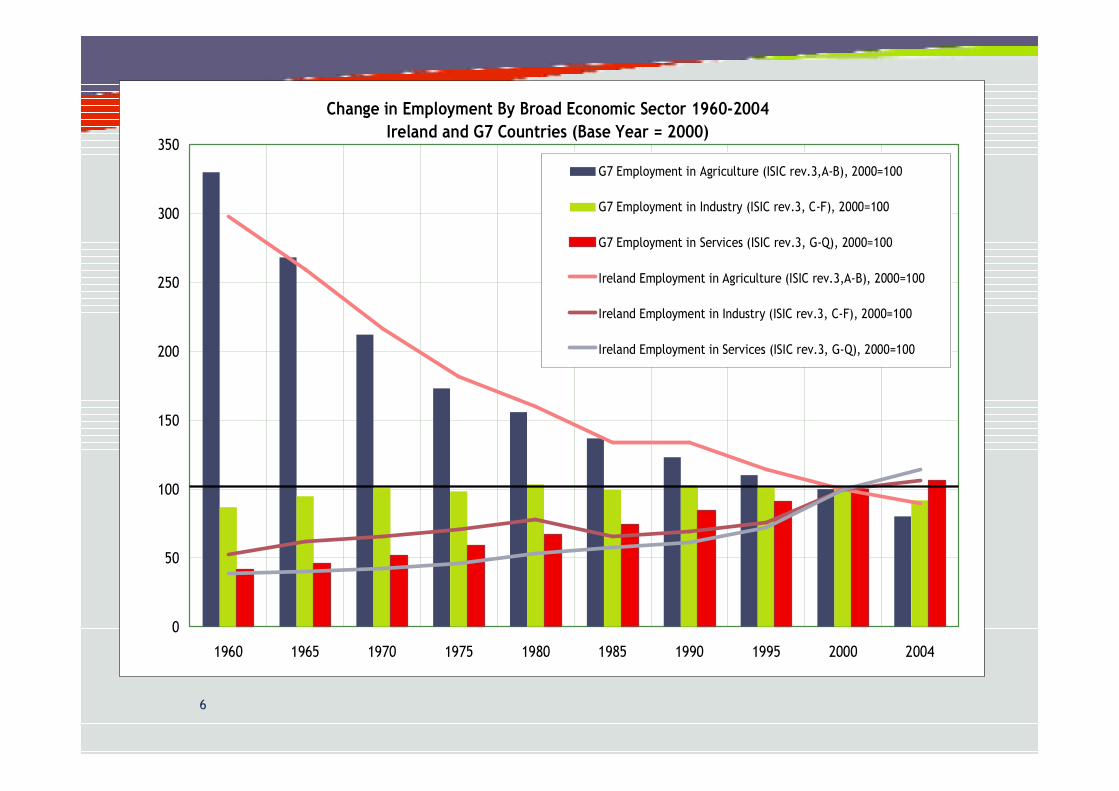
Change in Employment By Broad Economic Sector 1960-2004 Ireland and G7 Countries (Base Year = 2000)
0
50
100
150
200
250
300
350
1960 1965 1970 1975 1980 1985 1990 1995 2000 2004
Thou
sand
s
G7 Employment in Agriculture (ISIC rev.3,A-B), 2000=100
G7 Employment in Industry (ISIC rev.3, C-F), 2000=100
G7 Employment in Services (ISIC rev.3, G-Q), 2000=100
Ireland Employment in Agriculture (ISIC rev.3,A-B), 2000=100
Ireland Employment in Industry (ISIC rev.3, C-F), 2000=100
Ireland Employment in Services (ISIC rev.3, G-Q), 2000=100

7

8
Manufacturing Employment – 1995/2005Select OECD Economies
Share of Manufacturing as % of Total Employment - 1995, 2005*
40.58%
30.06%
26.27%
23.42%
20.88%
16.78%
13.21%
10.11%11.30%
25.84% 25.17%
18.63% 18.00%
27.25%
0%
5%
10%
15%
20%
25%
30%
35%
40%
45%
Czech Rep. Poland Hungary Korea Switzerland Ireland USA
1995 2005*

9
Employment (000s) within Manufacturing, 1995-2005
0 5000 10000 15000 20000 25000 30000 35000 40000 45000 50000
Food& Beverages; Tobacco
Textiles/Leather
Wood/Paper
Chemicals
Materials & Minerals
Electricial Machinery & Euipment
Modern Machinery
Medical, & Optical Instruments
Transport equipment
Manufacturing N.E.C
Number of Employees (000s)
1995 Q4 2000 Q4 2005 Q3

10
Services – Export Performance
Growth in Services and Merchandise Exports (1998-2005) Base Year = 1998
0
50
100
150
200
250
300
350
400
1998 1999 2000 2001 2002 2003 2004 2005
Merchandise
Services

11
0.0%
0.5%
1.0%
1.5%
2.0%
2.5%
3.0%
1993 1994 1995 1996 1997 1998 1999 2000 2001 2002 2003 2004 2005
Services M erchandise
Ireland’s Global Market Share

12
1.20%
1.23%
1.17%
1.49%
2.63%
2.26%
0.21%
0.49%
2.01%
4.78%
0.12%
0.30%
0.40%
0.55%
2.15%
4.34%
1.05%
0.12%
0.66%
0.80%
1.40%
4.10%
0% 1% 2% 3% 4% 5% 6%
Total Merchandise
Total Services
Fuels and Mining
Textiles
Transportation Services
Travel Services
Machinery
Food
Office and Telecom
Other Services
Chemicals
Ranked by 2005 World Market Share
2005
2000
Ireland’s Global Market Share

13
3.15.35.45.6
7.88.08.9
10.612.3
15.015.1
19.520.321.0
31.834.1
63.091.1
102.6
0 20 40 60 80 100 120
JapanItalyUS
KoreaGermany
FranceNetherlands
OECDPolandFinland
SpainNew Zealand
UKSwitzerland
SwedenDenmarkHungary
IrelandSingapore
Number of Greenfield Projects by Destination (per million of population)
FDI Greenfield Projects

14
Export Performance by Ownership
Irish Manufacturing Exports (Agency Assisted Companies) 1995-2004
0
10
20
30
40
50
60
1995 1996 1997 1998 1999 2000 2001 2002 2003 2004
€ Bi
llion
s
Indigenous Foreign Owned Companies

15
Irish FDI Outflows as a % of OECD Outflows
0.0%0.2%0.4%0.6%0.8%1.0%1.2%1.4%1.6%1.8%2.0%
1999 2000 2001 2002 2003 2004 2005Per
cent
age
of O
EC
D FD
I out
flow
s
Ireland FDI Outflow as % OECD FDI Outflow s

16
4.3
-0.2
1.8
3.1
-0.2
0.5
9.4
-0.5
4.2 4.1
-1.0
0.7
-2
0
2
4
6
8
10
Ireland Northern Ireland EU 15 US NEU 10 Japan
Mig
rant
s pe
r 1,0
00 o
f pop
ulat
ion
1995-1999 2000-2004
People Mobility

17
Emerging Policy Developments / Challenges
► Industrial policy►Research/ innovation policy►Fiscal/tax policy►Labour market policy►Regional policy/land and infrastructure planning►Education and training

18
Industrial Policy
► Continued pro-active / well resourced / highly skilled industrial development agencies
► Manufacturing – no special policy supports► FDI – no backlash after 2000 downturn► New EU state aid disciplines – gradual shift to
environmental/ R&D /skills supports► Mobile R&D investments - IDA/SFI partnership ► Smaller indigenous industry – policy emphasis on export
promotion, mgt. development, risk capital market development and R&D supports
► Outsourcing – policy neutral approach – some “soft support” for ODI for market development

19
Research / Innovation Policy
►Science Foundation Ireland►Creation of “4th level” education system -
doubling of PhD graduates by 2013►New university codes for management of IP
from publicly funded research►Coherence between research funding priorities
and industrial strategy►SME and services innovation policy?►Universities and applied research?

20
Fiscal Policy
►Global competition demands both higher spending on physical/ knowledge infrastructure and social supports and competitive tax rates• Greater pressure for public sector efficiencies• New financing models for infrastructure (user charges)• Shift from direct to indirect taxes (VAT, property)
►Corporate tax competition►Taxation of R&D and intellectual property►Extension of tax treaty network

21
Labour Market Policy
►Economic restructuring• Current forecasts suggest absolute declines in
employment only for farm workers and plant and machinery operators – natural demographic churn
► Immigration• Open access to new EU Members since 2004• New “green card” system for skilled non-EU migrants
►Hiring and firing• New protections against dislocation by immigrants• Social welfare replacement rates remain low• Application of Danish flexicurity model to Ireland?

22
Regional Policy / Land Planning
►Clustering of high-skilled jobs in urban areas► Increasing importance of creating attractive
metropolitan areas – social/cultural/ recreational infrastructure
►Rapidly rising urban land prices►More integrated land/transport planning►National Spatial Strategy►Rural economy? Continued direct and indirect
subsidies for agriculture, tourism, fisheries

23
Education and Training
►Education• Need to address polarisation of education outcomes• Need to complement academic system of education
with vocational stream• Growing demand for graduates – 65% of school leavers
to go on to higher education• Increasing emphasis on “soft generic” skills –
communications, team-working, conceptual
►Upskilling• National Training Fund• SkillNets

24
Responding to Change
“When the pace of change on the outside exceeds the pace of change on the inside then the end is in sight”
………………….Jack Welsh


