

GVDA Instrumentation Guide
Prepared by The Institute for Crustal Studies, UCSB.
Copyright 2008
Revision 1.5 1/30/08
Section I: Overview
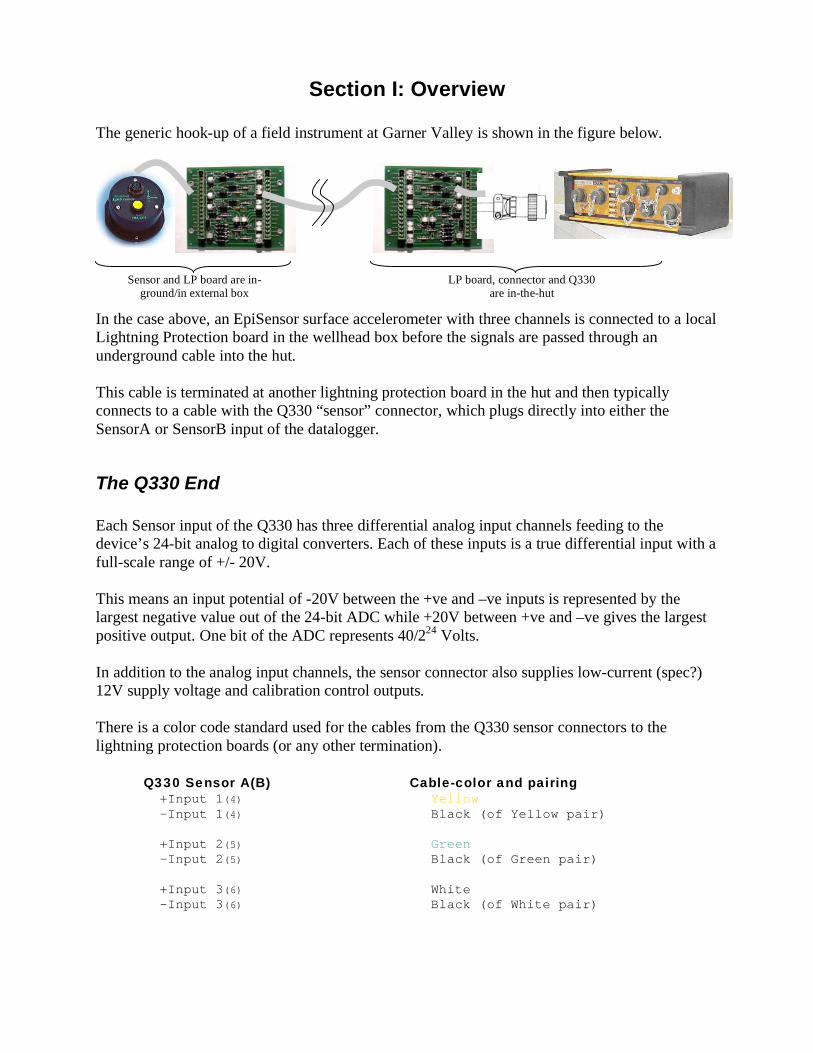
The generic hook-up of a field instrument at Garner Valley is shown in the figure below.
In the case above, an EpiSensor surface accelerometer with three channels is connected to a local
Lightning Protection board in the wellhead box before the signals are passed through an
underground cable into the hut.
This cable is terminated at another lightning protection board in the hut and then typically
connects to a cable with the Q330 “sensor” connector, which plugs directly into either the
SensorA or SensorB input of the datalogger.
The Q330 End
Each Sensor input of the Q330 has three differential analog input channels feeding to the
device’s 24-bit analog to digital converters. Each of these inputs is a true differential input with a
full-scale range of +/- 20V.
This means an input potential of -20V between the +ve and –ve inputs is represented by the
largest negative value out of the 24-bit ADC while +20V between +ve and –ve gives the largest
positive output. One bit of the ADC represents 40/224
Volts.
In addition to the analog input channels, the sensor connector also supplies low-current (spec?)
12V supply voltage and calibration control outputs.
There is a color code standard used for the cables from the Q330 sensor connectors to the
lightning protection boards (or any other termination).
Q330 Sensor A(B) Cable-color and pairing +Input 1(4) Yellow
-Input 1(4) Black (of Yellow pair)
+Input 2(5) Green
-Input 2(5) Black (of Green pair)
+Input 3(6) White
-Input 3(6) Black (of White pair)
Sensor and LP board are in-ground/in external box
LP board, connector and Q330 are in-the-hut
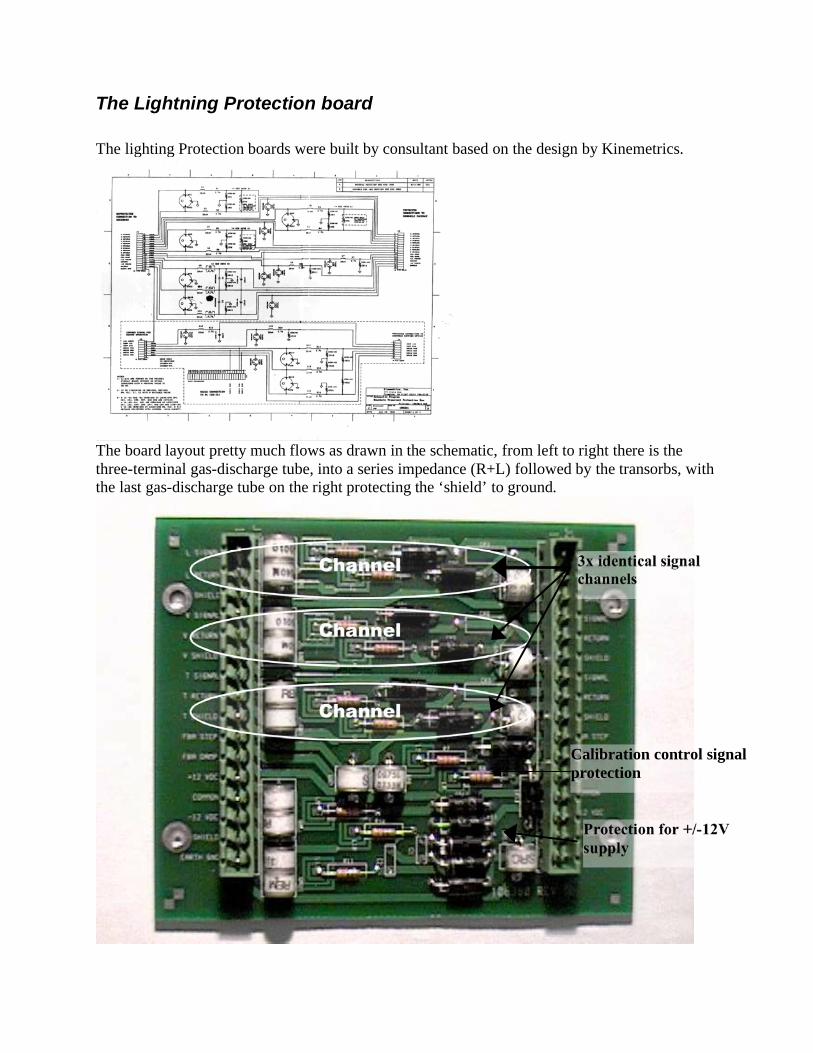
The Lightning Protection board
The lighting Protection boards were built by consultant based on the design by Kinemetrics.
The board layout pretty much flows as drawn in the schematic, from left to right there is the
three-terminal gas-discharge tube, into a series impedance (R+L) followed by the transorbs, with
the last gas-discharge tube on the right protecting the ‘shield’ to ground.
Channel
Channel
Channel
3x identical signal
channels
Protection for +/-12V
supply
Calibration control signal
protection
Channel Assignments
The ideal situation is to have tri-axial accelerometers correctly oriented to true-north, in this case
the three channels would properly represent acceleration in the Up, North and East directions, in
Cartesian terms these are the Z, Y and X axes.
When an instrument has not been installed with correct compass alignment the three channels are
referred to as V(ertical), (L)ongitudinal and (T)ransverse corresponding to the Z, Y and X
directions respectively.
The convention for datalogger channel assignment is the Z (up) direction is channel 1, the Y (or
nominally north) is channel 2 and the X (or easterly) is channel 3. (When single-channel
transducers, pressure transducers etc., are used then a channel is just a channel.)
Sensor Direction (True) LVT Mapping Q330 Channel#
Z (up = positive) V (z) 1 (4) Yellow
N-S (north= positive) L (y) 2 (5) Green
E-W (east = positive) T (x) 3 (6) White
Thus, wiring from the sensors to the Q330s through the lightning protection etc. should map
from sensor-axis to Q330 channel so as to assign up-down to channel#1, north-south to
channel#2, east-west to channel#3.
Legacy wiring at Garner valley thwarts this convention with many of the old sensors swapping
the channel assignment for the “L” and “T” channels, though over the coming months there will
be an effort to minimize any irregularities.
Legacy silkscreen on some lightning protection boards further confuses the clarity of wiring.
Every effort will be made to standardize the sequencing of wiring through LP boards so that
from top-to-bottom the channel wiring will be 1,2,3 (for a tri-axial accelerometer that would
ideally mean Z,N,E).
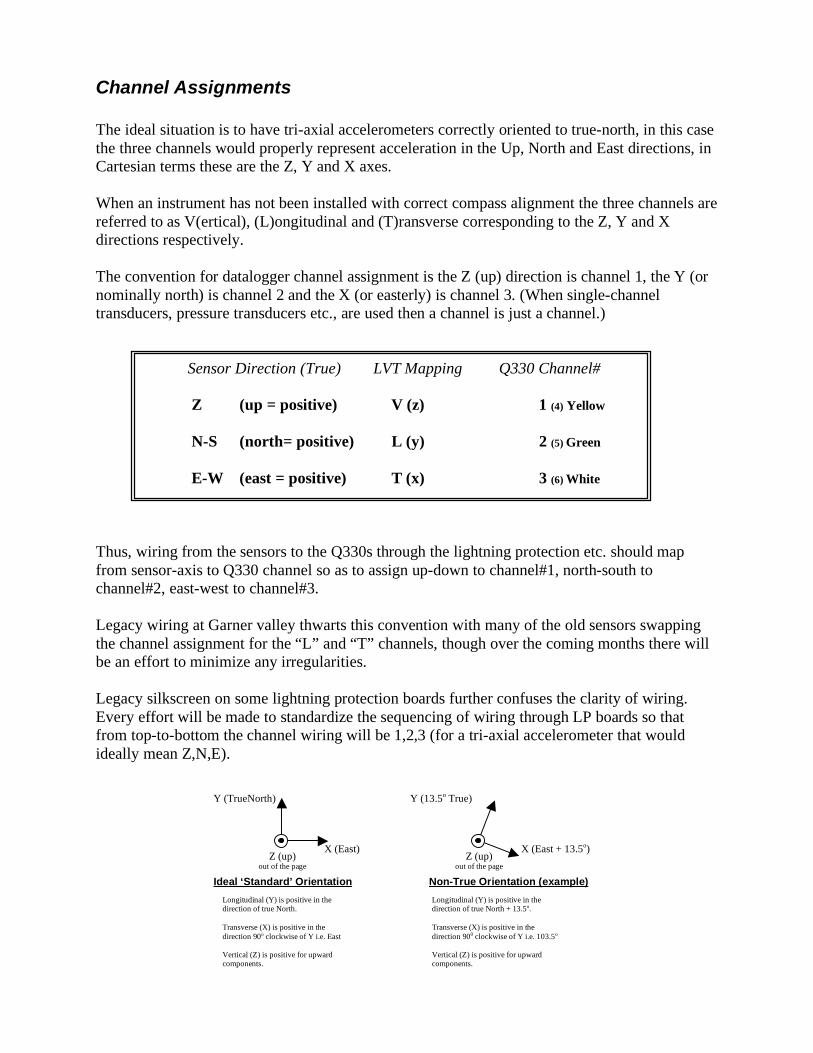
Z (up) out of the page
Y (TrueNorth)
Ideal ‘Standard’ Orientation
X (East)
Non-True Orientation (example)
Z (up) out of the page
Y (13.5o True)
X (East + 13.5o)
Longitudinal (Y) is positive in the direction of true North.
Transverse (X) is positive in the
direction 90o clockwise of Y i.e. East
Vertical (Z) is positive for upward components.
Longitudinal (Y) is positive in the direction of true North + 13.5o.
Transverse (X) is positive in the
direction 900 clockwise of Y i.e. 103.5o
Vertical (Z) is positive for upward components.

Section II : The GVDA Hut
The south wall of the hut has the shelves holding the Q330 dataloggers and the networking
equipment. Adjacent and in-line with the Q330s are the Lightning Protection boards where the
sensor cables terminate in the hut. The photo-montage below shows the basic layout.
The power-supply for the sensors is routed through the +/-12V channels of the LP boards.
LQ9,WL1,BP1
501M
150M
S00
S3E
S2E
PT5,7,9
6M
PT4,6,8
S1W
n/a
LQ1,n/a,n/a
S1E
S00-MEMS
50M
15M
LQ2,3,4
22M
GVDA
GVA05
GVA04
GVA02
GVA07 GVA03
GVA01
GVA06
GVA08
Power Supply Set-up
The power-supply system at GVDA has backup redundancy in two ways. The main supply is
metered AC power from Anza Electric, additionally there is an auto-start generator on site which
kicks-in if main power fails and finally all major data-acquisition systems also have battery back-
up.
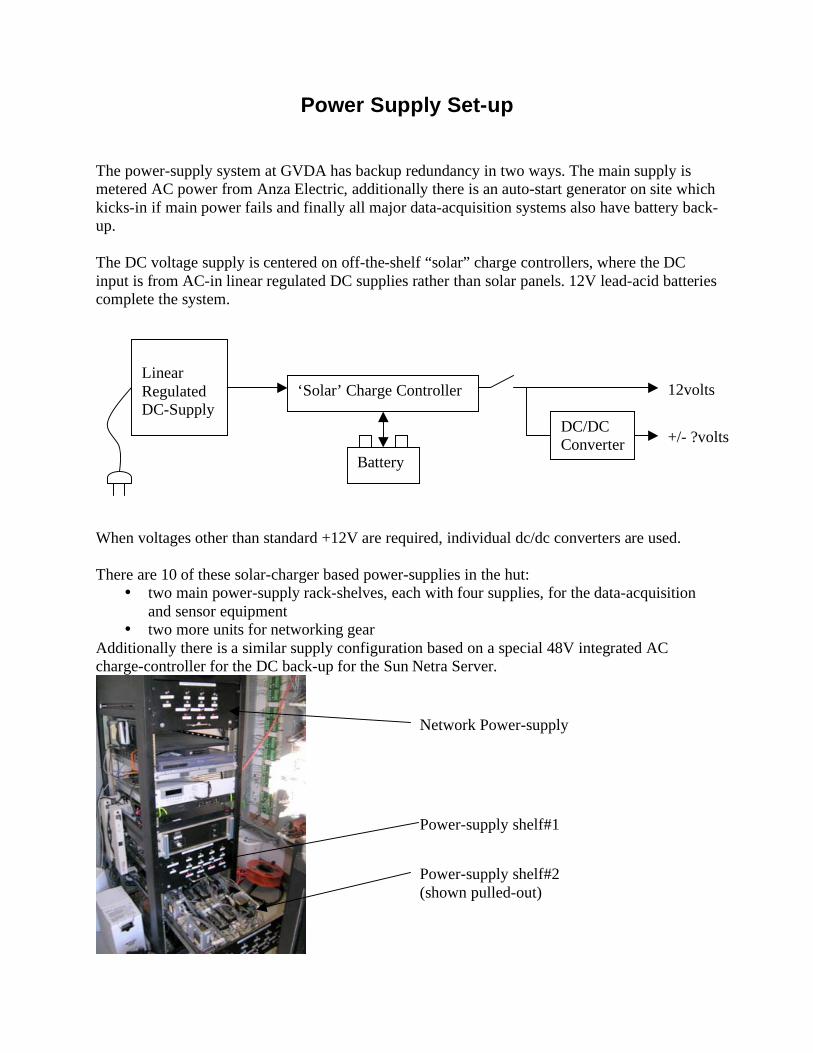
The DC voltage supply is centered on off-the-shelf “solar” charge controllers, where the DC
input is from AC-in linear regulated DC supplies rather than solar panels. 12V lead-acid batteries
complete the system.
When voltages other than standard +12V are required, individual dc/dc converters are used.
There are 10 of these solar-charger based power-supplies in the hut:
• two main power-supply rack-shelves, each with four supplies, for the data-acquisition
and sensor equipment
• two more units for networking gear
Additionally there is a similar supply configuration based on a special 48V integrated AC
charge-controller for the DC back-up for the Sun Netra Server.
Linear
Regulated
DC-Supply
‘Solar’ Charge Controller
Battery
DC/DC
Converter +/- ?volts
12volts
Power-supply shelf#1
Network Power-supply
Power-supply shelf#2
(shown pulled-out)
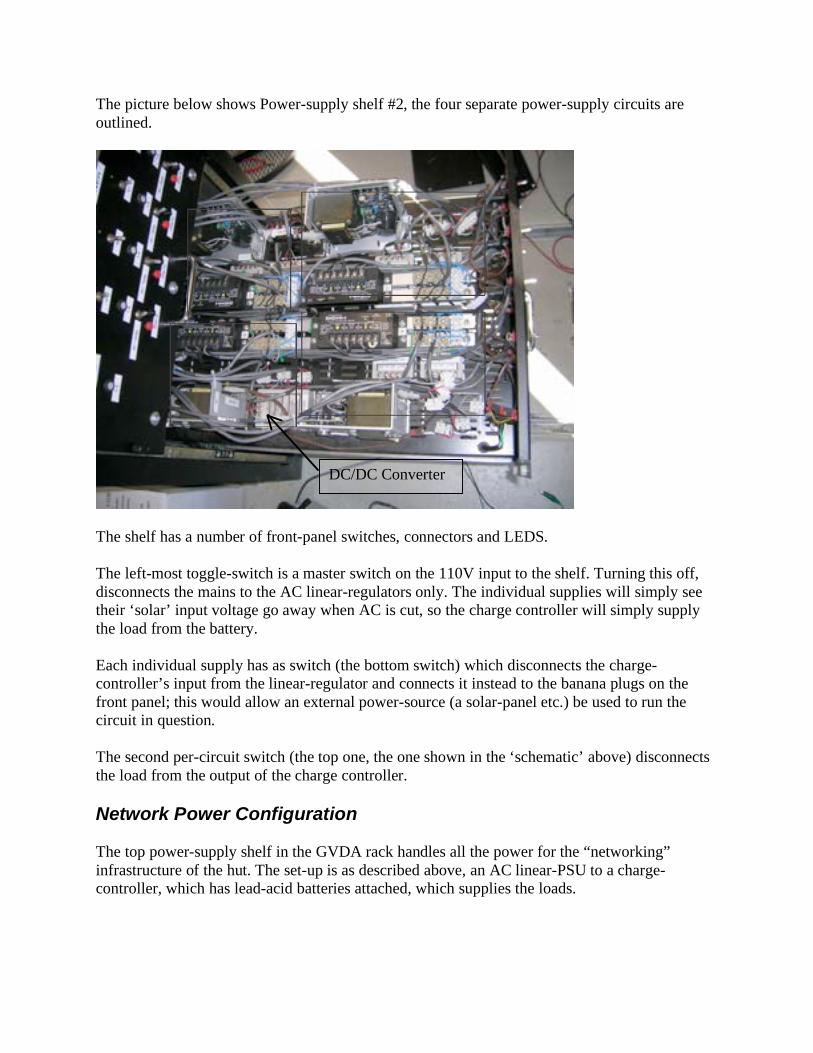
The picture below shows Power-supply shelf #2, the four separate power-supply circuits are
outlined.
The shelf has a number of front-panel switches, connectors and LEDS.
The left-most toggle-switch is a master switch on the 110V input to the shelf. Turning this off,
disconnects the mains to the AC linear-regulators only. The individual supplies will simply see
their ‘solar’ input voltage go away when AC is cut, so the charge controller will simply supply
the load from the battery.
Each individual supply has as switch (the bottom switch) which disconnects the charge-
controller’s input from the linear-regulator and connects it instead to the banana plugs on the
front panel; this would allow an external power-source (a solar-panel etc.) be used to run the
circuit in question.
The second per-circuit switch (the top one, the one shown in the ‘schematic’ above) disconnects
the load from the output of the charge controller.
Network Power Configuration
The top power-supply shelf in the GVDA rack handles all the power for the “networking”
infrastructure of the hut. The set-up is as described above, an AC linear-PSU to a charge-
controller, which has lead-acid batteries attached, which supplies the loads.
DC/DC Converter

There are two separate ‘Network Supplies’ on the shelf labeled “Network A” and “Network B”.
Circuit Load Battery
WiLAN Radio
Router
Right-hand Ethernet switch
Rocksite comms
Remote-relay control
Network A
HPWREN ADAM
Connected to 4 batteries in
parallel in battery-shack.
Network B Marmot
Right-hand Ethernet switch
Modem
Connected to 2 batteries in
parallel in bottom of rack.
The breakout for each of these supplies is in the caterpillar above the Q330 shelves, see photos
below…
Section III: Site Layout
This section lists each sensor in turn with pictures and notes about actual cable coloring, actual
LP board wiring and any other physical information of relevance.
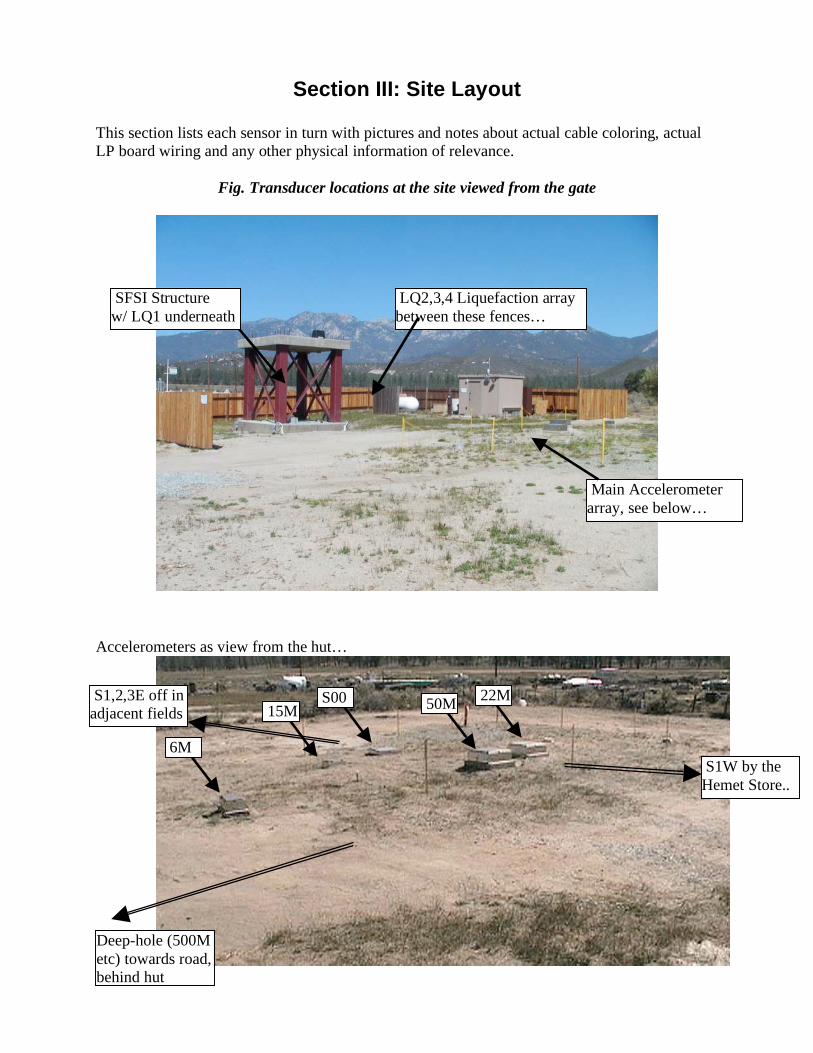
Fig. Transducer locations at the site viewed from the gate
Accelerometers as view from the hut…
S00 15M
6M
50M
S1W by the
Hemet Store..
Deep-hole (500M
etc) towards road,
behind hut
22M S1,2,3E off in
adjacent fields
Main Accelerometer
array, see below…
SFSI Structure
w/ LQ1 underneath
LQ2,3,4 Liquefaction array
between these fences…
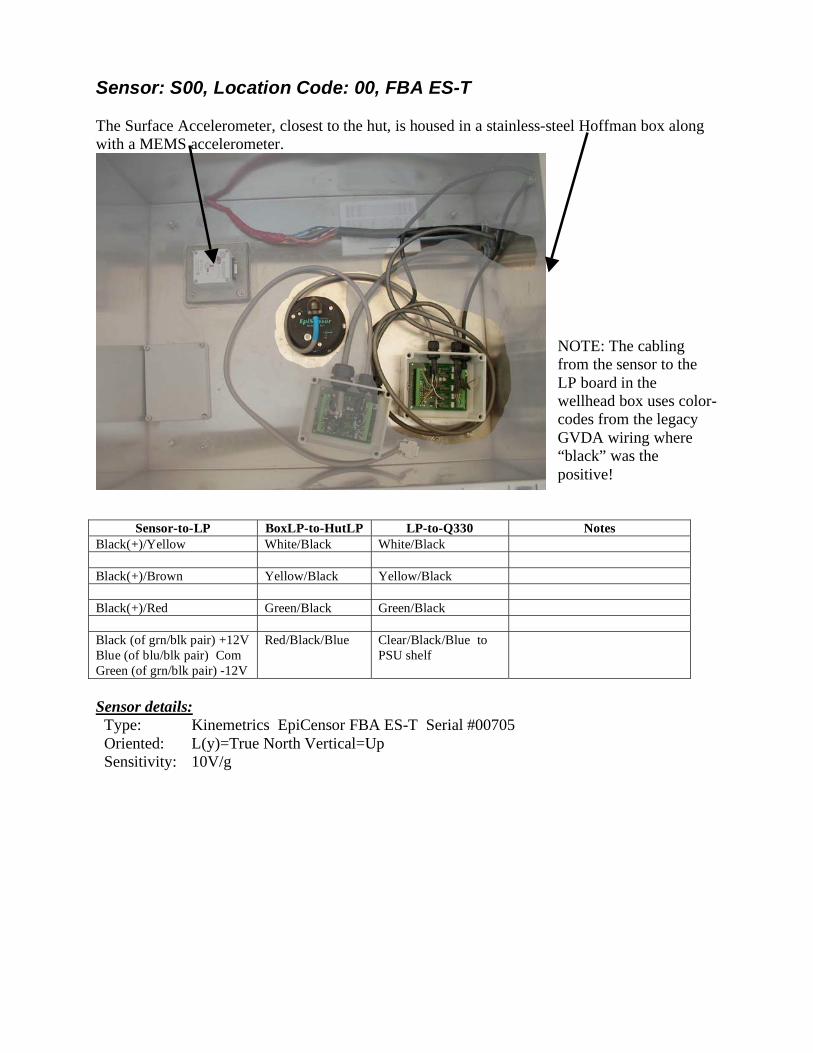
Sensor: S00, Location Code: 00, FBA ES-T
The Surface Accelerometer, closest to the hut, is housed in a stainless-steel Hoffman box along
with a MEMS accelerometer.
NOTE: The cabling
from the sensor to the
LP board in the
wellhead box uses color-
codes from the legacy
GVDA wiring where
“black” was the
positive!
Sensor-to-LP BoxLP-to-HutLP LP-to-Q330 Notes
Black(+)/Yellow White/Black White/Black
Black(+)/Brown Yellow/Black Yellow/Black
Black(+)/Red Green/Black Green/Black
Black (of grn/blk pair) +12V
Blue (of blu/blk pair) Com
Green (of grn/blk pair) -12V
Red/Black/Blue Clear/Black/Blue to
PSU shelf
Sensor details:
Type: Kinemetrics EpiCensor FBA ES-T Serial #00705
Oriented: L(y)=True North Vertical=Up
Sensitivity: 10V/g
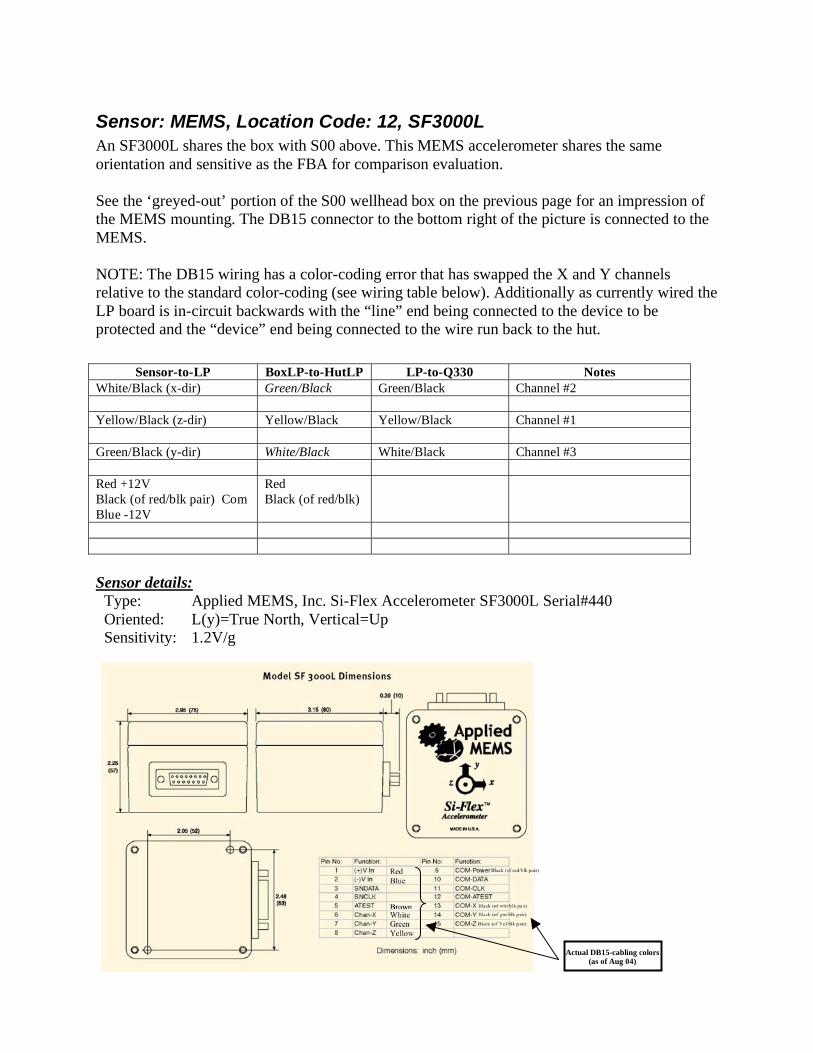
Sensor: MEMS, Location Code: 12, SF3000L
An SF3000L shares the box with S00 above. This MEMS accelerometer shares the same
orientation and sensitive as the FBA for comparison evaluation.
See the ‘greyed-out’ portion of the S00 wellhead box on the previous page for an impression of
the MEMS mounting. The DB15 connector to the bottom right of the picture is connected to the
MEMS.
NOTE: The DB15 wiring has a color-coding error that has swapped the X and Y channels
relative to the standard color-coding (see wiring table below). Additionally as currently wired the
LP board is in-circuit backwards with the “line” end being connected to the device to be
protected and the “device” end being connected to the wire run back to the hut.
Sensor details:
Type: Applied MEMS, Inc. Si-Flex Accelerometer SF3000L Serial#440
Oriented: L(y)=True North, Vertical=Up
Sensitivity: 1.2V/g
Sensor-to-LP BoxLP-to-HutLP LP-to-Q330 Notes
White/Black (x-dir) Green/Black Green/Black Channel #2
Yellow/Black (z-dir) Yellow/Black Yellow/Black Channel #1
Green/Black (y-dir) White/Black White/Black Channel #3
Red +12V
Black (of red/blk pair) Com
Blue -12V
Red
Black (of red/blk)
Yellow
Green
White Brown Brown
Red
Blue
Black (of wht/blk pair)
Black (of grn/blk pair)
Black (of Yel/blk pair)
Black (of red/blk pair)
Actual DB15-cabling colors
(as of Aug 04)
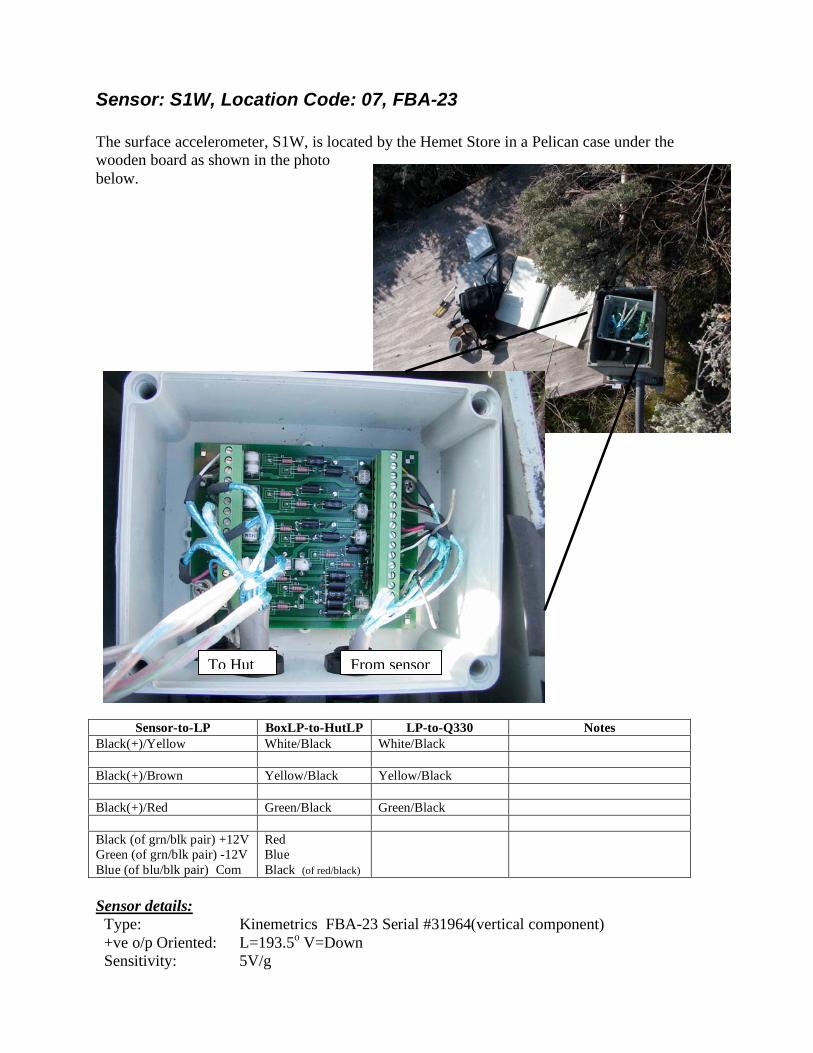
Sensor: S1W, Location Code: 07, FBA-23
The surface accelerometer, S1W, is located by the Hemet Store in a Pelican case under the
wooden board as shown in the photo
below.
Sensor details:
Type: Kinemetrics FBA-23 Serial #31964(vertical component)
+ve o/p Oriented: L=193.5o V=Down
Sensitivity: 5V/g
Sensor-to-LP BoxLP-to-HutLP LP-to-Q330 Notes
Black(+)/Yellow White/Black White/Black
Black(+)/Brown Yellow/Black Yellow/Black
Black(+)/Red Green/Black Green/Black
Black (of grn/blk pair) +12V
Green (of grn/blk pair) -12V
Blue (of blu/blk pair) Com
Red
Blue
Black (of red/black)
From sensor To Hut
Sensor: S1E, Location Code: 08, EPI ES-T (SN#2491)
Sensor: S2E, Location Code: 09, EPI ES-T (SN#732)
Sensor: S3E, Location Code: 10, FBA 23 (SN#31973(vertical component))
Surface accelerometers in the field to the east of the hut that form a linear surface array with
S1W and S00 sensors.
FBA 23’s physically oriented to true-north but generate positive output for south and down
accelerations with a sensitivity of 5V/g. The EPIs are oriented to true-north but generate positive
output for North, up and east accelerations with a sensitivity of 10V/g.
Sensor: 6M, Location Code: 01, FBA 23 DH
Sensor details:
Type: Kinemetrics FBA-23 DH Serial #45529(vertical component)
+ve o/p Oriented: L=180o V=Down
Sensitivity: 5V/g
Sensor: 15M, Location Code: 02, FBA 23 DH
Sensor details:
Type: Kinemetrics FBA-23 DH Serial #38283(vertical component)
+ve o/p Oriented: L=98o V=Up
Sensitivity: 5V/g
Sensor: 50M, Location Code: 04, FBA 23 Special
Sensor details:
Type: Kinemetrics FBA-23 Special Serial #35627(vertical component)
+ve o/p Oriented: L=23.5o V=Up
Sensitivity: 5V/g
Sensor: 501M, Location Code: 06, FBA 23 Special
Sensor details:
Type: Kinemetrics FBA-23 Serial #33738(vertical component)
+ve o/p Oriented: L=166.9o V=Up
Sensitivity: 5V/g

Sensor: 22M, Location Code: 03, Planned
Sensor: 150M, Location Code: 05, Hypo-Sensor SN#181 10V/g
Sensor: 500M, Location Code: 11, Decommissioned

Sensor: PT4 to 9, Location Code: 43 to 48, KPSI Model-30-432-10100
A collection of pore-pressure transducers in the 500M borehole at various depths.
Each sensor is wired into the Lightning Protection box and then back to the hut in a multi-pair
cable.
All sensors are 0 to 100PSIA input for an analog output of 0-5V.
Sensor Depth/Serial # Serial # Loc-code/Cable-pair
PT4 0m 0700988 43 blk/orn
PT5 333m 0709085 44 blk/red
PT6 339m 0709084 45 blk/yel
PT7 417m 0709083 46 red/grn
PT8 428m 0709082 47 blk/wht
PT9 494m 0700989 48 blk/brn
Sensor: LQ9, Location Code: 68, Druck PDCR 940, 0 – 50PSIG
Seems to be faulty…
At a depth of 12.4m.
Output 0 to 0.1V
Serial# 881401
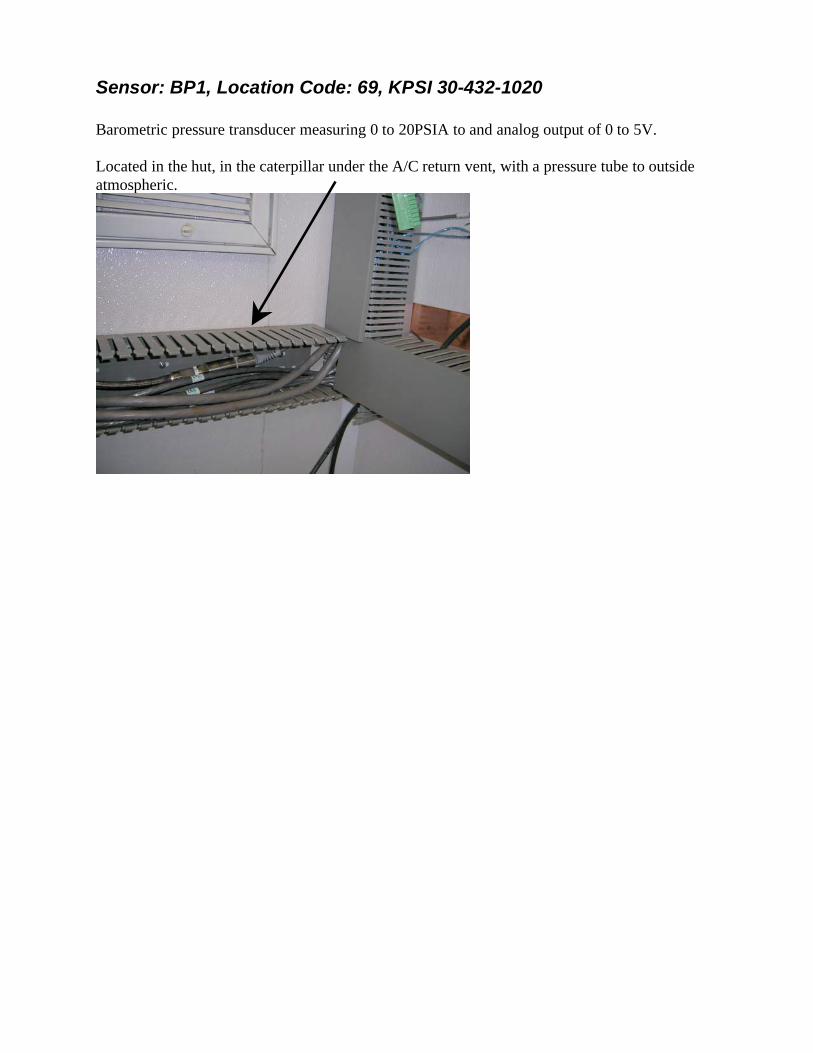
Sensor: BP1, Location Code: 69, KPSI 30-432-1020
Barometric pressure transducer measuring 0 to 20PSIA to and analog output of 0 to 5V.
Located in the hut, in the caterpillar under the A/C return vent, with a pressure tube to outside
atmospheric.
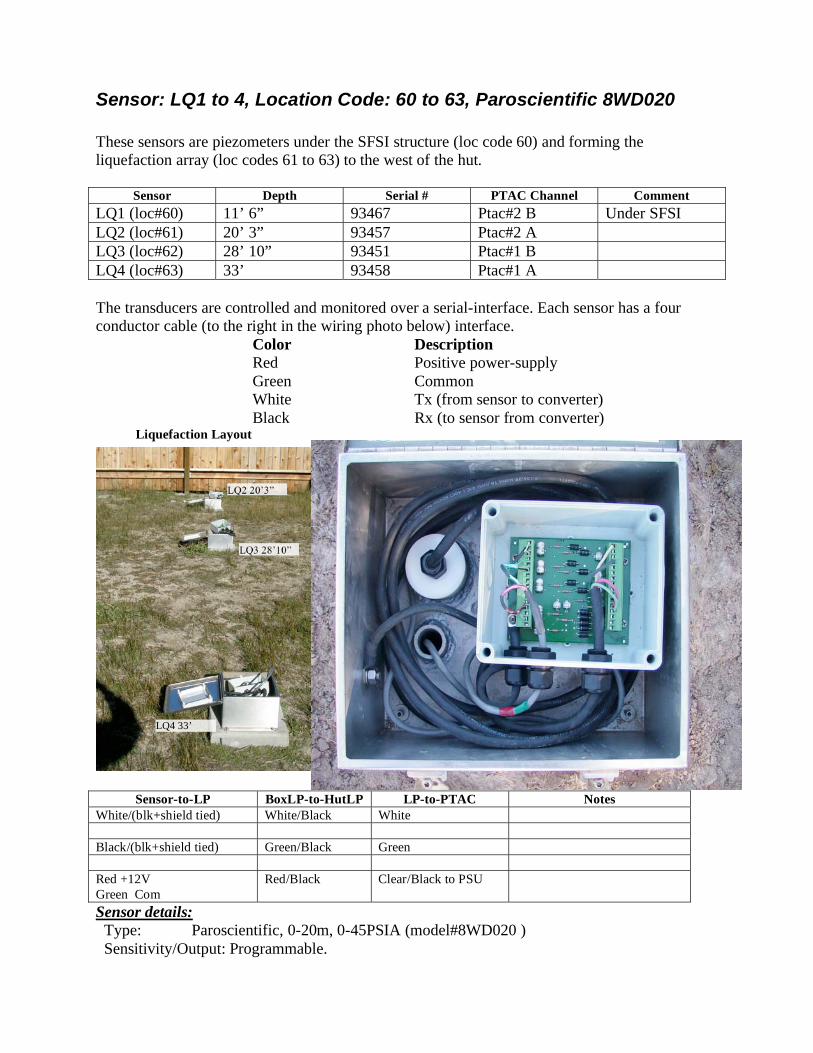
Sensor: LQ1 to 4, Location Code: 60 to 63, Paroscientific 8WD020
These sensors are piezometers under the SFSI structure (loc code 60) and forming the
liquefaction array (loc codes 61 to 63) to the west of the hut.
Sensor Depth Serial # PTAC Channel Comment
LQ1 (loc#60) 11’ 6” 93467 Ptac#2 B Under SFSI
LQ2 (loc#61) 20’ 3” 93457 Ptac#2 A
LQ3 (loc#62) 28’ 10” 93451 Ptac#1 B
LQ4 (loc#63) 33’ 93458 Ptac#1 A
The transducers are controlled and monitored over a serial-interface. Each sensor has a four
conductor cable (to the right in the wiring photo below) interface.
Color Description
Red Positive power-supply
Green Common
White Tx (from sensor to converter)
Black Rx (to sensor from converter) Liquefaction Layout
Sensor-to-LP BoxLP-to-HutLP LP-to-PTAC Notes
White/(blk+shield tied) White/Black White
Black/(blk+shield tied) Green/Black Green
Red +12V
Green Com
Red/Black Clear/Black to PSU
Sensor details:
Type: Paroscientific, 0-20m, 0-45PSIA (model#8WD020 )
Sensitivity/Output: Programmable.
LQ2 20’3”
LQ3 28’10”
LQ4 33’
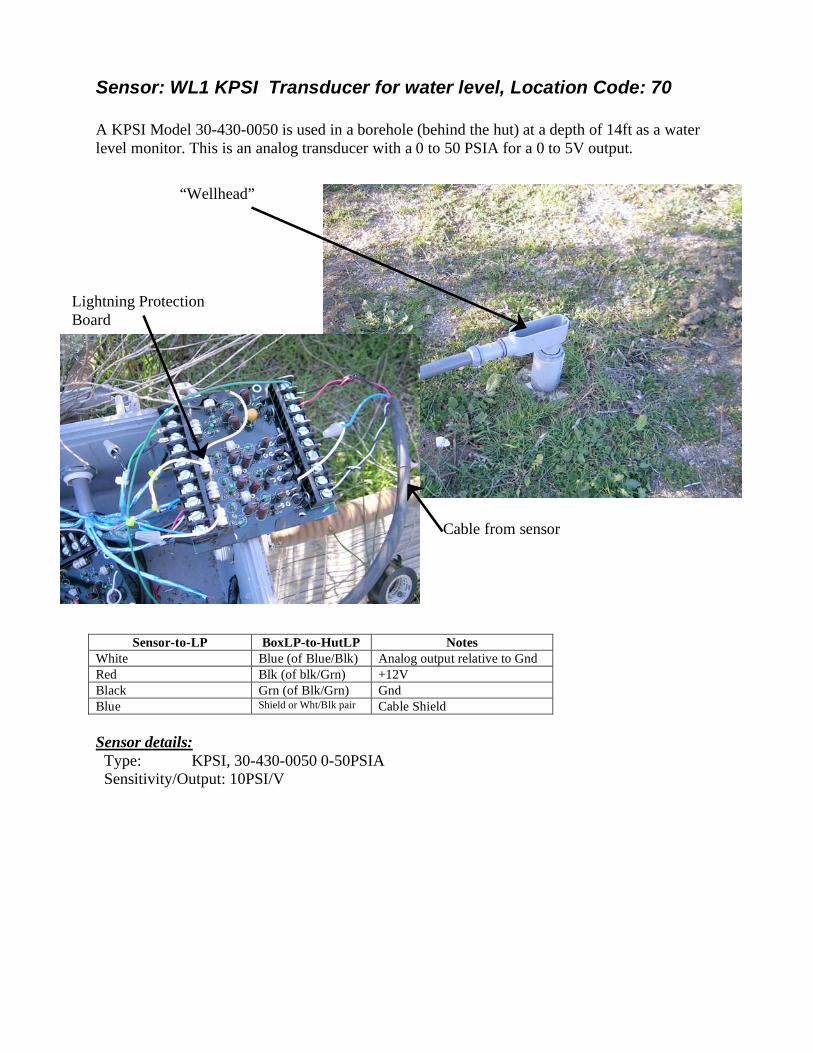
Sensor: WL1 KPSI Transducer for water level, Location Code: 70
A KPSI Model 30-430-0050 is used in a borehole (behind the hut) at a depth of 14ft as a water
level monitor. This is an analog transducer with a 0 to 50 PSIA for a 0 to 5V output.
Sensor-to-LP BoxLP-to-HutLP Notes
White Blue (of Blue/Blk) Analog output relative to Gnd
Red Blk (of blk/Grn) +12V
Black Grn (of Blk/Grn) Gnd
Blue Shield or Wht/Blk pair Cable Shield
Sensor details:
Type: KPSI, 30-430-0050 0-50PSIA
Sensitivity/Output: 10PSI/V
Cable from sensor
Lightning Protection
Board
“Wellhead”

Appendix I: Note on gain calculations
This Appendix shows examples of the calculation mechanisms for finding gain, ‘calib’ etc.
values associated with cascaded stages in typical data-acquisition configurations….
Accelerometers
For accelerometers the device will be specified as volts-out per “g”, in other words the analog
output voltage generate by a physical acceleration of 1g.
To convert this to volts per m/s2, just remember “g” = 9.80665 m/s
2 (NIST value)
So if an Episensor is rated as 10V/2g then the gain is 10V/(2x9.806)m/s2 = 0.50989 V/(m/s
2)
To convert to nanometers remember 1nm = 1x10⁻⁹
m or m=1x10⁹nm. Thus for the example
above, the Episensor gain is 5.0989x10⁻¹⁰
V/(nm/s2)
If this signal is feed into a Q330 datalogger, the analog signal will be sampled by a 24-bit ADC
which has a full-scale input range of 40V. In other words the sensitivity of the ADC is 40V/224
counts or one count is equivalent to an input voltage of 2.384x10⁻⁶
V put another way the
datalogger gain is 2.384x10⁻⁶
V/count
Putting these stage gains together, the system gain can be seen to be
5.0989x10⁻¹⁰
V/(nm/s2) * (1/2.384x10
-6) count/V = 0.00021388 count/(nm/s
2)
And that’s equivalent to the factor for mapping ADC value (counts) to acceleration (calib)…
4675.518 (nm/s2)/count
It is expected that schema rt1.0 SEGTYPE of “A” will be used for accelerometers which
represents data in nm/s2.

Pressure Transducers
When dealing with a Paroscientific pressure transducer the calculation of system gain is
complicated by the configurability of the transducer and the ‘PTAC’ data converter combination.
The PTAC output voltage range is 0 to 10V, however the pressure range that maps to this full-
scale output range is programmable by setting a low pressure that will map to 0V output and a
high-pressure that will map to 10V with the range between mapped linearly. Additionally the
pressure units used is programmable into the transducers.
Thus 0 to 10V is configured to map to Low (pressure-units) to High (pressure-units) meaning the
instrument gain is given by 10V / (H-L) pressure-units.
For example, if the units are set to kPa and the Low and High values to 0 and 350 the gain would
be… 10V/310kPa. (the transducers are rated for 0-45PSIA thats approx 0 – 310kPa)
This analog voltage is then applied to a Q330 channel with its 224
ADC for a 40V full-scale so
the counts to kPa would be
310kPa/10V * 40V/224 =
73.909x10⁻⁶
kPa/count
It is expected that schema rt1.0 SEGTYPE of “K” will be used for pressure-transducers which
represents data in kPa.

Appendix II: Applied MEMS SF3000L Data
See www.appliedmems.com for more details.


