ICIS Power amp Carbon Seminar
First Day
14-15 November 2018Berlin Germany
ICIS is a world leading price reporting agency and analytics powerhouse for commodity markets
Prices News Analytics Data
Petro-Chemical
Energy Fertilizers
1030-1100Keynote AddressBarbara Lempp Managing Director EFET
Dr Tobias Paulun EEX
1100-1145 Forecasting European power marketsPhilipp Ruf ICIS
1245-1315 QampA with the European CommissionPeter Zapfel European Commission
Coffee Break
1215-1245What is behind the latest carbon price
moveStefan Feuchtinger ICIS
Lunch Break
1415-1445What to look out for ndash a mid- to long-term
forecast for Europersquos carbon marketMarcus Ferdinand ICIS
1445-1530Southern Europe A renewable revolution
in Italy and SpainMatteo Mazzoni amp Matt Jones ICIS
1800Networking ReceptionSponsored by EEX
Melia Hotel Tapas Bar
Coffee Break
1600-1730Coal phase-out ndash key for low carbon
transitionMarcus Ferdinand amp Matt Jones amp Vija Pakalkaite ICIS
Keynote
Address
Barbara LemppManaging Director EFET
Dr Tobias PaulunChief Strategy Office EEX
Forecasting European Power Markets
This is a sample text Insert your
desired text here Philipp RufDirector ndash Carbon amp Power Analytics
copyright copy 2018 ICIS wwwiciscom 7
We are scaling up our country coverage to build a pan-European service on power price forecasting
Sep 2018
bullBiggest countries and central Western Europe
bullAT BE DE ES FR IT NL PL UK
Dec 2018
bullBaltics
bullEE LT LV
Jan 2019
bullNordics and Czech
bullCZ DK FI NO SE
H1 2019
bullSouth-East EU and remaining
bullConstant publication
bullBG CH GR HU HR IE PT RO SI SK
copyright copy 2018 ICIS wwwiciscom 8
Model methodology
Overall methodology
Dispatch model ndash we are modelling
the hourly dispatch mimicking how
the market clearing works
Global optimization model that
minimizes all system costs subject
to a number of constrains (or
maximization of social welfare)
Formulated as a linear programming
model
Features
Optimal dispatch of generation including trade
Incorporation of start-up costs
Full EU integration capacities of all major interconnectors
Detailed hydro modelling
Accurate cycling of thermal generation
Taking into account technical restrictions part-load efficiencies reservoir levels ramping restrictions
copyright copy 2018 ICIS wwwiciscom 9
Capacity assumptions
Existing Capacities
TSO Data
hellip
Nuclear
bull Project based new capacity
bull Decommissioning based on plant by plant approach
Fossil (lignite coal gas)
bull Project based new capacity
bull Decommissioning on announced closures coal phase-out plans and lifetime approach
Renewables
bull New capacity based on subsidy systems (incl auctions) as well as long-term country strategies
bull Only minor decommissioning expected
Future Capacities
copyright copy 2018 ICIS wwwiciscom 10
What does that mean Where are capacities going
0
100
200
300
400
500
600
700
800
900
1000
ca
pa
city
Capacity Development of Modelled Countries
Nuclear Lignite Coal Gas Oil Hydropower Bio Wind Solar
copyright copy 2018 ICIS wwwiciscom 11
Trend 1 ndash coal phase-outs all over Europe
Phase-outs planned in all
modelled countries
except Poland
Some are fixed in
legislation (AT FR ES
NL UK)
Others not (DE IT)
Total reduction of
capacity
Lignite 105GW or -38
Coal 512GW or -68
0
100
200
300
400
500
600
700
800
900
1000
ca
pa
city
Capacity Development of Modelled Countries
Nuclear Lignite Coal Gas Oil Hydropower Bio Wind Solar
copyright copy 2018 ICIS wwwiciscom 12
Trend 2 ndash increase of renewables
All modelled countries
have a significant
increase of renewables
We expect the largest
increase in wind
capacity with 131GW
additional or +120
Solar will deliver
second with 118GW
additional or +77
0
100
200
300
400
500
600
700
800
900
1000
ca
pa
city
Capacity Development of Modelled Countries
Nuclear Lignite Coal Gas Oil Hydropower Bio Wind Solar
copyright copy 2018 ICIS wwwiciscom 13
Fuel price assumptions mixture of internal modelling and external benchmarks
Carbon ICIS carbon forecast
Lignite based on own assumptions
Coal Based on forward curve
(API2) and extrapolated behind the
curve
Gas Forward curve based on ICIS
price assessments behind the
forward curve we utilise World
Banklsquos natural gas forecast
000
1000
2000
3000
4000
5000
6000
7000
8000
9000
10000
price
Fuel Price Assumptions
carbon [EURtonne] lignite [EURtonne]
coal [USDtonne] gas [EURMWh]
copyright copy 2018 ICIS wwwiciscom 14
Trend 3 ndash we expect carbon prices to increase rapidly in the early years of the 2020s and relax in the later years
Political context post-2020 reform with the strengthened MSR is cutting supply short and is a game changer for the system
Participants in the last month the increased political stability incentivised financial players to participate in the system
Volume Due to the MSR abatement in the future will be necessary and will have to be delivered through fuel switch in the power sector and carbon efficiency measures in industry
000
1000
2000
3000
4000
5000
6000
7000
8000
9000
10000
price
Fuel Price Assumptions
carbon [EURtonne] lignite [EURtonne]
coal [USDtonne] gas [EURMWh]
copyright copy 2018 ICIS wwwiciscom 15
Trend 4 Brexit
Power Markets
Link to internal energy markets at risk
As UK is highly dependent on electricity imports the continued functioning of the interconnectors are crucial
Long-term policies are defined independently of Brexit
Future of UK power market highly dependent on party manifestos
Carbon Markets
Creating sentiment effect in the last weeks
Short-term effects of hard Brexit selling by utilities and industrials
Long-term solution requires adjustment of the system
Both ambition levels for carbon reduction UK and EU should not be seriously affected
copyright copy 2018 ICIS wwwiciscom 16
The base case power price forecasts
4500
5000
5500
6000
6500
7000
7500
price
fo
reca
st [E
UR
MW
h]
Power Price Forecast ndash Base Cases
AT BE ES FR DE IT NL PL UK
What is behind the latest carbon price move Have times really changed
Stefan FeuchtingerSenior Analyst ndash Carbon amp Power Analytics
Current Market Situation
copyright copy 2018 ICIS wwwiciscom 19
Last 5 years EUA price developmentsEverything before 2018 was boring
000
500
1000
1500
2000
2500
3000
ca
rbo
n p
rice [euro
to
nn
e]
EUA price
+258 in the
last 12 months+334 peak
copyright copy 2018 ICIS wwwiciscom 20
Last 5 years EUA price developmentsEverything before 2018 was boring
000
500
1000
1500
2000
2500
3000
ca
rbo
n p
rice [euro
to
nn
e]
EUA price 200 per Mov Avg (EUA price)
+258 in the
last 12 months+334 peak
EUA price developmentsVolumes are picking up EU carbon in second boom period
000
500
1000
1500
2000
2500
3000
000
500
1000
1500
2000
2500
3000
vo
lum
e [
m to
nn
es]
ca
rbo
n p
rice [euro
to
nn
e]
EUA trading volume EUA price EUA trading volume (yearly average) EUA trading volume (quarterly average)
copyright copy 2018 ICIS wwwiciscom 22
EUA price developments30-day-volatility was decreasing September massive increase towards historic heights then recently slight decrease
0
01
02
03
04
05
06
07
08
09
1
000
500
1000
1500
2000
2500
3000
30 d
ay v
ola
tilit
y
ca
rbo
n p
rice [euro
to
nn
e]
EUA price 30-day volatility
copyright copy 2018 ICIS wwwiciscom 23
EUA price and Article 29aBoogeyman or serious threat
000
500
1000
1500
2000
2500
3000
3500
ca
rbo
n p
rice [euro
to
nn
e]
Historical_Price Six months trigger_Overlapping Two-year average_Overlapping
Six months trigger_Successive Two-year average_Successive
copyright copy 2018 ICIS wwwiciscom 24
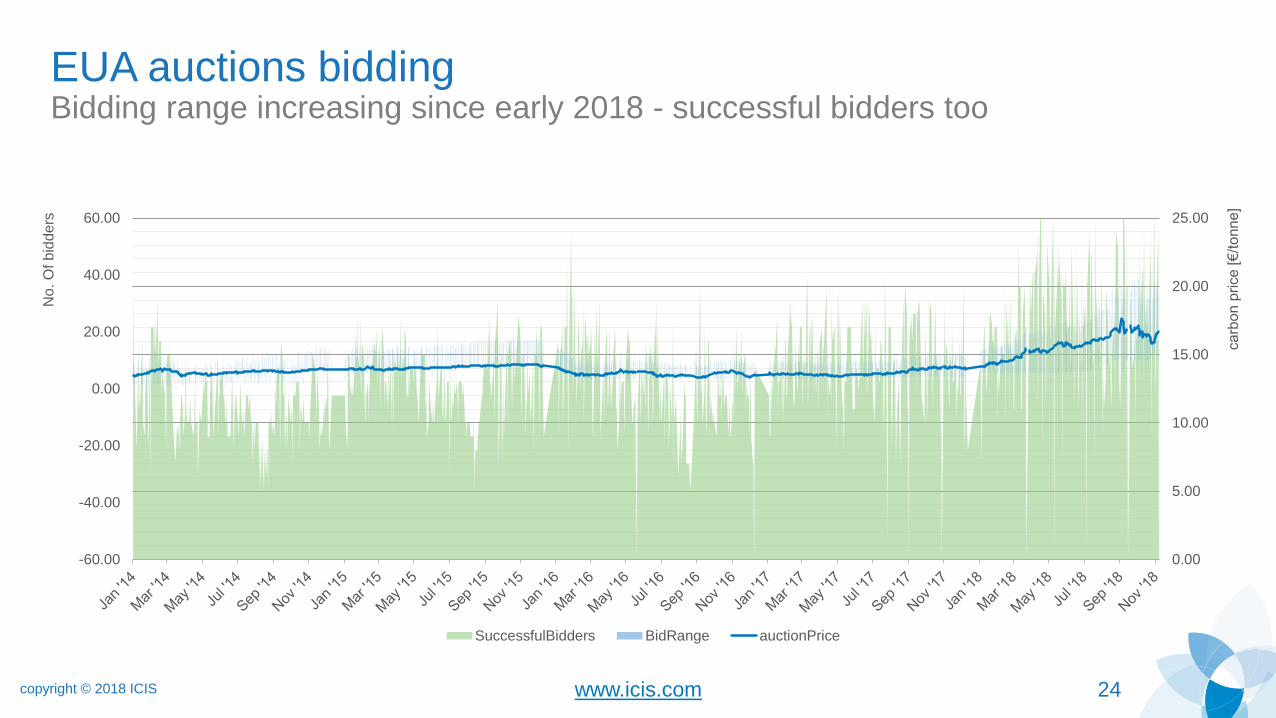
EUA auctions biddingBidding range increasing since early 2018 - successful bidders too
-6000
-4000
-2000
000
2000
4000
6000
000
500
1000
1500
2000
2500
No
O
f b
idde
rs
ca
rbo
n p
rice [euro
to
nn
e]
SuccessfulBidders BidRange auctionPrice
copyright copy 2018 ICIS wwwiciscom 25
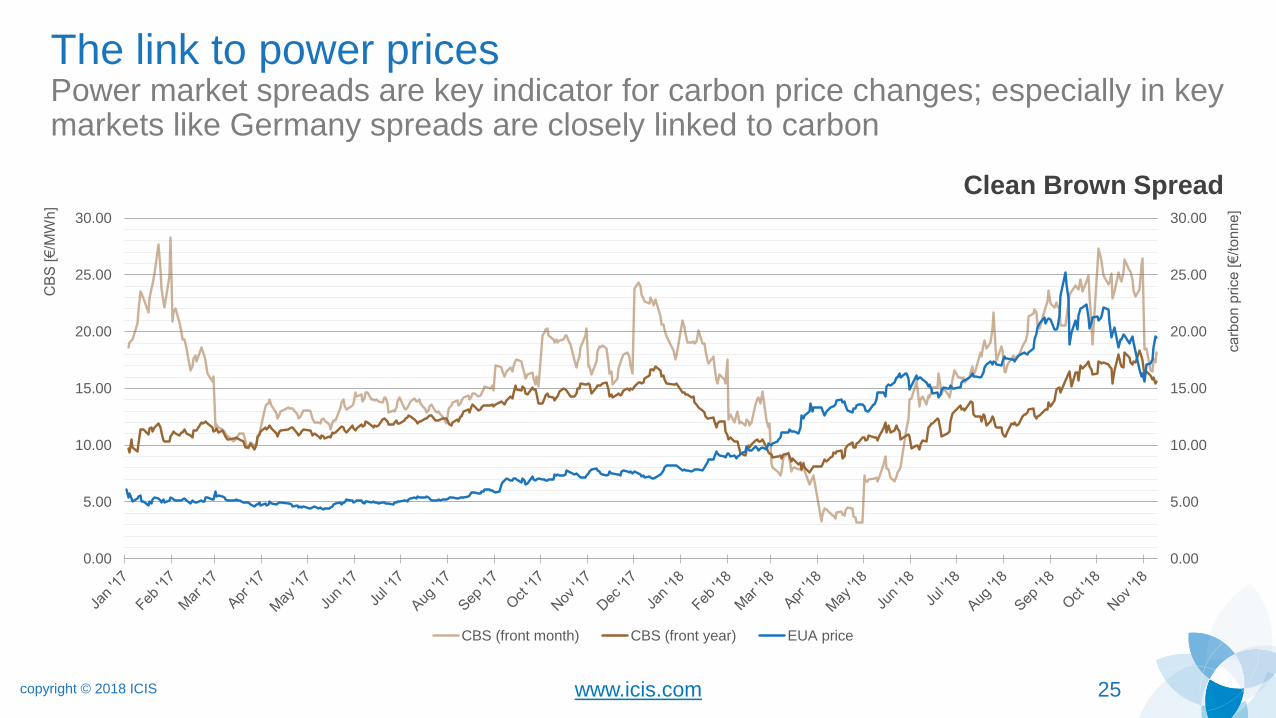
The link to power pricesPower market spreads are key indicator for carbon price changes especially in key markets like Germany spreads are closely linked to carbon
Clean Brown Spread
000
500
1000
1500
2000
2500
3000
000
500
1000
1500
2000
2500
3000
ca
rbo
n p
rice [euro
to
nn
e]
CB
S [
euroM
Wh
]
CBS (front month) CBS (front year) EUA price
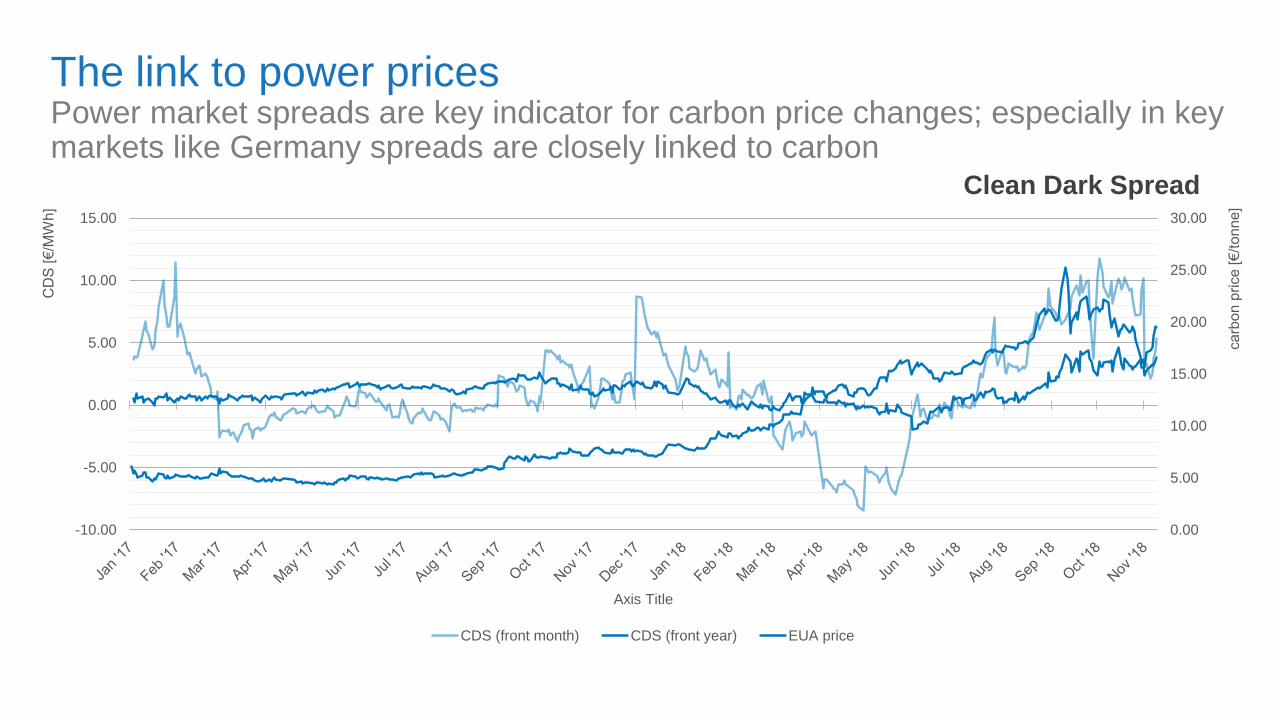
The link to power pricesPower market spreads are key indicator for carbon price changes especially in key markets like Germany spreads are closely linked to carbon
Clean Dark Spread
000
500
1000
1500
2000
2500
3000
-1000
-500
000
500
1000
1500
ca
rbo
n p
rice [euro
to
nn
e]
CD
S [
euroM
Wh
]
Axis Title
CDS (front month) CDS (front year) EUA price
copyright copy 2018 ICIS wwwiciscom 27
The link to power pricesPower market spreads are key indicator for carbon price changes especially in key markets like Germany spreads are closely linked to carbon
Clean Spark Spread
000
500
1000
1500
2000
2500
3000
-2000
-1500
-1000
-500
000
500
1000
ca
rbo
n p
rice [euro
to
nn
e]
CS
S [
euroM
Wh
]
CSS (front month) CSS (front year) EUA price
copyright copy 2018 ICIS wwwiciscom 28
The link to power pricesPower market spreads are key indicator for carbon price changes especially in key markets like Germany spreads are closely linked to carbon
Fuel Switching costs
000
500
1000
1500
2000
2500
3000
-1000
000
1000
2000
3000
4000
5000
ca
rbo
n p
rice [euro
to
nn
e]
To
tal sw
itch
ing
co
sts
[euro
MW
h]
FS (frontmonth) FS (frontyear) EUA price
copyright copy 2018 ICIS wwwiciscom 29
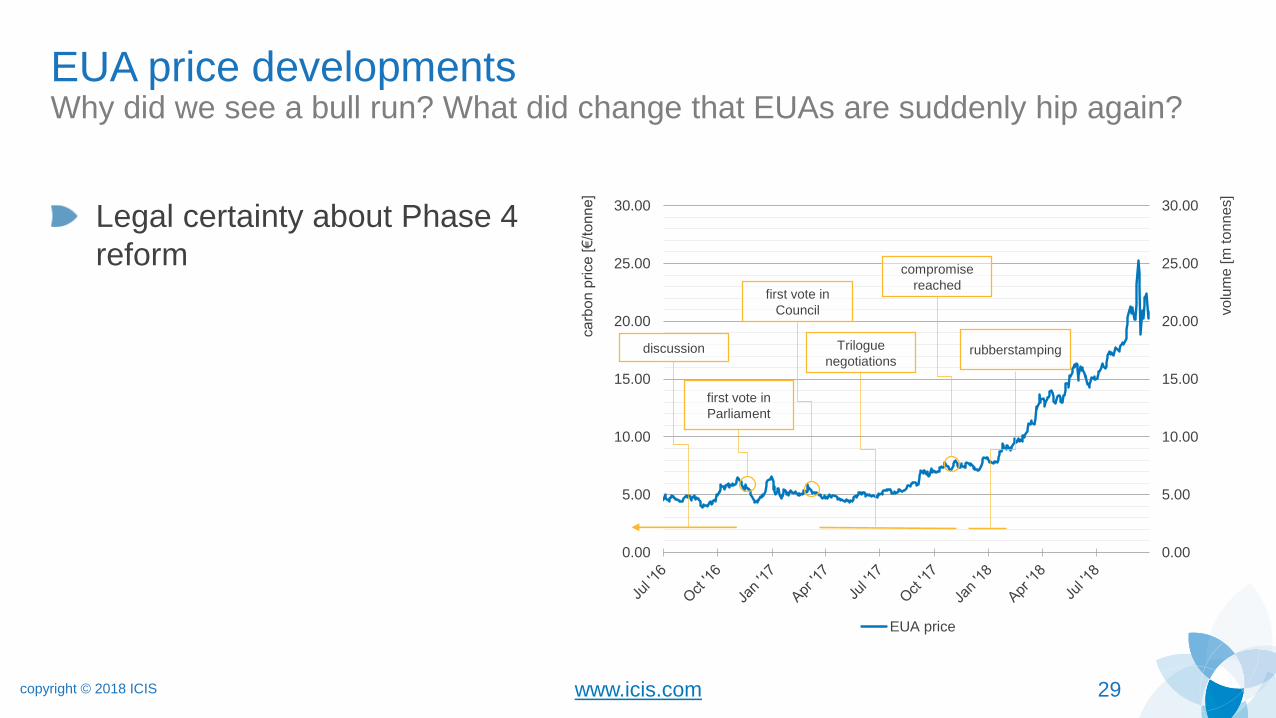
EUA price developmentsWhy did we see a bull run What did change that EUAs are suddenly hip again
Legal certainty about Phase 4
reform
000
500
1000
1500
2000
2500
3000
000
500
1000
1500
2000
2500
3000
vo
lum
e [
m to
nn
es]
ca
rbo
n p
rice [euro
to
nn
e]
EUA price
first vote in
Parliament
first vote in
Council
discussion Trilogue
negotiations
compromise
reached
rubberstamping
copyright copy 2018 ICIS wwwiciscom 30
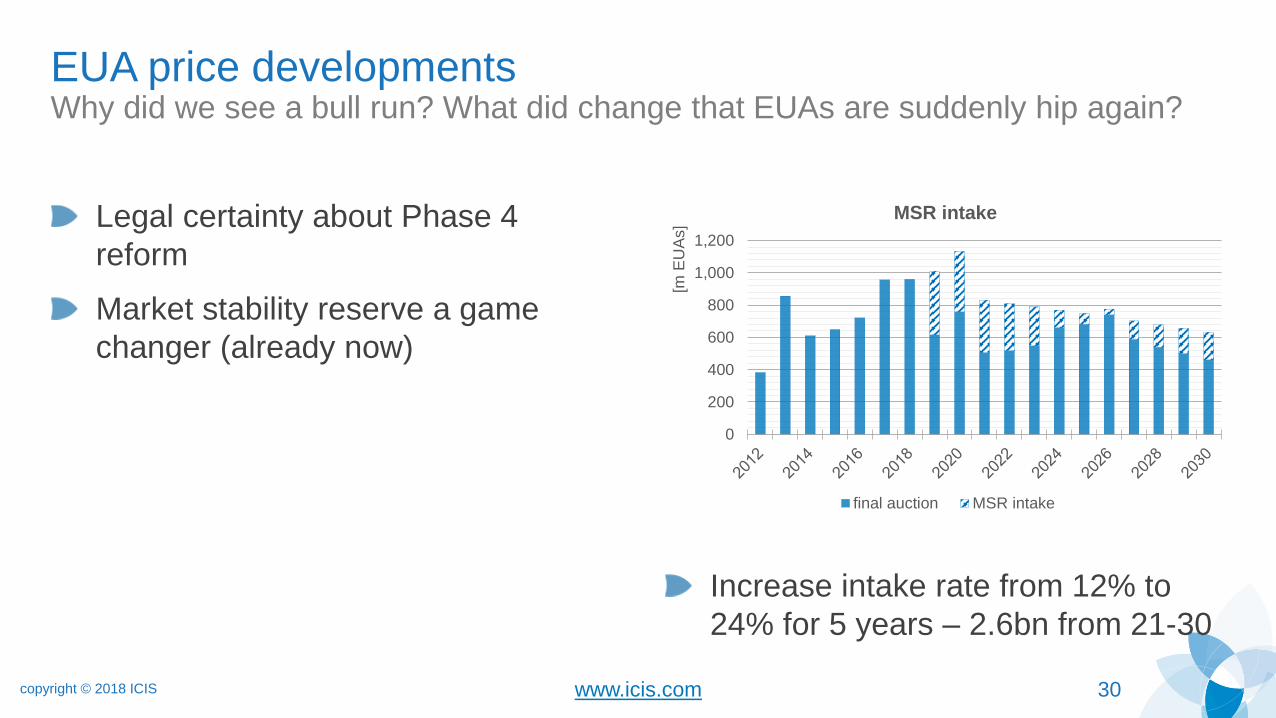
EUA price developmentsWhy did we see a bull run What did change that EUAs are suddenly hip again
Legal certainty about Phase 4
reform
Market stability reserve a game
changer (already now)
0
200
400
600
800
1000
1200
[m E
UA
s]
MSR intake
final auction MSR intake
Increase intake rate from 12 to
24 for 5 years ndash 26bn from 21-30
copyright copy 2018 ICIS wwwiciscom 31
EUA price developmentsWhy did we see a bull run What did change that EUAs are suddenly hip again
Legal certainty about Phase 4
reform
Market stability reserve a game
changer (already now)
Utilities build strategic hedging
reserves
194
293
626
1919
2939
238
1077
33123399
3605
000
2000
4000
6000
8000
10000
EU
As [m
to
nn
es]
CO2 position RWE
hedged [m tonnes] synthetic [m tonnes]
strategic [m tonnes] open [m tonnes]
copyright copy 2018 ICIS wwwiciscom 32
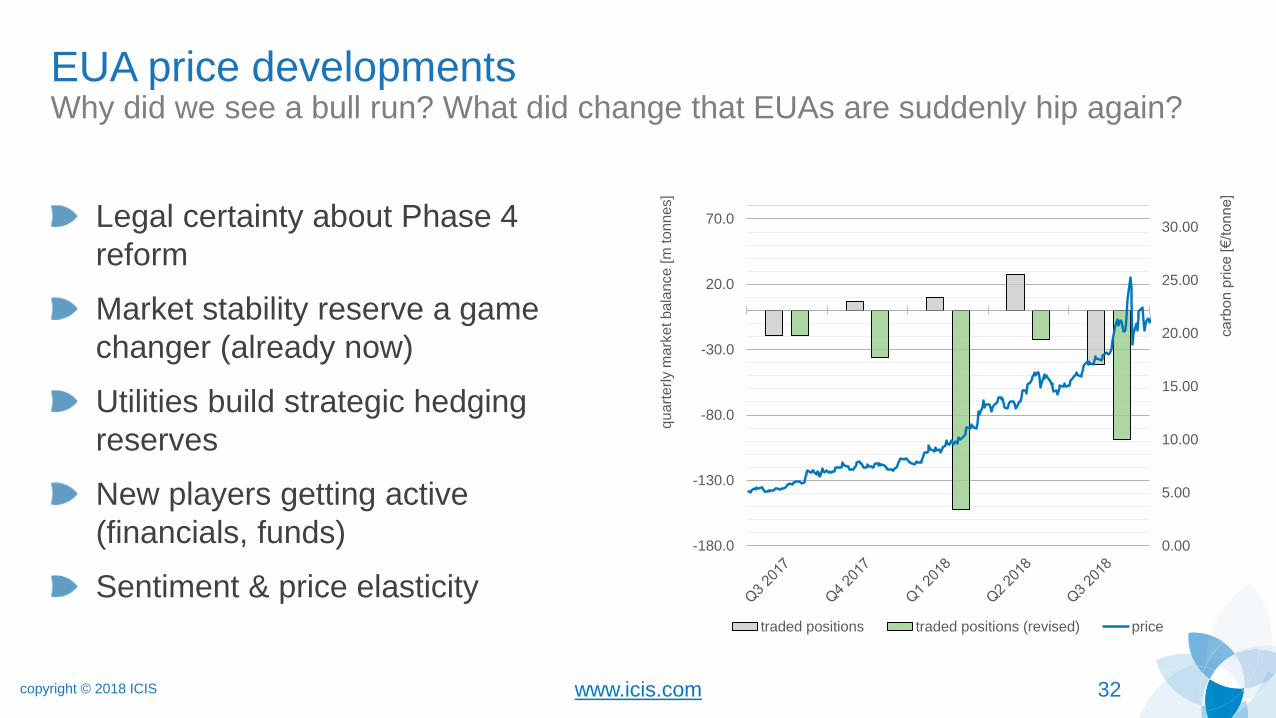
EUA price developmentsWhy did we see a bull run What did change that EUAs are suddenly hip again
Legal certainty about Phase 4
reform
Market stability reserve a game
changer (already now)
Utilities build strategic hedging
reserves
New players getting active
(financials funds)
Sentiment amp price elasticity
000
500
1000
1500
2000
2500
3000
-1800
-1300
-800
-300
200
700
ca
rbo
n p
rice [euro
to
nn
e]
qu
art
erly m
ark
et b
ala
nce
[m
to
nn
es]
traded positions traded positions (revised) price
Mid-Term View
copyright copy 2018 ICIS wwwiciscom 34
The fundamentalsThe MSR is increasing the pressure on compliance companies in the next years
Yearly supply is not enough
anymore to cover yearly demand
Compliance companies will be
forced to invest in reduction
measures or historic surplus needs
to come to market
First available are fuel switch from
coal to gas
Later on industrial abatement
projects
00
2000
4000
6000
8000
10000
12000
14000
16000
18000
20000
em
issio
nsE
UA
s [m
to
nn
es]
allocation auction other MSR BAU emissions
copyright copy 2018 ICIS wwwiciscom 35
The fundamentalsWhere would CO2 reductions come from
Biggest abatement pressure is on
power sector in the beginning
Fuel switch on short notice available
No additional investments necessary
Immediate economic impact
Once fuel switch capacity is utilized
industrial and power sector need to
invest to abate emissions
Especially in second half of phase 4
industrials will start abating emissions
quicker
0
20
40
60
80
100
120
140
160
180
ab
ate
me
nt tr
igge
red
[m
to
nn
es]
abatement per sector
Power Industry
copyright copy 2018 ICIS wwwiciscom 36
Price ForecastThe Base Case ndash a conservative view
1000 euro
1500 euro
2000 euro
2500 euro
3000 euro
ca
rbo
n p
rice [euro
to
nn
e]
base
copyright copy 2018 ICIS wwwiciscom 37
Price ForecastScenarios around the risk of a hard Brexit
1000 euro
1500 euro
2000 euro
2500 euro
3000 euro
ca
rbo
n p
rice [euro
to
nn
e]
hardBrexit60m hardBrexit30m base
copyright copy 2018 ICIS wwwiciscom 38
The fundamentalsWhere does the historic surplus sit
0
400
800
1200
1600
2000
0
200
400
600
800
1000
cu
mu
lative
ho
ldin
g [m
EU
As]
ab
so
lute
ho
ldin
g [m
EU
As]
2017 holdings
utilities industry financial cumulative end of 2017
copyright copy 2018 ICIS wwwiciscom 39
Price ForecastScenario around changed speculative buying
1000 euro
1500 euro
2000 euro
2500 euro
3000 euro
ca
rbo
n p
rice [euro
to
nn
e]
base Spec-ContinuedSpecDemand Spec-Q2sellOff
copyright copy 2018 ICIS wwwiciscom 40
Price ForecastScenario around changed speculative buying
1000 euro
1500 euro
2000 euro
2500 euro
3000 euro
ca
rbo
n p
rice [euro
to
nn
e]
-18000
-14000
-10000
-6000
-2000
2000
6000
10000
sp
ecu
lative
vo
lum
e [
m E
UA
s]
Base case Continued spec demand Spec sell-off
copyright copy 2018 ICIS wwwiciscom 41
Conclusions
Only as of 2019 MSR intake leads to a significant scarcity on the market
In 2018 the increases are based on speculative buying and compliance
preparation for the MSR
Mid-term risks and opportunities
Hard Brexit
Clean spread development brown dark and spark spreads
Anticipation buying of compliance companies
Sell off triggered by one or few long players
Further behaviour of speculators
copyright copy 2018 ICIS wwwiciscom 42
Price ForecastScenario comparison
1000 euro
1500 euro
2000 euro
2500 euro
3000 euro
ca
rbo
n p
rice [euro
to
nn
e]
hardBrexit60m hardBrexit30m base Spec-ContinuedSpecDemand Spec-Q2sellOff price price
Peter ZapfelHead of Unit B1 ndash ETS policy Development and Auctioning European Commission
QampA
Marcus FerdinandHead of European Carbon amp Power Analytics
What to look out for ndash a mid to long-term forecast for Europersquos carbon market
copyright copy 2018 ICIS
Agenda
1) The market turns short
2) Market Stability Reserve ndash room for review
3) Coal phase-out ndash implications for the carbon price
copyright copy 2018 ICIS wwwiciscom 46
The market balance during phase 4 ndash fundamental
-500
0
500
1000
1500
2000
2500
-400
-200
0
200
400
600
800
1000
1200 cu
mu
lativ
e b
ala
nce
ba
nked
MS
R [m
ton
ne
s]
ye
arly b
ala
nce
in [m
to
nn
es]
FundamentalBalance CumulativeFundamentalBalance
copyright copy 2018 ICIS wwwiciscom 47
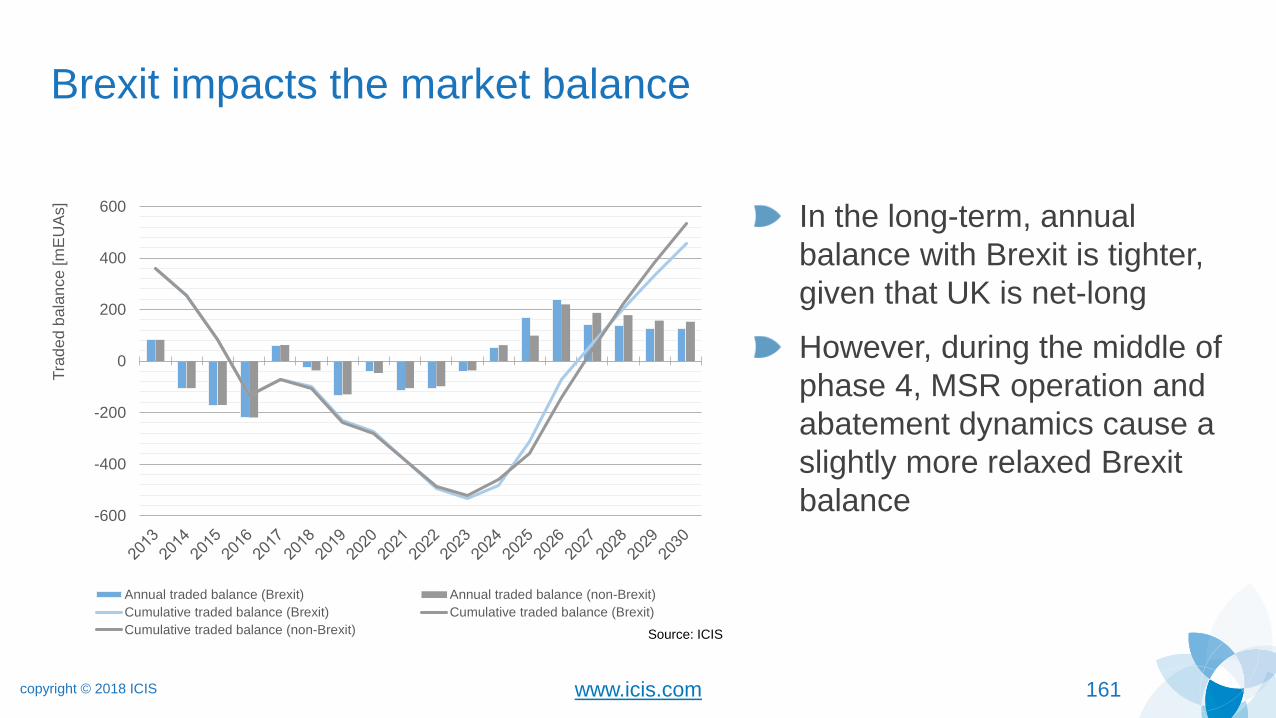
The market balance during phase 4 ndash traded
-1000
-500
0
500
1000
1500
2000
2500
-400
-200
0
200
400
600
800
1000
1200 cu
mu
lativ
e b
ala
nce
ba
nked
MS
R [m
ton
ne
s]
ye
arly b
ala
nce
in [m
to
nn
es]
TradedBalance FundamentalBalance CumulativeTradedBalance CumulativeFundamentalBalance
copyright copy 2018 ICIS wwwiciscom 48
The market balance during phase 4 ndash MSRbanked
-1000
-500
0
500
1000
1500
2000
2500
3000
-400
-200
0
200
400
600
800
1000
1200 cu
mu
lativ
e b
ala
nce
ba
nked
MS
R [m
ton
ne
s]
ye
arly b
ala
nce
in [m
to
nn
es]
CumulativeBanked CumulativeMSR TradedBalance FundamentalBalance CumulativeTradedBalance CumulativeFundamentalBalance
The market stability
reserve ndash room for review
copyright copy 2018 ICIS wwwiciscom 50
One key bit needs to be taken into account the TNAC is not the available surplus
Due to the exclusion of EUA compliance by the aviation sector the TNAC is higher than the available surplus
Leads to overestimation of market surplus
Higher MSR outtake
In case aviation shortfall gt400 Mt lower threshold obsolete
Higher threshold nearly impossible to undercut
But CORSIA effect
We expect this to be changed and incorporate a TNAC equal to the surplus in our analysis from 2022 onwards
0
500
1000
1500
2000
2500
EU
As [
m to
nn
es]
cumulative aviation short thresholds surplus TNAC
Source ICIS
copyright copy 2018 ICIS wwwiciscom 51
Our base case analysis
Market to be squeezed in early TP4
This will trigger significant emission
reductions in power and industry
Decreasing base emissions reduce
hedge demand significantly
MSR goes back to 12 and demand
decreases (lower base emissions)
Triggered abatement increases TNAC
MSR is not capable to reduce over-
supply at the same speed
000
1000
2000
3000
4000
0
200
400
600
800
1000
1200
1400
1600
1800
ca
rbo
n p
rice [euro
to
nn
e]
EU
As [
m to
nn
es]
MSR thresholds TNAC hedge demand base price
Source ICIS
copyright copy 2018 ICIS wwwiciscom 52
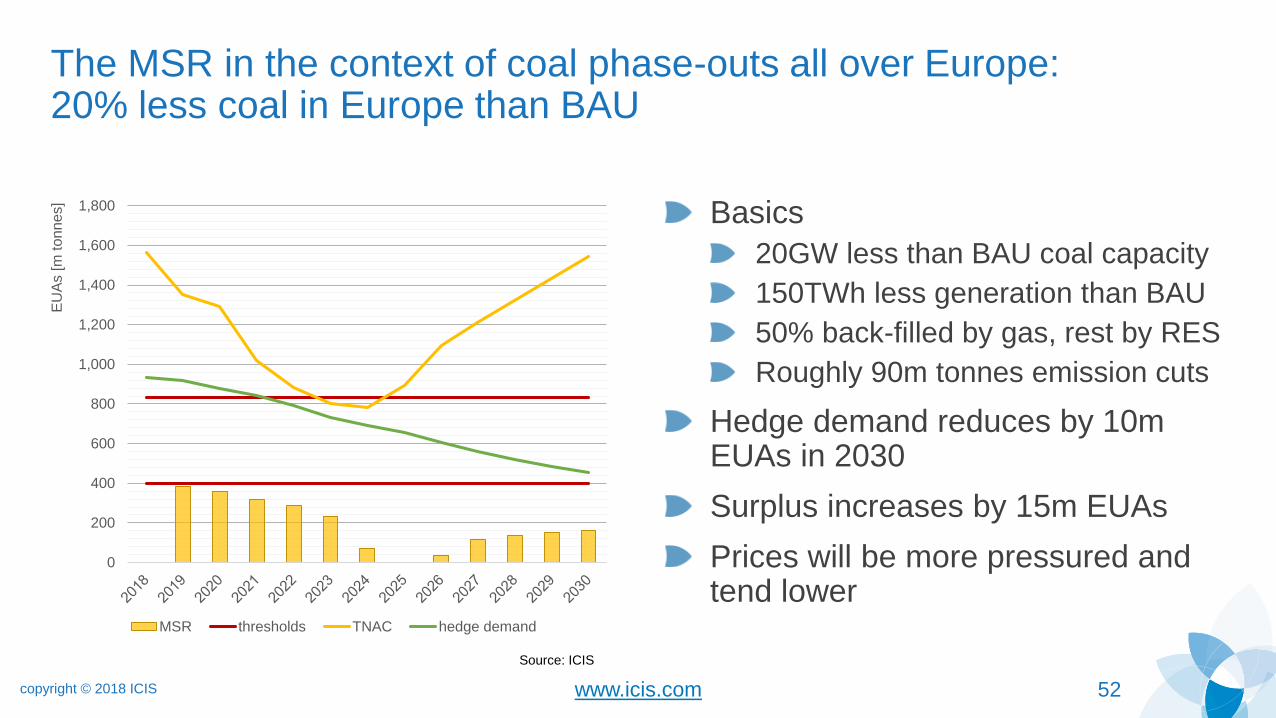
The MSR in the context of coal phase-outs all over Europe20 less coal in Europe than BAU
Basics
20GW less than BAU coal capacity
150TWh less generation than BAU
50 back-filled by gas rest by RES
Roughly 90m tonnes emission cuts
Hedge demand reduces by 10m EUAs in 2030
Surplus increases by 15m EUAs
Prices will be more pressured and tend lower
0
200
400
600
800
1000
1200
1400
1600
1800
EU
As [
m to
nn
es]
MSR thresholds TNAC hedge demand
Source ICIS
copyright copy 2018 ICIS wwwiciscom 53
The MSR in the context of coal phase-outs all over Europe50 less coal in Europe than BAU
Basics
50GW less than BAU coal capacity
375TWh less generation than BAU
50 back-filled by gas rest by RES (investment needed)
Roughly 225m tonnes emission cuts
Hedge demand reduces by 90m EUAs in 2030
Surplus increases by 70m EUAs
Prices will be more pressured and tend lower
0
200
400
600
800
1000
1200
1400
1600
1800
EU
As [
m to
nn
es]
MSR thresholds TNAC hedge demand
Source ICIS
copyright copy 2018 ICIS wwwiciscom 54
The MSR in the context of coal phase-outs all over Europe70 less coal in Europe than BAU
Basics
70GW less than BAU coal capacity
525TWh less generation than BAU
50 back-filled by gas rest by RES (investment needed)
Roughly 315m tonnes emission cuts
Hedge demand reduces by 150m EUAs in 2030
Surplus increases by 153m EUAs
Prices will be more pressured and tend lower
0
200
400
600
800
1000
1200
1400
1600
1800
EU
As [
m to
nn
es]
MSR thresholds TNAC hedge demand
Source ICIS
copyright copy 2018 ICIS wwwiciscom 55
Consequences for the MSR parameter discussion (50 coal)
MSR parameters can be amended
with review
Two potential scenarios
Reduce thresholds (600 280 Mt)MSR continues to trigger
allowances during all years
MSR withdraws 235m allowances
more compared to 833400
thresholds
TNAC remains on lower pathway
0
200
400
600
800
1000
1200
1400
1600
1800
EU
As [
m to
nn
es]
MSR_600280 thresholds
TNAC_600280 hedge demand_600280
Source ICIS
copyright copy 2018 ICIS wwwiciscom 56
Consequences for the MSR parameter discussion (50 coal)
MSR parameters can be amended
with review
Two potential scenarios
Reduce thresholds (600 280 Mt)
Remain on 24 withdrawal rateMSR continues to trigger
allowances during all years
MSR withdraws 790m allowances
more compared to old thresholds
and 12 rate
TNAC remains on lower pathway
0
200
400
600
800
1000
1200
1400
1600
1800
EU
As [
m to
nn
es]
MSR_600280 MSR_600280_24
thresholds TNAC_600280
hedge demand_600280 TNAC_600280_24
hedge demand_600280_24
Source ICIS
copyright copy 2018 ICIS wwwiciscom 57
Price trajectories ndash highly assumptions-driven
000 euro
1000 euro
2000 euro
3000 euro
4000 euro
5000 euro
ICIS base case base emissions - MSR withdrawal rate base emissions - MSR threshold and withdrawal rate
20 coal reduction 50 coal reduction 70 coal reduction
20 coal - MSR thresholds 50 coal - MSR thresholds 70 coal - MSR thresholds
20 coal - MSR thresholds and withdrawal 50 coal - MSR thresholds and withdrawal 70 coal - MSR thresholds and withdrawal
Source ICIS
copyright copy 2018 ICIS wwwiciscom 58
Conclusion
Changing power sector dynamics could lead to significantly lower emissions
If we factor in the current trend towards coal phase-outs all over EuropeThe surplus increases more
The hedge demand reduces more
With lower power sector demand TNAC increases with current MSR parameters
According to our analysis the MSR will not be strong enough to mitigate the surplus built-up due to lower emissions
Less demand results in laxer market balance lower prices
Adjustment of MSR parameters an option to keep market tightness
Southern Europe ndash a renewable revolution in Italy and Spain
Matteo MazzoniSenior Analyst ndash EU Carbon amp Power Analytics
Matt JonesSenior Analyst ndash EU Carbon amp Power Analytics
copyright copy 2018 ICIS
Agenda
1) Historical renewable developments in Spain and Italy
2) Recent and upcoming auctions
3) Renewable growth trajectories
4) Potential for lsquosubsidy-freersquo renewables
Drivers of subsidy-free RES
Merchant-risk
PPAs
Government de-risking
5) Signposts
6) Conclusions
Historical renewable
developments in Spain
and Italy
copyright copy 2018 ICIS wwwiciscom 62
Renewable generation within the energy mix
Gas41
Coal16
Nuclear19
Other fossil4
Hydro7
Solar1
Wind11
Biomass1
RES20
Gas25
Coal17
Nuclear21
Other fossil4
Hydro8
Solar5
Wind18
Biomass1
Others0
RES32
Gas58
Coal14
Other fossil8
Hydro14
Solar0
Wind2
Biomass3
Others2
RES20
Gas46
Coal11
Other fossil8
Hydro12
Solar8
Wind6
Biomass6
Others2
RES34
Italian Generation Mix Spanish Generation Mix
2008
2017
Source Terna Source REE
copyright copy 2018 ICIS wwwiciscom 63
Where are they now RES capacity grew quickly
0
20
40
60
80
100
120
GW
Installed RES capacity by country
Spain Germany Italy France UKSource IRENA
copyright copy 2018 ICIS wwwiciscom 64
Renewable targets for 2020
10
12
14
16
18
20
22
Spain Italy
sh
are
Renewable shares vs 2020 target ()
2016 2020 target
Italy is already exceeding
its 2020 target due to
rapid growth 2010-2012 in
particular
Spain remains behind on
its own target due to
stagnant growth in recent
years
Uncertainty over whether
the 201617 auctions will
be enough for Spain to
reach its target
copyright copy 2018 ICIS wwwiciscom 65
Feed-in-tariffs give way to auctions
Spain Italy
Market Premium scheme reformed 2012
-RES capacity almost flat since
-Numerous lawsuits under the ECT
-No longer open to installations
gt5MW
-De facto moratorium on new RES
FiT and FiP reformed in 2015
-RES capacity almost flat since
-No longer open to installations
gt5MW
-De facto moratorium on new RES
No Green Certificates scheme No Green Certificates scheme
Tendering scheme introduced in 2016
- Three rounds held
- Floor price mechanism
- More auctions planned but not
announced
RES auctions planned for 2019 and 2020
- First round suggested Jan-2019
- Contracts-for-differences style
scheme proposed
- Likely to be delayed again
Recent and upcoming
auctions
copyright copy 2018 ICIS wwwiciscom 67
The introduction of renewable auctions in Spain
Source ICIS OMIE
Auction Date TechnologyCapacity target
(MW)
Capacity awarded
(MW)Weighted average floor price (euroMWh)
Jan 2016Onshore wind
700 in total569 0
Biomass 200 0
May 2017
Onshore wind
3000 in total
2780 399
Other RES 19 416
Solar 1 422
Jul 2017Onshore wind
3000 in total1128 282
Solar 3909 327
Total 6700 8606
copyright copy 2018 ICIS wwwiciscom 68
Key features of the Spanish auctions
Prices cleared below market prices
Bidders can expect to get the market price except when prices fall below the auction floor price
Payments for unlimited duration
The floor price level calculation methodology can be revised every six years
0
10
20
30
40
50
60
70
Onshore windSpain
Solar Spain Onshore windItaly
Solar France Onshore windGermany
Solar Germany
euroM
Wh
(no
min
al)
Lowest subsidy price vs 2020 market price
Lowest subsidy 2020 power price (ICIS assessment 30 Oct)
copyright copy 2018 ICIS wwwiciscom 69
Auctions in Spain and Italy
0
20
40
60
80
100
120
140
160
euroM
Wh
(no
min
al)
Prices at auctions - Spain vs other EU countries
Onshore wind Spain Solar Spain Onshore wind Italy Onshore wind Germany Solar Germany Solar France
copyright copy 2018 ICIS wwwiciscom 70
Upcoming auctions in Italy
Italy is planning to auction 79 GW of capacity between January 2019 and May 2021
Of the total 56GW will be for solar and wind competing against one another
Winning bidders will be offered a CfD contract (like the UK model for RES support)
The latest draft of the decree sets a 70 euroMWh for wind and solar
Session Date Auction Registry Auction Registry Auction Registry Auction Registry
1 31012019 500 45 - 100 10 10 60 10
2 31052019 500 45 - 100 10 10 60 10
3 30092019 700 100 - 100 10 10 60 10
4 31012020 700 100 - 100 10 10 60 10
5 31052020 800 120 - 100 10 10 60 10
6 30092020 800 120 - 100 20 10 60 10
7 31012021 800 120 - 100 20 10 70 10
8 31052021 800 120 - 100 20 10 70 10
5600 770 0 800 110 80 500 80
Solar-Wind Solar asbestos sub Hydro-Biogas Repowering
Total
CAPACITY AVAILABLE (MW)
Source MiSE
Renewable growth
trajectories
copyright copy 2018 ICIS wwwiciscom 72
SpainItaly 2030 RES targets in the EU context
RES Targets 2020 2030
Europe20
(binding)
32
(binding)
Italy17
(binding)
28
(non-binding)
Spain20
(binding)
35
(non-binding)
The EU has recently agreed on a
32 RES target by 2030
Italy set a 28 RES target for
2030 which is below the EU target
Notwithstanding numerous
announcements Spain has yet to
publish the Energy Transition
Strategy which is expected to
come by the end of the year
copyright copy 2018 ICIS wwwiciscom 73
Italy the National Energy Strategy (SEN)
1740
22
28
2016 2030 BAU 2030 SEN
RES ON ENERGY CONSUMPTION
335038
55
2016 2030 BAU 2030 SEN
RES ON ELECTRICITY CONSUMPTION
The SEN was presented in November 2017 after a long consultation with more than 250 stakeholders
The SEN went beyond the RES EU target proposed by the EC but it now falls short of the new target
Great part of the rise is on the power sector with solar accounting for 24 of the electricity consumption and wind for 13
The SEN foresees EUR 35bn to be invested in RES and EUR 30bn to be invested in grids
Source MiSE
copyright copy 2018 ICIS wwwiciscom 74
Expectations for Spanish and Italian RES capacity
0
10
20
30
40
50
60
GW
Solar capacity forecast 2018-2030 (GW)
Spain Italy
0
5
10
15
20
25
30
35
GW
Wind capacity forecast 2018-2030 (GW)
Spain Italy
Source Icis Horizon Power model
Subsidy-free solar and
wind growth
copyright copy 2018 ICIS wwwiciscom 76
Why is subsidy-free renewables increasingly discussed
We have started to see the
first zero-subsidy solar and
onshore wind project come
online while offshore wind
projects are due in the
early 2020s
The development is driven
primarily by rapidly falling
technology costs 0
50
100
150
200
250
30
40
50
60
70
80
90
100
Ca
pa
city a
uctio
ne
d (
MW
)
Str
ike
price (
euroM
Wh
)
Solar auction results in Germany since 2015
capacity (MW) mean average successful bid (euroMWh)
copyright copy 2018 ICIS wwwiciscom 77
Why are Spain and Italy likely to be at the forefront
Both Spain and Italy have good resources for solar and wind
Both countries have high power prices by European standards
0
10
20
30
40
50
60
70
2016 2017 2018 YTD
euroM
Wh
Average power prices in Spain and Italy are ~euro16MWh higher vs Germany
Germany Italy Spain
copyright copy 2018 ICIS wwwiciscom 78
Why are Spain and Italy likely to be at the forefront
Both Spain and Italy have good resources for solar and wind
Both countries have high power prices by European standards
47
49
51
53
55
57
59
61
63
euroM
Wh
ICIS Horizon power price forecasts euroMWh
Italy Spain Germany
copyright copy 2018 ICIS wwwiciscom 79
Full merchant risk ndash price volatility
Merchant projects are risky given
uncertainty over future prices and
volatility
Without a guaranteed strike price
generators would be faced with
varying income on the wholesale
market
Volatility to increase over time
while seasonal variation will
increaseSource OMIE
0
10
20
30
40
50
60
70
80
90
100
euroM
Wh
Spanish hourly prices July 2017-July 2018
Hourly prices Average price
copyright copy 2018 ICIS wwwiciscom 80
Full merchant risk ndash price direction uncertainty
We expect power prices to be driven significantly by carbon prices through to 2030
As a result wholesale power prices will be at their highest in 202324 before declining
as EUA prices fall and as more RES capacity is added
47
49
51
53
55
57
59
61
63
euroM
Wh
ICIS Horizon power price forecasts euroMWh
Italy Spain Germany
copyright copy 2018 ICIS wwwiciscom 81
Full merchant risk ndash price cannibalisation
In the absence of subsidy the key metric is the capture price rather than the wholesale
price as this reflects what the generator will actually receive
Capture prices are pushed lower as addition RES units of the same type are added
(price cannibalisation)
40
45
50
55
60
65
euroM
Wh
Italy average price vs RES capture prices
Onshore wind capture price Solar capture price Annual average wholesale price
copyright copy 2018 ICIS wwwiciscom 82
Full merchant risk ndash price cannibalisation
In the absence of subsidy the key metric is the capture price rather than the wholesale
price as this reflects what the generator will actually receive
Capture prices are pushed lower as addition RES units of the same type are added
(price cannibalisation)
30
35
40
45
50
55
60
65
euroM
Wh
Spain average price vs RES capture price
Onshore wind capture price Solar capture price Annual average wholesale price
copyright copy 2018 ICIS wwwiciscom 83
Power Purchase Agreements (PPAs)
PPAs de-risk projects by locking
in long-term prices
We are starting to see the first
PPAs signed for RES projects in
Spain and Italy
Most in Spain have been supplier
PPAs rather than the more
publicised corporate PPAs
PPA
Corporate Supplier
copyright copy 2018 ICIS wwwiciscom 84
Power Purchase Agreements (PPAs)
PPAs de-risk projects by locking
in long-term prices
We are starting to see the first
PPAs signed for RES projects in
Spain and Italy
The question is whether there will
be enough demand for PPAs to
enable large-scale subsidy-free
rollout
Source ICISWindEurope
0
1
2
3
4
5
6
2010 2011 2012 2013 2014 2015 2016 2017
GW
European corporate PPA demand vs Spanish and Italian RES capacity anticipation
European RES capacity sourced through PPAs
Spain anticipated RES per year (2019-2030)
Italy anticipated RES per year (2019-2030)
copyright copy 2018 ICIS wwwiciscom 85
Spain 15 PPAs signed since the start of 2017
Total PPA capacity 2437MW
All due to be commissioned by 2020
Most of the PPAs are for solar PV
Six corporate PPAs seen totalling 481MW
lsquoUndisclosed buyerrsquo 820MW
Publicly-announced PPAs signed for new renewable capacity on the
Spanish mainland
0
1
2
3
4
5
Supplier Corporate Undisclosed Mixed
Num
ber
Spanish RES PPAs signed since 2017 by fuel and buyer
Solar Wind
0
200
400
600
800
1000
Supplier Corporate Undisclosed Mixed
Tota
l C
apacity (
MW
)
Spanish RES PPAs signed since 2017 by fuel and buyer
Solar Wind
copyright copy 2018 ICIS wwwiciscom 86
The most popular duration for PPAs in Spain is ten years
Five of the fifteen PPAs are for
ten years
Five PPAs are for longer than ten
years
Four PPAs are for an unreported
duration0
1
2
3
4
5
6
0
200
400
600
800
1000
1200
Nu
mb
er o
f P
PA
s
Tota
l cap
acit
y (M
W)
Duration (years)
Spanish RES PPAs signed since 2017 by duration
Capacity Count
copyright copy 2018 ICIS wwwiciscom 87
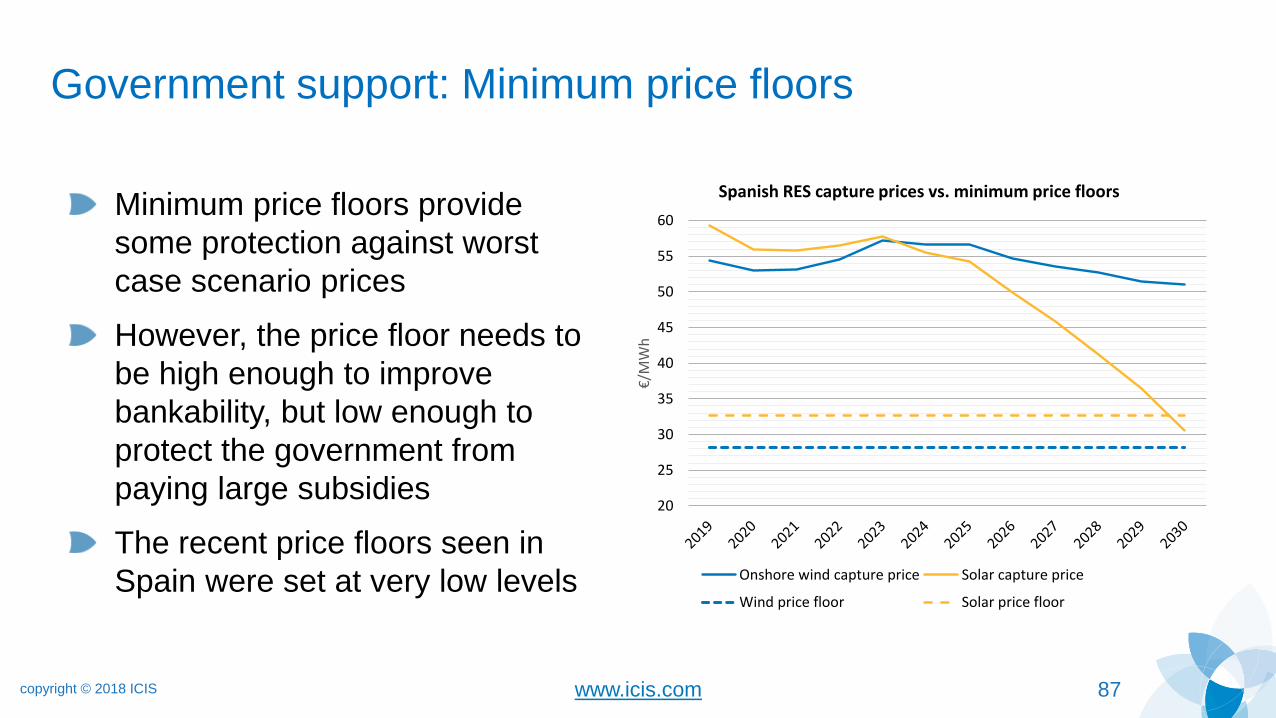
Government support Minimum price floors
Minimum price floors provide
some protection against worst
case scenario prices
However the price floor needs to
be high enough to improve
bankability but low enough to
protect the government from
paying large subsidies
The recent price floors seen in
Spain were set at very low levels
20
25
30
35
40
45
50
55
60
euroM
Wh
Spanish RES capture prices vs minimum price floors
Onshore wind capture price Solar capture price
Wind price floor Solar price floor
copyright copy 2018 ICIS wwwiciscom 88
Government support ldquoSubsidy-freerdquo CfDs
There is increasing talk in the UK
over ldquosubsidy-freerdquo CfDs for onshore
wind and solar
A similar idea could be seen in Italy
in the future
Generators would only be able to bid
in at the forecast power price level
Potential upside for the government
if prices rise above expectations but
downside if prices fall as subsidies
would be paid
40
45
50
55
60
65
70
euroM
Wh
Subsidy-free CfD price risk
ICIS price forecast Low price scenario High price scenario
copyright copy 2018 ICIS wwwiciscom 89
Signposts
The Spanish energy strategy due before end of 2018
The new Italian government announced it will revise its 2017 National Energy
Strategy
Strike prices in the upcoming Italian auctions
RES projects in Spanish recent auctions ndash how many projects will be
commissioned and on time
copyright copy 2018 ICIS wwwiciscom 90
Conclusions
Subsidy-free projects are beginning to emerge in a number of EU member
states
However Spain and Italy could be the first EU countries to attempt to roll out
subsidy-free capacity at scale driven by comparatively higher power prices
Investor appetite for risk given market price uncertainty will remain the greatest
challenge going forward How many projects can get off the ground
The PPA market can help de-risk projects but it remains in a nascent stage
Continued reductions in LCOE will help improve the prospects for projects
Our forecasts suggest that profit margins will be best for early movers
Coal phase-outs ndash key for the low carbon transition
Vija PakalkaiteAnalyst ndash EU Carbon amp Power Analytics
Matt JonesSenior Analyst ndash EU Carbon amp Power Analytics
Marcus FerdinandHead of EU Carbon amp Power Analytics
copyright copy 2018 ICIS
Agenda
1) Overview of coal phase-out in Europe Policy discussions and capacity
expectations
2) Netherlands Total phase-out and carbon price floor
3) Germany Gradual phase-out
4) Poland Clinging on to coal
5) Conclusions Comparing the three national approaches
Overview of coal-phase
out in Europe
copyright copy 2018 ICIS wwwiciscom 94
Europersquos current power mix
Nuclear 27
Coal and lignite 23Gas 17
Oil 2
Biomass 6
Hydro 12
Wind 10Solar 3
EU generation share
Coal and lignite account for 23 of the
European electricity mix at present
Coal and lignite have the second
largest installed capacity in the EU
(139GW) behind gas and ahead of
nuclear
Germany is the dominant country for
coal and lignite accounting for 31 of
EU capacity followed by Poland (21)
0
50
100
150
200
250
Gas Coal amp lignite Nuclear
GW
Installed capacity in the EU
copyright copy 2018 ICIS wwwiciscom 95
Coal phase-out plans
CountryCapacity
(MW)Phase-out date
UK 11160 2025
Italy 7806 2025
Netherlands 4692 2030
Denmark 2776 2030
France 2335 2021
Finland 1693 2029
Portugal 1677 2030
Ireland 855 2025
Austria 644 2025
Sweden 130 2022
copyright copy 2018 ICIS wwwiciscom 96
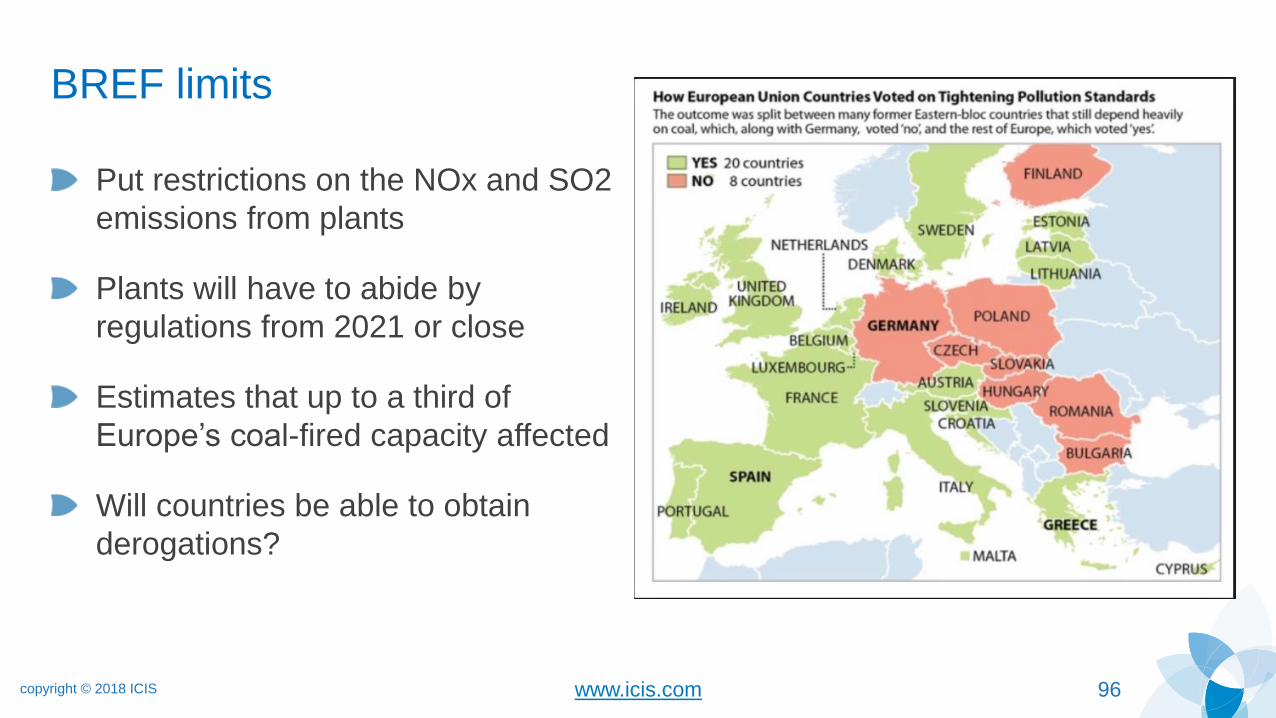
BREF limits
Put restrictions on the NOx and SO2
emissions from plants
Plants will have to abide by
regulations from 2021 or close
Estimates that up to a third of
Europersquos coal-fired capacity affected
Will countries be able to obtain
derogations
copyright copy 2018 ICIS wwwiciscom 97
Capacity market legislation
Council Parliament
Rule
New plants will only be eligible to receive payments in a capacity
market if their emissions are below 550 gr CO2KWh or if their
emissions are less than 700 Kg CO2
New plants will only be eligible to receive payments in a capacity market if their emissions are below 550 gr CO2KWh However specific lower limit of 200 Kg
CO2 on average per year per installed KW is applied to plants in a strategic reserve
Date applicable
2025 (new) 2030 (existing) 2019 (new) 2024 (existing)
Coal-fired plants wanting to enter a capacity market will be affected by
EU legislation in the Electricity Market Design Regulation
Hard coal 08tMWh
Lignite 11tMWh
700 (Council) 10 7
200 (Parliament) 3 2
copyright copy 2018 ICIS wwwiciscom 98
EU Coallignite capacity forecast 2018-2030
Coallignite capacity expected to decline from 139GW in 2018 to
88GW in 2025 and 58GW in 2030
0
20000
40000
60000
80000
100000
120000
140000
160000
2018 2019 2020 2021 2022 2023 2024 2025 2026 2027 2028 2029 2030
MW
EU coal amp lignite capacity by country 2018-2030 (MW)
Germany Poland UK Czech Republic Spain Italy NetherlandsGreece Bulgaria Romania Denmark France Finland PortugalHungary Slovenia Ireland Austria Slovakia Croatia Sweden
Source ICIS Source ICIS
copyright copy 2018 ICIS wwwiciscom 99
EU Coallignite capacity forecast 2018-2030
Coallignite capacity expected to decline from 139GW in 2018 to
88GW in 2025 and 58GW in 2030
0
5000
10000
15000
20000
25000
30000
35000
40000
45000
MW
EU coal amp lignite capacity 2018 and 2030 (MW)
2018 2030Source ICIS
copyright copy 2018 ICIS wwwiciscom 100
Differing trends for coal and lignite
We expect coal capacity to fall considerably while lignite will prove more resilient
Coal capacity to fall from 87GW in 2018 to 26GW in 2030
Lignite to decline from 52GW in 2018 to 32GW in 2030
0
10000
20000
30000
40000
50000
60000
70000
80000
90000
100000
MW
EU coal and lignite capacity 2018-2030 (MW)
Coal LigniteSource ICIS
Source ICIS
Netherlands Coal phase-
out and carbon price floor
copyright copy 2018 ICIS wwwiciscom 102
Complete coal phase-out by 2030
Currently the Netherlands has 47GW coal-fired capacity available (5 plants)
three of which came online as recently as 2015
Remaining units
Source ICIS
copyright copy 2018 ICIS wwwiciscom 103
Complete coal phase-out by 2030
The two oldest plants will be forced to close at the end of 2024 the three
newest plants by the end of 2029
Currently the Netherlands has 47GW coal-fired capacity available (5 plants)
three of which came online as recently as 2015
Remaining units
Source ICIS
copyright copy 2018 ICIS wwwiciscom 104
Dutch CO2 emissions and targets
Urgenda ruling called for 25 cut in CO2 (compared to 1990) by 2020 ndash
government in danger of missing this target
Government has set its own ambitions for a 49 cut by 2030 ndash this is driving
the plans for coal phase-out and the carbon price floor
0
50
100
150
200
250
mtC
O2
Dutch greenhouse gas emissions
Actual Urgenda target Coalition target
Source ICIS
copyright copy 2018 ICIS wwwiciscom 105
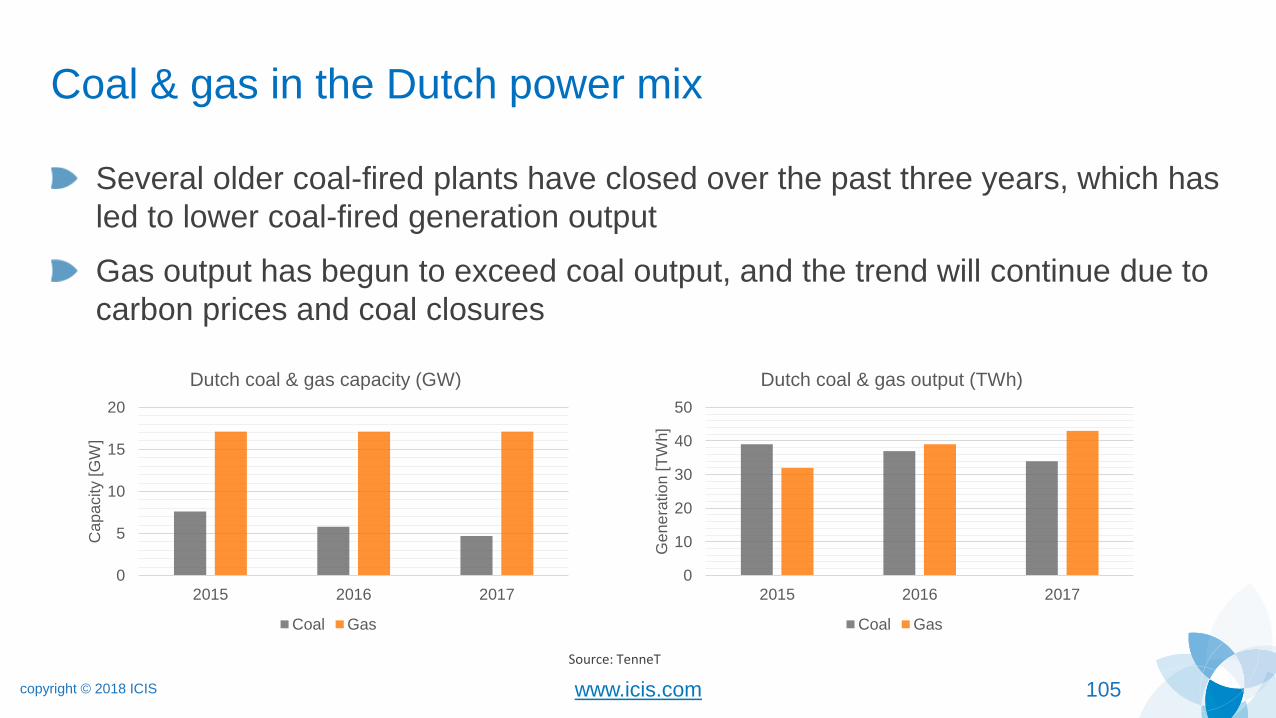
Coal amp gas in the Dutch power mix
Several older coal-fired plants have closed over the past three years which has
led to lower coal-fired generation output
Gas output has begun to exceed coal output and the trend will continue due to
carbon prices and coal closures
0
5
10
15
20
2015 2016 2017
Cap
acity [
GW
]
Dutch coal amp gas capacity (GW)
Coal Gas
0
10
20
30
40
50
2015 2016 2017
Ge
ne
ratio
n [T
Wh]
Dutch coal amp gas output (TWh)
Coal Gas
Source TenneT
copyright copy 2018 ICIS wwwiciscom 106
Modelling Impact on coal output
Coal capacity will close in line with the announced dates (20252030)
Output will be driven partially by these closures but also by our carbon price
expectations
0
500
1000
1500
2000
2500
3000
3500
4000
4500
5000
Cap
acity [
MW
]
Dutch coal capacity forecast (MW)
0
5
10
15
20
25
30
Ge
ne
ratio
n [T
Wh]
Dutch coal generation forecast (TWh)
Source ICIS
copyright copy 2018 ICIS wwwiciscom 107
Modelling Impact on gas output
Gas-fired output will increase through to 2023 as EUA prices drive fuel switching
Output will decline in the later 2020s due to softening EUAs and increased RES
Full coal phase-out in 2030 will lead to an increase in gas output
0
2000
4000
6000
8000
10000
12000
14000
16000
18000
20000
Cap
acity [
MW
]
Dutch gas capacity forecast (MW)
0
10
20
30
40
50
60
70
80
Ge
ne
ratio
n [T
Wh]
Dutch gas generation forecast (TWh)
Source ICIS
copyright copy 2018 ICIS wwwiciscom 108
Modelling Price impact
46
48
50
52
54
56
58
Duts
ch
po
we
r p
rice
fo
reca
st [euro
MW
h] Dutch power price forecast (euroMWh)
Final three coal
plants close
Prices driven higher by
EUA price increase
Fuel switching seen
EUA prices fall increasing
offshore wind and solar
output pressures prices
lower
Gas and coal
prices soften
new
interconnectors
Source ICIS
copyright copy 2018 ICIS wwwiciscom 109
Carbon price floor plan
In addition to the coal phase-out the government plans to introduce a carbon price floor for the
power sector
The floor would start at euro18tonne in 2020 increasing to euro43tonne in 2030
We anticipate the floor to be below EUA prices until 2026
0
10
20
30
40
50
Car
bo
n p
rice
flo
or
[eurot
on
ne
]
ICIS EUA forecast vs proposed Dutch carbon price floor
Proposed price floor ICIS carbon priceSource ICIS
copyright copy 2018 ICIS wwwiciscom 110
Carbon price floor ndash coal amp gas output
We anticipate that the carbon price floor would have no impact for the first five years after
implementation
From 2026-2030 the price floor would lead to a reduction in both coal and gas output
compared to the base case
0
5
10
15
20
25
30
Ge
ne
ratio
n [T
Wh]
Dutch coal output forecast (TWh)
Base case Carbon price floor
0
10
20
30
40
50
60
70
80
Ge
ne
ratio
n [T
Wh]
Dutch gas output forecast (TWh)
Base case Carbon price floor
Source ICIS
copyright copy 2018 ICIS wwwiciscom 111
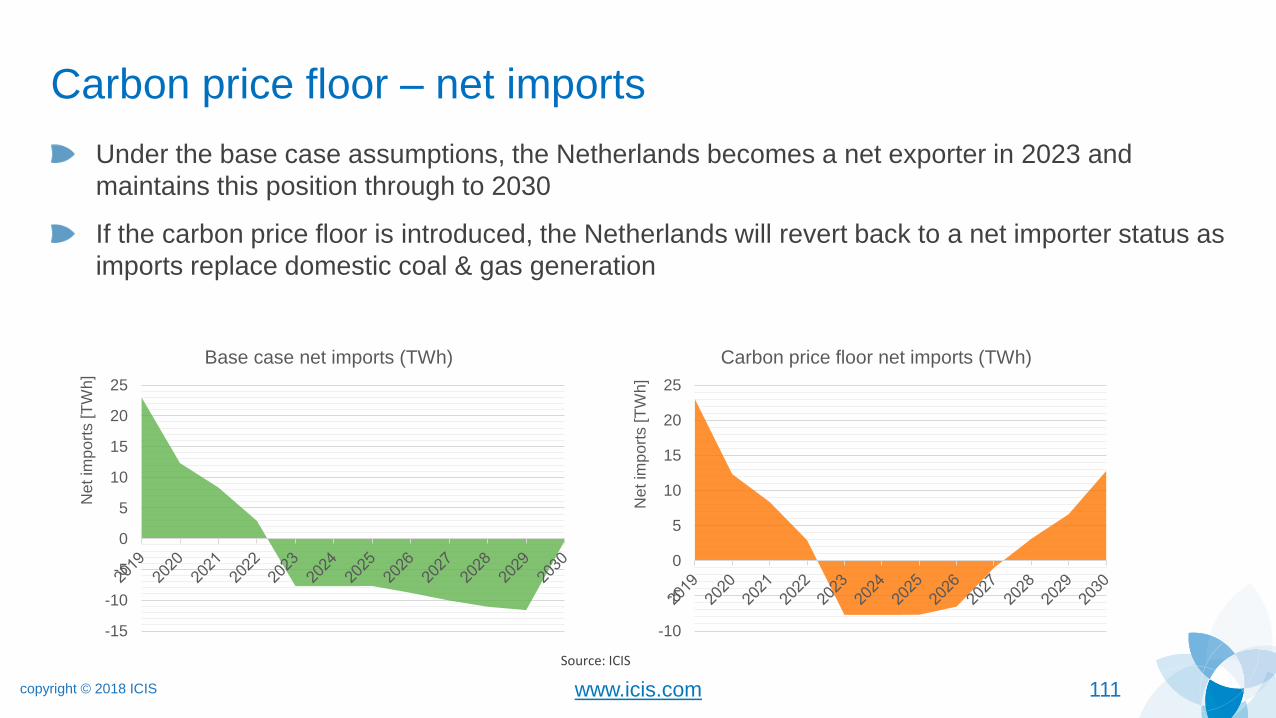
Carbon price floor ndash net imports
Under the base case assumptions the Netherlands becomes a net exporter in 2023 and
maintains this position through to 2030
If the carbon price floor is introduced the Netherlands will revert back to a net importer status as
imports replace domestic coal amp gas generation
-15
-10
-5
0
5
10
15
20
25
Net im
po
rts [T
Wh
]
Base case net imports (TWh)
-10
-5
0
5
10
15
20
25
Net im
po
rts [T
Wh
]
Carbon price floor net imports (TWh)
Source ICIS
copyright copy 2018 ICIS wwwiciscom 112
Carbon price floor ndash prices
From 2026 the carbon price floor would start to increase prices
Modelling suggests that annual prices would be on average euro148MWh higher
than the base case 2026-2030
42
44
46
48
50
52
54
56
58
60
2019 2020 2021 2022 2023 2024 2025 2026 2027 2028 2029 2030
Dutc
h p
ow
er
price
[euro
MW
h]
Dutch power price forecast (euroMWh)
Base case Carbon price floorSource ICIS
copyright copy 2018 ICIS wwwiciscom 113
Carbon price floor ndash Emissions
Under the base case assumptions power sector emissions would decline only
marginally through to 2029 before a big drop associated with coal phase-out in 2030
The carbon price floor would lead to a much more significant drop 2026-2030
However the emissions decline would be cancelled out by an increase elsewhere
0
5
10
15
20
25
30
35
40
45
50
Po
we
r se
cto
r e
mis
sio
ns [M
tCO
2]
Base case power sector emissions
0
5
10
15
20
25
30
35
40
45
50
Po
we
r se
cto
r e
mis
sio
ns [M
tCO
2]
Carbon price floor power sector emissions
Source ICIS
Germanylsquos coal phase-
out scenario analysis
copyright copy 2018 ICIS
Agenda
1) The bdquocoal commissionldquo at work
2) Market fundamentals
3) Our phase-out scenarios
4) Impact on German power prices
5) Hambacher Forest and its implications
copyright copy 2018 ICIS wwwiciscom 116
The bdquocoal commissionldquo
Two working groups
economic development and jobs in
the region
Energy industry and climate goals
Plenary and WGs meet once a
month
Equal voting rights
Two-thirds majority
Four commission leaders
Eight representatives of federal ministries (economy environment internal affairs labour transport finance agriculture and education)
Six representatives of federal states (North Rhine-Westphalia Brandenburg Saxony Saxony-Anhalt Lower Saxony and Saarland)
Three members of parliament without voting rights (CDU CSU and SPD)
24 experts (political groups research institutes associations NGOs and the private sector)
The secretariat with seven people is hosted within the economy ministry
copyright copy 2018 ICIS wwwiciscom 117
Aims and timeplan for decision making
Guidelines
Options for closing gap to 2020 target
Measures to ensure 2030 target
achievement
Step-wise reduction and phase-out of
coal generation incl phase-out date
Ensuring financial security for structural
changes
Potentially delaying final report
depending on ability to find consensus
Current status
1516 November next meeting discussiondetails expected regarding phase-out
So far intermediate report on structuralchanges adopted on 1 Nov details on financig instruments levels missing
Aim to have final report before end of year interim report expected by mid-December
German coalition struggle could impact theCommissions work (depending on nextCDU leader) pressure to meet timeplan
copyright copy 2018 ICIS wwwiciscom 118
Power generation in Germany
2017 generation
Lignite 134 TWh (242)
Hard coal 817 TWh (148)
Total production was 5571 TWh
Combined lignite and hard coal
~80 of emissions
0
100
200
300
400
500
600
2010 2011 2012 2013 2014 2015 2016 2017
An
nu
al D
E p
ow
er
ge
ne
ratio
n [T
Wh
]
Lignite Hard coal Nuclear Gas Oil
Hydro Biomass Wind Solar Other
Source ICIS
copyright copy 2018 ICIS wwwiciscom 119
Capacity development ndash bdquomoderate scenarioldquo
Installed capacity 2018
Hard coal 227 GW
Lignite 20 GW
Lignite reserve 18 GW increasing
to 27 GW in 2019
Additional 23 GW hard coal and 30
GW lignite in grid reserve (not
available to market)
0
50
100
150
200
250
300
Insta
lled
ca
pa
city [G
W]
Lignite Hard coalNuclear Natural gasOil Hydro pump storage totalHydro reservoir Hydro run-of-riverBiomass Wind (onshore)Wind (offshore) Solar PVGeothermal
Source ICIS
copyright copy 2018 ICIS wwwiciscom 120
Scenario set-up
Four phase-out scenarios
Moderate 45 GW reduction by 2020 halved by 2030
Slow Reduction by approx frac14 towards2030
Speedy 105 GW drop towards 2020 70 drop by 2030
Lignite-only Lignite phase-out until 2030 hard coal stable
Lifetime approach for hard coal and lignite
Initial capacity reduction towards 2020 target
All other parameters unchanged
Nuclear phase-out by 2022
Nat gas capacity adjusted by additions and closures fluctuating around 24 GW
Hydro fluctuating around 96 GW
Wind onshore auction results+adjustedEEG2017 corridor
Wind offshore Adjusted EEG2017 corridor
Solar PV Auction+adjusted EEG2017 corridor
copyright copy 2018 ICIS wwwiciscom 121
Phase-out scenarios ndash capacity development
00
50
100
150
200
250
Insta
lled
lig
nite
ca
pa
city (
GW
)
Moderate lignite Slow lignite
Speedy lignite Lignite-only lignite
00
50
100
150
200
250
Insta
lled
ha
rd c
oa
l ca
pa
city (
GW
)
Moderate hard coal Slow hard coal
Speedy hard coal Lignite-only hard coal
Source ICIS
copyright copy 2018 ICIS wwwiciscom 122
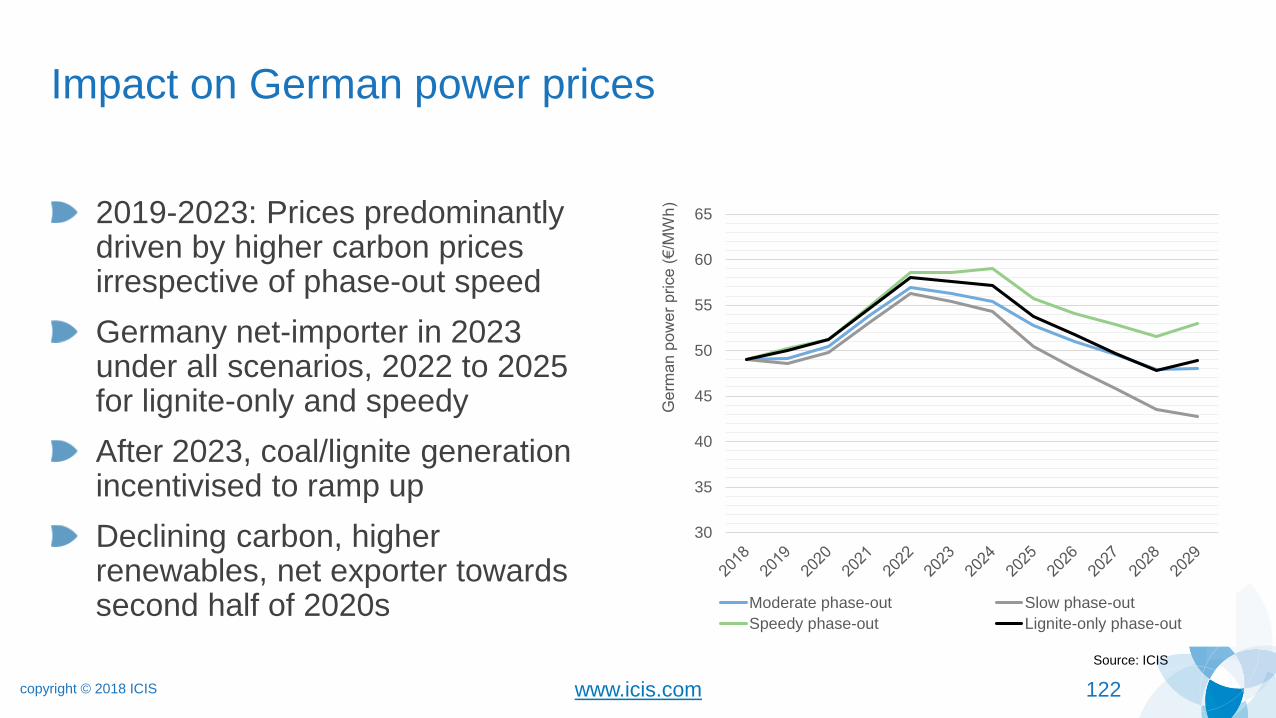
Impact on German power prices
2019-2023 Prices predominantlydriven by higher carbon pricesirrespective of phase-out speed
Germany net-importer in 2023 under all scenarios 2022 to 2025 for lignite-only and speedy
After 2023 coallignite generationincentivised to ramp up
Declining carbon higherrenewables net exporter towardssecond half of 2020s
Source ICIS
30
35
40
45
50
55
60
65
Ge
rma
n p
ow
er
price
(euro
MW
h)
Moderate phase-out Slow phase-out
Speedy phase-out Lignite-only phase-out
copyright copy 2018 ICIS wwwiciscom 123
Hourly price comparison
Increasing number of
hours with high prices
in winter
Lack of gas in times
of low RES
generation
Speedy and lignite-
only scenarios more
visible spikes 30
80
130
180
230
280
330
380
430
480
530
1 6
11
16
21
26
31
36
41
46
51
56
61
66
71
76
81
86
91
96
101
106
111
116
121
126
131
136
141
146
151
156
161
166
Ge
rma
n h
ou
rly p
ow
er
price
w
ee
k 3
20
24
(euro
MW
h)
Hour of the week
Moderate phase-out Slow phase-out Speedy phase-out Lignite-only phase-out
Source ICIS
copyright copy 2018 ICIS wwwiciscom 124
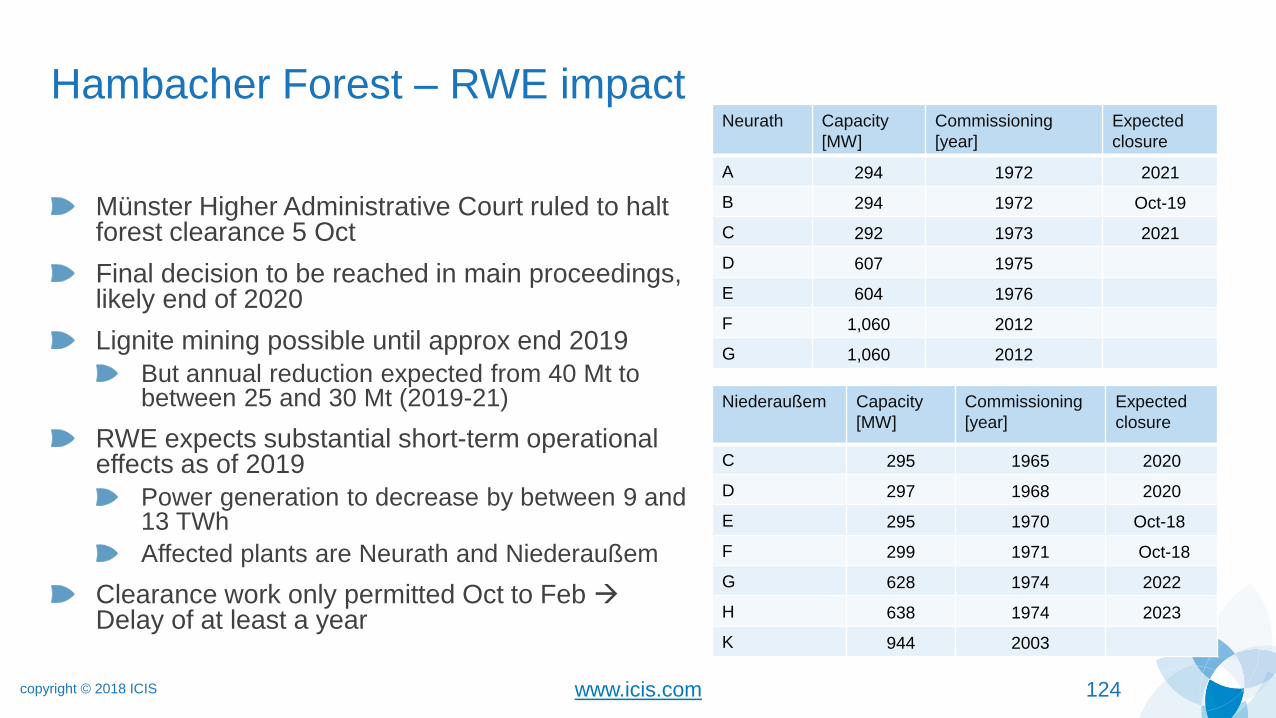
Hambacher Forest ndash RWE impact
Muumlnster Higher Administrative Court ruled to halt forest clearance 5 Oct
Final decision to be reached in main proceedings likely end of 2020
Lignite mining possible until approx end 2019
But annual reduction expected from 40 Mt tobetween 25 and 30 Mt (2019-21)
RWE expects substantial short-term operational effects as of 2019
Power generation to decrease by between 9 and13 TWh
Affected plants are Neurath and Niederauszligem
Clearance work only permitted Oct to Feb Delay of at least a year
Neurath Capacity
[MW]
Commissioning
[year]
Expected
closure
A 294 1972 2021
B 294 1972 Oct-19
C 292 1973 2021
D 607 1975
E 604 1976
F 1060 2012
G 1060 2012
Niederauszligem Capacity
[MW]
Commissioning
[year]
Expected
closure
C 295 1965 2020
D 297 1968 2020
E 295 1970 Oct-18
F 299 1971 Oct-18
G 628 1974 2022
H 638 1974 2023
K 944 2003
copyright copy 2018 ICIS wwwiciscom 125
Impact on Hambach generation
With potential closures we see a
reduction of 182 TWh in 2023
This would translate to a reduction
of 138 Mt emissions in 2023
Below our assumptions for the
bdquomoderate scenarioldquo which assumes
68 GW lignite and 36 GW hard
coal to drop-out
Hambach can be seen as preview
towards coal commission result
00
50
100
150
200
250
300
350
2018 2019 2020 2021 2022 2023
Ha
mb
ach
po
we
r g
en
era
tio
n [T
Wh
]
Neurath - full generation Niederauszligem - full generation
Neurath - reduced generation Niederauszligem - reduced generation
Source ICIS
copyright copy 2018 ICIS wwwiciscom 126
Impact of Hambach Forest decision on carbon price
On average 2020 to
2030 Hambacher Forest
scenario euro05t lower
compared to base case
Reducing emissions by
a total of 35 Mt over
2020-23
00
50
100
150
200
250
300
350
400
450
EU
A p
rice
[euro
t]
Hambach impact base case
Source ICIS
The Polish energy market
and the coal dependency
copyright copy 2018 ICIS wwwiciscom 128
Production of solid fuels in the EU
0
20000
40000
60000
80000
100000
120000
140000
160000
180000
2010 2011 2012 2013 2014 2015 2016
Eu
rosta
t so
lid f
ue
l p
rod
uctio
n [1
00
00
to
e]
Polish coal production EUs coal production without PolandSource Eurostat
copyright copy 2018 ICIS wwwiciscom 129
Future of coal in Poland ndash no clear strategy
Last adopted energy strategy ndash almost a decade old
New draft presented in 2015 under previous government
Draft update promised by December 2018 ndash COP24 in Katowice in parallel to
ldquoNational Energy and Climate Plan for 2021-2030rdquo
Bits and pieces in media
2018 July Energy Minister Krzysztof Tchoacuterzewski ldquothe share of coal in electricity
generation will systematically fall It is predicted that in 2050 it will be 50rdquo
2018 October ldquoPower from coal seen down at 50 by 2040-govt officialrdquo
copyright copy 2018 ICIS wwwiciscom 130
Industrial Emissions Directive
District heating plants (CHP) list ndash phase-out from 2023
Limited Lifetime Derogation (LLD) list ndash phase out from 2024
Unclear future of the plants in the Transitional National Plan
(TNP)
copyright copy 2018 ICIS wwwiciscom 131
Planned coal capacity additions
Max 4GW new coal capacity mid-term
Opole 900MW in late 2018 and 900MW in 2019
Byczyna (Jaworzno) unit 910MW in 2019
[2023]1000MW Ostroleka C in northeast Poland
Energy Minister Krzysztof Tchoacuterzewski about Ostroleka C lsquothe last coal-burning plant to be built in Polandrsquo
Ostrołęka C Power plant
copyright copy 2018 ICIS wwwiciscom 132
Capacity market auction to commence this week
Basic fuel Net reachable power [GW]
Existing physical generating units
Physical generating units planned
Gas 228 437
Coal and lignite 2632 402
Sum 3633 890
Sum existing and planned
4523
copyright copy 2018 ICIS wwwiciscom 133
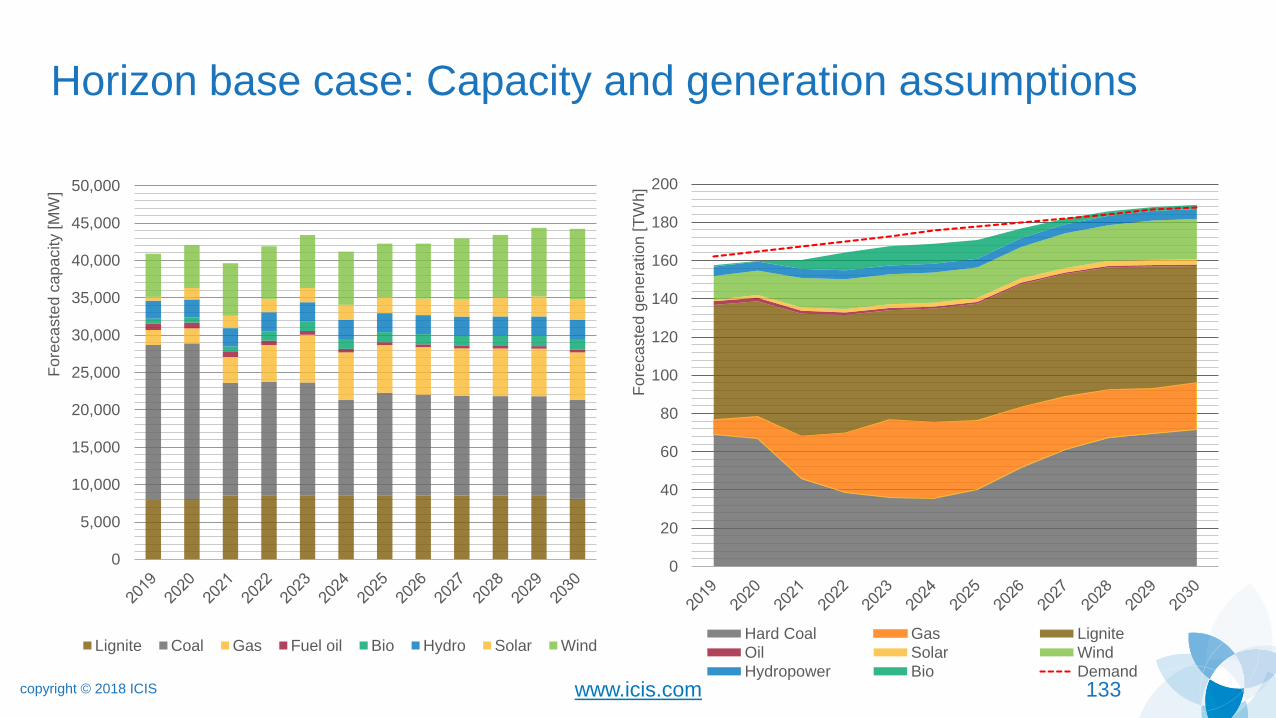
Horizon base case Capacity and generation assumptions
0
20
40
60
80
100
120
140
160
180
200
Fo
reca
ste
d g
en
era
tio
n [
TW
h]
Hard Coal Gas Lignite
Oil Solar Wind
Hydropower Bio Demand
0
5000
10000
15000
20000
25000
30000
35000
40000
45000
50000
Fo
reca
ste
d c
ap
acity [
MW
]
Lignite Coal Gas Fuel oil Bio Hydro Solar Wind
copyright copy 2018 ICIS wwwiciscom 134
Zooming in ndash EUAs price forecast and fossil generation
00
50
100
150
200
250
300
350
400
450
0
20
40
60
80
100
120
140
160
180
2019 2020 2021 2022 2023 2024 2025 2026 2027 2028 2029 2030
EU
As p
rice
fo
reca
st [euro
to
nn
e]
Ge
ne
ratio
n fo
reca
st [T
Wh
]
Hard Coal Gas Lignite EUAs price forecast
copyright copy 2018 ICIS wwwiciscom 135
2019-2030 Polish power price outlook
25
35
45
55
65
75
85
2017 2018 2019 2020 2021 2022 2023 2024 2025 2026 2027 2028 2029 2030
Po
lish
po
we
r p
rice
[euro
MW
h]
TGE day-ahead prices Horizon forecast
copyright copy 2018 ICIS wwwiciscom 136
2019-2030 Polish power price outlook
500
520
540
560
580
600
620
640
660
680
700
2019 2020 2021 2022 2023 2024 2025 2026 2027 2028 2029 2030
Po
lish
po
we
r p
rice
[euro
MW
h]
Horizon price outlook
EUA increase
outweighed by coal
and gas prices
softening
Prices driven higher by
EUA price increase
Fuel switching seenSome coal capacity
phased-out
EUA prices fall more
RES capacity comes
onlineRegional coal
closures (especially
NL phase-out) push
regional prices higher
Conclusions
copyright copy 2018 ICIS wwwiciscom 138
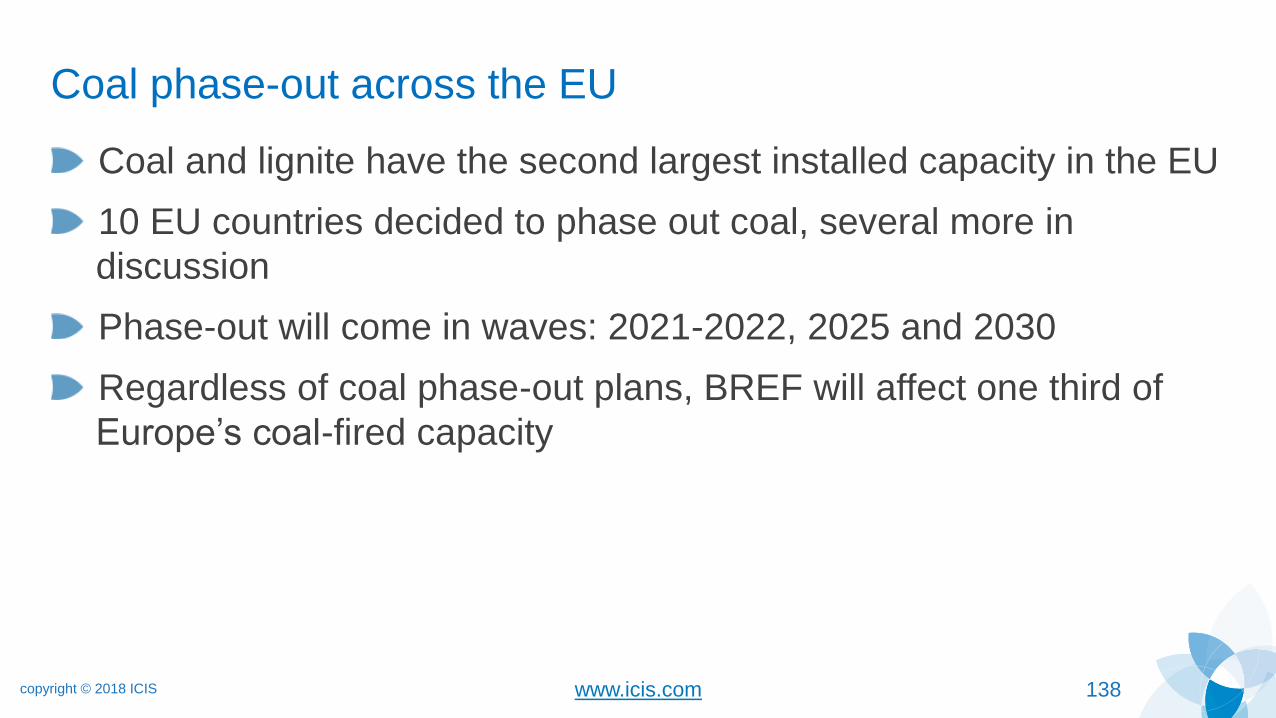
Coal phase-out across the EU
Coal and lignite have the second largest installed capacity in the EU
10 EU countries decided to phase out coal several more in
discussion
Phase-out will come in waves 2021-2022 2025 and 2030
Regardless of coal phase-out plans BREF will affect one third of
Europersquos coal-fired capacity
copyright copy 2018 ICIS wwwiciscom 139
Capacity implications
Three very different policy approaches to coal
Netherlands Complete phase out by 2030 and (potentially) a carbon price floor
Germany Gradual reduction over the next ten years driven by government intervention
Poland Attempting to keep capacity online using the capacity mechanism to provide support
None of the three countries will phase out coal rapidly
In absence of policy decision Industrial Emissions DirectiveBREF will define the pathway
0
5
10
15
20
25
30
35
40
45
2019 2020 2021 2022 2023 2024 2025 2026 2027 2028 2029 2030
Cap
acity [
GW
]
Coal-fired capacity expectations 2019-2030
Germany Poland Netherlands
Source ICIS
copyright copy 2018 ICIS wwwiciscom 140
Generation implications ndash carbon price importance
Coal generation will fall in all three
countries regardless of the coal
capacity developments because of
the bullish EUA prices
As EUA prices soften from 2024
coal-fired output will rebound
The most significant increase will be
seen in Poland as the majority of
capacity remains online 0
5
10
15
20
25
30
35
40
45
0
50
100
150
200
250
300
350
EU
As p
rice
fo
reca
st [euro
to
nn
e]
Po
we
r H
orizo
n f
ore
ca
ste
d g
en
era
tio
n [
TW
h]
Coal-fired generation 2019-2030
Germany Poland
Netherlands ICIS EUAs price forecast
Source ICIS ICIS Power Horizon
copyright copy 2018 ICIS wwwiciscom 141
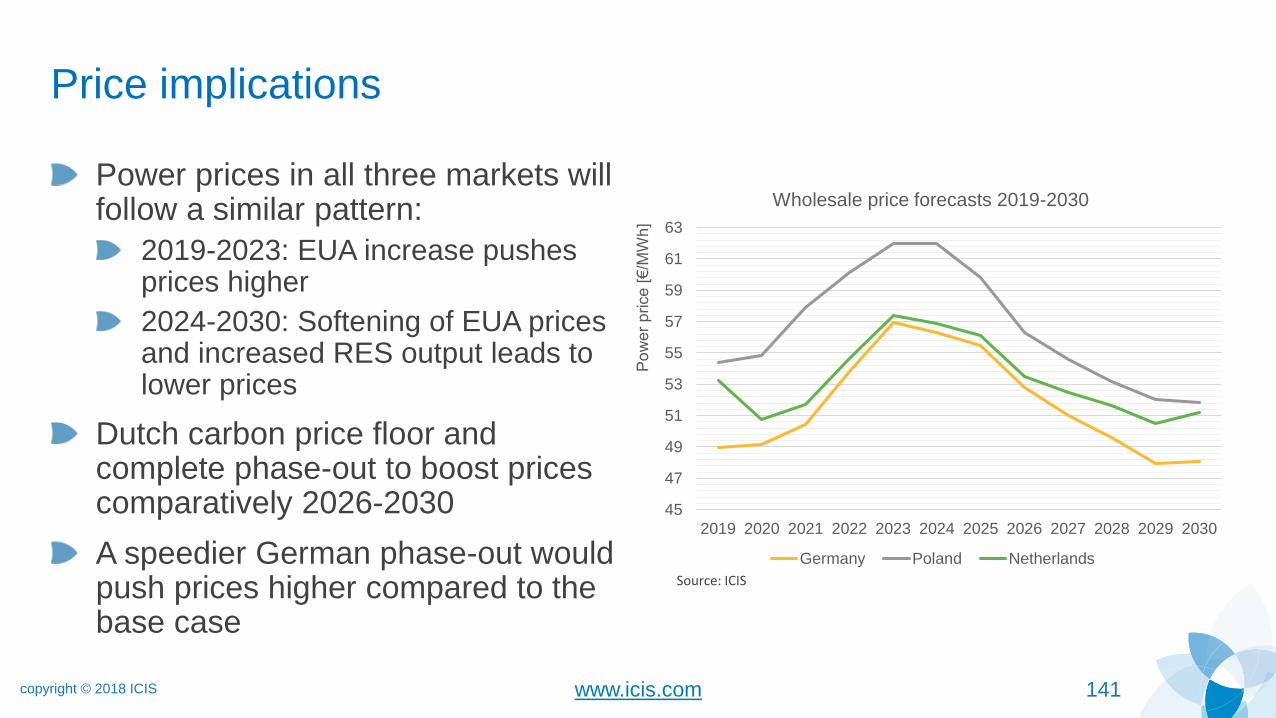
Price implications
Power prices in all three markets will follow a similar pattern
2019-2023 EUA increase pushes prices higher
2024-2030 Softening of EUA prices and increased RES output leads to lower prices
Dutch carbon price floor and complete phase-out to boost prices comparatively 2026-2030
A speedier German phase-out would push prices higher compared to the base case
45
47
49
51
53
55
57
59
61
63
2019 2020 2021 2022 2023 2024 2025 2026 2027 2028 2029 2030
Po
we
r p
rice
[euro
MW
h]
Wholesale price forecasts 2019-2030
Germany Poland Netherlands
Source ICIS
Stay focused on the power market developments that are important to your business with the new online tool from ICIS
Understand the impact of energy policy changes
Anticipate market developments across Europe
Foresee risks and spot profitable opportunities Fast
ICIS Power Perspective amp Horizon
Speak to us to find out more
Tel +44 20 7911 1919 | Email powerperspectiveiciscom | wwwiciscompowerperspective
Reliable provider of global carbon market analytics and forecasts
Learn more
Stay ahead of the carbon market trends and developments
Get the latest analysis and forecasts for global carbon trading
Make profitable investments within seconds
Strengthen you trading position
wwwiciscom
ICIS Power amp Carbon Seminar
Second Day
14-15 November 2018Berlin Germany
1230-1300 Power Purchase AgreementsVivianna Ciancibello EEX
0930-0945 WelcomePhilipp Ruf ICIS
0945-1115
Brexit and its impact on the UK electricity
market and the EU ETSHenry Evans amp Matt Jones amp Marcus Ferdinand ICIS
Mark Copley BEIS
Coffee Break
1145-1230 Renewable energy trends across EuropeMatteo Mazzoni amp Vija Pakalkaite ICIS
Goodbye and wrap-up
Brexit and its impact on the UK electricity market and the EU ETS
Henry EvansSenior Market Reporter
Matt JonesSenior Analyst ndash EU Carbon amp Power Analytics
Marcus FerdinandHead of EU Carbon amp Power Analytics
Mark CopleyDeputy Director ndash EU Exit Energy amp Climate Programme at BEIS
The future of the UK
electricity market post-
Brexit
copyright copy 2018 ICIS wwwiciscom 148
Deal or no-deal What is the timeline
November
bull Negotiators for UK and EU reach agreement in principle on Withdrawal Agreement
bull 25 November EU emergency Council meeting on Agreement
December
bull UK Parliament likely to vote on Agreement in early December
bull 13-14 Dec ndash last EU Council of 2018
2019
bull UK and EU parliamentary approval required for any deal
bull New UK legislation will need to be passed before 29 March
bull Potential for extension of date if no deal agreed
copyright copy 2018 ICIS wwwiciscom 149
EU vs UK ndash where do they both stand on energy
EU Commission publishes notice on
27 April detailing the UKrsquos position
in the EUrsquos internal energy market in
the event of ldquono dealrdquo
UK government published its Brexit
white paper on 12 July following the
fabled Chequers meeting ndash pages
44-45 are the important part
copyright copy 2018 ICIS wwwiciscom 150
Will the interconnectors stop flowing power
UK currently has three underwater cables connected to the EU ndash 2GW IFA with
France 1GW BritNed with Netherlands and 500MW East-West Interconnector
with Ireland
UK and EU papers make no mention of flows between the UK and EU halting
on 29 March 2019
National Grid 28 June 2018 ndash ldquoOur internal analysis backed up by two
separate external legal views has stated that there is no legal right for the
interconnectors to be simply ldquoswitched offrdquo post Brexitrdquo
copyright copy 2018 ICIS wwwiciscom 151
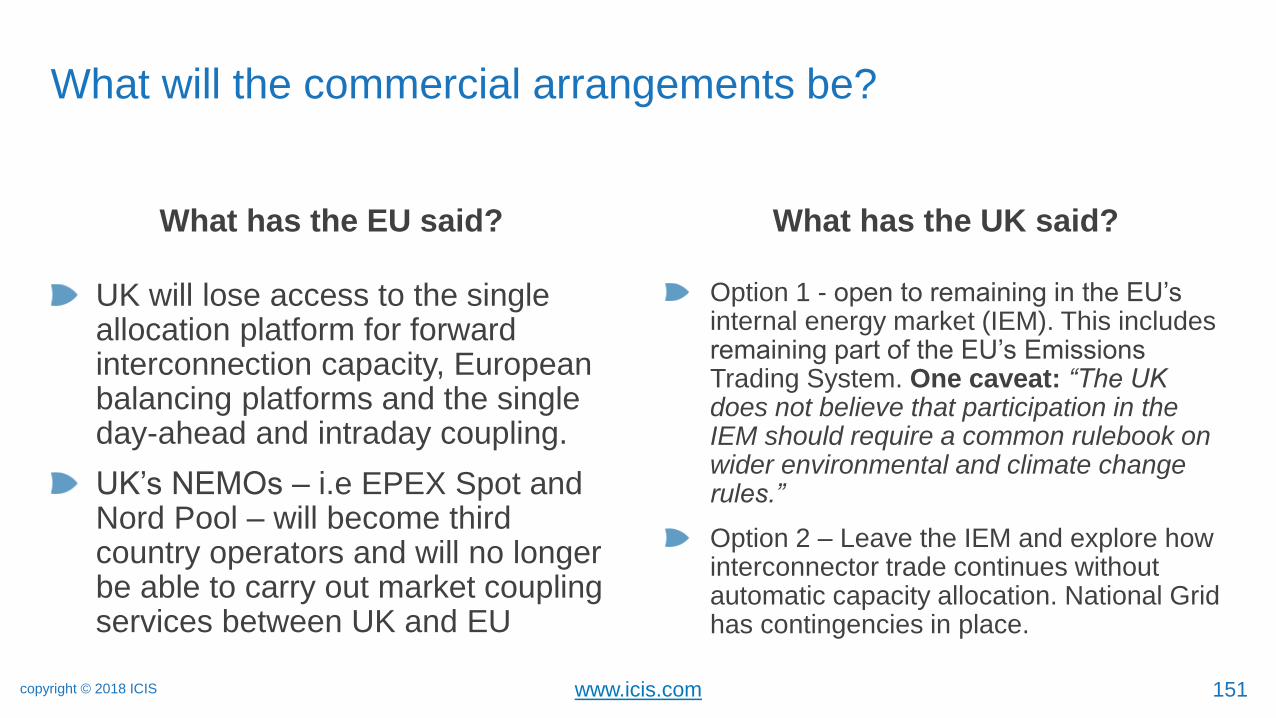
What will the commercial arrangements be
UK will lose access to the single allocation platform for forward interconnection capacity European balancing platforms and the single day-ahead and intraday coupling
UKrsquos NEMOs ndash ie EPEX Spot and Nord Pool ndash will become third country operators and will no longer be able to carry out market coupling services between UK and EU
Option 1 - open to remaining in the EUrsquos internal energy market (IEM) This includes remaining part of the EUrsquos Emissions Trading System One caveat ldquoThe UK does not believe that participation in the IEM should require a common rulebook on wider environmental and climate change rulesrdquo
Option 2 ndash Leave the IEM and explore how interconnector trade continues without automatic capacity allocation National Grid has contingencies in place
What has the EU said What has the UK said
copyright copy 2018 ICIS wwwiciscom 152
Regulations and REMIT
UK market participants will have to
register with the regulatory authority
of the Member State in which they
are active
The registration form has to be
submitted prior to entering into a
transaction which is required to be
reported
ldquoThe UK is putting in place
arrangements so that when trading
after exit businesses will have
certainty that they will not face
substantially different requirements
compared to their current
obligations under the Regulation on
Wholesale Energy Market Integrity
and Transparency (REMIT)rdquo
What has the EU said What has the UK said
copyright copy 2018 ICIS wwwiciscom 153
If the UK leaves the IEM what happens
Positive for existing interconnectors Increased price divergence between UK
and continental markets possible without market coupling
Negative for interconnectors in development Investor confidence weakens
New projects already delayed
Will liquidity in wholesale market be affected
Mark CopleyDeputy Director ndash EU Exit Energy amp Climate Programme at BEIS
BEIS Update
on Brexit
Brexit and its impact on
the EU ETS
copyright copy 2018 ICIS
Agenda
1) Brexit ndash UK installations and the short-term market impact
2) Long-term considerations for the EUA price
3) Beware of interactions
4) Future of the carbon price support
copyright copy 2018 ICIS wwwiciscom 157
Short-term considerations
UK installations will exit the EU ETS on 29 March 2019
UK brought forward its compliance deadline to 15 March 2019
UK compliance is guaranteed for emissions year 2018
Depending on broad negotiations transition period could lead to Brexit
adjustments only for phase 4
Likely no auctioning as of 1 January 2019 in case of bdquono-dealldquo scenario or
remaining uncertainty
copyright copy 2018 ICIS wwwiciscom 158
Preparing for the worst ndash a no-deal setting
Technical note on no-deal Brexit
Published 12 October 2018
2019 free allocation cannot be used by UK
operators for 2018 obligations
Recommends to open a second registry
account in another EU member state and to
transfer their EUAs to these accounts
In no dealrsquo scenario the UK government
will initially meet its existing carbon pricing
commitments via CO2 tax system
UK 2018 budget
Released on 29 October 2018
Carbon Price Support (CPS) rate at pound18t
until including the financial year 2020-21
If no-deal scenario Carbon Emissions Tax
Tax rate of pound16t (~euro18t) above an installationrsquos
emissions allowance (on top of CPS)
All stationary installations currently participating in
the EU ETS from 1 April 2019 (incl industry)
Next rate defined in 2019 budget
Emissions allowance set by EU ETS free
allocation
copyright copy 2018 ICIS wwwiciscom 159
Considerations following the preliminary agreement
Withdrawal Agreement
Published 14 Nov 2018
ldquoThe United Kingdom shall implement a
system of carbon pricing of at least the
same effectiveness and scope as that
provided by Directive 200387EC of the
European Parliament and of the Council of
13 October 2003 establishing a scheme for
greenhouse gas emission allowance
trading within the Communityrdquo
Future relationship
Released on 14 Nov 2018
ldquoConsideration of cooperation on carbon
pricing by linking a United Kingdom
national greenhouse gas emissions
trading system with the Unionrsquos
Emissions Trading Systemrdquo
copyright copy 2018 ICIS wwwiciscom 160
Short-term implications
Short-term
UK utilities expected to reduce total
hedging (in EUAs) from ~100m in
2017 to ~35m in 2030
UK utilities end 2018 locked-in 71m
EUAs for 201920
Industrials to add another
~30m~60m Brexit-related supply
Bearish risk approx euro2t-euro3t if
released Q1 20191000 euro
1200 euro
1400 euro
1600 euro
1800 euro
2000 euro
2200 euro
2400 euro
2600 euro
2800 euro
3000 euro
EU
A p
rice
[euro
to
nn
e]
hardBrexit60m hardBrexit30m base
Source ICIS
copyright copy 2018 ICIS wwwiciscom 161
Brexit impacts the market balance
In the long-term annual
balance with Brexit is tighter
given that UK is net-long
However during the middle of
phase 4 MSR operation and
abatement dynamics cause a
slightly more relaxed Brexit
balance-600
-400
-200
0
200
400
600
Tra
de
d b
ala
nce
[m
EU
As]
Annual traded balance (Brexit) Annual traded balance (non-Brexit)
Cumulative traded balance (Brexit) Cumulative traded balance (Brexit)
Cumulative traded balance (non-Brexit) Source ICIS
copyright copy 2018 ICIS wwwiciscom 162
Brexitlsquos long-term EUA price risk related to Brexit
Long-term
Assumption that transition period of
21 months (until end 2020) is
agreed
Adjustment of demand and supply
for departure of UK installations
Net long position removed from the
market
But ndash implications for parameters
like MSR000
500
1000
1500
2000
2500
3000
3500
4000
4500
EU
A p
rice
[euro
to
nn
e]
Brexit case No-Brexit case
Source ICIS
copyright copy 2018 ICIS wwwiciscom 163
Risk that market stability reserve operation is affected by Brexit
Removing UK as net
emitter reduces TNAC
MSR gets triggered less
and for fewer years in case
of Brexit
Sensitivity of TNAC around
upper threshold
-500
0
500
1000
1500
2000
2500
TN
AC
an
d M
SR
with
dra
wa
l [M
t]
MSR Brexit MSR No-Brexit TNAC Brexit
TNAC No-Brexit MSR threshold Source ICIS
copyright copy 2018 ICIS wwwiciscom 164
Carbon Price support ndash what does it actually mean
Future of UK carbon priceremains vague
In 2017 budget
Government total carbon price is set at the right level
In 2018 budget
The government will seek to reduce the CPS rate if the Total Carbon Price remains high
Carbon Emission tax level for2021 set at next budget
Delta btw 2017 and 2018 budgetapproach is approx 100m tonsbetween 2019 and 2030
0
10
20
30
40
50
60
70
EU
A p
rice
an
d U
K p
rice
flo
or
tax [euro
t]
EUA price (ICIS base case) Total carbon price (2017) inflation adjusted
Total carbon price (2018) inflation adjusted Carbon Price UK (no adjustment EU ETS participation)
Carbon Emissions Tax
Source ICISbdquoCarbon price UKldquo means EU ETS price + Carbon Price support frozen at pound18 accounting for inflation adjustment
(CET + CPS)
copyright copy 2018 ICIS wwwiciscom 165
Conclusion
A no-deal scenario would have a moderate short-term bearish effect on EUA
prices
Fundamentally we talk about extra supply of between 100 to 130m allowances until29 March
Sentiment might weigh heavier
Long-term Brexit will in principle support carbon prices
Net length removed
But MSR to be very sensitive
Highly dependant on which of the four options is chosen
Brexit and its impact on
the UK electricity market
and the EU ETS
copyright copy 2018 ICIS
Agenda
1) Will Brexit impact renewable development in the UK
2) Coal and gas generation
3) Interconnectors
4) Power price expectations
copyright copy 2018 ICIS wwwiciscom 168
Renewables in the UK ndash Historical development
Onshore wind and solar capacity grew
quickly under the Renewable Obligation
(RO) scheme but that is now closed
Since 2014 onshore wind and solar
have been excluded from the Contracts
for Difference (CfD) scheme
Therefore offshore wind looks set to
dominate capacity additions under
current policies
0
2
4
6
8
10
12
14
GW
UK renewable growth 2008-2017
Onshore wind Offshore wind Solar
Source IRENA
copyright copy 2018 ICIS wwwiciscom 169
How will Brexit impact renewable targets
The UK wants to remain in the IEM while removing itself from climate
change targets and commitments
If this were to be agreed the UK would not have to commit to a share
of the EUrsquos recently agreed 2030 renewable target of 32
If there were to be no deal this would also lead to the government
dropping out of the EU renewable target
copyright copy 2018 ICIS wwwiciscom 170
How will Brexit impact renewable targets
If this were to happen the impact on the UK would be minimal compared to current expectations
With no subsidies for onshore wind and solar future growth will come from subsidy-free projects
Funding of pound557m has already been agreed for additional CfD rounds which will lead to offshore wind growth
0
5
10
15
20
25
GW
UK renewable growth forecast to 2030
Onshore wind Offshore wind Solar
Source IRENAICIS
copyright copy 2018 ICIS wwwiciscom 171
How would a Labour government impact renewables
While Brexit will not have a major impact on renewable development a Labour government certainly would
In October the Labour Party released plans to massively increase RES capacity by 2030
Offshore wind ndash 52GW (from 8GW currently
Onshore wind ndash 30GW (from 13GW currently)
Solar ndash 35GW (from 13GW currently)
RES share in electricity ndash 85
0
20
40
60
80
100
120
GW
UK onshore wind offshore wind and solar capacity forecast
Base case Labour scenario
Source ICIS
copyright copy 2018 ICIS wwwiciscom 172
Labour targets would push down prices significantly
Our modelling suggests that if
the capacity was brought online
as planned it would significantly
reduce prices
By 2030 average annual prices
would be euro184MWh below the
base case 40
45
50
55
60
65
70
75
euroM
Wh
Power price forecast 2019-2030
Base case Labour scenario
Source ICIS
copyright copy 2018 ICIS wwwiciscom 173
The impact on capture prices would prevent subsidy-free developments
A massive expansion of renewables would lead to price cannibalisation pushing capture prices lower
By 2030 offshore wind capture prices are forecast to be euro22MWh below the base case assumption
Such low capture prices would prevent subsidy-free development in the long-term and lock in huge subsidies for existing capacity
30
35
40
45
50
55
60
65
70
75
euroW
Mh
Offshore wind capture price forecast 2019-2030
Base case Labour scenario
Source ICIS
copyright copy 2018 ICIS wwwiciscom 174
Coal and gas output in the UK - Historical
UK coal output has declined considerably since the CPS was introduced in
2013 (from 137TWh in 2012 to 21TWh in 2017)
Over the same period gas generation increased from 83TWh to 120TWh
0
20
40
60
80
100
120
140
160
TW
h
UK coal generation 2012-2018
0
20
40
60
80
100
120
140
TW
h
UK gas generation 2012-2018
Source National Grid
copyright copy 2018 ICIS wwwiciscom 175
Coal and gas output in the UK - Forecasts
All coal plants in the UK will have to close by October 2025
However given the anticipated increase in carbon prices we anticipate
coal being almost completely phased out by 2021
0
2
4
6
8
10
12
14
16
TW
h
UK coal generation forecast 2019-2030
0
20
40
60
80
100
120
140
160
180
TW
h
UK gas generation forecast 2019-2030
Source ICIS
copyright copy 2018 ICIS wwwiciscom 176
Impact on power prices
Since fuel switch has already mostly taken place the impending carbon price rise
will have less impact on the UK than on other coal-dependent countries
As a result spreads to other EU markets will narrow
45
50
55
60
65
70
euroM
Wh
Power price forecasts 2020-2030
UK Netherlands Italy
Spain Germany Poland
0
2
4
6
8
10
euroM
Wh
Power price increase 2020-2023
Source ICIS
copyright copy 2018 ICIS wwwiciscom 177
Modelling UK capacity forecast
0
20000
40000
60000
80000
100000
120000M
WUk electricity capacity forecast 2019-2030 (MW)
Nuclear Coal Gas Bio Hydro Offshore wind Onshore wind Solar
Source ICIS
copyright copy 2018 ICIS wwwiciscom 178
Modelling UK generation forecast
0
50
100
150
200
250
300
350
400
TW
hUK electricity generation forecast 2019-2030 (TWh)
Nuclear Coal Gas Bio Hydro Offshore wind Onshore wind Solar
Source ICIS
copyright copy 2018 ICIS wwwiciscom 179
Modelling UK generation forecast
0
50
100
150
200
250
300
350
400
2019 2020 2021 2022 2023 2024 2025 2026 2027 2028 2029 2030
TWh
UK electricity generation forecast 2019-2030 (TWh)
Nuclear Coal Gas Bio Hydro Offshore wind Onshore wind Solar Demand
Source ICIS
copyright copy 2018 ICIS wwwiciscom 180
Modelling UK generation forecast
0
50
100
150
200
250
300
350
400
TW
hUK electricity generation forecast 2019-2030 (TWh)
Nuclear Coal Gas Bio Hydro
Offshore wind Onshore wind Solar Imports Demand
Source ICIS
copyright copy 2018 ICIS wwwiciscom 181
Modelling UK import forecast
0
10
20
30
40
50
60
70
80
90
100T
Wh
UK net imports 2019-2030 (TWh)
Belgium Denmark France Germany Netherlands Norway
Source ICIS
copyright copy 2018 ICIS wwwiciscom 182
Modelling UK power price forecast
50
52
54
56
58
60
62
64
66
68
2019 2020 2021 2022 2023 2024 2025 2026 2027 2028 2029 2030
poundM
Wh
UK power price forecast 2019-2030 (poundMWh)
Gas prices ease
pressuring power
prices lower new
interconnector
Increasing carbon price
pushes up prices (but less
pronounced than other
markets)
Carbon prices soften
offshore wind capacity
expands increased imports
via new interconnectors
Nuclear
reduction coal
closures in
neighbouring
countries
Source ICIS
copyright copy 2018 ICIS wwwiciscom 183
Conclusions
The biggest disrupter to the power market comes not from Brexit but from a
Labour government
This would likely lead to a rapid renewable expansion which would pressure prices lower
Under current policies renewable growth will be dominated by offshore wind in
the mid-term due to the absence of subsidies for onshore wind or solar
Despite an official coal phase-out date of October 2025 coal will be almost
completely pushed out of the mix from 2021
The UK looks set to increasingly rely on interconnectors as older thermal
capacity closes
Renewable energy trends across Europe
Matteo MazzoniSenior Analyst ndash EU Carbon amp Power Analytics
Dr Vija PakalkaiteAnalyst ndash EU Carbon amp Power Analytics
copyright copy 2018 ICIS
Agenda
1) Regulatory environment
Race to reach the 2020 targets
Recast Renewable Energy Directive
2) RES auctions trends
Auction designs
Auction results
3) RES costs and future outlook
4) Conclusions
copyright copy 2018 ICIS wwwiciscom 186
Renewable targets for 2020
EU level
Binding target of 20 RES in final energy
consumption in 2020 (comprised of Electricity
(RES-E) Heating amp Cooling and Transport
No binding target for RES-E
It reached 17 in 2016 and is on course for
2020
Member State level
Each country has a binding target for RES in
final energy consumption
11 member states already exceeded this target
in 2016 most of the 17 other countries are on
course to meet 2020 target
0
5
10
15
20
25
[]
EU-RES share in final energy consumption
res share target
Source ICIS based on Eurostat
copyright copy 2018 ICIS wwwiciscom 187
2020 RES share and distance to the target in 2016
-9-7-5-3-113579
Ga
p to
th
e ta
rge
ts [p
p]
14
23
16 1511 13
1013 15
25
18 18
40
20
31
14
34
17
38
24
13 13
30
23
16
25
49
20
202
0 R
ES
[
] ta
rge
ts
Source ICIS based on Eurostat
copyright copy 2018 ICIS wwwiciscom 188
2016 distance to 2020 target in energy volume
-1300
-1100
-900
-700
-500
-300
-100
100
300
Dis
tan
ce
to
ta
rge
t ke
ep
ing 2
01
6 c
on
sta
nt [T
Wh
]
Source ICIS based on Eurostat
copyright copy 2018 ICIS wwwiciscom 189
Implications of non-compliance and MS strategies
2020 can be reached by
Physical investments (both national or joint)
Administrative measures statistical transfers
Consequences of non compliance
No penalty mechanism in Directive itself
Infringement proceedingsReasoned Opinion by the EC referral to CJEU Burdensome for all parties and can take several years
Ramp-up
Statistical transfers
Wait and see
copyright copy 2018 ICIS wwwiciscom 190
Statistical transfers first deals made in late 2017 increase expected especially towardsfor 2020 delivery
Luxembourg ndash Estonia
Length 2018-2020
Volume 700MWh
Cost euro105m
Cost per unit
euro15MWh
Luxembourg ndash
Lithuania
Length 2018-2020
Volume Unknown
Cost ldquoAt least euro10mrdquo
Cost per unit around
euro15MWh
copyright copy 2018 ICIS wwwiciscom 191
Proliferation of RES tendersauctions
MS behind their RES 2020 targets
lsquowoke uprsquo and speedily install
tenderingincrease volumes
2018 ndash last year to tender multi-
technology for 2020 target 2019 ndash
last year for solar (shorter lead time)
11 MS have executed
tendersauctions
5 MS Legal frameworks in place or
about to be adopted
Source ICIS RES auctions database
copyright copy 2018 ICIS wwwiciscom 192
Countries behind the 2020 target ramp up
0
5
10
15
20
25
30
RE
S a
uctio
n r
esu
lts v
olu
me
s [G
W]
DE auction volumes ES auction volumes FR auction volumes NL auction volumes UK auction volumes other countries
Source ICIS RES auctions database
copyright copy 2018 ICIS wwwiciscom 193
Assumed cumulative generation from auctions to be added by 2020
Country Estimated additional
RES generation [TWh]
Progress in closing the
gap
France 100 79
Germany 100 120
Netherlands 274 590
Poland 04 14
Spain 84 333
United Kingdom 45 51
total 609 152
total without UK 564 181
copyright copy 2018 ICIS wwwiciscom 194
Renewable energy targets for 2030
Recast Renewable Energy Directive
ndash 2030 target for RES in final
energy consumption
Progress control in Governance
Regulation
Draft national energy and climate
plans (trajectories) ndash end 2018
ldquoGap fillerrdquo mechanisms
Overall EU target 32
No national binding targets
2020 targets will be baseline
copyright copy 2018 ICIS wwwiciscom 195
RES share 2020 ndash the baseline through 2030
ldquoUnder no circumstances the
national RES share should fall
belowrdquo
If deviated from the baseline ndash
additional national measures to be
taken ldquowithin one yearrdquo
Additional measures to take
Within 2021 or 2022
Statistics compiled
Oct 2021 national statistics agencies
Jan 2022 Eurostat publication
Fulfilling the 2009 RED requirements
National binding target
Full year 2020
copyright copy 2018 ICIS wwwiciscom 196
Recast Directive and RES support schemes
ldquoDesigned in a market-based wayrdquo
Competitive bidding except for small scale RES
Feed-in Premiums instead of Feed-in Tariffs or Certificates of Origin (ldquogreen certificatesrdquo)
Bidding should be non-discriminatory (technology neutral)
Opening up support schemes
Voluntary
At least 5 of newly supported RES capacity in 2023-2026 increase to 10 in 2027-2030)
Or the level of interconnectivity of a MS if lower
Guarantees of Origin and supported electricity
RES auction trends
copyright copy 2018 ICIS wwwiciscom 198
Trends in auction designs
From technology-specific to multi-technology
Germany and France have had ldquopilotrdquo auctions wind vs solar
Legal frameworks for ldquotechnology neutralrdquo in Hungary Finland Ireland Lithuania Spain Slovenia
But many limitations
From tariffs towards premiums
Floating FiP Denmark Finland France Germany Hungary Ireland Italy Lithuania Netherlands Slovenia Spain
Contracts for Difference Denmark(offshore) Hungary Greece Poland the UK Italy (forthcoming)
Fixed FiP Denmark (solar) Estonia
copyright copy 2018 ICIS wwwiciscom 199
Auction results the success of solar PV
0
5
10
15
20
25
30
Aw
ard
ed
vo
lum
es in
au
ctio
ns in E
uro
pe
[G
W]
solar wind onshore wind offshore biogasampbiomass hydro other RESSource ICIS RES auctions database
copyright copy 2018 ICIS wwwiciscom 200
Trends in auction results solar vs wind
0
50
100
150
200
250
Str
ike
price
ave
rage
s [
euroM
W]
Technology specific RES auctions
German Auction-Solar German Auction-Wind
French Auction-Solar French Auction-Wind
Greek Auction-Solar Greek Auction-Wind
Lithuanian Auction-Wind
0
50
100
150
200
250
Str
ike
price
ave
rage
s [
euroM
W]
Multi-technology RES auctions
German Auction-Solar Spanish Auction-Solar
Spanish Auction-Wind French Auction-Solar
Dutch Auction-Solar Dutch Auction-Wind
Slovenian Auction-Solar Slovenian Auction-Wind
UK Auction-Solar UK Auction-Wind
Source ICIS RES auctions database Source ICIS RES auctions database
copyright copy 2018 ICIS wwwiciscom 201
Offshore wind is picking up
0
50
100
150
200
250
Str
ike
price
s in
re
ce
nt E
U o
ffsh
ore
win
d p
roje
cts
[euro
MW
h]
Source ICIS Power Perspective
copyright copy 2018 ICIS wwwiciscom 202
Offshore wind ndash closing the RES gap
0
5
10
15
20
25
30
35
Bu
ilt a
nd
pla
nn
ed
off
sh
ore
win
d c
ap
acity [M
W]
Source ICIS Power Perspective
copyright copy 2018 ICIS wwwiciscom 203
Turbine
Balance of System
Financial
Turbine32
Development3
Foundations15
Electrical infastructure
9
Assembly amp Installation
19
Commissioning1
Decommissioning
5
Contingency6
Finance9
Insurance1
Breakdown of offshore wind costs
Recipe for a ldquosubsidy freerdquo offshore trends
Larger turbines
Synergies with adjacent
sites
Grid connection
Longer lifetime (30y)
Potential costs reductions
Source NREL
Renewable energy outlook
copyright copy 2018 ICIS wwwiciscom 205
RES outlook
copyright copy 2018 ICIS wwwiciscom 206
RES costs developments
The overall trend sees all
renewable costs (LCOEs) falling
over the next decade
Solar and offshore wind will be
the technologies experiencing
the biggest reduction
Market parity may come sooner
than expected
However RES business plan
needs stability -gt PPAs
0
20
40
60
80
100
120
Estim
ate
d R
ES
-E L
CO
ES
[euro
MW
]PV Wind onshore Wind offshore Hydro Bioenergy
Sources IRENA BEIS auctions Bundesnetzagentur McKinsey Lazard 2017-18
copyright copy 2018 ICIS wwwiciscom 207
Centralized vs Decentralized
Source Lazard 2018
Solar has the largest potential in terms of penetration
Solar costs vary a lot based on the size of the plant
Onshore wind and utility scale PV are already cost-competitive with conventional thermal plants
Two different market models may be competing
Grid defection problem
0
50
100
150
200
250
RooftopRes
RooftopCampI
Community Utility Scale- Crystaline
Utility Scale- Thin film
Wind
LC
OE
pe
r P
V a
nd
win
d insta
llatio
ns [euro
MW
]
copyright copy 2018 ICIS wwwiciscom 208
Storage is catching up and it may be the game-changer
0
100
200
300
400
500
600
Sto
rage
ndashe
ne
rgy insta
llatio
n c
osts
euroM
Wh
Pumped Hydro CAES li-Ion (LFP) NaS Vanadium
Source IRENA 2018
Higher RES in the system will require a higher degree of flexibility
Electricity storage will play a crucial role in enabling the next phase of the energy transition
Prices are falling and based on the difference services that could be provided storage may become attractive quite soon
Power-to-gas may enter into the game (seasonal storage)
copyright copy 2018 ICIS wwwiciscom 209
RES costs and Horizon power price outlook
10
20
30
40
50
60
70
80
90
100
110
RE
S a
nd
Horizo
n p
rice
fo
reca
st [E
UR
MW
h]
Horizon price outlook PV LCOE Wind onshore LCOE Wind offshore LCEO
Source ICIS Power Horizon BEIS auctions Bundesnetzagentur McKinsey Lazard 2017-18
copyright copy 2018 ICIS wwwiciscom 210
Conclusions
Targets Unclear destiny of binding national targets
EU as a whole is at risk to miss the 2020 target as the worst performers also are largest consumers
Statistical transfers can help fill the gap but will likely not be used for entire delta
Uncertainty regarding implications of not meeting national targets
PolicyRamp up of support and statistical transfers in early 2020s
Technology neutral auctions is the new black in mid-term
PPAs will play an important role
Targets
Policies
Costs
Market impact
copyright copy 2018 ICIS wwwiciscom 211
CostsRenewables costs will continue to fall
Wind and solar utility-scale projects are already competitive with conventional thermal
Storage systems will be essential in driving the decarbonisation
Market impactGrid-parity is already a reality in some cases while market parity maybe just behind the corner
Carbon price pushing up power prices will make renewables far more competitive reducing the need for subsidies
Power markets design remains an open issue
Targets
Policies
Costs
Market impact
Conclusions
Stay focused on the power market developments that are important to your business with the new online tool from ICIS
Understand the impact of energy policy changes
Anticipate market developments across Europe
Foresee risks and spot profitable opportunities Fast
ICIS Power Perspective amp Horizon
Speak to us to find out more
Tel +44 20 7911 1919 | Email powerperspectiveiciscom | wwwiciscompowerperspective
Reliable provider of global carbon market analytics and forecasts
Learn more
Stay ahead of the carbon market trends and developments
Get the latest analysis and forecasts for global carbon trading
Make profitable investments within seconds
Strengthen you trading position
wwwiciscom
Viviana Ciancibello Business Developer EEX
ICIS Power and Carbon Seminar
Berlin 15 November 2018
Power Purchase Agreements
Hedging via EEX Power Futures
A few key figures
copy EEX AG 2018 2
32 June 2018 new binding 2030 renewable
energy target for the EU
euro62bn Feb 2018 IRENA report of estimated
average investment in renewable energy
per year to reach 34 capacity in the EU
17 2016 estimated share of renewable energy
in the EUs gross final energy consumption
Source EU Commission Bloomberg
One PPA is not like the other
3
Power Purchase Agreement (PPA)
Long term contract between a party generating and selling electricity and a
party purchasing electricity Have existed for decades
Corporate PPA
Renewable Corporate PPA
Electricity traded between the two parties comes from a Renewable Energy
power plant PPAs are necessary to be in place prior to a RE asset
developer securing financing from a bank for their project Purchasers
are attracted by lower prices and the lsquogreen credentialsrsquo in having their power
supply come from 100 renewable sources RE Corporate PPAs are often
fixed for long periods up to 15 years to ensure revenue security for the
developer
Corporate PPAs enable businesses to source electricity from generators at
an agreed price while giving producers a reliable guaranteed buyer at a
stable price
copy EEX AG 2018
RE Corporate PPAs are quickly gaining in popularity
in Europe
4
Around 6 of new installed wind
power capacity in Europe in the
last 5 years is under PPAs
In Europe over 1GW of power was contracted
under PPAs in 2017 with 95 of this volume
coming from the Netherlands Norway
Sweden and the UK due to favourable policy
conditions
More PPAs in Germany and Europe are
expected once wind and solar assets start
coming off of subsidies in the next few
years
Source WindEuropecopy EEX AG 2018
Who are the Corporates and what is driving them
5
RE 100 is a global initiative uniting more than 100 influential
businesses committed to sourcing 100 of their power
supply from renewable electricity by a specified year
Table source RE 100copy EEX AG 2018
EEX lists full Power Futures curves in 16 European
market areas
copy EEX AG 2018 6
EEX connects 264 trading
participants from 28 countries
8 Austria
1 Belgium
1 Bulgaria
1 Croatia
20 Czech Republic
7 Denmark
2 Finland
13 France
57 Germany
2 Greece
3 Hungary
1 Ireland
34 Italy
5 non-European participants
Canada Cayman Islands USA
Exchange traded EEX Power Futures
EEX Trade Registration Services for Power Futures
New Market Area As of 31 May 2018
1 Luxembourg
10 Netherlands
6 Norway
10 Poland
1 Portugal
3 Romania
4 Slovakia
4 Slovenia
14 Spain
3 Sweden
20 Switzerland
33 United Kingdom
How are EEX Members active in PPAs
7
EEX Members buy Power
via Long-Term PPAs
and build RE assets
EEX Members provide
balancing services on Spot
amp hedge via Futures
RE Developers sell Power via
Long-Term PPAs
EEX Members sell Power from their own
RE assets via LT Corporate PPAs
Banks provide financing
once PPA is in place
copy EEX AG 2018
euro
0
5
10
15
20
25
30
35
40
45
50
0
5
10
15
20
25
30
2019 2020 2021 2022 2023 2024 2025 2026 2027 2028
Pri
ce (
EUR
)
MW
MW Price
PPAs affect the hedging profile of EEX Members
and extends it to the long-term
8
Old hedging horizon to Cal+3
New hedging horizon to Cal+10
EEX members have been using Power Futures to hedge merchant risk from
conventional power plants for years
EEX is investigating listing further calendar expiries to support long-term
hedging of Renewable Energy assets
10-Year PPA Fixed Price and Volume Profile
Current EEX Futures to Cal+6
copy EEX AG 2018
How do EEX Power Derivatives help to mitigate
PPA Price Risk
9
Since 29th May 2018 15 long-term hedges of calendar contracts up to 2024
have been registered OTC in Spanish Power with a total volume of 116 TWh
copy EEX AG 2018
Market participants who enter into long-term PPAs can register a strip of cash-
settled calendar futures out to Cal+6 for clearing with EEX
This means that sellers can lock in a secure cash flow for up to 6 years
for the sale of electricity in the respective market area
Buyers lock in a guaranteed price of purchase for up to 6 years providing
certainty on their future electricity price and protecting against upswings
Therefore the purchase or sale of derivatives provides long-term price risk hedging
together with counterparty risk mitigation through the ECC clearing house
Example Long-Term Hedge cleared on 12 July on
Spanish Power
10
A 50 MW strip from July 18 to Cal+6 was cleared in Spanish Power on 12 July
2018 with an initial margin requirement of 6543286 EUR
The Initial Margin percentage of the notional value of the trade was 466
The execution price of each trade was 4985 EUR
Trade Date ProductExpiry
Year
Expiry
MonthTrade Price
Initial
Margin per
Contract
ContractsTotal Initial
Margin
Trade Volume
(in MWh)Notional Value
12072018
Spanish Power Base Month 2018 8 4985 euro 3266 euro 50 163300 euro 37200 37088 euro
Spanish Power Base Month 2018 9 4985 euro 3153 euro 50 157650 euro 37200 35892 euro
Spanish Power Base Quarter 2018 10 4985 euro 7908 euro 50 395400 euro 109500 5458575 euro
Spanish Power Base Year 2019 12 4985 euro 12527 euro 50 626340 euro 438000 21834300 euro
Spanish Power Base Year 2020 12 4985 euro 10716 euro 50 535824 euro 439200 21894120 euro
Spanish Power Base Year 2021 12 4985 euro 10862 euro 50 543120 euro 438000 21834300 euro
Spanish Power Base Year 2022 12 4985 euro 19885 euro 50 994260 euro 438000 21834300 euro
Spanish Power Base Year 2023 12 4985 euro 29959 euro 50 1497960 euro 438000 21834300 euro
Spanish Power Base Year 2024 12 4985 euro 32589 euro 50 1629432 euro 439200 21894120 euro
6543286 euro 2814300 140292855 euro
Initial Margin in of Notional Value 466
copy EEX AG 2018
Long-term Hedges contribute to overall Open
Interest in Spanish Power
11
Op
en In
tere
st M
Wh
(p
rev
day
)
Trad
ed V
olu
me
MW
h
copy EEX AG 2018
Long-term hedges cause volume spikes and contribute to Open Interest
Spanish Power now has the highest Open Interest in long-dated contracts
Daily Settlement in Illiquid Contracts and Legacy
Trades
12
In illiquid long-dated contracts where there have been no order book trades
EEX uses two methods to determine settlement prices
Fair Value Providers ask chief traders from select members what their fair
values are for settlement
Market Structure take the daily price dynamic of the last liquid expiry and
apply it to the illiquid expiries (ex Cal21 increases by 30 euroct then Cal22 ndash
Cal24 will increase by 30 euroct)
Legacy Trades are possible at EEX in order to ldquoroll overrdquo a long-term hedge
at the previously traded price once a new Cal is open
Prices which are out of range must be approved by the respective General
Clearing Member
copy EEX AG 2018
Renewable Corporate PPAs are the dawn of a new
era in the Energy Transition
13
PPAs are an enabler of new Renewable Energy
developmentshellip
Major energy players are already starting to hedge their
long-term price risk with standard EEX products
hellipbut the market is in need of more standardisation and
better risk management products in order to grow and
meet the EUrsquos ambitious targets
EEX will ensure we remain part of our Membersrsquo long-term
hedging strategy and explore opportunities to build new
PPA-related products
copy EEX AG 2018
Thank you
Viviana Ciancibello
Business Developer
European Power Derivatives
VivianaCiancibelloeexcom

ICIS is a world leading price reporting agency and analytics powerhouse for commodity markets
Prices News Analytics Data
Petro-Chemical
Energy Fertilizers
1030-1100Keynote AddressBarbara Lempp Managing Director EFET
Dr Tobias Paulun EEX
1100-1145 Forecasting European power marketsPhilipp Ruf ICIS
1245-1315 QampA with the European CommissionPeter Zapfel European Commission
Coffee Break
1215-1245What is behind the latest carbon price
moveStefan Feuchtinger ICIS
Lunch Break
1415-1445What to look out for ndash a mid- to long-term
forecast for Europersquos carbon marketMarcus Ferdinand ICIS
1445-1530Southern Europe A renewable revolution
in Italy and SpainMatteo Mazzoni amp Matt Jones ICIS
1800Networking ReceptionSponsored by EEX
Melia Hotel Tapas Bar
Coffee Break
1600-1730Coal phase-out ndash key for low carbon
transitionMarcus Ferdinand amp Matt Jones amp Vija Pakalkaite ICIS
Keynote
Address
Barbara LemppManaging Director EFET
Dr Tobias PaulunChief Strategy Office EEX
Forecasting European Power Markets
This is a sample text Insert your
desired text here Philipp RufDirector ndash Carbon amp Power Analytics
copyright copy 2018 ICIS wwwiciscom 7
We are scaling up our country coverage to build a pan-European service on power price forecasting
Sep 2018
bullBiggest countries and central Western Europe
bullAT BE DE ES FR IT NL PL UK
Dec 2018
bullBaltics
bullEE LT LV
Jan 2019
bullNordics and Czech
bullCZ DK FI NO SE
H1 2019
bullSouth-East EU and remaining
bullConstant publication
bullBG CH GR HU HR IE PT RO SI SK
copyright copy 2018 ICIS wwwiciscom 8
Model methodology
Overall methodology
Dispatch model ndash we are modelling
the hourly dispatch mimicking how
the market clearing works
Global optimization model that
minimizes all system costs subject
to a number of constrains (or
maximization of social welfare)
Formulated as a linear programming
model
Features
Optimal dispatch of generation including trade
Incorporation of start-up costs
Full EU integration capacities of all major interconnectors
Detailed hydro modelling
Accurate cycling of thermal generation
Taking into account technical restrictions part-load efficiencies reservoir levels ramping restrictions
copyright copy 2018 ICIS wwwiciscom 9
Capacity assumptions
Existing Capacities
TSO Data
hellip
Nuclear
bull Project based new capacity
bull Decommissioning based on plant by plant approach
Fossil (lignite coal gas)
bull Project based new capacity
bull Decommissioning on announced closures coal phase-out plans and lifetime approach
Renewables
bull New capacity based on subsidy systems (incl auctions) as well as long-term country strategies
bull Only minor decommissioning expected
Future Capacities
copyright copy 2018 ICIS wwwiciscom 10
What does that mean Where are capacities going
0
100
200
300
400
500
600
700
800
900
1000
ca
pa
city
Capacity Development of Modelled Countries
Nuclear Lignite Coal Gas Oil Hydropower Bio Wind Solar
copyright copy 2018 ICIS wwwiciscom 11
Trend 1 ndash coal phase-outs all over Europe
Phase-outs planned in all
modelled countries
except Poland
Some are fixed in
legislation (AT FR ES
NL UK)
Others not (DE IT)
Total reduction of
capacity
Lignite 105GW or -38
Coal 512GW or -68
0
100
200
300
400
500
600
700
800
900
1000
ca
pa
city
Capacity Development of Modelled Countries
Nuclear Lignite Coal Gas Oil Hydropower Bio Wind Solar
copyright copy 2018 ICIS wwwiciscom 12
Trend 2 ndash increase of renewables
All modelled countries
have a significant
increase of renewables
We expect the largest
increase in wind
capacity with 131GW
additional or +120
Solar will deliver
second with 118GW
additional or +77
0
100
200
300
400
500
600
700
800
900
1000
ca
pa
city
Capacity Development of Modelled Countries
Nuclear Lignite Coal Gas Oil Hydropower Bio Wind Solar
copyright copy 2018 ICIS wwwiciscom 13
Fuel price assumptions mixture of internal modelling and external benchmarks
Carbon ICIS carbon forecast
Lignite based on own assumptions
Coal Based on forward curve
(API2) and extrapolated behind the
curve
Gas Forward curve based on ICIS
price assessments behind the
forward curve we utilise World
Banklsquos natural gas forecast
000
1000
2000
3000
4000
5000
6000
7000
8000
9000
10000
price
Fuel Price Assumptions
carbon [EURtonne] lignite [EURtonne]
coal [USDtonne] gas [EURMWh]
copyright copy 2018 ICIS wwwiciscom 14
Trend 3 ndash we expect carbon prices to increase rapidly in the early years of the 2020s and relax in the later years
Political context post-2020 reform with the strengthened MSR is cutting supply short and is a game changer for the system
Participants in the last month the increased political stability incentivised financial players to participate in the system
Volume Due to the MSR abatement in the future will be necessary and will have to be delivered through fuel switch in the power sector and carbon efficiency measures in industry
000
1000
2000
3000
4000
5000
6000
7000
8000
9000
10000
price
Fuel Price Assumptions
carbon [EURtonne] lignite [EURtonne]
coal [USDtonne] gas [EURMWh]
copyright copy 2018 ICIS wwwiciscom 15
Trend 4 Brexit
Power Markets
Link to internal energy markets at risk
As UK is highly dependent on electricity imports the continued functioning of the interconnectors are crucial
Long-term policies are defined independently of Brexit
Future of UK power market highly dependent on party manifestos
Carbon Markets
Creating sentiment effect in the last weeks
Short-term effects of hard Brexit selling by utilities and industrials
Long-term solution requires adjustment of the system
Both ambition levels for carbon reduction UK and EU should not be seriously affected
copyright copy 2018 ICIS wwwiciscom 16
The base case power price forecasts
4500
5000
5500
6000
6500
7000
7500
price
fo
reca
st [E
UR
MW
h]
Power Price Forecast ndash Base Cases
AT BE ES FR DE IT NL PL UK
What is behind the latest carbon price move Have times really changed
Stefan FeuchtingerSenior Analyst ndash Carbon amp Power Analytics
Current Market Situation
copyright copy 2018 ICIS wwwiciscom 19
Last 5 years EUA price developmentsEverything before 2018 was boring
000
500
1000
1500
2000
2500
3000
ca
rbo
n p
rice [euro
to
nn
e]
EUA price
+258 in the
last 12 months+334 peak
copyright copy 2018 ICIS wwwiciscom 20
Last 5 years EUA price developmentsEverything before 2018 was boring
000
500
1000
1500
2000
2500
3000
ca
rbo
n p
rice [euro
to
nn
e]
EUA price 200 per Mov Avg (EUA price)
+258 in the
last 12 months+334 peak
EUA price developmentsVolumes are picking up EU carbon in second boom period
000
500
1000
1500
2000
2500
3000
000
500
1000
1500
2000
2500
3000
vo
lum
e [
m to
nn
es]
ca
rbo
n p
rice [euro
to
nn
e]
EUA trading volume EUA price EUA trading volume (yearly average) EUA trading volume (quarterly average)
copyright copy 2018 ICIS wwwiciscom 22
EUA price developments30-day-volatility was decreasing September massive increase towards historic heights then recently slight decrease
0
01
02
03
04
05
06
07
08
09
1
000
500
1000
1500
2000
2500
3000
30 d
ay v
ola
tilit
y
ca
rbo
n p
rice [euro
to
nn
e]
EUA price 30-day volatility
copyright copy 2018 ICIS wwwiciscom 23
EUA price and Article 29aBoogeyman or serious threat
000
500
1000
1500
2000
2500
3000
3500
ca
rbo
n p
rice [euro
to
nn
e]
Historical_Price Six months trigger_Overlapping Two-year average_Overlapping
Six months trigger_Successive Two-year average_Successive
copyright copy 2018 ICIS wwwiciscom 24
EUA auctions biddingBidding range increasing since early 2018 - successful bidders too
-6000
-4000
-2000
000
2000
4000
6000
000
500
1000
1500
2000
2500
No
O
f b
idde
rs
ca
rbo
n p
rice [euro
to
nn
e]
SuccessfulBidders BidRange auctionPrice
copyright copy 2018 ICIS wwwiciscom 25
The link to power pricesPower market spreads are key indicator for carbon price changes especially in key markets like Germany spreads are closely linked to carbon
Clean Brown Spread
000
500
1000
1500
2000
2500
3000
000
500
1000
1500
2000
2500
3000
ca
rbo
n p
rice [euro
to
nn
e]
CB
S [
euroM
Wh
]
CBS (front month) CBS (front year) EUA price
The link to power pricesPower market spreads are key indicator for carbon price changes especially in key markets like Germany spreads are closely linked to carbon
Clean Dark Spread
000
500
1000
1500
2000
2500
3000
-1000
-500
000
500
1000
1500
ca
rbo
n p
rice [euro
to
nn
e]
CD
S [
euroM
Wh
]
Axis Title
CDS (front month) CDS (front year) EUA price
copyright copy 2018 ICIS wwwiciscom 27
The link to power pricesPower market spreads are key indicator for carbon price changes especially in key markets like Germany spreads are closely linked to carbon
Clean Spark Spread
000
500
1000
1500
2000
2500
3000
-2000
-1500
-1000
-500
000
500
1000
ca
rbo
n p
rice [euro
to
nn
e]
CS
S [
euroM
Wh
]
CSS (front month) CSS (front year) EUA price
copyright copy 2018 ICIS wwwiciscom 28
The link to power pricesPower market spreads are key indicator for carbon price changes especially in key markets like Germany spreads are closely linked to carbon
Fuel Switching costs
000
500
1000
1500
2000
2500
3000
-1000
000
1000
2000
3000
4000
5000
ca
rbo
n p
rice [euro
to
nn
e]
To
tal sw
itch
ing
co
sts
[euro
MW
h]
FS (frontmonth) FS (frontyear) EUA price
copyright copy 2018 ICIS wwwiciscom 29
EUA price developmentsWhy did we see a bull run What did change that EUAs are suddenly hip again
Legal certainty about Phase 4
reform
000
500
1000
1500
2000
2500
3000
000
500
1000
1500
2000
2500
3000
vo
lum
e [
m to
nn
es]
ca
rbo
n p
rice [euro
to
nn
e]
EUA price
first vote in
Parliament
first vote in
Council
discussion Trilogue
negotiations
compromise
reached
rubberstamping
copyright copy 2018 ICIS wwwiciscom 30
EUA price developmentsWhy did we see a bull run What did change that EUAs are suddenly hip again
Legal certainty about Phase 4
reform
Market stability reserve a game
changer (already now)
0
200
400
600
800
1000
1200
[m E
UA
s]
MSR intake
final auction MSR intake
Increase intake rate from 12 to
24 for 5 years ndash 26bn from 21-30
copyright copy 2018 ICIS wwwiciscom 31
EUA price developmentsWhy did we see a bull run What did change that EUAs are suddenly hip again
Legal certainty about Phase 4
reform
Market stability reserve a game
changer (already now)
Utilities build strategic hedging
reserves
194
293
626
1919
2939
238
1077
33123399
3605
000
2000
4000
6000
8000
10000
EU
As [m
to
nn
es]
CO2 position RWE
hedged [m tonnes] synthetic [m tonnes]
strategic [m tonnes] open [m tonnes]
copyright copy 2018 ICIS wwwiciscom 32
EUA price developmentsWhy did we see a bull run What did change that EUAs are suddenly hip again
Legal certainty about Phase 4
reform
Market stability reserve a game
changer (already now)
Utilities build strategic hedging
reserves
New players getting active
(financials funds)
Sentiment amp price elasticity
000
500
1000
1500
2000
2500
3000
-1800
-1300
-800
-300
200
700
ca
rbo
n p
rice [euro
to
nn
e]
qu
art
erly m
ark
et b
ala
nce
[m
to
nn
es]
traded positions traded positions (revised) price
Mid-Term View
copyright copy 2018 ICIS wwwiciscom 34
The fundamentalsThe MSR is increasing the pressure on compliance companies in the next years
Yearly supply is not enough
anymore to cover yearly demand
Compliance companies will be
forced to invest in reduction
measures or historic surplus needs
to come to market
First available are fuel switch from
coal to gas
Later on industrial abatement
projects
00
2000
4000
6000
8000
10000
12000
14000
16000
18000
20000
em
issio
nsE
UA
s [m
to
nn
es]
allocation auction other MSR BAU emissions
copyright copy 2018 ICIS wwwiciscom 35
The fundamentalsWhere would CO2 reductions come from
Biggest abatement pressure is on
power sector in the beginning
Fuel switch on short notice available
No additional investments necessary
Immediate economic impact
Once fuel switch capacity is utilized
industrial and power sector need to
invest to abate emissions
Especially in second half of phase 4
industrials will start abating emissions
quicker
0
20
40
60
80
100
120
140
160
180
ab
ate
me
nt tr
igge
red
[m
to
nn
es]
abatement per sector
Power Industry
copyright copy 2018 ICIS wwwiciscom 36
Price ForecastThe Base Case ndash a conservative view
1000 euro
1500 euro
2000 euro
2500 euro
3000 euro
ca
rbo
n p
rice [euro
to
nn
e]
base
copyright copy 2018 ICIS wwwiciscom 37
Price ForecastScenarios around the risk of a hard Brexit
1000 euro
1500 euro
2000 euro
2500 euro
3000 euro
ca
rbo
n p
rice [euro
to
nn
e]
hardBrexit60m hardBrexit30m base
copyright copy 2018 ICIS wwwiciscom 38
The fundamentalsWhere does the historic surplus sit
0
400
800
1200
1600
2000
0
200
400
600
800
1000
cu
mu
lative
ho
ldin
g [m
EU
As]
ab
so
lute
ho
ldin
g [m
EU
As]
2017 holdings
utilities industry financial cumulative end of 2017
copyright copy 2018 ICIS wwwiciscom 39
Price ForecastScenario around changed speculative buying
1000 euro
1500 euro
2000 euro
2500 euro
3000 euro
ca
rbo
n p
rice [euro
to
nn
e]
base Spec-ContinuedSpecDemand Spec-Q2sellOff
copyright copy 2018 ICIS wwwiciscom 40
Price ForecastScenario around changed speculative buying
1000 euro
1500 euro
2000 euro
2500 euro
3000 euro
ca
rbo
n p
rice [euro
to
nn
e]
-18000
-14000
-10000
-6000
-2000
2000
6000
10000
sp
ecu
lative
vo
lum
e [
m E
UA
s]
Base case Continued spec demand Spec sell-off
copyright copy 2018 ICIS wwwiciscom 41
Conclusions
Only as of 2019 MSR intake leads to a significant scarcity on the market
In 2018 the increases are based on speculative buying and compliance
preparation for the MSR
Mid-term risks and opportunities
Hard Brexit
Clean spread development brown dark and spark spreads
Anticipation buying of compliance companies
Sell off triggered by one or few long players
Further behaviour of speculators
copyright copy 2018 ICIS wwwiciscom 42
Price ForecastScenario comparison
1000 euro
1500 euro
2000 euro
2500 euro
3000 euro
ca
rbo
n p
rice [euro
to
nn
e]
hardBrexit60m hardBrexit30m base Spec-ContinuedSpecDemand Spec-Q2sellOff price price
Peter ZapfelHead of Unit B1 ndash ETS policy Development and Auctioning European Commission
QampA
Marcus FerdinandHead of European Carbon amp Power Analytics
What to look out for ndash a mid to long-term forecast for Europersquos carbon market
copyright copy 2018 ICIS
Agenda
1) The market turns short
2) Market Stability Reserve ndash room for review
3) Coal phase-out ndash implications for the carbon price
copyright copy 2018 ICIS wwwiciscom 46
The market balance during phase 4 ndash fundamental
-500
0
500
1000
1500
2000
2500
-400
-200
0
200
400
600
800
1000
1200 cu
mu
lativ
e b
ala
nce
ba
nked
MS
R [m
ton
ne
s]
ye
arly b
ala
nce
in [m
to
nn
es]
FundamentalBalance CumulativeFundamentalBalance
copyright copy 2018 ICIS wwwiciscom 47
The market balance during phase 4 ndash traded
-1000
-500
0
500
1000
1500
2000
2500
-400
-200
0
200
400
600
800
1000
1200 cu
mu
lativ
e b
ala
nce
ba
nked
MS
R [m
ton
ne
s]
ye
arly b
ala
nce
in [m
to
nn
es]
TradedBalance FundamentalBalance CumulativeTradedBalance CumulativeFundamentalBalance
copyright copy 2018 ICIS wwwiciscom 48
The market balance during phase 4 ndash MSRbanked
-1000
-500
0
500
1000
1500
2000
2500
3000
-400
-200
0
200
400
600
800
1000
1200 cu
mu
lativ
e b
ala
nce
ba
nked
MS
R [m
ton
ne
s]
ye
arly b
ala
nce
in [m
to
nn
es]
CumulativeBanked CumulativeMSR TradedBalance FundamentalBalance CumulativeTradedBalance CumulativeFundamentalBalance
The market stability
reserve ndash room for review
copyright copy 2018 ICIS wwwiciscom 50
One key bit needs to be taken into account the TNAC is not the available surplus
Due to the exclusion of EUA compliance by the aviation sector the TNAC is higher than the available surplus
Leads to overestimation of market surplus
Higher MSR outtake
In case aviation shortfall gt400 Mt lower threshold obsolete
Higher threshold nearly impossible to undercut
But CORSIA effect
We expect this to be changed and incorporate a TNAC equal to the surplus in our analysis from 2022 onwards
0
500
1000
1500
2000
2500
EU
As [
m to
nn
es]
cumulative aviation short thresholds surplus TNAC
Source ICIS
copyright copy 2018 ICIS wwwiciscom 51
Our base case analysis
Market to be squeezed in early TP4
This will trigger significant emission
reductions in power and industry
Decreasing base emissions reduce
hedge demand significantly
MSR goes back to 12 and demand
decreases (lower base emissions)
Triggered abatement increases TNAC
MSR is not capable to reduce over-
supply at the same speed
000
1000
2000
3000
4000
0
200
400
600
800
1000
1200
1400
1600
1800
ca
rbo
n p
rice [euro
to
nn
e]
EU
As [
m to
nn
es]
MSR thresholds TNAC hedge demand base price
Source ICIS
copyright copy 2018 ICIS wwwiciscom 52
The MSR in the context of coal phase-outs all over Europe20 less coal in Europe than BAU
Basics
20GW less than BAU coal capacity
150TWh less generation than BAU
50 back-filled by gas rest by RES
Roughly 90m tonnes emission cuts
Hedge demand reduces by 10m EUAs in 2030
Surplus increases by 15m EUAs
Prices will be more pressured and tend lower
0
200
400
600
800
1000
1200
1400
1600
1800
EU
As [
m to
nn
es]
MSR thresholds TNAC hedge demand
Source ICIS
copyright copy 2018 ICIS wwwiciscom 53
The MSR in the context of coal phase-outs all over Europe50 less coal in Europe than BAU
Basics
50GW less than BAU coal capacity
375TWh less generation than BAU
50 back-filled by gas rest by RES (investment needed)
Roughly 225m tonnes emission cuts
Hedge demand reduces by 90m EUAs in 2030
Surplus increases by 70m EUAs
Prices will be more pressured and tend lower
0
200
400
600
800
1000
1200
1400
1600
1800
EU
As [
m to
nn
es]
MSR thresholds TNAC hedge demand
Source ICIS
copyright copy 2018 ICIS wwwiciscom 54
The MSR in the context of coal phase-outs all over Europe70 less coal in Europe than BAU
Basics
70GW less than BAU coal capacity
525TWh less generation than BAU
50 back-filled by gas rest by RES (investment needed)
Roughly 315m tonnes emission cuts
Hedge demand reduces by 150m EUAs in 2030
Surplus increases by 153m EUAs
Prices will be more pressured and tend lower
0
200
400
600
800
1000
1200
1400
1600
1800
EU
As [
m to
nn
es]
MSR thresholds TNAC hedge demand
Source ICIS
copyright copy 2018 ICIS wwwiciscom 55
Consequences for the MSR parameter discussion (50 coal)
MSR parameters can be amended
with review
Two potential scenarios
Reduce thresholds (600 280 Mt)MSR continues to trigger
allowances during all years
MSR withdraws 235m allowances
more compared to 833400
thresholds
TNAC remains on lower pathway
0
200
400
600
800
1000
1200
1400
1600
1800
EU
As [
m to
nn
es]
MSR_600280 thresholds
TNAC_600280 hedge demand_600280
Source ICIS
copyright copy 2018 ICIS wwwiciscom 56
Consequences for the MSR parameter discussion (50 coal)
MSR parameters can be amended
with review
Two potential scenarios
Reduce thresholds (600 280 Mt)
Remain on 24 withdrawal rateMSR continues to trigger
allowances during all years
MSR withdraws 790m allowances
more compared to old thresholds
and 12 rate
TNAC remains on lower pathway
0
200
400
600
800
1000
1200
1400
1600
1800
EU
As [
m to
nn
es]
MSR_600280 MSR_600280_24
thresholds TNAC_600280
hedge demand_600280 TNAC_600280_24
hedge demand_600280_24
Source ICIS
copyright copy 2018 ICIS wwwiciscom 57
Price trajectories ndash highly assumptions-driven
000 euro
1000 euro
2000 euro
3000 euro
4000 euro
5000 euro
ICIS base case base emissions - MSR withdrawal rate base emissions - MSR threshold and withdrawal rate
20 coal reduction 50 coal reduction 70 coal reduction
20 coal - MSR thresholds 50 coal - MSR thresholds 70 coal - MSR thresholds
20 coal - MSR thresholds and withdrawal 50 coal - MSR thresholds and withdrawal 70 coal - MSR thresholds and withdrawal
Source ICIS
copyright copy 2018 ICIS wwwiciscom 58
Conclusion
Changing power sector dynamics could lead to significantly lower emissions
If we factor in the current trend towards coal phase-outs all over EuropeThe surplus increases more
The hedge demand reduces more
With lower power sector demand TNAC increases with current MSR parameters
According to our analysis the MSR will not be strong enough to mitigate the surplus built-up due to lower emissions
Less demand results in laxer market balance lower prices
Adjustment of MSR parameters an option to keep market tightness
Southern Europe ndash a renewable revolution in Italy and Spain
Matteo MazzoniSenior Analyst ndash EU Carbon amp Power Analytics
Matt JonesSenior Analyst ndash EU Carbon amp Power Analytics
copyright copy 2018 ICIS
Agenda
1) Historical renewable developments in Spain and Italy
2) Recent and upcoming auctions
3) Renewable growth trajectories
4) Potential for lsquosubsidy-freersquo renewables
Drivers of subsidy-free RES
Merchant-risk
PPAs
Government de-risking
5) Signposts
6) Conclusions
Historical renewable
developments in Spain
and Italy
copyright copy 2018 ICIS wwwiciscom 62
Renewable generation within the energy mix
Gas41
Coal16
Nuclear19
Other fossil4
Hydro7
Solar1
Wind11
Biomass1
RES20
Gas25
Coal17
Nuclear21
Other fossil4
Hydro8
Solar5
Wind18
Biomass1
Others0
RES32
Gas58
Coal14
Other fossil8
Hydro14
Solar0
Wind2
Biomass3
Others2
RES20
Gas46
Coal11
Other fossil8
Hydro12
Solar8
Wind6
Biomass6
Others2
RES34
Italian Generation Mix Spanish Generation Mix
2008
2017
Source Terna Source REE
copyright copy 2018 ICIS wwwiciscom 63
Where are they now RES capacity grew quickly
0
20
40
60
80
100
120
GW
Installed RES capacity by country
Spain Germany Italy France UKSource IRENA
copyright copy 2018 ICIS wwwiciscom 64
Renewable targets for 2020
10
12
14
16
18
20
22
Spain Italy
sh
are
Renewable shares vs 2020 target ()
2016 2020 target
Italy is already exceeding
its 2020 target due to
rapid growth 2010-2012 in
particular
Spain remains behind on
its own target due to
stagnant growth in recent
years
Uncertainty over whether
the 201617 auctions will
be enough for Spain to
reach its target
copyright copy 2018 ICIS wwwiciscom 65
Feed-in-tariffs give way to auctions
Spain Italy
Market Premium scheme reformed 2012
-RES capacity almost flat since
-Numerous lawsuits under the ECT
-No longer open to installations
gt5MW
-De facto moratorium on new RES
FiT and FiP reformed in 2015
-RES capacity almost flat since
-No longer open to installations
gt5MW
-De facto moratorium on new RES
No Green Certificates scheme No Green Certificates scheme
Tendering scheme introduced in 2016
- Three rounds held
- Floor price mechanism
- More auctions planned but not
announced
RES auctions planned for 2019 and 2020
- First round suggested Jan-2019
- Contracts-for-differences style
scheme proposed
- Likely to be delayed again
Recent and upcoming
auctions
copyright copy 2018 ICIS wwwiciscom 67
The introduction of renewable auctions in Spain
Source ICIS OMIE
Auction Date TechnologyCapacity target
(MW)
Capacity awarded
(MW)Weighted average floor price (euroMWh)
Jan 2016Onshore wind
700 in total569 0
Biomass 200 0
May 2017
Onshore wind
3000 in total
2780 399
Other RES 19 416
Solar 1 422
Jul 2017Onshore wind
3000 in total1128 282
Solar 3909 327
Total 6700 8606
copyright copy 2018 ICIS wwwiciscom 68
Key features of the Spanish auctions
Prices cleared below market prices
Bidders can expect to get the market price except when prices fall below the auction floor price
Payments for unlimited duration
The floor price level calculation methodology can be revised every six years
0
10
20
30
40
50
60
70
Onshore windSpain
Solar Spain Onshore windItaly
Solar France Onshore windGermany
Solar Germany
euroM
Wh
(no
min
al)
Lowest subsidy price vs 2020 market price
Lowest subsidy 2020 power price (ICIS assessment 30 Oct)
copyright copy 2018 ICIS wwwiciscom 69
Auctions in Spain and Italy
0
20
40
60
80
100
120
140
160
euroM
Wh
(no
min
al)
Prices at auctions - Spain vs other EU countries
Onshore wind Spain Solar Spain Onshore wind Italy Onshore wind Germany Solar Germany Solar France
copyright copy 2018 ICIS wwwiciscom 70
Upcoming auctions in Italy
Italy is planning to auction 79 GW of capacity between January 2019 and May 2021
Of the total 56GW will be for solar and wind competing against one another
Winning bidders will be offered a CfD contract (like the UK model for RES support)
The latest draft of the decree sets a 70 euroMWh for wind and solar
Session Date Auction Registry Auction Registry Auction Registry Auction Registry
1 31012019 500 45 - 100 10 10 60 10
2 31052019 500 45 - 100 10 10 60 10
3 30092019 700 100 - 100 10 10 60 10
4 31012020 700 100 - 100 10 10 60 10
5 31052020 800 120 - 100 10 10 60 10
6 30092020 800 120 - 100 20 10 60 10
7 31012021 800 120 - 100 20 10 70 10
8 31052021 800 120 - 100 20 10 70 10
5600 770 0 800 110 80 500 80
Solar-Wind Solar asbestos sub Hydro-Biogas Repowering
Total
CAPACITY AVAILABLE (MW)
Source MiSE
Renewable growth
trajectories
copyright copy 2018 ICIS wwwiciscom 72
SpainItaly 2030 RES targets in the EU context
RES Targets 2020 2030
Europe20
(binding)
32
(binding)
Italy17
(binding)
28
(non-binding)
Spain20
(binding)
35
(non-binding)
The EU has recently agreed on a
32 RES target by 2030
Italy set a 28 RES target for
2030 which is below the EU target
Notwithstanding numerous
announcements Spain has yet to
publish the Energy Transition
Strategy which is expected to
come by the end of the year
copyright copy 2018 ICIS wwwiciscom 73
Italy the National Energy Strategy (SEN)
1740
22
28
2016 2030 BAU 2030 SEN
RES ON ENERGY CONSUMPTION
335038
55
2016 2030 BAU 2030 SEN
RES ON ELECTRICITY CONSUMPTION
The SEN was presented in November 2017 after a long consultation with more than 250 stakeholders
The SEN went beyond the RES EU target proposed by the EC but it now falls short of the new target
Great part of the rise is on the power sector with solar accounting for 24 of the electricity consumption and wind for 13
The SEN foresees EUR 35bn to be invested in RES and EUR 30bn to be invested in grids
Source MiSE
copyright copy 2018 ICIS wwwiciscom 74
Expectations for Spanish and Italian RES capacity
0
10
20
30
40
50
60
GW
Solar capacity forecast 2018-2030 (GW)
Spain Italy
0
5
10
15
20
25
30
35
GW
Wind capacity forecast 2018-2030 (GW)
Spain Italy
Source Icis Horizon Power model
Subsidy-free solar and
wind growth
copyright copy 2018 ICIS wwwiciscom 76
Why is subsidy-free renewables increasingly discussed
We have started to see the
first zero-subsidy solar and
onshore wind project come
online while offshore wind
projects are due in the
early 2020s
The development is driven
primarily by rapidly falling
technology costs 0
50
100
150
200
250
30
40
50
60
70
80
90
100
Ca
pa
city a
uctio
ne
d (
MW
)
Str
ike
price (
euroM
Wh
)
Solar auction results in Germany since 2015
capacity (MW) mean average successful bid (euroMWh)
copyright copy 2018 ICIS wwwiciscom 77
Why are Spain and Italy likely to be at the forefront
Both Spain and Italy have good resources for solar and wind
Both countries have high power prices by European standards
0
10
20
30
40
50
60
70
2016 2017 2018 YTD
euroM
Wh
Average power prices in Spain and Italy are ~euro16MWh higher vs Germany
Germany Italy Spain
copyright copy 2018 ICIS wwwiciscom 78
Why are Spain and Italy likely to be at the forefront
Both Spain and Italy have good resources for solar and wind
Both countries have high power prices by European standards
47
49
51
53
55
57
59
61
63
euroM
Wh
ICIS Horizon power price forecasts euroMWh
Italy Spain Germany
copyright copy 2018 ICIS wwwiciscom 79
Full merchant risk ndash price volatility
Merchant projects are risky given
uncertainty over future prices and
volatility
Without a guaranteed strike price
generators would be faced with
varying income on the wholesale
market
Volatility to increase over time
while seasonal variation will
increaseSource OMIE
0
10
20
30
40
50
60
70
80
90
100
euroM
Wh
Spanish hourly prices July 2017-July 2018
Hourly prices Average price
copyright copy 2018 ICIS wwwiciscom 80
Full merchant risk ndash price direction uncertainty
We expect power prices to be driven significantly by carbon prices through to 2030
As a result wholesale power prices will be at their highest in 202324 before declining
as EUA prices fall and as more RES capacity is added
47
49
51
53
55
57
59
61
63
euroM
Wh
ICIS Horizon power price forecasts euroMWh
Italy Spain Germany
copyright copy 2018 ICIS wwwiciscom 81
Full merchant risk ndash price cannibalisation
In the absence of subsidy the key metric is the capture price rather than the wholesale
price as this reflects what the generator will actually receive
Capture prices are pushed lower as addition RES units of the same type are added
(price cannibalisation)
40
45
50
55
60
65
euroM
Wh
Italy average price vs RES capture prices
Onshore wind capture price Solar capture price Annual average wholesale price
copyright copy 2018 ICIS wwwiciscom 82
Full merchant risk ndash price cannibalisation
In the absence of subsidy the key metric is the capture price rather than the wholesale
price as this reflects what the generator will actually receive
Capture prices are pushed lower as addition RES units of the same type are added
(price cannibalisation)
30
35
40
45
50
55
60
65
euroM
Wh
Spain average price vs RES capture price
Onshore wind capture price Solar capture price Annual average wholesale price
copyright copy 2018 ICIS wwwiciscom 83
Power Purchase Agreements (PPAs)
PPAs de-risk projects by locking
in long-term prices
We are starting to see the first
PPAs signed for RES projects in
Spain and Italy
Most in Spain have been supplier
PPAs rather than the more
publicised corporate PPAs
PPA
Corporate Supplier
copyright copy 2018 ICIS wwwiciscom 84
Power Purchase Agreements (PPAs)
PPAs de-risk projects by locking
in long-term prices
We are starting to see the first
PPAs signed for RES projects in
Spain and Italy
The question is whether there will
be enough demand for PPAs to
enable large-scale subsidy-free
rollout
Source ICISWindEurope
0
1
2
3
4
5
6
2010 2011 2012 2013 2014 2015 2016 2017
GW
European corporate PPA demand vs Spanish and Italian RES capacity anticipation
European RES capacity sourced through PPAs
Spain anticipated RES per year (2019-2030)
Italy anticipated RES per year (2019-2030)
copyright copy 2018 ICIS wwwiciscom 85
Spain 15 PPAs signed since the start of 2017
Total PPA capacity 2437MW
All due to be commissioned by 2020
Most of the PPAs are for solar PV
Six corporate PPAs seen totalling 481MW
lsquoUndisclosed buyerrsquo 820MW
Publicly-announced PPAs signed for new renewable capacity on the
Spanish mainland
0
1
2
3
4
5
Supplier Corporate Undisclosed Mixed
Num
ber
Spanish RES PPAs signed since 2017 by fuel and buyer
Solar Wind
0
200
400
600
800
1000
Supplier Corporate Undisclosed Mixed
Tota
l C
apacity (
MW
)
Spanish RES PPAs signed since 2017 by fuel and buyer
Solar Wind
copyright copy 2018 ICIS wwwiciscom 86
The most popular duration for PPAs in Spain is ten years
Five of the fifteen PPAs are for
ten years
Five PPAs are for longer than ten
years
Four PPAs are for an unreported
duration0
1
2
3
4
5
6
0
200
400
600
800
1000
1200
Nu
mb
er o
f P
PA
s
Tota
l cap
acit
y (M
W)
Duration (years)
Spanish RES PPAs signed since 2017 by duration
Capacity Count
copyright copy 2018 ICIS wwwiciscom 87
Government support Minimum price floors
Minimum price floors provide
some protection against worst
case scenario prices
However the price floor needs to
be high enough to improve
bankability but low enough to
protect the government from
paying large subsidies
The recent price floors seen in
Spain were set at very low levels
20
25
30
35
40
45
50
55
60
euroM
Wh
Spanish RES capture prices vs minimum price floors
Onshore wind capture price Solar capture price
Wind price floor Solar price floor
copyright copy 2018 ICIS wwwiciscom 88
Government support ldquoSubsidy-freerdquo CfDs
There is increasing talk in the UK
over ldquosubsidy-freerdquo CfDs for onshore
wind and solar
A similar idea could be seen in Italy
in the future
Generators would only be able to bid
in at the forecast power price level
Potential upside for the government
if prices rise above expectations but
downside if prices fall as subsidies
would be paid
40
45
50
55
60
65
70
euroM
Wh
Subsidy-free CfD price risk
ICIS price forecast Low price scenario High price scenario
copyright copy 2018 ICIS wwwiciscom 89
Signposts
The Spanish energy strategy due before end of 2018
The new Italian government announced it will revise its 2017 National Energy
Strategy
Strike prices in the upcoming Italian auctions
RES projects in Spanish recent auctions ndash how many projects will be
commissioned and on time
copyright copy 2018 ICIS wwwiciscom 90
Conclusions
Subsidy-free projects are beginning to emerge in a number of EU member
states
However Spain and Italy could be the first EU countries to attempt to roll out
subsidy-free capacity at scale driven by comparatively higher power prices
Investor appetite for risk given market price uncertainty will remain the greatest
challenge going forward How many projects can get off the ground
The PPA market can help de-risk projects but it remains in a nascent stage
Continued reductions in LCOE will help improve the prospects for projects
Our forecasts suggest that profit margins will be best for early movers
Coal phase-outs ndash key for the low carbon transition
Vija PakalkaiteAnalyst ndash EU Carbon amp Power Analytics
Matt JonesSenior Analyst ndash EU Carbon amp Power Analytics
Marcus FerdinandHead of EU Carbon amp Power Analytics
copyright copy 2018 ICIS
Agenda
1) Overview of coal phase-out in Europe Policy discussions and capacity
expectations
2) Netherlands Total phase-out and carbon price floor
3) Germany Gradual phase-out
4) Poland Clinging on to coal
5) Conclusions Comparing the three national approaches
Overview of coal-phase
out in Europe
copyright copy 2018 ICIS wwwiciscom 94
Europersquos current power mix
Nuclear 27
Coal and lignite 23Gas 17
Oil 2
Biomass 6
Hydro 12
Wind 10Solar 3
EU generation share
Coal and lignite account for 23 of the
European electricity mix at present
Coal and lignite have the second
largest installed capacity in the EU
(139GW) behind gas and ahead of
nuclear
Germany is the dominant country for
coal and lignite accounting for 31 of
EU capacity followed by Poland (21)
0
50
100
150
200
250
Gas Coal amp lignite Nuclear
GW
Installed capacity in the EU
copyright copy 2018 ICIS wwwiciscom 95
Coal phase-out plans
CountryCapacity
(MW)Phase-out date
UK 11160 2025
Italy 7806 2025
Netherlands 4692 2030
Denmark 2776 2030
France 2335 2021
Finland 1693 2029
Portugal 1677 2030
Ireland 855 2025
Austria 644 2025
Sweden 130 2022
copyright copy 2018 ICIS wwwiciscom 96
BREF limits
Put restrictions on the NOx and SO2
emissions from plants
Plants will have to abide by
regulations from 2021 or close
Estimates that up to a third of
Europersquos coal-fired capacity affected
Will countries be able to obtain
derogations
copyright copy 2018 ICIS wwwiciscom 97
Capacity market legislation
Council Parliament
Rule
New plants will only be eligible to receive payments in a capacity
market if their emissions are below 550 gr CO2KWh or if their
emissions are less than 700 Kg CO2
New plants will only be eligible to receive payments in a capacity market if their emissions are below 550 gr CO2KWh However specific lower limit of 200 Kg
CO2 on average per year per installed KW is applied to plants in a strategic reserve
Date applicable
2025 (new) 2030 (existing) 2019 (new) 2024 (existing)
Coal-fired plants wanting to enter a capacity market will be affected by
EU legislation in the Electricity Market Design Regulation
Hard coal 08tMWh
Lignite 11tMWh
700 (Council) 10 7
200 (Parliament) 3 2
copyright copy 2018 ICIS wwwiciscom 98
EU Coallignite capacity forecast 2018-2030
Coallignite capacity expected to decline from 139GW in 2018 to
88GW in 2025 and 58GW in 2030
0
20000
40000
60000
80000
100000
120000
140000
160000
2018 2019 2020 2021 2022 2023 2024 2025 2026 2027 2028 2029 2030
MW
EU coal amp lignite capacity by country 2018-2030 (MW)
Germany Poland UK Czech Republic Spain Italy NetherlandsGreece Bulgaria Romania Denmark France Finland PortugalHungary Slovenia Ireland Austria Slovakia Croatia Sweden
Source ICIS Source ICIS
copyright copy 2018 ICIS wwwiciscom 99
EU Coallignite capacity forecast 2018-2030
Coallignite capacity expected to decline from 139GW in 2018 to
88GW in 2025 and 58GW in 2030
0
5000
10000
15000
20000
25000
30000
35000
40000
45000
MW
EU coal amp lignite capacity 2018 and 2030 (MW)
2018 2030Source ICIS
copyright copy 2018 ICIS wwwiciscom 100
Differing trends for coal and lignite
We expect coal capacity to fall considerably while lignite will prove more resilient
Coal capacity to fall from 87GW in 2018 to 26GW in 2030
Lignite to decline from 52GW in 2018 to 32GW in 2030
0
10000
20000
30000
40000
50000
60000
70000
80000
90000
100000
MW
EU coal and lignite capacity 2018-2030 (MW)
Coal LigniteSource ICIS
Source ICIS
Netherlands Coal phase-
out and carbon price floor
copyright copy 2018 ICIS wwwiciscom 102
Complete coal phase-out by 2030
Currently the Netherlands has 47GW coal-fired capacity available (5 plants)
three of which came online as recently as 2015
Remaining units
Source ICIS
copyright copy 2018 ICIS wwwiciscom 103
Complete coal phase-out by 2030
The two oldest plants will be forced to close at the end of 2024 the three
newest plants by the end of 2029
Currently the Netherlands has 47GW coal-fired capacity available (5 plants)
three of which came online as recently as 2015
Remaining units
Source ICIS
copyright copy 2018 ICIS wwwiciscom 104
Dutch CO2 emissions and targets
Urgenda ruling called for 25 cut in CO2 (compared to 1990) by 2020 ndash
government in danger of missing this target
Government has set its own ambitions for a 49 cut by 2030 ndash this is driving
the plans for coal phase-out and the carbon price floor
0
50
100
150
200
250
mtC
O2
Dutch greenhouse gas emissions
Actual Urgenda target Coalition target
Source ICIS
copyright copy 2018 ICIS wwwiciscom 105
Coal amp gas in the Dutch power mix
Several older coal-fired plants have closed over the past three years which has
led to lower coal-fired generation output
Gas output has begun to exceed coal output and the trend will continue due to
carbon prices and coal closures
0
5
10
15
20
2015 2016 2017
Cap
acity [
GW
]
Dutch coal amp gas capacity (GW)
Coal Gas
0
10
20
30
40
50
2015 2016 2017
Ge
ne
ratio
n [T
Wh]
Dutch coal amp gas output (TWh)
Coal Gas
Source TenneT
copyright copy 2018 ICIS wwwiciscom 106
Modelling Impact on coal output
Coal capacity will close in line with the announced dates (20252030)
Output will be driven partially by these closures but also by our carbon price
expectations
0
500
1000
1500
2000
2500
3000
3500
4000
4500
5000
Cap
acity [
MW
]
Dutch coal capacity forecast (MW)
0
5
10
15
20
25
30
Ge
ne
ratio
n [T
Wh]
Dutch coal generation forecast (TWh)
Source ICIS
copyright copy 2018 ICIS wwwiciscom 107
Modelling Impact on gas output
Gas-fired output will increase through to 2023 as EUA prices drive fuel switching
Output will decline in the later 2020s due to softening EUAs and increased RES
Full coal phase-out in 2030 will lead to an increase in gas output
0
2000
4000
6000
8000
10000
12000
14000
16000
18000
20000
Cap
acity [
MW
]
Dutch gas capacity forecast (MW)
0
10
20
30
40
50
60
70
80
Ge
ne
ratio
n [T
Wh]
Dutch gas generation forecast (TWh)
Source ICIS
copyright copy 2018 ICIS wwwiciscom 108
Modelling Price impact
46
48
50
52
54
56
58
Duts
ch
po
we
r p
rice
fo
reca
st [euro
MW
h] Dutch power price forecast (euroMWh)
Final three coal
plants close
Prices driven higher by
EUA price increase
Fuel switching seen
EUA prices fall increasing
offshore wind and solar
output pressures prices
lower
Gas and coal
prices soften
new
interconnectors
Source ICIS
copyright copy 2018 ICIS wwwiciscom 109
Carbon price floor plan
In addition to the coal phase-out the government plans to introduce a carbon price floor for the
power sector
The floor would start at euro18tonne in 2020 increasing to euro43tonne in 2030
We anticipate the floor to be below EUA prices until 2026
0
10
20
30
40
50
Car
bo
n p
rice
flo
or
[eurot
on
ne
]
ICIS EUA forecast vs proposed Dutch carbon price floor
Proposed price floor ICIS carbon priceSource ICIS
copyright copy 2018 ICIS wwwiciscom 110
Carbon price floor ndash coal amp gas output
We anticipate that the carbon price floor would have no impact for the first five years after
implementation
From 2026-2030 the price floor would lead to a reduction in both coal and gas output
compared to the base case
0
5
10
15
20
25
30
Ge
ne
ratio
n [T
Wh]
Dutch coal output forecast (TWh)
Base case Carbon price floor
0
10
20
30
40
50
60
70
80
Ge
ne
ratio
n [T
Wh]
Dutch gas output forecast (TWh)
Base case Carbon price floor
Source ICIS
copyright copy 2018 ICIS wwwiciscom 111
Carbon price floor ndash net imports
Under the base case assumptions the Netherlands becomes a net exporter in 2023 and
maintains this position through to 2030
If the carbon price floor is introduced the Netherlands will revert back to a net importer status as
imports replace domestic coal amp gas generation
-15
-10
-5
0
5
10
15
20
25
Net im
po
rts [T
Wh
]
Base case net imports (TWh)
-10
-5
0
5
10
15
20
25
Net im
po
rts [T
Wh
]
Carbon price floor net imports (TWh)
Source ICIS
copyright copy 2018 ICIS wwwiciscom 112
Carbon price floor ndash prices
From 2026 the carbon price floor would start to increase prices
Modelling suggests that annual prices would be on average euro148MWh higher
than the base case 2026-2030
42
44
46
48
50
52
54
56
58
60
2019 2020 2021 2022 2023 2024 2025 2026 2027 2028 2029 2030
Dutc
h p
ow
er
price
[euro
MW
h]
Dutch power price forecast (euroMWh)
Base case Carbon price floorSource ICIS
copyright copy 2018 ICIS wwwiciscom 113
Carbon price floor ndash Emissions
Under the base case assumptions power sector emissions would decline only
marginally through to 2029 before a big drop associated with coal phase-out in 2030
The carbon price floor would lead to a much more significant drop 2026-2030
However the emissions decline would be cancelled out by an increase elsewhere
0
5
10
15
20
25
30
35
40
45
50
Po
we
r se
cto
r e
mis
sio
ns [M
tCO
2]
Base case power sector emissions
0
5
10
15
20
25
30
35
40
45
50
Po
we
r se
cto
r e
mis
sio
ns [M
tCO
2]
Carbon price floor power sector emissions
Source ICIS
Germanylsquos coal phase-
out scenario analysis
copyright copy 2018 ICIS
Agenda
1) The bdquocoal commissionldquo at work
2) Market fundamentals
3) Our phase-out scenarios
4) Impact on German power prices
5) Hambacher Forest and its implications
copyright copy 2018 ICIS wwwiciscom 116
The bdquocoal commissionldquo
Two working groups
economic development and jobs in
the region
Energy industry and climate goals
Plenary and WGs meet once a
month
Equal voting rights
Two-thirds majority
Four commission leaders
Eight representatives of federal ministries (economy environment internal affairs labour transport finance agriculture and education)
Six representatives of federal states (North Rhine-Westphalia Brandenburg Saxony Saxony-Anhalt Lower Saxony and Saarland)
Three members of parliament without voting rights (CDU CSU and SPD)
24 experts (political groups research institutes associations NGOs and the private sector)
The secretariat with seven people is hosted within the economy ministry
copyright copy 2018 ICIS wwwiciscom 117
Aims and timeplan for decision making
Guidelines
Options for closing gap to 2020 target
Measures to ensure 2030 target
achievement
Step-wise reduction and phase-out of
coal generation incl phase-out date
Ensuring financial security for structural
changes
Potentially delaying final report
depending on ability to find consensus
Current status
1516 November next meeting discussiondetails expected regarding phase-out
So far intermediate report on structuralchanges adopted on 1 Nov details on financig instruments levels missing
Aim to have final report before end of year interim report expected by mid-December
German coalition struggle could impact theCommissions work (depending on nextCDU leader) pressure to meet timeplan
copyright copy 2018 ICIS wwwiciscom 118
Power generation in Germany
2017 generation
Lignite 134 TWh (242)
Hard coal 817 TWh (148)
Total production was 5571 TWh
Combined lignite and hard coal
~80 of emissions
0
100
200
300
400
500
600
2010 2011 2012 2013 2014 2015 2016 2017
An
nu
al D
E p
ow
er
ge
ne
ratio
n [T
Wh
]
Lignite Hard coal Nuclear Gas Oil
Hydro Biomass Wind Solar Other
Source ICIS
copyright copy 2018 ICIS wwwiciscom 119
Capacity development ndash bdquomoderate scenarioldquo
Installed capacity 2018
Hard coal 227 GW
Lignite 20 GW
Lignite reserve 18 GW increasing
to 27 GW in 2019
Additional 23 GW hard coal and 30
GW lignite in grid reserve (not
available to market)
0
50
100
150
200
250
300
Insta
lled
ca
pa
city [G
W]
Lignite Hard coalNuclear Natural gasOil Hydro pump storage totalHydro reservoir Hydro run-of-riverBiomass Wind (onshore)Wind (offshore) Solar PVGeothermal
Source ICIS
copyright copy 2018 ICIS wwwiciscom 120
Scenario set-up
Four phase-out scenarios
Moderate 45 GW reduction by 2020 halved by 2030
Slow Reduction by approx frac14 towards2030
Speedy 105 GW drop towards 2020 70 drop by 2030
Lignite-only Lignite phase-out until 2030 hard coal stable
Lifetime approach for hard coal and lignite
Initial capacity reduction towards 2020 target
All other parameters unchanged
Nuclear phase-out by 2022
Nat gas capacity adjusted by additions and closures fluctuating around 24 GW
Hydro fluctuating around 96 GW
Wind onshore auction results+adjustedEEG2017 corridor
Wind offshore Adjusted EEG2017 corridor
Solar PV Auction+adjusted EEG2017 corridor
copyright copy 2018 ICIS wwwiciscom 121
Phase-out scenarios ndash capacity development
00
50
100
150
200
250
Insta
lled
lig
nite
ca
pa
city (
GW
)
Moderate lignite Slow lignite
Speedy lignite Lignite-only lignite
00
50
100
150
200
250
Insta
lled
ha
rd c
oa
l ca
pa
city (
GW
)
Moderate hard coal Slow hard coal
Speedy hard coal Lignite-only hard coal
Source ICIS
copyright copy 2018 ICIS wwwiciscom 122
Impact on German power prices
2019-2023 Prices predominantlydriven by higher carbon pricesirrespective of phase-out speed
Germany net-importer in 2023 under all scenarios 2022 to 2025 for lignite-only and speedy
After 2023 coallignite generationincentivised to ramp up
Declining carbon higherrenewables net exporter towardssecond half of 2020s
Source ICIS
30
35
40
45
50
55
60
65
Ge
rma
n p
ow
er
price
(euro
MW
h)
Moderate phase-out Slow phase-out
Speedy phase-out Lignite-only phase-out
copyright copy 2018 ICIS wwwiciscom 123
Hourly price comparison
Increasing number of
hours with high prices
in winter
Lack of gas in times
of low RES
generation
Speedy and lignite-
only scenarios more
visible spikes 30
80
130
180
230
280
330
380
430
480
530
1 6
11
16
21
26
31
36
41
46
51
56
61
66
71
76
81
86
91
96
101
106
111
116
121
126
131
136
141
146
151
156
161
166
Ge
rma
n h
ou
rly p
ow
er
price
w
ee
k 3
20
24
(euro
MW
h)
Hour of the week
Moderate phase-out Slow phase-out Speedy phase-out Lignite-only phase-out
Source ICIS
copyright copy 2018 ICIS wwwiciscom 124
Hambacher Forest ndash RWE impact
Muumlnster Higher Administrative Court ruled to halt forest clearance 5 Oct
Final decision to be reached in main proceedings likely end of 2020
Lignite mining possible until approx end 2019
But annual reduction expected from 40 Mt tobetween 25 and 30 Mt (2019-21)
RWE expects substantial short-term operational effects as of 2019
Power generation to decrease by between 9 and13 TWh
Affected plants are Neurath and Niederauszligem
Clearance work only permitted Oct to Feb Delay of at least a year
Neurath Capacity
[MW]
Commissioning
[year]
Expected
closure
A 294 1972 2021
B 294 1972 Oct-19
C 292 1973 2021
D 607 1975
E 604 1976
F 1060 2012
G 1060 2012
Niederauszligem Capacity
[MW]
Commissioning
[year]
Expected
closure
C 295 1965 2020
D 297 1968 2020
E 295 1970 Oct-18
F 299 1971 Oct-18
G 628 1974 2022
H 638 1974 2023
K 944 2003
copyright copy 2018 ICIS wwwiciscom 125
Impact on Hambach generation
With potential closures we see a
reduction of 182 TWh in 2023
This would translate to a reduction
of 138 Mt emissions in 2023
Below our assumptions for the
bdquomoderate scenarioldquo which assumes
68 GW lignite and 36 GW hard
coal to drop-out
Hambach can be seen as preview
towards coal commission result
00
50
100
150
200
250
300
350
2018 2019 2020 2021 2022 2023
Ha
mb
ach
po
we
r g
en
era
tio
n [T
Wh
]
Neurath - full generation Niederauszligem - full generation
Neurath - reduced generation Niederauszligem - reduced generation
Source ICIS
copyright copy 2018 ICIS wwwiciscom 126
Impact of Hambach Forest decision on carbon price
On average 2020 to
2030 Hambacher Forest
scenario euro05t lower
compared to base case
Reducing emissions by
a total of 35 Mt over
2020-23
00
50
100
150
200
250
300
350
400
450
EU
A p
rice
[euro
t]
Hambach impact base case
Source ICIS
The Polish energy market
and the coal dependency
copyright copy 2018 ICIS wwwiciscom 128
Production of solid fuels in the EU
0
20000
40000
60000
80000
100000
120000
140000
160000
180000
2010 2011 2012 2013 2014 2015 2016
Eu
rosta
t so
lid f
ue
l p
rod
uctio
n [1
00
00
to
e]
Polish coal production EUs coal production without PolandSource Eurostat
copyright copy 2018 ICIS wwwiciscom 129
Future of coal in Poland ndash no clear strategy
Last adopted energy strategy ndash almost a decade old
New draft presented in 2015 under previous government
Draft update promised by December 2018 ndash COP24 in Katowice in parallel to
ldquoNational Energy and Climate Plan for 2021-2030rdquo
Bits and pieces in media
2018 July Energy Minister Krzysztof Tchoacuterzewski ldquothe share of coal in electricity
generation will systematically fall It is predicted that in 2050 it will be 50rdquo
2018 October ldquoPower from coal seen down at 50 by 2040-govt officialrdquo
copyright copy 2018 ICIS wwwiciscom 130
Industrial Emissions Directive
District heating plants (CHP) list ndash phase-out from 2023
Limited Lifetime Derogation (LLD) list ndash phase out from 2024
Unclear future of the plants in the Transitional National Plan
(TNP)
copyright copy 2018 ICIS wwwiciscom 131
Planned coal capacity additions
Max 4GW new coal capacity mid-term
Opole 900MW in late 2018 and 900MW in 2019
Byczyna (Jaworzno) unit 910MW in 2019
[2023]1000MW Ostroleka C in northeast Poland
Energy Minister Krzysztof Tchoacuterzewski about Ostroleka C lsquothe last coal-burning plant to be built in Polandrsquo
Ostrołęka C Power plant
copyright copy 2018 ICIS wwwiciscom 132
Capacity market auction to commence this week
Basic fuel Net reachable power [GW]
Existing physical generating units
Physical generating units planned
Gas 228 437
Coal and lignite 2632 402
Sum 3633 890
Sum existing and planned
4523
copyright copy 2018 ICIS wwwiciscom 133
Horizon base case Capacity and generation assumptions
0
20
40
60
80
100
120
140
160
180
200
Fo
reca
ste
d g
en
era
tio
n [
TW
h]
Hard Coal Gas Lignite
Oil Solar Wind
Hydropower Bio Demand
0
5000
10000
15000
20000
25000
30000
35000
40000
45000
50000
Fo
reca
ste
d c
ap
acity [
MW
]
Lignite Coal Gas Fuel oil Bio Hydro Solar Wind
copyright copy 2018 ICIS wwwiciscom 134
Zooming in ndash EUAs price forecast and fossil generation
00
50
100
150
200
250
300
350
400
450
0
20
40
60
80
100
120
140
160
180
2019 2020 2021 2022 2023 2024 2025 2026 2027 2028 2029 2030
EU
As p
rice
fo
reca
st [euro
to
nn
e]
Ge
ne
ratio
n fo
reca
st [T
Wh
]
Hard Coal Gas Lignite EUAs price forecast
copyright copy 2018 ICIS wwwiciscom 135
2019-2030 Polish power price outlook
25
35
45
55
65
75
85
2017 2018 2019 2020 2021 2022 2023 2024 2025 2026 2027 2028 2029 2030
Po
lish
po
we
r p
rice
[euro
MW
h]
TGE day-ahead prices Horizon forecast
copyright copy 2018 ICIS wwwiciscom 136
2019-2030 Polish power price outlook
500
520
540
560
580
600
620
640
660
680
700
2019 2020 2021 2022 2023 2024 2025 2026 2027 2028 2029 2030
Po
lish
po
we
r p
rice
[euro
MW
h]
Horizon price outlook
EUA increase
outweighed by coal
and gas prices
softening
Prices driven higher by
EUA price increase
Fuel switching seenSome coal capacity
phased-out
EUA prices fall more
RES capacity comes
onlineRegional coal
closures (especially
NL phase-out) push
regional prices higher
Conclusions
copyright copy 2018 ICIS wwwiciscom 138
Coal phase-out across the EU
Coal and lignite have the second largest installed capacity in the EU
10 EU countries decided to phase out coal several more in
discussion
Phase-out will come in waves 2021-2022 2025 and 2030
Regardless of coal phase-out plans BREF will affect one third of
Europersquos coal-fired capacity
copyright copy 2018 ICIS wwwiciscom 139
Capacity implications
Three very different policy approaches to coal
Netherlands Complete phase out by 2030 and (potentially) a carbon price floor
Germany Gradual reduction over the next ten years driven by government intervention
Poland Attempting to keep capacity online using the capacity mechanism to provide support
None of the three countries will phase out coal rapidly
In absence of policy decision Industrial Emissions DirectiveBREF will define the pathway
0
5
10
15
20
25
30
35
40
45
2019 2020 2021 2022 2023 2024 2025 2026 2027 2028 2029 2030
Cap
acity [
GW
]
Coal-fired capacity expectations 2019-2030
Germany Poland Netherlands
Source ICIS
copyright copy 2018 ICIS wwwiciscom 140
Generation implications ndash carbon price importance
Coal generation will fall in all three
countries regardless of the coal
capacity developments because of
the bullish EUA prices
As EUA prices soften from 2024
coal-fired output will rebound
The most significant increase will be
seen in Poland as the majority of
capacity remains online 0
5
10
15
20
25
30
35
40
45
0
50
100
150
200
250
300
350
EU
As p
rice
fo
reca
st [euro
to
nn
e]
Po
we
r H
orizo
n f
ore
ca
ste
d g
en
era
tio
n [
TW
h]
Coal-fired generation 2019-2030
Germany Poland
Netherlands ICIS EUAs price forecast
Source ICIS ICIS Power Horizon
copyright copy 2018 ICIS wwwiciscom 141
Price implications
Power prices in all three markets will follow a similar pattern
2019-2023 EUA increase pushes prices higher
2024-2030 Softening of EUA prices and increased RES output leads to lower prices
Dutch carbon price floor and complete phase-out to boost prices comparatively 2026-2030
A speedier German phase-out would push prices higher compared to the base case
45
47
49
51
53
55
57
59
61
63
2019 2020 2021 2022 2023 2024 2025 2026 2027 2028 2029 2030
Po
we
r p
rice
[euro
MW
h]
Wholesale price forecasts 2019-2030
Germany Poland Netherlands
Source ICIS
Stay focused on the power market developments that are important to your business with the new online tool from ICIS
Understand the impact of energy policy changes
Anticipate market developments across Europe
Foresee risks and spot profitable opportunities Fast
ICIS Power Perspective amp Horizon
Speak to us to find out more
Tel +44 20 7911 1919 | Email powerperspectiveiciscom | wwwiciscompowerperspective
Reliable provider of global carbon market analytics and forecasts
Learn more
Stay ahead of the carbon market trends and developments
Get the latest analysis and forecasts for global carbon trading
Make profitable investments within seconds
Strengthen you trading position
wwwiciscom
ICIS Power amp Carbon Seminar
Second Day
14-15 November 2018Berlin Germany
1230-1300 Power Purchase AgreementsVivianna Ciancibello EEX
0930-0945 WelcomePhilipp Ruf ICIS
0945-1115
Brexit and its impact on the UK electricity
market and the EU ETSHenry Evans amp Matt Jones amp Marcus Ferdinand ICIS
Mark Copley BEIS
Coffee Break
1145-1230 Renewable energy trends across EuropeMatteo Mazzoni amp Vija Pakalkaite ICIS
Goodbye and wrap-up
Brexit and its impact on the UK electricity market and the EU ETS
Henry EvansSenior Market Reporter
Matt JonesSenior Analyst ndash EU Carbon amp Power Analytics
Marcus FerdinandHead of EU Carbon amp Power Analytics
Mark CopleyDeputy Director ndash EU Exit Energy amp Climate Programme at BEIS
The future of the UK
electricity market post-
Brexit
copyright copy 2018 ICIS wwwiciscom 148
Deal or no-deal What is the timeline
November
bull Negotiators for UK and EU reach agreement in principle on Withdrawal Agreement
bull 25 November EU emergency Council meeting on Agreement
December
bull UK Parliament likely to vote on Agreement in early December
bull 13-14 Dec ndash last EU Council of 2018
2019
bull UK and EU parliamentary approval required for any deal
bull New UK legislation will need to be passed before 29 March
bull Potential for extension of date if no deal agreed
copyright copy 2018 ICIS wwwiciscom 149
EU vs UK ndash where do they both stand on energy
EU Commission publishes notice on
27 April detailing the UKrsquos position
in the EUrsquos internal energy market in
the event of ldquono dealrdquo
UK government published its Brexit
white paper on 12 July following the
fabled Chequers meeting ndash pages
44-45 are the important part
copyright copy 2018 ICIS wwwiciscom 150
Will the interconnectors stop flowing power
UK currently has three underwater cables connected to the EU ndash 2GW IFA with
France 1GW BritNed with Netherlands and 500MW East-West Interconnector
with Ireland
UK and EU papers make no mention of flows between the UK and EU halting
on 29 March 2019
National Grid 28 June 2018 ndash ldquoOur internal analysis backed up by two
separate external legal views has stated that there is no legal right for the
interconnectors to be simply ldquoswitched offrdquo post Brexitrdquo
copyright copy 2018 ICIS wwwiciscom 151
What will the commercial arrangements be
UK will lose access to the single allocation platform for forward interconnection capacity European balancing platforms and the single day-ahead and intraday coupling
UKrsquos NEMOs ndash ie EPEX Spot and Nord Pool ndash will become third country operators and will no longer be able to carry out market coupling services between UK and EU
Option 1 - open to remaining in the EUrsquos internal energy market (IEM) This includes remaining part of the EUrsquos Emissions Trading System One caveat ldquoThe UK does not believe that participation in the IEM should require a common rulebook on wider environmental and climate change rulesrdquo
Option 2 ndash Leave the IEM and explore how interconnector trade continues without automatic capacity allocation National Grid has contingencies in place
What has the EU said What has the UK said
copyright copy 2018 ICIS wwwiciscom 152
Regulations and REMIT
UK market participants will have to
register with the regulatory authority
of the Member State in which they
are active
The registration form has to be
submitted prior to entering into a
transaction which is required to be
reported
ldquoThe UK is putting in place
arrangements so that when trading
after exit businesses will have
certainty that they will not face
substantially different requirements
compared to their current
obligations under the Regulation on
Wholesale Energy Market Integrity
and Transparency (REMIT)rdquo
What has the EU said What has the UK said
copyright copy 2018 ICIS wwwiciscom 153
If the UK leaves the IEM what happens
Positive for existing interconnectors Increased price divergence between UK
and continental markets possible without market coupling
Negative for interconnectors in development Investor confidence weakens
New projects already delayed
Will liquidity in wholesale market be affected
Mark CopleyDeputy Director ndash EU Exit Energy amp Climate Programme at BEIS
BEIS Update
on Brexit
Brexit and its impact on
the EU ETS
copyright copy 2018 ICIS
Agenda
1) Brexit ndash UK installations and the short-term market impact
2) Long-term considerations for the EUA price
3) Beware of interactions
4) Future of the carbon price support
copyright copy 2018 ICIS wwwiciscom 157
Short-term considerations
UK installations will exit the EU ETS on 29 March 2019
UK brought forward its compliance deadline to 15 March 2019
UK compliance is guaranteed for emissions year 2018
Depending on broad negotiations transition period could lead to Brexit
adjustments only for phase 4
Likely no auctioning as of 1 January 2019 in case of bdquono-dealldquo scenario or
remaining uncertainty
copyright copy 2018 ICIS wwwiciscom 158
Preparing for the worst ndash a no-deal setting
Technical note on no-deal Brexit
Published 12 October 2018
2019 free allocation cannot be used by UK
operators for 2018 obligations
Recommends to open a second registry
account in another EU member state and to
transfer their EUAs to these accounts
In no dealrsquo scenario the UK government
will initially meet its existing carbon pricing
commitments via CO2 tax system
UK 2018 budget
Released on 29 October 2018
Carbon Price Support (CPS) rate at pound18t
until including the financial year 2020-21
If no-deal scenario Carbon Emissions Tax
Tax rate of pound16t (~euro18t) above an installationrsquos
emissions allowance (on top of CPS)
All stationary installations currently participating in
the EU ETS from 1 April 2019 (incl industry)
Next rate defined in 2019 budget
Emissions allowance set by EU ETS free
allocation
copyright copy 2018 ICIS wwwiciscom 159
Considerations following the preliminary agreement
Withdrawal Agreement
Published 14 Nov 2018
ldquoThe United Kingdom shall implement a
system of carbon pricing of at least the
same effectiveness and scope as that
provided by Directive 200387EC of the
European Parliament and of the Council of
13 October 2003 establishing a scheme for
greenhouse gas emission allowance
trading within the Communityrdquo
Future relationship
Released on 14 Nov 2018
ldquoConsideration of cooperation on carbon
pricing by linking a United Kingdom
national greenhouse gas emissions
trading system with the Unionrsquos
Emissions Trading Systemrdquo
copyright copy 2018 ICIS wwwiciscom 160
Short-term implications
Short-term
UK utilities expected to reduce total
hedging (in EUAs) from ~100m in
2017 to ~35m in 2030
UK utilities end 2018 locked-in 71m
EUAs for 201920
Industrials to add another
~30m~60m Brexit-related supply
Bearish risk approx euro2t-euro3t if
released Q1 20191000 euro
1200 euro
1400 euro
1600 euro
1800 euro
2000 euro
2200 euro
2400 euro
2600 euro
2800 euro
3000 euro
EU
A p
rice
[euro
to
nn
e]
hardBrexit60m hardBrexit30m base
Source ICIS
copyright copy 2018 ICIS wwwiciscom 161
Brexit impacts the market balance
In the long-term annual
balance with Brexit is tighter
given that UK is net-long
However during the middle of
phase 4 MSR operation and
abatement dynamics cause a
slightly more relaxed Brexit
balance-600
-400
-200
0
200
400
600
Tra
de
d b
ala
nce
[m
EU
As]
Annual traded balance (Brexit) Annual traded balance (non-Brexit)
Cumulative traded balance (Brexit) Cumulative traded balance (Brexit)
Cumulative traded balance (non-Brexit) Source ICIS
copyright copy 2018 ICIS wwwiciscom 162
Brexitlsquos long-term EUA price risk related to Brexit
Long-term
Assumption that transition period of
21 months (until end 2020) is
agreed
Adjustment of demand and supply
for departure of UK installations
Net long position removed from the
market
But ndash implications for parameters
like MSR000
500
1000
1500
2000
2500
3000
3500
4000
4500
EU
A p
rice
[euro
to
nn
e]
Brexit case No-Brexit case
Source ICIS
copyright copy 2018 ICIS wwwiciscom 163
Risk that market stability reserve operation is affected by Brexit
Removing UK as net
emitter reduces TNAC
MSR gets triggered less
and for fewer years in case
of Brexit
Sensitivity of TNAC around
upper threshold
-500
0
500
1000
1500
2000
2500
TN
AC
an
d M
SR
with
dra
wa
l [M
t]
MSR Brexit MSR No-Brexit TNAC Brexit
TNAC No-Brexit MSR threshold Source ICIS
copyright copy 2018 ICIS wwwiciscom 164
Carbon Price support ndash what does it actually mean
Future of UK carbon priceremains vague
In 2017 budget
Government total carbon price is set at the right level
In 2018 budget
The government will seek to reduce the CPS rate if the Total Carbon Price remains high
Carbon Emission tax level for2021 set at next budget
Delta btw 2017 and 2018 budgetapproach is approx 100m tonsbetween 2019 and 2030
0
10
20
30
40
50
60
70
EU
A p
rice
an
d U
K p
rice
flo
or
tax [euro
t]
EUA price (ICIS base case) Total carbon price (2017) inflation adjusted
Total carbon price (2018) inflation adjusted Carbon Price UK (no adjustment EU ETS participation)
Carbon Emissions Tax
Source ICISbdquoCarbon price UKldquo means EU ETS price + Carbon Price support frozen at pound18 accounting for inflation adjustment
(CET + CPS)
copyright copy 2018 ICIS wwwiciscom 165
Conclusion
A no-deal scenario would have a moderate short-term bearish effect on EUA
prices
Fundamentally we talk about extra supply of between 100 to 130m allowances until29 March
Sentiment might weigh heavier
Long-term Brexit will in principle support carbon prices
Net length removed
But MSR to be very sensitive
Highly dependant on which of the four options is chosen
Brexit and its impact on
the UK electricity market
and the EU ETS
copyright copy 2018 ICIS
Agenda
1) Will Brexit impact renewable development in the UK
2) Coal and gas generation
3) Interconnectors
4) Power price expectations
copyright copy 2018 ICIS wwwiciscom 168
Renewables in the UK ndash Historical development
Onshore wind and solar capacity grew
quickly under the Renewable Obligation
(RO) scheme but that is now closed
Since 2014 onshore wind and solar
have been excluded from the Contracts
for Difference (CfD) scheme
Therefore offshore wind looks set to
dominate capacity additions under
current policies
0
2
4
6
8
10
12
14
GW
UK renewable growth 2008-2017
Onshore wind Offshore wind Solar
Source IRENA
copyright copy 2018 ICIS wwwiciscom 169
How will Brexit impact renewable targets
The UK wants to remain in the IEM while removing itself from climate
change targets and commitments
If this were to be agreed the UK would not have to commit to a share
of the EUrsquos recently agreed 2030 renewable target of 32
If there were to be no deal this would also lead to the government
dropping out of the EU renewable target
copyright copy 2018 ICIS wwwiciscom 170
How will Brexit impact renewable targets
If this were to happen the impact on the UK would be minimal compared to current expectations
With no subsidies for onshore wind and solar future growth will come from subsidy-free projects
Funding of pound557m has already been agreed for additional CfD rounds which will lead to offshore wind growth
0
5
10
15
20
25
GW
UK renewable growth forecast to 2030
Onshore wind Offshore wind Solar
Source IRENAICIS
copyright copy 2018 ICIS wwwiciscom 171
How would a Labour government impact renewables
While Brexit will not have a major impact on renewable development a Labour government certainly would
In October the Labour Party released plans to massively increase RES capacity by 2030
Offshore wind ndash 52GW (from 8GW currently
Onshore wind ndash 30GW (from 13GW currently)
Solar ndash 35GW (from 13GW currently)
RES share in electricity ndash 85
0
20
40
60
80
100
120
GW
UK onshore wind offshore wind and solar capacity forecast
Base case Labour scenario
Source ICIS
copyright copy 2018 ICIS wwwiciscom 172
Labour targets would push down prices significantly
Our modelling suggests that if
the capacity was brought online
as planned it would significantly
reduce prices
By 2030 average annual prices
would be euro184MWh below the
base case 40
45
50
55
60
65
70
75
euroM
Wh
Power price forecast 2019-2030
Base case Labour scenario
Source ICIS
copyright copy 2018 ICIS wwwiciscom 173
The impact on capture prices would prevent subsidy-free developments
A massive expansion of renewables would lead to price cannibalisation pushing capture prices lower
By 2030 offshore wind capture prices are forecast to be euro22MWh below the base case assumption
Such low capture prices would prevent subsidy-free development in the long-term and lock in huge subsidies for existing capacity
30
35
40
45
50
55
60
65
70
75
euroW
Mh
Offshore wind capture price forecast 2019-2030
Base case Labour scenario
Source ICIS
copyright copy 2018 ICIS wwwiciscom 174
Coal and gas output in the UK - Historical
UK coal output has declined considerably since the CPS was introduced in
2013 (from 137TWh in 2012 to 21TWh in 2017)
Over the same period gas generation increased from 83TWh to 120TWh
0
20
40
60
80
100
120
140
160
TW
h
UK coal generation 2012-2018
0
20
40
60
80
100
120
140
TW
h
UK gas generation 2012-2018
Source National Grid
copyright copy 2018 ICIS wwwiciscom 175
Coal and gas output in the UK - Forecasts
All coal plants in the UK will have to close by October 2025
However given the anticipated increase in carbon prices we anticipate
coal being almost completely phased out by 2021
0
2
4
6
8
10
12
14
16
TW
h
UK coal generation forecast 2019-2030
0
20
40
60
80
100
120
140
160
180
TW
h
UK gas generation forecast 2019-2030
Source ICIS
copyright copy 2018 ICIS wwwiciscom 176
Impact on power prices
Since fuel switch has already mostly taken place the impending carbon price rise
will have less impact on the UK than on other coal-dependent countries
As a result spreads to other EU markets will narrow
45
50
55
60
65
70
euroM
Wh
Power price forecasts 2020-2030
UK Netherlands Italy
Spain Germany Poland
0
2
4
6
8
10
euroM
Wh
Power price increase 2020-2023
Source ICIS
copyright copy 2018 ICIS wwwiciscom 177
Modelling UK capacity forecast
0
20000
40000
60000
80000
100000
120000M
WUk electricity capacity forecast 2019-2030 (MW)
Nuclear Coal Gas Bio Hydro Offshore wind Onshore wind Solar
Source ICIS
copyright copy 2018 ICIS wwwiciscom 178
Modelling UK generation forecast
0
50
100
150
200
250
300
350
400
TW
hUK electricity generation forecast 2019-2030 (TWh)
Nuclear Coal Gas Bio Hydro Offshore wind Onshore wind Solar
Source ICIS
copyright copy 2018 ICIS wwwiciscom 179
Modelling UK generation forecast
0
50
100
150
200
250
300
350
400
2019 2020 2021 2022 2023 2024 2025 2026 2027 2028 2029 2030
TWh
UK electricity generation forecast 2019-2030 (TWh)
Nuclear Coal Gas Bio Hydro Offshore wind Onshore wind Solar Demand
Source ICIS
copyright copy 2018 ICIS wwwiciscom 180
Modelling UK generation forecast
0
50
100
150
200
250
300
350
400
TW
hUK electricity generation forecast 2019-2030 (TWh)
Nuclear Coal Gas Bio Hydro
Offshore wind Onshore wind Solar Imports Demand
Source ICIS
copyright copy 2018 ICIS wwwiciscom 181
Modelling UK import forecast
0
10
20
30
40
50
60
70
80
90
100T
Wh
UK net imports 2019-2030 (TWh)
Belgium Denmark France Germany Netherlands Norway
Source ICIS
copyright copy 2018 ICIS wwwiciscom 182
Modelling UK power price forecast
50
52
54
56
58
60
62
64
66
68
2019 2020 2021 2022 2023 2024 2025 2026 2027 2028 2029 2030
poundM
Wh
UK power price forecast 2019-2030 (poundMWh)
Gas prices ease
pressuring power
prices lower new
interconnector
Increasing carbon price
pushes up prices (but less
pronounced than other
markets)
Carbon prices soften
offshore wind capacity
expands increased imports
via new interconnectors
Nuclear
reduction coal
closures in
neighbouring
countries
Source ICIS
copyright copy 2018 ICIS wwwiciscom 183
Conclusions
The biggest disrupter to the power market comes not from Brexit but from a
Labour government
This would likely lead to a rapid renewable expansion which would pressure prices lower
Under current policies renewable growth will be dominated by offshore wind in
the mid-term due to the absence of subsidies for onshore wind or solar
Despite an official coal phase-out date of October 2025 coal will be almost
completely pushed out of the mix from 2021
The UK looks set to increasingly rely on interconnectors as older thermal
capacity closes
Renewable energy trends across Europe
Matteo MazzoniSenior Analyst ndash EU Carbon amp Power Analytics
Dr Vija PakalkaiteAnalyst ndash EU Carbon amp Power Analytics
copyright copy 2018 ICIS
Agenda
1) Regulatory environment
Race to reach the 2020 targets
Recast Renewable Energy Directive
2) RES auctions trends
Auction designs
Auction results
3) RES costs and future outlook
4) Conclusions
copyright copy 2018 ICIS wwwiciscom 186
Renewable targets for 2020
EU level
Binding target of 20 RES in final energy
consumption in 2020 (comprised of Electricity
(RES-E) Heating amp Cooling and Transport
No binding target for RES-E
It reached 17 in 2016 and is on course for
2020
Member State level
Each country has a binding target for RES in
final energy consumption
11 member states already exceeded this target
in 2016 most of the 17 other countries are on
course to meet 2020 target
0
5
10
15
20
25
[]
EU-RES share in final energy consumption
res share target
Source ICIS based on Eurostat
copyright copy 2018 ICIS wwwiciscom 187
2020 RES share and distance to the target in 2016
-9-7-5-3-113579
Ga
p to
th
e ta
rge
ts [p
p]
14
23
16 1511 13
1013 15
25
18 18
40
20
31
14
34
17
38
24
13 13
30
23
16
25
49
20
202
0 R
ES
[
] ta
rge
ts
Source ICIS based on Eurostat
copyright copy 2018 ICIS wwwiciscom 188
2016 distance to 2020 target in energy volume
-1300
-1100
-900
-700
-500
-300
-100
100
300
Dis
tan
ce
to
ta
rge
t ke
ep
ing 2
01
6 c
on
sta
nt [T
Wh
]
Source ICIS based on Eurostat
copyright copy 2018 ICIS wwwiciscom 189
Implications of non-compliance and MS strategies
2020 can be reached by
Physical investments (both national or joint)
Administrative measures statistical transfers
Consequences of non compliance
No penalty mechanism in Directive itself
Infringement proceedingsReasoned Opinion by the EC referral to CJEU Burdensome for all parties and can take several years
Ramp-up
Statistical transfers
Wait and see
copyright copy 2018 ICIS wwwiciscom 190
Statistical transfers first deals made in late 2017 increase expected especially towardsfor 2020 delivery
Luxembourg ndash Estonia
Length 2018-2020
Volume 700MWh
Cost euro105m
Cost per unit
euro15MWh
Luxembourg ndash
Lithuania
Length 2018-2020
Volume Unknown
Cost ldquoAt least euro10mrdquo
Cost per unit around
euro15MWh
copyright copy 2018 ICIS wwwiciscom 191
Proliferation of RES tendersauctions
MS behind their RES 2020 targets
lsquowoke uprsquo and speedily install
tenderingincrease volumes
2018 ndash last year to tender multi-
technology for 2020 target 2019 ndash
last year for solar (shorter lead time)
11 MS have executed
tendersauctions
5 MS Legal frameworks in place or
about to be adopted
Source ICIS RES auctions database
copyright copy 2018 ICIS wwwiciscom 192
Countries behind the 2020 target ramp up
0
5
10
15
20
25
30
RE
S a
uctio
n r
esu
lts v
olu
me
s [G
W]
DE auction volumes ES auction volumes FR auction volumes NL auction volumes UK auction volumes other countries
Source ICIS RES auctions database
copyright copy 2018 ICIS wwwiciscom 193
Assumed cumulative generation from auctions to be added by 2020
Country Estimated additional
RES generation [TWh]
Progress in closing the
gap
France 100 79
Germany 100 120
Netherlands 274 590
Poland 04 14
Spain 84 333
United Kingdom 45 51
total 609 152
total without UK 564 181
copyright copy 2018 ICIS wwwiciscom 194
Renewable energy targets for 2030
Recast Renewable Energy Directive
ndash 2030 target for RES in final
energy consumption
Progress control in Governance
Regulation
Draft national energy and climate
plans (trajectories) ndash end 2018
ldquoGap fillerrdquo mechanisms
Overall EU target 32
No national binding targets
2020 targets will be baseline
copyright copy 2018 ICIS wwwiciscom 195
RES share 2020 ndash the baseline through 2030
ldquoUnder no circumstances the
national RES share should fall
belowrdquo
If deviated from the baseline ndash
additional national measures to be
taken ldquowithin one yearrdquo
Additional measures to take
Within 2021 or 2022
Statistics compiled
Oct 2021 national statistics agencies
Jan 2022 Eurostat publication
Fulfilling the 2009 RED requirements
National binding target
Full year 2020
copyright copy 2018 ICIS wwwiciscom 196
Recast Directive and RES support schemes
ldquoDesigned in a market-based wayrdquo
Competitive bidding except for small scale RES
Feed-in Premiums instead of Feed-in Tariffs or Certificates of Origin (ldquogreen certificatesrdquo)
Bidding should be non-discriminatory (technology neutral)
Opening up support schemes
Voluntary
At least 5 of newly supported RES capacity in 2023-2026 increase to 10 in 2027-2030)
Or the level of interconnectivity of a MS if lower
Guarantees of Origin and supported electricity
RES auction trends
copyright copy 2018 ICIS wwwiciscom 198
Trends in auction designs
From technology-specific to multi-technology
Germany and France have had ldquopilotrdquo auctions wind vs solar
Legal frameworks for ldquotechnology neutralrdquo in Hungary Finland Ireland Lithuania Spain Slovenia
But many limitations
From tariffs towards premiums
Floating FiP Denmark Finland France Germany Hungary Ireland Italy Lithuania Netherlands Slovenia Spain
Contracts for Difference Denmark(offshore) Hungary Greece Poland the UK Italy (forthcoming)
Fixed FiP Denmark (solar) Estonia
copyright copy 2018 ICIS wwwiciscom 199
Auction results the success of solar PV
0
5
10
15
20
25
30
Aw
ard
ed
vo
lum
es in
au
ctio
ns in E
uro
pe
[G
W]
solar wind onshore wind offshore biogasampbiomass hydro other RESSource ICIS RES auctions database
copyright copy 2018 ICIS wwwiciscom 200
Trends in auction results solar vs wind
0
50
100
150
200
250
Str
ike
price
ave
rage
s [
euroM
W]
Technology specific RES auctions
German Auction-Solar German Auction-Wind
French Auction-Solar French Auction-Wind
Greek Auction-Solar Greek Auction-Wind
Lithuanian Auction-Wind
0
50
100
150
200
250
Str
ike
price
ave
rage
s [
euroM
W]
Multi-technology RES auctions
German Auction-Solar Spanish Auction-Solar
Spanish Auction-Wind French Auction-Solar
Dutch Auction-Solar Dutch Auction-Wind
Slovenian Auction-Solar Slovenian Auction-Wind
UK Auction-Solar UK Auction-Wind
Source ICIS RES auctions database Source ICIS RES auctions database
copyright copy 2018 ICIS wwwiciscom 201
Offshore wind is picking up
0
50
100
150
200
250
Str
ike
price
s in
re
ce
nt E
U o
ffsh
ore
win
d p
roje
cts
[euro
MW
h]
Source ICIS Power Perspective
copyright copy 2018 ICIS wwwiciscom 202
Offshore wind ndash closing the RES gap
0
5
10
15
20
25
30
35
Bu
ilt a
nd
pla
nn
ed
off
sh
ore
win
d c
ap
acity [M
W]
Source ICIS Power Perspective
copyright copy 2018 ICIS wwwiciscom 203
Turbine
Balance of System
Financial
Turbine32
Development3
Foundations15
Electrical infastructure
9
Assembly amp Installation
19
Commissioning1
Decommissioning
5
Contingency6
Finance9
Insurance1
Breakdown of offshore wind costs
Recipe for a ldquosubsidy freerdquo offshore trends
Larger turbines
Synergies with adjacent
sites
Grid connection
Longer lifetime (30y)
Potential costs reductions
Source NREL
Renewable energy outlook
copyright copy 2018 ICIS wwwiciscom 205
RES outlook
copyright copy 2018 ICIS wwwiciscom 206
RES costs developments
The overall trend sees all
renewable costs (LCOEs) falling
over the next decade
Solar and offshore wind will be
the technologies experiencing
the biggest reduction
Market parity may come sooner
than expected
However RES business plan
needs stability -gt PPAs
0
20
40
60
80
100
120
Estim
ate
d R
ES
-E L
CO
ES
[euro
MW
]PV Wind onshore Wind offshore Hydro Bioenergy
Sources IRENA BEIS auctions Bundesnetzagentur McKinsey Lazard 2017-18
copyright copy 2018 ICIS wwwiciscom 207
Centralized vs Decentralized
Source Lazard 2018
Solar has the largest potential in terms of penetration
Solar costs vary a lot based on the size of the plant
Onshore wind and utility scale PV are already cost-competitive with conventional thermal plants
Two different market models may be competing
Grid defection problem
0
50
100
150
200
250
RooftopRes
RooftopCampI
Community Utility Scale- Crystaline
Utility Scale- Thin film
Wind
LC
OE
pe
r P
V a
nd
win
d insta
llatio
ns [euro
MW
]
copyright copy 2018 ICIS wwwiciscom 208
Storage is catching up and it may be the game-changer
0
100
200
300
400
500
600
Sto
rage
ndashe
ne
rgy insta
llatio
n c
osts
euroM
Wh
Pumped Hydro CAES li-Ion (LFP) NaS Vanadium
Source IRENA 2018
Higher RES in the system will require a higher degree of flexibility
Electricity storage will play a crucial role in enabling the next phase of the energy transition
Prices are falling and based on the difference services that could be provided storage may become attractive quite soon
Power-to-gas may enter into the game (seasonal storage)
copyright copy 2018 ICIS wwwiciscom 209
RES costs and Horizon power price outlook
10
20
30
40
50
60
70
80
90
100
110
RE
S a
nd
Horizo
n p
rice
fo
reca
st [E
UR
MW
h]
Horizon price outlook PV LCOE Wind onshore LCOE Wind offshore LCEO
Source ICIS Power Horizon BEIS auctions Bundesnetzagentur McKinsey Lazard 2017-18
copyright copy 2018 ICIS wwwiciscom 210
Conclusions
Targets Unclear destiny of binding national targets
EU as a whole is at risk to miss the 2020 target as the worst performers also are largest consumers
Statistical transfers can help fill the gap but will likely not be used for entire delta
Uncertainty regarding implications of not meeting national targets
PolicyRamp up of support and statistical transfers in early 2020s
Technology neutral auctions is the new black in mid-term
PPAs will play an important role
Targets
Policies
Costs
Market impact
copyright copy 2018 ICIS wwwiciscom 211
CostsRenewables costs will continue to fall
Wind and solar utility-scale projects are already competitive with conventional thermal
Storage systems will be essential in driving the decarbonisation
Market impactGrid-parity is already a reality in some cases while market parity maybe just behind the corner
Carbon price pushing up power prices will make renewables far more competitive reducing the need for subsidies
Power markets design remains an open issue
Targets
Policies
Costs
Market impact
Conclusions
Stay focused on the power market developments that are important to your business with the new online tool from ICIS
Understand the impact of energy policy changes
Anticipate market developments across Europe
Foresee risks and spot profitable opportunities Fast
ICIS Power Perspective amp Horizon
Speak to us to find out more
Tel +44 20 7911 1919 | Email powerperspectiveiciscom | wwwiciscompowerperspective
Reliable provider of global carbon market analytics and forecasts
Learn more
Stay ahead of the carbon market trends and developments
Get the latest analysis and forecasts for global carbon trading
Make profitable investments within seconds
Strengthen you trading position
wwwiciscom
Viviana Ciancibello Business Developer EEX
ICIS Power and Carbon Seminar
Berlin 15 November 2018
Power Purchase Agreements
Hedging via EEX Power Futures
A few key figures
copy EEX AG 2018 2
32 June 2018 new binding 2030 renewable
energy target for the EU
euro62bn Feb 2018 IRENA report of estimated
average investment in renewable energy
per year to reach 34 capacity in the EU
17 2016 estimated share of renewable energy
in the EUs gross final energy consumption
Source EU Commission Bloomberg
One PPA is not like the other
3
Power Purchase Agreement (PPA)
Long term contract between a party generating and selling electricity and a
party purchasing electricity Have existed for decades
Corporate PPA
Renewable Corporate PPA
Electricity traded between the two parties comes from a Renewable Energy
power plant PPAs are necessary to be in place prior to a RE asset
developer securing financing from a bank for their project Purchasers
are attracted by lower prices and the lsquogreen credentialsrsquo in having their power
supply come from 100 renewable sources RE Corporate PPAs are often
fixed for long periods up to 15 years to ensure revenue security for the
developer
Corporate PPAs enable businesses to source electricity from generators at
an agreed price while giving producers a reliable guaranteed buyer at a
stable price
copy EEX AG 2018
RE Corporate PPAs are quickly gaining in popularity
in Europe
4
Around 6 of new installed wind
power capacity in Europe in the
last 5 years is under PPAs
In Europe over 1GW of power was contracted
under PPAs in 2017 with 95 of this volume
coming from the Netherlands Norway
Sweden and the UK due to favourable policy
conditions
More PPAs in Germany and Europe are
expected once wind and solar assets start
coming off of subsidies in the next few
years
Source WindEuropecopy EEX AG 2018
Who are the Corporates and what is driving them
5
RE 100 is a global initiative uniting more than 100 influential
businesses committed to sourcing 100 of their power
supply from renewable electricity by a specified year
Table source RE 100copy EEX AG 2018
EEX lists full Power Futures curves in 16 European
market areas
copy EEX AG 2018 6
EEX connects 264 trading
participants from 28 countries
8 Austria
1 Belgium
1 Bulgaria
1 Croatia
20 Czech Republic
7 Denmark
2 Finland
13 France
57 Germany
2 Greece
3 Hungary
1 Ireland
34 Italy
5 non-European participants
Canada Cayman Islands USA
Exchange traded EEX Power Futures
EEX Trade Registration Services for Power Futures
New Market Area As of 31 May 2018
1 Luxembourg
10 Netherlands
6 Norway
10 Poland
1 Portugal
3 Romania
4 Slovakia
4 Slovenia
14 Spain
3 Sweden
20 Switzerland
33 United Kingdom
How are EEX Members active in PPAs
7
EEX Members buy Power
via Long-Term PPAs
and build RE assets
EEX Members provide
balancing services on Spot
amp hedge via Futures
RE Developers sell Power via
Long-Term PPAs
EEX Members sell Power from their own
RE assets via LT Corporate PPAs
Banks provide financing
once PPA is in place
copy EEX AG 2018
euro
0
5
10
15
20
25
30
35
40
45
50
0
5
10
15
20
25
30
2019 2020 2021 2022 2023 2024 2025 2026 2027 2028
Pri
ce (
EUR
)
MW
MW Price
PPAs affect the hedging profile of EEX Members
and extends it to the long-term
8
Old hedging horizon to Cal+3
New hedging horizon to Cal+10
EEX members have been using Power Futures to hedge merchant risk from
conventional power plants for years
EEX is investigating listing further calendar expiries to support long-term
hedging of Renewable Energy assets
10-Year PPA Fixed Price and Volume Profile
Current EEX Futures to Cal+6
copy EEX AG 2018
How do EEX Power Derivatives help to mitigate
PPA Price Risk
9
Since 29th May 2018 15 long-term hedges of calendar contracts up to 2024
have been registered OTC in Spanish Power with a total volume of 116 TWh
copy EEX AG 2018
Market participants who enter into long-term PPAs can register a strip of cash-
settled calendar futures out to Cal+6 for clearing with EEX
This means that sellers can lock in a secure cash flow for up to 6 years
for the sale of electricity in the respective market area
Buyers lock in a guaranteed price of purchase for up to 6 years providing
certainty on their future electricity price and protecting against upswings
Therefore the purchase or sale of derivatives provides long-term price risk hedging
together with counterparty risk mitigation through the ECC clearing house
Example Long-Term Hedge cleared on 12 July on
Spanish Power
10
A 50 MW strip from July 18 to Cal+6 was cleared in Spanish Power on 12 July
2018 with an initial margin requirement of 6543286 EUR
The Initial Margin percentage of the notional value of the trade was 466
The execution price of each trade was 4985 EUR
Trade Date ProductExpiry
Year
Expiry
MonthTrade Price
Initial
Margin per
Contract
ContractsTotal Initial
Margin
Trade Volume
(in MWh)Notional Value
12072018
Spanish Power Base Month 2018 8 4985 euro 3266 euro 50 163300 euro 37200 37088 euro
Spanish Power Base Month 2018 9 4985 euro 3153 euro 50 157650 euro 37200 35892 euro
Spanish Power Base Quarter 2018 10 4985 euro 7908 euro 50 395400 euro 109500 5458575 euro
Spanish Power Base Year 2019 12 4985 euro 12527 euro 50 626340 euro 438000 21834300 euro
Spanish Power Base Year 2020 12 4985 euro 10716 euro 50 535824 euro 439200 21894120 euro
Spanish Power Base Year 2021 12 4985 euro 10862 euro 50 543120 euro 438000 21834300 euro
Spanish Power Base Year 2022 12 4985 euro 19885 euro 50 994260 euro 438000 21834300 euro
Spanish Power Base Year 2023 12 4985 euro 29959 euro 50 1497960 euro 438000 21834300 euro
Spanish Power Base Year 2024 12 4985 euro 32589 euro 50 1629432 euro 439200 21894120 euro
6543286 euro 2814300 140292855 euro
Initial Margin in of Notional Value 466
copy EEX AG 2018
Long-term Hedges contribute to overall Open
Interest in Spanish Power
11
Op
en In
tere
st M
Wh
(p
rev
day
)
Trad
ed V
olu
me
MW
h
copy EEX AG 2018
Long-term hedges cause volume spikes and contribute to Open Interest
Spanish Power now has the highest Open Interest in long-dated contracts
Daily Settlement in Illiquid Contracts and Legacy
Trades
12
In illiquid long-dated contracts where there have been no order book trades
EEX uses two methods to determine settlement prices
Fair Value Providers ask chief traders from select members what their fair
values are for settlement
Market Structure take the daily price dynamic of the last liquid expiry and
apply it to the illiquid expiries (ex Cal21 increases by 30 euroct then Cal22 ndash
Cal24 will increase by 30 euroct)
Legacy Trades are possible at EEX in order to ldquoroll overrdquo a long-term hedge
at the previously traded price once a new Cal is open
Prices which are out of range must be approved by the respective General
Clearing Member
copy EEX AG 2018
Renewable Corporate PPAs are the dawn of a new
era in the Energy Transition
13
PPAs are an enabler of new Renewable Energy
developmentshellip
Major energy players are already starting to hedge their
long-term price risk with standard EEX products
hellipbut the market is in need of more standardisation and
better risk management products in order to grow and
meet the EUrsquos ambitious targets
EEX will ensure we remain part of our Membersrsquo long-term
hedging strategy and explore opportunities to build new
PPA-related products
copy EEX AG 2018
Thank you
Viviana Ciancibello
Business Developer
European Power Derivatives
VivianaCiancibelloeexcom
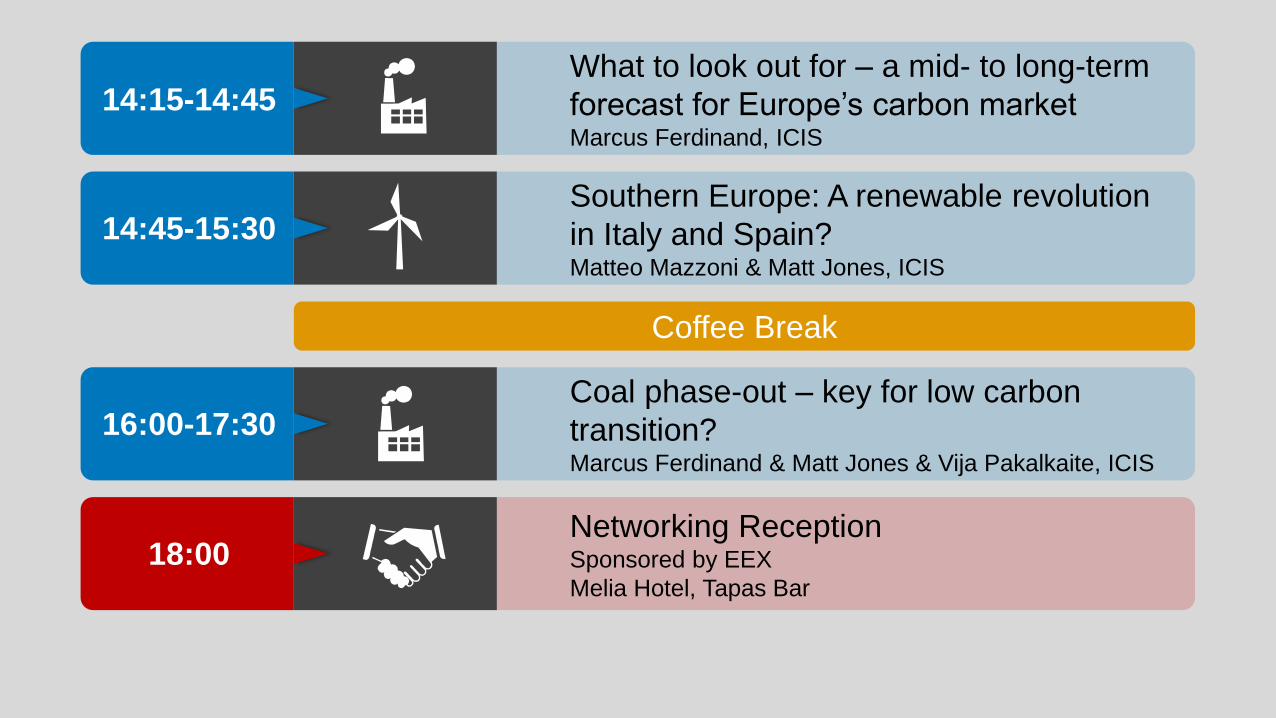
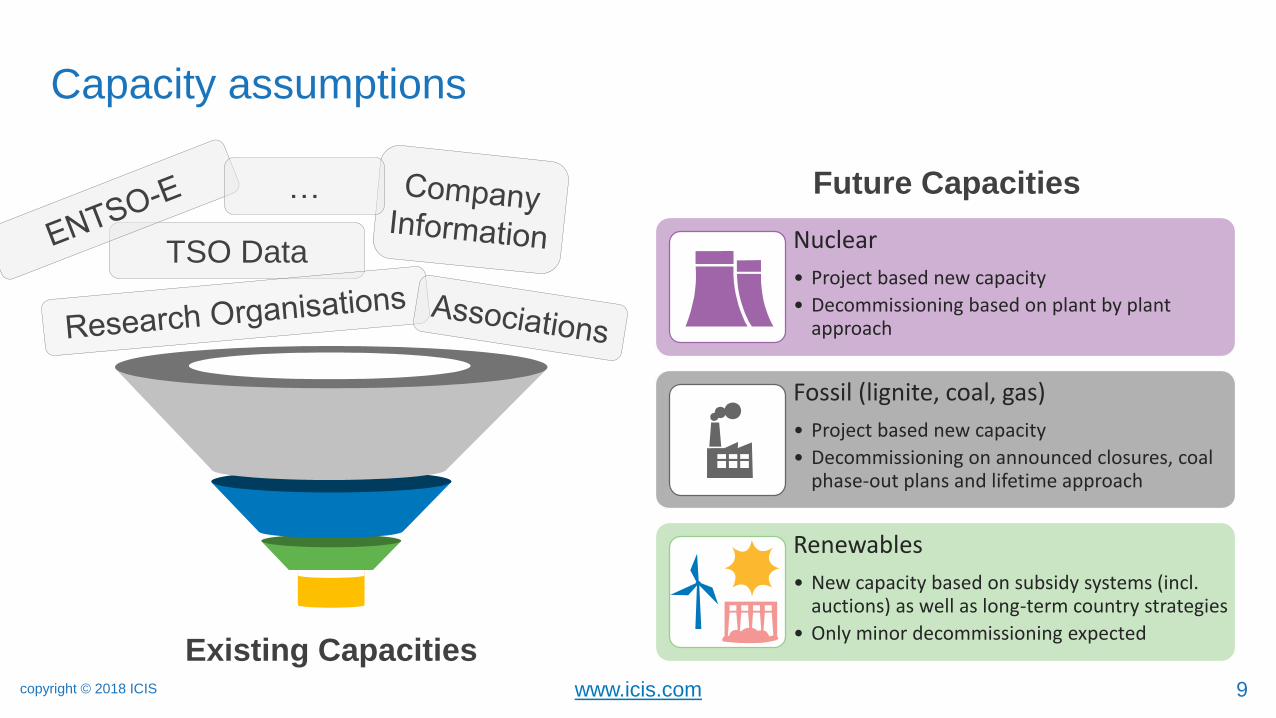
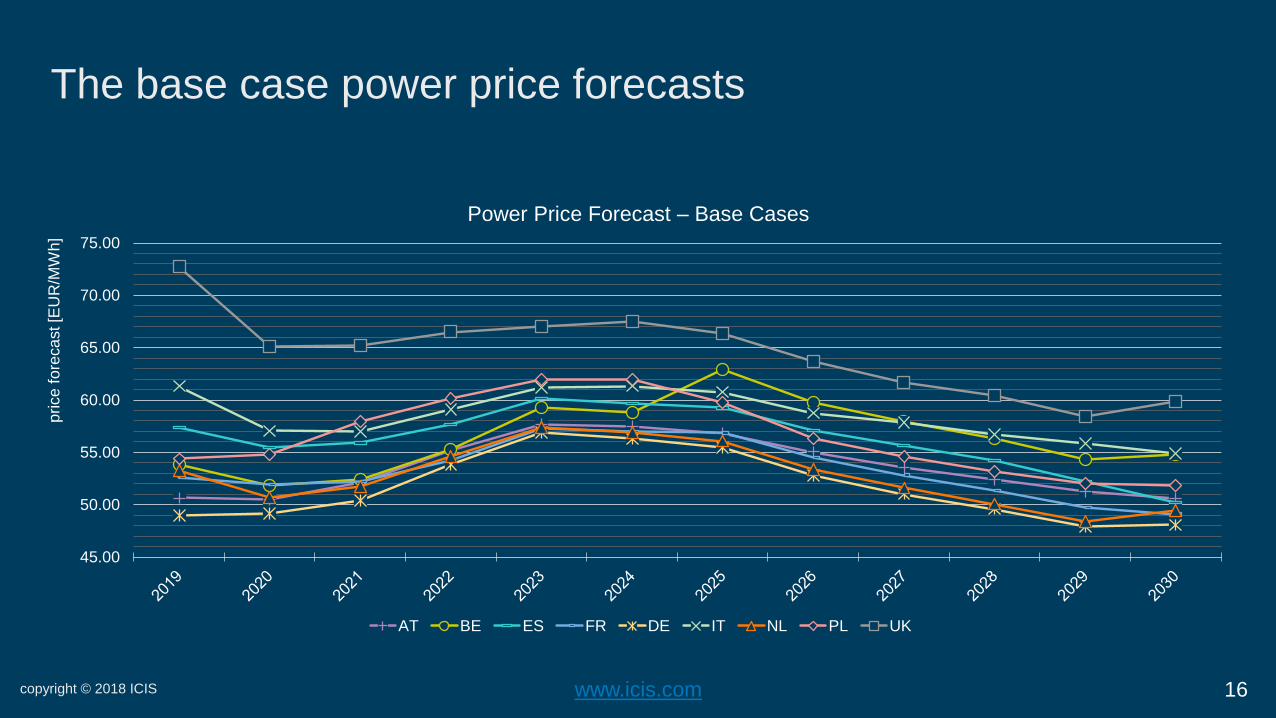