

1
Individual Learning Plans for College and Career Readiness: State Policies and School-Based PracticesA National Study
October 2015

2 3
Executive Summary —
College and career readiness is an increasing priority of secondary schools, school districts, and states. The changing economic and technological landscape has necessitated that schools provide students with the skills to navigate the complex requirements of the 21st century workplace. This report examines how states and schools have responded to these demands through schools’ use and implementation of Individual Learning Plans (ILPs) and expands upon two prior reports developed by Hobsons in 2009 and 2011. ILPs are personalized plans developed collaboratively by students and school personnel to set goals that help students focus on their academic and career futures and keep them on track toward these goals. ILPs are also known as Academic Achievement Plans, Personal Learning Plans, Personal Graduation Plans, or 4-Year Plans.
The National Association for College Admission Counseling (NACAC), in partnership with Hobsons and with analytical support from Coffey Consulting, LLC, initiated this study to more fully understand:
1. How ILPs are operationalized in high schools
2. Who is tasked with implementing ILPs in high schools and the scope of their responsibility for assessing the success of ILPs on student outcomes
3. The extent to which ILP requirements contribute to high school students’ college/career readiness and successful transition to postsecondary education and work
To answer these questions, NACAC oversaw a review of state websites (Chapter 1) and surveyed a random sample of school personnel at public high schools in all 50 states and the District of Columbia (Chapters 2, 3, and 4). Key findings include:
• Twenty-nine states and the District of Columbia mandated ILP policies or other college and career readiness initiatives.
• In some cases, state-level ILP mandates have not translated into school-level practice. Among survey respondents in ILP-mandated states, 29 percent reported that they did not, in fact, use ILPs. Conversely, many survey respondents from states without ILP mandates (44 percent) reported using ILPs in their schools.
• More than half of survey respondents with ILPs (54 percent) had been using them for more than five years. Nearly one-third (31 percent) had been using ILPs for 10 years or more.
• Almost all survey respondents reported that ILPs were initiated by 9th grade. Nearly 40 percent of schools initiated an ILP in 8th grade.
• Survey respondents indicated a relative lack of involvement in ILP development, implementation, and evaluation among state- and district-level stakeholders, as well as among school administrators and personnel other than counselors.
• According to survey respondents, counselors were most involved with implementation of ILPs and least involved with evaluation.
• Counselor training related to ILP use was lacking. One-third of survey respondents reported receiving training on ILP implementation, 24 percent for ILP design/development. Only 7 percent reported having received training for evaluation of ILPs.
• Nearly three-quarters of survey respondents (74 percent) indicated that tracking of ILP progress ended upon high school graduation, thereby limiting assessments of effectiveness.
• Nearly two-thirds (62 percent) of survey respondents judged that, based on their professional experience, ILPs somewhat or greatly contributed to successful student outcomes.
• Feedback from survey participants pointed to the need for more one-on-one time between counselors, students, and their families.

4 5
Table of Contents —
Executive Summary 2
Chapter 1. State Policies Regarding ILPs 6
Chapter 2. ILPs in Practice: How Schools Use ILPs 11
Chapter 3. ILP Effectiveness: Connecting ILPs to Student Outcomes 27
Chapter 4. Recommendations for Policy and Practice 31
References 34
Appendix A: Methodology 36
Appendix B: State ILPs 38
Acknowledgements 54
6 7
Chapter 1. State Policies Regarding ILPs —
A state scan was conducted to identify ILP initiatives in place or under development in all 50 states and the District of Columbia. The scan consisted of a thorough search of each state’s education department website for information related to ILPs. This scan was supplemented with a follow-up email sent to an education department representative from each state that asked the following questions:
• How do students develop a plan with the Individualized Learning Plan? For example, do students develop the plan online or do students create the plan with academic counselors?
• What are the typical components of an Individualized Learning Plan?• How many times are the Individualized Learning Plans reviewed?• Has there been any research on the effectiveness of Individualized Learning
Plans? If yes, what has the research found?
In cases where state websites did not provide information about ILPs and state contacts did not respond to our emails, the U.S. Department of Labor’s Office of Disability Employment Policy database of ILP mandates was used to identify a state’s ILP policies.1 This database was used to identify ILP policies in eight states.
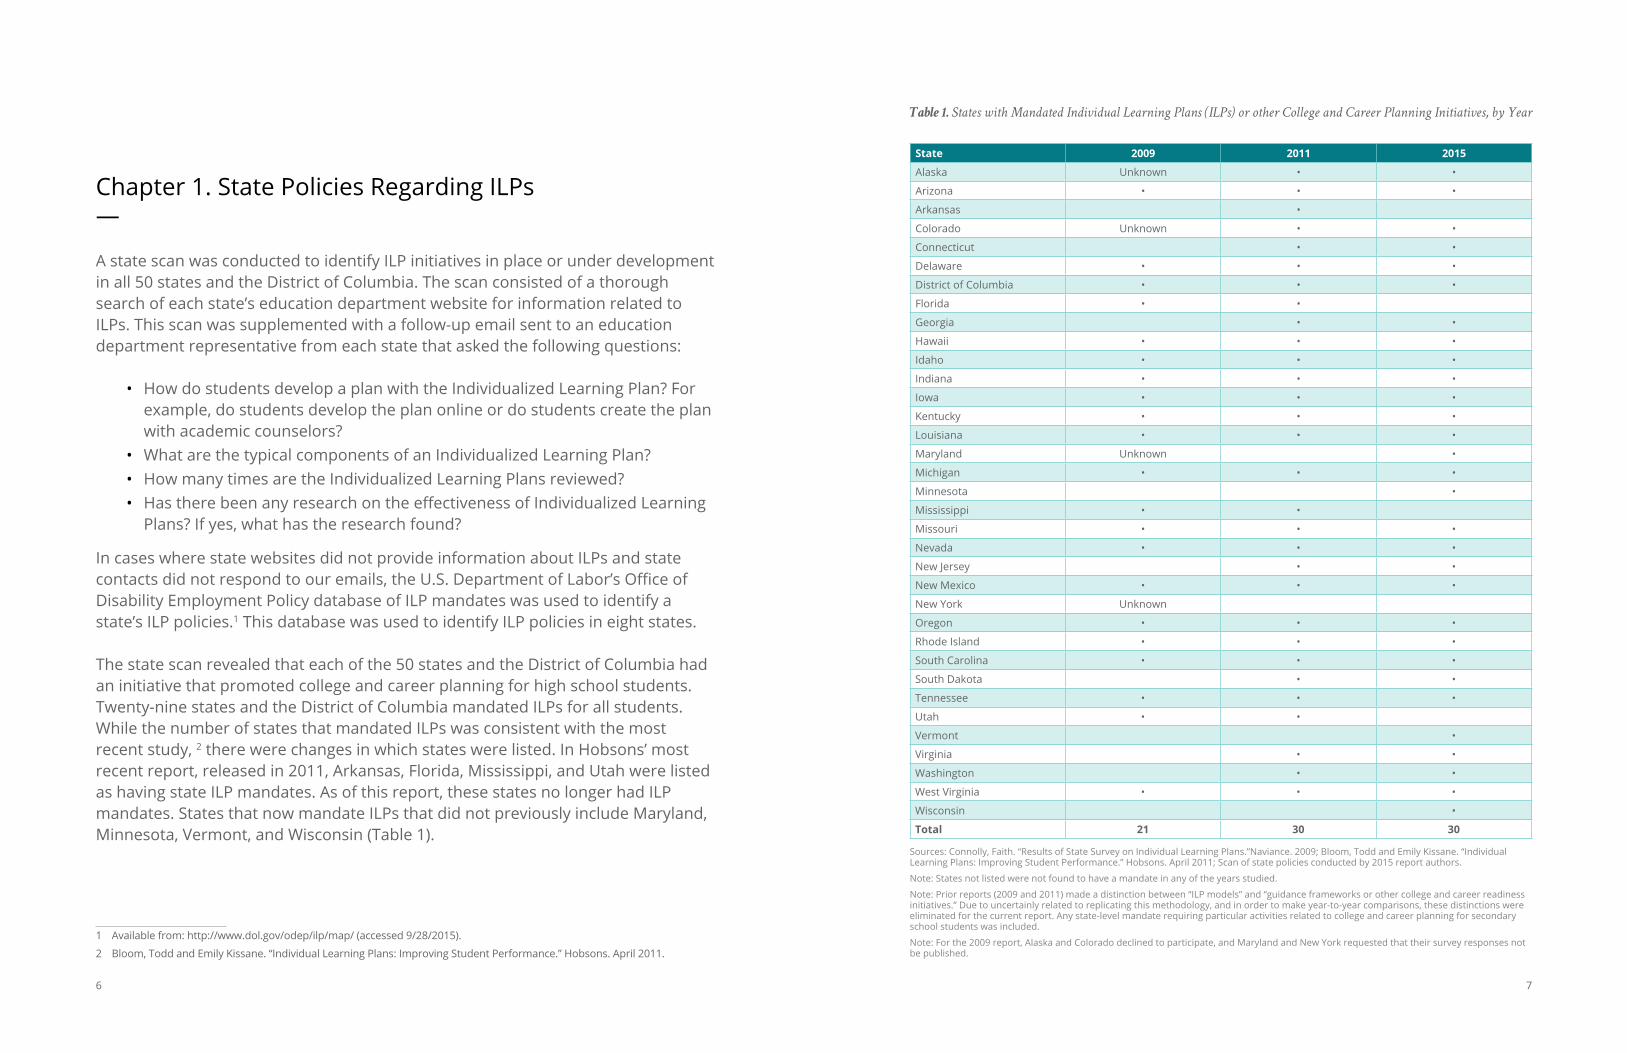
The state scan revealed that each of the 50 states and the District of Columbia had an initiative that promoted college and career planning for high school students. Twenty-nine states and the District of Columbia mandated ILPs for all students. While the number of states that mandated ILPs was consistent with the most recent study, 2 there were changes in which states were listed. In Hobsons’ most recent report, released in 2011, Arkansas, Florida, Mississippi, and Utah were listed as having state ILP mandates. As of this report, these states no longer had ILP mandates. States that now mandate ILPs that did not previously include Maryland, Minnesota, Vermont, and Wisconsin (Table 1).
1 Available from: http://www.dol.gov/odep/ilp/map/ (accessed 9/28/2015).
2 Bloom, Todd and Emily Kissane. “Individual Learning Plans: Improving Student Performance.” Hobsons. April 2011.
Table 1. States with Mandated Individual Learning Plans (ILPs) or other College and Career Planning Initiatives, by Year
State 2009 2011 2015
Alaska Unknown • •
Arizona • • •
Arkansas •
Colorado Unknown • •
Connecticut • •
Delaware • • •
District of Columbia • • •
Florida • •
Georgia • •
Hawaii • • •
Idaho • • •
Indiana • • •
Iowa • • •
Kentucky • • •
Louisiana • • •
Maryland Unknown •
Michigan • • •
Minnesota •
Mississippi • •
Missouri • • •
Nevada • • •
New Jersey • •
New Mexico • • •
New York Unknown
Oregon • • •
Rhode Island • • •
South Carolina • • •
South Dakota • •
Tennessee • • •
Utah • •
Vermont •
Virginia • •
Washington • •
West Virginia • • •
Wisconsin •
Total 21 30 30
Sources: Connolly, Faith. “Results of State Survey on Individual Learning Plans.”Naviance. 2009; Bloom, Todd and Emily Kissane. “Individual Learning Plans: Improving Student Performance.” Hobsons. April 2011; Scan of state policies conducted by 2015 report authors.
Note: States not listed were not found to have a mandate in any of the years studied.
Note: Prior reports (2009 and 2011) made a distinction between “ILP models” and “guidance frameworks or other college and career readiness initiatives.” Due to uncertainly related to replicating this methodology, and in order to make year-to-year comparisons, these distinctions were eliminated for the current report. Any state-level mandate requiring particular activities related to college and career planning for secondary school students was included.
Note: For the 2009 report, Alaska and Colorado declined to participate, and Maryland and New York requested that their survey responses not be published.

8 9
State ILP policies were examined for key characteristics (see Table 2). The most common ILP elements included: an academic plan; identification of academic, career, and personal goals; a career exploration tool; and the capacity to update ILPs annually. Less commonly found characteristics among the states and the District of Columbia included: a resume builder; opportunities for personal reflection; personality and learning style assessments; identification of strengths and needs; an action plan, which allows students to set goals and timelines to better monitor progress; community service learning; and referrals for learning support.
The most commonly found ILP component, academic plans, tended to include course mapping for graduation requirements and/or college and career goals. Most plans allowed students to identify academic, career, and personal goals as a guide map for high school. Many states were beginning to use electronic and online plans to better enable students not only to remain on course, but to update the plan annually and effectively, and to share updates with students, parents, counselors, and teachers.
Table 2. Key Elements of State ILPs or other College and Career Planning Initiatives
Number of States that Include Each Element
Academic plan 49
Academic, career, and personal goals identified 45
Career exploration 45
Updated annually 41
Strengths and needs assessments 21
Resume builder 18
Personal reflection 17
Service learning 16
Action plan 15
Personality and learning style assessments 10
Learning support referral 10
Source: Scan of state policies conducted by 2015 report authors. Note: n = 51 (50 states and the District of Columbia)
Some states had been, or were in the process of, collecting data on ILPs to better evaluate their use and effectiveness in improving students’ high school performance and college enrollments. Based on the state scan, only nine states had conducted formal evaluations on ILPs, although several states were currently collecting data to measure ILP efficacy in the future. Of the states that had evaluated ILP use, most collected data on ILP usage and completion, including Colorado, the District of Columbia, Indiana, Kentucky, and Nebraska. Other states
had assessed ILP effectiveness, including California, Oklahoma, Rhode Island, and South Carolina. New Jersey, for instance, contracted Rutgers University to conduct a three-year evaluation of their Personalized Student Learning Plan pilot program, which provided valuable information on effective implementation strategies in New Jersey. The study found that the following factors increased student success: a clear framework for school personnel to follow; adequate training and time allotted to school personnel; strong teams that include grade-level teachers as well as counselors and administrators; continuous feedback; and collective commitment at school sites.3 Table 3 provides an overview of the type of ILP assessments used by these states and the District of Columbia.
Table 3. Types of State-Level Assessments of ILP/College and Career Planning Initiatives
States with ILP Assessments Type of Assessments
California Tracks whether students in certified pathway program earn additional credits, are more likely to be on track toward graduation, and are more likely to graduate than peers in more traditional high school programs.
Colorado Tracks Individual Career and Academic Plan usage, along with milestones within the plan.
Delaware Beginning to collect data.
District of Columbia Tracks student course completion, specifically repetition of courses, and regularly administers surveys.
Indiana Tracks High School Graduation Plan usage and graduation rates. Indiana also has a survey called the Learn More Indiana Survey.
Kentucky Tracks ILP usage and completion rates.
Nebraska Tracks Personal Learning Plan usage and effectiveness.
New Jersey Rutgers University conducted a three-year evaluation report on the state’s Personalized Student Learning pilot program.
Oklahoma Tracks academic achievement in Career and Technical Education programs.
Rhode Island Has a Data Hub with statistics on student success measures and is collecting data on ILP usage.
South Carolina Conducts longitudinal studies on the state’s Personal Pathways to Success initiative.
Source: Scan of state policies conducted by 2015 report authors.
To better understand ILP use and evaluation efforts, all 50 states and the District of Columbia were contacted via email between October and December 2014.
3 John J. Heldrich Center for Workforce Development. “New Jersey Department of Education Personalized Student Learning Plan Pilot Program, 2011-2012 Evaluation Report.” October 2012. Available from: http://www.state.nj.us/education/cte/pslp/EvaluationReportY3.pdf (accessed 9/28/15).

10 11
Representatives from 25 states and the District of Columbia provided a response. Many of these respondents shared that ILPs were created at the local level, meaning schools determined the elements of students’ ILPs. These respondents included Alaska, Connecticut, Indiana, Kentucky, Maine, Michigan, Minnesota, New Hampshire, New Jersey, New Mexico, and Rhode Island. However, some respondents noted that ILP elements are state regulated, including Delaware, Hawaii, and Missouri. Respondents from South Carolina and Virginia provided information about their state’s use of technology when creating and using ILPs. South Carolina indicated that the state uses a web-based program called Powerschool, and Virginia has implemented an interactive online tool, Virginia Education Wizard. Both tools allow students to create and follow a path to help them become career and college ready.
Chapter 2. ILPs in Practice: How Schools Use ILPs —
Table 4 presents the distribution of the schools surveyed by state. Close to two-thirds (64 percent) of all schools in the United States were surveyed. Of the 10,000 surveyed schools, 16 percent responded, with more than half reporting that they used ILPs. While the state scan identified that 29 states and the District of Columbia have state-mandated ILPs, survey respondents from 44 states and the District of Columbia reported ILP state mandates.
Table 4. Distribution of Schools Surveyed by State
State Name Mandated ILP State
Total Number of High Schools
% of Total High Schools Surveyed
% of Surveyed Schools that Responded
% of Survey Respondents
Using ILPs
Alabama 266 48 11 71
Alaska • 48 79 11 75
Arizona • 364 79 13 78
Arkansas 271 79 8 44
California 1,223 48 14 72
Colorado • 272 79 14 83
Connecticut • 163 79 18 87
Delaware • 27 78 14 0
District of Columbia • 26 81 29 83
Florida 463 48 9 26
Georgia • 396 48 14 62
Hawaii • 39 79 19 17
Idaho • 110 79 25 59
Illinois 644 48 18 25
Indiana • 348 79 13 60
Iowa • 301 79 18 79
Kansas 290 48 30 66
Kentucky • 214 79 27 100
Louisiana • 188 79 14 90
Maine 107 48 24 8
Maryland • 185 79 17 40
Massachusetts 279 79 16 19
Michigan • 582 79 16 72
Minnesota • 392 79 26 57

12 13
State Name Mandated ILP State
Total Number of High Schools
% of Total High Schools Surveyed
% of Surveyed Schools that Responded
% of Survey Respondents
Using ILPs
Mississippi 201 48 7 43
Missouri • 478 79 16 75
Montana 116 47 16 33
Nebraska 257 48 21 69
Nevada • 94 79 15 82
New Hampshire 83 49 20 25
New Jersey • 344 79 11 17
New Mexico • 146 79 13 47
New York 915 48 11 34
North Carolina 466 48 16 43
North Dakota 136 48 20 69
Ohio 769 48 14 8
Oklahoma 427 48 15 10
Oregon • 221 79 15 58
Pennsylvania 595 48 22 6
Rhode Island • 45 78 46 88
South Carolina • 201 79 20 87
South Dakota • 133 79 17 89
Tennessee • 300 79 11 44
Texas 1,176 79 10 79
Utah 130 48 16 80
Vermont • 45 76 35 50
Virginia • 306 79 17 64
Washington • 315 79 19 50
West Virginia • 101 79 18 93
Wisconsin • 413 79 22 66
Wyoming 56 48 33 44
State Unknown -- -- -- 34
Total 30 15,667 63.8 16.3 56.3
--Not applicable.
Source: The list of all U.S. high schools was acquired from the U.S. Department of Education’s Common Core of Data (CCD), 2012-13. Only high schools classified as “regular” were included.
Note: Schools in states that were determined to have an ILP mandate during the scan of state policies were oversampled to ensure adequate response from schools that use ILPs.
Note: School location was known for only 1,573 of the total 1,626 survey respondents. Among the 915 survey respondents who reported using an ILP, state location was known for 857.
Table 5 profiles the survey respondents by ILP use, school enrollment, Title I status, locale, free and reduced-price lunch rate, and school type. According to the survey, 56 percent of respondents reported working in schools that used ILPs.
Table 5. School Characteristics of Survey Respondents
School Characteristics, 2012-2013 Percentage of Survey Respondents
ILPs Used
Yes 56
No 39
Not sure 2
Missing 2
School Enrollment
0-50 0
50-249 19
250-499 22
500-749 12
750-999 9
Over 1000 36
Missing 3
Title I School
Yes 52
No 44
Missing 3
Locale
City 16
Suburb 26
Town 18
Rural 37
Missing 3
Free/Reduced-Price Lunch
0% 1
1-24% 22
25-49% 42
50-74% 23
75% and above 8
Missing 4
School Type
Traditional public school 81
Charter school 4
Missing 16
Note: School characteristics were merged with survey responses using the U.S. Department of Education’s Common Core of Data (CCD), 2012-13. Note: n = 1,626
Table 4 cont’d.

14 15
Table 6 shows the job characteristics of the respondents. More than half (60 percent) identified as either a school or a college counselor, and an additional one-third (33 percent) identified as the director or head of a school’s counseling department.
Table 6. Job Title of Survey Respondents
Job Title Percentage of Survey Respondents
School Counselor 57
Director or Head of Counseling Department 33
College Counselor 3
Principal; Vice/Assistant Principal; Head of School 2
Other 3
Missing 3
Source: High School ILP Survey. Note: n = 1,626
Among those survey respondent schools that use an ILP, the vast majority had student caseloads of 500 or fewer, with more than 40 percent reporting a student-to-counselor ratio of 250 or lower. Data limitations did not allow for a comparison of ratios at schools not using ILPs. However, the distribution shown in Figure 1 at least suggests that survey respondents at “ILP schools” benefited from smaller caseloads than the national public school average of 482 students per counselor.4
Figure 1. Distribution of Counselor Caseloads at Survey Respondent “ILP Schools”
50.9%251–500 students 41.3%
250 or fewer students
7.7%>500 students
Source: High School ILP Survey Note: n=854
4 Common Core of Data. Elementary/Secondary information System (ELSi) tableGenerator. (2012-13). U.S. Department of Education. Washington, DC: National Center for Education Statistics.
Characteristics of Schools That Use ILPs Compared with Schools That Do Not Use ILPsFigures 2 - 5 show how schools that use ILPs compare to those that do not use ILPs on various school characteristics, as well as the state mandate status, as determined by the scan of state policies.
Enrollment size, school locale, and school type As shown in Figure 2, small schools (those with a total enrollment of fewer than 250 students) were significantly more likely to use ILPs in comparison with schools enrolling 500 or more students.5
Figure 2. Percentage of Schools Using an ILP, by School Enrollment Size
50–249 250–499 500–749 750–999 >1000
6259
5452
55
School Enrollment Size
Perc
enta
ge o
f Sch
ools
Usi
ng a
n IL
P
Sources: High School ILP Survey; U.S. Department of Education’s Common Core of Data (CCD), 2012-13. Note: n=1,573
Use of ILPs did not vary greatly based on school locale. Half (50 percent) of schools located in suburban areas used ILPs compared to just under 60 percent of schools in each of the other locales (city, town, and rural) (n = 1,573). Interestingly, charter schools were significantly more likely than traditional public schools to use ILPs. Seventy-three percent of charter schools reported using ILPs compared with 54 percent of traditional public schools (n = 1,374). Many charter schools have
5 All significance testing in the report is at the p < .05 level.

16 17
a college preparatory or career-oriented mission, which may explain the higher percentage of charter school respondents reporting use of ILPs.
Indicators of student and school financial resources The percentage of students who qualify for free or reduced-price lunch was used as a proxy for the general socioeconomic status of a school’s student body. Survey results indicated that schools with the lowest proportions of FRPL-eligible students (fewer than 25 percent) were less likely to use ILPs, as compared to those with more low-income students (Figure 3).
Figure 3. Percentage of Schools Using an ILP, by Student Eligibility for Free or Reduced-Price Lunch
0 – 24 25 – 49Percentage of Students Eligible for Free or Reduced-Price Lunch
Perc
enta
ge o
f Sch
ools
Usi
ng a
n IL
P
50 – 74 75 +
5458 59 59
Sources: High School ILP Survey; U.S. Department of Education’s Common Core of Data (CCD), 2012-13. Note: n=1,562
ILP usage also varied by per student funding levels. As shown in Figure 4, higher-funded schools ($11,000 per student or more) were significantly less likely to use ILPs than those with funding between $8,000 and $11,000 per student. No difference was found between the lowest funding level (less than $8,000 per student) and other groups. A school’s Title I status was not found to relate to ILP use. Fifty-eight percent of Title I schools and 56 percent of non-Title I schools used ILPs (n = 1,571).
Figure 4. Percentage of Schools Using an ILP, by School Funding Level
Less than $8,000 $8,000–$11,000 $11,001–$14,000 More than $14,000
School Funding Level per Student
Perc
enta
ge o
f Sch
ools
Usi
ng a
n IL
P
56
70
40
45
Sources: High School ILP Survey; U.S. Department of Education’s Common Core of Data (CCD), 2012–13. Note: n=1,517
State ILP mandate status Table 7 compares results of the state policy scan with survey responses on ILP use. Interestingly, 29 percent of survey respondents located in states that had been identified as mandating ILPs reported that they did not, in fact, use ILPs. Administrators and other leaders at these schools may have been unaware of the state mandates, or they may have lacked the resources to comply. Conversely, many survey respondents from states without ILP mandates (44 percent) reported using ILPs in their schools. This finding is consistent with information revealed during the state policy scan. Although only 30 states have mandated ILPs, all states have some type of college and career readiness initiative. Some of these initiatives are designed and managed at a more local level, and some schools may implement ILPs independently, recognizing the potential benefit to students.

18 19
Table 7. ILP Mandate Status According to Survey Respondents, Compared to State Policy Scan
Respondent Characteristics
ILP Status
Used Not Used Missing/Not Sure
State mandated (state scan)
Yes 67 29 3
No 44 53 3
State mandated (survey response)
Yes 96 0 4
No 93 2 6
Not sure 96 1 4
Sources: Scan of state policies conducted by 2015 report authors; High School ILP Survey.
ILP Features
Figures 5 and 6 profile schools that use ILPs by ILP timespan and grades in which ILPs are initiated. More than half of schools (54 percent) had used ILPs for more than five years, with 31 percent having used ILPs for more than 10 years (Figure 5).
Figure 5. Number of Years Survey Respondent Schools Have Used ILPs
1 – 2 years
Number of Years Using ILP
Perc
enta
ge o
f Sur
vey
Resp
onde
nts
3 – 5 years 6 – 10 years More than10 years
Not sure
14
19
23
31
13
Source: High School ILP Survey Note: n=905
Respondents were most likely to report initiating ILP use in the 8th grade (38 percent), followed by 9th grade (27 percent). Only two percent of respondents indicated that ILP use started in grades 10 through 12 (Figure 6).
Figure 6. Grades ILPs Were Initiated
Before 6thgrade
6thgrade
7thgrade
8thgrade
9thgrade
10th–12thgrade
Notsure
Grade When ILP is Initiated
Perc
enta
ge o
f Sur
vey
Resp
onde
nts
5
13 12
38
27
24
Sources: High School ILP Survey. Note: n=904
The large majority (81 percent) of respondents reported that their state-level ILPs were mandated for all students, and another 5 percent indicated that most students were encouraged to participate. Few schools reported that ILPs were used only for particular groups, such as students with disabilities or English language learners (3 percent), academically at-risk students (2 percent), or select grade levels (2 percent).
Table 8 displays the elements that respondents reported were included in their schools’ ILPs. The most commonly reported element was “progress toward high school graduation” (88 percent), followed by “completion of high school course plan of study” (81 percent), “career interest identified” (77 percent), and “participation in dual enrollment courses” (65 percent). Survey results were consistent with the state policy scan, which found academic plans to be the most common component.

20 21
Table 9. Types of ILP Training Provided for Survey Respondents Using ILPs
Types of ILP Training Percentage of Schools
No training 44
Implementing ILPs 33
Communicating with students about their ILPs 28
Designing/developing ILPs 24
Communicating with families about ILPs 22
Best practices in using ILPs 19
Communicating with teachers about ILPs 13
Evaluating ILP implementation 7
Other 7
Workshops/trainings 1
Training by other school personnel 1
State training 1
District training 1
Other miscellaneous type of training 1
Not sure 1
None 1
Missing 0
Source: High School ILP Survey.
Based on the particular characteristics of ILPs and other college/career readiness initiatives across different states, potential stakeholders—school counselors, other school staff, district-level personnel, and state-level leaders—are likely to be involved to varying degrees with ILP design, implementation, and evaluation. Survey results indicated that school counselors were more often involved with ILPs compared to other stakeholders (Table 10). Counselors were most likely to be involved with ILP implementation (79 percent), followed by ILP design/development (62 percent), and ILP evaluation (50 percent). Similarly, other school-level personnel also were more involved in the implementation stage (39 percent) than in the design/development and evaluation stages (32 and 21, respectively.) In contrast, state- and district-level personnel were each most likely to be involved in the design/development stage (34 percent and 26 percent, respectively).
Table 8. Elements Included in ILPs Used by Survey Respondents
ILP Element Percentage of Schools
Progress toward high school graduation (e.g., high school courses taken) 88
Completion of high school course plan of study 81
Career interest identified 77
Participation in dual enrollment (college) courses 65
Self-assessment of interests, strengths, aptitudes, etc. 48
Completion of pre-college entrance examinations (ACT’s PLAN, EXPLORE, etc.) 44
Student resume completed 43
Completion of college entrance examinations (ACT, SAT) 41
Extracurricular non-athletics 37
Volunteerism 34
Extracurricular athletics 30
Awards 29
Work experience (e.g. apprenticeship, internship, job shadowing) 29
FAFSA completion 23
College application submission 20
Postsecondary financial plan 20
Participation in personal financial literacy courses/workshops/activities 18
Other financial aid application completion (e.g., scholarship and grant applications) 16
Other 10
Postsecondary plans 3
Academic supports and interventions 1
Goal setting 1
Other miscellaneous elements 1
Test support 1
Missing 3
Source: High School ILP Survey.
ILP Implementation
Tables 9-12 provide details about how ILPs are implemented, including training of school personnel, involvement of various stakeholders, and communication among school personnel and with students and families. As Table 9 displays, respondents were most likely to report having received no ILP training (44 percent). Approximately one-third (33 percent) reported having received training related to ILP implementation.

22 23
Table 10. Stakeholders Involved in ILP Design, Implementation, and Evaluation
Percentage of Schools Reporting Involvement of Each Stakeholder
ILP design/development
Counselor 62
School 32
District 26
State 34
Not sure 5
ILP implementation
Counselor 79
School 39
District 18
State 9
Not Sure 3
ILP evaluation
Counselor 50
School 21
District 14
State 11
Not sure 30
Source: High School ILP Survey.
Survey respondents also provided more detail about the level of involvement of school-based personnel (including, counselors) in ILP design, implementation, and evaluation. More than one-third (35 percent) of survey respondents reported that school-based personnel were highly involved in ILP implementation, compared to only 19 percent for ILP design and 14 percent for ILP evaluation (Table 11). The combined survey results presented in Tables 10 and 11 clearly indicate that ILP implementation is the area in which counselors have played the largest role.
Table 11. Level of Involvement of School-Based Personnel in ILP Design, Implementation, and Evaluation
Percentage of Schools
ILP design/development
Highly involved 19
Somewhat involved 37
Not involved 41
Missing 3
ILP implementation
Highly involved 35
Somewhat involved 42
Not involved 21
Missing 2
ILP evaluation
Highly involved 14
Somewhat involved 31
Not involved 53
Missing 3
Source: High School ILP Survey.
When asked about the frequency of meetings related to ILPs between school personnel and administration, the most common response of survey respondents was never (32 percent) or not sure (26 percent) (Table 12). Seventeen percent of respondents reported a meeting frequency of once each academic year, and another 16 percent met once each term. Very few survey respondents (7 percent) reported meeting more often than once per term.
Table 12. How Frequently School Personnel and Administration Meet about ILPs
Percentage of Survey Respondents
Once a month or more 3
Several times each term 4
Once each term 16
Once each academic year 17
Never 32
Not sure 26
Missing 3
Source: High School ILP Survey.

24 25
Figure 7 and Table 13 display the frequency of ILP meetings, by grade level, between school personnel and students and families, respectively. The vast majority of survey respondents (approximately 90 percent) reported that students at their schools meet with personnel to review ILPs at least once per academic year beginning in 9th grade. However, yearly ILP meetings with families occurred at less than two-thirds of schools (between 60 percent and 65 percent, depending on grade level) (Figure 7).
Figure 7. Percentage of Survey Respondents Who Reported that Students or Families Meet with School Personnel at
Least Once per Academic Year
Additional detail about meeting frequency by grade level for students and families can be found in Table 13. While survey respondents indicated that students across all grade levels meet with school personnel at least once per academic year, students in 12th grade were significantly more likely than those in grades 9 and 10 to meet several times per term (25 percent of schools versus 14 percent). Looking at the timeframe of “at least once each term,” shows that 9th and 10th graders meet that frequently at 43 percent of schools, 11th graders at 48 percent of schools, and 12th graders at 54 percent of schools.
Table 13. Meeting Frequency between School Personnel and Students and Families, by Grade Level
Percentage of Schools Reporting Each Level of Meeting Frequency
Once a month or
more
Several times each
term
Once each term
Once each academic
year
Never Not sure/Not Applicable/
Missing
Students
Before 9th grade2 8 9
393
38
9th grade5 14 24
491
8
10th grade5 14 24
482
8
11th grade5 19 24
432
8
12th grade8 25 21
363
9
Families
Before 9th grade1 1 3
3712
25
9th grade1 2 8
4921
12
10th grade1 3 8
4921
11
11th grade1 5 8
5218
10
12th grade1 7 9
4519
10
Source: High School ILP Survey. Note: n = 915
ILP Tracking and Evaluation
The survey also collected information about state-mandated ILP tracking. Table 14 shows that more than one-third (36 percent) of schools had reported mandated tracking at the time of the survey. However, a similar proportion of survey respondents (31 percent) were not sure if ILP tracking was mandated. Nearly one-quarter of survey respondent schools indicated that all ILP tracking was done on paper. Thirty percent reported tracking using computer software or an online system, and another 37 percent used a combination of paper and computer-based solutions. The majority of respondents (74 percent) only tracked ILPs through the point of high school graduation.
Few respondents (12 percent) indicated working in a state that formally evaluates ILP policies, while the majority (78 percent) were unsure if their state conducted ILP evaluations (Table 14). This finding is consistent with other survey results indicating
Before 9thgrade
9thgrade
10thgrade
11thgrade
12thgrade
Grade Level When Meetings Occur
■ Students | ■ Families
Perc
enta
ge o
f Sch
ools
58
42
91
60
91 91 89
6165 63
Source: High School ILP Survey. Note: n = 915

26 27
the relative lack of involvement of counselors with ILP evaluation, as compared to design and implementation (see Tables 10 and 11).
Table 14. ILP Tracking and Evaluation
Percentage of Schools
ILP tracking mandated by state
Yes 36
No 32
Not sure 31
Missing 1
ILP tracking method
Combination of paper and computer software/online system 37
Computer software/online system 30
On paper 24
Not tracked 8
Missing 1
ILP tracking duration
Ends upon high school graduation 74
1-3 years after graduation 9
4-6 years after graduation 2
Other 1
Depends on individual student 1
A few months after graduation 1
Indefinite tracking length 1
Not sure 10
Missing 3
Frequency of state-level ILP evaluations
2-5 Years 4
Annually 8
Never 8
Other 1
Often 1
Not Sure 78
Missing 3
Source: High School ILP Survey.
Chapter 3. ILP Effectiveness: Connecting ILPs to Student Outcomes —
Respondents who used ILPs were asked to provide student outcomes directly following high school graduation, including the percentage of students accepted into college, enrolling in college, and entering the workforce. On average, 57 percent of graduates at survey respondent schools were accepted into college, and just under half (48 percent) enrolled in college. Twelve percent entered directly into the workforce. No correlations were found between these outcomes and specific ILP elements as reported on the survey.6 Because similar information about student outcomes was not available for survey respondents who did not use ILPs, it was not possible to make a comparison of ILP and non-ILP schools. However, further research should compare graduate outcomes of schools that use ILPs with those that do not to provide a greater understanding of the relationship between ILP usage and graduate outcomes (see Chapter 4, Policy Recommendations). According to the U.S. Department of Education’s National Center for Education Statistics, 65 percent of students in 2013 enrolled in college the fall immediately following high school graduation.7
6 Correlation coefficients were equal to, or below .1
7 NCES. “Fast Facts: College and University Education.” 2015. http://nces.ed.gov/fastfacts/display.asp?id=372

28 29
Figure 8. Survey Respondents’ Experience-Based Views of the Contribution of ILPs to Students’ College and/or Career
Success
24%Notsure
12%Does notimprove
46%Somewhatimproves
15%Greatly
Improves
3%Missing
Source: High School ILP Survey.
Respondents were also asked to report their perceptions of the contribution of ILPs to students’ college and career success. As displayed in Figure 8, the majority (62 percent) felt that ILPs somewhat or greatly contributed to successful student outcomes. Nearly one-quarter (24 percent) were not sure whether or not ILPs were related to student success, and 12 percent felt that ILPs did not have any effect on successful student outcomes.
Finally, respondents were asked to report any effective ILP practices and potential areas for improvement. Nearly half (45 percent) did not identify any effective ILP practices (Table 15). Of the other 45 percent who did report effective ILP elements, just over half (51 percent) provided specific examples. These open-ended responses were coded into categories, the most common being career and college guidance (20 percent); followed by consistent and constant review of ILPs by students, staff, and parents (9 percent); and graduation course plan and requirements (5 percent).
Table 15. Survey Respondents’ Experience-Based Views Related to Effective ILP Practices
Effective ILP Practices Percentage of Survey Respondents
Thinking about how ILPs are used at your school, are there any ILP practices that you believe are particularly effective at improving students’ college and/or career success?
Yes 45
Career and college guidance 20
Consistent and constant review of ILP by students, staff, and parents 9
Individual student meetings, often with parents 5
Graduation course plan and requirements 5
Develop ILPs early 1
Other 2
Missing 3
No 45
Missing 10
Source: High School ILP Survey.
Just over half (54 percent) of survey respondents reported areas of potential improvement (Table 16), including more time with students or smaller student-to-counselor ratios (14 percent), greater access to technology (10 percent), and more buy-in from students, parents, and/or staff (8 percent).
Table 16. Survey Respondents’ Experience-Based Views Related to ILP Improvement
Percentage of Survey Respondents
Is there anything that would make the use of ILPs at your school more effective?
Yes 54
More time with students/smaller student- to- counselor ratio 14
More access to technology 10
More student, parent, and or/staff buy-in 8
More staff, resources, training, and funding 5
More use in the classroom and by teachers 3
Broader range of ILP elements/more student-driven ILP 3
Better guidance from school, state, and or/district 2
More data, tracking, and evaluation 2
Other miscellaneous areas of improvement 4
Not sure 1
Missing 2
No 34
Missing 11
Source: High School ILP Survey.

30 31
Chapter 4. Recommendations for Policy and Practice —
The results of the state policy scan and national school survey suggest that ILPs are regularly used across states. The survey respondents, most of whom were school counselors, seemed to view ILPs favorably and felt they contributed to students’ successful outcomes, and the majority had been using ILPs for more than five years. However, the survey responses also indicated that ILP implementation and evaluation could be improved. Below are five areas that policymakers and state education officials should consider when designing, implementing, and evaluating ILP programs and policies.
Improved Communication and Consistency
One interesting finding is a discrepancy in the awareness of ILP mandates between state-level education officials and school counselors who work directly with ILPs. The state policy scan, which relied on communication with state-level contacts, state website reviews, and a federal database of state policy mandates, revealed that 29 states and the District of Columbia, or 66 percent of survey respondents’ schools, mandated ILP usage. However, 96 percent of respondents reported that their states mandated ILPs. This finding points to a need for greater awareness and communication related to ILPs at the state level, specifically between states, districts, schools, and school personnel.
The state policy scan also revealed that states have widely varied names for ILPs, which could create confusion about whether or not a state ILP mandate exists. Perhaps more consistent naming and messaging of plans across states would facilitate greater knowledge and familiarity with ILPs. Individualized Education Plans (IEPs), which serve students with disabilities, seem to be consistently named and more widely known across states, which may reflect a more established and ingrained state-level policy to which ILP policy can aspire.
The lack of information about ILPs on state education websites also points to a need for greater public awareness of ILPs, particularly among families of students in the college and career pipeline. States should not only create greater consistency

32 33
in their messaging to districts and schools, but also improve messaging to promote greater awareness among the public. If parents are aware of ILPs, they may be more invested in their students’ plans and help facilitate greater engagement with ILP follow-up and completion.
Need for Greater Investment and Engagement
Survey respondents indicated that there was limited involvement in ILP implementation, development, and evaluation among state and district-level stakeholders, as well as among some school administrators and personnel (other than counselors). Greater engagement on the part of leadership would help set ILPs as a priority and perhaps would generate a more concerted effort to track and improve ILP elements.
Need for Uniform Tracking and Evaluation
While some states seemed to conduct regular ILP evaluations, it was unclear whether any consistent indicators of usage, progress, and outcomes exist. State and district-level leadership can help increase the effectiveness of ILPs by creating clear, consistent guidelines to be shared at state and national levels. This would facilitate further efforts to track ILP usage and assess their effects on related outcomes.
Due to limitations of this survey, student outcomes could not be compared by ILP usage, but an effort should be made to do so on a larger scale. This would help determine the extent to which ILPs may or may not have an effect on successful student outcomes such as graduation, college application, and college enrollment.
In addition to tracking usage and outcomes, robust qualitative data could provide additional insight into ILP usage and effectiveness. It would be useful to gain greater insight into counselors’ experiences with ILP training and implementation, what they have learned, how they feel ILPs help, any challenges they have experienced, and the level of awareness of ILPs on the part of other school personnel and administrators. Focus groups and interviews with counselors using ILPs – particularly with those who have been using ILPs for more than 10 years (31 percent of respondents) – as well as with students who participated in the ILP process, could provide useful information to help guide the future use and development of ILPs.
Need for Greater Training
The survey results indicated that most schools did not have any extensive training in place for ILPs. While nearly one-third of respondents indicated having received training for ILP implementation, it was not clear whether any training existed to ensure that ILPs continued to be used and tracked in the most effective and consistent manner. Training should be developed for all phases of ILP usage, from development to delivery and evaluation.
Prior NACAC research has shown that lack of access to professional development opportunities related to college counseling is a persistent problem for secondary school counselors, particularly for those who work at public schools. Results of NACAC’s 2013 Counseling Trends Survey indicated that only 40 percent of respondent high schools required professional development in college counseling, and only 57 percent of those with this requirement paid all costs associated with the professional development. Private high school survey respondents were much more likely than public schools to require professional development of counselors (54 percent and 34 percent, respectively), and they were more likely to cover all associated costs (69 percent and 31 percent, respectively).8 The general nature of these findings has been consistent over many years of the annual survey administration.
Implications for Reduced Student/Counselor Ratio
Survey participants pointed to the need for more one-on-one time between counselors and students and their families. For ILPs to be effective, they likely require a commitment to meet regularly with students on an individual basis, track their progress, and regularly re-evaluate goals and plans. Additional capacity may need to be built into schools to carry this through on a large scale.
While counselors generally report positive perceptions of their ILP programs, it seems a greater level of investment and engagement could be achieved from additional stakeholders and personnel at the state, district, and school levels. More consistent messaging, increased awareness, greater coordination, improved tracking and training, and increased resources toward counseling personnel are all ways to help maximize the effectiveness of ILPs, both in policy and practice. As a start, greater insight should be gained into ILP experiences and impact before further expansion or changes are made.
8 State of College Admission. (2014). National Association for College Admission Counseling: Arlington, VA.

34 35
References
Bloom, Todd and Emily Kissane. “Individual Learning Plans: Improving Student Performance.” Hobsons. April 2011.
Connolly, Faith. “Results of State Survey on Individual Learning Plans.” Naviance. 2009.
John J. Heldrich Center for Workforce Development. “New Jersey Department of Education Personalized Student Learning Plan Pilot Program, 2011-2012 Evaluation Report.” October 2012. Available from: http://www.state.nj.us/education/cte/pslp/EvaluationReportY3.pdf (accessed 9/28/2015).
NCES. “Fast Facts: College and University Education.” 2015. Available from: http://nces.ed.gov/fastfacts/display.asp?id=372 (accessed 9/28/2015).

36 37
Appendix A: Methodology
State Inventory
A scan of state websites was conducted between October and November 2014 to update prior research examining states’ policies on Individual Learning Plans (ILPs) and to extend the literature by determining to what extent ILPs are assessed at the state level and the types of outcomes measured (i.e., high school completion, college entry, workforce transition). To ensure the state scan was as consistent as possible with previous studies, the proposed methodology took into account the processes and procedures articulated in Naviance’s 2009 Results of State Survey on Individual Learning Plans and Hobson’s 2011 Individual Learning Plans: Improving Student Performance. An additional scan of state websites was conducted in August 2015 to account for any changes in states’ ILP policies.
Each state’s education department website was reviewed to compare and update the information provided in the 2009 and 2011 studies (Table B1 and Table B2). State plans, regulatory documents, and other information available on state websites were mined to extract the desired information. Supplemental literature from educational organizations, foundations, government agencies, and peer-reviewed journals published after 2012 were consulted to confirm findings.
Materials and resources collected as part of the state scan were reviewed in light of a standardized data collection tool to ensure that comparable data was collected. The characteristics of each ILP were compared to the domains specified in the data collection tools, which were consistent with those listed in previous studies.
While the materials available on the state department of education websites provided the majority of the information in the final tables, additional information was also gathered directly from state counseling offices to verify the data collected. All 50 states and the District of Columbia were contacted via email and asked the following questions:
• How do students develop a plan with the {name of ILP in the state}? For example, do students develop the plan online or do students create the plan
with academic counselors?• What are the typical components of a plan?• How many times are plans reviewed?• Has there been any research on the effectiveness of the {name of ILP in the
state}? If yes, what has the research found?
Twenty-three states responded, and their feedback was integrated into the findings reported in Chapter 1 of this report.

38 39
Appendix B: State ILPs
Table B1. State Status on Developing, Implementing, and Assessing Individual Learning PlansState Website(s) State Mandate Type of Plan or
ActivityAgencies Involved Delivery Assessment
InformationAssessment Findings Number of
Times ILP is Reviewed
Alabama www.alcareerinfo.org No Online planning tools and resources
Alabama Career Information Network; funding from College
Access Challenge Grant; Alabama Department of Education
Online sample education plans No assessment information. Annually, at minimum
Alaska http://www.livebinders.com/play/play?id=1193391
Yes Personal Learning and Career Plan
Alaska Department of Education and Early Development; Alaska Department of Labor and Workforce Development; University of Alaska
Electronically and/or paper document
No assessment information
No assessment information Annually, at minimum
Arizona http://www.azed.gov/ecap/ Yes Education and Career Action Plan
Arizona Department of Education Paper document and/or online portfolio
No assessment information
No assessment information Annually, at minimum
Arkansas http://arkansasworks.kuder.com/ No College and Career Planning Center
Department of Career Education; Department of Education, Department of Higher Education, Department of Workforce Services, and Economic Development Commission; Arkansas Science and Technology Authority; Arkansas Association of Two-Year Colleges, State Chamber of Commerce
Online No assessment information
No assessment information Annually, at minimum
California http://www.connectedcalifornia.org/linked_learning
No Linked Learning: students follow industry-themed pathways that integrate academics, technical courses, and work-based learning
ConnectEd: The California Center for College and Career Linked Learning Alliance, a statewide group of more than 140 education, industry, and community organizations and individuals
Online http://www.sri.com/work/projects/evaluation-california-linked-learning-district-initiative
Results found that students enrolled in certified pathways across the districts 1) earned an average of 6.6 more credits in the 10th grade than similar peers in a more traditional high school program and 2) were 8.9 percentage points more likely to be on track at the end of 10th grade to complete the a-g requirements than similar peers in a more traditional high school program.
Annually, at minimum
Colorado http://www.cde.state.co.us/postsecondary/icap
Yes Individual Career and Academic Plan
Colorado Department of Education; Colorado Council of High School and College Relations; Colorado Department of Higher Education; Colorado Community College System; Colorado High School Graduation Initiative
Paper document http://www.cde.state.co.us/postsecondary/icapitemsmatrix
Has a document detailing milestones for ICAP progress Annually, at minimum

40 41
State Website(s) State Mandate Type of Plan or Activity
Agencies Involved Delivery Assessment Information
Assessment Findings Number of Times ILP is Reviewed
Connecticut http://www.sde.ct.gov/sde/cwp/view.asp?a=2702&Q=334064
Yes Student Success Plan
Connecticut Department of Education Electronic student portfolios
No assessment information
No assessment information Recommended at least twice a year
Delaware http://www.doe.k12.de.us/Page/2140 Yes Student Success Plan
Delaware Department of Education Online Education Success Planning and Evaluation System (ESPES)
Just beginning to collect data
Just beginning to collect data Four times a year, at minimum
District of Columbia
https://access.bridges.com/auth/login.do?sponsor=37
Yes Individual Graduation Portfolio
District of Columbia Public Schools Online portfolio Surveys and analyses have been done
Data has shown that using the IGP has reduced repeater courses being taken and also has empowered the students to take ownership of their grades.
About two to three times a year
Florida https://www.floridashines.org/ partners/mycareershines-implementation
https://www.floridashines.org/documents/ 111597/112763/05.15.15+Memo+from+the+ Florida+Department+of+Education.pdf /12c677d2-3d91-477e-8dbc-7c2d5fd7e7e4
No College and Career Planner
State University System of Florida; Florida College System; Florida Department of Education
Paper document; online portfolio
No assessment information
No assessment information Annually, at minimum
Georgia https://www.gacollege411.org/Home/_default.aspx
Yes Peach State Pathways: Education and Career Planning Tool
Education Pathways Georgia Department of Education
Electronically and/or paper document
No assessment information No assessment information. Annually, at minimum
Hawaii http://www.hawaiipublicschools.org/TeachingAndLearning/StudentLearning/GraduationRequirements/Pages/home.aspx
Yes Personal Transition Plan
Hawaii Department of Education Online portfolio No assessment information
No assessment information Annually, at minimum
Idaho http://www.pte.idaho.gov/Career_Guidance/Program_of_Study_curriculum/Programs_of_Study.html
Yes Individual Graduation Plans
Professional-Technical Education Electronically and/or paper document
No assessment information
No assessment information Annually, at minimum
Illinois https://secure.whatsnextillinois.org/ No College and Career Exploration and Planning
Illinois Student Assistance Commission Online No assessment information
No assessment information Annually, at minimum
Table B1 cont’d.

42 43
State Website(s) State Mandate Type of Plan or Activity
Agencies Involved Delivery Assessment Information
Assessment Findings Number of Times ILP is Reviewed
Indiana http://www.in.gov/learnmoreindiana/2587.htm
Yes High School Graduation Plan
Indiana Commission for Higher Education; Indiana Department of Education
Online tracker and/or paper document
Learn More Indiana Survey
In 2005, when the Grad Plan legislation was adopted, the high school graduation rate was about 73%. This past year it was 86%.
Annually, at minimum
Iowa https://secure.ihaveaplaniowa.gov/default.aspx
Yes I Have A Plan Iowa Department of Education; Iowa College Student Aid Commission; Iowa Workforce Development; College Saving Iowa 529 Plan
Online portfolio No assessment information
No assessment information Annually, at minimum
Kansas http://www.ksde.org/Agency/DivisionofLearningServices/CareerStandardsandAssessmentServices/CSASHome/IndividualPlansofStudy(IPS)-Student.aspx
No Individual Plan of Study
Kansas State Department of Education Paper document No assessment information
No assessment information Twice annually
Kentucky http://education.ky.gov/educational/ccadv/ilp/Pages/default.aspx
Yes Individual Learning Plan
Kentucky Department of Education Online tracker ILP usage statistics; http://education.ky.gov/educational/CCadv/ilp/Pages/ilpUsage.aspx
ILP usage statistics provide information on percentage of completions as well as frequency of use of the tool
Annually, at minimum
Louisiana http://www.louisianabelieves.com/resources/classroom-support-toolbox/counselor-support-toolbox/individual-student-planning
Yes Individual Graduation Plan
Louisiana Department of Education Paper document No assessment information
No assessment information Annually, at minimum
Maine http://www.maine.gov/doe/plan/ No Personal Learning Plan under development
Maine Department of Education Under development
No assessment information
No assessment information Annually, at minimum
Maryland http://www.marylandpublicschools.org/msde/divisions/careertech/career_technology/cd.htm
Yes Maryland Career Development Framework
Maryland State Department of Education Paper document No assessment information
No assessment information Annually, at minimum
Massachusetts https://www.yourplanforthefuture.org/Ext/YPFC/Home/index.html
No Your Plan for the Future
Massachusetts Educational Financing Authority; Massachusetts Department of Elementary and Secondary Education; Massachusetts Department of Higher Education
Online tracker No assessment information
No assessment information Unknown
Table B1 cont’d.

44 45
State Website(s) State Mandate Type of Plan or Activity
Agencies Involved Delivery Assessment Information
Assessment Findings Number of Times ILP is Reviewed
Michigan http://www.michigan.gov/documents/mde/MDE_EDP_10-2-09_296459_7.pdf
Yes Educational Development Plan
Michigan Department of Education Paper document No assessment information
No assessment information Annually, at minimum
Minnesota http://education.state.mn.us/MDE/StuSuc/CollReadi/index.html
Yes Personal Learning Plan
Minnesota Department of Education Online and/or paper document
No assessment information
No assessment information Annually, at minimum
Mississippi https://www.rcu.msstate.edu/MDE/PathwaystoSuccess.aspx
No Pathways to Success Mississippi Department of Education; Mississippi State University
Paper document No assessment information
No assessment information Annually, at minimum
Missouri http://dese.mo.gov/college-career-readiness/guidance-counseling/personal-plans-study
Yes Personal Plan of Study
Missouri Department of Elementary and Secondary Education
Online tracker and/or paper document
No assessment information
No assessment information Annually, at minimum
Montana http://www.mus.edu/BigSkyPathways/ No Big Skys Pathways (career pathways)
Montana Association for Career and Technical Education; Montana University System; Montana Office of the Commissioner of Higher Education; Montana Office of Public Instruction
Paper document No assessment information
No assessment information Annually
Nebraska http://www.education.ne.gov/CARED/PDFs/PLPBooklet.pdf
No Personal Learning Plan
Nebraska Department of Education Paper document http://www.education.ne.gov/CARED/PDFs/PLPBooklet.pdf
Includes information about usage and effectiveness Annually, at minimum
Nevada http://cteae.nv.gov/Career_Guidance/ Yes Academic Plan Nevada Department of Education Unknown No assessment information
No assessment information Annually, at minimum
New Hampshire http://www.education.nh.gov/career/guidance/nh_comp_guid.htm
No Individual planning as part of the Comprehensive Developmental Guidance and Counseling Program Model
New Hampshire Department of Education Paper document No assessment information
No assessment information Unknown
New Jersey http://www.state.nj.us/education/cte/pslp/ Yes (piloted in select school districts)
Personalized Student Learning Plan
State of New Jersey Department of Education Online tracker http://www.state.nj.us/ education/cte/pslp/ Evaluation ReportY3.pdf
Rutgers completed a three year evaluation report on the PSLP pilot program.
Annually, at minimum
New Mexico http://ped.state.nm.us/ped/PEDNextStepPlan.html
Yes Next Step Plan New Mexico Public Education Department Paper document No assessment information
No assessment information Annually, at minimum
Table B1 cont’d.

46 47
State Website(s) State Mandate Type of Plan or Activity
Agencies Involved Delivery Assessment Information
Assessment Findings Number of Times ILP is Reviewed
New York http://www.p12.nysed.gov/cte/careerplan/ No Career Plans New York State Education Department; University of the State of New York; New York State Department of Labor
Online portfolio and/or paper document
No assessment information
No assessment information Annually, at minimum
North Carolina http://www.ncpublicschools.org/docs/curriculum/guidance/resources/programs-study.pdf
No Program of Study for Comprehensive School Counseling
Public Schools of North Carolina Paper document No assessment information
No assessment information Unknown
North Dakota http://www.dpi.state.nd.us/title1/resource/individual/individual.shtm
No Individual Learning Plan
North Dakota Department of Public Instruction Paper document No assessment information
No assessment information Unknown
Ohio http://education.ohio.gov/getattachment/Topics/Career-Tech/Career-Development/2012-IACP.pdf.aspx
No Individual Academic and Career Plan
Ohio Department of Education Online portfolio No assessment information
No assessment information Annually, at minimum
Oklahoma https://www.okcareertech.org/ No Career Tech Oklahoma Department of Career and Technology Education
Online and or/paper document
Evaluation by the National Association for Career and Technical Education on Career Tech
Students at schools with highly integrated rigorous academic and CTE programs have significantly higher achievement in reading, mathematics and science than do students at schools with less integrated programs.
Annually, at minimum
Oregon http://www.ode.state.or.us/teachlearn/certificates/diploma/ed-plan-and-profile.pdf
Yes Education Plan and Profile
Oregon Department of Education Paper document No assessment information
No assessment information Annually, at minimum
Pennsylvania http://www.pdesas.org/default.aspx No Standards Aligned System
Pennsylvania Department of Education Online No assessment information
No assessment information Unknown
Rhode Island http://www.ride.ri.gov/Portals/0/Uploads/Documents/Diploma-System/ILP-Framework-Final.pdf
Yes Individual Learning Plan
Rhode Island Department of Education Paper document http://ridatahub.org/
The Data Hub doesn’t have direct reports on ILPs, but has data information on student success and other measures.
Prior to the start of each semester, at minimum
South Carolina http://recs.sc.gov/Pages/welcome.aspx Yes Individual Graduation Plan
South Carolina Department of Education Electronic plan http://www.nrccte.org/sites/default/files/publication-files/nrccte_sc_personal_pathways_final_report.pdf
Longitudinal study on Personal Pathways to Success Initiative
Annually, at minimum
South Dakota http://sdmylife.com/about-us/ Yes Personal Learning Plan
South Dakota Department of Education Online portfolio and/or paper document
No assessment information
No assessment information Annually, at minimum
Tennessee http://www.planningyourdreams.org/ Yes Focused Plan of Study
Tennessee Department of Education; Tennessee Board of Regents
Online portfolio No assessment information
No assessment information Annually, at minimum
Table B1 cont’d.

48 49
State Website(s) State Mandate Type of Plan or Activity
Agencies Involved Delivery Assessment Information
Assessment Findings Number of Times ILP is Reviewed
Texas http://ritter.tea.state.tx.us/taa/stanprog102303.html
Required for junior/middle/high school students identified as at risk for not graduating
Personal Graduation Plan
Texas Education Agency Paper document No assessment information
No assessment information Unknown
Utah http://www.schools.utah.gov/cte/documents/guidance/model/UtahModel.pdf
No Student Education Plan or Student Education Occupational Plan
Utah State Office of Education Paper document No assessment information
No assessment information Annually, at minimum
Vermont http://education.vermont.gov/plp-working-group/main
Yes (in implementation phase)
Personal Learning Plans
Vermont Department of Education In implementation phase
No assessment information
No assessment information Unknown
Virginia http://www.doe.virginia.gov/instruction/graduation/academic_career_plan/index.shtml
Yes Academic and Career Plan
Virginia Department of Education Electronic and/or paper document
No assessment information
No assessment information Review before 9th and 11th grade
Washington http://www.k12.wa.us/GraduationRequirements/Requirement-HighSchoolBeyond.aspx
Yes High School and Beyond Plan
State of Washington Office of Superintendent of Public Instruction
Paper document No assessment information
No assessment information Annually, at minimum
West Virginia http://wvde.state.wv.us/counselors/links/framework/more-about-links.html
Yes Individual Student Transition Plans
West Virginia Department of Education Paper document No assessment information
No assessment information Annually, at minimum
Wisconsin http://sspw.dpi.wi.gov/sspw_counsl1 Yes Individual Learning Plan
Wisconsin Department of Public Instruction Electronic portfolio and/or paper document
No assessment information
No assessment information Annually, at minimum
Wyoming http://edu.wyoming.gov/beyond-the-classroom/college-career/planning-for-college/
No College and Career Readiness
Wyoming Department of Education Unknown No assessment information
No assessment information Unknown
Table B1 cont’d.

50 51
Table B2. Characteristics of State Individual Learning PlansState Academic Plan Academic, Career,
Personal Goals IdentifiedCareer
ExplorationResume Builder
Updated Annually
Personal Reflection
Personality and Learning Style Assessments
Strengths and Needs
Action Plan Service Learning Learning Support Reference
Alabama • • • • • • • • •
Alaska • • • • • • • • • •
Arizona • • • • • • • •
Arkansas • • • • • • •
California • • • • • •
Colorado • • • • • • •
Connecticut • • • • • • • •
Delaware • • •
District of Columbia • • • • • • • • •
Florida • • • • • •
Georgia • • • • • •
Hawaii • • • • • • • •
Idaho • • • • •
Illinois • • • • •
Indiana • • • •
Iowa • • • • • • • • •
Kansas • • • • • •
Kentucky • • • • • • •
Lousiana • • •
Maine • • • •
Missouri • • • • • •
Montana • • • •
Nebraska • • • • • •
Nevada • • •
New Hampshire • • • •
New Jersey • • • • •
New Mexico • • • •
New York • • • • • •

52 53
Table B2 cont’d.
State Academic Plan Academic, Career, Personal Goals Identified
Career Exploration
Resume Builder
Updated Annually
Personal Reflection
Personality and Learning Style Assessments
Strengths and Needs
Action Plan Service Learning Learning Support Reference
North Carolina • • •
North Dakota • •
Ohio • • • • • • • • •
Oklahoma • • • •
Oregon • • • • •
Pennsylvania •
Rhode Island • • • • • • • • •
South Carolina • • • • • • •
South Dakota • • • • • •
Tennessee • • • • • • • •
Texas • • •
Utah • • • • • • • • •
Vermont • • • • •
Virginia • • • • •
Washington • • • • • • • •
West Virginia • • • • • •
Wisconsin • • • • • • •
Note: No information was available for Wyoming.

54 55
Acknowledgements
The National Association for College Admission Counseling (NACAC) wishes to acknowledge the following key individuals and groups for their contributions to this report.
First and foremost, NACAC would like to thank Hobsons for a productive research partnership. In addition to financial support, Hobsons gave generously of staff time and expertise to build upon Hobsons’ prior work related to state ILP policies.
NACAC and Hobsons each offer special thanks to the secondary school counselors who gave of their valuable time to participate in the survey research. Without the contribution of more than 1,500 counselors across the country, the report would not have been possible.
NACAC and Hobsons also thank colleagues at Coffey Consulting, LLC for analytical support with survey development and data analysis, as well as updating the state policy scan and drafting the report. Specifically, we would like to acknowledge Amy Topper, Senior Research Associate; Abby Miller, Senior Associate; and Lauren Sheram, Research Assistant.
The following individuals from Hobsons made significant contributions to the development and promotion of the research: Mary Docken, Vice President, Association Partnerships; Amanda Mason-Singh, former Research Analyst; Patty Mason, Director of Communications; Emily Goebel, Online Community Manager; Kim Oppelt, Education and Outreach Manager; and Mark Holmes, Creative Consultant.
NACAC staff members who contributed to the development and promotion of the report include: David Hawkins, Executive Director of Educational Content and Policy; Melissa Clinedinst, Associate Director of Research; Shanda Ivory, Director of Communications; Kristen Garman, Associate Director of Communications, Publications, and Technology; Mary Stegmeir, Assistant Director for Content and Marketing; John McGrath, Deputy CEO; and Joyce Smith, CEO.

© 2015 Hobsons. All rights reserved worldwide.


