

8/7/2019 Internet Advertising Burea Wordwide Digital Marketing Spending by Industrt and Ad formats
http://slidepdf.com/reader/full/internet-advertising-burea-wordwide-digital-marketing-spending-by-industrt 1/28
IAB Internet Advertising Revenue Report An Industry Survey Conducted by PwC and Sponsored by the Interactive Advertising Bureau (IAB)
2010 Full Year Results April 2011
www.pwc.comwww.iab.net
8/7/2019 Internet Advertising Burea Wordwide Digital Marketing Spending by Industrt and Ad formats
http://slidepdf.com/reader/full/internet-advertising-burea-wordwide-digital-marketing-spending-by-industrt 2/28
2PwC
Table of Contents
Background 3
Executive summary 4
Detailed findings
• 2010 Fourth quarter and full year results
• Annual and quarterly trends
• Industry concentration
• Advertising formats
• Industry category spending
• Pricing models
5
ppendix
• Definitions
• Survey scope and methodology
• IAB board officers and directors
• Organization profiles
22
8/7/2019 Internet Advertising Burea Wordwide Digital Marketing Spending by Industrt and Ad formats
http://slidepdf.com/reader/full/internet-advertising-burea-wordwide-digital-marketing-spending-by-industrt 3/28
3PwC
Background
About the IAB Internet Advertising Revenue Report
Conducted by PricewaterhouseCoopers LLP (“PwC”) on an ongoing basis, with resultsreleased quarterly, the “IAB Internet Advertising Revenue Report” was initiated by theInteractive Advertising Bureau (IAB) in 1996. This report utilizes data and information
reported directly to PwC, publicly available online corporate data and informationprovided by online ad selling companies.
The results reported are considered the most accurate measurement of Internet/onlineadvertising revenues because the data is compiled directly from information supplied by companies selling advertising online. All-inclusive, the report includes data reflectingonline advertising revenues from Web sites, commercial online services, ad networks ande-mail providers, as well as other companies selling online advertising.
The report is conducted independently by PwC on behalf of the IAB. PwC does not auditthe information and provides no opinion or other form of assurance with respect to the
information. Only aggregate results are published and individual company information isheld in strict confidence with PwC. Further details regarding scope and methodology areprovided in the appendix to this report.
David SilvermanPwC
8/7/2019 Internet Advertising Burea Wordwide Digital Marketing Spending by Industrt and Ad formats
http://slidepdf.com/reader/full/internet-advertising-burea-wordwide-digital-marketing-spending-by-industrt 4/28
4PwC
Executive summary
IAB Internet Advertising Revenue Report2010 Full Year Highlights
Internet advertising revenues (“revenues”) in the United States totaled $26.0 billion for the full year of 2010, with Q3 2010 accounting for approximately
$6.5 billion and Q4 2010 totaling approximately $7.5 billion. Internetadvertising revenues for the full year of 2010 increased 15 percent over 2009.
Key trends underlying 2010 results
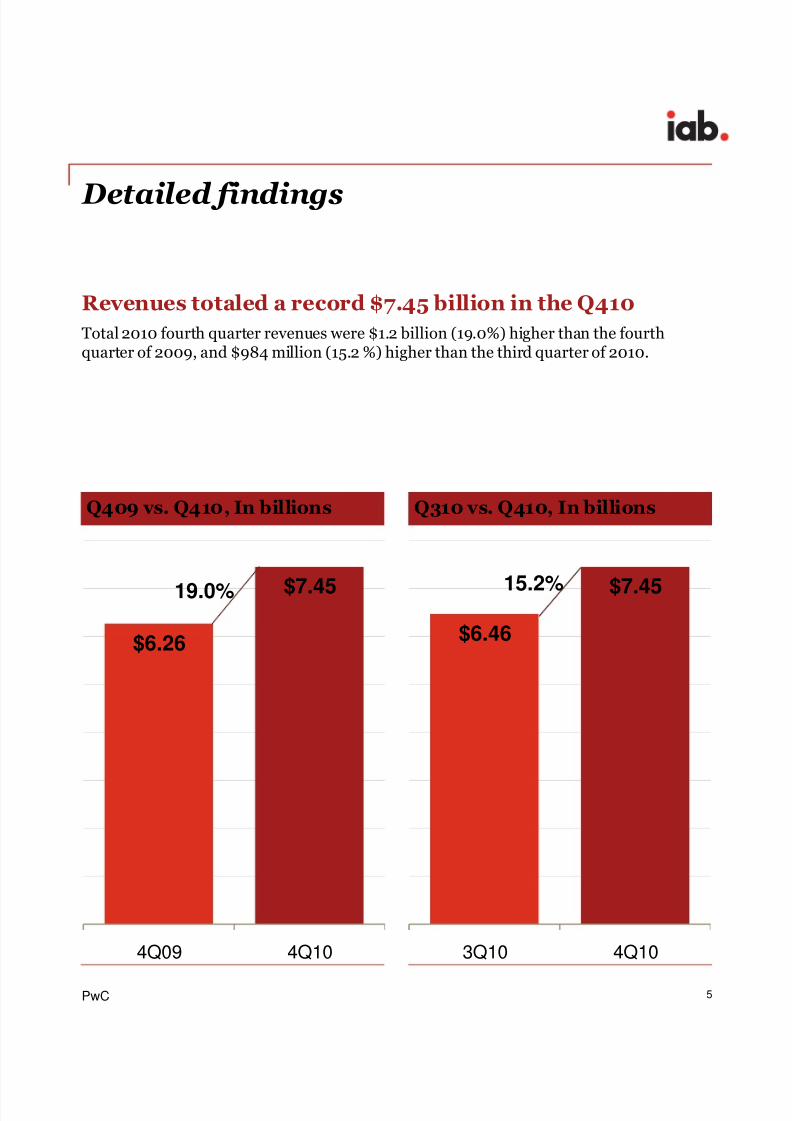
Revenues Increased 15% in 2010 — Internet advertising revenues in the U.S. totaled$7.45 billion in the fourth quarter of 2010, an increase of 15 percent from the 2010 thirdquarter total of $6.46 billion, and an increase of 19 percent from the 2009 fourthquarter total of $6.26 billion. 2010 full year Internet advertising revenues totaled $26.0
billion, up 15 percent from the $22.7 billion reported in 2009.
“With a strong rebound from 2009, the $26 billion spent on Internet advertising pointsto a continued focus on digital media ad spend, with dollars catching up to the eyeballs.
More time spent online, especially with increases in digital video and social media, hascertainly helped to fuel the continued growth.”
—David Silverman, Partner, PwC
Search Continues to Lead, followed by Display Banners and Classifieds—Search revenue accounted for 46 percent of 2010 revenues, down slightly from the 47percent reported in 2009. Display advertising showed solid growth, accounting for 38
percent of 2010 revenue up from 35 percent in 2009. Digital video, which is acomponent of display advertising, increased 40 percent from 2009 to 2010.
“ As the latest IAB Internet Advertising Revenue Report concludes, online advertising isgrowing. These results show that many advertisers and marketers take digital mediainto consideration and more are using online advertising as part of their campaigns.Consumers are shifting more of their time to digital media, watching television showsand movies online, and advertisers recognize the opportunities to reach their targetsthrough this medium.”
—Randall Rothenberg, President and CEO, IAB
8/7/2019 Internet Advertising Burea Wordwide Digital Marketing Spending by Industrt and Ad formats
http://slidepdf.com/reader/full/internet-advertising-burea-wordwide-digital-marketing-spending-by-industrt 5/28
8/7/2019 Internet Advertising Burea Wordwide Digital Marketing Spending by Industrt and Ad formats
http://slidepdf.com/reader/full/internet-advertising-burea-wordwide-digital-marketing-spending-by-industrt 6/28
6PwC
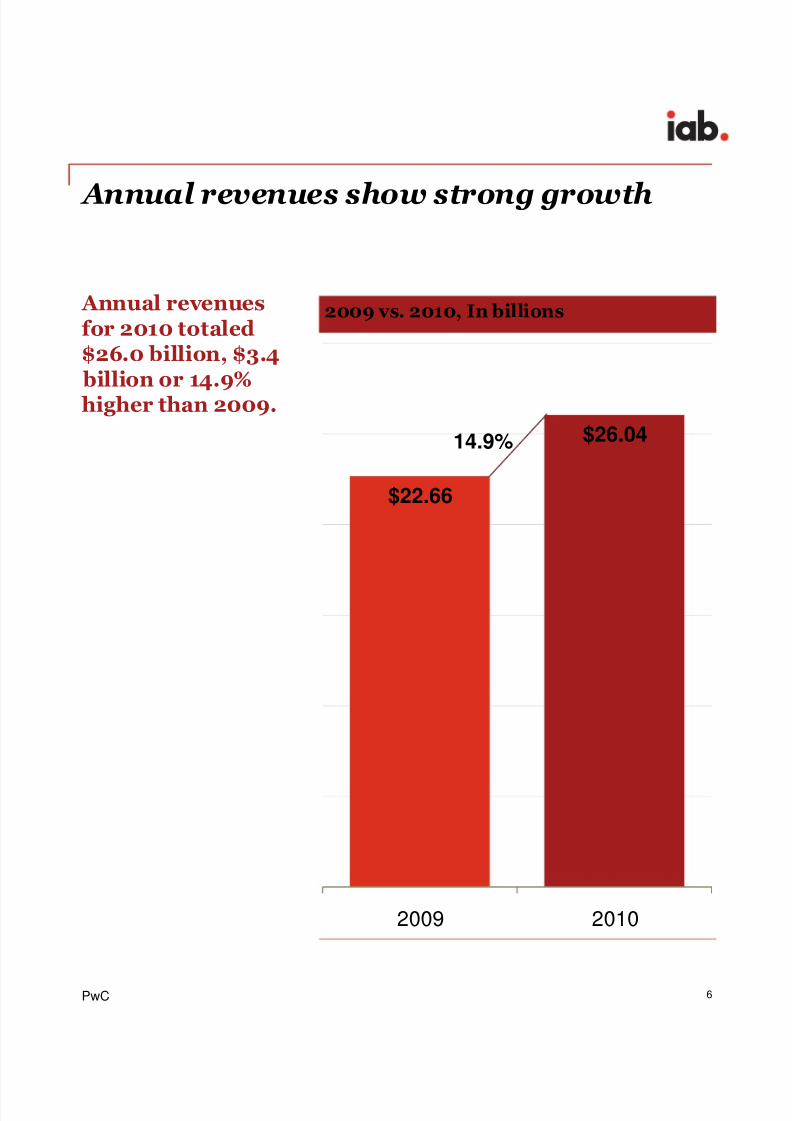
2009 vs. 2010, In billions Annual revenuesfor 2010 totaled$26.0 billion, $3.4
billion or 14.9%higher than 2009.
Annual revenues show strong growth
$22.66
$26.04
2009 2010
14.9%

8/7/2019 Internet Advertising Burea Wordwide Digital Marketing Spending by Industrt and Ad formats
http://slidepdf.com/reader/full/internet-advertising-burea-wordwide-digital-marketing-spending-by-industrt 7/28
7PwC
Annual Revenue, In billions
Revenue growth recovers in 2010
2010 annual revenues increased on a year-over-year percentage and dollar basis, afterrevenues dropped in 2009, impacted primarily by the economic recession.
$8.09
$7.13 $6.01$7.27
$9.63
$12.54
$16.88
$21.21
$23.45 $22.66
$26.04
2000 2001 2002 2003 2004 2005 2006 2007 2008 2009 2010
Historical annual revenue trends
8/7/2019 Internet Advertising Burea Wordwide Digital Marketing Spending by Industrt and Ad formats
http://slidepdf.com/reader/full/internet-advertising-burea-wordwide-digital-marketing-spending-by-industrt 8/28
8PwC
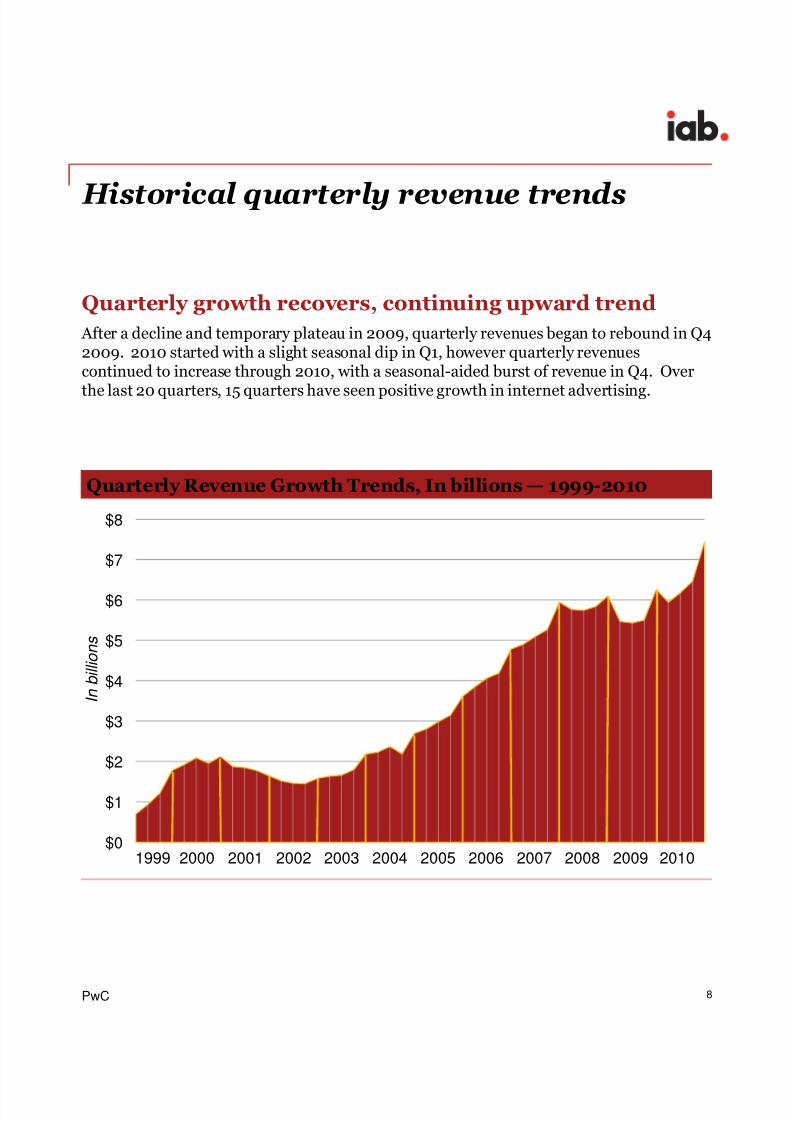
Quarterly growth recovers, continuing upward trend
After a decline and temporary plateau in 2009, quarterly revenues began to rebound in Q42009. 2010 started with a slight seasonal dip in Q1, however quarterly revenuescontinued to increase through 2010, with a seasonal-aided burst of revenue in Q4. Over
the last 20 quarters, 15 quarters have seen positive growth in internet advertising.
Quarterly Revenue Growth Trends, In billions — 1999-2010
Historical quarterly revenue trends
$0
$1
$2
$3
$4
$5
$6
$7
$8
2001 2002 2003 2004 2005 2006 2007 2008 2009 2010
I n
b i l l i o n s
20001999
8/7/2019 Internet Advertising Burea Wordwide Digital Marketing Spending by Industrt and Ad formats
http://slidepdf.com/reader/full/internet-advertising-burea-wordwide-digital-marketing-spending-by-industrt 9/28
9PwC
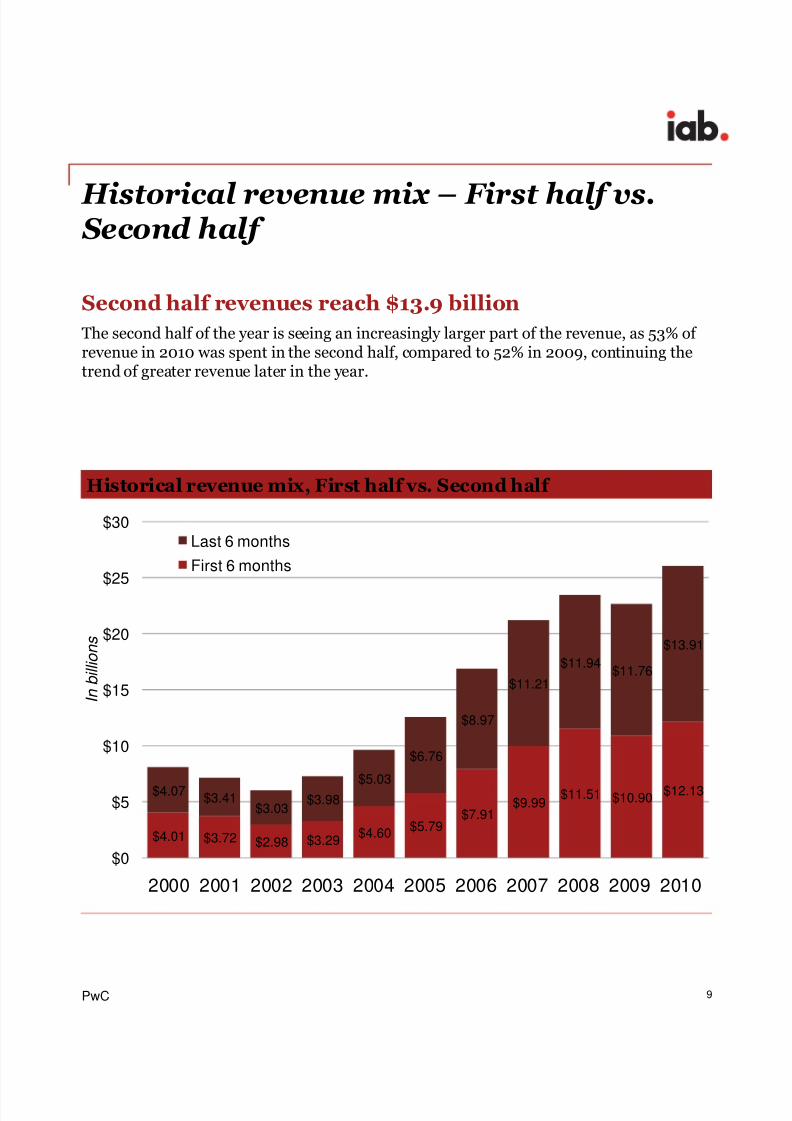
Second half revenues reach $13.9 billion
The second half of the year is seeing an increasingly larger part of the revenue, as 53% of revenue in 2010 was spent in the second half, compared to 52% in 2009, continuing thetrend of greater revenue later in the year.
Historical revenue mix – First half vs. Second half
Historical revenue mix, First half vs. Second half
$4.01 $3.72 $2.98 $3.29$4.60
$5.79$7.91
$9.99$11.51 $10.90 $12.13$4.07 $3.41
$3.03$3.98
$5.03
$6.76
$8.97
$11.21
$11.94$11.76
$13.91
$0
$5
$10
$15
$20
$25
$30
2000 2001 2002 2003 2004 2005 2006 2007 2008 2009 2010
Last 6 months
First 6 months
I n
b i l l i o n s
8/7/2019 Internet Advertising Burea Wordwide Digital Marketing Spending by Industrt and Ad formats
http://slidepdf.com/reader/full/internet-advertising-burea-wordwide-digital-marketing-spending-by-industrt 10/28
10PwC
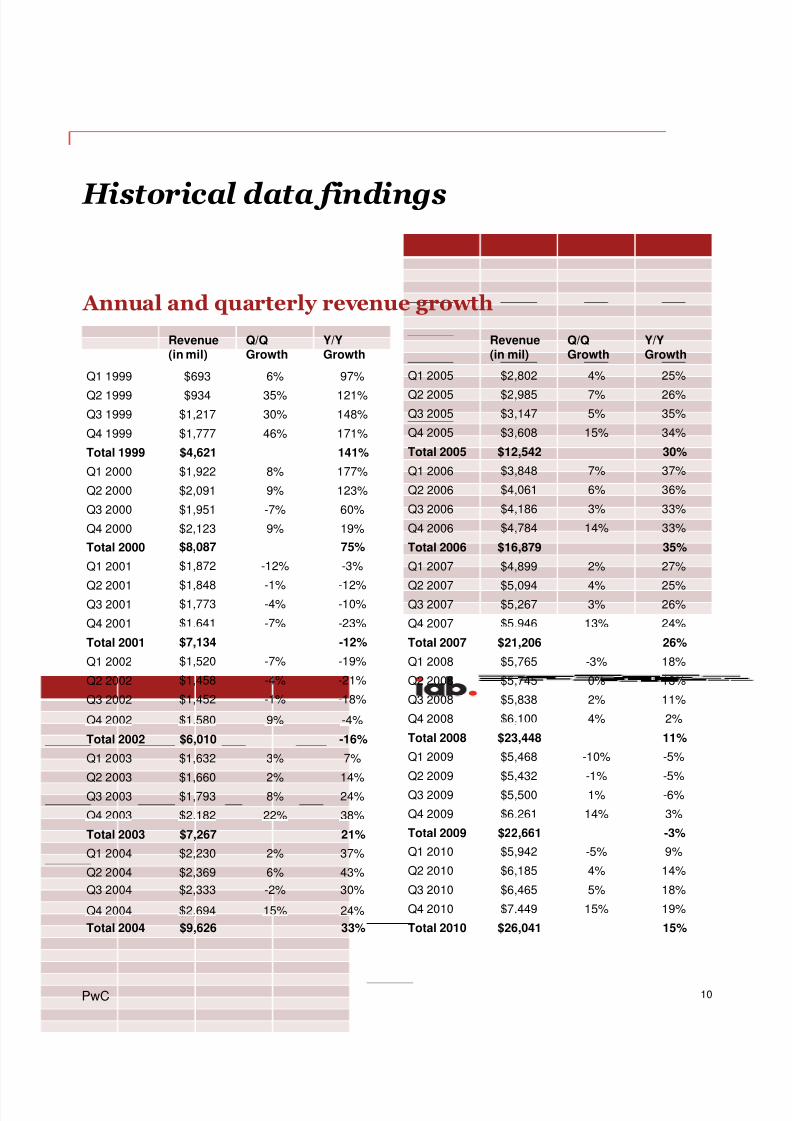
Historical data findings
Revenue(in mil)
Q/QGrowth
Y/YGrowth
Q1 2005 $2,802 4% 25%
Q2 2005 $2,985 7% 26%
Q3 2005 $3,147 5% 35%
Q4 2005 $3,608 15% 34%
Total 2005 $12,542 30%
Q1 2006 $3,848 7% 37%
Q2 2006 $4,061 6% 36%
Q3 2006 $4,186 3% 33%
Q4 2006 $4,784 14% 33%
Total 2006 $16,879 35%
Q1 2007 $4,899 2% 27%
Q2 2007 $5,094 4% 25%Q3 2007 $5,267 3% 26%
Q4 2007 $5,946 13% 24%
Total 2007 $21,206 26%
Q1 2008 $5,765 -3% 18%
Q2 2008 $5,745 0% 13%
Q3 2008 $5,838 2% 11%
Q4 2008 $6,100 4% 2%
Total 2008 $23,448 11%
Q1 2009 $5,468 -10% -5%
Q2 2009 $5,432 -1% -5%
Q3 2009 $5,500 1% -6%
Q4 2009 $6,261 14% 3%
Total 2009 $22,661 -3%
Q1 2010 $5,942 -5% 9%
Q2 2010 $6,185 4% 14%
Q3 2010 $6,465 5% 18%
Q4 2010 $7,449 15% 19%
Total 2010 $26,041 15%
Revenue(in mil)
Q/QGrowth
Y/YGrowth
Q1 1999 $693 6% 97%
Q2 1999 $934 35% 121%
Q3 1999 $1,217 30% 148%
Q4 1999 $1,777 46% 171%
Total 1999 $4,621 141%
Q1 2000 $1,922 8% 177%
Q2 2000 $2,091 9% 123%
Q3 2000 $1,951 -7% 60%
Q4 2000 $2,123 9% 19%
Total 2000 $8,087 75%
Q1 2001 $1,872 -12% -3%
Q2 2001 $1,848 -1% -12%Q3 2001 $1,773 -4% -10%
Q4 2001 $1,641 -7% -23%
Total 2001 $7,134 -12%
Q1 2002 $1,520 -7% -19%
Q2 2002 $1,458 -4% -21%
Q3 2002 $1,452 -1% -18%
Q4 2002 $1,580 9% -4%
Total 2002 $6,010 -16%
Q1 2003 $1,632 3% 7%
Q2 2003 $1,660 2% 14%
Q3 2003 $1,793 8% 24%
Q4 2003 $2,182 22% 38%
Total 2003 $7,267 21%
Q1 2004 $2,230 2% 37%
Q2 2004 $2,369 6% 43%
Q3 2004 $2,333 -2% 30%
Q4 2004 $2,694 15% 24%
Total 2004 $9,626 33%
Annual and quarterly revenue growth
8/7/2019 Internet Advertising Burea Wordwide Digital Marketing Spending by Industrt and Ad formats
http://slidepdf.com/reader/full/internet-advertising-burea-wordwide-digital-marketing-spending-by-industrt 11/28
11PwC
0
20
40
60
80
100
Q 1 Q 2 Q 3 Q 4 Q 1 Q 2 Q 3 Q 4 Q 1 Q 2 Q 3 Q 4 Q 1 Q 2 Q 3 Q 4 Q 1 Q 2 Q 3 Q 4 Q 1 Q 2 Q 3 Q 4 Q 1 Q 2 Q 3 Q 4 Q 1 Q 2 Q 3 Q 4 Q 1 Q 2 Q 3 Q 4 Q 1 Q 2 Q 3 Q 4
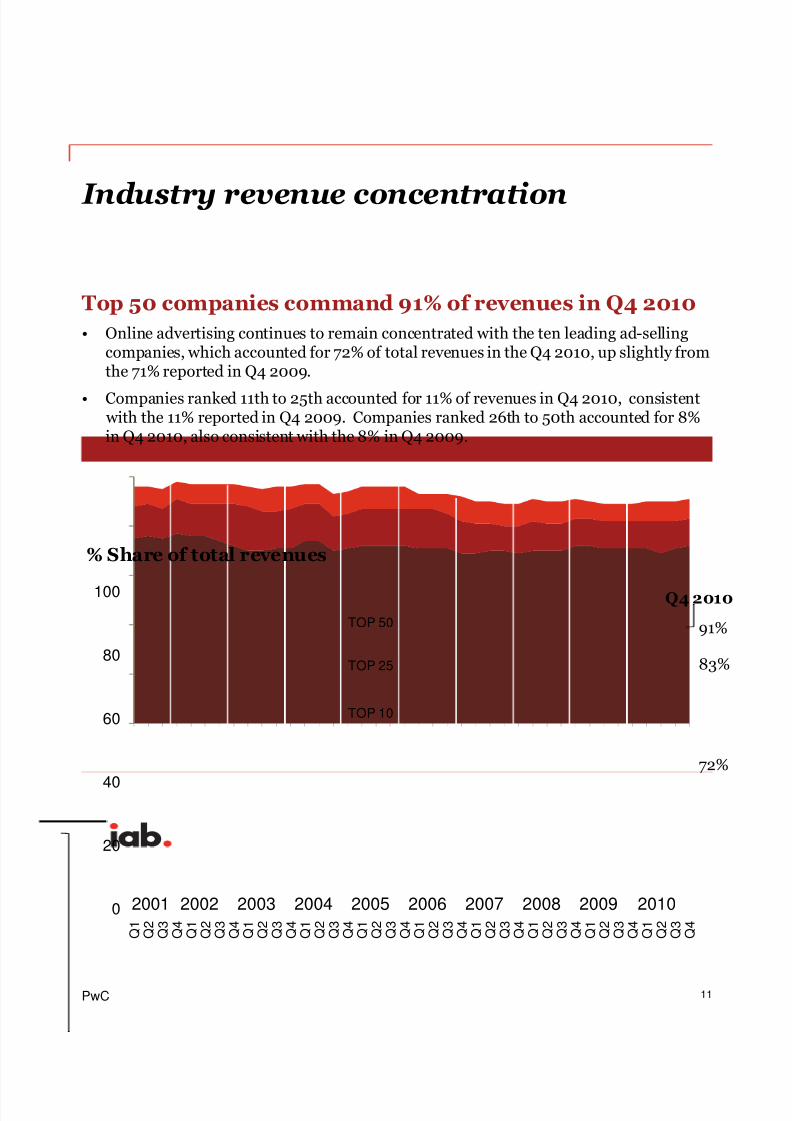
Top 50 companies command 91% of revenues in Q4 2010
• Online advertising continues to remain concentrated with the ten leading ad-sellingcompanies, which accounted for 72% of total revenues in the Q4 2010, up slightly fromthe 71% reported in Q4 2009.
• Companies ranked 11th to 25th accounted for 11% of revenues in Q4 2010, consistent with the 11% reported in Q4 2009. Companies ranked 26th to 50th accounted for 8%in Q4 2010, also consistent with the 8% in Q4 2009.
% Share of total revenues
Industry revenue concentration
91%TOP 50
TOP 25
TOP 10
83%
72%
2010200920082007200620052004200320022001
Q4 2010
8/7/2019 Internet Advertising Burea Wordwide Digital Marketing Spending by Industrt and Ad formats
http://slidepdf.com/reader/full/internet-advertising-burea-wordwide-digital-marketing-spending-by-industrt 12/28
12PwC
45%
26%
9%
5%
5%
5%4% 1%
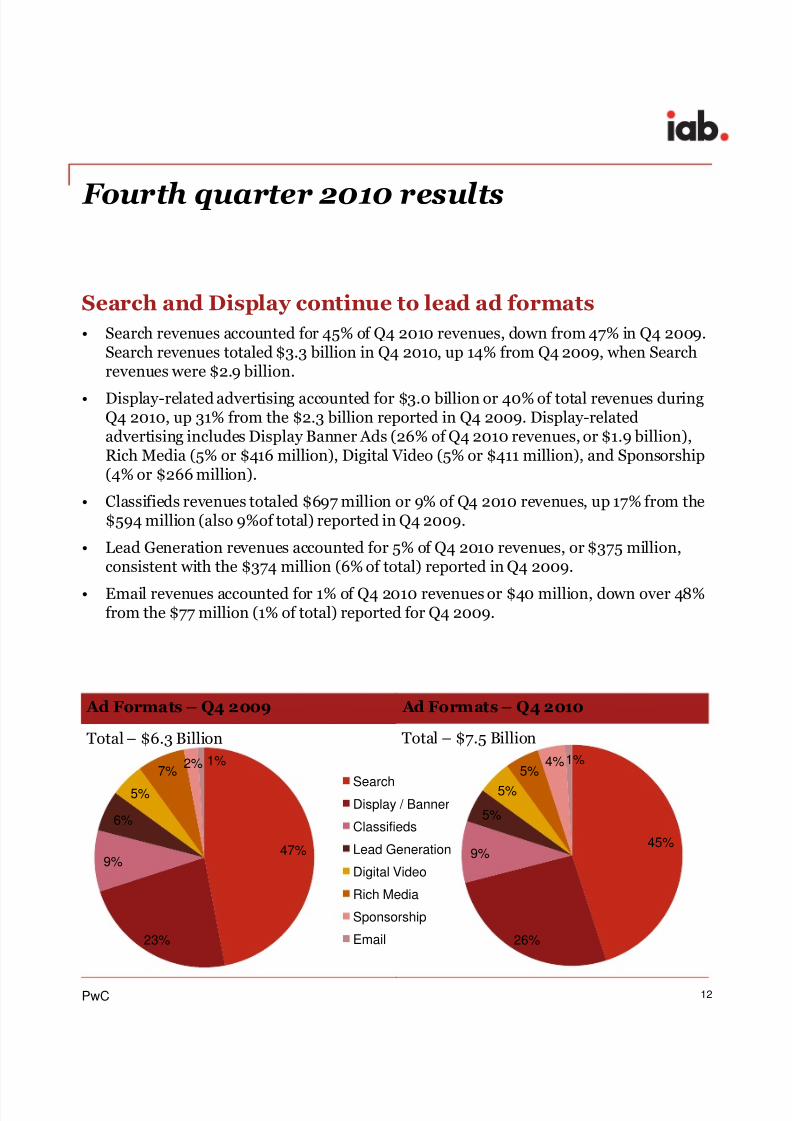
Search and Display continue to lead ad formats
• Search revenues accounted for 45% of Q4 2010 revenues, down from 47% in Q4 2009.Search revenues totaled $3.3 billion in Q4 2010, up 14% from Q4 2009, when Searchrevenues were $2.9 billion.
• Display-related advertising accounted for $3.0 billion or 40% of total revenues duringQ4 2010, up 31% from the $2.3 billion reported in Q4 2009. Display-relatedadvertising includes Display Banner Ads (26% of Q4 2010 revenues, or $1.9 billion),Rich Media (5% or $416 million), Digital Video (5% or $411 million), and Sponsorship(4% or $266 million).
• Classifieds revenues totaled $697 million or 9% of Q4 2010 revenues, up 17% from the$594 million (also 9%of total) reported in Q4 2009.
• Lead Generation revenues accounted for 5% of Q4 2010 revenues, or $375 million,consistent with the $374 million (6% of total) reported in Q4 2009.
• Email revenues accounted for 1% of Q4 2010 revenues or $40 million, down over 48%from the $77 million (1% of total) reported for Q4 2009.
Fourth quarter 2010 results
Ad Formats – Q4 2009
Total – $6.3 Billion
Ad Formats – Q4 2010
Total – $7.5 Billion
47%
23%
9%
6%
5%
7%2% 1%
SearchDisplay / Banner
Classifieds
Lead Generation
Digital Video
Rich Media
Sponsorship
8/7/2019 Internet Advertising Burea Wordwide Digital Marketing Spending by Industrt and Ad formats
http://slidepdf.com/reader/full/internet-advertising-burea-wordwide-digital-marketing-spending-by-industrt 13/28
13PwC
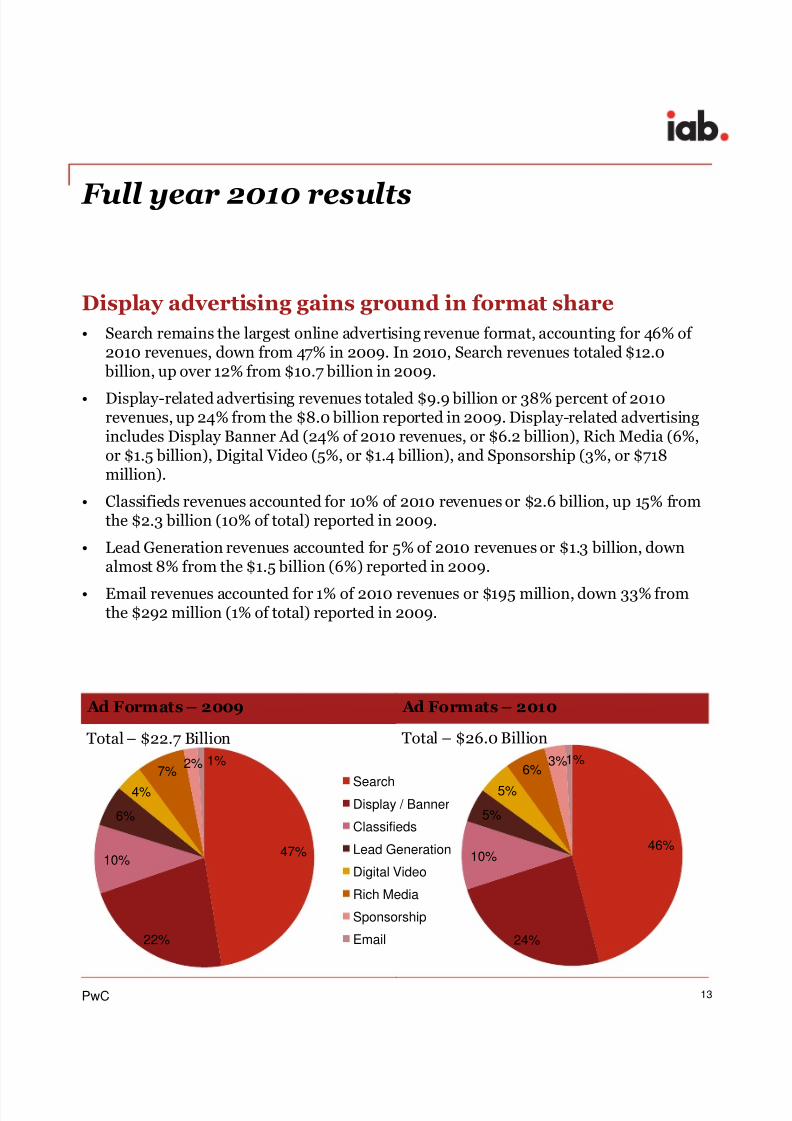
Display advertising gains ground in format share
• Search remains the largest online advertising revenue format, accounting for 46% of 2010 revenues, down from 47% in 2009. In 2010, Search revenues totaled $12.0
billion, up over 12% from $10.7 billion in 2009.
• Display-related advertising revenues totaled $9.9 billion or 38% percent of 2010revenues, up 24% from the $8.0 billion reported in 2009. Display-related advertisingincludes Display Banner Ad (24% of 2010 revenues, or $6.2 billion), Rich Media (6%,or $1.5 billion), Digital Video (5%, or $1.4 billion), and Sponsorship (3%, or $718million).
• Classifieds revenues accounted for 10% of 2010 revenues or $2.6 billion, up 15% fromthe $2.3 billion (10% of total) reported in 2009.
• Lead Generation revenues accounted for 5% of 2010 revenues or $1.3 billion, downalmost 8% from the $1.5 billion (6%) reported in 2009.
• Email revenues accounted for 1% of 2010 revenues or $195 million, down 33% fromthe $292 million (1% of total) reported in 2009.
Full year 2010 results
Ad Formats – 2009
Total – $22.7 Billion
Ad Formats – 2010
Total – $26.0 Billion
47%
22%
10%
6%
4%
7%2% 1%
SearchDisplay / Banner
Classifieds
Lead Generation
Digital Video
Rich Media
Sponsorship
46%
24%
10%
5%
5%
6%3%1%
8/7/2019 Internet Advertising Burea Wordwide Digital Marketing Spending by Industrt and Ad formats
http://slidepdf.com/reader/full/internet-advertising-burea-wordwide-digital-marketing-spending-by-industrt 14/28
14PwC
Mobile advertising estimates
Mobile advertising estimated between $550-$650 millionin 2010
• Mobile advertising for 2010 is estimated to be between $550–$650 million. This yearmarks the initial estimate for mobile advertising revenue in this report.
• Currently, mobile advertising is reported within pre-existing Internet ad formatrevenues.
• PwC estimated this value based upon a separate methodology from the results of therest of this report. Mobile advertising information is gathered from publicly availableinformation, industry research, and a small percentage of direct submissions withinthe full-year 2010 reporting cycle.

8/7/2019 Internet Advertising Burea Wordwide Digital Marketing Spending by Industrt and Ad formats
http://slidepdf.com/reader/full/internet-advertising-burea-wordwide-digital-marketing-spending-by-industrt 15/28
15PwC
Search retains largest share of revenue, but display makes strong gains
• Search has remained the leading format since 2006, having strong sequential growththrough this period. In 2010, Search lost some of its overall share to Display Banners,
which now account for 24% of internet advertising revenues.
• Having seen sharp declines over the past five years, Classified revenues stabilized in2010, maintaining its 10% of market share, down from the 18% of advertising revenuesit commanded in 2006.
Advertising Format Share (% of Total Revenue)
Historical format trends
*Format definitions may have changed over the time period depicted, both within the survey process and
definitionally by survey respondents.
0%
10%
20%
30%
40%
50%
Search DisplayBanners
Classifieds Rich Media &Digital Video
LeadGeneration
Sponsorships
2006 2007 2008 2009 2010
8/7/2019 Internet Advertising Burea Wordwide Digital Marketing Spending by Industrt and Ad formats
http://slidepdf.com/reader/full/internet-advertising-burea-wordwide-digital-marketing-spending-by-industrt 16/28
16PwC
Ad revenues by industry category
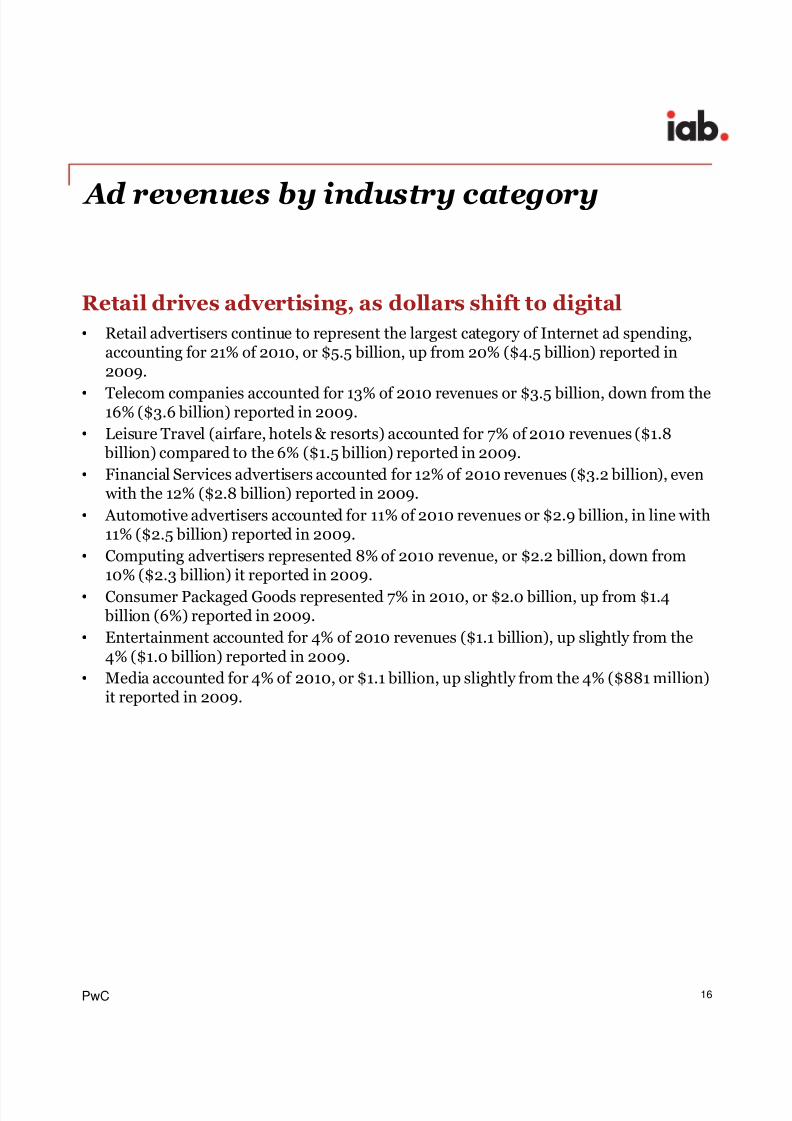
Retail drives advertising, as dollars shift to digital
• Retail advertisers continue to represent the largest category of Internet ad spending,accounting for 21% of 2010, or $5.5 billion, up from 20% ($4.5 billion) reported in2009.
• Telecom companies accounted for 13% of 2010 revenues or $3.5 billion, down from the16% ($3.6 billion) reported in 2009.
• Leisure Travel (airfare, hotels & resorts) accounted for 7% of 2010 revenues ($1.8 billion) compared to the 6% ($1.5 billion) reported in 2009.
• Financial Services advertisers accounted for 12% of 2010 revenues ($3.2 billion), even with the 12% ($2.8 billion) reported in 2009.
• Automotive advertisers accounted for 11% of 2010 revenues or $2.9 billion, in line with11% ($2.5 billion) reported in 2009.
• Computing advertisers represented 8% of 2010 revenue, or $2.2 billion, down from10% ($2.3 billion) it reported in 2009.
• Consumer Packaged Goods represented 7% in 2010, or $2.0 billion, up from $1.4 billion (6%) reported in 2009.
• Entertainment accounted for 4% of 2010 revenues ($1.1 billion), up slightly from the4% ($1.0 billion) reported in 2009.
• Media accounted for 4% of 2010, or $1.1 billion, up slightly from the 4% ($881 million)it reported in 2009.

8/7/2019 Internet Advertising Burea Wordwide Digital Marketing Spending by Industrt and Ad formats
http://slidepdf.com/reader/full/internet-advertising-burea-wordwide-digital-marketing-spending-by-industrt 17/28
8/7/2019 Internet Advertising Burea Wordwide Digital Marketing Spending by Industrt and Ad formats
http://slidepdf.com/reader/full/internet-advertising-burea-wordwide-digital-marketing-spending-by-industrt 18/28

8/7/2019 Internet Advertising Burea Wordwide Digital Marketing Spending by Industrt and Ad formats
http://slidepdf.com/reader/full/internet-advertising-burea-wordwide-digital-marketing-spending-by-industrt 19/28
19PwC
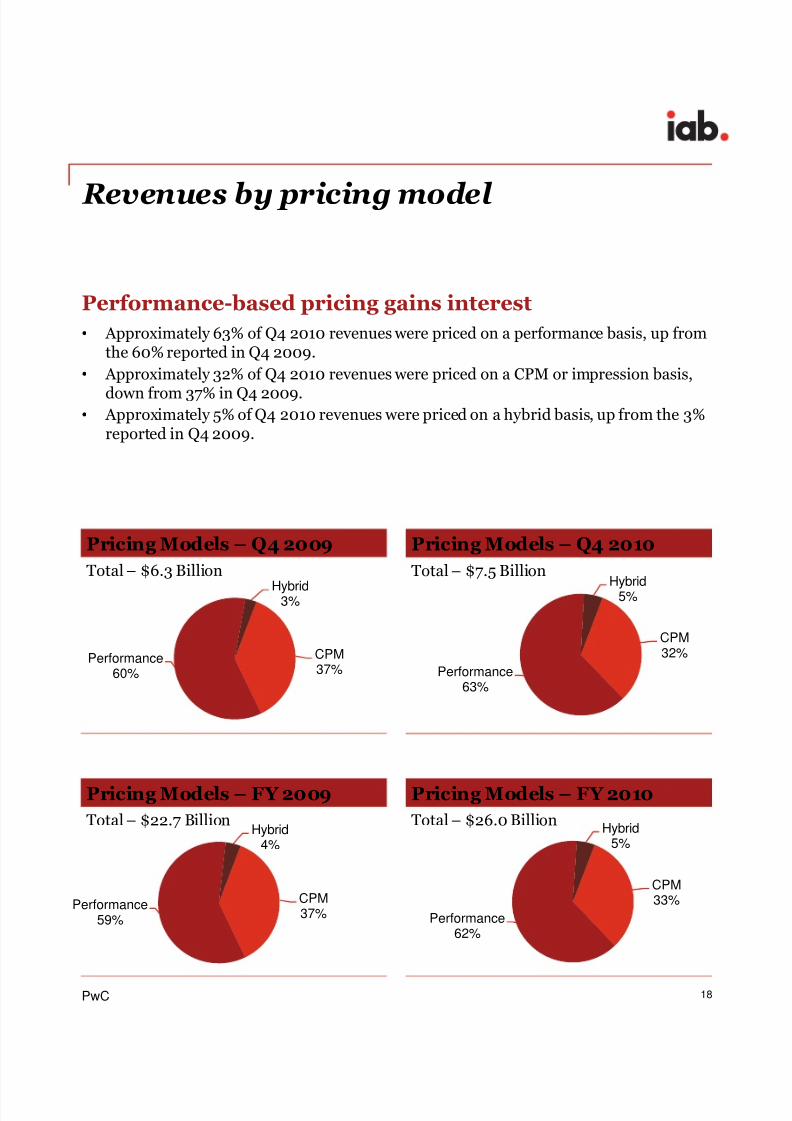
Performance-based pricing remains the preferred model
• Performance based pricing, the most prevalent pricing model since 2006, hasmaintained a strong sequential growth rate, reaching 62% in 2010. It is followed by CPM/Impression based pricing which has declined as a percentage of revenue over the
past several years. Hybrid pricing has seen the greatest loss in percentage revenueover the period, to a sharp dip from 17% in 2004 to 4% in 2009, but is back up to 5%in 2010.
*Pricing model definitions may have changed over time period depicted, both within the survey process anddefinitionally by survey respondents.
Internet Ad Revenues by Pricing Model*
42%
46%48%
45%
39% 37%33%
41% 41%
47%
51%
57% 59%62%
17%
13%
5% 4% 4%4% 5%
0%
10%
20%
30%
40%
50%
60%
70%
2004 2005 2006 2007 2008 2009 2010
%
o f T o t a l R e v e n u e s
CPM Performance Hybrid
Hybrid
Performance
CPM
Historical pricing model trends
8/7/2019 Internet Advertising Burea Wordwide Digital Marketing Spending by Industrt and Ad formats
http://slidepdf.com/reader/full/internet-advertising-burea-wordwide-digital-marketing-spending-by-industrt 20/28
20PwC
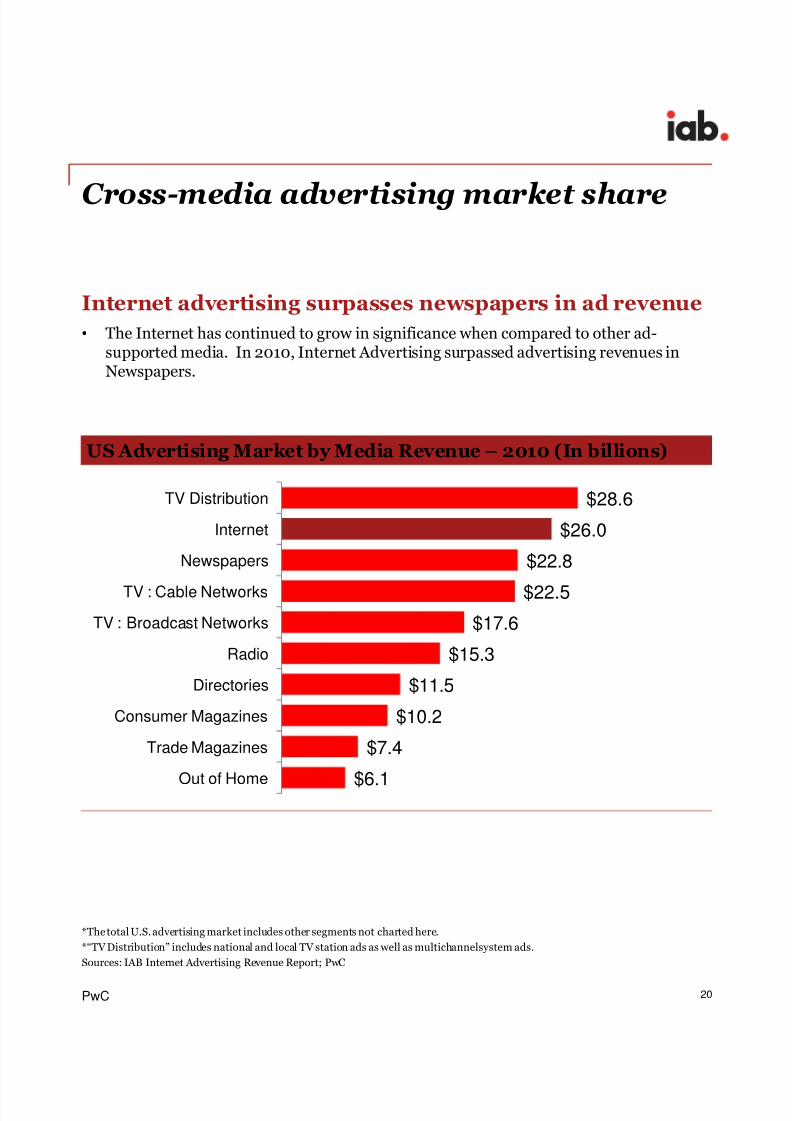
*The total U.S. advertising market includes other segments not charted here.
*“TV Distribution” includes national and local TV station ads as well as multichannelsystem ads.
Sources: IAB Internet Advertising Revenue Report; PwC
US Advertising Market by Media Revenue – 2010 (In billions)
Cross-media advertising market share
$6.1
$7.4
$10.2
$11.5
$15.3
$17.6
$22.5
$22.8
$26.0
$28.6
Out of Home
Trade Magazines
Consumer Magazines
Directories
Radio
TV : Broadcast Networks
TV : Cable Networks
Newspapers
Internet
TV Distribution
Internet advertising surpasses newspapers in ad revenue
• The Internet has continued to grow in significance when compared to other ad-supported media. In 2010, Internet Advertising surpassed advertising revenues inNewspapers.
8/7/2019 Internet Advertising Burea Wordwide Digital Marketing Spending by Industrt and Ad formats
http://slidepdf.com/reader/full/internet-advertising-burea-wordwide-digital-marketing-spending-by-industrt 21/28
21PwC
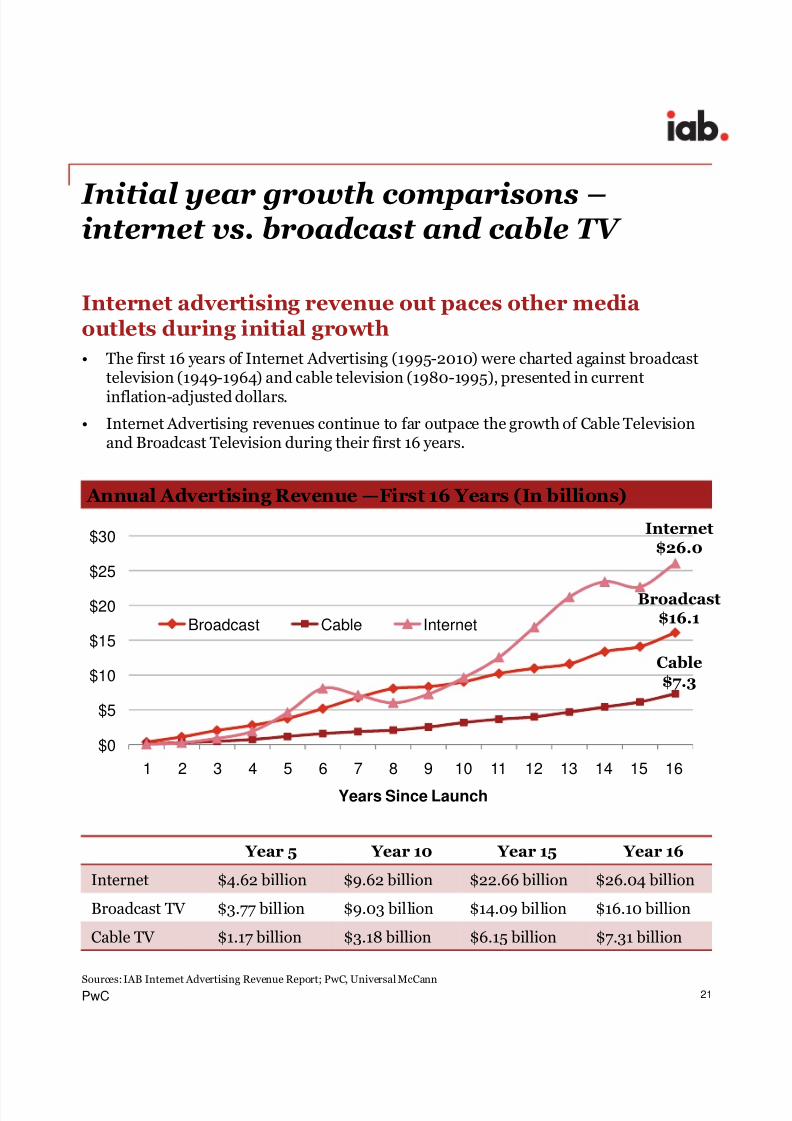
Year 5 Year 10 Year 15 Year 16
Internet $4.62 billion $9.62 billion $22.66 billion $26.04 billion
Broadcast TV $3.77 billion $9.03 billion $14.09 billion $16.10 billion
Cable TV $1.17 billion $3.18 billion $6.15 billion $7.31 billion
Internet advertising revenue out paces other mediaoutlets during initial growth
• The first 16 years of Internet Advertising (1995-2010) were charted against broadcasttelevision (1949-1964) and cable television (1980-1995), presented in current
inflation-adjusted dollars.
• Internet Advertising revenues continue to far outpace the growth of Cable Televisionand Broadcast Television during their first 16 years.
Sources: IAB Internet Advertising Revenue Report; PwC, Universal McCann
Annual Advertising Revenue —First 16 Years (In billions)
Initial year growth comparisons –internet vs. broadcast and cable TV
$0
$5
$10
$15
$20
$25
$30
1 2 3 4 5 6 7 8 9 10 11 12 13 14 15 16
Years Since Launch
Broadcast Cable Internet
Internet$26.0
Broadcast$16.1
Cable$7.3
8/7/2019 Internet Advertising Burea Wordwide Digital Marketing Spending by Industrt and Ad formats
http://slidepdf.com/reader/full/internet-advertising-burea-wordwide-digital-marketing-spending-by-industrt 22/28
22PwC
Appendix
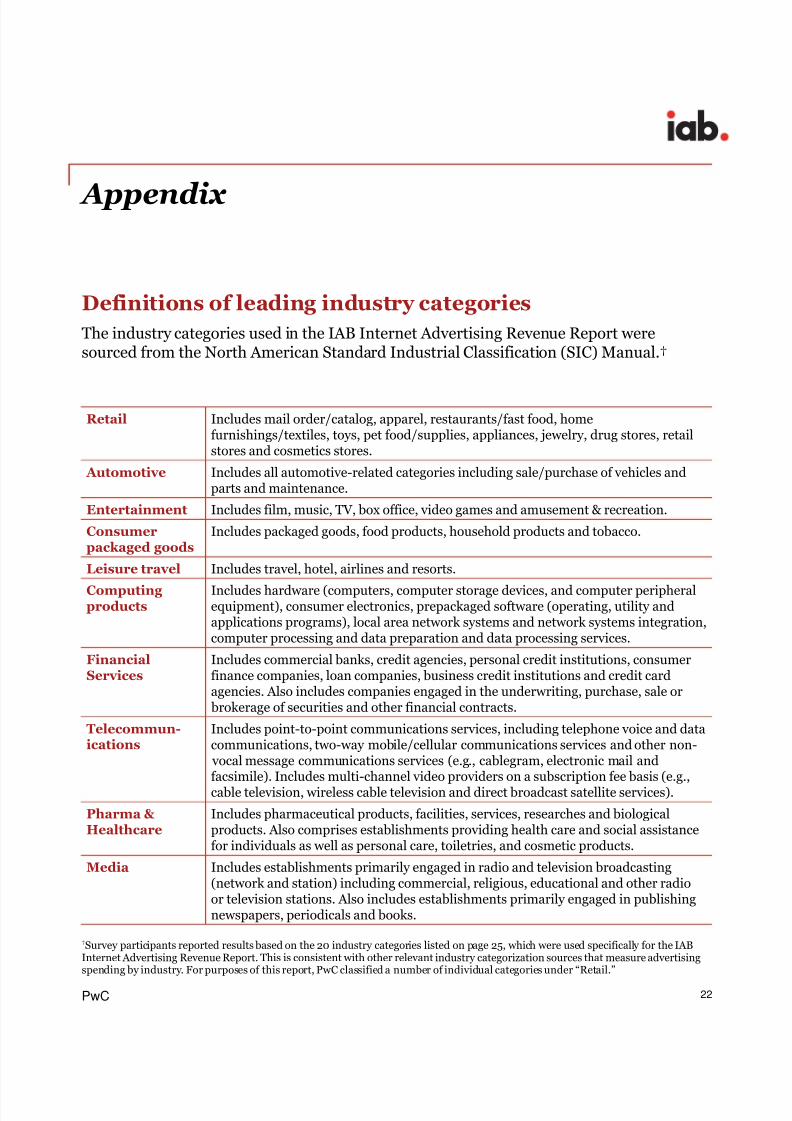
Definitions of leading industry categories
The industry categories used in the IAB Internet Advertising Revenue Report weresourced from the North American Standard Industrial Classification (SIC) Manual.†
Retail Includes mail order/catalog, apparel, restaurants/fast food, homefurnishings/textiles, toys, pet food/supplies, appliances, jewelry, drug stores, retailstores and cosmetics stores.
Automotive Includes all automotive-related categories including sale/purchase of vehicles andparts and maintenance.
Entertainment Includes film, music, TV, box office, video games and amusement & recreation.
Consumerpackaged goods
Includes packaged goods, food products, household products and tobacco.
Leisure travel Includes travel, hotel, airlines and resorts.
Computingproducts
Includes hardware (computers, computer storage devices, and computer peripheralequipment), consumer electronics, prepackaged software (operating, utility andapplications programs), local area network systems and network systems integration,computer processing and data preparation and data processing services.
FinancialServices
Includes commercial banks, credit agencies, personal credit institutions, consumerfinance companies, loan companies, business credit institutions and credit cardagencies. Also includes companies engaged in the underwriting, purchase, sale or
brokerage of securities and other financial contracts.
Telecommun-ications
Includes point-to-point communications services, including telephone voice and datacommunications, two-way mobile/cellular communications services and other non-
vocal message communications services (e.g., cablegram, electronic mail andfacsimile). Includes multi-channel video providers on a subscription fee basis (e.g.,cable television, wireless cable television and direct broadcast satellite services).
Pharma & Healthcare
Includes pharmaceutical products, facilities, services, researches and biologicalproducts. Also comprises establishments providing health care and social assistancefor individuals as well as personal care, toiletries, and cosmetic products.
Media Includes establishments primarily engaged in radio and television broadcasting(network and station) including commercial, religious, educational and other radioor television stations. Also includes establishments primarily engaged in publishingnewspapers, periodicals and books.
†Survey participants reported results based on the 20 industry categories listed on page 25, which were used specifically for the IABInternet Advertising Revenue Report. This is consistent with other relevant industry categorization sources that measure advertisingspending by industry. For purposes of this report, PwC classified a number of individual categories under “Retail.”
8/7/2019 Internet Advertising Burea Wordwide Digital Marketing Spending by Industrt and Ad formats
http://slidepdf.com/reader/full/internet-advertising-burea-wordwide-digital-marketing-spending-by-industrt 23/28
23PwC
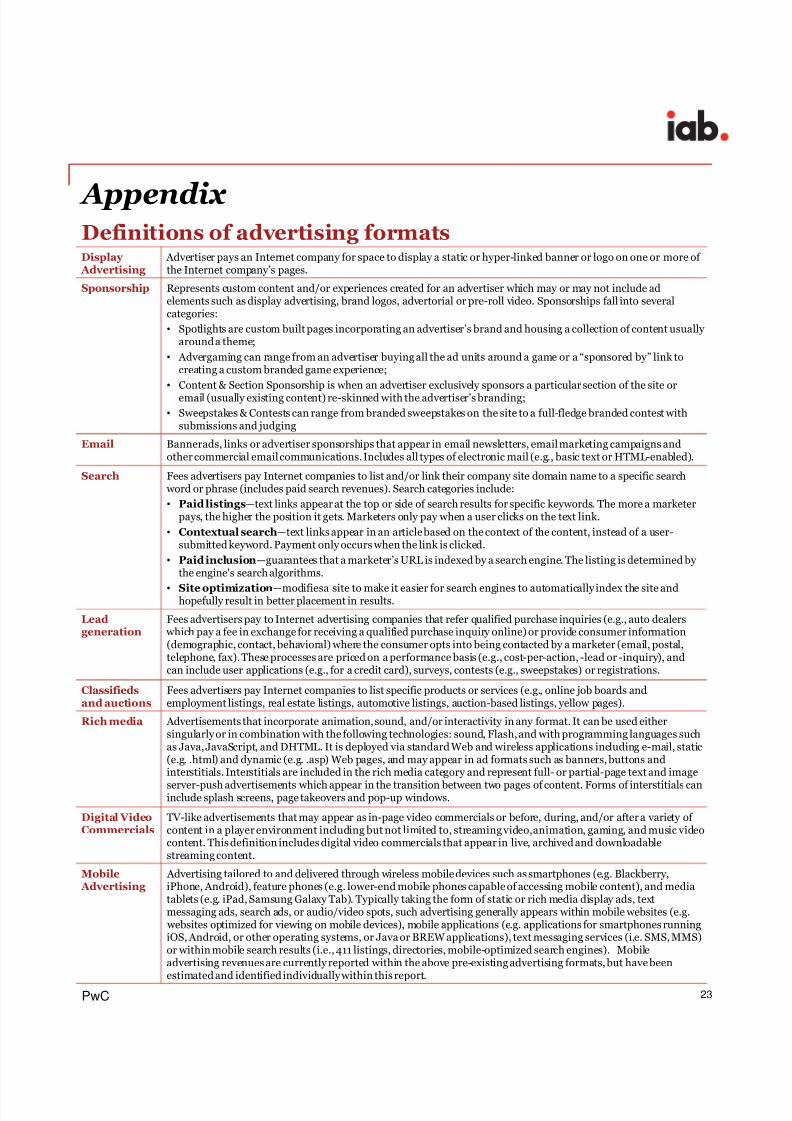
Display Advertising
Advertiser pays an Internet company for space to display a static or hyper-linked banner or logo on one or more of the Internet company’s pages.
Sponsorship Represents custom content and/or experiences created for an advertiser which may or may not include adelements such as display advertising, brand logos, advertorial or pre-roll video. Sponsorships fall into severalcategories:
• Spotlights are custom built pages incorporating an advertiser’s brand and housing a collection of content usually around a theme;
• Advergaming can range from an advertiser buying all the ad units around a game or a “sponsored by” link tocreating a custom branded game experience;
• Content & Section Sponsorship is when an advertiser exclusively sponsors a particular section of the site oremail (usually existing content) re-skinned with the advertiser’s branding;
• Sweepstakes & Contests can range from branded sweepstakes on the site to a full-fledge branded contest withsubmissions and judging
Email Bannerads, links or advertiser sponsorships that appear in email newsletters, email marketing campaigns andother commercial email communications. Includes all types of electronic mail (e.g., basic text or HTML-enabled).
Search Fees advertisers pay Internet companies to list and/or link their company site domain name to a specific search word or phrase (includes paid search revenues). Search categories include:
• Paid listings—text links appear at the top or side of search results for specific keywords. The more a marketerpays, the higher the position it gets. Marketers only pay when a user clicks on the text link.
• Contextual search—text links appear in an article based on the context of the content, instead of a user-submitted keyword. Payment only occurs when the link is clicked.
• Paid inclusion—guarantees that a marketer’s URL is indexed by a search engine. The listing is determined by the engine's search algorithms.
• Site optimization—modifiesa site to make it easier for search engines to automatically index the site andhopefully result in better placement in results.
Leadgeneration
Fees advertisers pay to Internet advertising companies that refer qualified purchase inquiries (e.g., auto dealers which pay a fee in exchange for receiving a qualified purchase inquiry online) or provide consumer information(demographic, contact, behavioral) where the consumer opts into being contacted by a marketer (email, postal,telephone, fax). These processes are priced on a performance basis (e.g., cost-per-action, -lead or -inquiry), andcan include user applications (e.g., for a credit card), surveys, contests (e.g., sweepstakes) or registrations.
Classifiedsand auctions
Fees advertisers pay Internet companies to list specific products or services (e.g., online job boards andemployment listings, real estate listings, automotive listings, auction-based listings, yellow pages).
Rich media Advertisements that incorporate animation, sound, and/or interactivity in any format. It can be used eithersingularly or in combination with the following technologies: sound, Flash, and with programming languages suchas Java, JavaScript, and DHTML. It is deployed via standard Web and wireless applications including e-mail, static(e.g. .html) and dynamic (e.g. .asp) Web pages, and may appear in ad formats such as banners, buttons andinterstitials. Interstitials are included in the rich media category and represent full- or partial-page text and image
server-push advertisements which appear in the transition between two pages of content. Forms of interstitials caninclude splash screens, page takeovers and pop-up windows.
Digital VideoCommercials
TV-like advertisements that may appear as in-page video commercials or before, during, and/or after a variety of content in a player environment including but not limited to, streaming video, animation, gaming, and music videocontent. This definition includes digital video commercials that appear in live, archived and downloadablestreaming content.
Mobile Advertising
Advertising tailored to and delivered through wireless mobile devices such as smartphones (e.g. Blackberry,iPhone, Android), feature phones (e.g. lower-end mobile phones capable of accessing mobile content), and mediatablets (e.g. iPad, Samsung Galaxy Tab). Typically taking the form of static or rich media display ads, textmessaging ads, search ads, or audio/video spots, such advertising generally appears within mobile websites (e.g.
websites optimized for viewing on mobile devices), mobile applications (e.g. applications for smartphones runningiOS, Android, or other operating systems, or Java or BREW applications), text messaging services (i.e. SMS, MMS)or within mobile search results (i.e., 411 listings, directories, mobile-optimized search engines). Mobileadvertising revenues are currently reported within the above pre-existing advertising formats, but have beenestimated and identified individually within this report.
Definitions of advertising formats Appendix
8/7/2019 Internet Advertising Burea Wordwide Digital Marketing Spending by Industrt and Ad formats
http://slidepdf.com/reader/full/internet-advertising-burea-wordwide-digital-marketing-spending-by-industrt 24/28
24PwC
Appendix
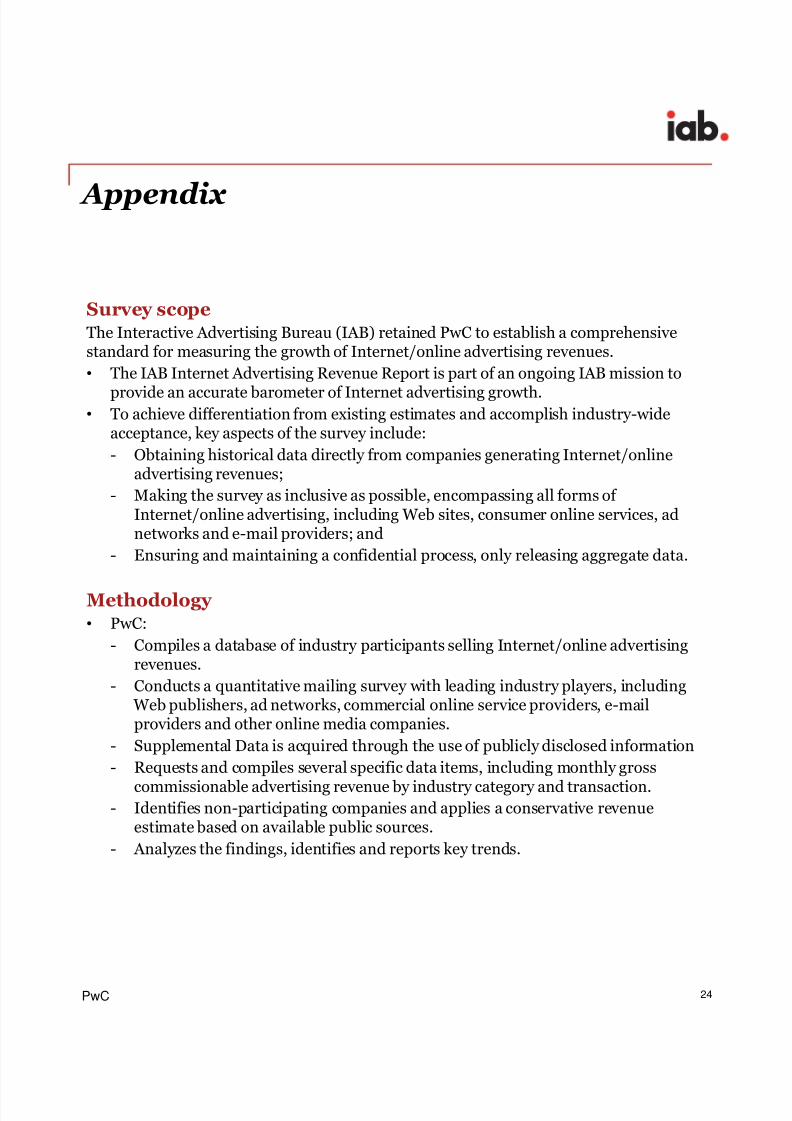
Survey scopeThe Interactive Advertising Bureau (IAB) retained PwC to establish a comprehensivestandard for measuring the growth of Internet/online advertising revenues.
• The IAB Internet Advertising Revenue Report is part of an ongoing IAB mission to
provide an accurate barometer of Internet advertising growth.• To achieve differentiation from existing estimates and accomplish industry-wide
acceptance, key aspects of the survey include:
- Obtaining historical data directly from companies generating Internet/onlineadvertising revenues;
- Making the survey as inclusive as possible, encompassing all forms of Internet/online advertising, including Web sites, consumer online services, adnetworks and e-mail providers; and
- Ensuring and maintaining a confidential process, only releasing aggregate data.
Methodology • PwC:
- Compiles a database of industry participants selling Internet/online advertisingrevenues.
- Conducts a quantitative mailing survey with leading industry players, including Web publishers, ad networks, commercial online service providers, e-mailproviders and other online media companies.
- Supplemental Data is acquired through the use of publicly disclosed information
- Requests and compiles several specific data items, including monthly gross
commissionable advertising revenue by industry category and transaction.- Identifies non-participating companies and applies a conservative revenue
estimate based on available public sources.
- Analyzes the findings, identifies and reports key trends.
8/7/2019 Internet Advertising Burea Wordwide Digital Marketing Spending by Industrt and Ad formats
http://slidepdf.com/reader/full/internet-advertising-burea-wordwide-digital-marketing-spending-by-industrt 25/28
25PwC
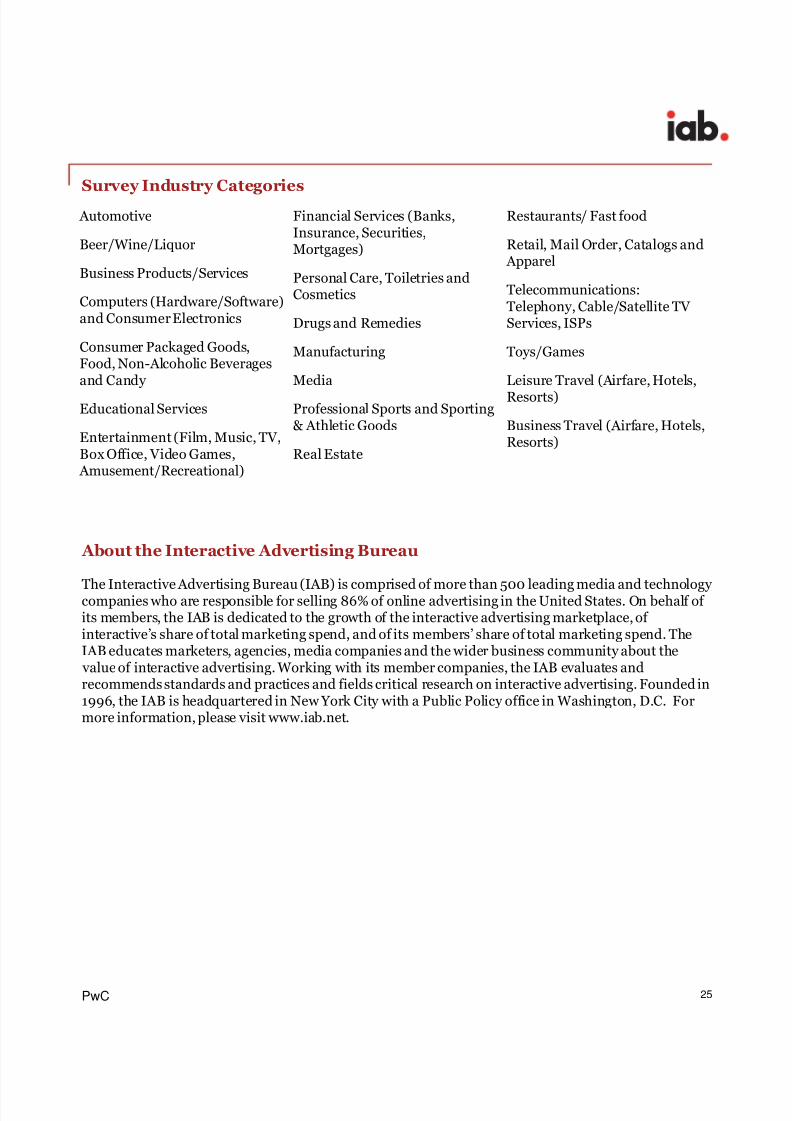
Survey Industry Categories
Automotive
Beer/Wine/Liquor
Business Products/Services
Computers (Hardware/Software)and Consumer Electronics
Consumer Packaged Goods,Food, Non-Alcoholic Beveragesand Candy
Educational Services
Entertainment (Film, Music, TV,Box Office, Video Games,
Amusement/Recreational)
Financial Services (Banks,Insurance, Securities,Mortgages)
Personal Care, Toiletries andCosmetics
Drugs and Remedies
Manufacturing
Media
Professional Sports and Sporting& Athletic Goods
Real Estate
Restaurants/ Fast food
Retail, Mail Order, Catalogs and Apparel
Telecommunications:Telephony, Cable/Satellite TV Services, ISPs
Toys/Games
Leisure Travel (Airfare, Hotels,
Resorts)
Business Travel (Airfare, Hotels,Resorts)
About the Interactive Advertising Bureau
The Interactive Advertising Bureau (IAB) is comprised of more than 500 leading media and technology companies who are responsible for selling 86% of online advertising in the United States. On behalf of its members, the IAB is dedicated to the growth of the interactive advertising marketplace, of interactive’s share of total marketing spend, and of its members’ share of total marketing spend. TheIAB educates marketers, agencies, media companies and the wider business community about the
value of interactive advertising. Working with its member companies, the IAB evaluates andrecommends standards and practices and fields critical research on interactive advertising. Founded in1996, the IAB is headquartered in New York City with a Public Policy office in Washington, D.C. Formore information, please visit www.iab.net.
8/7/2019 Internet Advertising Burea Wordwide Digital Marketing Spending by Industrt and Ad formats
http://slidepdf.com/reader/full/internet-advertising-burea-wordwide-digital-marketing-spending-by-industrt 26/28
26PwC
Ex-Officio
TreasurerBruce GordonDisney Interactive Media Group
SecretaryJoseph RosenbaumReed Smith LLP
Founding ChairmanRich LeFurgyArcher Advisors
Overall Report Guidance Provided by IAB Leadership
Executive Committee
PresidentRandall RothenbergIAB
Randy KilgoreTremor Media
Dennis WoodsideGoogle
ChairmanBob CarriganIDG Communications, Inc.
David Moore24/7 Real Media, Inc.
Vice ChairPeter NaylorNBC Universal
Rik van der KooiMicrosoft
Board of Directors
Kevin ArrixMTV Networks
Tom ArrixFacebook
John BattelleFederated Media
Alisa BowenThe W all Street Journal DigitalNetwork
David Carey
Hearst Magazines
Jarvis CoffinBurst Media
Louis ConaCondé Nast Media Group
Kevin ConroyUnivision Interactive Media
Greg D’AlbaCNN
Jory Des JardinsBlogHer
Mitch Golubcars.com
Elizabeth HarzElectronic Arts
Jeff HirschAudienceScience
Kathy KayseThe Oprah Winfrey Network(Discovery Networks)
Jeff LevickAOL
Leon Levitt
Cox Newspapers
Chris MaThe Washington Post Company
Greg McCastleAT&T Advanced Ad Solutions
David MorrisCBS Interactive
Martin NisenholtzThe New York Times Company
Mike PerlisForbes Media
James PitaroDisney Interactive Media Group
Randall RothenbergIAB
Scott SchillerComcast Interactive Media
Vivek ShahZiff Davis LLC
Tina SharkeyBabyCenter
Elisa SteeleYahoo!
Nada StirrattMySpace
Bill ToddValueClick
Lisa UtzschneiderAmazon.com
Lauren WienerMeredith
Jeff WilksUSATODAY.com
8/7/2019 Internet Advertising Burea Wordwide Digital Marketing Spending by Industrt and Ad formats
http://slidepdf.com/reader/full/internet-advertising-burea-wordwide-digital-marketing-spending-by-industrt 27/28
27PwC
PwC New Media Group
PwC (www.pwc.com) provides industry-focused assurance, tax and advisory services for public andprivate clients. More than 146,000 people in 150 countries connect their thinking, experience andsolutions to build public trust and enhance value for clients and their stakeholders.
PwC’s New Media Group was the first practice of its kind at a Big Four firm. Currently located in New York, Los Angeles, Boston, Seattle and the Bay Area, our New Media Group includes accounting, taxand consulting professionals who have broad and deep experience in the three areas that converge toform new media: advanced telecommunications, enabling software and contentdevelopment/distribution.
Our services include:
• Business assurance services
• Web audience measurement and advertising delivery auditing and advisory
• IAB Measurement Certification Compliance auditing
• Privacy policy structuring, attestation and compliance advisory
• Mergers & Acquisition assistance
• Tax planning and compliance
• Capital sourcing and IPO assistance
For more information about our New Media Group, contact one of the following PwC professionals:
New York
David SilvermanPartner, Assurance Services646.471.5421
New York
Russ SapienzaPartner, Advisory Services646.471.1517
Boston
Vic PetriPartner, Assurance Services617.478.1698
San Jose
Mike PearlPartner, Assurance [email protected]
Seattle
Suzanne FaulknerPartner, Assurance [email protected]

8/7/2019 Internet Advertising Burea Wordwide Digital Marketing Spending by Industrt and Ad formats
http://slidepdf.com/reader/full/internet-advertising-burea-wordwide-digital-marketing-spending-by-industrt 28/28
www.pwc.com/e&m
This publication has been prepared for general guidance on matters of interest only, and does not constituteprofessional advice. You should not act upon the information contained in this publication without obtaining specificprofessional advice. No representation or warranty (express or implied) is given as to the accuracy or completeness ofthe information contained in this publication, and, to the extent permitted by law, PricewaterhouseCoopers LLP, itsmembers, employees and agents do not accept or assume any liability, responsibility or duty of care for anyconsequences of you or anyone else acting, or refraining to act, in reliance on the information contained in thispublication or for any decision based on it.
© 2011 PricewaterhouseCoopers LLP. All rights reserved. In this document, “PwC” refers to PricewaterhouseCoopers
LLP, which is a member firm of PricewaterhouseCoopers International Limited, each member firm of which is aseparate legal entity.


![INDEX [] · approved consultant list/revision no.3 page 8 of 9. 1.4.9 1.4.10 burea veritas international register of classification of vessel & aircraft arya sgs ...](https://static.documents.pub/doc/80x56/5b8539537f8b9a4a488dd3f4/index-approved-consultant-listrevision-no3-page-8-of-9-149-1410-burea.jpg)

