

Impact of Climate Change on Hydrological Regime
and its consequences in Hydropower Production in
Dudhkoshi Basin, Nepal
JAYA R. PUDASHINE (Research Associate, Geoinformatics Center, AIT)
Prof Mukund.S Babel
Dr. Sangam Shrestha
Dr. Akiyuki Kawasaki
Email : [email protected]

Presentation Outline
Introduction
Study Area
Methodology
Results and discussion
Conclusion
2
Introduction
• Most economic, eco-friendly, mature and reliable renewable
energy source.
• Untapped hydropower potential need to be assessed and utilized.
• Traditional approach of HP planning /assessment provokes many
problems
• Climate change effect in hydropower planning
• Rapidly growing energy demand
• Green house gas emission
• Need of renewable energy source
Hydropower :
3
Objective
To assess the impact of future climate on hydropower
production in the Dudh Koshi Basin using GIS and
hydrological modeling
• To identify the potential sites for different type of HP plant
• To assess spatial and temporal availability of flow at
potential HP sites
• To develop high resolution future climate data for the study
basin
• To analyze the current and future energy production of the
basin
Specific objectives :
4

Study Area
Sapta Koshi Basin
Dudh Koshi basin
• Latitude : 2709’03” - 2806’24”N
• Longitude: 8626’2” - 8642’52” E
• Drainage area : 3718 km2
• Elevation ranges :436 m to 8848 m
• Average rainfall : 2000 mm/year
• Dry Season (Dec-May), Wet Season (Jun-Nov)
• Land use : Forest (31 %) , Snow (21%)
• Soils : LPi (44%), RGe (24%)
Dudh Koshi basin
5
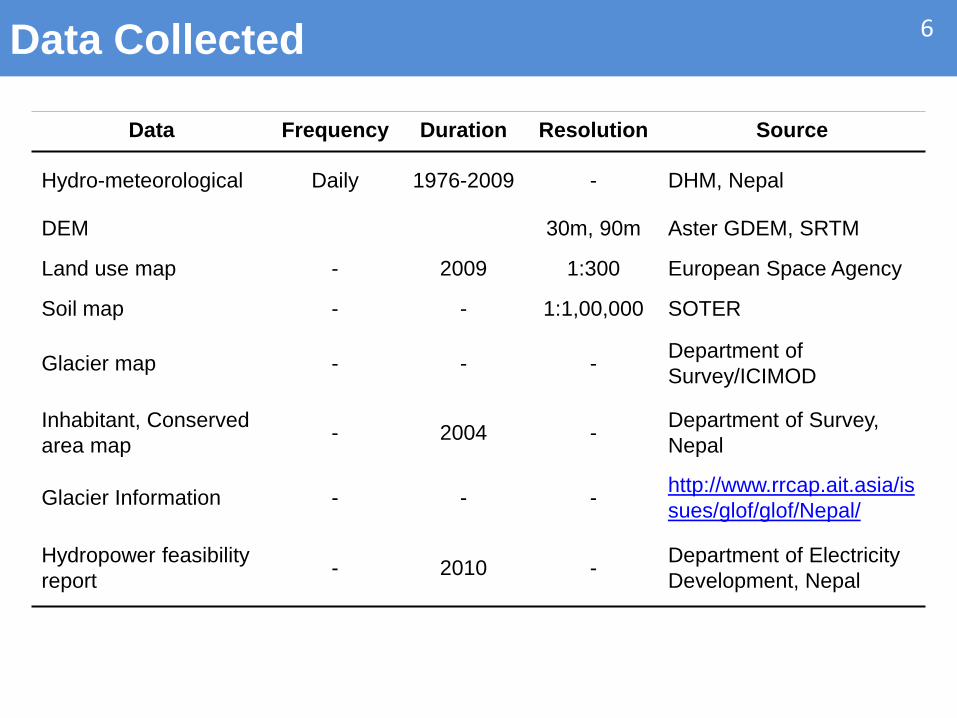
Data Collected
Data Frequency Duration Resolution Source
Hydro-meteorological Daily 1976-2009 - DHM, Nepal
DEM 30m, 90m Aster GDEM, SRTM
Land use map - 2009 1:300 European Space Agency
Soil map - - 1:1,00,000 SOTER
Glacier map - - - Department of
Survey/ICIMOD
Inhabitant, Conserved
area map - 2004 -
Department of Survey,
Nepal
Glacier Information - - - http://www.rrcap.ait.asia/is
sues/glof/glof/Nepal/
Hydropower feasibility
report - 2010 -
Department of Electricity
Development, Nepal
6

Methodological Framework
INPUT
DEM, LU, soil and hydro-
meteorological data
PRE-PROCESSING PHASE
DEM processing, FDR,
FAC, stream definition and
stream order
Setting up criteria to identify
hydropower location
Storage capacity, inundation
area, HH affected, LU affected
Overlay DEM and stream
network
Ranking of the reservoir
sites
Estimate gross head, distance
between weir and HP
Analysis of the result POTENTIAL HP LOCATIONS
(ROR and Reservoir type HPP)
Setting up calibration and
validation of hydrological model
Daily discharge at all
potential location
Energy production estimation
for ROR and Reservoir HP
CURRENT AND FUTURE BASIN
ENERGY PRODUCTION
Reservoir simulation
Future climate data
FDC at 40, 50, 60, 95%
exceedance
Current climatic data
7
Bias correction of
RCM/GCMs

Criteria for site selection
ROR hydropower site:
• Minimum bed slope
• Distance between weir and hydropower plant
• Minimum drainage area
Reservoir hydropower site : o Physical criteria
• Order of stream
• Dam height
• Interval between reservoirs
• Storage capacity and inundation area
o Social criteria
• Number of household inundated
o Environmental criteria
• Area of forest inundated
8
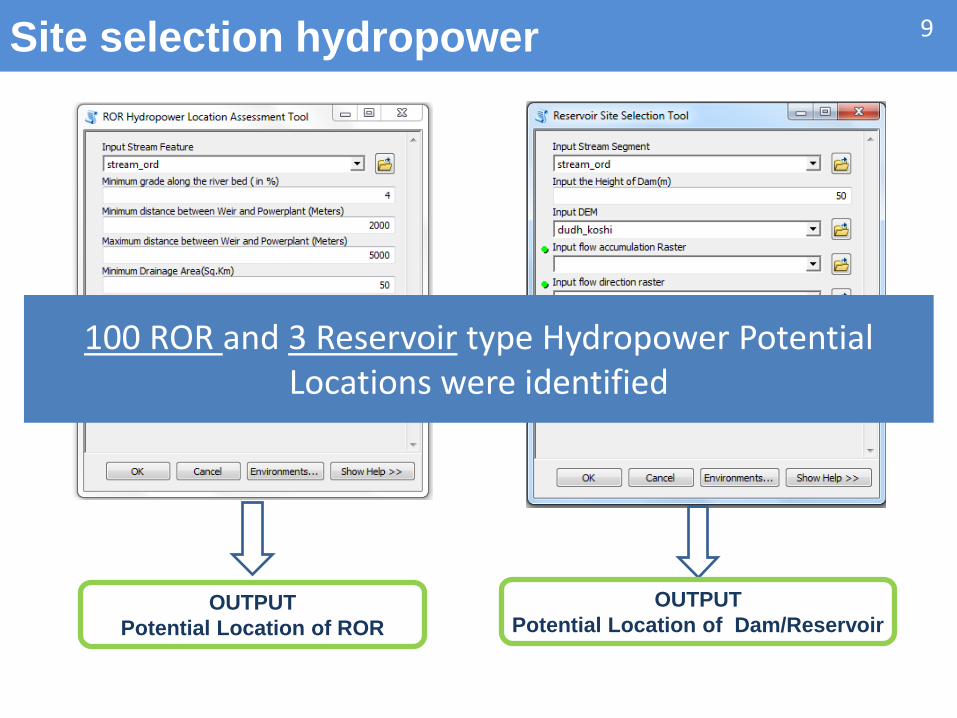
Site selection hydropower
OUTPUT
Potential Location of ROR
9
OUTPUT
Potential Location of Dam/Reservoir
100 ROR and 3 Reservoir type Hydropower Potential Locations were identified

Hydrological Model : SWAT Setup
• Basin Area : 3718 Sq.km
• Sub basins : 102
• HRU : 1121
• 5 Rainfall station & 1 climatic station
• Elevation Band : 4-6
• Warm up period : 1977-1980
• Calibration Period : 1981-1990
• Validation period : 1991-1997
10
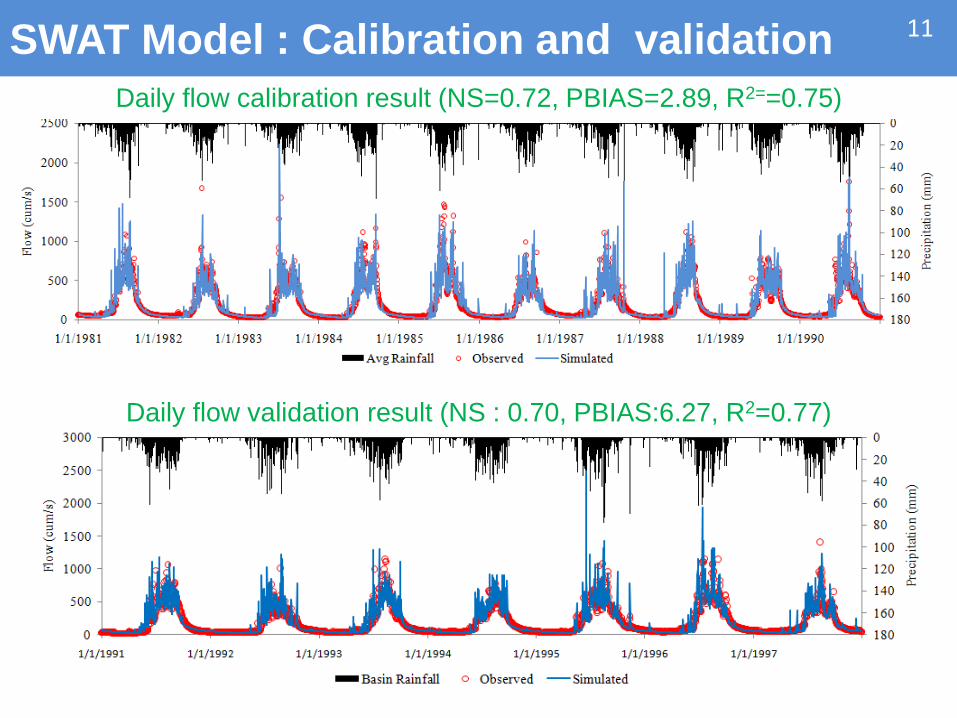
SWAT Model : Calibration and validation
Daily flow calibration result (NS=0.72, PBIAS=2.89, R2==0.75)
Daily flow validation result (NS : 0.70, PBIAS:6.27, R2=0.77)
11
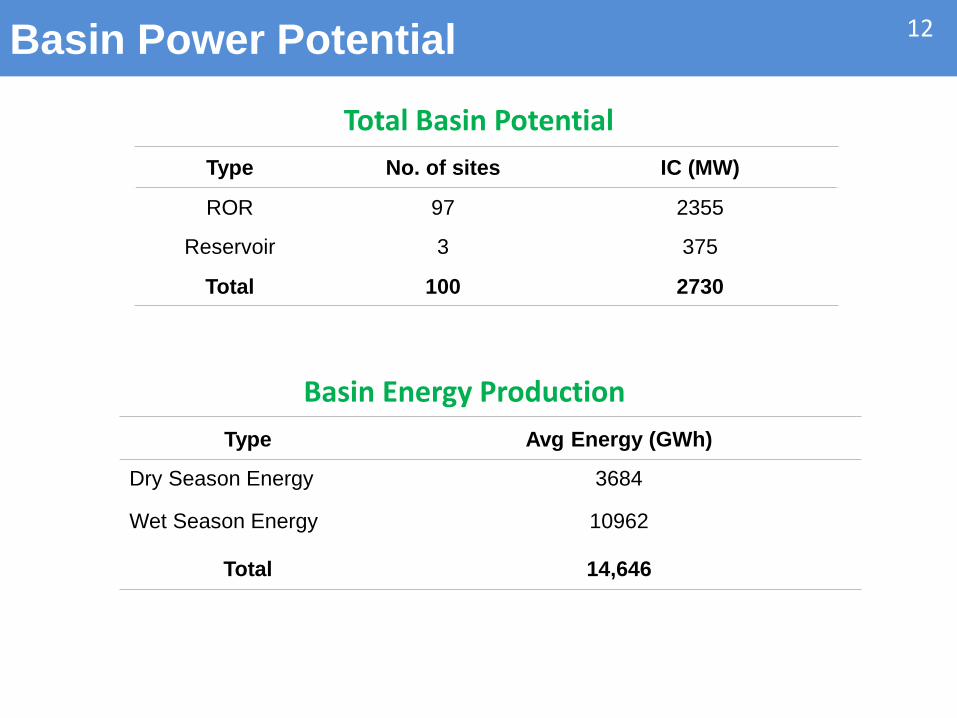
Basin Power Potential
Type No. of sites IC (MW)
ROR 97 2355
Reservoir 3 375
Total 100 2730
Type Avg Energy (GWh)
Dry Season Energy 3684
Wet Season Energy 10962
Total 14,646
Basin Energy Production
12
Total Basin Potential
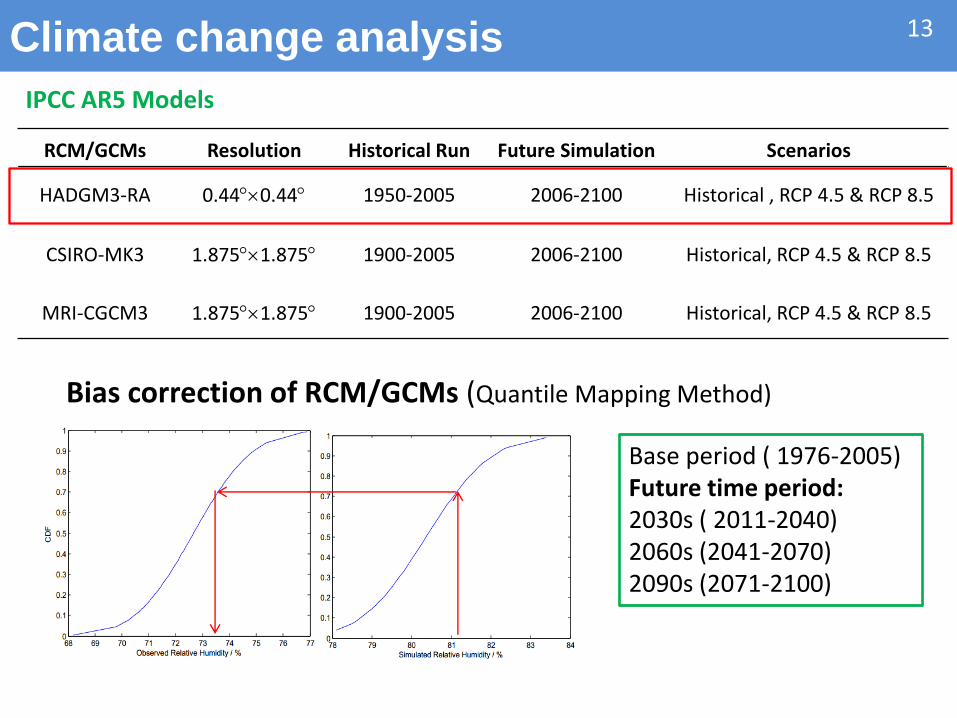
Climate change analysis
RCM/GCMs Resolution Historical Run Future Simulation Scenarios
HADGM3-RA 0.440.44 1950-2005 2006-2100 Historical , RCP 4.5 & RCP 8.5
CSIRO-MK3 1.8751.875 1900-2005 2006-2100 Historical, RCP 4.5 & RCP 8.5
MRI-CGCM3 1.8751.875 1900-2005 2006-2100 Historical, RCP 4.5 & RCP 8.5
IPCC AR5 Models
Bias correction of RCM/GCMs (Quantile Mapping Method)
Base period ( 1976-2005) Future time period: 2030s ( 2011-2040) 2060s (2041-2070) 2090s (2071-2100)
13

Bias Correction of Temperature
0
5
10
15
20
25
30
1 2 3 4 5 6 7 8 9 10 11 12
Max
imum
Tem
per
ature
(°C
)
Month
'Obs Raw Corrected
0
3
6
9
12
15
18
21
1 2 3 4 5 6 7 8 9 10 11 12
Min
. T
emp
erat
ure
(°C
)
Month
Obs Raw Corrected0
0.2
0.4
0.6
0.8
1
0 5 10 15 20 25 30 35C
um
ula
tiv
e D
istr
ibu
tio
n F
un
cti
on
Maximum Temperature (°C)
Raw RCM
Corrected
Observed
GCM/RCM HADGEM3 CSIRO MRI-CGCM3
Temperature Max Min Max Min Max Min
R2 0.79 0.94 0.74 0.95 0.75 0.94
RMSE (mm) 1.81 1.09 2.03 0.99 2.04 1.11
Performance of bias correction
Comparison of observed max & min temp with Raw and corrected RCM
14

Precipitation correction
Comparison of observed, raw and bias corrected GCM/RCM for station 1202
Comparison of observed and bias corrected mean monthly precipitation for station 1202
0
2
4
6
8
10
12
14
16
18
20
Jan Feb Mar Apr May Jun Jul Aug Sep Oct Nov Dec
Mea
n ra
infa
ll(m
m/d
ay)
Obs
Raw HADGEM3
Corrected
0
2
4
6
8
10
12
14
16
18
20
Jan Feb Mar Apr May Jun Jul Aug Sep Oct Nov Dec
Mea
n r
ain
fall (m
m/d
ay
)
Observed
Raw CSIRO
Corrected
0
5
10
15
20
25
30
35
Jan Feb Mar Apr May Jun Jul Aug Sep Oct Nov Dec
Mea
n ra
infa
ll(m
m/d
ay)
Obs
Raw CGCM3
Corrected
0
200
400
600
800
1000
1200
Jan-76 Jan-78 Jan-80 Jan-82 Jan-84 Jan-86 Jan-88 Jan-90 Jan-92 Jan-94 Jan-96 Jan-98 Jan-00 Jan-02 Jan-04
Bias Corrected Observed
15

0.0
1.0
2.0
3.0
4.0
5.0
2030s 2060s 2090s
Rel
ati
ve
cha
ng
e in
Tem
p (°C
)
HADGEM3 CSIRO CGCM3
Future climate prediction
0.0
1.0
2.0
3.0
4.0
5.0
2030s 2060s 2090s
Rel
ati
ve
cha
ng
e in
Tem
p (°C
)
HADGEM3 CSIRO CGCM3
Change in average temperature for different future period
Change in average basin precipitation for different future period
0
2
4
6
8
10
12
14
16
18
20
2030s 2060s 2090s
Rel
ati
ve(
%)
cha
ng
e in
pre
cip
ita
tio
n HADGEM3 CSIRO CGCM3
0
2
4
6
8
10
12
14
16
18
20
2030s 2060s 2090s
Rel
ati
ve(
%)
cha
ng
e in
pre
cip
ita
tio
n HADGEM3 CSIRO CGCM3
16
RCP 4.5 RCP 8.5
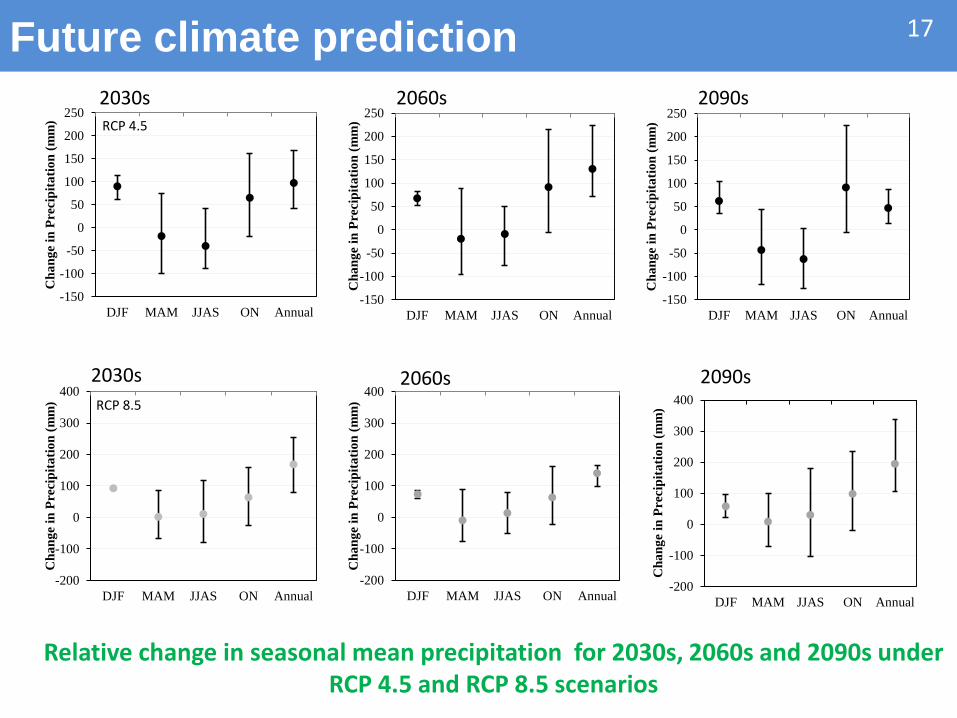
Future climate prediction
Relative change in seasonal mean precipitation for 2030s, 2060s and 2090s under RCP 4.5 and RCP 8.5 scenarios
-150
-100
-50
0
50
100
150
200
250
DJF MAM JJAS ON Annual
Ch
an
ge
in P
reci
pit
ati
on
(m
m)
-150
-100
-50
0
50
100
150
200
250
DJF MAM JJAS ON Annual
Ch
an
ge i
n P
recip
ita
tio
n (
mm
)
-150
-100
-50
0
50
100
150
200
250
DJF MAM JJAS ON Annual
Ch
an
ge
in P
reci
pit
ati
on
(m
m)
-200
-100
0
100
200
300
400
DJF MAM JJAS ON Annual
Ch
an
ge
in P
reci
pit
ati
on
(m
m)
-200
-100
0
100
200
300
400
DJF MAM JJAS ON Annual
Ch
an
ge
in P
reci
pit
ati
on
(m
m)
-200
-100
0
100
200
300
400
DJF MAM JJAS ON Annual
Ch
an
ge i
n P
recip
ita
tio
n (
mm
)
2030s 2060s 2090s RCP 4.5
RCP 8.5
2030s 2060s 2090s
17
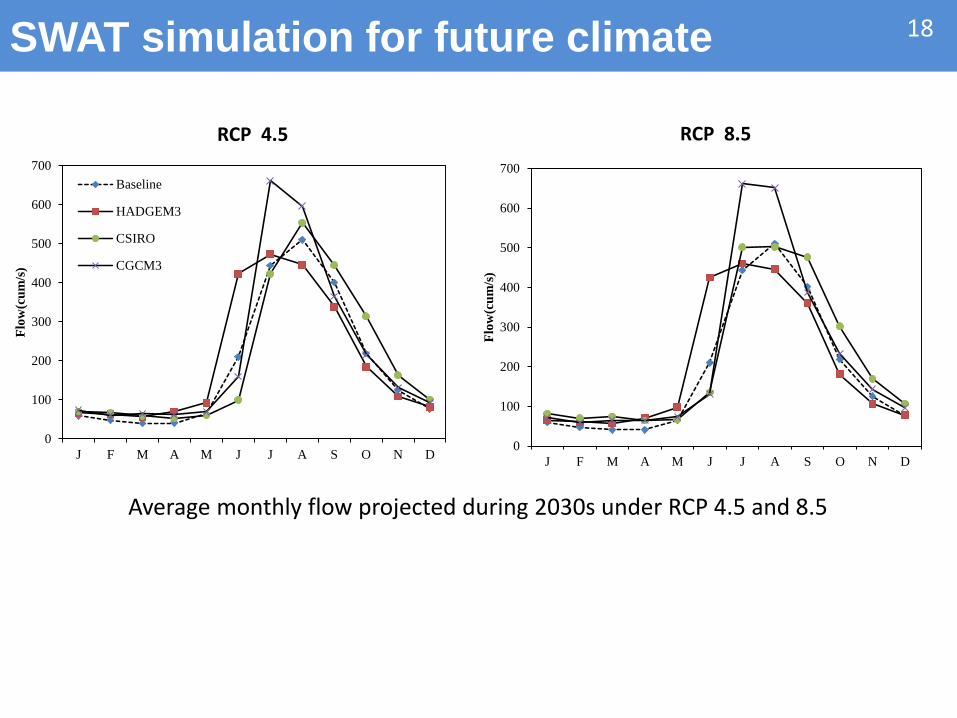
SWAT simulation for future climate
Average monthly flow projected during 2030s under RCP 4.5 and 8.5
0
100
200
300
400
500
600
700
J F M A M J J A S O N D
Flo
w(c
um
/s)
Baseline
HADGEM3
CSIRO
CGCM3
0
100
200
300
400
500
600
700
J F M A M J J A S O N D
Flo
w(c
um
/s)
18
RCP 4.5 RCP 8.5

CC impact on basin power potential
During 2030s (2011-2040)
RCM/GCMs
RCP 4.5 RCP 8.5
2030s 2060s 2090s 2030s 2060s 2090s
HADGEM 3 5.06 % 0.41 % -7.80 % 10.54 % 6.25 % -5.49 %
CSISO 2.76 % 20.86 % 8.71 % 14.46 % 16.77 % 18.37 %
CGCM3 2.90 % 3.90 % 1.03 % 10.07 % 7.49 % 27.11 %
0
10
20
30
40
50
60
70
Dry Wet Total
% c
ha
ng
e i
n e
ne
rgy p
rod
ucti
on
HADGEM3
CSIRO
CGCM3
0
10
20
30
40
50
60
70
Dry Wet Total
% c
han
ge i
n e
nerg
y p
rod
ucti
on
HADGEM3
CSIRO
CGCM3
Relative change in seasonal energy production of total basin under climate change scenarios
Relative change (%) in total basin energy production relative to baseline for future period
19
RCP 4.5 RCP 8.5
Summary and Conclusion
• Total basin power potential : 2730MW (97 ROR and 3 reservoir hydropower plants)
• Temperature is predicted to increase up to 1C and precipitation is
predicted to increase up from 2 to 12 percent during 2011-2040.
• Total basin energy production is predicted to increase until 2040 by 5 % under RCP 4.5 ,14 % under RCP 8.5 and up to 23 percent until
the end of this century
20

THANK YOU
21


