
LIFE INSURANCE BUSINESS
IN JAPAN
The Life Insurance Association of Japan
2016-2017

Life Insurance Business in Japan at a Glance
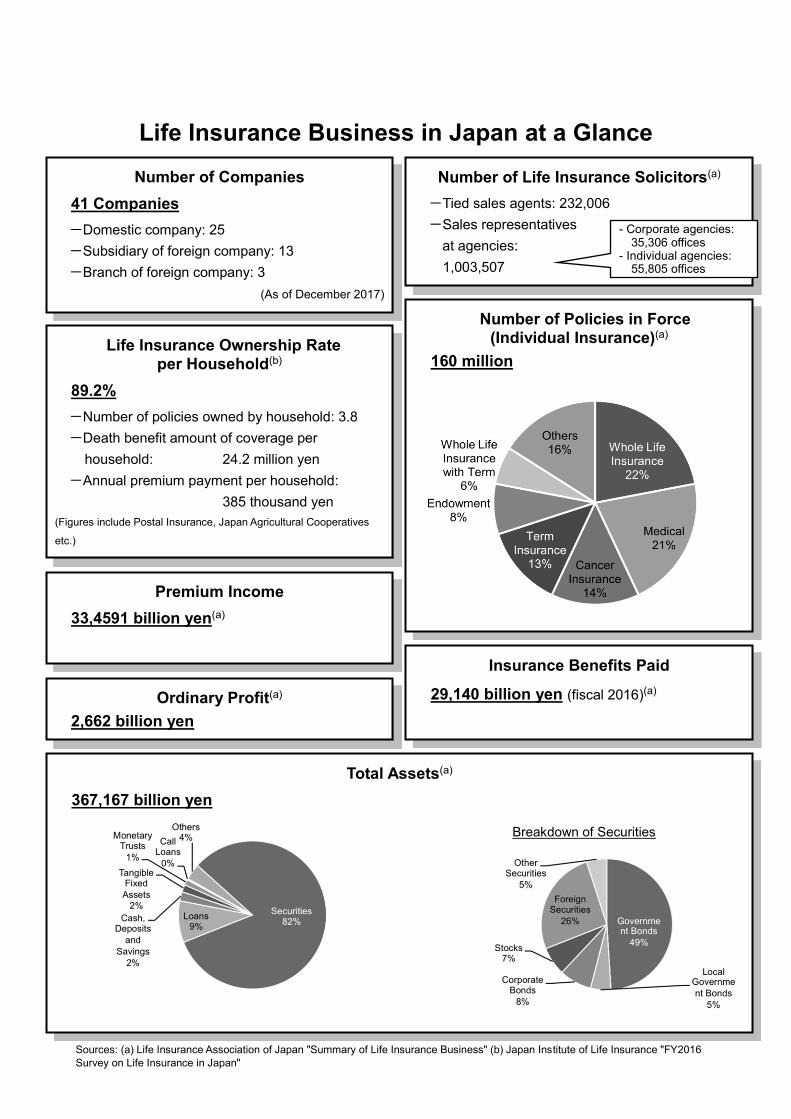
Number of Companies
41 Companies
-Domestic company: 25
-Subsidiary of foreign company: 13
-Branch of foreign company: 3
(As of December 2017)
Life Insurance Ownership Rate per Household(b)
89.2%
-Number of policies owned by household: 3.8
-Death benefit amount of coverage per
household: 24.2 million yen
-Annual premium payment per household:
385 thousand yen
(Figures include Postal Insurance, Japan Agricultural Cooperatives
etc.)
Ordinary Profit(a)
2,662 billion yen
Number of Life Insurance Solicitors(a)
-Tied sales agents: 232,006
-Sales representatives
at agencies:
1,003,507
Sources: (a) Life Insurance Association of Japan "Summary of Life Insurance Business" (b) Japan Institute of Life Insurance "FY2016
Survey on Life Insurance in Japan"
Premium Income
33,4591 billion yen(a)
Number of Policies in Force (Individual Insurance)(a)
160 million
Insurance Benefits Paid
29,140 billion yen (fiscal 2016)(a)
Total Assets(a)
367,167 billion yen
- Corporate agencies: 35,306 offices - Individual agencies: 55,805 offices
Breakdown of Securities
Table of Contents
Part 1 Life Insurance in Numbers ··································· 1
Part 2 The Life Insurance Association of Japan (LIAJ) ·
·················································································· 37
1. The LIAJ’s Topics for Fiscal 2016 ····························· 38
1. Promotion of Friendly Life Insurance Services for the Elderly ······ 38
2. Promotion of Insurance Education ······································ 39
2. The LIAJ's Key Activities ········································ 42
1. Activities to Provide Information and Promote Understanding on
the Life Insurance Business ············································· 42
2. Consultation Services, Complaint Processing and Dispute
Resolution Operations regarding Life Insurance Business ········· 43
3. Activities regarding Systems and Measures to Ensure
Appropriate Operation of the Life Insurance Business ·············· 45
4. Activities regarding Education and Training for the Staff of
Member Companies ······················································· 51
5. Activities regarding Making Requests and Proposals to relevant
Authorities, Agencies and Organizations ······························ 52
6. Activities to Fulfill Social Responsibilities····························· 54
3. The LIAJ’s Organization Profile ································ 56
Note: In this document, the LIAJ's activities are categorized in accordance with its Business
Plan for Fiscal Year 2016. This “Life Insurance Business in Japan” does not specifically introduce (V) Research and study activities regarding the theory and practice of life insurance and (VIII) Other activities considered necessary to achieve the goals of the LIAJ.

1
Part 1
Life Insurance in Numbers
(Reprint of Life Insurance Fact Book 2017)
2
Introduction
The Life Insurance Fact Book summarizes key performance indicators of life
insurance companies operating in Japan. We hope that this report will provide a
better understanding of the life insurance business in Japan.
Please note that the data of Japan Post Insurance has been included in the
figures since fiscal 2008; therefore, some figures show the data excluding Japan
Post Insurance in order to maintain continuity with the previous data before its
inclusion. The data of Japan Post Insurance is not included in figures for fiscal
2007 and 2008 for the purpose of counting years (e.g. “for the Xth successive
years” or “for the first time in X years”).
In addition to this report, the LIAJ provides detailed statistical data of the life
insurance market in Japan; please refer to such data as necessary.
*The LIAJ is not responsible for any losses that may occur through the use of the
information contained in this CD-ROM.
3
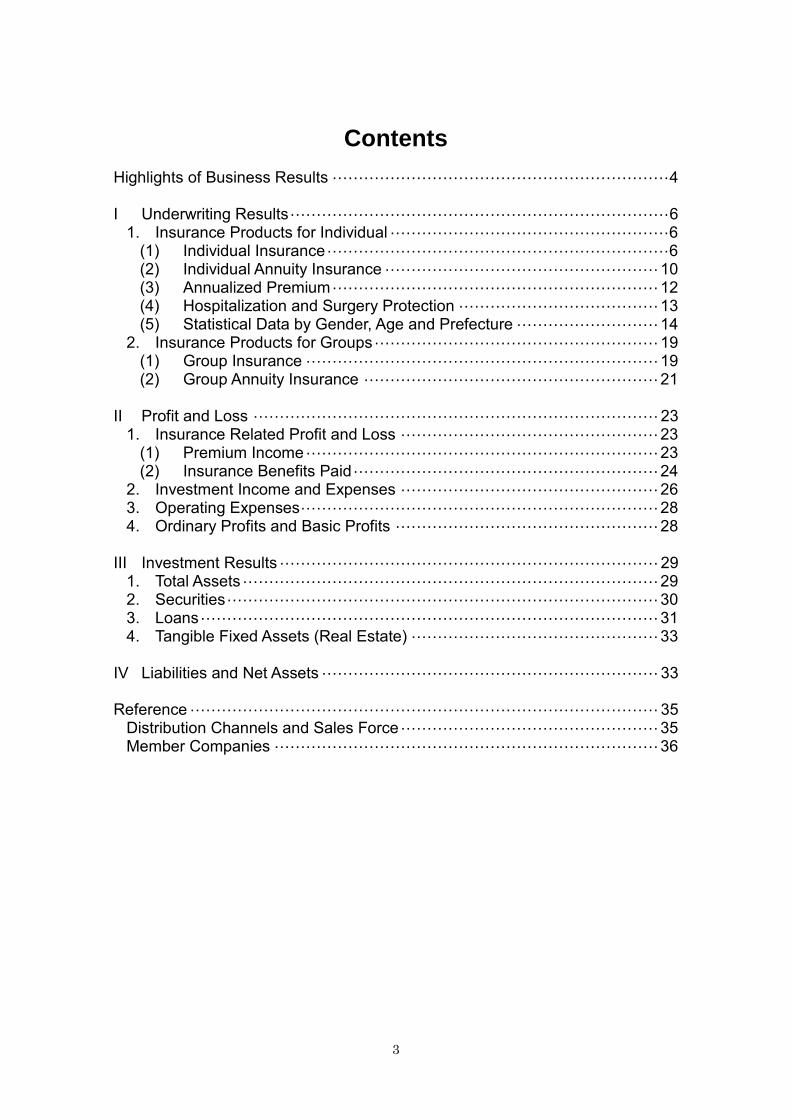
Contents
Highlights of Business Results ································································ 4
I Underwriting Results ········································································ 6 1. Insurance Products for Individual ····················································· 6
(1) Individual Insurance ································································· 6 (2) Individual Annuity Insurance ···················································· 10 (3) Annualized Premium ······························································ 12 (4) Hospitalization and Surgery Protection ······································ 13 (5) Statistical Data by Gender, Age and Prefecture ··························· 14
2. Insurance Products for Groups ······················································ 19 (1) Group Insurance ··································································· 19 (2) Group Annuity Insurance ························································ 21
II Profit and Loss ············································································· 23
1. Insurance Related Profit and Loss ················································· 23 (1) Premium Income ··································································· 23 (2) Insurance Benefits Paid ·························································· 24
2. Investment Income and Expenses ················································· 26 3. Operating Expenses ···································································· 28 4. Ordinary Profits and Basic Profits ·················································· 28
III Investment Results ········································································ 29
1. Total Assets ··············································································· 29 2. Securities ·················································································· 30 3. Loans ······················································································· 31 4. Tangible Fixed Assets (Real Estate) ··············································· 33
IV Liabilities and Net Assets ································································ 33
Reference ························································································· 35
Distribution Channels and Sales Force ················································· 35 Member Companies ········································································· 36

4
Highlights of Business Results - The Trend of Individual Insurance Policies -
As of the end of fiscal 2016, the amount of policies in force (the amount of coverage for major protections such as death protection) for individual insurance was 862,905 billion yen (100.5% y/y) and increased from the previous year for the second successive year. The number of policies in force as of the end of fiscal 2016 was 167.72 million, increasing for the ninth successive year. Though the amount of new policies (including converted contracts) decreased from the previous year to 68,478 billion yen (98.8% y/y),decrease in lapses and surrenders owing to insurers’ efforts over the past years to maintain existing policies lead to the increase in policies in force. As to the type of new policies for individual policies in terms of amount (excluding converted contracts), suspension of savings-type products due to the lower domestic interest rates and consequent lower assumed interest rates for single-premium products resulted in the decreased sale particularly for whole life insurance from the previous year. Meanwhile, the sales of term insurance, which is largely protection-based, increased from the previous year to 35,977 billion yen (112.8%y/y). (See: pages 6 to 9) y/y)
As to the annualized premium (the amount of premium income which a life insurer would receive in one year, under the assumption that premium is equally divided and paid throughout the entire contract period) of policies in force, it amounted to 27.4 trillion yen (including 6.2 trillion yen for "third-sector") at the end of fiscal 2016, increasing steadily since fiscal 2006 when the record started. With small amount insurance products of policies increasing such as medical insurance, annualized premium is referred to as an additional indicator that supports the amount of policies.(See: page 12)
Note: The amount of annualized premium of "third-sector" includes the amount of premium to be allocated for paying medical coverage (e.g. benefits for hospitalization/surgery), living benefits (e.g. benefits for specified disease/long-term care), and premium waiver benefits (e.g. benefits due to specified disease or long-term care, but excluding disability).
19.2
31.8
4.9
2.4
16.6
35.9
5.1
1.5
0
5
10
15
20
25
30
35
40
Whole Life
Insurance
(Total)
Term
Insurance
Endowment
Insurance
Variable
Insurance
(trillion yen)Amount of newpolicies (fiscal2015)
Amount of newpolicies (fiscal2016)
Note: "Whole Life Insurance (Total)" includes whole life insurance, whole life with term rider and whole life with variable accumulation rate.
19.4 19.8 20.4 21.3 21.7 22.7 23.8 24.4 25.2 26.1 27.4
4.4 4.5 4.7 4.8 5.0 5.2 5.3 5.5 5.7 5.9 6.2
0.0
5.0
10.0
15.0
20.0
25.0
30.0
2006 2007 2008 2009 2010 2011 2012 2013 2014 2015 2016
(trillion yen)Annualized Premium of Policies in Force
"Third-Sector"
Note: Including individual annuity insurance
861 857 862
0
20
40
60
80
100
120
140
160
180
0
100
200
300
400
500
600
700
800
900
1,000
2012 2013 2014 2015 2016
百万
Amount of Policies in Force
Number of Policies in Force
(million)
865 858
(trillion yen)
5
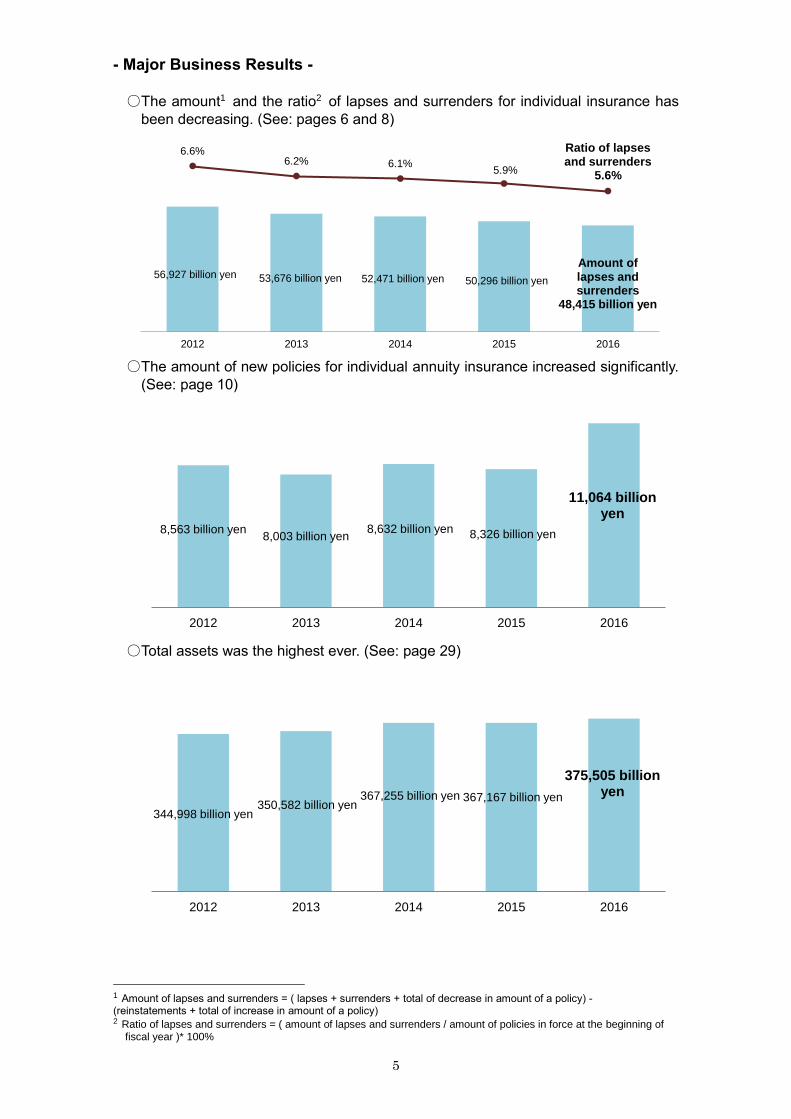
- Major Business Results - ○The amount1 and the ratio2 of lapses and surrenders for individual insurance has
been decreasing. (See: pages 6 and 8)
○The amount of new policies for individual annuity insurance increased significantly.
(See: page 10)
○Total assets was the highest ever. (See: page 29)
1 Amount of lapses and surrenders = ( lapses + surrenders + total of decrease in amount of a policy) - (reinstatements + total of increase in amount of a policy) 2 Ratio of lapses and surrenders = ( amount of lapses and surrenders / amount of policies in force at the beginning of
fiscal year )* 100%
56,927 billion yen 53,676 billion yen 52,471 billion yen 50,296 billion yen
Amount of lapses and surrenders
48,415 billion yen
6.6%6.2% 6.1%
5.9%
Ratio of lapses and surrenders
5.6%
2012 2013 2014 2015 2016
8,563 billion yen8,003 billion yen
8,632 billion yen 8,326 billion yen
11,064 billion yen
2012 2013 2014 2015 2016
344,998 billion yen350,582 billion yen
367,255 billion yen 367,167 billion yen
375,505 billion yen
2012 2013 2014 2015 2016

6
I Underwriting Results
1 Insurance Products for Individual3
(1) Individual Insurance
I. New Policies
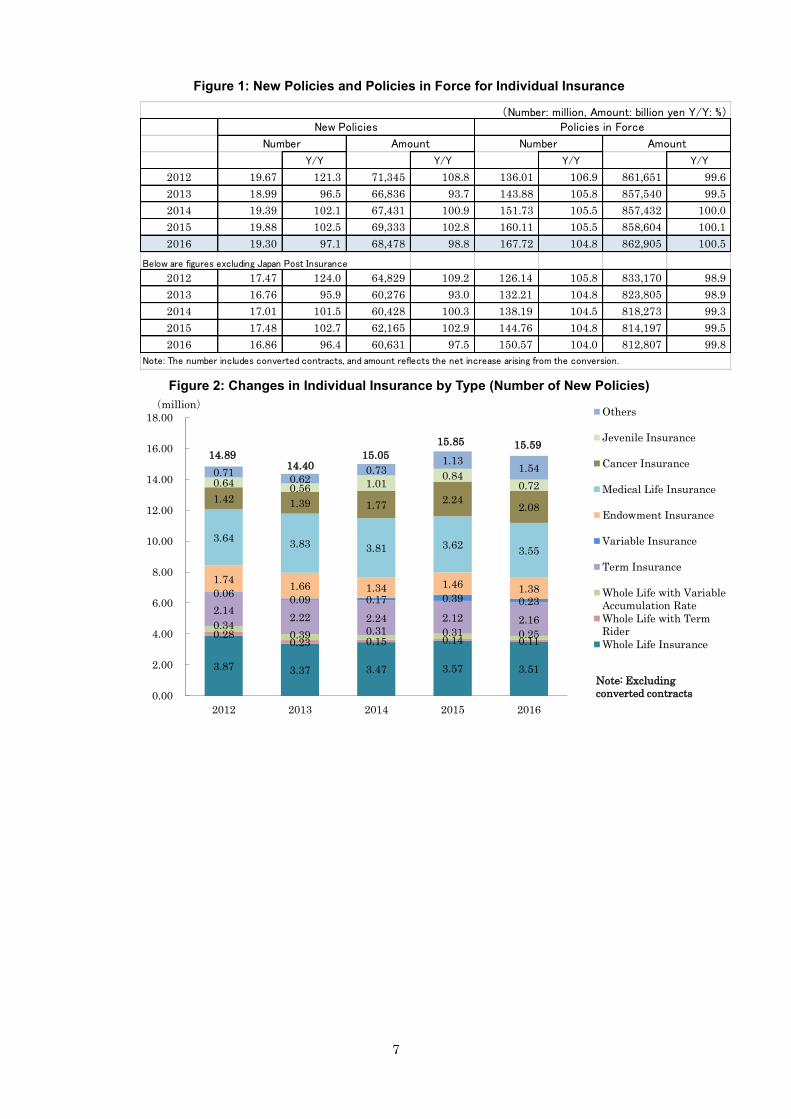
The number of new policies for individual insurance (including converted contracts) was 19.3 million (97.1% y/y), and the new policies amount4 (reflecting the net increase arising from the conversion) was 68,478billion yen (98.8% y/y). [Figure 1]
Both the number and the amount of new policies decreased from the previous year in fiscal 2016 notwithstanding the increase trend over the several years supported by increased sales of medical insurance and whole life insurance. This turn-around reflects the negative developments such as suspended sales of single premium payment products due to the reduction in the standard assumed interest rate for such products following the further downward shift of the yield in the domestic investment market.
By type of new policies for individual insurance (excluding converted contracts), medical insurance ranked top in number (3.55 million, 22.8% of the total), followed by whole life insurance (3.51 million, 22.5%), term insurance (2.16 million, 13.9%), cancer insurance (208 million, 13.4%), and endowment insurance (1.38 million, 8.9%), with the ranks switched between term insurance and cancer insurance from the previous year. [Figure 2]
Of the total amount of new policies for individual insurance (excluding converted contracts), term insurance ranked top (35,977 billion yen, 48.9% of the total), followed by whole life insurance (14,377 billion yen, 19.5%), endowment insurance (5,194 billion yen, 7.1%), Juvenile insurance(1,781billion, 2.4%), variable insurance (1,558 billion, 2.1%), with Juvenile insurance moving up in the ranking. [Figure 3]
II. Policies in Force
The number of policies in force for individual insurance was 167.72 million (104.8% y/y), and the amount of policies in force was 862,905 billion yen (100.5% y/y). [Figure 1]
The number of policies in force increased for the ninth successive year. Despite the fact that the insured amount of policies in force had been decreasing due to the current trend of increasing medical protection while reducing death protection, it increased for the second successive year.
As for the number of policies in force for individual insurance, whole life insurance ranked top (36.59 million, 21.8% of the total), followed by medical insurance (35.29 million, 21.0%), cancer insurance (23.90 million, 14.3%), term insurance (21.19 million, 12.6%), endowment insurance (13.89 million, 8.3%) and whole life insurance with term rider (9.85 million, 5.9%). [Figure 4]
Of the total amount of policies in force for individual insurance, term insurance ranked top (268,940 billion yen, 31.2% of the total), followed by whole life insurance(176,659 billion yen, 20.5%), whole life insurance with term rider (120,368 billion yen, 13.9%), whole life insurance with variable accumulation rate (69,593 billion yen, 8.1%) and endowment insurance (45,407 billion yen, 5.3%). [Figure 5]
III. Lapses and Surrenders
The amount5 and the ratio6 of lapses and surrenders for individual insurance were 48,415 billion yen (96.3% y/y) and 5.6% (down by 0.3 points from the previous year). [Figure 6]
The amount and the ratio of lapses and surrenders decreased for the fifteenth successive year and eighth successive year, respectively.
3 The business result of individual insurance and individual annuity insurance includes those policies under which
policyholder is a corporate body and the insured is a member of the management (so-called "key person insurance"). 4 The amount of major protections such as a death protection. 5 Amount of lapses and surrenders = ( lapses + surrenders + total of decrease in amount of a policy) -
(reinstatements + total of increase in amount of a policy) 6 Ratio of lapses and surrenders = ( amount of lapses and surrenders / amount of policies in force at the beginning of
fiscal year )* 100%
7
Figure 1: New Policies and Policies in Force for Individual Insurance
Figure 2: Changes in Individual Insurance by Type (Number of New Policies)
Y/Y Y/Y Y/Y Y/Y
2012 19.67 121.3 71,345 108.8 136.01 106.9 861,651 99.6
2013 18.99 96.5 66,836 93.7 143.88 105.8 857,540 99.5
2014 19.39 102.1 67,431 100.9 151.73 105.5 857,432 100.0
2015 19.88 102.5 69,333 102.8 160.11 105.5 858,604 100.1
2016 19.30 97.1 68,478 98.8 167.72 104.8 862,905 100.5
Below are figures excluding Japan Post Insurance
2012 17.47 124.0 64,829 109.2 126.14 105.8 833,170 98.9
2013 16.76 95.9 60,276 93.0 132.21 104.8 823,805 98.9
2014 17.01 101.5 60,428 100.3 138.19 104.5 818,273 99.3
2015 17.48 102.7 62,165 102.9 144.76 104.8 814,197 99.5
2016 16.86 96.4 60,631 97.5 150.57 104.0 812,807 99.8
Note: The number includes converted contracts, and amount reflects the net increase arising from the conversion.
(Number: million, Amount: billion yen Y/Y: %)New Policies Policies in Force
Number Amount Number Amount
3.87 3.37 3.47 3.57 3.51
0.28 0.23 0.15 0.14 0.11
0.34 0.39 0.31 0.31 0.25
2.14 2.22 2.24 2.12 2.16
0.06 0.09 0.17 0.39 0.23
1.74 1.66 1.34 1.46 1.38
3.64 3.83 3.81 3.62
3.55
1.42 1.39 1.77 2.24
2.08
0.64 0.56 1.01
0.84 0.72
0.71 0.62
0.73 1.13
1.54
0.00
2.00
4.00
6.00
8.00
10.00
12.00
14.00
16.00
18.00
2012 2013 2014 2015 2016
(million)Others
Jevenile Insurance
Cancer Insurance
Medical Life Insurance
Endowment Insurance
Variable Insurance
Term Insurance
Whole Life with Variable
Accumulation Rate
Whole Life with Term
Rider
Whole Life Insurance
15.5914.89
14.4015.05
15.85
Note: Excluding
converted contracts

8
Figure 3: Changes in Individual Insurance by Type (Amount of New Policies)
Figure 4: Changes in Individual Insurance by Type (Number of Policies in Force)
17.4 14.5 15.2 15.5 14.3
3.9 2.4 1.6 1.2 0.8
2.6 3.6 2.9 2.4
1.3
31.4
29.0 31.0 31.8 35.9
0.4
0.6 1.0 2.4 1.5
5.6
5.3 4.6 4.9 5.1
0.2
0.2 0.2 0.1 0.1
0.01
0.01 0.02 0.02 0.02 1.3
1.2 2.2 2.0 1.7
9.9
10.4 10.6
12.5 12.3
0
10
20
30
40
50
60
70
80
2012 2013 2014 2015 2016
(trillion yen)Others
Jevenile Insurance
Cancer Insurance
Medical Insurance
Endowment Insurance
Variable Insurance
Term Insurance
Whole Life with Variable
Accumulation RateWhole Life with Term Rider
Whole Life Insurance
73.2 73.673.269.9
67.7
26.42 29.01 31.51 34.10 36.59
12.29 11.66 10.99 10.41 9.85 7.58 7.51 7.07 6.75 6.45 14.32 16.52 18.44 19.89 21.19 1.47
1.51 1.63
1.98 2.16
11.60 12.38
12.84 13.41
13.89 27.78
29.98 31.94
33.70 35.29
20.54 21.16
21.97 23.14
23.90
5.88
6.03 6.65
7.15 7.54
8.09
8.07 8.63
9.54 10.82
0.00
20.00
40.00
60.00
80.00
100.00
120.00
140.00
160.00
180.00
2012 2013 2014 2015 2016
(million) Others
Jevenile Insurance
Cancer Insurance
Medical Insurance
Endowment Insurance
Variable Insurance
Term Insurance
Whole Life with Variable
Accumulation Rate
Whole Life with Term
Rider
While Life Insurance
167.72
136.01
143.88151.73
160.11

9
Figure 5: Changes in Individual Insurance by Type (Amount of Policies in Force)
Figure 6: Changes in Amount and Ratio of Lapses and Surrenders of Individual Insurance
135 146 157 167 176
194 174 154 136 120
112 104 91 80 69
204 220 237 252 268
10 10 11 12 14
38 40 42 43 45 4 4 4 4 3
2 2 2 2 1
13 13 14 15 16 145 139 141 143 145
0
200
400
600
800
1,000
2012 2013 2014 2015 2016
(trillion yen)
Others
Jevenile Insurance
Cancer Insurance
Medical Insurance
Endowment Insurance
Variable Insurance
Term Insurance
Whole Life with Variable
Accumulation RateWhole Life with Term
Rider
862858857857861
56,927 53,676 52,471 50,296 48,415
6.66.2 6.1 5.9
5.6
0.0
1.0
2.0
3.0
4.0
5.0
6.0
7.0
0
20,000
40,000
60,000
80,000
100,000
2012 2013 2014 2015 2016
(%)(billion yen)
10
(2) Individual Annuity Insurance
IV. New Policies
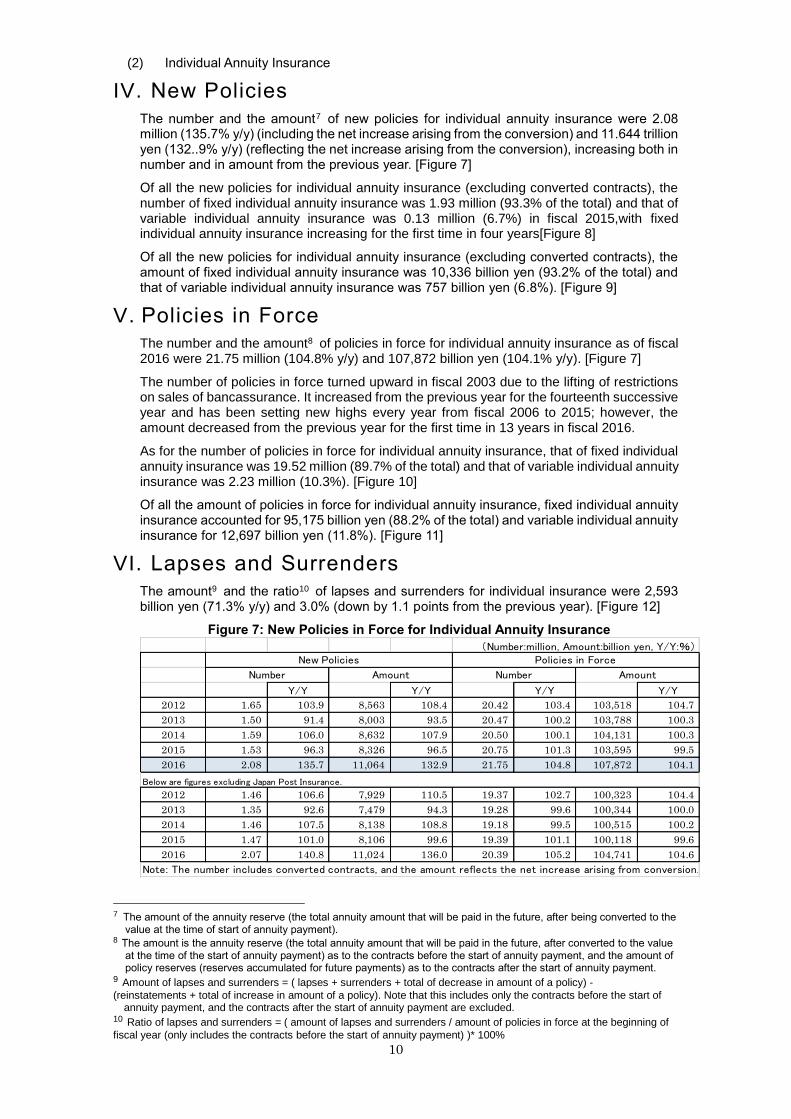
The number and the amount7 of new policies for individual annuity insurance were 2.08 million (135.7% y/y) (including the net increase arising from the conversion) and 11.644 trillion yen (132..9% y/y) (reflecting the net increase arising from the conversion), increasing both in number and in amount from the previous year. [Figure 7]
Of all the new policies for individual annuity insurance (excluding converted contracts), the number of fixed individual annuity insurance was 1.93 million (93.3% of the total) and that of variable individual annuity insurance was 0.13 million (6.7%) in fiscal 2015,with fixed individual annuity insurance increasing for the first time in four years[Figure 8]
Of all the new policies for individual annuity insurance (excluding converted contracts), the amount of fixed individual annuity insurance was 10,336 billion yen (93.2% of the total) and that of variable individual annuity insurance was 757 billion yen (6.8%). [Figure 9]
V. Policies in Force
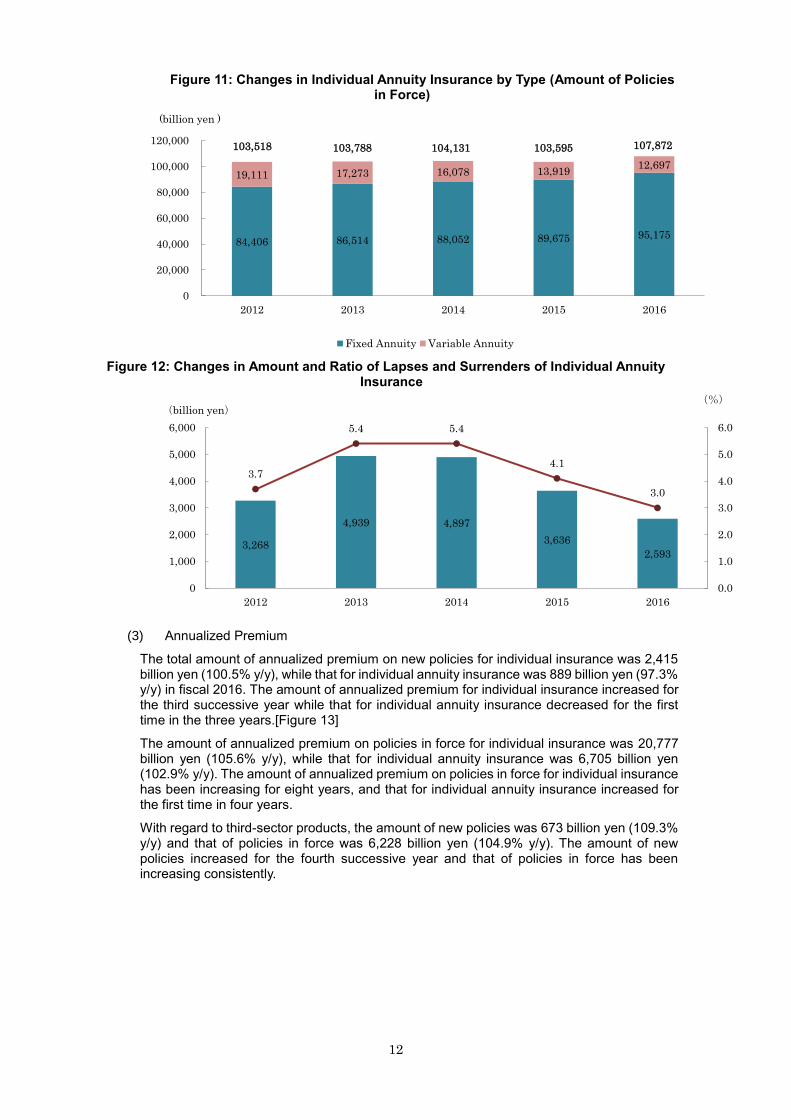
The number and the amount8 of policies in force for individual annuity insurance as of fiscal 2016 were 21.75 million (104.8% y/y) and 107,872 billion yen (104.1% y/y). [Figure 7]
The number of policies in force turned upward in fiscal 2003 due to the lifting of restrictions on sales of bancassurance. It increased from the previous year for the fourteenth successive year and has been setting new highs every year from fiscal 2006 to 2015; however, the amount decreased from the previous year for the first time in 13 years in fiscal 2016.
As for the number of policies in force for individual annuity insurance, that of fixed individual annuity insurance was 19.52 million (89.7% of the total) and that of variable individual annuity insurance was 2.23 million (10.3%). [Figure 10]
Of all the amount of policies in force for individual annuity insurance, fixed individual annuity insurance accounted for 95,175 billion yen (88.2% of the total) and variable individual annuity insurance for 12,697 billion yen (11.8%). [Figure 11]
VI. Lapses and Surrenders
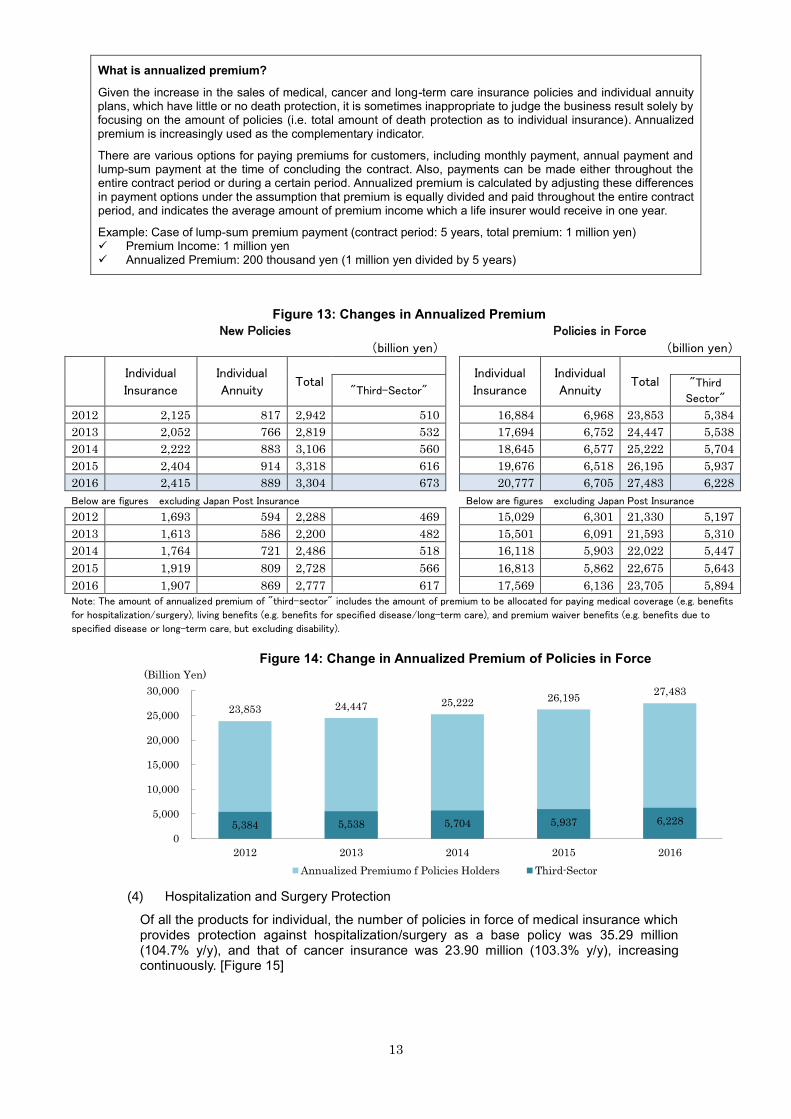
The amount9 and the ratio10 of lapses and surrenders for individual insurance were 2,593 billion yen (71.3% y/y) and 3.0% (down by 1.1 points from the previous year). [Figure 12]
Figure 7: New Policies in Force for Individual Annuity Insurance
7 The amount of the annuity reserve (the total annuity amount that will be paid in the future, after being converted to the
value at the time of start of annuity payment). 8 The amount is the annuity reserve (the total annuity amount that will be paid in the future, after converted to the value
at the time of the start of annuity payment) as to the contracts before the start of annuity payment, and the amount of policy reserves (reserves accumulated for future payments) as to the contracts after the start of annuity payment.
9 Amount of lapses and surrenders = ( lapses + surrenders + total of decrease in amount of a policy) -
(reinstatements + total of increase in amount of a policy). Note that this includes only the contracts before the start of annuity payment, and the contracts after the start of annuity payment are excluded.
10 Ratio of lapses and surrenders = ( amount of lapses and surrenders / amount of policies in force at the beginning of
fiscal year (only includes the contracts before the start of annuity payment) )* 100%
(Number:million, Amount:billion yen, Y/Y:%)
Y/Y Y/Y Y/Y Y/Y
2012 1.65 103.9 8,563 108.4 20.42 103.4 103,518 104.7
2013 1.50 91.4 8,003 93.5 20.47 100.2 103,788 100.3
2014 1.59 106.0 8,632 107.9 20.50 100.1 104,131 100.3
2015 1.53 96.3 8,326 96.5 20.75 101.3 103,595 99.5
2016 2.08 135.7 11,064 132.9 21.75 104.8 107,872 104.1
2012 1.46 106.6 7,929 110.5 19.37 102.7 100,323 104.4
2013 1.35 92.6 7,479 94.3 19.28 99.6 100,344 100.0
2014 1.46 107.5 8,138 108.8 19.18 99.5 100,515 100.2
2015 1.47 101.0 8,106 99.6 19.39 101.1 100,118 99.6
2016 2.07 140.8 11,024 136.0 20.39 105.2 104,741 104.6
Below are figures excluding Japan Post Insurance.
Note: The number includes converted contracts, and the amount reflects the net increase arising from conversion.
New Policies Policies in Force
Number Amount Number Amount

11
Figure 8: Changes in Individual Annuity Insurance by Type (Number of New Policies)
Figure 9: Changes in Individual Annuity Insurance by Type
(Amount of New Policies)
Figure 10: Changes in Individual Annuity Insurance by Type (Number of Policies
in Force)
1.51.3 1.3 1.29
1.93
0.090.16 0.26 0.22
0.13
0
0.3
0.6
0.9
1.2
1.5
1.8
2.1
2.4
2012 2013 2014 2015 2016
(million)
Fixed Annuity Variable Annuity
2.07
1.521.561.471.6
8,023 7,054 7,001 6,964
10,336
526 919 1,653 1,390
757
0
2,000
4,000
6,000
8,000
10,000
12,000
2012 2013 2014 2015 2016
(billion yen)
Fixed Annuity Variable Annuity
11,094
8,3548,655
7,973
8,550
17.09 17.50 17.85 18.33 19.52
3.33 2.97 2.64 2.422.23
0.00
5.00
10.00
15.00
20.00
25.00
2012 2013 2014 2015 2016
(million)
Fixed Annuity Variable Annuity
21.7520.7520.5020.4720.42
Note: Excluding converted contracts
Note: Excluding converted contracts
12
Figure 11: Changes in Individual Annuity Insurance by Type (Amount of Policies
in Force)
Figure 12: Changes in Amount and Ratio of Lapses and Surrenders of Individual Annuity
Insurance
(3) Annualized Premium
The total amount of annualized premium on new policies for individual insurance was 2,415 billion yen (100.5% y/y), while that for individual annuity insurance was 889 billion yen (97.3% y/y) in fiscal 2016. The amount of annualized premium for individual insurance increased for the third successive year while that for individual annuity insurance decreased for the first time in the three years.[Figure 13]
The amount of annualized premium on policies in force for individual insurance was 20,777 billion yen (105.6% y/y), while that for individual annuity insurance was 6,705 billion yen (102.9% y/y). The amount of annualized premium on policies in force for individual insurance has been increasing for eight years, and that for individual annuity insurance increased for the first time in four years.
With regard to third-sector products, the amount of new policies was 673 billion yen (109.3% y/y) and that of policies in force was 6,228 billion yen (104.9% y/y). The amount of new policies increased for the fourth successive year and that of policies in force has been increasing consistently.
84,406 86,514 88,052 89,675 95,175
19,111 17,273 16,078 13,919 12,697
0
20,000
40,000
60,000
80,000
100,000
120,000
2012 2013 2014 2015 2016
(billion yen )
Fixed Annuity Variable Annuity
103,788103,518 103,595104,131 107,872
3,268
4,939 4,897
3,636
2,593
3.7
5.4 5.4
4.1
3.0
0.0
1.0
2.0
3.0
4.0
5.0
6.0
0
1,000
2,000
3,000
4,000
5,000
6,000
2012 2013 2014 2015 2016
(%)(billion yen)
13
What is annualized premium?
Given the increase in the sales of medical, cancer and long-term care insurance policies and individual annuity plans, which have little or no death protection, it is sometimes inappropriate to judge the business result solely by focusing on the amount of policies (i.e. total amount of death protection as to individual insurance). Annualized premium is increasingly used as the complementary indicator.
There are various options for paying premiums for customers, including monthly payment, annual payment and lump-sum payment at the time of concluding the contract. Also, payments can be made either throughout the entire contract period or during a certain period. Annualized premium is calculated by adjusting these differences in payment options under the assumption that premium is equally divided and paid throughout the entire contract period, and indicates the average amount of premium income which a life insurer would receive in one year.
Example: Case of lump-sum premium payment (contract period: 5 years, total premium: 1 million yen) Premium Income: 1 million yen Annualized Premium: 200 thousand yen (1 million yen divided by 5 years)
Figure 13: Changes in Annualized Premium
New Policies Policies in Force
(billion yen) (billion yen)
Individual
Insurance
Individual
Annuity Total
Individual
Insurance
Individual
Annuity Total
"Third-Sector" "Third
Sector"
2012 2,125 817 2,942 510 16,884 6,968 23,853 5,384
2013 2,052 766 2,819 532 17,694 6,752 24,447 5,538
2014 2,222 883 3,106 560 18,645 6,577 25,222 5,704
2015 2,404 914 3,318 616 19,676 6,518 26,195 5,937
2016 2,415 889 3,304 673 20,777 6,705 27,483 6,228
Below are figures excluding Japan Post Insurance Below are figures excluding Japan Post Insurance
2012 1,693 594 2,288 469 15,029 6,301 21,330 5,197
2013 1,613 586 2,200 482 15,501 6,091 21,593 5,310
2014 1,764 721 2,486 518 16,118 5,903 22,022 5,447
2015 1,919 809 2,728 566 16,813 5,862 22,675 5,643
2016 1,907 869 2,777 617 17,569 6,136 23,705 5,894
Note: The amount of annualized premium of "third-sector" includes the amount of premium to be allocated for paying medical coverage (e.g. benefits
for hospitalization/surgery), living benefits (e.g. benefits for specified disease/long-term care), and premium waiver benefits (e.g. benefits due to
specified disease or long-term care, but excluding disability).
Figure 14: Change in Annualized Premium of Policies in Force
(4) Hospitalization and Surgery Protection
Of all the products for individual, the number of policies in force of medical insurance which provides protection against hospitalization/surgery as a base policy was 35.29 million (104.7% y/y), and that of cancer insurance was 23.90 million (103.3% y/y), increasing continuously. [Figure 15]
23,853 24,447 25,222 26,195 27,483
5,384 5,538 5,704 5,937 6,228
0
5,000
10,000
15,000
20,000
25,000
30,000
2012 2013 2014 2015 2016
(Billion Yen)
Annualized Premiumo f Policies Holders Third-Sector

14
Figure 15: Changes in Medical and Cancer Insurance (Number of Policies in Force)
To provide medical protection, there are also other types of insurance policies which are served with medical riders. With respect to insurance policies with hospitalization and surgery coverage (the sum of riders and stand-alone medical insurance policies among individual life insurance and individual annuity insurance), the number of policies with accidental hospitalization riders in force was 76.75 million (102.1% y/y), those with sickness hospitalization riders in force was 77.33 million (102.4% y/y), and those with surgical benefit riders in force was 102.74 million (103.0% y/y). [Figure 16]
Figure 16: Changes in Medical Insurance for Hospitalization and Surgery
(Number of Policies in Force)
Note: Figures are the total of the numbers of protection under individual insurance policies and individual annuity contracts in force, both as a base policy and as a rider. Products with more than one protections are counted in each protection.
(5) Statistical Data by Gender, Age and Prefecture11
VII. By Gender
Comparing the number of new policies for individual insurance (excluding converted contracts) by gender of the insured, the ratio of females has been increasing recently to exceed that of males. In fiscal 2016, the ratio of males was slightly higher than that of the previous year. The ratio of females was 50.2%, slightly exceeding that of men at 49.8%, though the gap was narrowed. [Figure 17]
Comparing the number of new policies for individual insurance between each type of insurance product by gender of the insured in fiscal 2016, "others" including cancer insurance and medical insurance ranked top (more than 50% of the total) for male and female, followed by whole life insurance, term insurance and endowment insurance. [Figure 18]
11 Statistical data by gender, age and prefecture is based on the classification of the insured.
27.78 29.98
31.94 33.70
35.29
20.54 21.16 21.97 23.14 23.90
0.00
5.00
10.00
15.00
20.00
25.00
30.00
35.00
40.00
2012 2013 2014 2015 2016
(million)
Medical Insurance Cancer Insurance
70.8172.31 73.57
75.1576.75
70.4172.21
73.7175.53
77.33
92.0594.52
96.7399.74
50.00
60.00
70.00
80.00
90.00
100.00
2012 2013 2014 2015 2016
(million) 102.74
Hospitalization due to unforseen accidents Hospitalization due to sickness Surgery
15
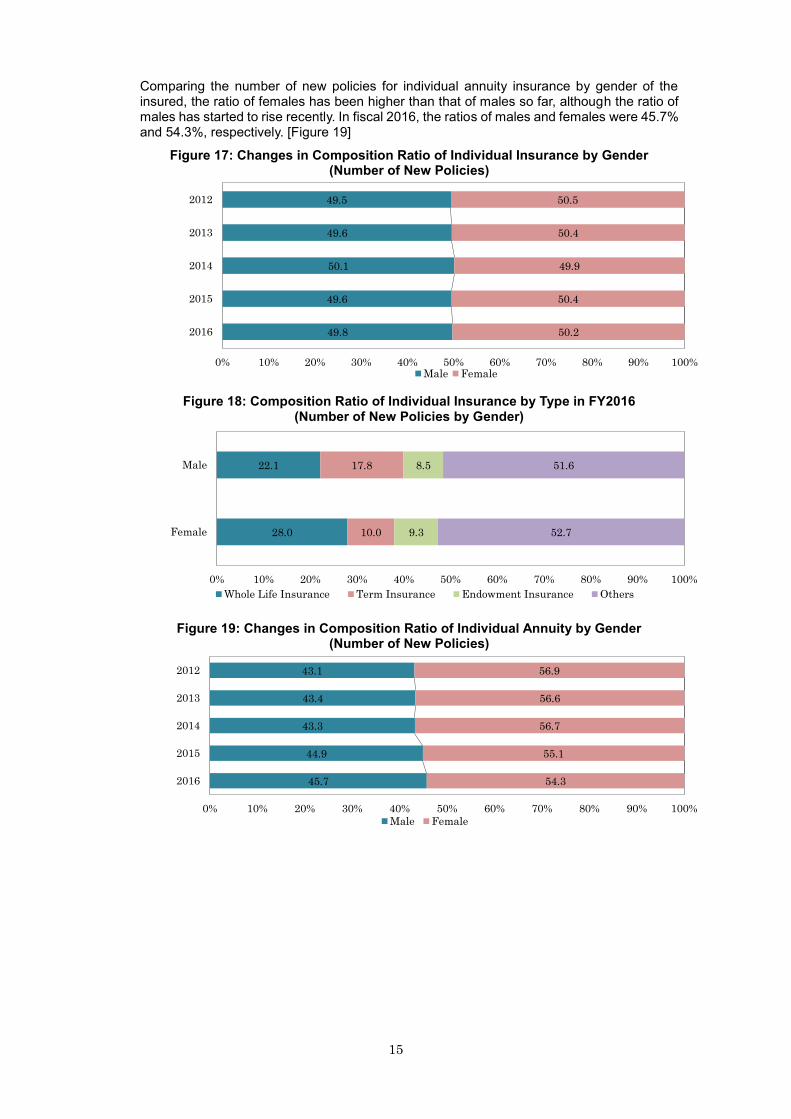
Comparing the number of new policies for individual annuity insurance by gender of the insured, the ratio of females has been higher than that of males so far, although the ratio of males has started to rise recently. In fiscal 2016, the ratios of males and females were 45.7% and 54.3%, respectively. [Figure 19]
Figure 17: Changes in Composition Ratio of Individual Insurance by Gender (Number of New Policies)
Figure 18: Composition Ratio of Individual Insurance by Type in FY2016 (Number of New Policies by Gender)
Figure 19: Changes in Composition Ratio of Individual Annuity by Gender (Number of New Policies)
49.5
49.6
50.1
49.6
49.8
50.5
50.4
49.9
50.4
50.2
0% 10% 20% 30% 40% 50% 60% 70% 80% 90% 100%
2012
2013
2014
2015
2016
Male Female
22.1
28.0
17.8
10.0
8.5
9.3
51.6
52.7
0% 10% 20% 30% 40% 50% 60% 70% 80% 90% 100%
Male
Female
Whole Life Insurance Term Insurance Endowment Insurance Others
43.1
43.4
43.3
44.9
45.7
56.9
56.6
56.7
55.1
54.3
0% 10% 20% 30% 40% 50% 60% 70% 80% 90% 100%
2012
2013
2014
2015
2016
Male Female
16
VIII. By Age
Comparing the number of new policies for individual insurance (excluding converted contracts) by age group of the insured, the ratio of those in their 40s has been on a rising trend, and the ratio of those in their 20s and 30s on a decreasing trend. In fiscal 2016, the ratio of those in their 20s to 40s has increased, resulting in a smaller ratio of those aged 50s and over 50s. [Figure 20]
Also, comparing the number of new policies for individual insurance between each type of insurance product by age group of the insured, the ratio of "others" (including medical insurance, juvenile insurance, etc.) was the highest in those under 20, reaching 71.5%. Among those in their 20s to 60s, the ratio of "others" ranked top at approximately 50%, followed by whole life insurance. [Figure 21]
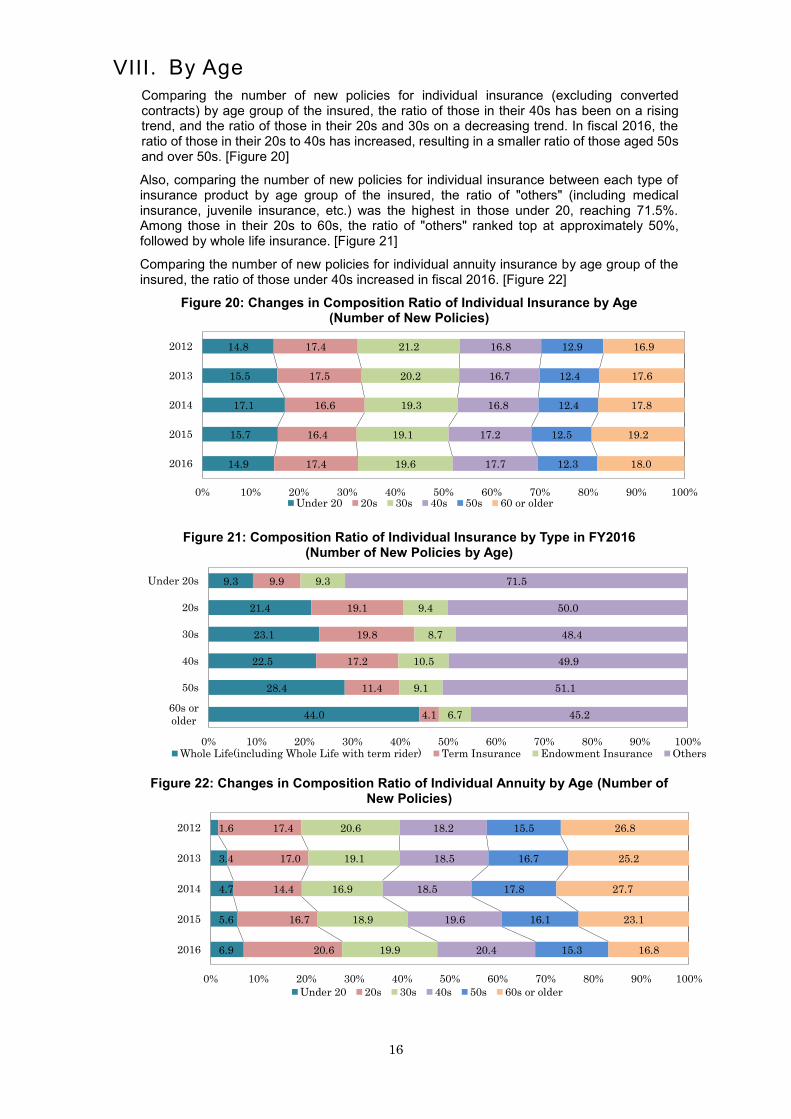
Comparing the number of new policies for individual annuity insurance by age group of the insured, the ratio of those under 40s increased in fiscal 2016. [Figure 22]
Figure 20: Changes in Composition Ratio of Individual Insurance by Age (Number of New Policies)
Figure 21: Composition Ratio of Individual Insurance by Type in FY2016 (Number of New Policies by Age)
Figure 22: Changes in Composition Ratio of Individual Annuity by Age (Number of New Policies)
14.8
15.5
17.1
15.7
14.9
17.4
17.5
16.6
16.4
17.4
21.2
20.2
19.3
19.1
19.6
16.8
16.7
16.8
17.2
17.7
12.9
12.4
12.4
12.5
12.3
16.9
17.6
17.8
19.2
18.0
0% 10% 20% 30% 40% 50% 60% 70% 80% 90% 100%
2012
2013
2014
2015
2016
Under 20 20s 30s 40s 50s 60 or older
9.3
21.4
23.1
22.5
28.4
44.0
9.9
19.1
19.8
17.2
11.4
4.1
9.3
9.4
8.7
10.5
9.1
6.7
71.5
50.0
48.4
49.9
51.1
45.2
0% 10% 20% 30% 40% 50% 60% 70% 80% 90% 100%
Under 20s
20s
30s
40s
50s
60s or
older
Whole Life(including Whole Life with term rider) Term Insurance Endowment Insurance Others
1.6
3.4
4.7
5.6
6.9
17.4
17.0
14.4
16.7
20.6
20.6
19.1
16.9
18.9
19.9
18.2
18.5
18.5
19.6
20.4
15.5
16.7
17.8
16.1
15.3
26.8
25.2
27.7
23.1
16.8
0% 10% 20% 30% 40% 50% 60% 70% 80% 90% 100%
2012
2013
2014
2015
2016
Under 20 20s 30s 40s 50s 60s or older

17
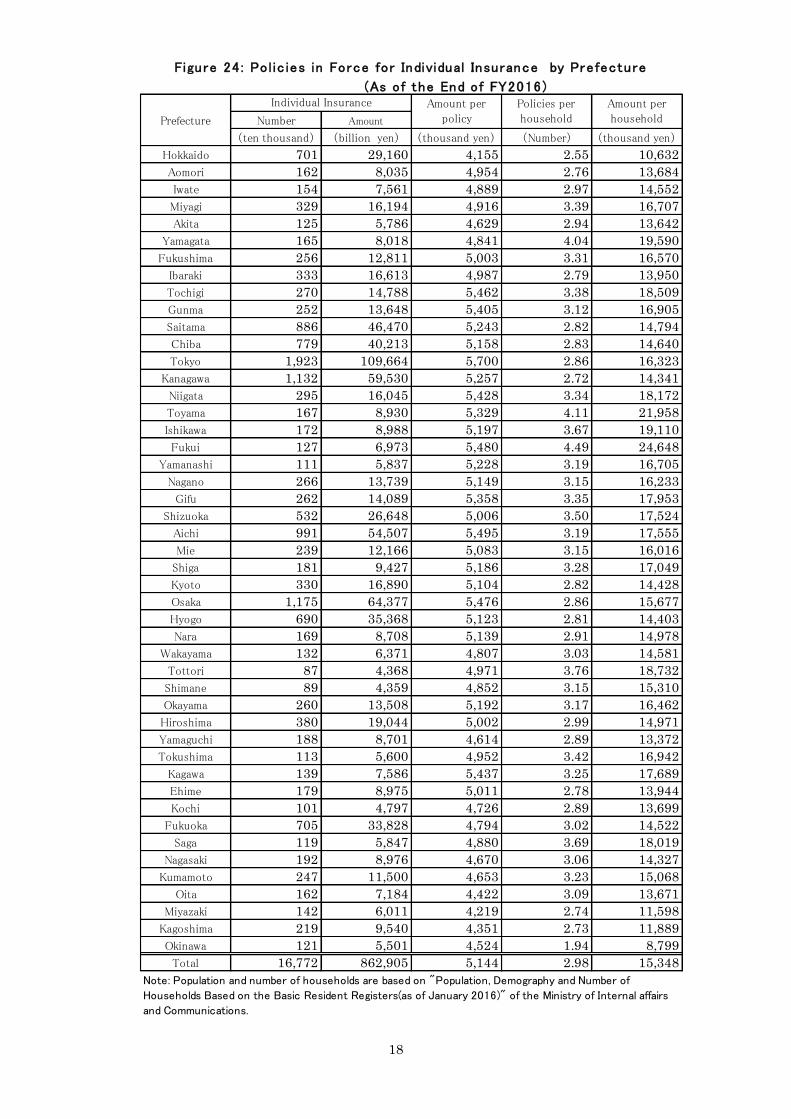
IX. By Prefecture
Regarding the details of individual insurance by each prefecture, Figure 23 provides the details of new policies (excluding converted contracts), and Figure 24 provides details of policies in force.
Prefecture Numver Amount
ten thousand (billion yen) (thousand yen) (Number) (thousand yen)(ten thousand)(ten thousand)
Hokkaido 67 2,503 3,709 0.24 912 534 274
Aomori 15 587 3,897 0.25 1,000 131 58
Iwate 14 610 4,178 0.28 1,175 127 51
Miyagi 30 1,353 4,484 0.31 1,396 230 96
Akita 11 432 3,672 0.27 1,020 102 42
Yamagata 15 631 4,056 0.38 1,541 111 40
Fukushima 23 1,094 4,686 0.30 1,415 192 77
Ibaraki 30 1,331 4,429 0.25 1,117 290 119
Tochigi 23 1,128 4,745 0.29 1,412 195 79
Gunma 21 1,087 4,696 0.27 1,346 194 80
Saitama 76 3,700 4,826 0.24 1,178 719 314
Chiba 67 3,123 4,633 0.24 1,137 615 274
Tokyo 200 10,596 5,275 0.29 1,577 1,304 671
Kanagawa 97 4,796 4,922 0.23 1,155 896 415
Niigata 25 1,227 4,737 0.29 1,390 228 88
Toyama 13 647 4,723 0.33 1,591 105 40
Ishikawa 15 718 4,599 0.33 1,527 114 47
Fukui 11 551 4,713 0.41 1,949 78 28
Yamanashi 10 457 4,416 0.29 1,308 83 34
Nagano 22 1,055 4,591 0.27 1,247 209 84
Gifu 23 1,157 4,985 0.29 1,474 201 78
Shizuoka 47 2,159 4,539 0.31 1,420 368 152
Aichi 88 4,699 5,289 0.28 1,513 731 310
Mie 22 1,013 4,571 0.29 1,334 179 75
Shiga 16 764 4,566 0.30 1,382 139 55
Kyoto 30 1,437 4,755 0.25 1,227 251 117
Osaka 111 5,799 5,201 0.27 1,412 864 410
Hyogo 61 3,025 4,884 0.25 1,231 550 245
Nara 14 683 4,671 0.25 1,175 136 58
Wakayama 12 521 4,219 0.28 1,193 97 43
Tottori 7 329 4,155 0.34 1,414 57 23
Shimane 8 339 4,072 0.29 1,192 68 28
Okayama 23 1,105 4,668 0.28 1,347 190 82
Hiroshima 35 1,710 4,814 0.27 1,344 281 127
Yamaguchi 17 742 4,213 0.27 1,140 139 65
Tokushima 11 461 4,179 0.33 1,397 75 33
Kagawa 12 636 4,927 0.30 1,484 98 42
Ehime 17 761 4,405 0.26 1,183 139 64
Kochi 9 372 4,003 0.26 1,065 72 35
Fukuoka 68 3,169 4,597 0.29 1,360 506 232
Saga 11 477 4,245 0.34 1,471 83 32
Nagasaki 18 1,051 4,129 0.30 1,239 138 62
Kumamoto 24 1,123 4,670 0.31 1,471 178 76
Oita 15 624 4,025 0.29 1,188 116 52
Miyazaki 15 576 3,798 0.29 1,111 111 51
Kagoshima 21 903 4,118 0.27 1,125 166 80
Okinawa 14 598 4,117 0.23 957 145 62
Total 1,559 73,607 4,719 0.27 1,309 12,558 5,622
3 the population does not include non-Japanese residents.
2.The figures are now policies excluding converted contracts.
Figure 23 : New Pol ic ies for Individual Insurance by Prefecture (FY2016)
Individual Insurance Amount per
policy
Policies per
household
Amount per
householdPopulation Household
* 1.Population and number of households are based on"Population, Demography, and Number of House holds based on the
Basic Resident Registers(as of 1 January 2016)" of the Ministry of Internal Affairs and Communications.
18
Prefecture Number Amount
(ten thousand) (billion yen) (thousand yen) (Number) (thousand yen)
Hokkaido 701 29,160 4,155 2.55 10,632
Aomori 162 8,035 4,954 2.76 13,684
Iwate 154 7,561 4,889 2.97 14,552
Miyagi 329 16,194 4,916 3.39 16,707
Akita 125 5,786 4,629 2.94 13,642
Yamagata 165 8,018 4,841 4.04 19,590
Fukushima 256 12,811 5,003 3.31 16,570
Ibaraki 333 16,613 4,987 2.79 13,950
Tochigi 270 14,788 5,462 3.38 18,509
Gunma 252 13,648 5,405 3.12 16,905
Saitama 886 46,470 5,243 2.82 14,794
Chiba 779 40,213 5,158 2.83 14,640
Tokyo 1,923 109,664 5,700 2.86 16,323
Kanagawa 1,132 59,530 5,257 2.72 14,341
Niigata 295 16,045 5,428 3.34 18,172
Toyama 167 8,930 5,329 4.11 21,958
Ishikawa 172 8,988 5,197 3.67 19,110
Fukui 127 6,973 5,480 4.49 24,648
Yamanashi 111 5,837 5,228 3.19 16,705
Nagano 266 13,739 5,149 3.15 16,233
Gifu 262 14,089 5,358 3.35 17,953
Shizuoka 532 26,648 5,006 3.50 17,524
Aichi 991 54,507 5,495 3.19 17,555
Mie 239 12,166 5,083 3.15 16,016
Shiga 181 9,427 5,186 3.28 17,049
Kyoto 330 16,890 5,104 2.82 14,428
Osaka 1,175 64,377 5,476 2.86 15,677
Hyogo 690 35,368 5,123 2.81 14,403
Nara 169 8,708 5,139 2.91 14,978
Wakayama 132 6,371 4,807 3.03 14,581
Tottori 87 4,368 4,971 3.76 18,732
Shimane 89 4,359 4,852 3.15 15,310
Okayama 260 13,508 5,192 3.17 16,462
Hiroshima 380 19,044 5,002 2.99 14,971
Yamaguchi 188 8,701 4,614 2.89 13,372
Tokushima 113 5,600 4,952 3.42 16,942
Kagawa 139 7,586 5,437 3.25 17,689
Ehime 179 8,975 5,011 2.78 13,944
Kochi 101 4,797 4,726 2.89 13,699
Fukuoka 705 33,828 4,794 3.02 14,522
Saga 119 5,847 4,880 3.69 18,019
Nagasaki 192 8,976 4,670 3.06 14,327
Kumamoto 247 11,500 4,653 3.23 15,068
Oita 162 7,184 4,422 3.09 13,671
Miyazaki 142 6,011 4,219 2.74 11,598
Kagoshima 219 9,540 4,351 2.73 11,889
Okinawa 121 5,501 4,524 1.94 8,799
Total 16,772 862,905 5,144 2.98 15,348
Note: Population and number of households are based on "Population, Demography and Number of
Households Based on the Basic Resident Registers(as of January 2016)" of the Ministry of Internal affairs
and Communications.
Figure 24 : Po l ic ies in Force for Individual Insurance by Prefecture
Individual Insurance Amount per
policy
Policies per
household
Amount per
household
(As of the End of FY2016)

19
2 Insurance Products for Groups
(1) Group Insurance
X. New Policies
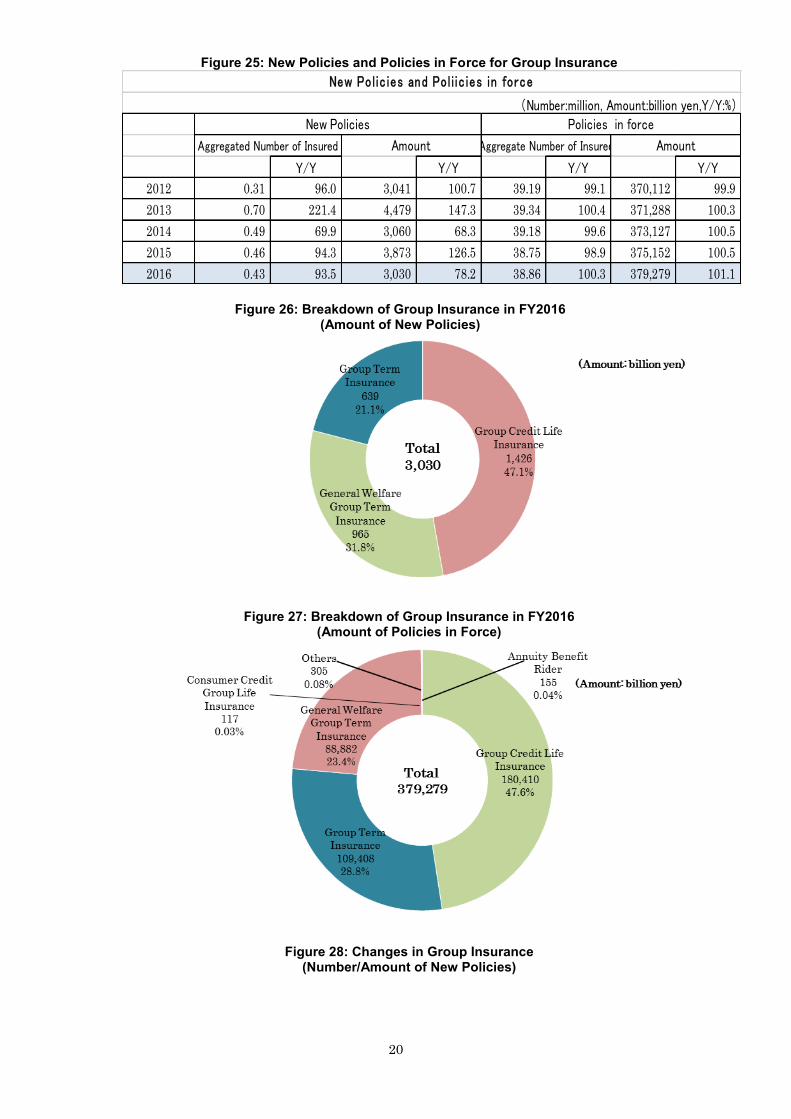
The aggregated number of the newly insured (the number after resolving double counting of insured of coinsurance undertaken by multiple insurers) and the amount of new policies for group insurance were 0.43 million (93.5% y/y) and 3,30 billion yen (78.2% y/y). [Figures 25 and 28]
Looking at the aggregated number of the newly insured, new policies for group insurance had been declining since some policies of the group term insurance existing at that time were switched to general welfare group term insurance in fiscal 1997. However, it has remained on the same level since fiscal 2006.
Of all the new policies, the amount of general welfare group term insurance ranked top (1,426 billion yen, 47.1% of the total), followed by group credit life insurance (965 billion yen, 31.8%) and group term insurance (639 billion yen, 21.1%). [Figure 26]
XI. Policies in Force
The number of the insured (aggregated) and the amount of policies in force were 38.86 million (100.3% y/y) and 379,279 billion yen (101.1% y/y). [Figures 25 and 29]
Of all the policies in force, the amount of group credit life insurance ranked top (180,410 billion yen, 47.6% of the total), followed by group term insurance (109,408 billion yen, 28.8%) and general welfare group term insurance (88,882 billion yen, 23.4%). [Figure 27]
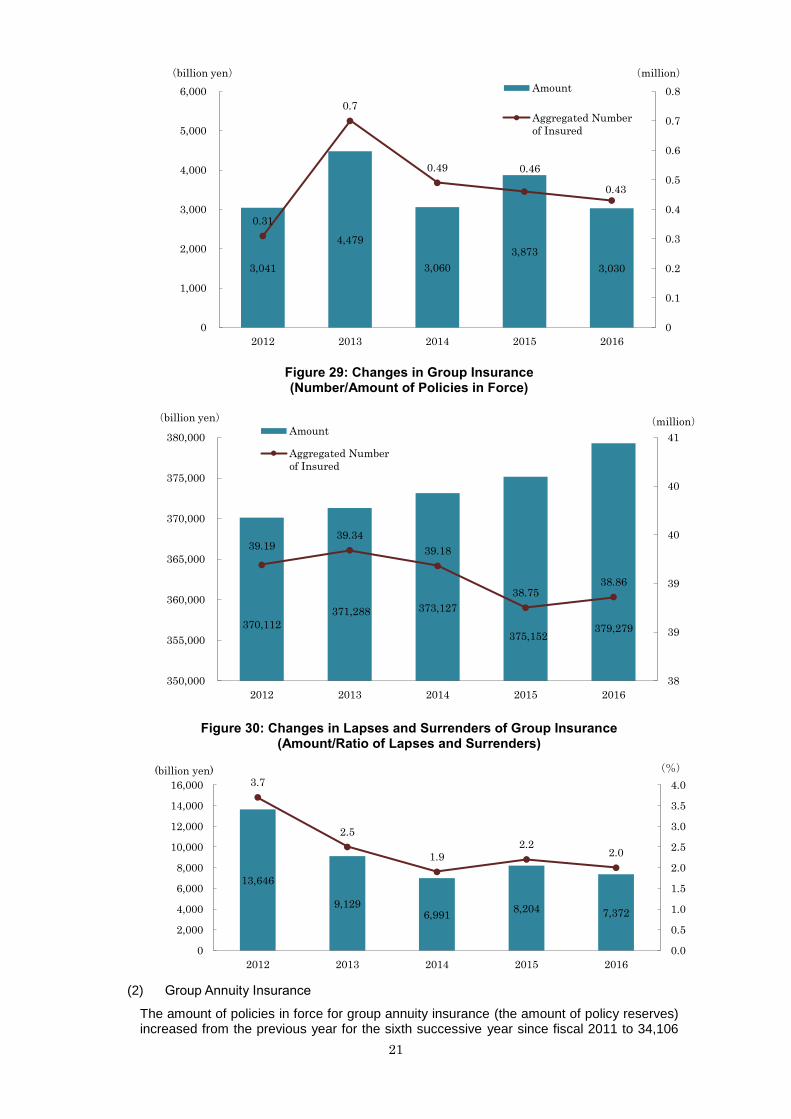
XII. Lapses and Surrenders
The amount of lapses and surrenders of group insurance12 decreased from the previous year to 7,372 billion yen (89.9% y/y), and the ratio of lapses and surrenders13 also decreased to 2.0 (down by 0.2 points from the previous year). [Figure 30]
[Major Types of Group Insurance]
Group Term Insurance: A kind of voluntary insurance product companies introduce for the purpose of welfare for its members, under which the applicants become insured and pay insurance premium.
General Welfare Group Term Insurance: A kind of term insurance companies requires its all members to subscribe mandatorily in principle for the purpose of providing life security to the surviving relatives of the member. Contracts are renewed every year and the companies pay the premium.
Group Credit Life Insurance: A kind of insurance used for the conservation of loans such as housing loans, under which a debtor of the loan becomes the insured and credit providers (e.g. banks) or credit guarantee institutions become policyholders and beneficiaries. Under group credit life insurance, in case the debtor dies or become affected by prescribed state of disabilities, benefits equivalent to the amount of unpaid debts will be paid to the policyholder to clear the debt.
12 Amount of lapses and surrenders = ( lapses + surrenders + total of decrease in amount of a policy) -
(reinstatements + total of increase in amount of a policy) 13 Ratio of lapses and surrenders = ( amount of lapses and surrenders / amount of policies in force at the beginning of
fiscal year )* 100%
20
Figure 25: New Policies and Policies in Force for Group Insurance
Figure 26: Breakdown of Group Insurance in FY2016 (Amount of New Policies)
Figure 27: Breakdown of Group Insurance in FY2016 (Amount of Policies in Force)
Figure 28: Changes in Group Insurance (Number/Amount of New Policies)
Y/Y Y/Y Y/Y Y/Y
2012 0.31 96.0 3,041 100.7 39.19 99.1 370,112 99.9
2013 0.70 221.4 4,479 147.3 39.34 100.4 371,288 100.3
2014 0.49 69.9 3,060 68.3 39.18 99.6 373,127 100.5
2015 0.46 94.3 3,873 126.5 38.75 98.9 375,152 100.5
2016 0.43 93.5 3,030 78.2 38.86 100.3 379,279 101.1
New Pol ic ies and Pol i ic ies in force
(Number:million, Amount:billion yen,Y/Y:%)New Policies Policies in force
Aggregated Number of Insured Amount Aggregate Number of Insured Amount
21
Figure 29: Changes in Group Insurance (Number/Amount of Policies in Force)
Figure 30: Changes in Lapses and Surrenders of Group Insurance (Amount/Ratio of Lapses and Surrenders)
(2) Group Annuity Insurance
The amount of policies in force for group annuity insurance (the amount of policy reserves) increased from the previous year for the sixth successive year since fiscal 2011 to 34,106
3,041
4,479
3,060
3,873
3,030
0.31
0.7
0.49 0.46
0.43
0
0.1
0.2
0.3
0.4
0.5
0.6
0.7
0.8
0
1,000
2,000
3,000
4,000
5,000
6,000
2012 2013 2014 2015 2016
(million)(billion yen)
Amount
Aggregated Number
of Insured
370,112
371,288 373,127
375,152 379,279
39.19 39.34
39.18
38.75 38.86
38
39
39
40
40
41
350,000
355,000
360,000
365,000
370,000
375,000
380,000
2012 2013 2014 2015 2016
(million)(billion yen)Amount
Aggregated Number
of Insured
13,646
9,1296,991
8,204 7,372
3.7
2.5
1.92.2
2.0
0.0
0.5
1.0
1.5
2.0
2.5
3.0
3.5
4.0
0
2,000
4,000
6,000
8,000
10,000
12,000
14,000
16,000
2012 2013 2014 2015 2016
(%)(billion yen)
22
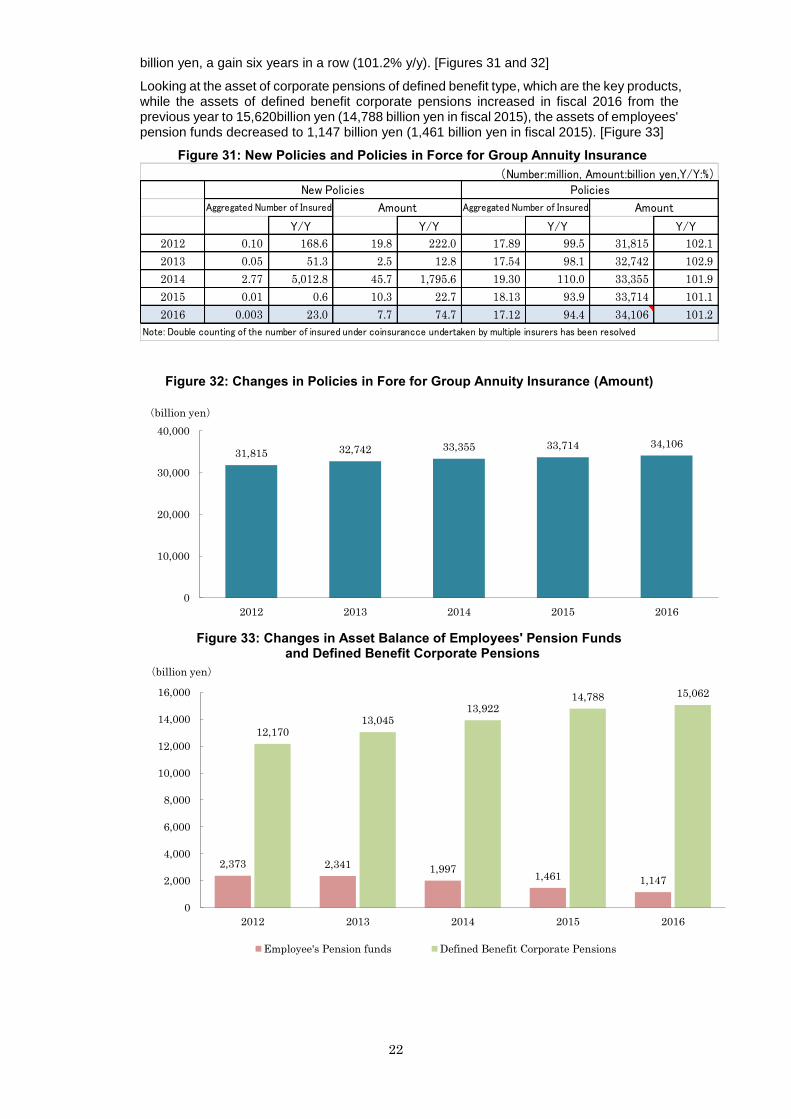
billion yen, a gain six years in a row (101.2% y/y). [Figures 31 and 32]
Looking at the asset of corporate pensions of defined benefit type, which are the key products, while the assets of defined benefit corporate pensions increased in fiscal 2016 from the previous year to 15,620billion yen (14,788 billion yen in fiscal 2015), the assets of employees' pension funds decreased to 1,147 billion yen (1,461 billion yen in fiscal 2015). [Figure 33]
Figure 31: New Policies and Policies in Force for Group Annuity Insurance
Figure 32: Changes in Policies in Fore for Group Annuity Insurance (Amount)
Figure 33: Changes in Asset Balance of Employees' Pension Funds and Defined Benefit Corporate Pensions
Y/Y Y/Y Y/Y Y/Y
2012 0.10 168.6 19.8 222.0 17.89 99.5 31,815 102.1
2013 0.05 51.3 2.5 12.8 17.54 98.1 32,742 102.9
2014 2.77 5,012.8 45.7 1,795.6 19.30 110.0 33,355 101.9
2015 0.01 0.6 10.3 22.7 18.13 93.9 33,714 101.1
2016 0.003 23.0 7.7 74.7 17.12 94.4 34,106 101.2
Note: Double counting of the number of insured under coinsurancce undertaken by multiple insurers has been resolved
(Number:million, Amount:billion yen,Y/Y:%)New Policies Policies
Aggregated Number of Insured Amount Aggregated Number of Insured Amount
31,815 32,742 33,355 33,714 34,106
0
10,000
20,000
30,000
40,000
2012 2013 2014 2015 2016
(billion yen)
2,373 2,341 1,9971,461 1,147
12,17013,045
13,92214,788 15,062
0
2,000
4,000
6,000
8,000
10,000
12,000
14,000
16,000
2012 2013 2014 2015 2016
(billion yen)
Employee's Pension funds Defined Benefit Corporate Pensions

23
II Profit and Loss
1 Insurance Related Profit and Loss
(1) Premium Income
The total amount of gross annual premium income was 33,459 billion yen (88.6% y/y) in Fiscal 2016. Though Gross annual premium income had trended upward in recent years, it decreased for the first time in three years in fiscal 2016, affected by the suspension of the sales of single-premium products due to the reduce in the assumed interest rates. [Figure 34]
As for results by type of business, individual insurance (23,611billion yen, 92.2% y/y), individual annuity insurance (4,340 billion yen, 91.8% y/y), group insurance (1,134 billion yen, 100.9% y/y), and group annuity insurance (3,057 billion yen, 67.0% y/y). [Figure 35]
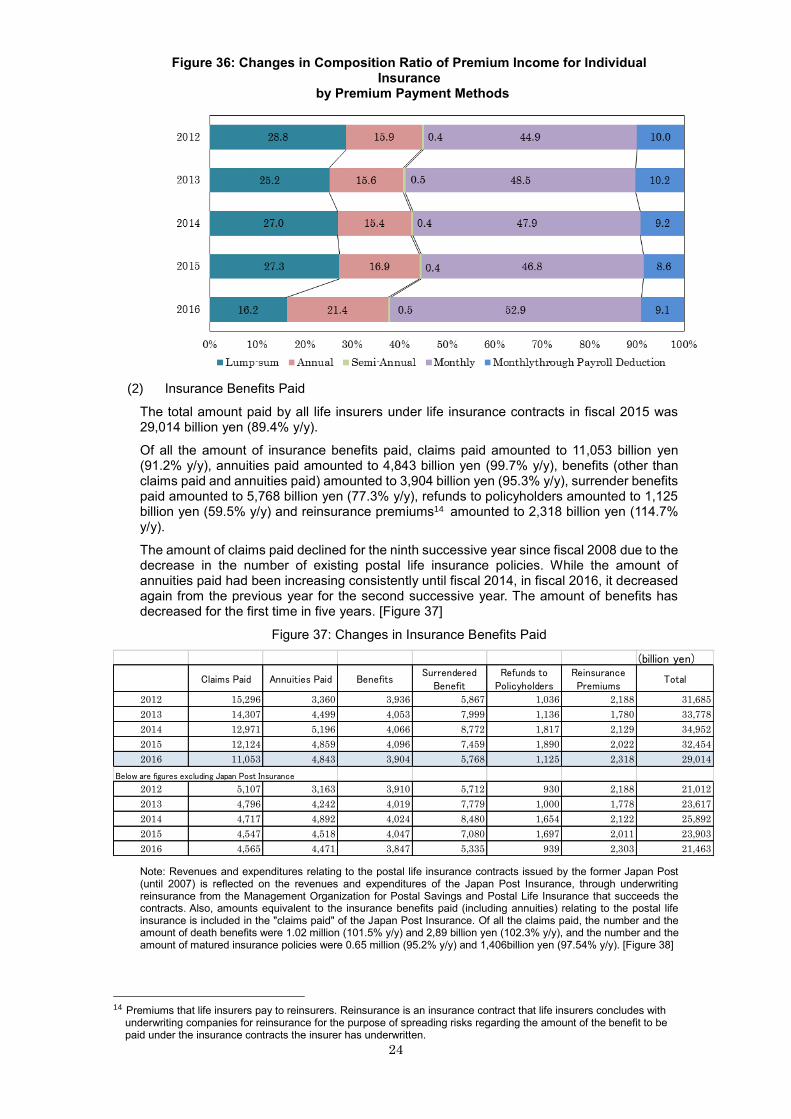
By method of premium payments for individual insurance, monthly payment ranked top (52.9% of the total), followed by annual payment (21.4%), single-premium payment (16.2%) and monthly payment through payroll deduction (9.1%). The shares of single-premium payment and annual payment have significantly decreased from the previous year in fiscal 2016. [Figure 36]
Figure 34: Changes in Profit and Loss
Figure 35: Changes in Premium Income by Type
Ordinary
Revenue
s
Premium
Incomes and
Others
Premium
Income
Investmen
t Income
Interest
and
Dividend
Others
Ordinary
Expense
s
Insuranc
e
benefits
paid
Provision
for Policy
Reserves
Investme
nt
Expenses
Operatin
g
Expense
s
Other
s
2012 54,803 38,069 37,140 11,835 6,475 4,899 52,239 31,685 12,881 1,734 4,349 1,588 2,564
2013 53,215 35,784 34,738 11,326 6,877 6,105 50,113 33,778 9,108 1,345 4,389 1,491 3,101
2014 55,959 38,681 37,222 12,310 7,085 4,966 52,449 34,952 10,041 1,325 4,499 1,630 3,510
2015 52,305 38,962 37,748 8,291 7,111 5,051 49,537 32,454 8,361 2,473 4,706 1,541 2,768
2016 47,760 35,182 33,459 9,078 7,023 3,499 45,097 29,014 8,155 1,777 4,726 1,423 2,662
Below are figures excluding Japan Post Insurance
2012 42,968 31,587 30,658 10,274 4,975 1,106 40,933 21,012 12,872 1,705 3,836 1,507 2,034
2013 41,981 29,872 28,826 9,785 5,419 2,323 39,343 23,617 9,103 1,327 3,876 1,418 2,638
2014 45,790 32,724 31,267 10,850 5,720 2,215 42,773 25,892 10,040 1,314 3,986 1,538 3,016
2015 42,700 33,548 32,338 6,936 5,802 2,214 40,344 23,903 8,361 2,463 4,169 1,446 2,355
2016 39,101 30,141 28,424 7,710 5,797 1,250 36,717 21,463 8,155 1,617 4,166 1,314 2,383
(billion yen)Income Expenses
Ordinary
Profit
24,099 22,721 24,546 25,60723,611
4,3744,312
5,154 4,7294,340
1,1091,112
1,119 1,1241,134
3,6833,851
4,175 4,562
3,057
3,8742,739
2,226 1,723
1,314
0
5,000
10,000
15,000
20,000
25,000
30,000
35,000
40,000
2012 2013 2014 2015 2016
(billion yen)
Individual Insurance Individual Annuity Insurance
Group Insurance Group Annuity Insurance
34,73837,222 37,748
33,459
37,140
24
Figure 36: Changes in Composition Ratio of Premium Income for Individual Insurance
by Premium Payment Methods
(2) Insurance Benefits Paid
The total amount paid by all life insurers under life insurance contracts in fiscal 2015 was 29,014 billion yen (89.4% y/y).
Of all the amount of insurance benefits paid, claims paid amounted to 11,053 billion yen (91.2% y/y), annuities paid amounted to 4,843 billion yen (99.7% y/y), benefits (other than claims paid and annuities paid) amounted to 3,904 billion yen (95.3% y/y), surrender benefits paid amounted to 5,768 billion yen (77.3% y/y), refunds to policyholders amounted to 1,125 billion yen (59.5% y/y) and reinsurance premiums14 amounted to 2,318 billion yen (114.7% y/y).
The amount of claims paid declined for the ninth successive year since fiscal 2008 due to the decrease in the number of existing postal life insurance policies. While the amount of annuities paid had been increasing consistently until fiscal 2014, in fiscal 2016, it decreased again from the previous year for the second successive year. The amount of benefits has decreased for the first time in five years. [Figure 37]
Figure 37: Changes in Insurance Benefits Paid
Note: Revenues and expenditures relating to the postal life insurance contracts issued by the former Japan Post (until 2007) is reflected on the revenues and expenditures of the Japan Post Insurance, through underwriting reinsurance from the Management Organization for Postal Savings and Postal Life Insurance that succeeds the contracts. Also, amounts equivalent to the insurance benefits paid (including annuities) relating to the postal life insurance is included in the "claims paid" of the Japan Post Insurance. Of all the claims paid, the number and the amount of death benefits were 1.02 million (101.5% y/y) and 2,89 billion yen (102.3% y/y), and the number and the amount of matured insurance policies were 0.65 million (95.2% y/y) and 1,406billion yen (97.54% y/y). [Figure 38]
14 Premiums that life insurers pay to reinsurers. Reinsurance is an insurance contract that life insurers concludes with
underwriting companies for reinsurance for the purpose of spreading risks regarding the amount of the benefit to be paid under the insurance contracts the insurer has underwritten.
(billion yen)
Claims Paid Annuities Paid BenefitsSurrendered
BenefitRefunds to
PolicyholdersReinsurancePremiums
Total
2012 15,296 3,360 3,936 5,867 1,036 2,188 31,685
2013 14,307 4,499 4,053 7,999 1,136 1,780 33,778
2014 12,971 5,196 4,066 8,772 1,817 2,129 34,952
2015 12,124 4,859 4,096 7,459 1,890 2,022 32,454
2016 11,053 4,843 3,904 5,768 1,125 2,318 29,014
Below are figures excluding Japan Post Insurance
2012 5,107 3,163 3,910 5,712 930 2,188 21,012
2013 4,796 4,242 4,019 7,779 1,000 1,778 23,617
2014 4,717 4,892 4,024 8,480 1,654 2,122 25,892
2015 4,547 4,518 4,047 7,080 1,697 2,011 23,903
2016 4,565 4,471 3,847 5,335 939 2,303 21,463

25
Figure 38: Changes in Number and Amount of Death/Maturity Benefit Payments
Of all the benefits paid, the number and the amount of hospitalization benefits increased to 6.66 million (102.9% y/y) and 693 billion yen (101.0% y/y), and also those of surgery benefits increased to 3.96 million (104.6% y/y) and 412 billion yen (103.0% y/y). [Figure 39]
Figure 39: Changes in Number and Amount of Hospitalization and Surgery Benefits
26
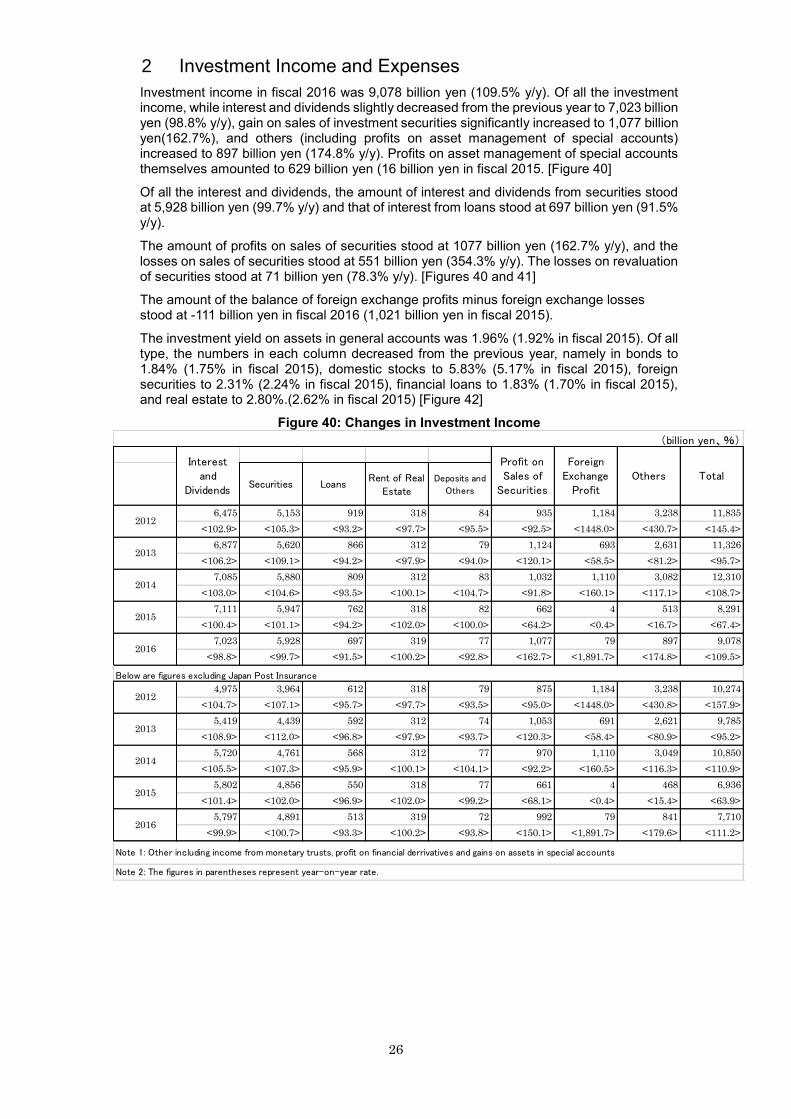
2 Investment Income and Expenses
Investment income in fiscal 2016 was 9,078 billion yen (109.5% y/y). Of all the investment income, while interest and dividends slightly decreased from the previous year to 7,023 billion yen (98.8% y/y), gain on sales of investment securities significantly increased to 1,077 billion yen(162.7%), and others (including profits on asset management of special accounts) increased to 897 billion yen (174.8% y/y). Profits on asset management of special accounts themselves amounted to 629 billion yen (16 billion yen in fiscal 2015. [Figure 40]
Of all the interest and dividends, the amount of interest and dividends from securities stood at 5,928 billion yen (99.7% y/y) and that of interest from loans stood at 697 billion yen (91.5% y/y).
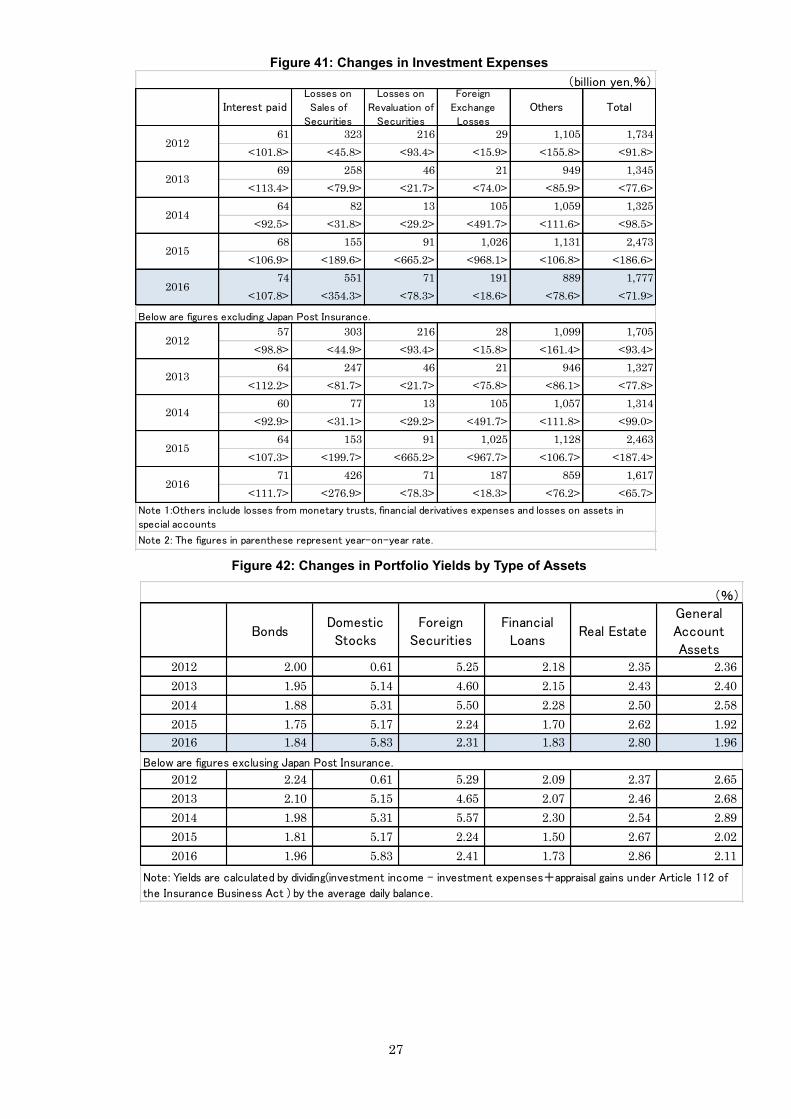
The amount of profits on sales of securities stood at 1077 billion yen (162.7% y/y), and the losses on sales of securities stood at 551 billion yen (354.3% y/y). The losses on revaluation of securities stood at 71 billion yen (78.3% y/y). [Figures 40 and 41]
The amount of the balance of foreign exchange profits minus foreign exchange losses stood at -111 billion yen in fiscal 2016 (1,021 billion yen in fiscal 2015).
The investment yield on assets in general accounts was 1.96% (1.92% in fiscal 2015). Of all type, the numbers in each column decreased from the previous year, namely in bonds to 1.84% (1.75% in fiscal 2015), domestic stocks to 5.83% (5.17% in fiscal 2015), foreign securities to 2.31% (2.24% in fiscal 2015), financial loans to 1.83% (1.70% in fiscal 2015), and real estate to 2.80%.(2.62% in fiscal 2015) [Figure 42]
Figure 40: Changes in Investment Income
Securities LoansRent of Real
EstateDeposits and
Others
6,475 5,153 919 318 84 935 1,184 3,238 11,835
<102.9> <105.3> <93.2> <97.7> <95.5> <92.5> <1448.0> <430.7> <145.4>
6,877 5,620 866 312 79 1,124 693 2,631 11,326
<106.2> <109.1> <94.2> <97.9> <94.0> <120.1> <58.5> <81.2> <95.7>
7,085 5,880 809 312 83 1,032 1,110 3,082 12,310
<103.0> <104.6> <93.5> <100.1> <104.7> <91.8> <160.1> <117.1> <108.7>
7,111 5,947 762 318 82 662 4 513 8,291
<100.4> <101.1> <94.2> <102.0> <100.0> <64.2> <0.4> <16.7> <67.4>
7,023 5,928 697 319 77 1,077 79 897 9,078
<98.8> <99.7> <91.5> <100.2> <92.8> <162.7> <1,891.7> <174.8> <109.5>
4,975 3,964 612 318 79 875 1,184 3,238 10,274
<104.7> <107.1> <95.7> <97.7> <93.5> <95.0> <1448.0> <430.8> <157.9>
5,419 4,439 592 312 74 1,053 691 2,621 9,785
<108.9> <112.0> <96.8> <97.9> <93.7> <120.3> <58.4> <80.9> <95.2>
5,720 4,761 568 312 77 970 1,110 3,049 10,850
<105.5> <107.3> <95.9> <100.1> <104.1> <92.2> <160.5> <116.3> <110.9>
5,802 4,856 550 318 77 661 4 468 6,936
<101.4> <102.0> <96.9> <102.0> <99.2> <68.1> <0.4> <15.4> <63.9>
5,797 4,891 513 319 72 992 79 841 7,710
<99.9> <100.7> <93.3> <100.2> <93.8> <150.1> <1,891.7> <179.6> <111.2>
Total
(billion yen、%)
Interestand
Dividends
Profit onSales of
Securities
2014
ForeignExchange
ProfitOthers
2012
2013
Note 1: Other including income from monetary trusts, profit on financial derrivatives and gains on assets in special accounts
2016
2012
2015
2016
Below are figures excluding Japan Post Insurance
2015
2013
2014
Note 2: The figures in parentheses represent year-on-year rate.
27
Figure 41: Changes in Investment Expenses
Figure 42: Changes in Portfolio Yields by Type of Assets
61 323 216 29 1,105 1,734
<101.8> <45.8> <93.4> <15.9> <155.8> <91.8>
69 258 46 21 949 1,345
<113.4> <79.9> <21.7> <74.0> <85.9> <77.6>
64 82 13 105 1,059 1,325
<92.5> <31.8> <29.2> <491.7> <111.6> <98.5>
68 155 91 1,026 1,131 2,473
<106.9> <189.6> <665.2> <968.1> <106.8> <186.6>
74 551 71 191 889 1,777
<107.8> <354.3> <78.3> <18.6> <78.6> <71.9>
57 303 216 28 1,099 1,705
<98.8> <44.9> <93.4> <15.8> <161.4> <93.4>
64 247 46 21 946 1,327
<112.2> <81.7> <21.7> <75.8> <86.1> <77.8>
60 77 13 105 1,057 1,314
<92.9> <31.1> <29.2> <491.7> <111.8> <99.0>
64 153 91 1,025 1,128 2,463
<107.3> <199.7> <665.2> <967.7> <106.7> <187.4>
71 426 71 187 859 1,617
<111.7> <276.9> <78.3> <18.3> <76.2> <65.7>
Note 2: The figures in parenthese represent year-on-year rate.
(billion yen,%)Losses on
Sales of
Securities
Losses on
Revaluation of
Securities
Foreign
Exchange
Losses
Others Total
Note 1:Others include losses from monetary trusts, financial derivatives expenses and losses on assets in
special accounts
2016
2015
Interest paid
2016
Below are figures excluding Japan Post Insurance.
2012
2015
2013
2014
2012
2013
2014
BondsDomesticStocks
ForeignSecurities
FinancialLoans
Real EstateGeneralAccountAssets
2012 2.00 0.61 5.25 2.18 2.35 2.36
2013 1.95 5.14 4.60 2.15 2.43 2.40
2014 1.88 5.31 5.50 2.28 2.50 2.58
2015 1.75 5.17 2.24 1.70 2.62 1.92
2016 1.84 5.83 2.31 1.83 2.80 1.96
2012 2.24 0.61 5.29 2.09 2.37 2.65
2013 2.10 5.15 4.65 2.07 2.46 2.68
2014 1.98 5.31 5.57 2.30 2.54 2.89
2015 1.81 5.17 2.24 1.50 2.67 2.02
2016 1.96 5.83 2.41 1.73 2.86 2.11
Below are figures exclusing Japan Post Insurance.
Note: Yields are calculated by dividing(investment income - investment expenses+appraisal gains under Article 112 of
the Insurance Business Act ) by the average daily balance.
(%)

28
3 Operating Expenses
The total amount of operating expenses stood at 4,726 billion yen (100.4% y/y). The ratio of premium income to total operating expenses was 13.4% (up by 1.3points from the previous year). [Figure 43]
Figure 43: Changes in Operating Expenses
4 Ordinary Profits and Basic Profits
The total amount of ordinary profits decreased for the second successive year to 2,662billion yen (96.2% y/y) due to the decrease in premium income. The total amount of basic profits, which represents the profitability of the life insurance companies for the year, increased from the previous year to 3,392 billion yen (101.8% y/y) for the first time in six years. [Figure 44]
What is Basic Profit?
"Basic profit" is the indicator for the basic periodic profit/loss status of life insurers, comprised of income and expenditures for core insurance business (e.g. premium income, payments of insurance benefits and operating expenses) and income and expenditures for investment (mainly interest and dividends). The amount is calculated by deducting both "capital gains/losses" and "extraordinary gains/losses" (e.g. profits/losses on sales of securities) from the ordinary profits.
4,349 4,389 4,499 4,706 4,726
11.4
12.3 11.6
12.1
13.4
0.0
2.0
4.0
6.0
8.0
10.0
12.0
14.0
0
1,000
2,000
3,000
4,000
5,000
6,000
2012 2013 2014 2015 2016
(%)(billion yen)
Operating Expenses
Ratio to Premium Income
29
III Investment Results
1 Total Assets
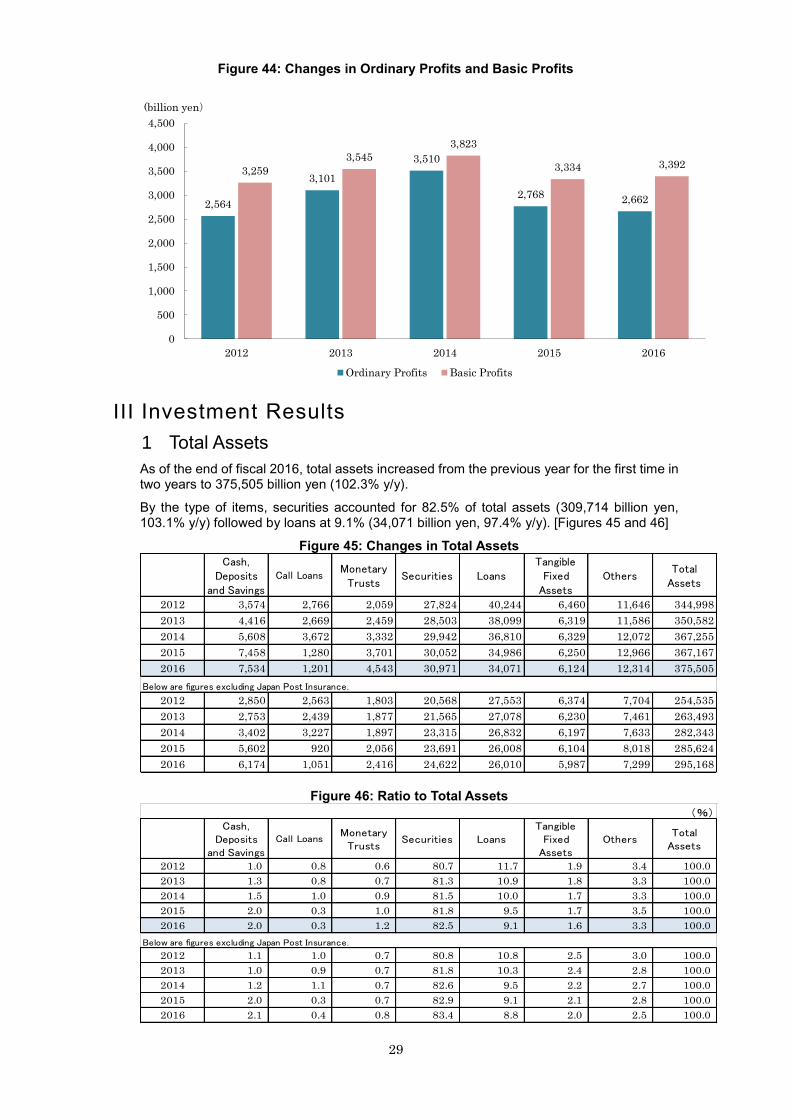
As of the end of fiscal 2016, total assets increased from the previous year for the first time in two years to 375,505 billion yen (102.3% y/y).
By the type of items, securities accounted for 82.5% of total assets (309,714 billion yen, 103.1% y/y) followed by loans at 9.1% (34,071 billion yen, 97.4% y/y). [Figures 45 and 46]
Figure 45: Changes in Total Assets
Figure 46: Ratio to Total Assets
2,564
3,101
3,510
2,7682,662
3,259
3,545
3,823
3,334 3,392
0
500
1,000
1,500
2,000
2,500
3,000
3,500
4,000
4,500
2012 2013 2014 2015 2016
(billion yen)
Ordinary Profits Basic Profits
Cash,Deposits
and Savings
Call LoansMonetary
TrustsSecurities Loans
TangibleFixed
AssetsOthers
TotalAssets
2012 3,574 2,766 2,059 27,824 40,244 6,460 11,646 344,998
2013 4,416 2,669 2,459 28,503 38,099 6,319 11,586 350,582
2014 5,608 3,672 3,332 29,942 36,810 6,329 12,072 367,255
2015 7,458 1,280 3,701 30,052 34,986 6,250 12,966 367,167
2016 7,534 1,201 4,543 30,971 34,071 6,124 12,314 375,505
2012 2,850 2,563 1,803 20,568 27,553 6,374 7,704 254,535
2013 2,753 2,439 1,877 21,565 27,078 6,230 7,461 263,493
2014 3,402 3,227 1,897 23,315 26,832 6,197 7,633 282,343
2015 5,602 920 2,056 23,691 26,008 6,104 8,018 285,624
2016 6,174 1,051 2,416 24,622 26,010 5,987 7,299 295,168
Below are figures excluding Japan Post Insurance.
Cash,Deposits
and Savings
Call LoansMonetary
TrustsSecurities Loans
TangibleFixed
AssetsOthers
TotalAssets
2012 1.0 0.8 0.6 80.7 11.7 1.9 3.4 100.0
2013 1.3 0.8 0.7 81.3 10.9 1.8 3.3 100.0
2014 1.5 1.0 0.9 81.5 10.0 1.7 3.3 100.0
2015 2.0 0.3 1.0 81.8 9.5 1.7 3.5 100.0
2016 2.0 0.3 1.2 82.5 9.1 1.6 3.3 100.0
2012 1.1 1.0 0.7 80.8 10.8 2.5 3.0 100.0
2013 1.0 0.9 0.7 81.8 10.3 2.4 2.8 100.0
2014 1.2 1.1 0.7 82.6 9.5 2.2 2.7 100.0
2015 2.0 0.3 0.7 82.9 9.1 2.1 2.8 100.0
2016 2.1 0.4 0.8 83.4 8.8 2.0 2.5 100.0
Below are figures excluding Japan Post Insurance.
(%)
Figure 44: Changes in Ordinary Profits and Basic Profits

30
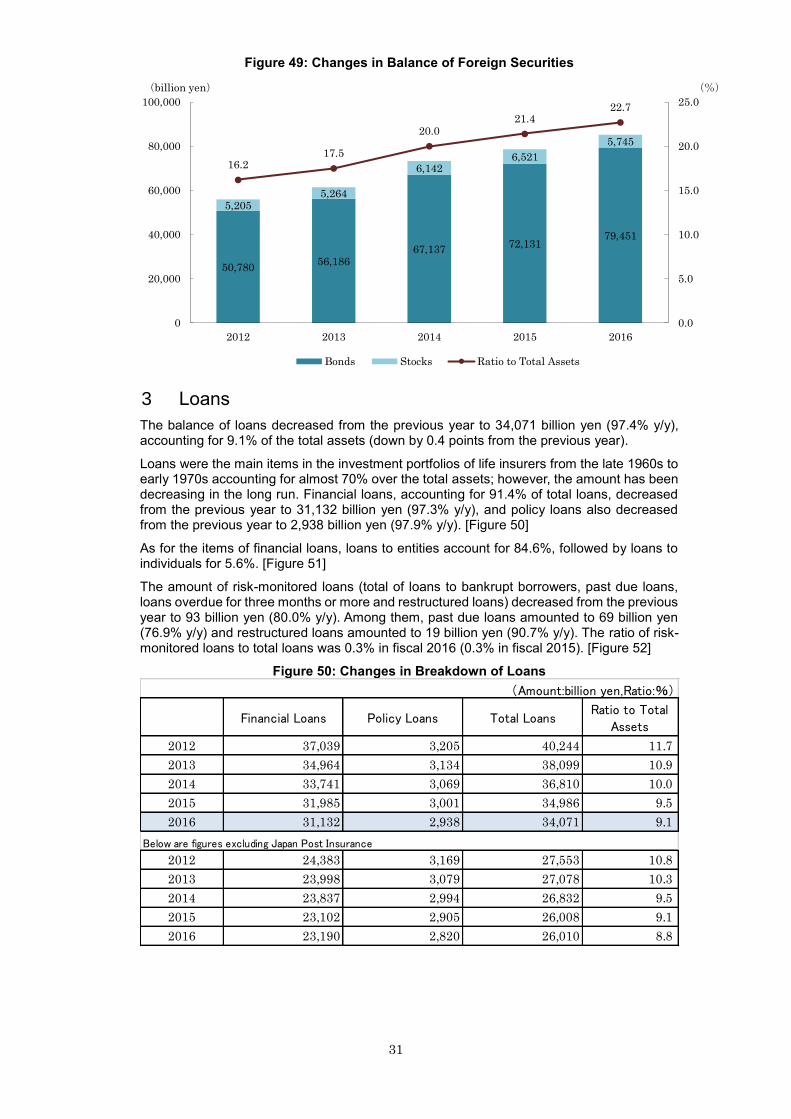
2 Securities
By the type of securities (309,714 billion yen in total), Japanese government bonds ranked top with 148,553 billion yen (99.99% y/y) accounting for 48.0% of the total securities, followed by foreign securities at 85,197 billion yen (108.3% y/y), corporate bonds at 25,824 billion yen (101.8% y/y), stocks at 21,514 billion yen (101.8% y/y) and local government bonds at 12,982 billion yen (96.0% y/y). [Figure 47]
Since the domestic interest rate remained low throughout fiscal 2016, financial resources were increasingly allocated to foreign securities etc., because of their comparatively higher interest rates. As a result, the amount of bonds (total of government bonds, local government bonds and corporate bonds) decreased for the third successive year (187,360 billion yen, 99.95% y/y). The amount of stocks increased for second successive year. Among the assets, the amount of bonds accounted for 49.9%, foreign securities for 22.7%, and stocks for 5.7% of the total in fiscal 2016. [Figures 48 and 49]
Of all the foreign securities, the amount of bonds (total of government bonds, local government bonds corporate bonds, and other foreign securities) stood at 79,451 billion yen (110.1% y/y), and the amount of stocks stood at 5,745 billion yen (88.1% y/y). [Figure 49]
Figure 47: Changes in Breakdown of Securities
Figure 48: Changes in Balance of Bonds and Stocks.
Total
Amount Ratio Amount Ratio Amount Ratio Amount Ratio Amount Ratio Amount Ratio Amount
2012 148,769 53.5 13,934 5.0 25,155 9.0 16,725 6.0 55,986 20.1 17,673 6.4 278,244
2013 149,815 52.6 14,008 4.9 24,895 8.7 18,029 6.3 61,450 21.6 16,830 5.9 285,031
2014 148,761 49.7 13,868 4.6 24,855 8.3 22,697 7.6 73,280 24.5 15,965 5.3 299,429
2015 148,568 49.4 13,517 4.5 25,363 8.4 19,813 6.6 78,653 26.2 14,607 4.9 300,523
2016 148,553 48.0 12,982 4.2 25,824 8.3 21,514 6.9 85,197 27.5 15,642 5.1 309,714
2012 92,296 44.9 5,236 2.5 18,671 9.1 16,724 8.1 55,084 26.8 17,673 8.6 205,686
2013 97,292 45.1 4,835 2.2 18,454 8.6 18,028 8.4 60,211 27.9 16,830 7.8 215,652
2014 100,675 43.2 4,312 1.8 18,202 7.8 22,696 9.7 71,299 30.6 15,965 6.8 233,152
2015 104,389 44.1 4,112 1.7 19,126 8.1 19,812 8.4 74,964 31.6 14,507 6.1 236,912
2016 105,821 43.0 3,755 1.5 20,125 8.2 21,455 8.7 80,845 32.8 14,225 5.8 246,228
Below are figures excluding Japan Post Insurance
GovernmentBonds
LocalGovernment
BondsCorporate Bonds Stocks Foreign SecuritiesOther Securities
(Amount:billion yen、Ratio:%)
31
Figure 49: Changes in Balance of Foreign Securities
3 Loans
The balance of loans decreased from the previous year to 34,071 billion yen (97.4% y/y), accounting for 9.1% of the total assets (down by 0.4 points from the previous year).
Loans were the main items in the investment portfolios of life insurers from the late 1960s to early 1970s accounting for almost 70% over the total assets; however, the amount has been decreasing in the long run. Financial loans, accounting for 91.4% of total loans, decreased from the previous year to 31,132 billion yen (97.3% y/y), and policy loans also decreased from the previous year to 2,938 billion yen (97.9% y/y). [Figure 50]
As for the items of financial loans, loans to entities account for 84.6%, followed by loans to individuals for 5.6%. [Figure 51]
The amount of risk-monitored loans (total of loans to bankrupt borrowers, past due loans, loans overdue for three months or more and restructured loans) decreased from the previous year to 93 billion yen (80.0% y/y). Among them, past due loans amounted to 69 billion yen (76.9% y/y) and restructured loans amounted to 19 billion yen (90.7% y/y). The ratio of risk-monitored loans to total loans was 0.3% in fiscal 2016 (0.3% in fiscal 2015). [Figure 52]
Figure 50: Changes in Breakdown of Loans
50,78056,186
67,13772,131
79,451
5,2055,264
6,1426,521
5,745
16.217.5
20.021.4
22.7
0.0
5.0
10.0
15.0
20.0
25.0
0
20,000
40,000
60,000
80,000
100,000
2012 2013 2014 2015 2016
(%)(billion yen)
Bonds Stocks Ratio to Total Assets
Financial Loans Policy Loans Total LoansRatio to Total
Assets
2012 37,039 3,205 40,244 11.7
2013 34,964 3,134 38,099 10.9
2014 33,741 3,069 36,810 10.0
2015 31,985 3,001 34,986 9.5
2016 31,132 2,938 34,071 9.1
2012 24,383 3,169 27,553 10.8
2013 23,998 3,079 27,078 10.3
2014 23,837 2,994 26,832 9.5
2015 23,102 2,905 26,008 9.1
2016 23,190 2,820 26,010 8.8
(Amount:billion yen,Ratio:%)
Below are figures excluding Japan Post Insurance

32
Figure 51: Changes in Financial Loans to Entities and Individuals
Note 1: Financial loans to entities include the loans to foreign entities in addition to the items described above. Note 2: Financial loans from Japan Post Insurance to SMEs include loans to Management Organization for Postal Savings and Postal Life Insurance. Note 3: The figures in parentheses represent year-on-year rate.
(Classification of Scale of Entities by the Type of Business)
Type of Business
① All Types of Business
Except for ② to ④ ② Retail and Eating and
Drinking Business ③ Service Business ④ Wholesale Business
Large Entities With more
than 300 employees and;
Capital of 1 billion yen or more With more
than 50 employees and;
Capital of 1 billion yen or more With more
than 100 employees and;
Capital of 1 billion yen or more With more
than 100 employees and;
Capital of 1 billion yen or more
Leading Medium-Sized Entities
Capital of more than 300 million yen and less than 1 billion yen
Capital of more than 50 million yen and less than 1 billion yen
Capital of more than 50 million yen and less than 1 billion yen
Capital of more than 100 million yen and less than 1 billion yen
SMEs With capital of 300 million yen or less or 300 or less full-time employees
With capital of 50 million yen or less or 50 or less full-time employees
With capital of 50 million yen or less or 100 or less full-time employees
With capital of 100 million yen or less or 100 or less full-time employees
Large EntitiesLeading
Medium-sizedEntities
SMEsHome
MortgagesConsumer
Loans
32,489 17,097 131 13,874 1,451 794
<94.5> <98.3> <85.4> <89.8> <92.4> <102.2>
30,443 16,594 139 12,104 1,400 808
<93.7> <97.1> <106.6> <87.2> <96.5> <101.7>
29,437 16,282 135 11,040 1,333 706
<96.7> <98.1> <97.3> <91.2> <95.2> <87.4>
27,798 15,659 156 9,989 1,251 646
<94.4> <96.2> <115.5> <90.5> <93.8> <91.6>
26,338 14,849 129 9,047 1,142 587
<94.7> <94.8> <82.8> <90.6> <91.3> <90.8>
20,286 16,881 131 1,888 1,451 794
<97.1> <98.0> <85.4> <89.2> <92.4> <102.2>
19,981 16,351 139 1,885 1,400 808
<98.5> <96.9> <106.6> <99.8> <96.5> <101.7>
20,067 16,027 135 1,925 1,333 706
<100.4> <98.0> <97.3> <102.1> <95.2> <87.4>
19,505 15,439 156 1,916 1,251 646
<97.2> <96.3> <115.5> <99.5> <93.8> <91.6>
19,067 14,673 129 1,951 1,142 587
<97.8> <95.0> <82.8> <101.8> <91.3> <90.8>
2013
2016
2015
2014
2015
2016
Below are figures exclusing Japan Post Insurance
2012
2014
Loans to Individuals
(billion yen, %)
2012
2013
Loans to Entities

33
Figure 52: Changes in Amount of Risk-Monitored Loans
4 Tangible Fixed Assets (Real Estate)
Of the total amount of tangible fixed assets (6,124 billion yen), the amount of real estate, which is the total amount of land, buildings and construction in process, was 6,027 billion yen (97.9% y/y). The total amount of tangible fixed assets accounts for 1.6% of the total assets for fiscal 2016.[Figures 45 and 53]
Figure 53: Changes in Balance of Real Estate
IV Liabilities and Net Assets
Total liabilities stood at 352,674 billion yen (102.6% y/y), accounting for 93.9% of gross capital (the total of liabilities and net assets). By the items of liabilities, insurance reserves account for 92.8% of total liabilities. Of all the insurance reserves, policy reserves, which are reserved for future insurance claim payments, account for 98.1% of total policy reserves. Other than that, reserves for policyholder dividends account for 1.3%, which are reserved for paying dividends on insurance contracts, and reserves for outstanding claims account for 0.7%, which are reserved for unclaimed insurance payable. [Figure 54 (upper panel)]
Meanwhile, total net assets were 22,830 billion yen (97.6% y/y), accounting for 6.1% of gross capital. It decreased from the previous year due to the decrease in "total valuation, translation adjustment, and others". [Figure 54 (lower panel)]

34
Figure 54: Liabilities and Net Assets
Breakdown of Liabilities (Billion、%)
Amount Ratio of Liabilities Ratio
327,298 92.8 87.2
Reserves for Outstanding Claims 2,180 0.6 0.6
Policy Reserves 321,021 91.0 85.5
Reserves for Policyholder Dividends 4,095 1.2 1.1
4,100 1.2 1.1
21,275 6.0 5.7
352,674 100.0 93.9
Amount Ratio of Net Assets Ratio
Total Foundation Funds and others or Total Stockholders' Equity10,684 46.8 2.8
Fund or Capital 2,840 12.4 0.8
Accumulated Redeemed Foundation Funds 2,376 10.4 0.6
Capital Surplus 1,872 8.2 0.5
Surplus or Retained Earnings 3,570 15.6 1.0
Others 24 0.1 0.0
12,146 53.2 3.2
0 0.0 0.0
22,830 100.0 6.1
37,550 - 100.0
Total Net Assets
Total Liabilities and Net Assets
Total Valuation, TranslationAdustment, and Others
Stock Acquisition Rights
Insurance Reserves
Reserves for Price Fluctuations
Others
Total Liablities
Breakdown of Net Assets
35
Reference
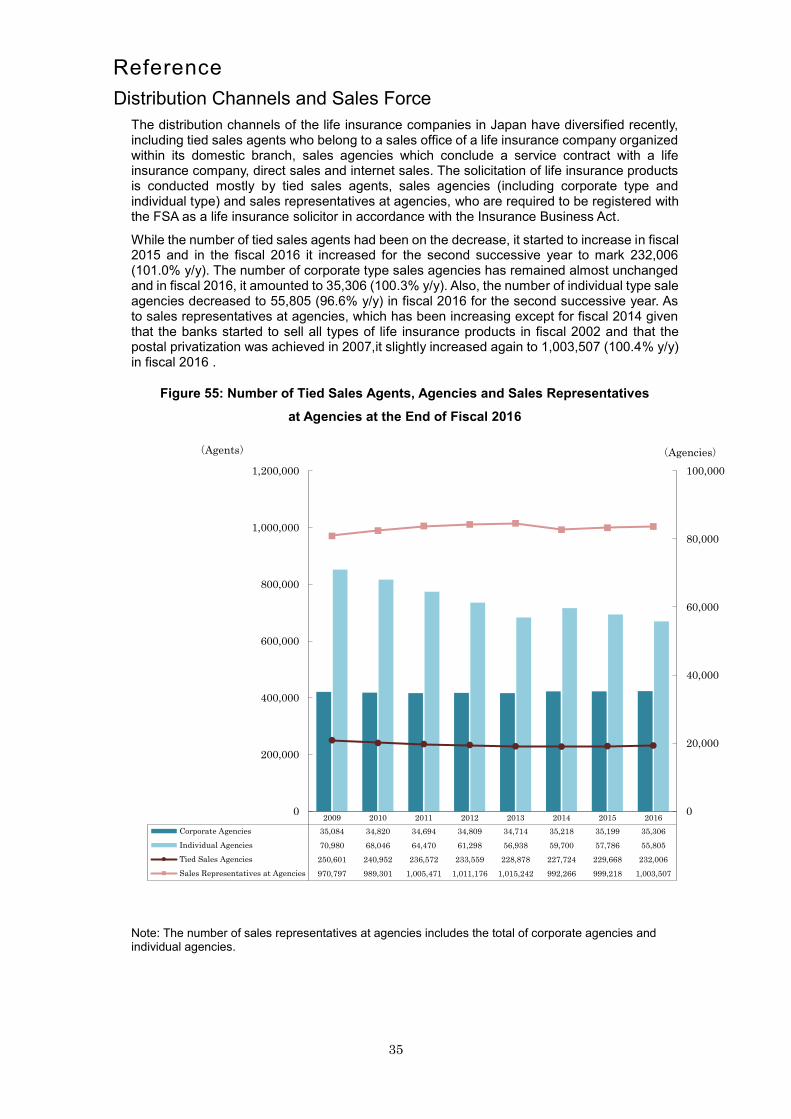
Distribution Channels and Sales Force
The distribution channels of the life insurance companies in Japan have diversified recently, including tied sales agents who belong to a sales office of a life insurance company organized within its domestic branch, sales agencies which conclude a service contract with a life insurance company, direct sales and internet sales. The solicitation of life insurance products is conducted mostly by tied sales agents, sales agencies (including corporate type and individual type) and sales representatives at agencies, who are required to be registered with the FSA as a life insurance solicitor in accordance with the Insurance Business Act.
While the number of tied sales agents had been on the decrease, it started to increase in fiscal 2015 and in the fiscal 2016 it increased for the second successive year to mark 232,006 (101.0% y/y). The number of corporate type sales agencies has remained almost unchanged and in fiscal 2016, it amounted to 35,306 (100.3% y/y). Also, the number of individual type sale agencies decreased to 55,805 (96.6% y/y) in fiscal 2016 for the second successive year. As to sales representatives at agencies, which has been increasing except for fiscal 2014 given that the banks started to sell all types of life insurance products in fiscal 2002 and that the postal privatization was achieved in 2007,it slightly increased again to 1,003,507 (100.4% y/y) in fiscal 2016 .
Figure 55: Number of Tied Sales Agents, Agencies and Sales Representatives
at Agencies at the End of Fiscal 2016
Note: The number of sales representatives at agencies includes the total of corporate agencies and individual agencies.
2009 2010 2011 2012 2013 2014 2015 2016
Corporate Agencies 35,084 34,820 34,694 34,809 34,714 35,218 35,199 35,306
Individual Agencies 70,980 68,046 64,470 61,298 56,938 59,700 57,786 55,805
Tied Sales Agencies 250,601 240,952 236,572 233,559 228,878 227,724 229,668 232,006
Sales Representatives at Agencies 970,797 989,301 1,005,471 1,011,176 1,015,242 992,266 999,218 1,003,507
0
20,000
40,000
60,000
80,000
100,000
0
200,000
400,000
600,000
800,000
1,000,000
1,200,000
(Agencies)(Agents)
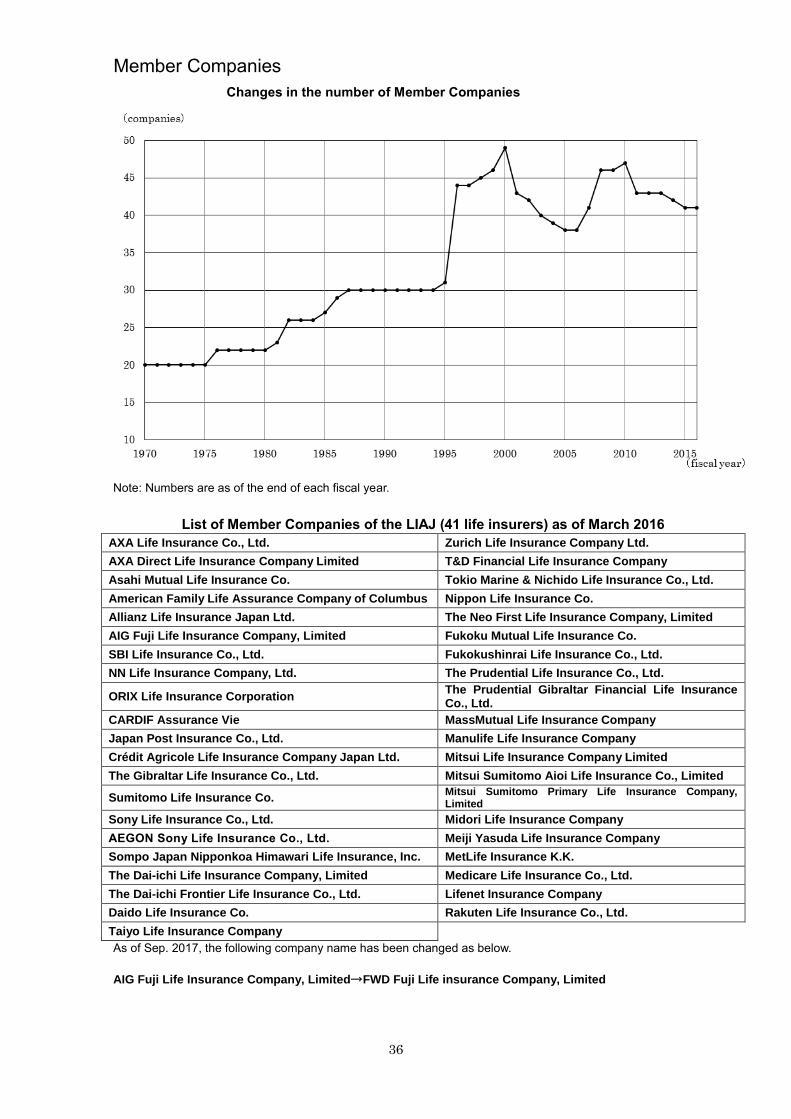
36
Member Companies
Changes in the number of Member Companies
Note: Numbers are as of the end of each fiscal year.
List of Member Companies of the LIAJ (41 life insurers) as of March 2016
AXA Life Insurance Co., Ltd. Zurich Life Insurance Company Ltd.
AXA Direct Life Insurance Company Limited T&D Financial Life Insurance Company
Asahi Mutual Life Insurance Co. Tokio Marine & Nichido Life Insurance Co., Ltd.
American Family Life Assurance Company of Columbus Nippon Life Insurance Co.
Allianz Life Insurance Japan Ltd. The Neo First Life Insurance Company, Limited
AIG Fuji Life Insurance Company, Limited Fukoku Mutual Life Insurance Co.
SBI Life Insurance Co., Ltd. Fukokushinrai Life Insurance Co., Ltd.
NN Life Insurance Company, Ltd. The Prudential Life Insurance Co., Ltd.
ORIX Life Insurance Corporation The Prudential Gibraltar Financial Life Insurance Co., Ltd.
CARDIF Assurance Vie MassMutual Life Insurance Company
Japan Post Insurance Co., Ltd. Manulife Life Insurance Company
Crédit Agricole Life Insurance Company Japan Ltd. Mitsui Life Insurance Company Limited
The Gibraltar Life Insurance Co., Ltd. Mitsui Sumitomo Aioi Life Insurance Co., Limited
Sumitomo Life Insurance Co. Mitsui Sumitomo Primary Life Insurance Company, Limited
Sony Life Insurance Co., Ltd. Midori Life Insurance Company
AEGON Sony Life Insurance Co., Ltd. Meiji Yasuda Life Insurance Company
Sompo Japan Nipponkoa Himawari Life Insurance, Inc. MetLife Insurance K.K.
The Dai-ichi Life Insurance Company, Limited Medicare Life Insurance Co., Ltd.
The Dai-ichi Frontier Life Insurance Co., Ltd. Lifenet Insurance Company
Daido Life Insurance Co. Rakuten Life Insurance Co., Ltd.
Taiyo Life Insurance Company
As of Sep. 2017, the following company name has been changed as below.
AIG Fuji Life Insurance Company, Limited→FWD Fuji Life insurance Company, Limited

37
Part 2
The Life Insurance Association of Japan
(LIAJ)

38
1. The LIAJ’s Topics for Fiscal 2016
1. Promotion of Friendly Life Insurance Services for the Elderly
(1)“The Recommendation on Utilization of the Individual Number System in the Private Sector"
The LIAJ issued “The Recommendation on Utilization of the Individual Number System in the Private Sector”
for promotion of friendly life insurance services for the elderly". In further striving for improvement of service
quality in serving the elderly by ensuring smooth and prompt service processing and accessibility, utilization
by the life insurers of the Individual Number System, which is a newly-introduced public infrastructure went
into operation in 2016, would enable them to introduce effective measurers for better servicing the elderly.
Based on this recognition, the LIAJ made the recommendation on utilization of the Individual Number
System in the private sector. The life insurance business by nature plays key social role to support people's
lives financially by appropriately providing insurance benefits. Giving particular focus on the elderly
customers under the rapid aging, the life insurance industry will continue improving its services in order to
provide peace of mind through fulfilling such key social role.
◆ Examples of Utilization of the Individual Number System by Life Insurers
②Access to the official administrative information on current address of the elderly
③Delivering notices to each elderly via Individual Number Web Portal
①Access to the official administrative information on existence (alive/dead) of the elderly
・By obtaining information on existence (dead) of the elderly, lifeinsurers can reach out to the beneficiaries to facilitate insuranceclaims.
・By obtaining information on existence (alive) of the elderly, lifeinsurers will no longer need to check with supportingdocumentation to confirm the life, which would be required forclaims filing for whole life annuity contracts.
Effective and efficient confirmation of existence of the elderly
Smooth and prompt receptionof benefit
Less burdensome claims filing
Benefits for customers
・By obtaining current contact address of the elderly policyholderwhen it is unknown to the insurers, life insurers can continueproviding follow-up services.
Effective and efficient confirmation of elderly policyholders’ contact addresses
Timely and sure reception ofservices from life insurers
Benefits for customers
・By delivering important notice documents (e.g. notification ofmaturity) and certificates for tax deduction for life insurancepremium via the Web portal of Individual Number System, lifeinsurers can provide relevant information to the policyholderstimelily and surely.
Enhancement of user-friendliness for elderly policyholders
Timely and sure reception ofimportant notices from lifeinsurers
Benefits for customers

39
(2) The LIAJ Symposium Held on 19 January, 2017
In the symposium, good practices that give due consideration to the characteristics of the elderly customers
by member companies were shared and challenges and benefit of "utilization of the Individual Number
System in the private sector" were discussed. Mr. Haruki Mukai, Councilor, Cabinet Secretariat, delivered key
note speech, followed by a panel discussion about "Promotion of Friendly Life Insurance Services for the
Elderly: Recommendation on Utilization of the Individual Number System in the Private Sector" by five
panelists. The discussion provided valuable inputs into the development of the recommendation
2. Promotion of Insurance Education
Participating rate of life insurance is declining especially for younger people. This could threaten peace of
mind for society in the future. To address this concern, a broader understanding of the role and importance
of self-help efforts is essential. Accordingly, the LIAJ helped spread the knowledge that people need in order
to make their own financial plans.
In particular, in addition to existing efforts by the LIAJ such as providing teaching materials, the LIAJ discussed
increasing opportunities for insurance education at school and providing input to the parties concerned so
that students can learn the role of insurance in life planning.
Recognising that these initiatives are critical for the life insurance business, the LIAJ continues to conduct
them not for a single year but over the medium to long term in cooperation with the Japan Institute of Life
Insurance. the LIAJ conducted initiatives below.
(1) Support for Teachers
In consultation with junior-high and high school teachers, Ministry of Education, Culture, Sports, Science and
Technology and Ministry of Health, Labour and Welfare, the LIAJ developed teaching materials through which
students can learn the roles and benefits of social security system and insurance in social studies (civics)
classes in junior-high schools and civics classes in high schools and the implementation manual for teachers.
○ Teaching Materials and Web Portal for Teachers
Teaching Materials
Teaching material for social studies classes in junior-high schools:
“Corporate Roles and Responsibilities in the Society: How do the insurance companies
contribute to the society?”
Teaching material for civics classes in high schools:
“Let’s study Basics of Social Security System and Insurance!”
Web Portal
The LIAJ opened the Web portal that enables one-stop provision of information regarding
education on social security and insurance to teachers in junior-high and high schools.
The Web portal includes access to teaching materials on social security prepared by the Minis-
try of Health, Labour and Welfare and those on life planning and life security prepared by Japan
Institute of Life Insurance, and introduction of efforts made by member companies and the LIAJ.
40
(2) Recommendation for Greater Opportunity for Insurance Education at Schools in the Report
on Enhancement of insurance Education
The LIAJ made a recommendation for greater opportunity for insurance education at schools in its report
"The Report on Enhancement of Insurance Education" in April 2016 and o. The LIAJ conducted a teachers'
survey by sending out questionnaire to teachers who are teaching social science (civics) or domestic
science in 15,513 junior/senior high schools all over Japan as well as a field survey in some major Western
countries. The report put together the survey results in order to identify current practices and problems that
need to be solved regarding insurance education at schools. The report then makes a recommendation
for greater opportunity for insurance education at schools.
In 2017, the new junior high school curriculum guideline and its commentary, which reflected the LIAJ’s
recommendation, noted that "private insurance" and "self-help, mutual assistance and public assistance
are most appropriately used where in learning social security in social science (civics). The textbooks
reflecting the new curriculum guidelines will be used from FY 2021. In order to provide future generations
with necessary competence to live their life with financial security, the LIAJ will further enhance initiatives
regarding insurance education through which they can learn the importance of self-help efforts in financial
preparation for their future life security.
○ Summary of the Recommendation
When the social security system is mentioned in the class, it should be ensured that the
importance of self-help efforts and the benefit of the function of insurance is also communicated.
More practically, they should be learnt in both contexts of: the study of domestic science that
focuses on personal life, and the study of social science (civics) that focuses on social life.
Domestic Science: While the current standard course provides that insurance should be
introduced in high school classes as a tool to manage risks in one's life planning, the course
curriculum should be expanded to introduce insurance in the context of the social security
system as a tool to prepare for one's future life security.
Social Science (Civics): While the current standard course provides that social security
system should be mentioned in junior-high and high school classes, the course should be
improved to ensure that the importance of self-help efforts and the benefit of the use of
insurance in their financial preparation for their future life security is communicated.
In implementing the above policy, teaching materials or lecturers provided by life insurance sector
should be recognized and used as appropriate.

41
(3) Publication of "Casebook on Industry Initiatives on Insurance Education" as Past Initiatives
In February 2016, the LIAJ published a casebook that introduces voluntary and active initiatives by member
companies in the area of insurance education.
○ About the Casebook
The LIAJ conducted a survey of member companies on their initiatives for "provision of
knowledge about insurance" and "seminars and lectures" in the area of insurance education to
achieve the better understanding on the important role of self-help efforts. The casebook
introduces survey responses as follows:
Provision of Knowledge about Insurance: Member companies are providing knowledge
about insurance through their website, education materials and other tools.
Seminars and Lectures: Member companies are providing lecturers, endow courses,
opportunities for workplace experience, education events, and education for teachers and
consumer consultants. In fiscal 2014, these events were held 532 times in total and about
46,000 people participated in such events.
Other Initiatives: The Japan Institute of Life Insurance and the LIAJ are also promoting
initiatives to deepen the understanding on life insurance and life planning by people of all
generations through the "all generation-responsive package" supporting the consumer
understanding.
Through taking advantages of member companies' initiatives shared in the Case Studies, the
LIAJ will further support member companies in introducing and conducting voluntary and active
measures in the area of insurance education and enhance initiatives taken by the life insurance
industry as a whole.

42
2. The LIAJ's Key Activities
1. Activities to Provide Information and Promote Understanding on
the Life Insurance Business
(1) Holding Interactive Dialogues on Life Insurance and Periodical Engagement with Consumers'
Groups/Organizations
The LIAJ holds the "Interactive Dialogue on Life Insurance" in cooperation with the Japan Institute of
Life Insurance (JILI), with the aim of promoting a proper understanding of the life insurance business
through dialogues with consumers’ groups/organizations. In fiscal 2016, the LIAJ held 129 meetings in
total across Japan with consumers' groups/organizations and journalists. Additionally, the LIAJ
periodically visits such organizations to provide information and hear their opinions on the life insurance
industry and the LIAJ's activities.
(2) Providing Basic Information and Knowledge about Life Insurance on the Website
The LIAJ posts basic life insurance information and knowledge on its website, covering various topics.
Also, using a "Quick Search for Life Insurance Products" on the LIAJ's website, customers can find
relevant information on life insurance products.
(3) Publication of a Summary of Life Insurance Statistics
The LIAJ collects statistics on the life insurance business of all life insurers monthly, quarterly, and
annually, and publishes these statistics on its website. In addition, the LIAJ prepares and publishes "Life
Insurance Fact Book" which summarizes the key performance of life insurers and the results of the life
insurance industry, and "Statistical Data Package of Life Insurance Market in Japan" which contains
detailed statistical data of life insurers.
(4) Review and Further Refinement of Standards for Disclosure
Laws stipulate detailed items to be disclosed by life insurers regarding their business operation. The
LIAJ has also prepared a set of industry-wide "Standards for Disclosure" with additional items that it
considers should be voluntarily added by member companies in the light of usefulness for customers
and investors. The LIAJ reviews these standards every year for possible refinement.
(5) Publication of a Guidebook on Financial Reports of Life Insurers
The LIAJ has prepared a guidebook on financial reports of life insurers to help customers better
understand business conditions of life insurers and has published it on their website.
(6) Providing Disclosure Materials of Life Insurers
In addition to prepare disclosure materials of life insurers in the LIAJ's headquarters and local offices,
the LIAJ provides them to about 400 consumer centers across Japan in order to improve access to the
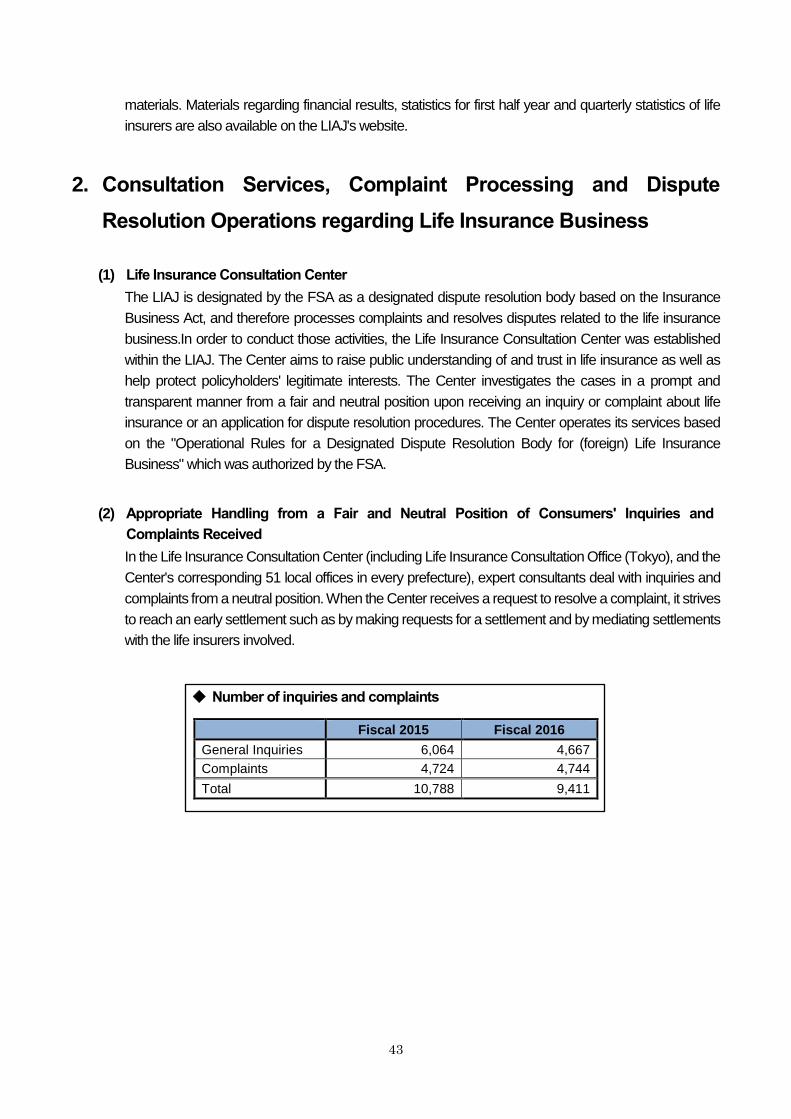
43
materials. Materials regarding financial results, statistics for first half year and quarterly statistics of life
insurers are also available on the LIAJ's website.
2. Consultation Services, Complaint Processing and Dispute
Resolution Operations regarding Life Insurance Business
(1) Life Insurance Consultation Center
The LIAJ is designated by the FSA as a designated dispute resolution body based on the Insurance
Business Act, and therefore processes complaints and resolves disputes related to the life insurance
business.In order to conduct those activities, the Life Insurance Consultation Center was established
within the LIAJ. The Center aims to raise public understanding of and trust in life insurance as well as
help protect policyholders' legitimate interests. The Center investigates the cases in a prompt and
transparent manner from a fair and neutral position upon receiving an inquiry or complaint about life
insurance or an application for dispute resolution procedures. The Center operates its services based
on the "Operational Rules for a Designated Dispute Resolution Body for (foreign) Life Insurance
Business" which was authorized by the FSA.
(2) Appropriate Handling from a Fair and Neutral Position of Consumers' Inquiries and
Complaints Received
In the Life Insurance Consultation Center (including Life Insurance Consultation Office (Tokyo), and the
Center's corresponding 51 local offices in every prefecture), expert consultants deal with inquiries and
complaints from a neutral position. When the Center receives a request to resolve a complaint, it strives
to reach an early settlement such as by making requests for a settlement and by mediating settlements
with the life insurers involved.
◆ Number of inquiries and complaints
Fiscal 2015 Fiscal 2016
General Inquiries 6,064 4,667
Complaints 4,724 4,744
Total 10,788 9,411

44
(4) Dispute Resolution by "Arbitration Council"
When a customer files a complaint with the Center, the Center facilitates communication between the
life insurer involved and the customer to reach a settlement. In principle, if they cannot reach a settlement
within one month, the Center convenes the Arbitration Council to resolve the dispute. The Arbitration
Council currently consists of 17 members (7 lawyers, 7 consumer advisors and 3 staff of the Life
Insurance Consultation Center) and strives to resolve the dispute appropriately from a fair and neutral
position.
◆ Flow of Procedure to Apply for the Arbitration Council
◆ Number of Filings for Procedures of the Arbitration Council
FY 2009 2010 2011 2012 2013 2014 2015 2016
Number 122 172 260 208 202 194 312 355
(5) Establishment of Arbitration Advisory Committee Consisting of External Experts
The Life Insurance Consultation Center established the Arbitration Advisory Committee consisting of
external experts such as scholars, lawyers, doctors, representatives of consumer organizations and full-
time executives of the LIAJ. In addition to responding to consultations by the Head of the Life Insurance
Consultation Center (Chairman of the LIAJ), the Arbitration Advisory Committee makes
recommendations and proposals, as appropriate, to ensure fair and smooth operation of the Center's
business and the Arbitration Council. The Center has a scheme for reflecting those recommendations
and proposals in the measures of the LIAJ and member companies.
Arbitration Council
Filing of Complaint
Judging of
appropriateness
Receive complaint
Arrange
negotiation
Settlement reached
Dispute unresolved
Fact-finding
through
documents,
hearings, etc.
Deliberation
Preparation/
presentation
of settlement
proposal
RefusalArbitration completed
by ruling
Settlement reached
Arbitration
unsuccessful
45
(6) Provision of Information regarding Consultations and Complaints
The Center publishes the annual "Life Insurance Consultation Center Report" and "Summaries of
Arbitration", which summarize the inquiries and complaints received during the year. To help prevent
disputes and their recurrence, the Center also prepares the quarterly "Voice Report" (sector-wide basis
and individual insurer basis), which provides information about inquiries and complaints in categories,
their numbers, as well as typical complaints that have been filed. In addition, the LIAJ discloses the
number of complaints by company on its website to ensure a neutral, fair and transparent process for
complaint handling.
(7) Reflecting Complaints in Improvement of Management
The life insurance industry is struggling to reflect complaints in improvement of their management. To
help make customers aware of the trend of complaints and how member companies deal with their
complaints, the LIAJ discloses information including the number and details of complaints as well as
those of payment/non-payment of insurance claims on the LIAJ's and member companies' websites.
3. Activities regarding Systems and Measures to Ensure
Appropriate Operation of the Life Insurance Business
(1) Development of the Code of Conduct for Member Companies
In order to achieve greater reliability on insurance business, the LIAJ has developed the "Code of
Conduct" that member companies and their officers/employees must follow. The Code of Conduct
consists of the "Principles of Conducts", the principles and standards which should be complied with by
each life insurer and its employees as they operate a company and conduct business, and the "Action
Guidelines" that should also be complied with.
(2) Development and Review of Voluntary Guidelines Suggesting Practical Points to Consider
To help life insurers to provide appropriate handling and best services for policyholders, from arranging
the contract to the payment of benefits, the LIAJ has developed voluntary guidelines which suggest
practical transactions and points to consider. These guidelines are referred to by each member
company and their executives and regular employees, and are periodically reviewed by the LIAJ.
(3) Collection of Best Practices to Reflect in Improvement of Management
The LIAJ had conducted "Follow-Up Survey" to monitor the measures taken by member companies in
accordance with voluntary guidelines and to better reflect objectives of the guidelines in their
management. Meanwhile, Consumers' Opinions Task Force, the cross-sectional body within the LIAJ,
had conducted survey to collect and analyze information on counseling, complaints, opinions or
requests received from outside of life insurance industry, and to collect member companies' initiatives
in the field where many complaints or requests were seen. Since 2015, these two surveys were
integrated into the regular "Value-Up Survey" to monitor the measures taken by member companies in

46
accordance with the voluntary guidelines. Through collecting and sharing examples of practices
adopted by member companies to improve customer services including measures reflecting the
opinions and requests from consumers and through improving the PDCA management cycle within
member companies, the LIAJ encourages them to adopt the guidelines in their management.
(4) Efforts to Address Revisions to the Insurance Business Act and Encouraging Establishment
of Management Systems for Appropriate Solicitation
As the business environment surrounding the Japanese insurance market is changing significantly (e.g.
diversification of the distribution channel), partial revisions were made to the Insurance Business Act
fully implemented on May 29, 2016 to introduce fundamental rules for insurance solicitation (e.g.
obligation to confirm customers' intention and to provide necessary information) and obligation on
insurance agencies to have management systems for appropriate solicitation in place. The LIAJ
encourages the member companies' establishment and operation of management systems for
appropriate solicitation by compiling and publishing a commentary in the form of questions and answers
on main points of the revision and drawing up "Guidelines for Insurance Agents to Have Management
Systems for Appropriate Solicitation in Place" and "Guidelines for Solicitation-related Activities".
(5) Activities as Authorized Personal Information Protection Organization
The LIAJ was accredited as an Authorized Personal Information Protection Organization by the
Financial Services Agency under the Act on the Protection of Personal Information in April 2005. The
LIAJ developed the Personal Information Protection Guidelines and provides guidance or
recommendations on complying with the guidelines to each member company, and also receives
related complaints from customers and shares them with member companies.
(6) Measures to Prevent Abuse of Life Insurance
Life insurance has the risk to be abused to make illegitimate profits (moral risk). The LIAJ is taking
various measures to mitigate this moral risks as well as cooperating with the police's investigation to
avoid overlooking of death caused by crimes.
Policy Data Registration System
When life insurance companies receive an application for insurance policy (including riders like
death benefit and hospitalization benefit), the relevant data of policyholders may be stored at the
registration center within the LIAJ. Life insurance companies refer to the registered details to judge
whether to accept a contract or whether to pay claims for death or hospitalization benefits, to
prevent attempts to receive insurance claims fraudulently by enrolling in several insurance policies
for short periods.
Policy Data Inquiry System
Life insurance companies and the National Mutual Insurance Federation of Agricultural
Cooperatives (Zenkyoren) have jointly operated the Policy Data Inquiry System to contribute to the
sound development of life insurance and cooperative systems since April 2002. Under the system,
the data held by Zenkyoren and the data registered in the Policy Data Registration System by the
LIAJ can be cross-referenced. They refer to the registered details to judge whether to accept a
contract or whether to pay claims for death or hospitalization benefits.

47
Cross Reference System for Assessing Insurance Claims
Upon receiving an insurance claim, participating insurance companies cross-reference each
other's data on policyholders. They then use the information when deciding whether to accept a
claim from a policyholder.
Liaison Conference between Life Insurers and the Police
In order to prevent the criminal abuse of life insurance, the LIAJ holds liaison meetings with the
National Police Agency. The "Liaison Conference between Life Insurers and the Police" is held
between the LIAJ's 52 local offices and municipal police headquarters to exchange information on
organized crime groups, special frauds and prevention of moral hazard.
(7) Measures against Special Frauds
Against special fraud, which has become a social issue, the LIAJ creates posters to call consumers'
attention in collaboration with the National Police Agency and the Financial Services Agency in addition
to distributing flyers to attract consumers' attention in its local offices across Japan.
(8) Measures against Money Laundering
The LIAJ creates a handbook, a commentary in the form of questions and answers and a poster to be
displayed for customers, to raise life insurance companies' understanding regarding money laundering.
(9) Measures against Anti-social Forces
The LIAJ has declared its commitment to cutting off any relations with anti-social forces (ASF). In this
regard, the LIAJ is taking measures such as encouraging member companies to add a clause that
enables insurers to terminate their contracts with ASF into the policy clauses, establishing a database
regarding anti-social forces for member companies' reference, and holding discussions with other
organizations in order to dissolve any insurance contracts with ASF or related parties.

48
○ Efforts to Combat Tax Evasion
Foreign Account Tax Compliance Act
On March 18, 2010, the Foreign Account Tax Compliance Act (FATCA) was enacted in the U.S.
as part of the Hiring Incentives to Restore Employment Act of 2010, with the aim of preventing tax
evasion by U.S. taxpayers using offshore financial accounts. Under the Act, foreign financial
institutions outside of the U.S. are required to report certain information about financial accounts
held by U.S. taxpayers directly to the U.S Internal Revenue Service (IRS). As of July 1, 2014, in
accordance with the "Statement of Mutual Cooperation and Understanding between the U.S.
Department of the Treasury and the Authorities of Japan to Improve International Tax Compliance
and to Facilitate Implementation of FATCA", Japanese life insurance companies started
implementing the due diligence procedures to identify certain financial accounts held by U.S.
taxpayers when concluding life insurance policy. And also, they started reporting the account
information to the IRS when the customers are identified as U.S. taxpayers.
OECD Common Reporting Standard
Following the increased demands for uniforming information exchanged between each country
with the aim of preventing tax evasion in accordance with the Automatic Exchange of Financial
Account Information (AEOI), the OECD also released a full version of Common Reporting
Standard (CRS) for AEOI prepared by the OECD Committee on Fiscal Affairs on July 21, 2014.
As for Japan, the Cabinet approved the implementation of the CRS, beginning January 1, 2018
(i.e. committed to first automatic exchange of information in 2018) on January 14, 2015. In Japan,
relevant legislations to support CRS were published on March 31, 2015, which came into force
on January 1, 2017. The legislations require life insurance companies in Japan to collect and
report to the National Tax Agency, non-resident account holder information sorted by residence
jurisdiction, after identifying the residence of the account holder by prescribed due diligence
procedures.

49
(10) LINC (The Life Insurance Network Center)
The life insurance industry established an industry-wide network system called the Life Insurance
Network Center, or LINC in 1986. This network has been striving to enrich their services to improve
information security in the insurance industry, and also reduces the burden of clerical work for client
companies. With several improvements to the network system since its establishment, the Center
currently operates the following 12 systems.
◆ LINC Systems
System Outline of Functions
1 Inter-network settlement system
among member companies To enable fund settlement among life insurers.
2
Data exchange system on
individual policies whose monthly
premiums are collected through
payrolls
To integrate data on individual policies whose premiums
are collected through payroll deduction and exchange
them between life insurers and client companies which
make payroll deductions.
3 Data exchange system
on asset-formation insurance
To act as an intermediary for exchanging data on asset-
formation insurance.
4 Registration system
on medical care insurance
To register the details of medical care insurance
contracts to check whether the same person is
designated as a medical care insured with several
insurance companies.
5 Registration system
on life insurance solicitors
To perform application procedures for registration of life
insurance solicitors and manage the register.
6 Registration system
on policy data
To register the details of contracts to check contracts
which designate the same person as a beneficiary of
hospitalization and death benefits in order to prevent
moral hazard.
7 Data distribution system on
National Pension Fund insurance
To collect and distribute data on National Pension Fund
insurance contracts to life insurers offering the
insurance.
8 Data exchange system
on life insurance business statistics
To collect statistical data from life insurers to prepare
materials on the business performance of the life
insurance industry.
9
Data exchange system on joint
Employee's Pension Fund
Insurance Report
To exchange data between life insurers and trust banks
to prepare the joint report on the Employees' Pension
Fund.
10 Cross referencing system
for assessing insurance claims
To cross-reference contracts among life insurers when a
claim is filed for insurance benefits and mutual aid
money in order to judge whether to pay the benefits,
cancel the contracts or allow the contracts to lapse in
order to prevent moral hazard.
11
Data exchange system on
corporate pension plans among
principal companies
To exchange settlement data on Employees' Pension
Funds and Defined Benefit Corporate Pensions among
principal life insurers and principal trust companies.
12 Statistics collection system on
incidence rates including mortality
To collect survey data on incidence rates including
mortality from life insurers and prepare statistical
materials.
50
(11) Promotion of Initiatives to Ensure Appropriate Business Operation
To ensure appropriate business operation, the LIAJ conducts several initiatives to encourage staff to
have the basic knowledge and improve their skills through the following examinations.
Examination for Life Insurance Claims Assessors
The LIAJ has been conducting the "Exam for Life Insurance Claims Assessors" since fiscal 2007.
This exam encourages staff who handle claims at life insurers to acquire the basic knowledge and
good judgment required by the staff with the aim of fostering such human resources, and
maintaining and improving their abilities in the light of securing proper payout practices.
Examination for Life Insurance Interviewers
When an applicant applies for a contract, whether to accept the contract is determined based on,
for example, the declaration form or a doctor's medical examination. As a way of determination,
the life insurance interviewer interviews the insured and checks their health. The LIAJ administers
qualification exam for interviewers.
(12) Development of Measures to Prepare for Disasters
To fulfill the social mission of the life insurance industry, the LIAJ takes several measures to continue its
important business such as payment of insurance benefits, even in extraordinary situations such as a
serious disaster or a pandemic of a new strain of influenza. Also, in light of the lessons learnt from the
Great East Japan Earthquake, life insurance companies reviewed and improved their countermeasures
against disaster as well as their services and business procedures. Life insurance companies reviewed
their business continuity plan (BCP) after the earthquake, and is striving to enhance their customer
services in ordinary situations.
(13) Operation of the Center for Locating Life Insurance Contracts in Disaster Areas
The LIAJ is operating the Center for Locating Life Insurance Contracts in Disaster Areas after the Great
East Japan Earthquake for those who were struck by disasters in designated disaster areas. Under this
search system, all member companies search for relevant insurance contracts for people who struggle
to claim insurance benefits because they have lost evidence of their contracts in a disaster or are not
sure of their insurance companies. Currently, the scope of this system has been expanded to any cases
where people have lost evidence of insurance contracts in an area covered by the Disaster Relief Act.
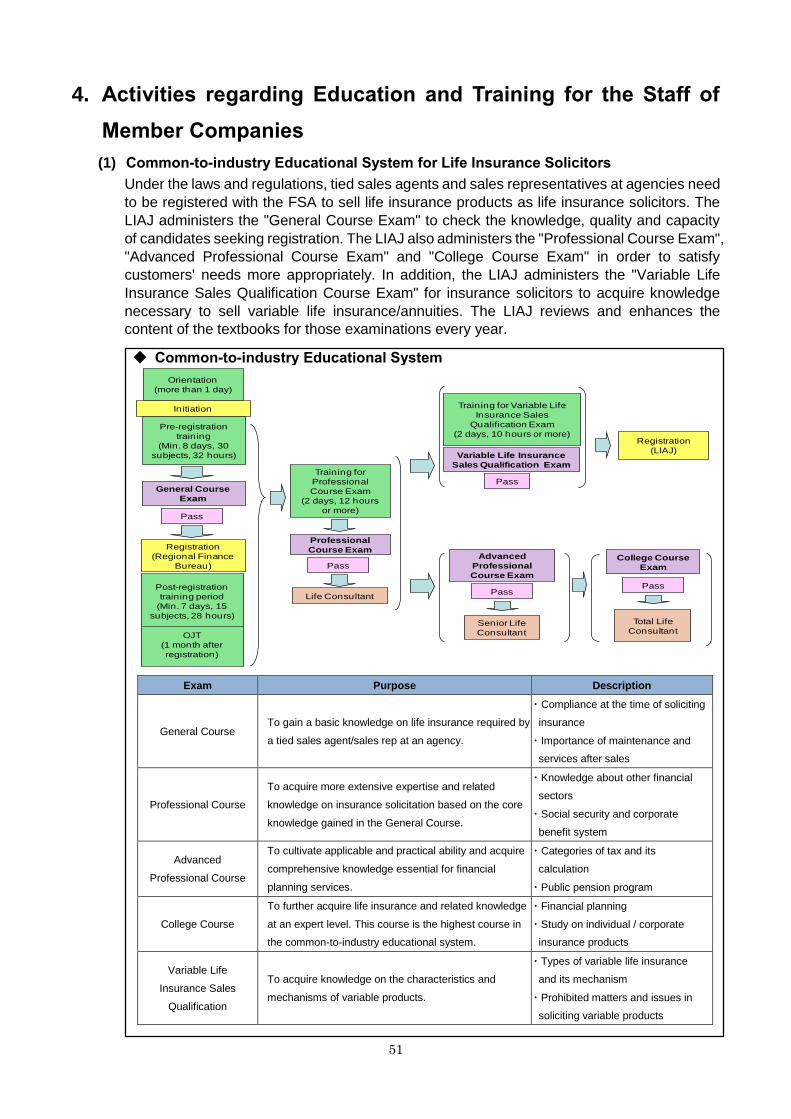
51
4. Activities regarding Education and Training for the Staff of
Member Companies
(1) Common-to-industry Educational System for Life Insurance Solicitors
Under the laws and regulations, tied sales agents and sales representatives at agencies need
to be registered with the FSA to sell life insurance products as life insurance solicitors. The
LIAJ administers the "General Course Exam" to check the knowledge, quality and capacity
of candidates seeking registration. The LIAJ also administers the "Professional Course Exam",
"Advanced Professional Course Exam" and "College Course Exam" in order to satisfy
customers' needs more appropriately. In addition, the LIAJ administers the "Variable Life
Insurance Sales Qualification Course Exam" for insurance solicitors to acquire knowledge
necessary to sell variable life insurance/annuities. The LIAJ reviews and enhances the
content of the textbooks for those examinations every year.
Exam Purpose Description
General Course To gain a basic knowledge on life insurance required by
a tied sales agent/sales rep at an agency.
・Compliance at the time of soliciting
insurance
・Importance of maintenance and
services after sales
Professional Course
To acquire more extensive expertise and related
knowledge on insurance solicitation based on the core
knowledge gained in the General Course.
・Knowledge about other financial
sectors
・Social security and corporate
benefit system
Advanced
Professional Course
To cultivate applicable and practical ability and acquire
comprehensive knowledge essential for financial
planning services.
・Categories of tax and its
calculation
・Public pension program
College Course
To further acquire life insurance and related knowledge
at an expert level. This course is the highest course in
the common-to-industry educational system.
・Financial planning
・Study on individual / corporate
insurance products
Variable Life
Insurance Sales
Qualification
To acquire knowledge on the characteristics and
mechanisms of variable products.
・Types of variable life insurance
and its mechanism
・Prohibited matters and issues in
soliciting variable products
Training for
Professional
Course Exam
(2 days, 12 hours
or more)
Professional
Course Exam
Pass
Life Consultant
Training for Variable Life
Insurance Sales
Qualification Exam
(2 days, 10 hours or more)
Variable Life Insurance
Sales Qualification Exam
Pass
Registration
(LIAJ)
Advanced
Professional
Course Exam
Pass
Senior Life
Consultant
College Course
Exam
Pass
Total Life
Consultant
Orientation
(more than 1 day)
Initiation
Pre-registration
training
(Min. 8 days, 30
subjects, 32 hours)
General Course
Exam
Registration
(Regional Finance
Bureau)
Post-registration
training period
(Min. 7 days, 15
subjects, 28 hours)
OJT
(1 month after
registration)
Pass
◆ Common-to-industry Educational System
52
(2) Continuing Education System for Life Insurance Solicitors
The LIAJ has a system for continuous education of all life insurance solicitors ("Continuing Education
System") once a year in principle so that they can conduct solicitation activities with an emphasis on
customer satisfaction and compliance. The LIAJ also conducts follow-up activities every year to
enhance the continuing education system.
(3) Life Insurance Course
This course is for staff engaged in the life insurance business, with the aim of imparting the basic
knowledge required to work in the life insurance industry. The course consists of eight subjects:
"Introduction to Life Insurance", "Life Insurance Actuarial Science", "Risk Selection", "Contractual
Provision and Law", "Life Insurance Products and Sales", "Life Insurance Accounting", "Asset
Management" and "Life Insurance and Tax Law". The LIAJ publishes the text and operates the exam
for each subject.
5. Activities regarding Making Requests and Proposals to Relevant
Authorities, Agencies and Organizations
(1) Requests on Tax Reform
Recognizing the current situation the social security system is in, the LIAJ believes it is important that
public security and private security fulfill their respective roles to support people's financial security.
Pursuing the idea of "double (public and private) pillared financial security", the LIAJ will continue to
request expansion of tax deduction and other schemes that encourages self-help efforts toward
enhanced private protection scheme.
(2) Continued Survey on Enhancing Equity Values for 43 Years
The LIAJ has been conducting serveys on the efforts of listed companies and institutional investors
regarding approach toward enhancing equity values for 43 years since fiscal 1974.
The LIAJ published its requests to investors as well as to companies from the perspectives of corporate
governance, management strategies oriented toward sustainable growth, and dialogues.
The LIAJ expects that the surmey results will promote medium-to long-term enhancement of equity
values, and thereby, link to revitalization of the stock market as a whole.

53
○ Follow-up Activities on Postal Privatization
Since the government announced its plans to privatize the nation's postal service in the cabinet's
"Basic Policy" and established the government-owned Japan Post in 2003, after continuous
discussions on postal privatization within the government, bills of the Postal Service Privatization
Act and related acts were passed in 2005. Following this enactment, Japan Post Holdings Co.,
Ltd. and Japan Post Insurance were established and announced plans to be listed in December
2014. They were successfully listed on the Tokyo Stock Exchange on November 4, 2015. On
April 1, 2016, the cap on the amount of additional insurance coverage, which is allowed after four
years from the date of conclusion, was raised to 10 million yen from 3 million yen and, as the
result, the cap on the amount of total coverage was raised to 20 million yen from 13 million yen.
In this context, the LIAJ has continued to express opinions that we can never agree to any
increase in the cap on the amount of insurance coverage or any expansion of business scope of
Japan Post Insurance without ensuring a level playing field and introducing an appropriate control
system.
(3) Comments on Global Standards for Insurance Supervision and International Financial
Reporting Standards
Amid the ongoing globalization of the insurance industry, discussions have been held on developing
global standards for insurance supervision at the International Association of Insurance Supervisors
(IAIS) and on developing International Financial Reporting Standards for insurance contracts at the
International Accounting Standards Board (IASB). The LIAJ submits various comments to input to such
discussions in order for the standards to appropriately reflect the characteristics of the life insurance
business in Japan. For instance, in 2017, IASB issued IFRS 17 is an International Financial Reporting
Standard on accounting for insurance contracts and has an effective date of 1 January 2021.
(4) Commitment to the Global Federation of Insurance Associations
The LIAJ is a founding member of the Global Federation of Insurance Associations (GFIA), which was
established in October 2012 with the aim of increasing effectiveness in providing input and to
exchanging information more effectively between insurance associations. The LIAJ will continue to
commit to the GFIA effectively to increase industry effectiveness in providing input to international bodies
such as the IAIS, and will contribute to further development of the GFIA.
○ The Global Federation of Insurance Associations (GFIA)
The GFIA is a non-profit association established to represent national and regional insurance
associations. Currently, its 40 member associations represent insurers and reinsurers in 60
countries that account for around 87% of total insurance premiums worldwide.

54
6. Activities to Fulfill Social Responsibilities
(1) The Project to Support Working Parents with Small Children - For Further Promotion of Active
Participation by Women
For further promotion of active participation by women and to address the issue of children on nursery
school waiting lists, the LIAJ aims to create an environment where working mothers need not to feel that
they are compromising on child rearing. Since fiscal 2014, the LIAJ has subsidized specific projects to
increase the facility capacity as well as projects to improve the quality of day nurseries/clubs for after-
school activities for children. In fiscal 2016, the LIAJ provided subsidies to 83 facilities, totaling 21 million
yen.
(2) Subsidy Program for Elderly Support Organizations - Staying Healthy in Old Age
Considering the society of accelerated aging of the population, it is of great importance to establish a
society where everyone can enrich their life in good health for all time, and to facilitate health promotion
so that they can live out their natural life span. Since fiscal 2014, the LIAJ has been providing subsidies
to private non-profit organizations and groups which engage in activities targeted for the elderly to
facilitate health care and health promotion, to promote independence of the elderly and to help them to
live a meaningful life. The LIAJ decided to provide subsidies to 52 organizations, totaling 5 million yen in
fiscal 2016.
(3) Activities to Enhance Family Bonds by Reading Picture Books to Children
The LIAJ has engaged in "Activities to Enhance Family Bonds by Reading Picture Books to Children"
since fiscal 2008 to enhance family bonds. In fiscal 2016, the LIAJ helped to hold the "JPIC* Workshop
for the Supporters of Reading Picture Books" and contributed to provision of opportunities for people to
spend more time with their families by promoting reading of picture books. In fiscal 2015, the workshops
were held in 33 regions and the number of participant was 3,431 in total. The LIAJ encourages the
participants to hold sessions for reading picture books to children based on what they learned at the
workshops, and provides the set of books for the sessions.
* Japan Publishing Industry Foundation for Culture
(4) Supporting Education of Care Workers and Childcare Workers
Care workers are expected to play a crucial role in providing elderly care. In order to support them, the
"Scholarship Program for Education of Care Workers" has been run for 27 years since fiscal 1989. The
recipients of the scholarship in the past are playing leading roles as care workers across the country. In
fiscal 2016, the LIAJ provided scholarship of annually 240 thousand yen per person (free of repayment
obligation) to 197 students. In addition, since 2017, the LIAJ launched new scholarship program for
childcare workers.
(5) Scholarship Program for International Students in Japan (Seiho Scholarship Program)
This scholarship (for two years, free of repayment obligation) has been provided to 363 international
students from Southeast Asia and East Asia as an international contribution to assist human exchanges.

55
(6) Encouraging Efforts against Environmental Issues with Numerical Targets
The life insurance industry is committed to addressing environmental issues by developing the Life
Insurance Industry's Action Guidelines for Environmental Issues, the Life insurance Industry's
Commitment to a Low Carbon Society, and also by setting a numerical target for reducing electricity
consumption as well as sharing information on member companies' efforts. The LIAJ set the reduction
targets for fiscal 2020 and from fiscal 2020 until fiscal 2030 in accordance with the "Nippon Keidanren's
Commitment to a Low-Carbon Society" and is encouraging active efforts against encouraging issues.
The LIAJ also conducts follow-up activities every year to further encourage efforts made by member
companies.

56
3. The LIAJ’s Organization Profile
The LIAJ started as an incorporated association with formal sanction by the authorities concerned on December
7, 1908. Since then, the Association has continued to make efforts for the sound development of the life insurance
industry.
Objective
To strive for the sound development of the life insurance industry and maintain its reliability.
Activities
1. Activities to provide information and promote understanding on the life insurance business
2. Consultation services, complaint processing and dispute resolution operations regarding life insurance
3. Activities regarding systems and measures to ensure appropriate operation of the life insurance business
4. Activities regarding education and training for the staff of member companies
5. Research and study activities regarding the theory and practice of life insurance
6. Activities regarding making requests and proposals to relevant authorities, agencies and organizations
7. Activities to fulfill social responsibilities
8. Other activities considered necessary to achieve the goals of the LIAJ
History
1898 The Forum of Japanese Life Insurers was founded.
1905 The Forum of Japanese Life Insurers was reorganized into the Association of Japanese Life Insurers.
1908 The Association of Japanese Life Insurers was authorized as an incorporated association.
1942 The Life Insurance Control Association was founded. The Association of Japanese Life Insurers was renamed
the Life Insurance Network, and most of its operations were transferred to the Life Insurance Control
Association.
1945 The Life Insurance Council of Japan was founded to take over the operations of the Control Association after
it was dissolved. The Life Insurance Network was renamed The Life Insurance Association of Japan (LIAJ).
All the operations of the Life Insurance Network were transferred to the LIAJ.
2008 The LIAJ marked the 100th anniversary since its foundation.
2014 The LIAJ made a transition from an incorporated association to a general incorporated association.
Membership
All 41 life insurance companies operating in Japan (As of December 31, 2017)
Board Members
Representatives of member companies and full-time officers of the LIAJ (As of December 31, 2017)
Offices
52 offices (the headquarters in Tokyo and 51 local offices) (As of December 31, 2017)
Number of Employees
268 employees (As of December 31, 2017)
Funding
Membership fees and revenues from business activities such as examination business (Budget for fiscal 2016:
approx. 5.24 billion yen, of which 4.14 billion yen from membership fees and 1.05 billion yen from revenues from
business activities)
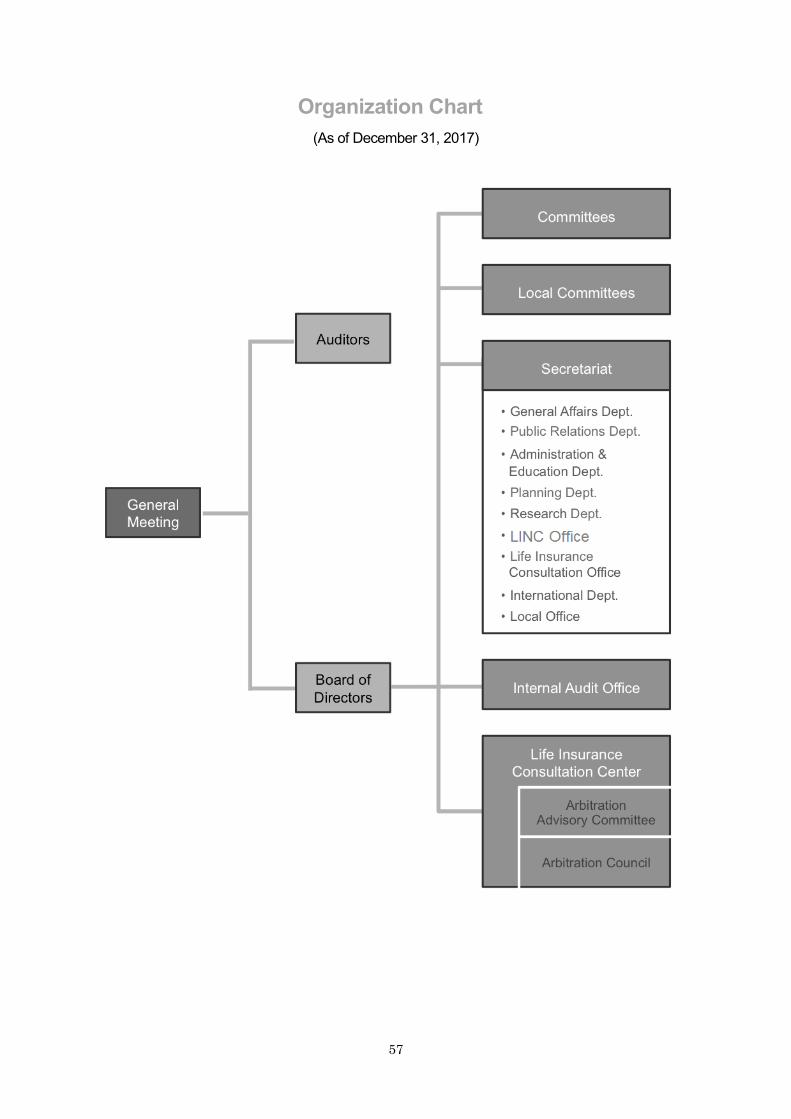
57
Organization Chart
(As of December 31, 2017)

58
Board Members
(As of December 31, 2017)
Chairman
Masahiro Hashimoto President and Chief Executive Officer, Sumitomo Life Insurance Co.
Vice Chairmen
Seiji Inagaki President and Representative Director, The Dai-ichi Life Insurance Company, Limited
Yoshiteru Yoneyama President, Fukoku Mutual Life Insurance Co.
Directors
Yoshinobu Tsutsui President, Nippon Life Insurance Co.
Katsumi Nakazato President & Chief Executive Officer,Tokio Marine & Nichido Life Insurance Co.,
Ltd.
Yasunori Kume Representative, CARDIF Assurance Vie
Tomoo Hagimoto President and Representative Director, Sony Life Insurance Co., Ltd.
Akira Nishino Representative Director and President, AEGON Sony Life Insurance Co., Ltd.
Kaoru Takahashi President & CEO, Sompo Japan Nipponkoa Himawari Life Insurance, Inc.
Kazunori Kataoka President, ORIX Life Insurance Corporation
Hitoshi Morita President & CEO, Representative Executive Officer, Manulife Life Insurance
Company
Mitsuru Imoto Representative Director and President, MassMutual Life Insurance Company
Shoichiro Ichitani President and Chief Executive Officer, The Prudential Life Insurance Co., Ltd.
Norimitsu Shimada Executive Managing Director, NN Life Insurance Company, Ltd.
Norio Tomono Representative Director, President and COO, FWD Fuji Life Insurance
Company, Limited
Tomohiko Komoto Director, Representative Executive Officer, Deputy President and Chief
Distribution Officer, AXA Life Insurance Co., Ltd.
Masatoshi Koide President of Aflac Japan, Representative in Japan of Aflac, American Family
Life Assurance Company of Columbus
Hiroki Kimura President and Representative Director, Asahi Mutual Life Insurance Co.
Akio Negishi President, Meiji Yasuda Life Insurance Company
Sachin N. Shah Director, Representative Statutory Executive Officer and Chairman, MetLife
Insurance K.K.
Hitoshige Tambo President, Mitsui Sumitomo Aioi Life Insurance Co., Limited.
Masahiro Hashimoto President and Chief Executive Officer, Sumitomo Life Insurance Co.
Vice Chairmen
Toyonari Sasaki The Life Insurance Association of Japan (Full-time)
Kenichi Kobayashi The Life Insurance Association of Japan (Full-time)
Director
Kazushige Mori The Life Insurance Association of Japan (Full-time)
Auditors
Minoru Kudo Representative Director and President, Daido Life Insurance Co.
Daisuke Iwase President & Representative Director, Lifenet Insurance Company
Yuzo Hashiya President and Representative Director, Rakuten Life Insurance Co., Ltd.
Kazuo Ohtake Attorney at Law
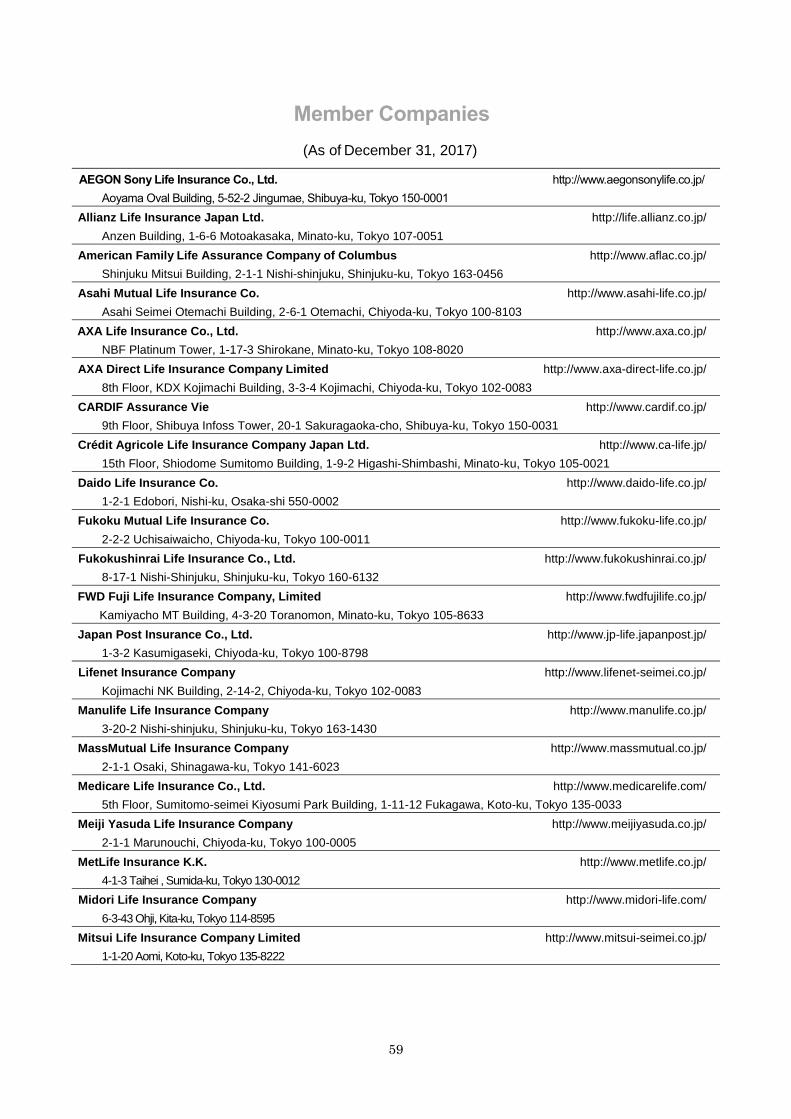
59
Member Companies
(As of December 31, 2017)
AEGON Sony Life Insurance Co., Ltd. http://www.aegonsonylife.co.jp/
Aoyama Oval Building, 5-52-2 Jingumae, Shibuya-ku, Tokyo 150-0001
Allianz Life Insurance Japan Ltd. http://life.allianz.co.jp/
Anzen Building, 1-6-6 Motoakasaka, Minato-ku, Tokyo 107-0051
American Family Life Assurance Company of Columbus http://www.aflac.co.jp/
Shinjuku Mitsui Building, 2-1-1 Nishi-shinjuku, Shinjuku-ku, Tokyo 163-0456
Asahi Mutual Life Insurance Co. http://www.asahi-life.co.jp/
Asahi Seimei Otemachi Building, 2-6-1 Otemachi, Chiyoda-ku, Tokyo 100-8103
AXA Life Insurance Co., Ltd. http://www.axa.co.jp/
NBF Platinum Tower, 1-17-3 Shirokane, Minato-ku, Tokyo 108-8020
AXA Direct Life Insurance Company Limited http://www.axa-direct-life.co.jp/
8th Floor, KDX Kojimachi Building, 3-3-4 Kojimachi, Chiyoda-ku, Tokyo 102-0083
CARDIF Assurance Vie http://www.cardif.co.jp/
9th Floor, Shibuya Infoss Tower, 20-1 Sakuragaoka-cho, Shibuya-ku, Tokyo 150-0031
Crédit Agricole Life Insurance Company Japan Ltd. http://www.ca-life.jp/
15th Floor, Shiodome Sumitomo Building, 1-9-2 Higashi-Shimbashi, Minato-ku, Tokyo 105-0021
Daido Life Insurance Co. http://www.daido-life.co.jp/
1-2-1 Edobori, Nishi-ku, Osaka-shi 550-0002
Fukoku Mutual Life Insurance Co. http://www.fukoku-life.co.jp/
2-2-2 Uchisaiwaicho, Chiyoda-ku, Tokyo 100-0011
Fukokushinrai Life Insurance Co., Ltd. http://www.fukokushinrai.co.jp/
8-17-1 Nishi-Shinjuku, Shinjuku-ku, Tokyo 160-6132
FWD Fuji Life Insurance Company, Limited http://www.fwdfujilife.co.jp/
Kamiyacho MT Building, 4-3-20 Toranomon, Minato-ku, Tokyo 105-8633
Japan Post Insurance Co., Ltd. http://www.jp-life.japanpost.jp/
1-3-2 Kasumigaseki, Chiyoda-ku, Tokyo 100-8798
Lifenet Insurance Company http://www.lifenet-seimei.co.jp/
Kojimachi NK Building, 2-14-2, Chiyoda-ku, Tokyo 102-0083
Manulife Life Insurance Company http://www.manulife.co.jp/
3-20-2 Nishi-shinjuku, Shinjuku-ku, Tokyo 163-1430
MassMutual Life Insurance Company http://www.massmutual.co.jp/
2-1-1 Osaki, Shinagawa-ku, Tokyo 141-6023
Medicare Life Insurance Co., Ltd. http://www.medicarelife.com/
5th Floor, Sumitomo-seimei Kiyosumi Park Building, 1-11-12 Fukagawa, Koto-ku, Tokyo 135-0033
Meiji Yasuda Life Insurance Company http://www.meijiyasuda.co.jp/
2-1-1 Marunouchi, Chiyoda-ku, Tokyo 100-0005
MetLife Insurance K.K. http://www.metlife.co.jp/
4-1-3 Taihei , Sumida-ku, Tokyo 130-0012
Midori Life Insurance Company http://www.midori-life.com/
6-3-43 Ohji, Kita-ku, Tokyo 114-8595
Mitsui Life Insurance Company Limited http://www.mitsui-seimei.co.jp/
1-1-20 Aomi, Koto-ku, Tokyo 135-8222
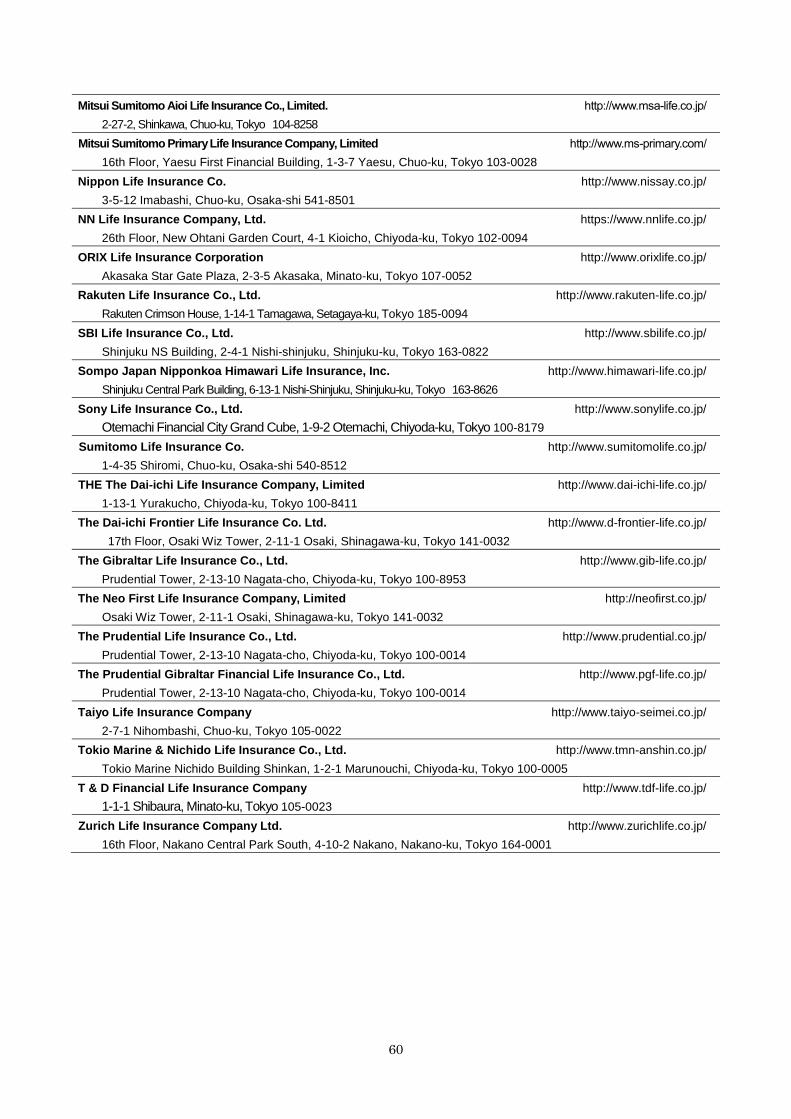
60
Mitsui Sumitomo Aioi Life Insurance Co., Limited. http://www.msa-life.co.jp/
2-27-2, Shinkawa, Chuo-ku, Tokyo 104-8258
Mitsui Sumitomo Primary Life Insurance Company, Limited http://www.ms-primary.com/
16th Floor, Yaesu First Financial Building, 1-3-7 Yaesu, Chuo-ku, Tokyo 103-0028
Nippon Life Insurance Co. http://www.nissay.co.jp/
3-5-12 Imabashi, Chuo-ku, Osaka-shi 541-8501
NN Life Insurance Company, Ltd. https://www.nnlife.co.jp/
26th Floor, New Ohtani Garden Court, 4-1 Kioicho, Chiyoda-ku, Tokyo 102-0094
ORIX Life Insurance Corporation http://www.orixlife.co.jp/
Akasaka Star Gate Plaza, 2-3-5 Akasaka, Minato-ku, Tokyo 107-0052
Rakuten Life Insurance Co., Ltd. http://www.rakuten-life.co.jp/
Rakuten Crimson House, 1-14-1 Tamagawa, Setagaya-ku, Tokyo 185-0094
SBI Life Insurance Co., Ltd. http://www.sbilife.co.jp/
Shinjuku NS Building, 2-4-1 Nishi-shinjuku, Shinjuku-ku, Tokyo 163-0822
Sompo Japan Nipponkoa Himawari Life Insurance, Inc. http://www.himawari-life.co.jp/
Shinjuku Central Park Building, 6-13-1 Nishi-Shinjuku, Shinjuku-ku, Tokyo 163-8626
Sony Life Insurance Co., Ltd. http://www.sonylife.co.jp/
Otemachi Financial City Grand Cube, 1-9-2 Otemachi, Chiyoda-ku, Tokyo 100-8179
Sumitomo Life Insurance Co. http://www.sumitomolife.co.jp/
1-4-35 Shiromi, Chuo-ku, Osaka-shi 540-8512
THE The Dai-ichi Life Insurance Company, Limited http://www.dai-ichi-life.co.jp/
1-13-1 Yurakucho, Chiyoda-ku, Tokyo 100-8411
The Dai-ichi Frontier Life Insurance Co. Ltd. http://www.d-frontier-life.co.jp/
17th Floor, Osaki Wiz Tower, 2-11-1 Osaki, Shinagawa-ku, Tokyo 141-0032
The Gibraltar Life Insurance Co., Ltd. http://www.gib-life.co.jp/
Prudential Tower, 2-13-10 Nagata-cho, Chiyoda-ku, Tokyo 100-8953
The Neo First Life Insurance Company, Limited http://neofirst.co.jp/
Osaki Wiz Tower, 2-11-1 Osaki, Shinagawa-ku, Tokyo 141-0032
The Prudential Life Insurance Co., Ltd. http://www.prudential.co.jp/
Prudential Tower, 2-13-10 Nagata-cho, Chiyoda-ku, Tokyo 100-0014
The Prudential Gibraltar Financial Life Insurance Co., Ltd. http://www.pgf-life.co.jp/
Prudential Tower, 2-13-10 Nagata-cho, Chiyoda-ku, Tokyo 100-0014
Taiyo Life Insurance Company http://www.taiyo-seimei.co.jp/
2-7-1 Nihombashi, Chuo-ku, Tokyo 105-0022
Tokio Marine & Nichido Life Insurance Co., Ltd. http://www.tmn-anshin.co.jp/
Tokio Marine Nichido Building Shinkan, 1-2-1 Marunouchi, Chiyoda-ku, Tokyo 100-0005
T & D Financial Life Insurance Company http://www.tdf-life.co.jp/
1-1-1 Shibaura, Minato-ku, Tokyo 105-0023
Zurich Life Insurance Company Ltd. http://www.zurichlife.co.jp/
16th Floor, Nakano Central Park South, 4-10-2 Nakano, Nakano-ku, Tokyo 164-0001


The Life Insurance Association of Japan
3rd floor, Shin-Kokusai Building, 4-1 Marunouchi 3-Chome,
Chiyoda-ku, Tokyo 100-0005 Japan
Telephone: +81-3-3286-2652 Facsimile: +81-3-3201-6713
http://www.seiho.or.jp/
Published in March 2018


