

Magnetic and Microstructural Study of Ferromagnetic Shape Memory Alloys
Final report Belspo project Dr. Jiangbo LU at EMAT, University of Antwerp, 15/11/2010 -
15/5/2012
Summary
The main topic of research of Dr. LU concerned the magnetic and microstructural
study of Co-Ni-Al alloys using various transmission electron microscopy (TEM)
techniques. Conventional TEM was performed to investigate the microstructures of
two kinds of Co38Ni33Al29 ferromagnetic shape memory alloys obtained from the
Institute of Physics at the Academy of Prague. In the Bg190 sample which was fastest
grown with the shortest annealing time, dendritic shaped ’ precipitates were observed
in a martensite matrix with a precipitate-austenite-martensite sandwich structure at the
precipitate-matrix interface. The formation of the sandwich structure can be explained
by the presence of a Co-depleted and Al-enriched chemical gradient zone and the
strong martensitic start temperature dependency on element composition. The
orientation relationship between residual austenite and precipitate fits the
Kurdjumov-Sachs orientation relationship. In the BM2 sample which was slower
grown and annealed for a longer time, besides the dendritic shaped ’ precipitates, the
facetted micron-sized precipitates without, or with one or three {111}p twin planes
were observed in the austenite matrix. These precipitates with the twinning structure
have a specific orientation distribution due to the existence of the {111}p twin plus the
Kurdjumov-Sachs orientation relationship between precipitates and matrix. No
chemical gradient zone across the interface between the precipitates and the austenite
matrix was observed. The 3D morphologies of the precipitates were studied with
Slice-and-View (FIB/SEM) while the magnetic domain structures of precipitates and
matrix were studied by Lorentz microscopy. The latter was the first time at EMAT to
apply the new Titan microscope for Lorentz microscopy.
Next to the originally planned work on Co38Ni33Al29 Dr. Lu also worked on strain
glass systems based on Ni-Ti and Ti-Pd-Cr alloys using HRSTEM aberration
corrected HR(S)TEM. He further also supported the PhD work of Hui SHI on large
hysteresis Ti-Ni-Nb shape memory material and joined a project on zeolite
microcrystals. Dr. Lu will stay at EMAT till September 2013 to continue his research
on these various topics and finalize several publications.
2. Material and Methods
Bulk single crystal Co38Ni33Al29 samples were prepared by the Bridgman method.
The different preparation and annealing conditions applied in the present work to the
as-cast single crystals to control Ms, Mf, etc. are listed in Table 1. The martensitic
transformation temperatures were determined by differential scanning calorimetry

(DSC). One main important difference between the effects of the crystal growth rate
and subsequent thermal treatment is that for Bg190 the resulting Ms is around room
temperature while for BM2 it is far below room temperature, yielding secondary
phase precipitates embedded in martensite and austenite matrix, respectively. In what
follows it will also become clear that the microstructure as such is substantially
different.
Table 1: Pulling rates, annealing temperature and time, and temperature of martensitic start
transformation for the studied materials.
Pulling rate
[m.s-1
]
Annealing temperature and time
[K/h], followed by water quenching
MS [K]
Bg190 28.8 1623/1 > 298
BM2 7.7 1373/72 < 173
Conventional TEM samples were prepared by twin-jet electropolishing in a 20%
sulfuric acid and 80% methanol electrolyte at 258K. In order to enable an adequate
study of the matrix-precipitate interface, an FEI Nova 200 Nanolab Dual Beam
SEM/FIB system was applied to get cross-sections from the place of interest. A
standard ion column is installed which allows Ga+ milling at 5-30KV. The
Slice-and-View study of the 3D morphologies of the precipitates was carried out with
the same equipment. Conventional TEM was carried out on a LaB6 Philips CM20,
and the high-resolution and analytical STEM-EDX analysis was performed on a FEG
FEI Tecnai G2, both microscopes were operated at 200KV. The Lorentz study was
carried out on an FEI aberration-corrected monochromated Titan operating at 300KV.
3. Microstructural study
Fig. 1(a) shows a SEM image of the bulk Bg190 sample, which reveals some detail
of the morphology of the sample with an dendritic structure yielding micron-sized
precipitates embedded in a martensitic matrix at room temperature, which is
consistent with Ms being around room temperature as listed in Table 1. In this sample
these large precipitates or the martensite-precipitate interfaces do not reveal any
particular crystallographic shapes. In order to investigate the details of the
martensite-precipitate interface a FIB TEM lamella was prepared from the position
indicated by the white bar.

Fig. 1 (a) Typical SEM image of the microstructure of the bulk Bg190 sample, (b) BF image of FIB
cross-section sample taken along [100]a zone axis of residual austenite phase, (c) STEM image of the
FIB lamella, (d) Concentration profiles of alloy elements across the precipitate-austenite-martensite
region shown in (c) using a STEM-EDX line scan method.
Fig. 1(b) shows the bright field (BF) image of the FIB lamella taken along the
[100]a zone axis of the austenite (the subscript “a” and “m” further-on in the text
denote austenitic and martensitic structure, resp.). The right upper part exhibits the
typical twinning structure of the martensitic phase. The electron diffraction pattern of
the twin lamellae along the [110]m zone axis is shown at the right lower corner and
consists of two sets of overlapping diffraction patterns. Each set of the pattern can be
indexed by the typical L10 tetragonal martensitic structure with a=b=0.385nm,
c=0.314nm. The two sets of patterns share the spots along the g[1-11]m direction, i.e. the
diffraction spots along the g[1-11]m direction are unsplit, which indicates the twin plane
(martensite plate boundaries) are the (1-11)L10 planes. The small diffraction spots
indicated by the white arrow might originate from surface martensite due to Ga+ ion
irradiation during FIB sample preparation. The middle part of Fig. 1(b) reveals the
morphology of the austenitic phase. The corresponding electron diffraction pattern
taken along the [100]a zone axis is shown at its upper part, and can be indexed by the
B2 cubic structure with a=0.285nm. Comparing the diffraction patterns of the
austenite and martensite in Fig. 1(b), the expected orientation relationship
[100]a||[110]m, and (01-1)a||(1-11)m accompanying the martensitic phase transition and
arising from a simple tetragonal distortion of the cubic cell can be confirmed. The left
lower part of Fig. 1(b) reveals the morphology of the precipitate with a slightly bend
interface with the sandwiched austenite region.
Fig. 1(c) shows a STEM image across the region of the
precipitate-austenite-martensite sandwich structure. The black line shows the trace
along which a STEM-EDX line scan analysis was performed. The characters a, b and
c indicate the interface of precipitate and austenite, the boundary of the chemical
gradient zone in the austenite (see below) and the interface of the austenite and
martensite, resp.. Fig. 1(d) shows the concentration profiles of three elements across
the sandwich structure. From these profiles we can clearly observe the Co depletion
and Al enrichment in the a-b gradient zone compared with the b-c zone (although the
position of “b” remains a bit arbitrary). For the present region, the width of this
chemical gradient zone is around 200 nm, while other gradient regions in the sample
were found to be between tens of nm to a maximum of 250nm. It is also important to
mention that the size of the austenite, which is in the range of tens of nm to several
micrometers, depends on the size and morphology of the precipitate. The quantified
mean EDX values of the different regions across the precipitate-austenite-martensite
sandwich structure are shown in Table 2. The data quantitatively show the presence of
the Co depletion and Al enrichment in the a-b chemical gradient region, as well as a
small composition difference between the austenite b-c and martensite regions. In
addition, the concentrations of Ni in the austenite and martensite are almost the same,
about 3 at.% higher than in precipitate.
Table 2: The average element concentrations of different regions in Fig .1(c) including statistical
standard error values.
Positions Co [at. %] Ni [at. %] Al [at. %]
Precipitate 52.28 ± 0.32 29.98 ± 0.15 17.74 ± 0.18
Region a-b austenite 35.96 ± 0.58 33.85 ± 0.23 30.18 ± 0.41
Region b-c austenite 37.89 ± 0.14 33.10 ± 0.20 29.00 ± 0.23
Region martensite 38.33 ± 0.19 33.21 ± 0.19 28.44 ± 0.19
Area inside the
precipitate (Fig. 3)
36.61 ± 0.42 32.94 ± 0.35 30.43 ± 0.27
In order to interpret the formation of the precipitate-austenite-martensite sandwich
structure, the positions representing the element concentrations of different regions
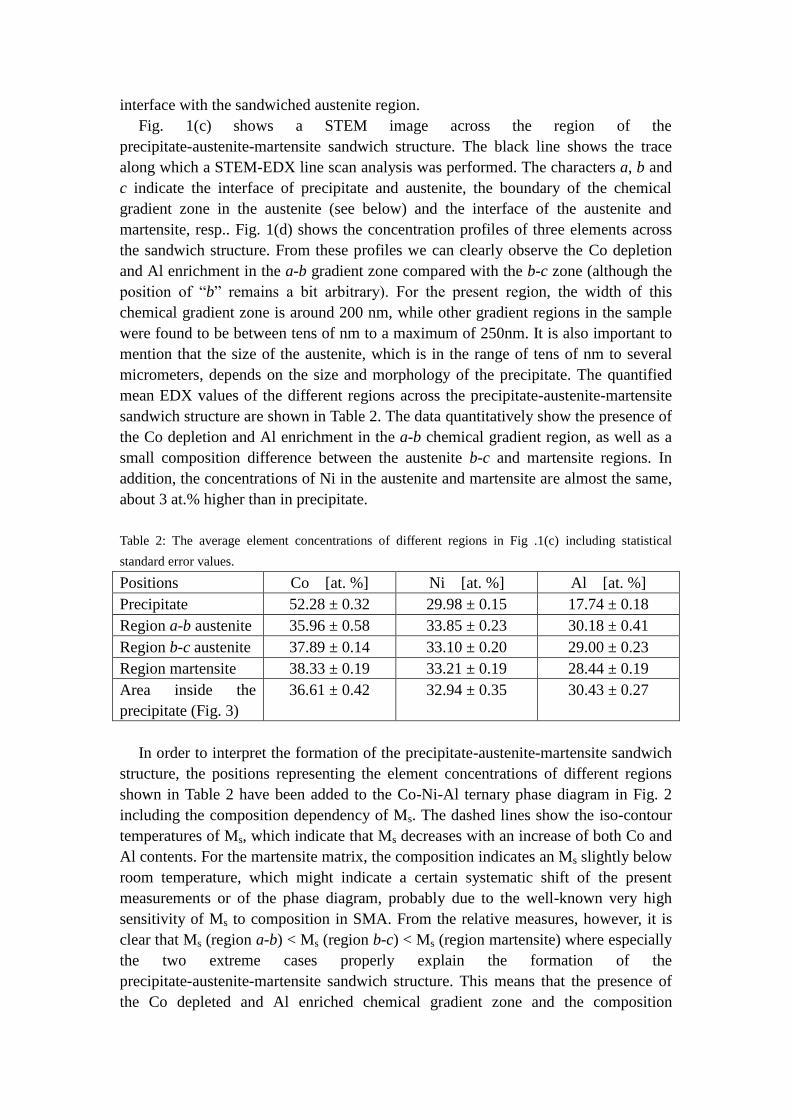
shown in Table 2 have been added to the Co-Ni-Al ternary phase diagram in Fig. 2
including the composition dependency of Ms. The dashed lines show the iso-contour
temperatures of Ms, which indicate that Ms decreases with an increase of both Co and
Al contents. For the martensite matrix, the composition indicates an Ms slightly below
room temperature, which might indicate a certain systematic shift of the present
measurements or of the phase diagram, probably due to the well-known very high
sensitivity of Ms to composition in SMA. From the relative measures, however, it is
clear that Ms (region a-b) < Ms (region b-c) < Ms (region martensite) where especially
the two extreme cases properly explain the formation of the
precipitate-austenite-martensite sandwich structure. This means that the presence of
the Co depleted and Al enriched chemical gradient zone and the composition
difference between austenite and martensite result in a structure separation due to the
strong dependency of Ms on alloy composition. Moreover, due to the orientation of
the Ms iso-contour lines the changes in Al content play the most important role in this
particular alloy. A similar phenomenon was reported in Ni-Ti shape memory
micro-wire where the concentration gradient of the alloying elements stemming from
the oxidation of the surface results in the formation of a martensite-austenite
core-shell structure for the entire micro-wire.
Fig. 2 Observed concentrations in the sandwich structure in view of composition dependency of the
martensitic start transformation temperature Ms in the Co-Ni-Al ternary system.
However, the small difference in composition between the martensite and region
b-c of the austenite does not explain the particular shape of the austenite region in this
area. On the other hand, from the relative lattice orientation between austenite and
martensite observed in Fig. (1), it is clear that the expected crystallography of the
cubic-to-tetragonal transformation has been retained and the system will have to
compete between the volume energy of both phases, governed by the concentration,
and the surface energy at the habit plane induced by the transformation strain. This
has probably resulted in the particular hat-shape of the austenite-martensite interface
in Fig. 1(b), yielding an austenite region slightly extending into an area with a higher
Co and lower Al content.
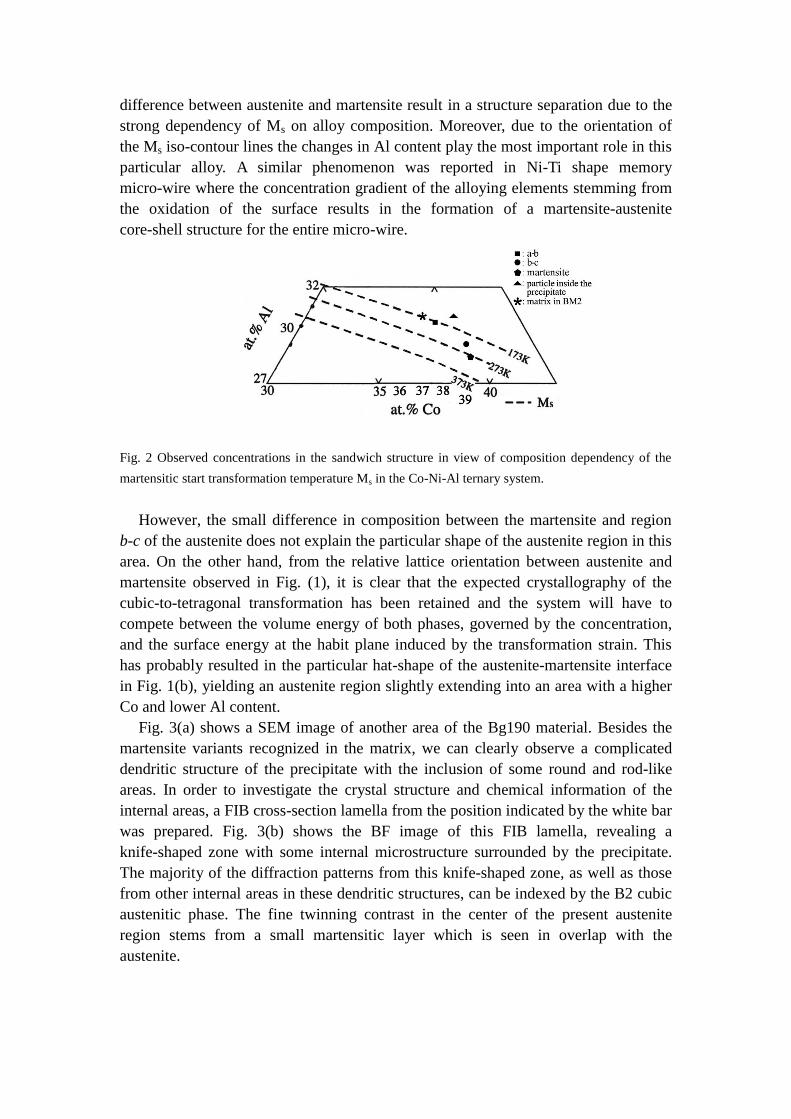
Fig. 3(a) shows a SEM image of another area of the Bg190 material. Besides the
martensite variants recognized in the matrix, we can clearly observe a complicated
dendritic structure of the precipitate with the inclusion of some round and rod-like
areas. In order to investigate the crystal structure and chemical information of the
internal areas, a FIB cross-section lamella from the position indicated by the white bar
was prepared. Fig. 3(b) shows the BF image of this FIB lamella, revealing a
knife-shaped zone with some internal microstructure surrounded by the precipitate.
The majority of the diffraction patterns from this knife-shaped zone, as well as those
from other internal areas in these dendritic structures, can be indexed by the B2 cubic
austenitic phase. The fine twinning contrast in the center of the present austenite
region stems from a small martensitic layer which is seen in overlap with the
austenite.
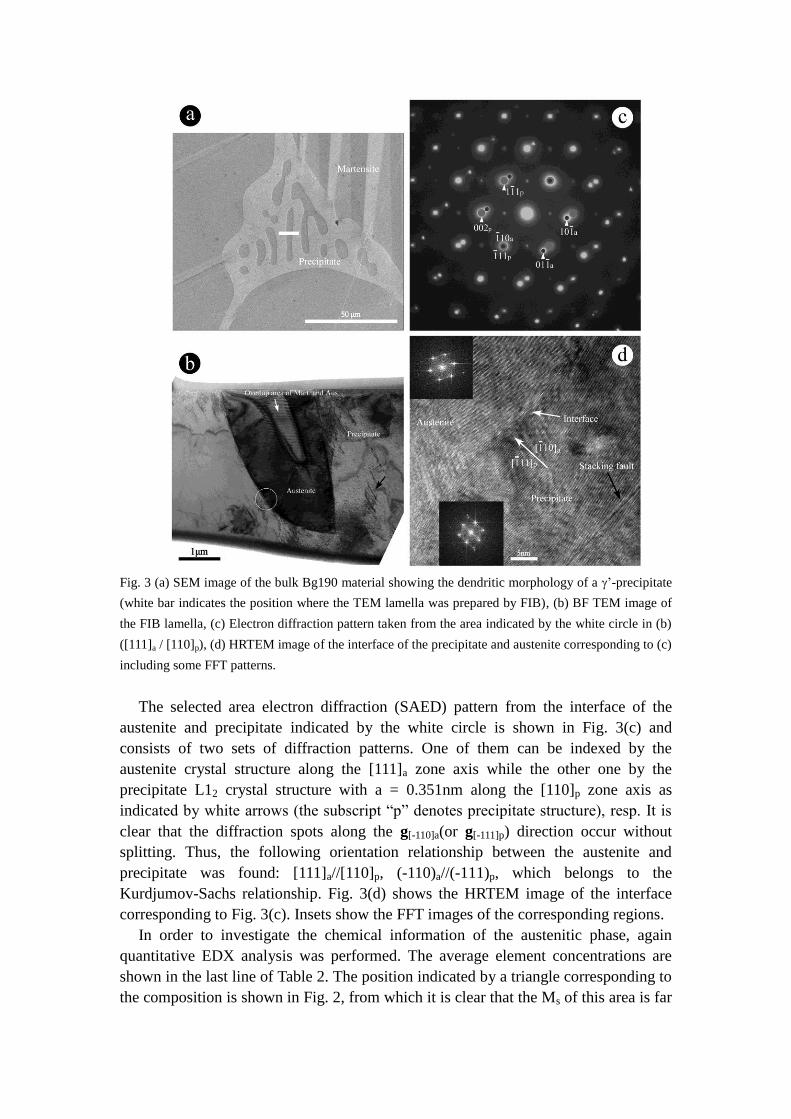
Fig. 3 (a) SEM image of the bulk Bg190 material showing the dendritic morphology of a ’-precipitate
(white bar indicates the position where the TEM lamella was prepared by FIB), (b) BF TEM image of
the FIB lamella, (c) Electron diffraction pattern taken from the area indicated by the white circle in (b)
([111]a / [110]p), (d) HRTEM image of the interface of the precipitate and austenite corresponding to (c)
including some FFT patterns.
The selected area electron diffraction (SAED) pattern from the interface of the
austenite and precipitate indicated by the white circle is shown in Fig. 3(c) and
consists of two sets of diffraction patterns. One of them can be indexed by the
austenite crystal structure along the [111]a zone axis while the other one by the
precipitate L12 crystal structure with a = 0.351nm along the [110]p zone axis as
indicated by white arrows (the subscript “p” denotes precipitate structure), resp. It is
clear that the diffraction spots along the g[-110]a(or g[-111]p) direction occur without
splitting. Thus, the following orientation relationship between the austenite and
precipitate was found: [111]a//[110]p, (-110)a//(-111)p, which belongs to the
Kurdjumov-Sachs relationship. Fig. 3(d) shows the HRTEM image of the interface
corresponding to Fig. 3(c). Insets show the FFT images of the corresponding regions.
In order to investigate the chemical information of the austenitic phase, again
quantitative EDX analysis was performed. The average element concentrations are
shown in the last line of Table 2. The position indicated by a triangle corresponding to
the composition is shown in Fig. 2, from which it is clear that the Ms of this area is far

below room temperature explaining the austenitic phase formation inside the
precipitate. The small martensite area in the center of the zone of Fig. 3b again
indicates the end of the competition between the volume and surface energy terms.
The black arrow in the lower right corner of Fig. 3d indicates the presence of a
stacking fault in the precipitate.
In some other samples of this same series, treated in slightly different ways,
precipitates as found in this Bg190 sample but completely embedded in austenite
matrix were found. Again some Co depletion and Al enrichment was observed in the
matrix near to the precipitate, but since the matrix is already in the austenite phase, no
structural effect is induced by this concentration gradient.
Fig. 4 (a) SEM image of the bulk BM2 material showing the homogeneous distribution and
surface cross-section morphologies (needles and ellipses) of the ’-precipitates at low
magnification, (b) High magnification of a FIB cross-section cut from the middle of a single
precipitate revealing a central interface.
For comparison we prepared the BM2 sample as shown in Table 1 with a pulling
rate of 7.7m.s-1
and annealed at 1373K for 72 hours, yielding an Ms far below room
temperature. In this sample, besides the complicate dendritic ’ L12 precipitates
similar to what we observed in Bg190, many micron-sized precipitates were found
(sometimes up to 50 micron long) in the austenite matrix as seen from the SEM image
in Fig. 4(a) and, as expected, no martensite traces in the matrix. The precipitates are
somewhat smaller than the dendritic precipitate and they have a clear crystallographic
shape, with many showing up as needles and some as ellipses on the surface of the
SEM sample. A FIB cross-sectional cut of a single precipitate showing up on the
surface as a needle was made and shown in Fig. 4(b). From this cut it is clear that the
precipitates are formed as elongated flattened sheets with one long axis and an
apparent central interface.

Fig. 5 (a) BF image of several ’ precipitates in BM2 material taken along the [110]p of precipitate-1 (=
[111]a), (b) BF image of precipitate-1 at higher magnification (several degree off to the [110]p), (c)
[110]p SAED of precipitate-1 from the twinning region, (d) [110]p SAED of precipitate-1 from the
interface of precipitate-1 and matrix showing the K-S orientation relationship, (e) [110]p SAED of
precipitate-1 from the region indicated by the white circle in (b), (f) [110]p SAED of precipitate-1 from
the region indicated by the white circle in (a) (the major spots from the [111]a matrix).
TEM SAED again reveals these precipitates have the ’ L12 structure. In the BF
image of Fig. 5(a) the B2 matrix is viewed along a [111]a zone axis and six relatively
small precipitates are observed of which four are labeled in order to illustrate their
relative orientation relationships. Typical dimensions for these precipitates are two or
three microns in thickness and a few microns in length (i.e., on the small end of the
distribution scale when compared with the SEM image). Fig. 5(b) shows the BF
image of precipitate-1 at a higher magnification (several degree off the [110]p zone
axis to enhance twin contrast) revealing a single (-111)p twin plane along the central
axis. Fig. 5(c) shows the corresponding SAED pattern of the twinning structure in Fig.
5(b). Fig. 5(d) shows the SAED pattern taken along [110]p zone axis of precipitate-1
from its interface with the austenite matrix as indicated by the black arrow in Fig. 5(b).
The latter confirms the Kurdjumov-Sachs orientation relationship between the two
structures as in Fig. 3(c), i.e., [111]a//[110]p, (-110)a//(-111)p. Fig. 5(e) shows the
SAED pattern which consists of the diffraction patterns shown in Fig. 5(c) and Fig.
5(d) from the region indicated by the white circle in Fig. 5(b), i.e., containing the
twinned precipitate as well as the austenite matrix. Fig. 5(f) shows the diffraction
pattern taken from the area as indicated by the white circle in Fig. 5(a) containing the
twinned precipitate-1, twinned precipitate-4 and austenite matrix. The white arrows in
Fig. 5(f) indicate the diffraction spots from the twinning structures of both precipitates.
From Fig. 5(f) we can measure an angle of 60° between the twin plane of
precipitate-1 and -4, confirming the measurement in Fig. 5(a). Twin plane orientation

relationships between precipitates-1, -2 and -3 were also examined from their
diffraction patterns relative to the diffraction pattern of the matrix, confirming the
correspondence of the {111}p twin planes with the corresponding {110}a austenite
planes as well as the full KS orientation relationship. The long unlabeled precipitate
also observed in Fig. 5(a) seems to have its twin plane inclined to the viewing
direction. From the relative orientation relationships, it can be concluded that the
shaped precipitates in the BM2 sample have a specific orientation distribution due to
the existence of the {111}p twin planes inside the precipitates plus the
Kurdjumov-Sachs orientation relationship between precipitates and matrix.
Fig. 6 (a) BF image showing three {111}p twin planes in a ’ precipitate in BM2 material observed
along the [110]p zone axis of the precipitate (inset shows the corresponding SAED), (b) Shows the BF
image of a precipitate taken along its [111]p zone axis (= [110]a), (c) Corresponding SAED taken at
white arrow in (b), the spots indicated by white arrows in (c) are from matrix, the ones indicated by
black arrows are from precipitate (weak spots around the main reflection spots are due to double
diffraction).
It also seems that the external shape of the precipitates is connected to the
occurrence of the internal twin plane. The observed cross-sections of the precipitates
in the TEM BF images of Fig. 5(a,b) reveal needle shapes with large edges parallel
with the internal central twin planes, i.e. close-packed {111}p habit planes. At the
corners various smaller edges are found parallel to other small index crystallographic
planes (e.g., {200}p or {110}p). Although most ’ precipitates contain only one single
twin Fig. 6(a) shows the BF image of a precipitate containing three parallel {111}p
twin planes taken along the [110]p zone axis. The corresponding SAED pattern taken
from the whole area, i.e. including the surrounding matrix, is shown in the upper left
corner. Fig. 6(b) shows a BF image of a precipitate taken perpendicular to the twin
plane revealing a close to elliptic plan-view shape of the precipitate. The long axis of
this elliptic shape is along the [-111]a direction of matrix. This view confirms the few
elliptic shapes observed in the SEM image of Fig. 4 and already indicates that a
twinned precipitate will grow faster along the plane of the twin than perpendicular to
the twin. The observation of a needle shape for these precipitates can thus be
correlated with the occurrence of this central twin plane resulting in surface facets of
different growth speed essentially yielding two-dimensional crystals. Indeed, a single
(111)fcc twin plane yields dense and slow growing (111)fcc surface planes on both sides
and parallel to this central twin plane while a re-entrant groove at which preferential
lateral growth occurs is present on three sides of the twin plane (see, e.g., right side of
precipitate-1 in Fig. 5(b)). For free growing crystals this will result in perfect
triangular or hexagonal crystals, depending on the actual number of parallel twins.
However, in the present case, with surrounding crystalline matrix and a K-S
relationship, flat facetted sheet-like precipitates with different aspect-ratios will be
formed and the observed needles can thus be interpreted as (electro)polished
cross-sections of these sheets, the latter having a diameter at least twice as large (and
often much more) than their height or thickness.
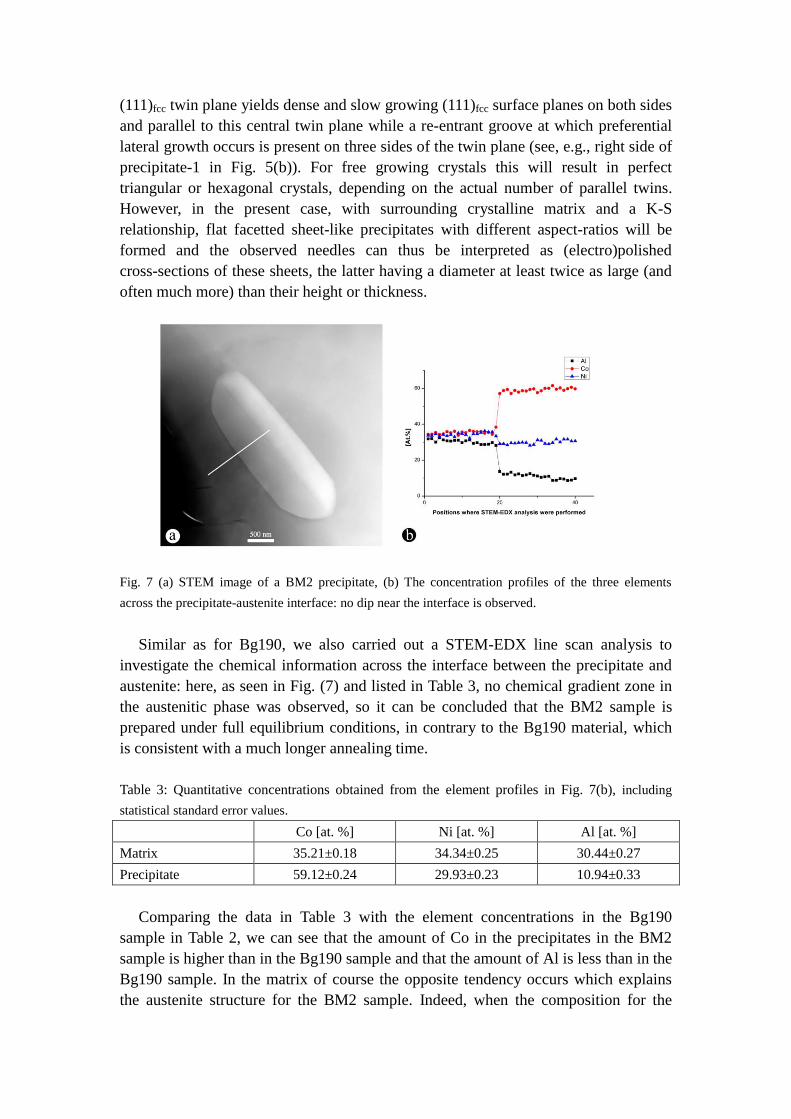
Fig. 7 (a) STEM image of a BM2 precipitate, (b) The concentration profiles of the three elements
across the precipitate-austenite interface: no dip near the interface is observed.
Similar as for Bg190, we also carried out a STEM-EDX line scan analysis to
investigate the chemical information across the interface between the precipitate and
austenite: here, as seen in Fig. (7) and listed in Table 3, no chemical gradient zone in
the austenitic phase was observed, so it can be concluded that the BM2 sample is
prepared under full equilibrium conditions, in contrary to the Bg190 material, which
is consistent with a much longer annealing time.
Table 3: Quantitative concentrations obtained from the element profiles in Fig. 7(b), including
statistical standard error values.
Co [at. %] Ni [at. %] Al [at. %]
Matrix 35.21±0.18 34.34±0.25 30.44±0.27
Precipitate 59.12±0.24 29.93±0.23 10.94±0.33
Comparing the data in Table 3 with the element concentrations in the Bg190
sample in Table 2, we can see that the amount of Co in the precipitates in the BM2
sample is higher than in the Bg190 sample and that the amount of Al is less than in the
Bg190 sample. In the matrix of course the opposite tendency occurs which explains
the austenite structure for the BM2 sample. Indeed, when the composition for the

BM2 matrix is added to Fig. 2 an Ms of 173K is found confirming the DSC measures
listed in Table 1. A dendritic growth of the matrix and precipitate was observed in
as-cast Co38Ni33Al29 samples at any growth rate including 7.7 m.s-1
(BM2) and 28.8
m.s-1
(Bg190) using the Bridgman method. Apparently different subsequent
annealing treatments in the present study yields different morphologies of precipitates
with the most prominent changes being introduced by the BM2 treatment.
Under different circumstances apparently genuine rod- or needle-shaped
precipitates have been reported in this system before. However, no L12 ordering was
observed and no twinning inside the precipitates was concluded. In both cases the
long axes of the rod was seen to grow in the <111> direction of the B2 matrix,
following the direction of the lowest interface misfit, similar to the lens-shape of
Ni4Ti3 precipitates playing an essential role in the functional behaviour of SMA alloys
of the Ni-Ti system. In the latter case the change in interplanar spacing in the
direction perpendicular to the central plane of the precipitate induces a strain gradient
in the matrix hindering the growth of the precipitate in this direction.
The larger ’ L12 precipitates observed in the BM2 samples of the present work,
however, do contain at least one plan-parallel internal twin plane. The reason that the
twinned precipitates are only observed in the BM2 sample can be understood from
energy competition between the formation of this internal defect and the surface
energy at the precipitate/matrix interface. Indeed, by nucleating with an internal twin
the precipitate can grow with large low energy close packed {111}p surface planes
which also induce the least strain inside the matrix. The latter can be concluded from
BF images as in Fig. 6(a) not showing any strain contrast but also from the typical
K-S diffraction pattern in, e.g., Fig. 5(d) from which the lattice planes in the
precipitate and matrix parallel to the interface are found to have the same interplanar
spacing. As indicated above, resulting from the internal twin are re-entrant grooves at
the edge of the precipitate promoting its growth along these edges. However, when
the annealing temperature is increased as in sample Bg190 the advantage of having
large low energy surface planes will be diminished by an increase of entropy and the
gain of forming a twin plane at the nucleation of the precipitate (and increasing its
total energy) will be minimized, eventually leading to single crystal precipitates
without faceting, but with dislocations and stacking faults accommodating internal
strain, as seen at the black arrow in Fig. 3(b).
Slice-and-View was carried out in order to study the 3D morphologies of the
precipitates in the BM2 sample. Slice-and-View is a powerful method to study the 3D
morphologies of the precipitates in alloys. In our experiment, ion beam worded at 30
kV, 9.5 nA and the electron beam worked at 5kV, 1.6nA. The thickness of the slice cut
off is 100nm.

Fig. 8(a, b) show the reconstructed image of the 3D morphology of one precipitate with twinning plane
inside and viewed along different directions. Fig. 8(c) shows one of the SEM images used for
reconstruction, from which the twinning of the precipitate can be observed.
Fig. 8 (a, b) shows the constructed images of one precipitate with one twinning
plane inside the precipitate viewed from different directions with Slice-and-View
technique. Fig. 8(c) shows one of the cross-section SEM images of the precipitate
used for reconstruction.
Fig. 9 (a-c) shows the reconstructed images of one precipitate without twinning viewed along different
directions. Fig. 9(d) shows one of the SEM images used for the reconstruction.
Fig. 9 (a-c) shows the reconstructed images of one precipitate without twinning
viewed along different directions. We can see the precipitate has a slab-like shape.
The thickness is about 1 micron. Fig. 9(d) shows one of the cross section SEM images
of the precipitate used for the 3D reconstruction, revealing the absence of the
twinning inside the precipitate.
4. Study of the magnetic structure
In order to investigate the magnetic domain structures of the precipitates and
matrix, Lorentz microscopy was performed. Fig. 10(a) shows the BF image of one
precipitate without a twinning plane, the inset shows the correspondent diffraction
pattern of the whole area. It was found that the precipitate lies along the [-11-1]p
direction and the interface between precipitate and matrix is {-11-2}p as indicated by
white arrows. Fig. 10(b-d) shows the Lorentz Fresnel image of the precipitate
observed at over-focus, in-focus and under-focus conditions at room temperature,
respectively. A closure domain can be observed inside the precipitate in Fig. 10(b, d).
The white arrows indicate the domain walls. The reversal of the magnetic domain
wall contrast can be observed, and the domain contrast is diminished at the in-focus

condition. Considering the crystallographic direction of the precipitate and the
morphology of the domain structure, the easy axis of the precipitate can be
determined to be <111>P. The black arrows in Fig. 10(d) indicate the magnetization
directions in the closure domains.
Fig. 10(a) shows the bright field image of one precipitate, the inset shows the selected area diffraction
pattern of the area including the precipitate and matrix. Fig. 10(b-d) show the over-focus, in-focus and
under-focus Fresnel image of the precipitate, respectively.
Fig. 11(a-d) shows a series of Fresnel images of the matrix obtained during an in
situ cooling experiment. Fig. 11(a) shows the over-focus Fresnel image at room
temperature. No magnetic domain contrast can be observed, which indicates the
matrix is paramagnetic. The selected area diffraction pattern at the upper left side of
Fig. 11(a) was obtained from the whole area. Fig. 11(b,c) shows the over-focus and
under-focus Fresnel image of matrix at -100°C. The inverse of the magnetic domain
wall contrast can be observed, from which it can be concluded that the straight black
and dark lines are domain walls in the sample. Fig. 11(d) shows the over-focus image
at -150°C. As we can see more magnetic domains appear when the sample is cooled
down. According to the Ms of the BM2 sample in Table 1, the matrix should
transform into martensite at -150°C. However, no martensitic transformation took
place when we kept the sample at -150°C for half an hour or even further cooling to

-170°C. The reason can be the inhomogeneity of the element composition in the
sample, which can strongly affect the local Ms transformation temperature or a thin
foil effect hampering the structural transformation. Taking into account of the
crystallography directions and the 180° walls, the magnetic easy axis of the matrix
can be determined to be [001] or [111]. Fig. 11(e) shows the over-focus Fresnel image
of another area of the matrix, as we can see the sample is austenite at the thinner area
whereas the sample is martensite at the thicker area.
Fig. 11(a) shows the over-focus Fresnel image of the matrix at room temperature. (b, c) show the
over-focus and under-focus Fresenel image of the same area at -100°C. (d) shows the over-focus image
of the matrix at -150°C. (e) shows the over-focus image of the matrix from another area at -150°C,
from which the coexistence of the martensite and austenite can be observed.
5. Conclusions
Transmission and scanning electron microscopy supported by analytical techniques
were performed to investigate the microstructure, 3D morphologies of the precipitate
and the magnetic domains of two kinds of Co38Ni33Al29 ferromagnetic shape memory
alloys, treated in different ways. The following conclusions are obtained:
(1) In the Bg190 sample, grown with a pulling rate of 28.8 m.s-1
and annealed at
1623K for 1h, the matrix shows large martensite regions and ’ precipitates
have a complicated dendritic structure with enclosed B2 austenite areas. Also,
a precipitate-austenite-martensite sandwich structure with residual austenite of
several hundred nanometers wide is formed due to the depletion of Co and
enrichment of Al in the chemical gradient zone and the effect of the strong
martensitic start temperature dependency of the element concentrations. The
orientation relationship between residual austenite and precipitate fits the

Kurdjumov-Sachs orientation relationship. The austenite [100]a direction is
found to be parallel to the martensite [110]m direction in this case, confirming
the origin of the sandwiched area as retained austenite.
(2) In the BM2 sample, grown with a pulling rate of 7.7 m.s-1
and annealed at
1373K for 72h, the matrix is austenite. Besides the complicated dendritic ’
precipitates similar to the observations in Bg190 sample, some micron-sized
precipitates formed in the matrix without, or with a single or three (-111)p twin
planes parallel to the central axis. These precipitates with twinning structure
have a specific orientation distribution due to the existence of the twin planes
and the Kurdjumov-Sachs orientation relationship between precipitates and
matrix. The growth of these kinds of precipitates can be explained by the Twin
Plane Re-entrant Edge growth theory. No chemical gradient zone was
observed across the interface of precipitates and austenite. The 3 D
morphologies of the precipitates without twinning plane have a slab-like shape,
while the precipitates with one twinning plane have a flat sheet-like shape
revealed by Slice-and-View technique. The Lorentz microscopy study reveals
that precipitates without twinning plane have a closure domain and the easy
axis is parallel to the [-11-1] at the room temperature. An in-situ cooling study
of the matrix is also carried out. The austenite matrix has a 180° parallel
domain, and the easy axis is parallel to [100] or [111].
Publications
Microstructure study of the precipitation behaviour in Co38Ni33Al29
ferromagnetic shape memory alloys, J.B. Lu, S. Sedlakova-Ignacova, R. Espinoza,
H. Shi, J. Kopeček, P. Sittner, D. Schryvers, B. Bártová, to be published
Magnetic study of the precipitation behaviour in Co38Ni33Al29 ferromagnetic
shape memory alloys, J.B. Lu, J. Kopeček, P. Sittner, D. Schryvers, to be
published
Recent EM investigations on nano- and micro-defect structures in SMAs, D.
Schryvers, S. Cao, S. Pourbabak, H. Shi, J.B. Lu, Journal of Alloys and
Compounds (proc. ICOMAT 2011, 4-9/09/11, Osaka, Jpn). accepted
Microstructure and intergrowth of defects in coffin-shaped ZSM-5 zeolite crystals
revealed by FIB-assisted HRTEM, JB Lu, D Schryvers, MBJ Roeffaers, E
Bartholomeeusen, B Sels, proc. emc2012, 16-21/09/12, Manchester, UK


