

RICE UNIVERSITY
Manual 1
Non-aqueous Phase
Titration for Total Acid
Number of Crude Oil
Yu Bian
08/10/2009

Prepared by Yu Bian, August, 2009
1
Name Comment Date

Prepared by Yu Bian, August, 2009
2
Contents
1. Non-aqueous Phase Titration ............................................. 3
1.1 Materials .......................................................................... 3
1.1.1 Solutions .................................................................... 3
1.1.2 Oil Sample ................................................................. 4
1.2 Equipment ....................................................................... 4
1.3 Procedure ........................................................................ 5
1.3.1 Conditioning the Electrode3 ........................................ 5
1.3.2 Titration Parameters .................................................. 7
1.3.3 Titrant Calibration ...................................................... 7
1.3.4 Controlled Experiment ............................................... 7
1.3.5 Titration of Oil Sample ............................................... 8
1.4 Discussion ..................................................................... 10
1.4.1 Electrode ................................................................. 10
1.4.2 Precondition ............................................................. 11
1.4.3 Electrode response with contact of crude oil or blank
solution ............................................................................. 15
1.4.4 Effect of sample size, volume step, titration rate ...... 16
1.4.5 Parallel blank ........................................................... 18
1.4.6 Asphaltene precipitation ........................................... 20
1.4.7 Benefit of spiking method ......................................... 23
1. 5 Conclusions .................................................................. 25
1. 6 Reference ..................................................................... 25

Prepared by Yu Bian, August, 2009
3
1. Non-aqueous Phase Titration
Acid number is defined as the quantity of base, expressed as milligrams of
potassium hydroxide per gram of sample, required to titrate a sample to
specified end point. Here, spiking method1 is used, because ASTM
(American Society for Testing and Materials) standard procedure2 requires
large amount of sample, 20 g oil sample if acid number is less than 1
mgKOH/gOil. In addition, the titration inflection point by ASTM is
frequently ambiguous. However, measurement of acid numbers measured
by spiking method not only requires smaller sample, 0.5 to 2.0 g oil, but
also yields a clear inflection point. This manual is prepared for measuring
acid number of the crude oil samples, including detailed discussion.
1.1 Materials
1.1.1 Solutions
(a) Organic Solvent (1000ml)
50% toluene (HPLC grade), 49.5% 2-propanol (HPLC grade) and 0.5%
deionized (DI) water (18.2 MΩ) in volume ratio. This solution is used for
most oil samples, but it is changed in some special case, please see
exception in 1.4.6.
(b) Spiking Solution (250ml)
Stearic acid dissolved in the organic solvent at a concentration of 0.02 M.
(c) Blank

Prepared by Yu Bian, August, 2009
4
75 ml organic solvent with 1 ml spiking solution. More organic solvent is
needed when using larger sample or some special case, as shown in
1.4.6.
(d) Titrant (500ml)
1.0 M tetrabutylamonium hydroxide (TBAOH) in methanol is bought from
Sigma-Aldrich and is diluted by ethanol to 0.05 M.
(e) Calibration solution (1000ml)
0.002 M potassium hydrogen phthalate (KHP) in DI water
1.1.2 Oil Sample
Crude oil is centrifuged before the titration to remove the water.
0.5-2 g crude oil is dissolved in 75 ml organic solvent with 1ml spiking
solution. Use larger sample size when acid number is small as discussed
in 1.4.4 and 1.4.6.
1.2 Equipment
Titrator: 716 DMS Titrator connected to a computer is used for
automatic titration and data collection.
Metrohm Solvotrode: a glass electrode (6.0229.100) is used in organic
solvent. It is a combination electrode and its reference electrolyte solution
is 0.4 M Tetra Ethyl Ammonium Bromide (TEABr) in ethylene glycol. If not
specified, the samples were titrated by this electrode. This electrode was
compared with Metrohm General and Orion 8165 in 1.4.1.

Prepared by Yu Bian, August, 2009
5
1.3 Procedure
1.3.1 Conditioning the Electrode3
Preparing the electrode for a titration after long storage
• Immerse the pH-sensitive glass membrane (but not the ground-joint diaphragm) in distilled water for one minute to hydrate it.
• Open the refill aperture for the reference electrolyte by sliding down the rubber ring covering it.
• Slightly lift the ring-shaped sleeve of the ground-joint diaphragm and allow a little electrolyte to flow out. Carefully slide the sleeve back into its original position without exerting too much pressure. If the ground-joint sleeve seize up, immerse it in hot water for about one minute before you again carefully try to loosen the sleeve.
• Rinse the electrode with distilled water without letting any water enter its interior.
• Fill the reference electrode with its electrolyte solution up to the refill aperture and close the refill aperture.
• Soak the electrode in DI water overnight before use if the electrode was previously originally stored in its electrolyte solution. See in 1.4.2.
• Open the refill aperture.
• Measure the potential difference (mV) between two buffer solution, pH=4 and pH=7, and the difference should be at least 150 mV at 25 °C.
• Precondition the electrode in organic solvent for 30 min before the first titration. See in 1.4.2.
Preparing the electrode for a titration daily
• The pH-sensitive glass membrane of the electrode should be immersed in distilled water overnight. (but not the ground-joint diaphragm)
• Open the refill aperture for the reference electrolyte by sliding down the rubber ring covering it.
• Fill the reference electrode with its electrolyte solution up to the refill aperture.
Prepared by Yu Bian, August, 2009
6
• Precondition the electrode in organic solvent for 30 min before the first titration. See in 1.4.2.
Between titrations
• Keep the refill aperture during titration.
• Rinse the electrode with the organic solvent.
• Rinse the electrode with DI water.
• Check whether the ground-joint diaphragm is blocked, i.e. whether you can see any deposits in the ground joint. If it is blocked, repeat the steps mentioned above for preparing the electrode.
• Rinse the electrode with the organic solvent.
• Precondition the electrode in the organic solvent for 3min between two titrations. See in 1.4.2.
Cleaning after the end of the titration
• Loosen the ring-shaped sleeve of the ground-joint diaphragm of the electrode.
• Remove any contamination of electrode caused by the sample with a suitable solvent, e.g. toluene.
• Rinse the electrode with distilled water
• Fill the reference electrode up to the refill aperture.
Storing the electrode
Storage periods of several days:
• Close the electrolyte refill aperture.
• Store the electrode in the corresponding reference electrolyte.
Shorter storage periods:
• Close the electrolyte refill aperture.
• Immerse the pH-sensitive glass membrane (but not the ground joint diaphragm) in DI water.

Prepared by Yu Bian, August, 2009
7
1.3.2 Titration Parameters
Titrant is delivered with the volume steps of 0.02 ml. Dosage rate is ≤0.2
ml/min. (TAN or stearic method in the computer). See discussion part in
1.4.4.
1.3.3 Titrant Calibration
Titrant concentration is calibrated by KHP aqueous solution. The
concentration of TBAOH is calculated by CKHPxVKHP/VTBAOH. Usually, the
concentration of KHP is 0.002M. 50 ml KHP is titrated by TBAOH to get
the inflection point to calculate the concentration of TBAOH.
1.3.4 Controlled Experiment4
Spiking solution (1.1.1(b)) will be used here as standard. The measured
concentration should agree with the prepared concentration. Various
volumes of spiking solution are diluted by same amount of organic solvent.
The volume of titrant is plotted versus the volume of spiking solution and
then the slope can be calculated as shown in Figure 1-1. Measured
concentration of stearic acid in spiking solution can be calculated from this
slope.
)()( TBAOHCslopestearicC ×= (1-1)

Prepared by Yu Bian, August, 2009
8
Titration of Spiking Solution
y = 0.3992x + 0.0962
R2 = 0.9997
0
0.2
0.4
0.6
0.8
1
1.2
1.4
1 1.5 2 2.5 3
V(spiking solution) mL
V(T
BA
OH
) m
L
Figure 1-1. Volume of titrant versus volume of spiking solution (75 ml
organic solvent)
Because the line intercept is not zero, Figure 1-1 indicates that the titration
is sensitive to the amount of organic solvent. Thus, it is important to keep
the volume of organic solvent same for sample and its blank.
1.3.5 Titration of Oil Sample
Titrate blank solution and oil sample (1.1.2). Each oil sample titration
should have one parallel blank titration with same amount of organic
solvent (reason is shown in 1.4.5). The titration results of Marathon Yates
sample labeled as MY8 and its blank solution are shown in Figure 1-2.

Prepared by Yu Bian, August, 2009
9
Figure 1-2. Titration of Yates MY8 and its parallel blank and the big
symbols shows the inflection point
Acid number can be calculated by
oilTBAOHbi WMwCVVAN /)( ××−= (1-2)
Where, AN: acid number (mgKOH/gOil); Vi: volume of titrant at the oil
sample inflection point (ml); Vb: volume of titrant at the blank inflection
point (ml); CTBAOH: molar concentration of TBAOH (M); Mw: molecular
weight of KOH (56.1g/mol); Woil: weight of the oil sample (g).
When the titration curve is not smooth and gives multiple end points, the
end point can be obtained by the cubic equation fitting and the details will
be shown in a separated chapter.

Prepared by Yu Bian, August, 2009
10
1.4 Discussion
1.4.1 Electrode4
Three electrodes were compared. Their properties were listed in the table
below.
Table 1-1 Properties of different electrodes
Metrohm Solvotrode Metrohm
general
Orion 8165
Electrolyte
Solution
0.4 mol/L Tetra Ethyl
Ammonium Bromide
(TEABr) in ethylene glycol
3 mol/L KCl
in DI
3 mol/L KCl
in DI
Diaphragm Ground-joint Ceramic
plate
Epoxy body
Metrohm Solvotrode was chosen over the other two electrodes because it
has faster and more stable response in organic solvent. For this particular
electrode, the filling solution TEABr in ethylene glycol is soluble in the
organic solvent. In contrast, Orion and Metrohm general electrodes use
nearly saturated KCl as the filling solution. This leads to the build-up of
KCl precipitate on the diaphragm, which impedes the ion transport (see
Figure 1-3). Furthermore, Solvotrode’s ground-joint allows inner electrolyte
solution to flow out of the aperture covered by the porous glass, which
makes it easy to clean. However, the diaphragm in Metrohm general is
made of a ceramic plate. When contacted with crude oil, the solid

Prepared by Yu Bian, August, 2009
11
contaminants in oil may clog the pores in the ceramic plate and damage
the electrode.
Figure 1-3. Metrohm general and Metrohm Solvotrode electrode. Left:
Metrohm general: before contact with organic solvent diaphragm is clean
of precipitates; middle: Metrohm general: after contact with organic solvent
KCl precipitates around diaphragm; right: Metrohm Solvotrode electrode
1.4.2 Precondition4
In order to keep the potential of a glass electrode constant, the ion
exchange across the membrane must have reached a stable condition.
Conditioning electrode in suitable electrolyte is necessary to ensure an
initial solvated layer condition that is as stationary as possible so that the
results can be as reproducible as possible. The electrode should be
preconditioned in the titration solvent as described in 1.3.1, as well as
between two successive titrations to restore its response. Preconditioning
is important in both non-aqueous and aqueous titration as shown below.
Prepared by Yu Bian, August, 2009
12
Precondition in organic solvent for non-aqueous titration
Metrohm Solvotrode Time Response Curve in Organic
Solvent
0
20
40
60
80
100
120
140
160
180
0 10 20 30 40 50
t/min
U/m
V
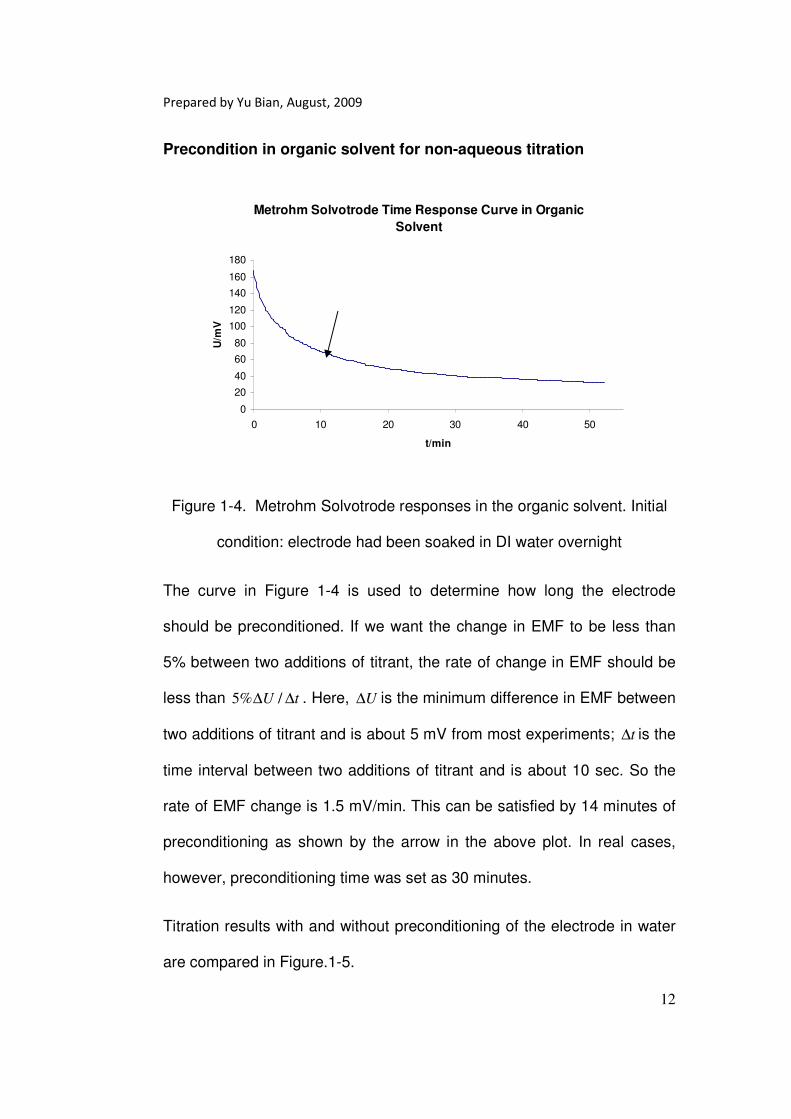
Figure 1-4. Metrohm Solvotrode responses in the organic solvent. Initial
condition: electrode had been soaked in DI water overnight
The curve in Figure 1-4 is used to determine how long the electrode
should be preconditioned. If we want the change in EMF to be less than
5% between two additions of titrant, the rate of change in EMF should be
less than 5% /U t∆ ∆ . Here, U∆ is the minimum difference in EMF between
two additions of titrant and is about 5 mV from most experiments; t∆ is the
time interval between two additions of titrant and is about 10 sec. So the
rate of EMF change is 1.5 mV/min. This can be satisfied by 14 minutes of
preconditioning as shown by the arrow in the above plot. In real cases,
however, preconditioning time was set as 30 minutes.
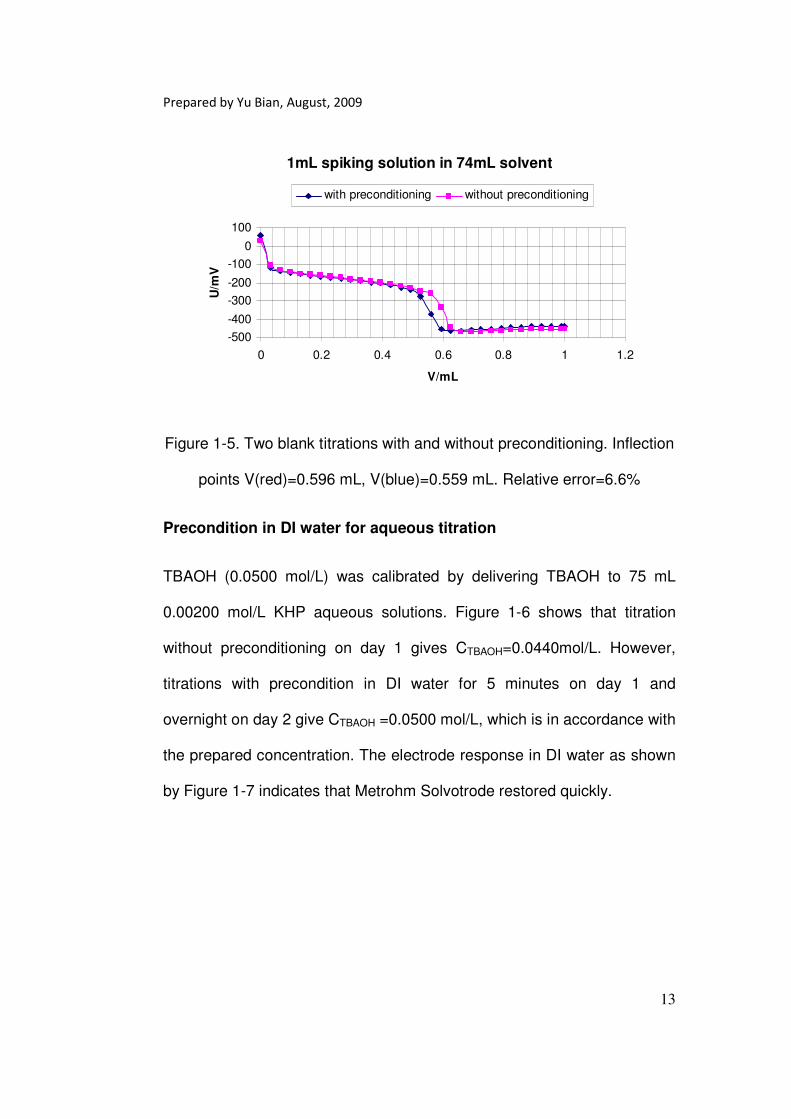
Titration results with and without preconditioning of the electrode in water
are compared in Figure.1-5.
Prepared by Yu Bian, August, 2009
13
1mL spiking solution in 74mL solvent
-500
-400
-300
-200
-100
0
100
0 0.2 0.4 0.6 0.8 1 1.2
V/mL
U/m
V
with preconditioning without preconditioning
Figure 1-5. Two blank titrations with and without preconditioning. Inflection
points V(red)=0.596 mL, V(blue)=0.559 mL. Relative error=6.6%
Precondition in DI water for aqueous titration
TBAOH (0.0500 mol/L) was calibrated by delivering TBAOH to 75 mL
0.00200 mol/L KHP aqueous solutions. Figure 1-6 shows that titration
without preconditioning on day 1 gives CTBAOH=0.0440mol/L. However,
titrations with precondition in DI water for 5 minutes on day 1 and
overnight on day 2 give CTBAOH =0.0500 mol/L, which is in accordance with
the prepared concentration. The electrode response in DI water as shown
by Figure 1-7 indicates that Metrohm Solvotrode restored quickly.

Prepared by Yu Bian, August, 2009
14
Titrant Calibration Curve with and
without Precondition in DI Water
-300
-250
-200
-150
-100
-50
0
50
100
150
200
0 2 4 6
V/mL
U/m
V
day1 without preconditionday1 with preconditionday2 with precondition
Figure 1-6. Titrant calibration curve with and without Precondition
Metrohm Solvotrode Electrode Time
Response in DI Water
-200
-150
-100
-50
0
50
0 1 2 3 4
t/min
U/m
V
Figure 1-7. The electrode responses in DI water. Initial condition:
electrode was soaked in the electrolyte solution (TEABr in ethyleneglycol)

Prepared by Yu Bian, August, 2009
15
1.4.3 Electrode response with contact of crude oil or blank solution4
It was reported by New Mexico Tech that whether blank titration was
performed before or after oil titration made a dramatic difference [Fan and
Buckley, 2008]. Blank titration before oil titration would give b i
V V> , which
would result in a negative acid number value. However, if the blank was
measured after oil titration, they had b i
V V< . According to them, only if the
blank was measured after contact with the crude oil (the electrode
response was affected for both measurements in the same manner) could
a realistic measure of acid number be obtained. This phenomenon of
dramatic change in blank titration curve was not observed in either MY6 or
Q-Sand titration result as shown in Figure 1-8 and 1-9.
Blank Measurement Before and After MY6 Oil
Titration
-500
-400
-300
-200
-100
0
100
200
300
0 0.2 0.4 0.6 0.8 1 1.2
V/mL
U/m
V
blank before oil titration
MY6 oil titration
blank after oil titration
Figure 1-8. Blank measurements before and after MY6 oil titration.
Exposure to MY6 crude oil sample does not drastically change the
electrode response. b
V (before)=0.566 mL, b
V (after)=0.556 mL.

Prepared by Yu Bian, August, 2009
16
Figure 1-9. Blank measurements before and after Q-sand oil titration.
Exposure to Q-Sand crude oil sample does not drastically change the
electrode response. b
V (before)=0.557 mL, b
V (after)=0.554 mL
Note that Figure 1-8 shows a difference of 0.01mL (an error of 1.8%)
between two blank titrations. This error would be significant if the acid
number is low. In this case, oil sample size must be increased.
1.4.4 Effect of sample size, volume step, titration rate4
From equation 1-2, more accurate acid number value can be obtained by
using larger sample size or smaller volume step. This is evaluated on MY8
crude oil sample by changing the sample size from 0.5 g to 1.0 g, the
volume step from 0.02 mL to 0.05 mL. The effect of titration rate was
evaluated by changing the dosage rate from 0.1 mL/min to 0.4 mL/min.
Table 1-2 shows that as sample size increased, standard deviation
became smaller.

Prepared by Yu Bian, August, 2009
17
Table 1-2. Effect of sample size. ∆V=0.033 mL, titration rate=0.2 mL/min
Vi (mL) Vb (mL) Oil (g) AN Mean Standard
0.687 0.528 0.5077 0.889 0.834 0.066
0.690 0.555 0.5037 0.761 0.673 0.525 0.4934 0.852
0.769 0.528 0.7543 0.907 0.907 0.040
0.735 0.486 0.7471 0.946
0.724 0.497 0.7441 0.866
0.798 0.497 1.0006 0.854 0.886 0.039
0.825 0.497 1.0024 0.929
0.807 0.499 1.0004 0.874
Table 1-3. Effect of volume step. Sample size=0.5 g, titration rate=0.2 mL/min
Vi(mL) Vb(mL) Oil (g) ∆V(mL) AN(mgKOH/gOil) Mean Standard
Deviation
0.643 0.506 0.4912 0.020
0.796 0.835 0.048
0.646 0.504 0.4933 0.821
0.660 0.507 0.4915 0.888
0.687 0.528 0.5077 0.033
0.889 0.834 0.066
0.690 0.555 0.5037 0.761
0.673 0.525 0.4934 0.852
0.645 0.500 0.4990 0.050
0.829 0.784 0.098
0.642 0.525 0.4971 0.672
0.648 0.500 0.4960 0.852
Table 1-4. Effect of titration rate. Sample size=0.5 g, ∆V=0.033 mL
Vi(mL) Vb(mL) Oil (g) Titration Rate
(ml/min)
AN(mgKO
H/gOil)
Mean Standard
Deviation
0.657 0.501 0.5017 0.1
0.883 0.875 0.046
0.668 0.502 0.5144 0.916 0.662 0.518 0.4948 0.826
0.687 0.528 0.5077 0.2
0.889 0.834 0.066
0.690 0.555 0.5037 0.930
0.673 0.525 0.4934 0.852
0.657 0.499 0.5046 0.4
0.889 0.829 0.073 0.645 0.515 0.4935 0.748
0.657 0.506 0.5042 0.850

Prepared by Yu Bian, August, 2009
18
Table 1-3 shows that as volume step decreased, standard deviation
became smaller.
Table 1-4 shows that as titration rate decreased, standard deviation
became smaller.
Take ½ ∆V as measuring accuracy, according to equation 1-2, this will
change the accuracy in acid number by Error range
=1/ 2 / 1/ 2 56.1 0.05 /w
V M M W V W∆ ⋅ ⋅ = ∆ × × . Table 1-5 and 1-6 show that
the standard deviation is smaller than the error range. The volume step
and oil size adopted in these measurements satisfied accuracy
requirement. Also, standard deviation becomes smaller with larger oil
sample size (Table 1-2) and smaller volume step (Table 1-3), as expected.
It is also found that accuracy improves with slower titration rate (Table 1-4).
Table 1-5. Error analysis by changing the oil size, ∆V=0.033 mL
Sample Size W (g) 0.5 0.75 1.0
Error range 0.093 0.062 0.046
Standard deviation 0.066 0.040 0.039
Table 1-6. Error analysis by changing the volume step, oil size=0.5 g
∆V(mL) 0.020 0.033 0.050 Error range 0.056 0.093 0.14
Standard 0.048 0.066 0.098
1.4.5 Parallel blank
Every sample should have a parallel blank with same amount of organic
solvent, because the organic solvent also consumes titrant and
experimental result is shown below.
Prepared by Yu Bian, August, 2009
19
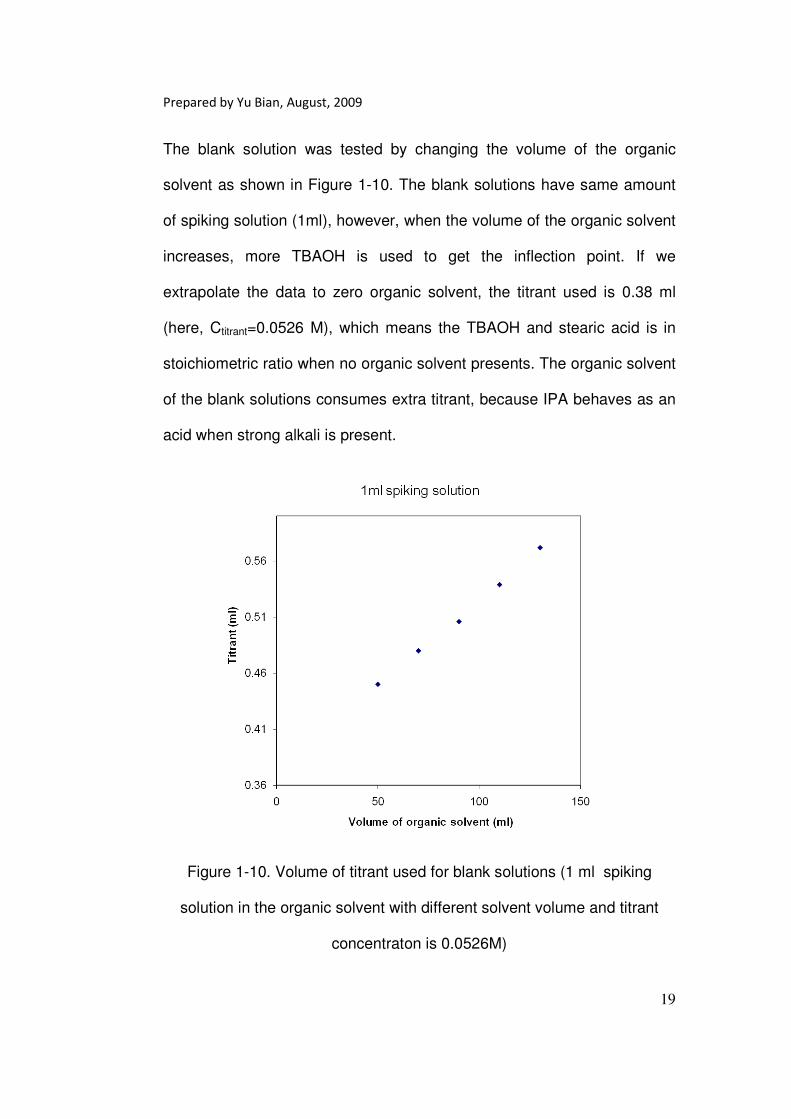
The blank solution was tested by changing the volume of the organic
solvent as shown in Figure 1-10. The blank solutions have same amount
of spiking solution (1ml), however, when the volume of the organic solvent
increases, more TBAOH is used to get the inflection point. If we
extrapolate the data to zero organic solvent, the titrant used is 0.38 ml
(here, Ctitrant=0.0526 M), which means the TBAOH and stearic acid is in
stoichiometric ratio when no organic solvent presents. The organic solvent
of the blank solutions consumes extra titrant, because IPA behaves as an
acid when strong alkali is present.
Figure 1-10. Volume of titrant used for blank solutions (1 ml spiking
solution in the organic solvent with different solvent volume and titrant
concentraton is 0.0526M)

Prepared by Yu Bian, August, 2009
20
1.4.6 Asphaltene precipitation
Pemex Akal oil precipitates with the standrd organic solvent during the
titration as shown by Figure 1-11, so the organic solvent was changed to
70% toluene, 29.5% IPA and 0.5% DI water, because the solubility is
enhanced by increasing ratio of toluene. Since the organic solvent is
changed, the spiking method need to be checked. The new organic
sovlents (toluene/ IPA ratio = 70/29.5) with spiking solution were studied
and compared with the old organic solvents (toluene/ IPA ratio = 50/49.5)
and results are shown by Figure 1-12 and 1-13, respectively.
Figure. 1-11 Precipitate of 20g Pemex Akal crude oil with 1 ml spiking
solution in 125 ml organic solvent (toluene/IPA=50/49.5)after titration.
Prepared by Yu Bian, August, 2009
21
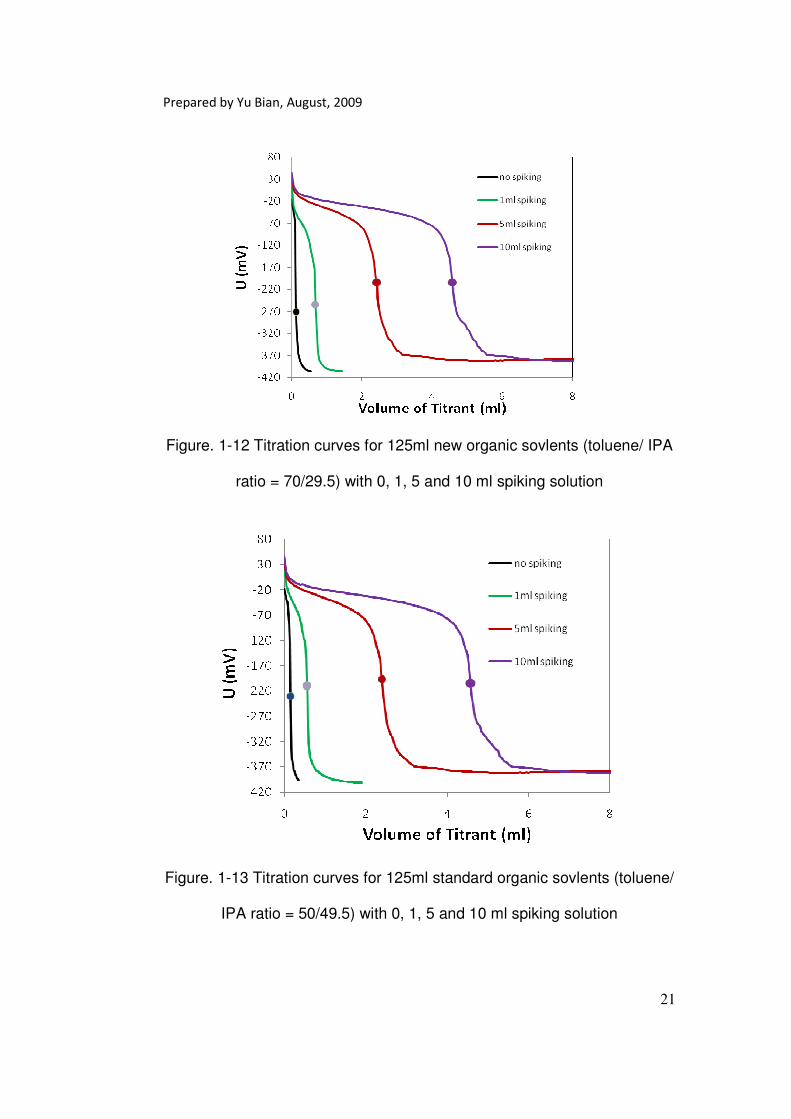
Figure. 1-12 Titration curves for 125ml new organic sovlents (toluene/ IPA
ratio = 70/29.5) with 0, 1, 5 and 10 ml spiking solution
Figure. 1-13 Titration curves for 125ml standard organic sovlents (toluene/
IPA ratio = 50/49.5) with 0, 1, 5 and 10 ml spiking solution

Prepared by Yu Bian, August, 2009
22
Figure. 1-14 Voltage at the inflection point of organic solvent (toluene/ IPA
ratio: 70/29.5 and 50/49.5) with 0, 1, 5 and 10 ml spiking solution
From Figure 1-13 and 1-14, it is noticed that the voltage at the inflection
point increase with increasing spiking solution volume. The voltage at the
inflection point vs. spiking solution volume is plotted in Figure 1-14.
Organic solvent with 50% toluene reach stable voltage with 1 ml spiking
solution, however, organic solvent with 70% toluene needs 5 ml spiking
solution to get stable voltage at the inflection point.
This is also observed in the titration results of Pemex Akal oil sample as
shown in Figure 1-15. When 1 g Akal crude oil with 1 ml spiking solution is
titrated, the effect of spiking is not enough, so the voltage at the inflection
point for the sample and blank is very different. Also, the total acid number
of Akal is very low (around 0.2 mgKOH/g), so inflection points for sample

Prepared by Yu Bian, August, 2009
23
and blank are close, which results in big system error. So sample size was
increased to 10 g with 1 ml spiking solution, then the titration result gives
multiple end points because the spiking solution is not enough. Then 5 g
Akal and 5 ml spiking solution was titrated. this sample shows clear
inflection point and the inflection points of sample and blank are found at
simlar voltage.
Figure. 1-15 Titration curve for Akal crude oil with different sample and
spiking solution size in 100 ml organic solution (toluene/IPA=70/29.5)
1.4.7 Benefit of spiking method
With the ASTM standard procedure, it is sometimes ambiguous to choose
the inflection point especially when a crude oil sample contains different
acids with various pKa’s. Such samples might give multiple inflection
points, or these points off-set resulting in no inflection point. However,

Prepared by Yu Bian, August, 2009
24
spiking method allows titration using smaller oil sample and gives sharper
inflection point as discussed in 1.4.6. (Figure 1-15).
The voltage at inflection point for sample and blank should be simlar;
otherwise, the inflection point is not for carboxylic acid. For example, when
MY8 is titrated by spiking method, as shown in Figure 1-16, a clear
inflection point was shown around 160 mV, but the inflection point for the
blank is around -210 mV, so the inflection point around 160mV is not the
end point for carboxylic acid. A second inflection point was observed by
continuous titration with more titrant. The first inflection point here
indicates the Yates MY8 crude oil contains some strong acid, which can
react with alkali, but does not produce soap. Therefore, spiking method
helps to decide where the carboxylic acid inflection point is.
Figure. 1-16 10g Yates MY8 oil in 125 ml organic solvent with 1ml spiking
solution

Prepared by Yu Bian, August, 2009
25
1. 5 Conclusions
Total acid number of crude oils is measured by acid-base titration. The
spiking method by using stearic acid as blank gives clear carboxlic
infletion point. There are different factors which affect the titration results,
such as precondition procedure, electrode response, sample and spiking
solution size, volume step, titration rate, parallel blank and asphaltene
precipitation. All these parameters are studied in this manual to improve
the titration technique.
1. 6 Reference
1. Fan, T., Buckley, J. S., “Acid Number Measurements Revisited”,
SPE Journal, 2007, 12(4), 496-500, SPE-99884-PA.
2. ASTM Standard Test Method D664-01 “Standard Test Method for
Acid Number of Petroleum Products by Potentiometric Titration”,
Annual Book of ASTM standard, Sect. 5, Am. Soc. Testing
Materials, Philadelphia, 2001.
3. http://www.metrohm.com
4. Robert Li’s Ph.D. thesis.


