

Geneva, 5-7 March 2008
Mobility and Climate ChangeAndreas Schäfer
University of Cambridge

The Fully Networked CarGeneva, 5-7 March 2008
2Structural Change in the Economy …
Sector shifts due to:1. Different income elasticities for goods and services produced by each of the three sectors2. Competitive advantage for each of the sector’s industries3. Changing needs of society
11 World-Regional Data series: 1971 - 1998

The Fully Networked CarGeneva, 5-7 March 2008
3… and in the Energy System
0
10
20
30
40
50
60
70
80
90
100
0 5000 10000 15000 20000 25000GDP/cap, US$(1985)
Sha
re in
Fin
al E
nerg
y, %
Residential
0
10
20
30
40
50
60
70
80
90
100
0 5000 10000 15000 20000 25000GDP/cap, US$(1985)
Sha
re in
Fin
al E
nerg
y, %
Agriculture
0
10
20
30
40
50
60
70
80
90
100
0 5000 10000 15000 20000 25000GDP/cap, US$(1985)
Sha
re in
Fin
al E
nerg
y, %
Industry
0
10
20
30
40
50
60
70
80
90
100
0 5000 10000 15000 20000 25000GDP/cap, US$(1985)
Sha
re in
Fin
al E
nerg
y, %
Services
Transportation
Others
Source: Schäfer A., 2005, Structural Change in Energy Use, Energy Policy, 33(4): 429-437.

The Fully Networked CarGeneva, 5-7 March 2008
4Determinants of GHG Emissions
o Identity of Greenhouse Gas Emissions (GGE):
GGE = GGE/E * E/PKT * PKT
PKT: Passenger-km TraveledE/PKT: Energy IntensityGGE/E: GHG Intensity of Fuel

The Fully Networked CarGeneva, 5-7 March 2008
5Travel Time Budget
0.0
0.5
1.0
1.5
2.0
2.5
3.0
3.5
4.0
4.5
5.0
0 5000 10000 15000 20000GDP/cap, US$(1985)
Trav
el T
ime
Bud
egt,
h/ca
p/d
African Villages in:I Tanzania, 1986II Ghana, 1988
City Surveys: 1 Tianjin (China), 1993 2 Kazanlik (Bulgaria), 1965/66 3 Lima-Callao (Peru), 1965/66 4 Pskov (Former USSR), 1965/66 5 Maribor (Former Yugoslavia), 1965/66 6 Kragujevac (F. Yugoslavia), 1965/66 7 Torun (Poland), 1965/66 8 Gyoer (Hungary), 1965/66 9 Olomouc (Former CSFR), 1965/6610 Hoyerswerde (Former GDR), 1965/6611 Sao Paulo (Brazil), 198712 Sao Paulo (Brazil), 197713 Warsaw (Poland), 199314 6 Cities (France), 1965/6615 Osnabruck (Germany), 1965/6616 44 Cities (USA), 1965/6617 Jackson (USA), 1965/6618 Paris (France), 1976
I II
19 Paris (France), 198320 Paris (France), 199121 Sendai (Japan), 197222 Sapporo (Japan), 197223 Kanazawa (Japan), 197424 Kagoshima (Japan), 197425 Kumamoto (Japan), 197326 Hamamatsu (Japan), 197527 Fukui (Japan), 197728 Niigata (Japan), 197829 Hiroshima (Japan), 197830 Osaka (Japan), 198031 Tokyo (Japan), 198032 Osaka (Japan), 198533 Tokyo (Japan), 198534 Cities No. 21-29 in 198735 Tokyo (Japan), 199036 Osaka (Japan), 1990
National Travel Surveys:A Belgium, 1965/66B Austria, 1983C Great Britain, 1985/86D Germany, 1976E Netherlands, 1979F Great Britain, 1989/91G Finland, 1986H Netherlands, 1987I France, 1984J Germany, 1982K Netherlands, 1989L USA, 1990M Germany, 1989N Switzerland, 1984O Switzerland, 1989P Australia, 1986Q Singapore, 1991R Norway, 1985S Norway, 1992T Japan, 1987
2
1
3 4
57
89 10 14 15
161712
11
136
18 19 20
22 23
2425
26 2728
2930
31
3233
35
36A34
B
C
D
E F
GH
I
J K L
M
N
OP
Q
R ST
21
Source: Schäfer A. and D.G. Victor (2000) The Future Mobility of the World Population, Transportation Research A, 34(3): 171-205
The Fully Networked CarGeneva, 5-7 March 2008
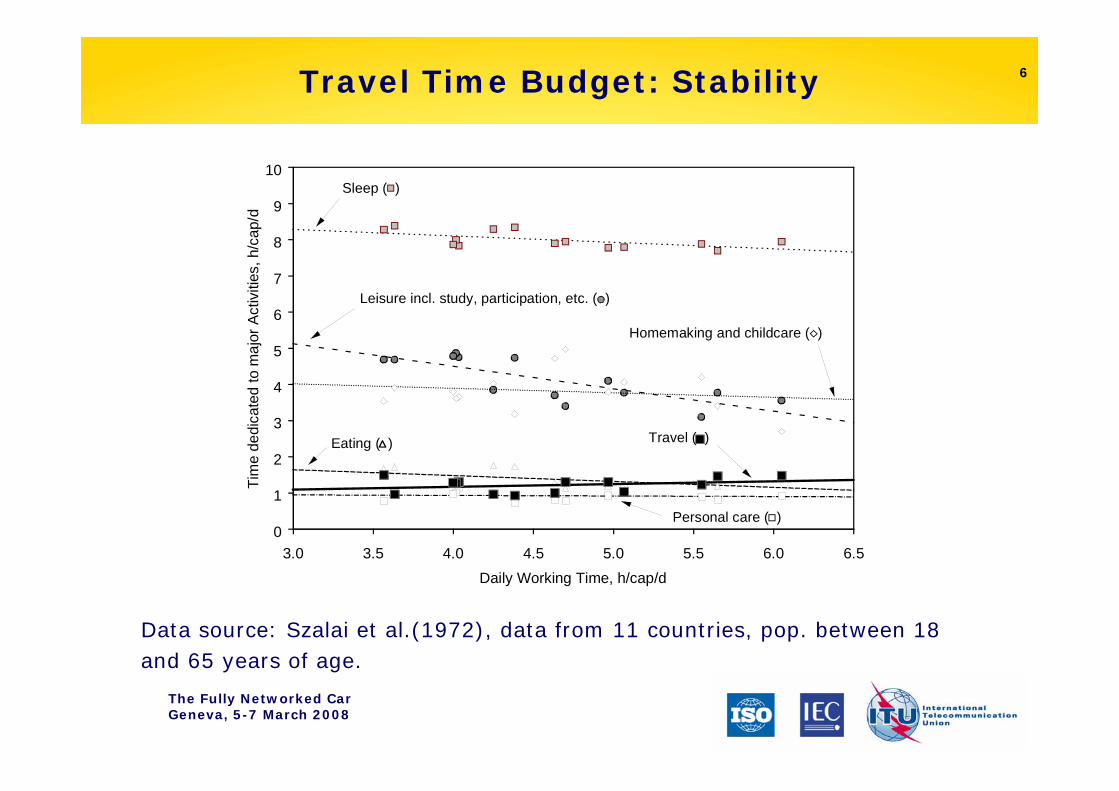
6Travel Time Budget: Stability
Data source: Szalai et al.(1972), data from 11 countries, pop. between 18 and 65 years of age.
0
1
2
3
4
5
6
7
8
9
10
3.0 3.5 4.0 4.5 5.0 5.5 6.0 6.5Daily Working Time, h/cap/d
Tim
e de
dica
ted
to m
ajor
Act
iviti
es, h
/cap
/d
Sleep ( )
Eating ( )
Homemaking and childcare ( )
Leisure incl. study, participation, etc. ( )
Personal care ( )
Travel ( )

The Fully Networked CarGeneva, 5-7 March 2008
7Travel Money Budget
0
5
10
15
20
25
0 100 200 300 400 500 600 700 800Motorization Rate, LDV/1000 Capita
Sha
re o
f GD
P d
edic
ated
to T
rave
l, %
U.S.: 1909-2001
Western Europe: 1963-2003
Eastern Europe: 2000-2002Japan: 1963-2003
Turkey: 1994
Sth. Africa: 2000
Sri Lanka: 2002
Individual Eastern European countries
Individual Western European countries
Mexico: 2000

The Fully Networked CarGeneva, 5-7 March 2008
8Global Mobility Trends
100
1,000
10,000
100,000
1,000,000
100 1,000 10,000 100,000 1,000,000
GDP/cap, US$(1996)
PKT/
cap
Centrally Planned AsiaLatin AmericaM. East, Nth&Sth AfricaOther Pacific AsiaSub-Saharan Africa
North AmericaPacific OECDWestern EuropeEastern EuropeFormer Soviet Union
South Asia
World
Data Range: 1950-2000
Source: A. Schäfer, Global Passenger Mobility Data Set, Version 1.0, University of Cambridge, Sept. 2005

The Fully Networked CarGeneva, 5-7 March 2008
9Declining Share of Public Transport
0.0
0.1
0.2
0.3
0.4
0.5
0.6
0.7
0.8
0.9
1.0
100 1000 10000 100000 1000000
PKT/cap
Shar
e of
Pub
lic T
rans
port
Mod
es in
PK
T
Centrally Planned AsiaLatin AmericaM. East, Nth&Sth AfricaOther Pacific AsiaSub-Saharan Africa
North AmericaPacific OECDWestern EuropeEastern EuropeFormer Soviet Union
South Asia
Data Range: 1950-2000
Source: A. Schäfer, Global Passenger Mobility Data Set, Version 1.0, University of Cambridge, Sept. 2005

The Fully Networked CarGeneva, 5-7 March 2008
10Changing relative Importance of the Automobile
0.0
0.1
0.2
0.3
0.4
0.5
0.6
0.7
0.8
0.9
1.0
100 1,000 10,000 100,000 1,000,000PKT/cap
Shar
e of
Lig
ht D
uty
Vehi
cles
in P
KT
Centrally Planned AsiaLatin AmericaM. East, Nth&Sth AfricaOther Pacific AsiaSub-Saharan Africa
North AmericaPacific OECDWestern EuropeEastern EuropeFormer Soviet Union
South Asia
Data Range: 1950-2000
Source: A. Schäfer, Global Passenger Mobility Data Set, Version 1.0, University of Cambridge, Sept. 2005

The Fully Networked CarGeneva, 5-7 March 2008
11The Rise of High-Speed Transportation
0.0
0.1
0.2
0.3
0.4
0.5
0.6
0.7
0.8
0.9
1.0
100 1,000 10,000 100,000 1,000,000
PKT/cap
Sha
re o
f Hig
h-S
peed
Mod
es in
PK
T
Centrally Planned AsiaLatin AmericaM. East, Nth&Sth AfricaOther Pacific AsiaSub-Saharan Africa
North AmericaPacific OECDWestern EuropeEastern EuropeFormer Soviet Union
South Asia
Source: A. Schäfer, Global Passenger Mobility Data Set, Version 1.0, University of Cambridge, Sept. 2005
Data Range: 1950-2000

The Fully Networked CarGeneva, 5-7 March 2008
12Evolution of Travel Demand: Past, Present, Future
0
10,000
20,000
30,000
40,000
50,000
From left to right:North AmericaWestern EuropePacific OECDLatin AmericaMiddle East & N/S AfricaEastern EuropeFormer Soviet UnionOther Pacific AsiaSouth AsiaSub-Saharan AfricaCentrally Planned Asia
0
10,000
20,000
30,000
40,000
50,000
High-Speed Transport (Aircraft & High-Speed Rail)
Low-Speed Public Transport Modes
Light-Duty Vehicles
From left to right:North AmericaWestern EuropePacific OECDOther Pacific AsiaMiddle East & N/S AfricaLatin AmericaEastern EuropeFormer Soviet UnionSouth AsiaCentrally Planned AsiaSub-Saharan Africa
From left to right:North AmericaWestern EuropePacific OECDEastern EuropeOther Pacific AsiaLatin AmericaFormer Soviet UnionMiddle East & N/S AfricaCentrally Planned AsiaSouth AsiaSub-Saharan Africa
0
10,000
20,000
30,000
40,000
50,000
Population (million)0 987654321 10
Population (million)0 987654321 10
Population (million)0 987654321 10
PKT/cap
PKT/cap
PKT/cap
1950 2000 2050 (?)
2050 travel demand > 3 X 2000 level at a roughly 3-fold GDP level

The Fully Networked CarGeneva, 5-7 March 2008
13Determinants of GHG Emissions: E/PKT (1)
o Historical trend: initially increasing, then leveling off at roughly 2 MJ/pkm due to
• Increasing forces: shift toward faster and more energy-intensive modes; shift toward larger and more powerful automobiles; declining automobile occupancy rates; etc.
• Mitigating forces: strong fuel-efficiency improvements and increasing passenger load factors of aircraft; fuel efficiency improvements of light-duty vehicles within each size class

The Fully Networked CarGeneva, 5-7 March 2008
14Determinants of GHG Emissions: E/PKT (2)
o Opportunities for reduction: significant (30-50%) over the next 20 years at current performance levels• Automobile/aircraft engines, others• Vehicle driving/flight resistances
o Challenges:• Extra costs of fuel-saving technology,
consumer preferences, etc.• Thus policies required to push fuel-
saving technologies into the market
The Fully Networked CarGeneva, 5-7 March 2008
15Determinants of GHG Emissions: GGE/E
o Historical trend: roughly constant (.73 gCO2/MJ for petroleum-based fuels)
o Opportunities for reduction: potentially significant but long-term• Current vs. second generation biofuels• Hydrogen and electricity
o Challenges for alternative fuels:• Energy density, convenience, costs,
scale (amount and location of resources), environmental, etc.

The Fully Networked CarGeneva, 5-7 March 2008
16World Passenger Mobility GHG Emissions
Projected low and high values differ by economic growth rate and thus PKT, mode share, and average E/PKT; and by the displacement of secondary bio-fuels for petroleum fuels. The travel demand under-lying the low projections corresponds to the 2050 projection on slide 12
0
5,000
10,000
15,000
20,000
25,000
low high low high low high
Constant FuelConsumption
$50/bbl $100/bbl
1950 2000 2050G
HG
Em
issi
ons,
MtC
O2-
eq
Fuel&Vehicle CycleHigh-Speed TransportPublic TransportLight-Duty Vehicles
$50/bbl & 550ppm
Atmospheric stabilization of CO2 concentration at 550ppm: carbon tax in 2030: $30/t(CO2)
Prevailing 2050 auto-mobile technologies:$50/bbl: gasoline-fueled mech drivetrain vehicle with reduced driving resistances $100/bbl: diesel-fueled mech drivetrain vehicle with strongly reduced driving resistances $50/bbl + C-tax:gasoline-fueled mechdrivetrain vehicle with strongly reduced driving resistances
The Fully Networked CarGeneva, 5-7 March 2008
17Some Conclusions
o Global travel demand likely to continue to grow strongly; demand growth coupled with a rising relative importance of faster modes
o Large opportunities exist for reducing GHG emissions; but they are more than offset by strong demand growth. Thus, world GHG emission will continue to grow even under stringent GHG mitigation policies
o Policies that focus on GHG mitigation cause technology to change but are unlikely to significantly impact growth in travel demand


