

MONTHLY UPDATE
JANUARY 2017

INDEX
Fund Name SFIN Page No
Balanced Managed Fund ‐ Life ULIF00402/01/04BalancedMF101 3Balanced Managed Fund ‐ Pension ULIF01102/01/04BalancedMF101 4Defensive Managed Fund ‐ Life ULIF00302/01/04DefensiveF101 5Defensive Managed Fund ‐ Pension ULIF01002/01/04DefensiveF101 6Growth Fund ‐ Life ULIF00502/01/04GrowthFund101 7Growth Fund ‐ Pension ULIF01202/01/04GrowthFund101 8Liquid Fund ‐ Life ULIF00102/01/04LiquidFund101 9Liquid Fund ‐ Pension ULIF00802/01/04LiquidFund101 10Secured Managed Fund ‐ Life ULIF00202/01/04SecureMgtF101 11Secured Managed Fund ‐ Pension ULIF00902/01/04SecureMgtF101 12Equity Managed Fund ‐ Life ULIF00616/01/06EquityMgFd101 13Equity Managed Fund ‐ Pension ULIF01316/01/06EquityMgFd101 14Stable Managed Fund ‐ Life ULIF00720/06/07StableMgFd101 15Stable Managed Fund ‐ Pension ULIF01420/06/07StableMgFd101 16Balanced Managed Fund ‐ Life ‐ II ULIF01920/02/08BalncdMFII101 17Defensive Managed Fund ‐ Life ‐ II ULIF01820/02/08DefnsvFdII101 18Equity Managed Fund ‐ Life ‐ II ULIF02020/02/08EquityMFII101 19Growth Fund ‐ Life ‐ II ULIF02120/02/08GrwthFndII101 20Liquid Fund ‐ Life ‐ II ULIF01520/02/08LiquidFdII101 21Secured Managed Fund ‐ Life ‐ II ULIF01720/02/08SecureMFII101 22Stable Managed Fund ‐ Life ‐ II ULIF01620/02/08StableMFII101 23Bond Opportunities Fund ULIF03004/08/08BondOprtFd101 24Large Cap Fund ULIF03204/08/08Large‐CapF101 25Manager's Fund ULIF03304/08/08ManagerFnd101 26
Individual Fund Fact Sheet for January 2017
Mid Cap Fund ULIF03104/08/08Mid‐capFnd101 27Money Plus Fund ULIF02904/08/08MoneyPlusF101 28Balanced Managed Fund ‐ Pension ‐ II ULIF02608/10/08BalncdMFII101 29Defensive Managed Fund ‐ Pension ‐ II ULIF02508/10/08DefnsvFdII101 30Equity Managed Fund ‐ Pension ‐ II ULIF02708/10/08EquityMFII101 31Growth Fund ‐ Pension ‐ II ULIF02808/10/08GrwthFndII101 32Liquid Fund ‐ Pension ‐ II ULIF02208/10/08LiquidFdII101 33Secured Managed Fund ‐ Pension ‐ II ULIF02408/10/08SecureMFII101 34Stable Managed Fund ‐Pension ‐ II ULIF02308/10/08StableMFII101 35BlueChip Fund ULIF03501/01/10BlueChipFd101 36Income Fund ULIF03401/01/10IncomeFund101 37Opportunities Fund ULIF03601/01/10OpprtntyFd101 38Vantage Fund ULIF03701/01/10VantageFnd101 39Balanced Fund ULIF03901/09/10BalancedFd101 40Highest Nav Guarentee Fund ULIF04001/09/10HighestNAV101 41Short Term Fund ULIF03801/09/10ShortTrmFd101 42Capital Guarantee Fund ULIF04126/10/10CaptlGuaFd101 43Pension Guarantee Maximus Fund ULIF04224/01/11PenGuaFnd1101 44Pension Super Plus Fund ‐ 2012 ULIF04818/06/12PenSuPls12101 45Equity Plus Fund ULIF05301/08/13EquityPlus101 46Diversified Equity Fund ULIF05501/08/13DivrEqtyFd101 47Bond Fund ULIF05601/08/13Bond Funds101 48Conservative Fund ULIF05801/08/13ConsertvFd101 49Pension Income Fund ULIF06101/04/14PenIncFund101 50Pension Equity Plus Fund ULIF06001/04/14PenEqPlsFd101 51Capital Growth Fund ULIF06301/04/15CapGrwthFd101 52Capital Secure Fund ULIF06401/04/15CapSecFund101 53Policy Discontinued Fund ‐ Life ULIF05110/03/11DiscontdPF101 54Policy Discontinued Fund ‐ Pension ULIF05201/10/13DiscontdPF101 55

AUM (` in Lakhs)
SFIN Code : ULIF00402/01/04BalancedMF101 Equity Debt MMI & Others Total
Inception Date : 02 Jan 2004 23,467.83 21,661.48 1,952.94 47,082.26
NAV : 95.2592
Fund V/s Benchmark Performance Equity Fund Debt Fund Balanced Fund
Period Returns (%) Benchmark Returns (%)# Mr Kailash Lalwani - 12 11
Inception 12.26% 9.39% Mr Shailesh Dhamankar 3 - 10
5 Years 12.04% 10.40%
3 Years 16.05% 12.64% Asset Category F&U Mandate
2 Years 6.11% 5.58% Money Market Insts 0% to 5%
1 Year 17.42% 14.51% Public Deposits 0% to 15%
6 Months 3.81% 3.40% Govt. Securities
1 Month 3.07% 3.05% Corporate Bonds
# 45% BSE -100 55% CRISIL Composite Bond Fund Index Equity 30% to 60%
Note: Returns over 1 year have been annualized. Net Current Assets -
Portfolio
Equity % to Fund
HDFC Bank Ltd 4.82%
ITC Ltd. 3.22%
ICICI Bank Ltd 2.32%
Infosys Ltd 2.31%
Reliance Industries Ltd. 2.30%
Tata Motors Limited 1.58%
Maruti Suzuki India Ltd 1.46%
Larsen & Toubro Limited. 1.39%
Kotak Mahindra Bank Limited. 1.21%
IndusInd Bank Ltd. 1.14%
Others 28.09%
Total 49.84%
Debentures / Bonds % to Fund
IDFC Bank Ltd 5.29%
Mahindra and Mahindra Financial Services Ltd 1.83%
Housing Development Finance Corporation Ltd 1.76%
HDB Financial Services Ltd 1.69%
Tata Sons Ltd 1.61%
Reliance Ports and Terminals Ltd 1.27%
Indiabulls Housing Finance Ltd 1.24%
Rural Electrification Corporation Ltd 1.21%
Mahindra & Mahindra Ltd 1.04%
L&T Shipbuilding Ltd 0.99%
Others 4.38%
Total 22.30%
Government Securities % to Fund
8.32% GOI Mat 02-Aug-2032 3.88%
8.17% GOI Mat 01-Dec-2044 3.73%
6.79% GOI Mat 26-Dec-2029 2.35%
7.61% GOI Mat 09-May-2030 2.14%
8.40% GOI Mat 28-Jul-2024 2.07%
8.15% GOI Mat 24-Nov-2026 2.05%
7.72% GOI Mat 25-May-2025 1.97%
7.73% GOI Mat 19-Dec-2034 1.84%
8.13% GOI Mat 22-June-2045 1.61%
9.20% GOI Mat 30-Sep-2030 1.41%
Others 0.66%
Total 23.71%
Deposits, Money Mkt Securities and Net Current Assets. 4.15%
Grand Total 100.00%
Debt Parameters
Portfolio Yield (%) 7.06%
Avg Maturity (In Months) 133.85
Modified Duration (In Years) 6.61
0.00%
20% to 70% 46.01%
49.84%
2.99%
Balanced Managed Fund - Life as on January 31, 2017
Fund Objective : To generate long term capital appreciation along with current income from a combined portfolio of equity and debt market instruments. The equity exposure will be between 30%-60%.
Fund ManagerNo. Of Funds Managed
% of Actual
1.16%
19.33%
28.88%
23.71%
5.48%
4.90%
4.30%
3.22%
3.16%
2.54%
2.46%
2.03%
Others
Financial Service Activities
Government Securities
Mfg of Motor Vehicles
Mfg of Coke &Refined Petroleum
Computer Programming
Mfg of Tobacco Products
Mfg of Pharmaceuticals
Mfg of Basic Metals
Mfg of Other Transport Equip.
Mfg of Non-metallic mineral Products
Sector Allocation as per NIC 2008% to Fund
7.52% 5.65%
48.09%38.74%
0.00%
10.00%
20.00%
30.00%
40.00%
50.00%
60.00%
70.00%
80.00%
90.00%
100.00%
0 - 1 Yr 1 - 3 Yrs 3 - 10 Yrs Above 10 Yrs
Debt Maturity Profile
Sovereign
51.53%
AAA 46.25%
AA & below
2.22%
Debt Rating Profile

AUM (` in Lakhs)SFIN Code : ULIF01102/01/04BalancedMF101 Equity Debt MMI & Others TotalInception Date : 02 Jan 2004 17,270.33 14,726.83 1,001.04 32,998.20NAV : 92.7675
Fund V/s Benchmark Performance Equity Fund Debt Fund Balanced FundPeriod Returns (%) Benchmark Returns (%)# Mr Kailash Lalwani - 12 11Inception 12.03% 9.39% Mr Farokh Pandole - - 135 Years 12.33% 10.40%3 Years 16.60% 12.64% Asset Category F&U Mandate2 Years 6.73% 5.58% Money Market Insts 0% to 5%1 Year 16.66% 14.51% Public Deposits 0% to 15%6 Months 3.69% 3.40% Govt. Securities1 Month 3.59% 3.05% Corporate Bonds
# 45% BSE -100 55% CRISIL Composite Bond Fund Index Equity 30% to 60%Note: Returns over 1 year have been annualized. Net Current Assets -
Portfolio
Equity % to FundHDFC Bank Ltd 5.17%ITC Ltd. 3.11%Reliance Industries Ltd. 2.44%Larsen & Toubro Limited. 2.13%Infosys Ltd 2.03%Tata Consultancy Services Ltd. 1.92%Maruti Suzuki India Ltd 1.92%Tata Motors Limited 1.65%Kotak Mahindra Bank Limited. 1.62%ICICI Bank Ltd 1.45%Others 28.89%
Total 52.34%
Balanced Managed Fund - Pension as on January 31, 2017Fund Objective : To generate long term capital appreciation along with current income from a combined portfolio of equity and debt market instruments. The equity exposure will be between 30%-60%.
Fund ManagerNo. Of Funds Managed
% of Actual0.02%0.00%
20% to 70% 44.63%
52.34%3.01%
18.73%
27.61%
24.10%
6.25%
5.35%
4.26%
3.19%
3.11%
2.56%
2.44%
2.40%
Others
Financial Service Activities
Government Securities
Mfg of Motor Vehicles
Mfg of Coke &Refined Petroleum
Computer Programming
Mfg of Basic Metals
Mfg of Tobacco Products
Mfg of Non-metallic mineral …
Mfg of Chemical Products
Mfg of Pharmaceuticals
Sector Allocation as per NIC 2008% to Fund
Total 52.34%
Debentures / Bonds % to FundIDFC Bank Ltd 5.35%Housing Development Finance Corporation Ltd 1.95%HDB Financial Services Ltd 1.60%Tata Sons Ltd 1.45%Reliance Ports and Terminals Ltd 1.24%Mahindra and Mahindra Financial Services Ltd 1.16%L&T Shipbuilding Ltd 0.95%IOT Utkal Energy Services Limited 0.89%Hindalco Industries Ltd 0.87%National Thermal Power Corporation Ltd 0.77%Others 4.29%
Total 20.52%
Government Securities % to Fund8.17% GOI Mat 01-Dec-2044 4.40%9.20% GOI Mat 30-Sep-2030 2.58%8.32% GOI Mat 02-Aug-2032 2.56%6.79% GOI Mat 26-Dec-2029 2.33%8.13% GOI Mat 22-June-2045 2.15%8.15% GOI Mat 24-Nov-2026 2.08%8.40% GOI Mat 28-Jul-2024 1.94%7.72% GOI Mat 25-May-2025 1.93%7.73% GOI Mat 19-Dec-2034 1.79%7.61% GOI Mat 09-May-2030 1.76%Others 0.60%
Total 24.10%
Deposits, Money Mkt Securities and Net Current Assets. 3.03%
Grand Total 100.00%
Debt ParametersPortfolio Yield (%) 7.11%Avg Maturity (In Months) 145.37Modified Duration (In Years) 7.04
3.02% 4.82%
49.95%42.20%
0.00%10.00%20.00%30.00%40.00%50.00%60.00%70.00%80.00%90.00%
100.00%
0 - 1 Yr 1 - 3 Yrs 3 - 10 Yrs Above 10 Yrs
Debt Maturity Profile
Sovereign 54.01%
AAA 42.10%
AA & below 3.89%
Debt Rating Profile

AUM (` in Lakhs)SFIN Code : ULIF00302/01/04DefensiveF101 Equity Debt MMI & Others TotalInception Date : 02 Jan 2004 2,876.06 6,960.07 673.21 10,509.34NAV : 71.5775
Fund V/s Benchmark Performance Equity Fund Debt Fund Balanced FundPeriod Returns (%) Benchmark Returns (%)# Mr Naveen Sharma - 15 16Inception 9.97% 8.10% Mr Farokh Pandole - - 135 Years 10.94% 10.09%3 Years 13.80% 12.36% Asset Category F&U Mandate2 Years 7.91% 8.03% Money Market Insts 0% to 5%1 Year 15.58% 14.14% Public Deposits 0% to 15%6 Months 5.02% 4.90% Govt. Securities1 Month 2.41% 2.13% Corporate Bonds
# 22.5% BSE -100 77.5% CRISIL Composite Bond Fund Index Equity 15% to 30%Note: Returns over 1 year have been annualized. Net Current Assets -
Portfolio
Equity % to FundHDFC Bank Ltd 2.60%ITC Ltd. 1.65%Reliance Industries Ltd. 1.29%Larsen & Toubro Limited. 1.12%Infosys Ltd 1.06%Maruti Suzuki India Ltd 1.02%Tata Consultancy Services Ltd. 1.01%Kotak Mahindra Bank Limited. 0.87%Tata Motors Limited 0.86%ICICI Bank Ltd 0.77%Others 15.11%
Defensive Managed Fund - Life as on January 31, 2017Fund Objective : To enhance long term returns for a portfolio predominantly invested in fixed income securities by taking a moderate to medium exposure to equity and equity related securities. The equity exposure will be between 15%-30%.
Fund ManagerNo. Of Funds Managed
% of Actual4.50%0.00%
50% to 85% 66.23%
27.37%1.91%
30.65%
29.08%
4.77%
4.41%
3.59%
2.90%
2.51%
2.48%
2.23%
1.97%
Financial Service Activities
Government Securities
Mfg of Motor Vehicles
Mfg of Coke &Refined Petroleum
Electricity,Gas & AC Supply
Mfg of Basic Metals
Civil Engineering
Warehousing
Computer Programming
Mfg of Chemical Products
Sector Allocation as per NIC 2008% to Fund
Total 27.37%
Debentures / Bonds % to FundHousing Development Finance Corporation Ltd 4.88%ICICI Securities Primary Dealership Ltd 3.15%East North Interconnection Co Ltd 2.66%Reliance Ports and Terminals Ltd 2.48%Bajaj Finance Ltd 2.46%Tata Sons Ltd 2.22%LIC Housing Finance Ltd 2.12%IOT Utkal Energy Services Limited 2.11%Mahindra & Mahindra Ltd 1.94%Rural Electrification Corporation Ltd 1.94%Others 11.18%
Total 37.15%
Government Securities % to Fund8.32% GOI Mat 02-Aug-2032 12.84%7.59% GOI Mat 20-Mar-2029 8.52%9.20% GOI Mat 30-Sep-2030 3.46%8.28% GOI Mat 21-Sep-2027 1.57%7.83% GOI Mat 11-Apr-2018 1.07%8.97% GOI Mat 05-Dec-2030 0.89%9.23% GOI Mat 23-Dec-2043 0.38%8.13% GOI Mat 22-June-2045 0.35%
Total 29.08%
Deposits, Money Mkt Securities and Net Current Assets. 6.41%
Grand Total 100.00%
Debt ParametersPortfolio Yield (%) 7.03%Avg Maturity (In Months) 108.20Modified Duration (In Years) 5.62
15.40%Others
7.32%17.28%
31.65%
43.75%
0.00%10.00%20.00%30.00%40.00%50.00%60.00%70.00%80.00%90.00%
100.00%
0 - 1 Yr 1 - 3 Yrs 3 - 10 Yrs Above 10 Yrs
Debt Maturity Profile
Sovereign 43.91%
AAA 47.65%
AA+ 5.18%AA & below
3.27%
Debt Rating Profile

AUM (` in Lakhs)
SFIN Code : ULIF01002/01/04DefensiveF101 Equity Debt MMI & Others Total
Inception Date : 02 Jan 2004 1,996.46 4,918.35 338.31 7,253.12
NAV : 65.1372
Fund V/s Benchmark Performance Equity Fund Debt Fund Balanced Fund
Period Returns (%) Benchmark Returns (%)# Mr Naveen Sharma - 15 16
Inception 9.18% 8.10% Mr Farokh Pandole - - 13
5 Years 11.13% 10.09%
3 Years 14.02% 12.36% Asset Category F&U Mandate
2 Years 8.21% 8.03% Money Market Insts 0% to 5%
1 Year 16.00% 14.14% Public Deposits 0% to 15%
6 Months 5.16% 4.90% Govt. Securities
1 Month 2.46% 2.13% Corporate Bonds
# 22.5% BSE -100 77.5% CRISIL Composite Bond Fund Index Equity 15% to 30%
Note: Returns over 1 year have been annualized. Net Current Assets -
Portfolio
Equity % to Fund
HDFC Bank Ltd 2.61%
ITC Ltd. 1.62%
Reliance Industries Ltd. 1.29%
Larsen & Toubro Limited. 1.14%
Maruti Suzuki India Ltd 1.10%
Infosys Ltd 1.06%
Tata Consultancy Services Ltd. 1.02%
Kotak Mahindra Bank Limited. 0.88%
Tata Motors Limited 0.87%
ICICI Bank Ltd 0.78%
Others 15.16%
Total 27.53%
Debentures / Bonds % to Fund
Rural Electrification Corporation Ltd 8.69%
Indian Railway Finance Corporation Ltd 3.47%
Bajaj Finance Ltd 3.16%
Mahindra & Mahindra Ltd 3.10%
Power Finance Corporation Ltd 2.91%
Reliance Ports and Terminals Ltd 2.88%
East North Interconnection Co Ltd 2.32%
ICICI Bank Ltd 2.22%
Capital First Ltd. 2.19%
LIC Housing Finance Ltd 2.16%
Others 19.38%
Total 52.48%
Government Securities % to Fund
8.32% GOI Mat 02-Aug-2032 5.15%
8.83% GOI Mat 12-Dec-2041 3.25%
9.20% GOI Mat 30-Sep-2030 2.03%
8.15% GOI Mat 24-Nov-2026 1.95%
7.61% GOI Mat 09-May-2030 1.48%
7.59% GOI Mat 20-Mar-2029 1.46%
Total 15.33%
Deposits, Money Mkt Securities and Net Current Assets. 4.66%
Grand Total 100.00%
Debt Parameters
Portfolio Yield (%) 7.12%
Avg Maturity (In Months) 100.36
Modified Duration (In Years) 5.36
0.00%
50% to 85% 67.81%
27.53%
0.76%
Defensive Managed Fund - Pension as on January 31, 2017
Fund Objective : To enhance long term returns for a portfolio predominantly invested in fixed income securities by taking a moderate to medium exposure to equity and equity related securities. The equity
exposure will be between 15%-30%.
Fund ManagerNo. Of Funds Managed
% of Actual
3.90%
15.08%
42.07%
15.33%
7.63%
4.07%
3.27%
3.09%
2.88%
2.73%
2.24%
1.62%
Others
Financial Service Activities
Government Securities
Mfg of Motor Vehicles
Mfg of Coke &Refined Petroleum
Mfg of Basic Metals
Civil Engineering
Warehousing
Electricity,Gas & AC Supply
Computer Programming
Mfg of Tobacco Products
Sector Allocation as per NIC 2008% to Fund
5.44%9.51%
63.69%
21.36%
0.00%
10.00%
20.00%
30.00%
40.00%
50.00%
60.00%
70.00%
80.00%
90.00%
100.00%
0 - 1 Yr 1 - 3 Yrs 3 - 10 Yrs Above 10 Yrs
Debt Maturity Profile
Sovereign
22.60%
AAA 68.06%
AA+ 4.52%AA & below
4.83%
Debt Rating Profile

AUM (` in Lakhs)SFIN Code : ULIF00502/01/04GrowthFund101 Equity Debt MMI & Others TotalInception Date : 02 Jan 2004 310,745.25 - 12,959.23 323,704.48NAV : 138.3021
Fund V/s Benchmark Performance Equity Fund Debt Fund Balanced FundPeriod Returns (%) Benchmark Returns (%)# Mr Priyank Singhal 8 - - Inception 15.01% 12.56%5 Years 13.44% 11.16% Asset Category F&U Mandate3 Years 18.59% 13.31% Money Market Insts 0% to 5%2 Years 2.48% -0.40% Public Deposits 0%1 Year 16.04% 15.42% Govt. Securities6 Months 1.02% -0.27% Corporate Bonds1 Month 5.03% 5.31% Equity 95% to 100%
# BSE-100 Net Current Assets -Note: Returns over 1 year have been annualized.
Portfolio
Equity % to FundHDFC Bank Ltd 9.37%ITC Ltd. 6.11%Infosys Ltd 4.85%Reliance Industries Ltd. 4.20%ICICI Bank Ltd 3.85%Maruti Suzuki India Ltd 3.55%Larsen & Toubro Limited. 3.41%Tata Motors Limited 3.00%Mahindra & Mahindra Ltd. 2.80%SBI-ETF Nifty Bank 2.69%Others 52.17%
Growth Fund - Life as on January 31, 2017Fund Objective : To generate long term capital appreciation from a diversified portfolio of equity and equity related securities.
Fund ManagerNo. Of Funds Managed
% of Actual3.91%0.00%
0% 0.00%
96.00%0.09%
22.81%
24.25%
10.72%
8.55%
7.53%
6.11%
5.71%
4.13%
3.59%
3.41%
3.21%
Others
Financial Service Activities
Mfg of Motor Vehicles
Computer Programming
Mfg of Coke &Refined Petroleum
Mfg of Tobacco Products
Mfg of Pharmaceuticals
Mfg of Non-metallic mineral …
Other Financial Activities
Civil Engineering
Mfg of Electrical Equipment
Sector Allocation as per NIC 2008% to Fund
Total 96.00%
Deposits, Money Mkt Securities and Net Current Assets. 4.00%
Grand Total 100.00%
100.00%
80.00%
90.00%
100.00%
0 - 1 Yr
Debt Maturity Profile

AUM (` in Lakhs)SFIN Code : ULIF01202/01/04GrowthFund101 Equity Debt MMI & Others TotalInception Date : 02 Jan 2004 148,637.18 - 6,864.54 155,501.71NAV : 132.9177
Fund V/s Benchmark Performance Equity Fund Debt Fund Balanced FundPeriod Returns (%) Benchmark Returns (%)# Mr Priyank Singhal 8 - - Inception 14.66% 12.56%5 Years 13.48% 11.16% Asset Category F&U Mandate3 Years 18.62% 13.31% Money Market Insts 0% to 5%2 Years 2.51% -0.40% Public Deposits 0%1 Year 16.17% 15.42% Govt. Securities6 Months 1.02% -0.27% Corporate Bonds1 Month 5.02% 5.31% Equity 95% to 100%
# BSE-100 Net Current Assets -Note: Returns over 1 year have been annualized.
Portfolio
Equity % to FundHDFC Bank Ltd 9.36%ITC Ltd. 6.07%Infosys Ltd 4.82%Reliance Industries Ltd. 4.17%ICICI Bank Ltd 3.83%Maruti Suzuki India Ltd 3.53%Larsen & Toubro Limited. 3.39%Tata Motors Limited 2.98%Mahindra & Mahindra Ltd. 2.79%SBI-ETF Nifty Bank 2.68%Others 51.95%
Growth Fund - Pension as on January 31, 2017Fund Objective : To generate long term capital appreciation from a diversified portfolio of equity and equity related securities.
Fund ManagerNo. Of Funds Managed
% of Actual4.32%0.00%
0% 0.00%
95.59%0.10%
23.13%
24.18%
10.67%
8.49%
7.48%
6.07%
5.68%
4.11%
3.57%
3.39%
3.23%
Others
Financial Service Activities
Mfg of Motor Vehicles
Computer Programming
Mfg of Coke &Refined Petroleum
Mfg of Tobacco Products
Mfg of Pharmaceuticals
Mfg of Non-metallic mineral …
Other Financial Activities
Civil Engineering
Mfg of Electrical Equipment
Sector Allocation as per NIC 2008% to Fund
Total 95.59%
Deposits, Money Mkt Securities and Net Current Assets. 4.41%
Grand Total 100.00%
100.00%
80.00%
90.00%
100.00%
0 - 1 Yr
Debt Maturity Profile
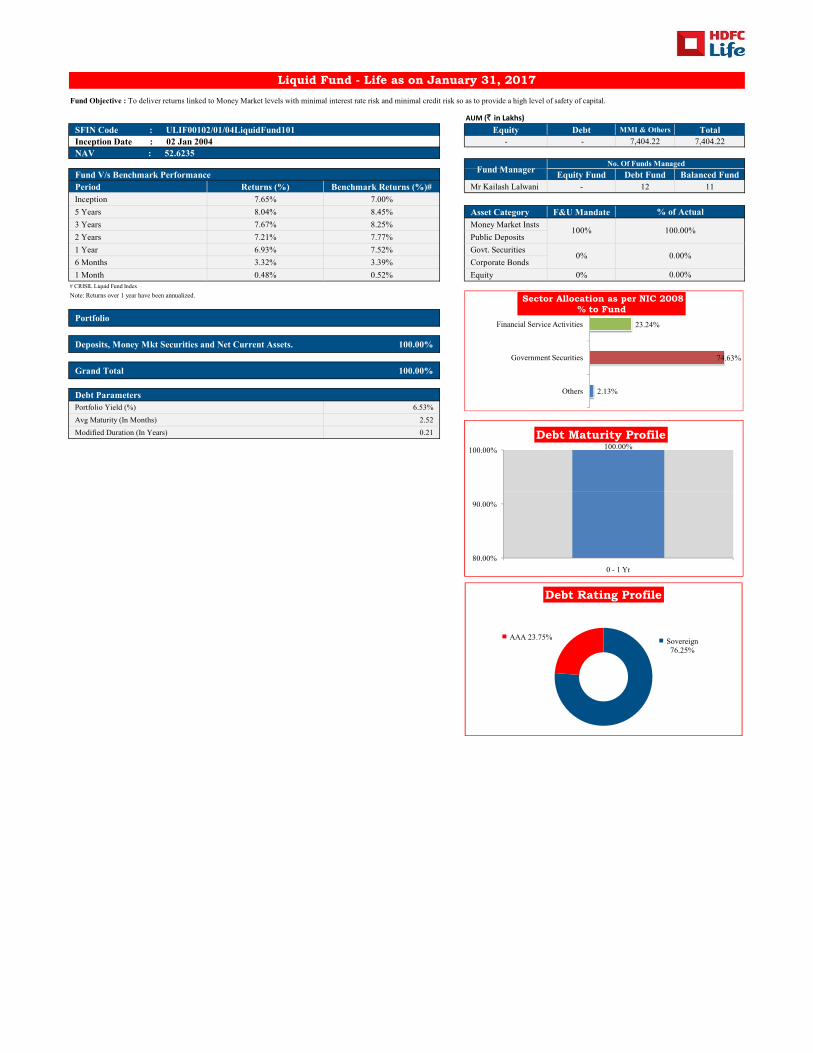
AUM (` in Lakhs)SFIN Code : ULIF00102/01/04LiquidFund101 Equity Debt MMI & Others TotalInception Date : 02 Jan 2004 - - 7,404.22 7,404.22NAV : 52.6235
Fund V/s Benchmark Performance Equity Fund Debt Fund Balanced FundPeriod Returns (%) Benchmark Returns (%)# Mr Kailash Lalwani - 12 11Inception 7.65% 7.00%5 Years 8.04% 8.45% Asset Category F&U Mandate3 Years 7.67% 8.25% Money Market Insts2 Years 7.21% 7.77% Public Deposits1 Year 6.93% 7.52% Govt. Securities6 Months 3.32% 3.39% Corporate Bonds1 Month 0.48% 0.52% Equity 0%
# CRISIL Liquid Fund IndexNote: Returns over 1 year have been annualized.
Portfolio
Deposits, Money Mkt Securities and Net Current Assets. 100.00%
Grand Total 100.00%
Debt ParametersPortfolio Yield (%) 6.53%Avg Maturity (In Months) 2.52Modified Duration (In Years) 0.21
0% 0.00%
0.00%
Liquid Fund - Life as on January 31, 2017Fund Objective : To deliver returns linked to Money Market levels with minimal interest rate risk and minimal credit risk so as to provide a high level of safety of capital.
Fund ManagerNo. Of Funds Managed
% of Actual
100% 100.00%
2.13%
74.63%
23.24%
Others
Government Securities
Financial Service Activities
Sector Allocation as per NIC 2008% to Fund
100.00%100.00%
Debt Maturity Profile
80.00%
90.00%
0 - 1 Yr
Sovereign 76.25%
AAA 23.75%
Debt Rating Profile

AUM (` in Lakhs)SFIN Code : ULIF00802/01/04LiquidFund101 Equity Debt MMI & Others TotalInception Date : 02 Jan 2004 - - 2,771.70 2,771.70NAV : 53.0425
Fund V/s Benchmark Performance Equity Fund Debt Fund Balanced FundPeriod Returns (%) Benchmark Returns (%)# Mr Kailash Lalwani - 12 11Inception 7.71% 7.00%5 Years 8.03% 8.45% Asset Category F&U Mandate3 Years 7.67% 8.25% Money Market Insts2 Years 7.19% 7.77% Public Deposits1 Year 6.94% 7.52% Govt. Securities6 Months 3.33% 3.39% Corporate Bonds1 Month 0.48% 0.52% Equity 0%
# CRISIL Liquid Fund IndexNote: Returns over 1 year have been annualized.
Portfolio
Deposits, Money Mkt Securities and Net Current Assets. 100.00%
Grand Total 100.00%
Debt ParametersPortfolio Yield (%) 6.57%Avg Maturity (In Months) 2.41Modified Duration (In Years) 0.20
0% 0.00%
0.00%
Liquid Fund - Pension as on January 31, 2017Fund Objective : To deliver returns linked to Money Market levels with minimal interest rate risk and minimal credit risk so as to provide a high level of safety of capital.
Fund ManagerNo. Of Funds Managed
% of Actual
100% 100.00%
1.09%
74.96%
23.94%
Others
Government Securities
Financial Service Activities
Sector Allocation as per NIC 2008% to Fund
100.00%100.00%
Debt Maturity Profile
80.00%
90.00%
0 - 1 Yr
Sovereign 75.79%AAA 24.21%
Debt Rating Profile
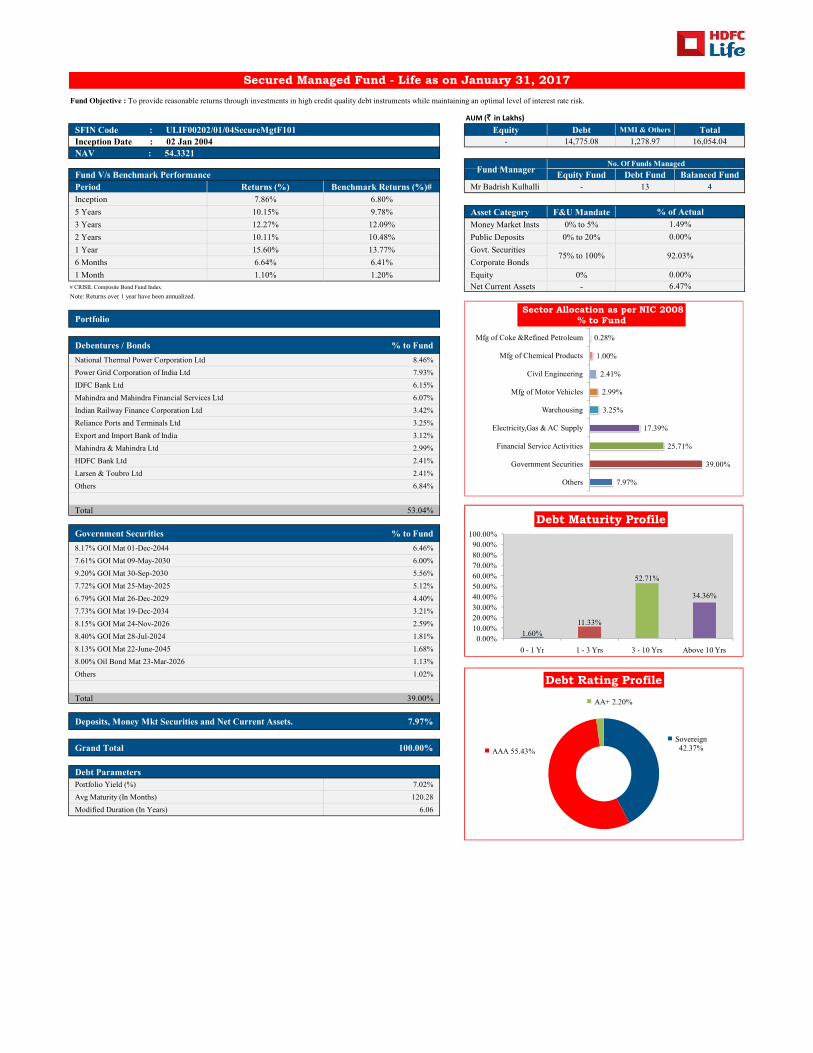
AUM (` in Lakhs)SFIN Code : ULIF00202/01/04SecureMgtF101 Equity Debt MMI & Others TotalInception Date : 02 Jan 2004 - 14,775.08 1,278.97 16,054.04NAV : 54.3321
Fund V/s Benchmark Performance Equity Fund Debt Fund Balanced FundPeriod Returns (%) Benchmark Returns (%)# Mr Badrish Kulhalli - 13 4Inception 7.86% 6.80%5 Years 10.15% 9.78% Asset Category F&U Mandate3 Years 12.27% 12.09% Money Market Insts 0% to 5%2 Years 10.11% 10.48% Public Deposits 0% to 20%1 Year 15.60% 13.77% Govt. Securities6 Months 6.64% 6.41% Corporate Bonds1 Month 1.10% 1.20% Equity 0%
# CRISIL Composite Bond Fund Index Net Current Assets -Note: Returns over 1 year have been annualized.
Portfolio
Debentures / Bonds % to FundNational Thermal Power Corporation Ltd 8.46%Power Grid Corporation of India Ltd 7.93%IDFC Bank Ltd 6.15%Mahindra and Mahindra Financial Services Ltd 6.07%Indian Railway Finance Corporation Ltd 3.42%Reliance Ports and Terminals Ltd 3.25%Export and Import Bank of India 3.12%Mahindra & Mahindra Ltd 2.99%HDFC Bank Ltd 2.41%Larsen & Toubro Ltd 2.41%Others 6.84%
Secured Managed Fund - Life as on January 31, 2017Fund Objective : To provide reasonable returns through investments in high credit quality debt instruments while maintaining an optimal level of interest rate risk.
Fund ManagerNo. Of Funds Managed
% of Actual1.49%0.00%
75% to 100% 92.03%
0.00%6.47%
7.97%
39.00%
25.71%
17.39%
3.25%
2.99%
2.41%
1.00%
0.28%
Others
Government Securities
Financial Service Activities
Electricity,Gas & AC Supply
Warehousing
Mfg of Motor Vehicles
Civil Engineering
Mfg of Chemical Products
Mfg of Coke &Refined Petroleum
Sector Allocation as per NIC 2008% to Fund
Total 53.04%
Government Securities % to Fund8.17% GOI Mat 01-Dec-2044 6.46%7.61% GOI Mat 09-May-2030 6.00%9.20% GOI Mat 30-Sep-2030 5.56%7.72% GOI Mat 25-May-2025 5.12%6.79% GOI Mat 26-Dec-2029 4.40%7.73% GOI Mat 19-Dec-2034 3.21%8.15% GOI Mat 24-Nov-2026 2.59%8.40% GOI Mat 28-Jul-2024 1.81%8.13% GOI Mat 22-June-2045 1.68%8.00% Oil Bond Mat 23-Mar-2026 1.13%Others 1.02%
Total 39.00%
Deposits, Money Mkt Securities and Net Current Assets. 7.97%
Grand Total 100.00%
Debt ParametersPortfolio Yield (%) 7.02%Avg Maturity (In Months) 120.28Modified Duration (In Years) 6.06
1.60%11.33%
52.71%
34.36%
0.00%10.00%20.00%30.00%40.00%50.00%60.00%70.00%80.00%90.00%
100.00%
0 - 1 Yr 1 - 3 Yrs 3 - 10 Yrs Above 10 Yrs
Debt Maturity Profile
Sovereign 42.37%AAA 55.43%
AA+ 2.20%
Debt Rating Profile

AUM (` in Lakhs)SFIN Code : ULIF00902/01/04SecureMgtF101 Equity Debt MMI & Others TotalInception Date : 02 Jan 2004 - 8,928.14 745.72 9,673.86NAV : 53.4616
Fund V/s Benchmark Performance Equity Fund Debt Fund Balanced FundPeriod Returns (%) Benchmark Returns (%)# Mr Badrish Kulhalli - 13 4Inception 7.73% 6.80%5 Years 10.15% 9.78% Asset Category F&U Mandate3 Years 12.26% 12.09% Money Market Insts 0% to 5%2 Years 10.11% 10.48% Public Deposits 0% to 20%1 Year 15.58% 13.77% Govt. Securities6 Months 6.63% 6.41% Corporate Bonds1 Month 1.09% 1.20% Equity 0%
# CRISIL Composite Bond Fund Index Net Current Assets -Note: Returns over 1 year have been annualized.
Portfolio
Debentures / Bonds % to FundNational Thermal Power Corporation Ltd 8.23%Power Grid Corporation of India Ltd 8.21%Mahindra and Mahindra Financial Services Ltd 6.17%IDFC Bank Ltd 5.66%Indian Railway Finance Corporation Ltd 3.53%Reliance Ports and Terminals Ltd 3.24%Export and Import Bank of India 3.15%Mahindra & Mahindra Ltd 3.06%HDFC Bank Ltd 2.60%Larsen & Toubro Ltd 2.27%Others 6.11%
Secured Managed Fund - Pension as on January 31, 2017Fund Objective : To provide reasonable returns through investments in high credit quality debt instruments while maintaining an optimal level of interest rate risk.
Fund ManagerNo. Of Funds Managed
% of Actual1.31%0.00%
75% to 100% 92.29%
0.00%6.40%
7.71%
40.06%
24.94%
17.44%
3.24%
3.06%
2.27%
1.11%
0.18%
Others
Government Securities
Financial Service Activities
Electricity,Gas & AC Supply
Warehousing
Mfg of Motor Vehicles
Civil Engineering
Mfg of Chemical Products
Mfg of Coke &Refined Petroleum
Sector Allocation as per NIC 2008% to Fund
Total 52.23%
Government Securities % to Fund7.61% GOI Mat 09-May-2030 6.33%8.17% GOI Mat 01-Dec-2044 6.28%9.20% GOI Mat 30-Sep-2030 6.05%7.72% GOI Mat 25-May-2025 5.19%6.79% GOI Mat 26-Dec-2029 4.40%7.73% GOI Mat 19-Dec-2034 3.29%8.15% GOI Mat 24-Nov-2026 2.67%8.13% GOI Mat 22-June-2045 2.00%8.40% GOI Mat 28-Jul-2024 1.68%8.00% Oil Bond Mat 23-Mar-2026 1.13%Others 1.04%
Total 40.06%
Deposits, Money Mkt Securities and Net Current Assets. 7.71%
Grand Total 100.00%
Debt ParametersPortfolio Yield (%) 7.02%Avg Maturity (In Months) 121.60Modified Duration (In Years) 6.12
1.40%10.60%
53.11%
34.89%
0.00%10.00%20.00%30.00%40.00%50.00%60.00%70.00%80.00%90.00%
100.00%
0 - 1 Yr 1 - 3 Yrs 3 - 10 Yrs Above 10 Yrs
Debt Maturity Profile
Sovereign 43.41%AAA 54.24%
AA+ 2.35%
Debt Rating Profile

AUM (` in Lakhs)SFIN Code : ULIF00616/01/06EquityMgFd101 Equity Debt MMI & Others TotalInception Date : 17 Jan 2006 74,023.97 4,964.06 1,819.66 80,807.69NAV : 121.0028
Fund V/s Benchmark Performance Equity Fund Debt Fund Balanced FundPeriod Returns (%) Benchmark Returns (%)# Mr Shailesh Dhamankar 3 - 10Inception 11.88% 10.12% Mr Naveen Sharma - 15 165 Years 13.05% 10.89%3 Years 18.06% 13.06% Asset Category F&U Mandate2 Years 2.71% 1.77% Money Market Insts 0% to 5%1 Year 17.24% 15.09% Public Deposits 0% to 10%6 Months 1.53% 1.06% Govt. Securities1 Month 4.79% 4.49% Corporate Bonds
# 80% BSE- 100 20% CRISIL Composite Bond Fund Index Equity 60% to 100%Note: Returns over 1 year have been annualized. Net Current Assets -
Portfolio
Equity % to FundHDFC Bank Ltd 9.21%ITC Ltd. 5.76%Reliance Industries Ltd. 4.20%Infosys Ltd 4.17%ICICI Bank Ltd 4.11%Tata Motors Limited 2.88%Larsen & Toubro Limited. 2.61%Maruti Suzuki India Ltd 2.60%Kotak Mahindra MF - Kotak Banking ETF - Dividend Payout Option 2.33%Kotak Mahindra Bank Limited. 2.06%Others 51.67%
Total 91.61%
Equity Managed Fund - Life as on January 31, 2017Fund Objective : To achieve long term capital appreciation by investing pre-dominantly in equity and equity related securities and balancing it by shifting assets to the fixed income securities depending on the fund manager's views. The minimum allocation to equity will be 60%.
Fund ManagerNo. Of Funds Managed
% of Actual0.48%0.00%
0% to 40% 6.14%
91.61%1.77%
26.43%
24.97%
7.97%
7.80%
7.16%
5.76%
5.55%
4.30%
3.81%
3.43%
2.82%
Others
Financial Service Activities
Mfg of Motor Vehicles
Computer Programming
Mfg of Coke &Refined Petroleum
Mfg of Tobacco Products
Mfg of Pharmaceuticals
Government Securities
Mfg of Non-metallic mineral …
Other Financial Activities
Mfg of Chemical Products
Sector Allocation as per NIC 2008% to Fund
Total 91.61%
Debentures / Bonds % to FundLIC Housing Finance Ltd 0.68%Indiabulls Housing Finance Ltd 0.26%Tata Sons Ltd 0.14%Power Grid Corporation of India Ltd 0.14%UPL Ltd 0.13%State Bank Of Patiala 0.13%Housing Development Finance Corporation Ltd 0.13%Power Finance Corporation Ltd 0.10%National Thermal Power Corporation Ltd 0.08%Sundaram Finance Ltd 0.05%
Total 1.84%
Government Securities % to Fund7.61% GOI Mat 09-May-2030 1.60%9.20% GOI Mat 30-Sep-2030 0.86%8.13% Oil Bond Mat 16-Oct-2021 0.61%8.97% GOI Mat 05-Dec-2030 0.29%8.30% GOI Mat 31-Dec-2042 0.27%7.83% GOI Mat 11-Apr-2018 0.19%8.15% GOI Mat 11-Jun-2022 0.13%7.68% GOI Mat 15-Dec-2023 0.12%8.32% GOI Mat 02-Aug-2032 0.11%8.28% GOI Mat 15-Feb-2032 0.09%Others 0.02%
Total 4.30%
Deposits, Money Mkt Securities and Net Current Assets. 2.25%
Grand Total 100.00%
Debt ParametersPortfolio Yield (%) 6.81%Avg Maturity (In Months) 107.60Modified Duration (In Years) 5.54
10.31%15.99%
22.79%
50.91%
0.00%10.00%20.00%30.00%40.00%50.00%60.00%70.00%80.00%90.00%
100.00%
0 - 1 Yr 1 - 3 Yrs 3 - 10 Yrs Above 10 Yrs
Debt Maturity Profile
Sovereign 70.00%
AAA 26.97%
AA+ 2.96% AA & below 0.06%
Debt Rating Profile

AUM (` in Lakhs)
SFIN Code : ULIF01316/01/06EquityMgFd101 Equity Debt MMI & Others Total
Inception Date : 17 Jan 2006 32,940.96 2,231.84 117.00 35,289.80
NAV : 115.9487
Fund V/s Benchmark Performance Equity Fund Debt Fund Balanced Fund
Period Returns (%) Benchmark Returns (%)# Mr Shailesh Dhamankar 3 - 10
Inception 11.75% 10.12% Mr Naveen Sharma - 15 16
5 Years 13.26% 10.89%
3 Years 18.21% 13.06% Asset Category F&U Mandate
2 Years 2.89% 1.77% Money Market Insts 0% to 5%
1 Year 17.54% 15.09% Public Deposits 0% to 10%
6 Months 1.55% 1.06% Govt. Securities
1 Month 4.79% 4.49% Corporate Bonds
# 80% BSE- 100 20% CRISIL Composite Bond Fund Index Equity 60% to 100%
Note: Returns over 1 year have been annualized. Net Current Assets -
Portfolio
Equity % to Fund
HDFC Bank Ltd 9.15%
ITC Ltd. 5.75%
Reliance Industries Ltd. 4.30%
ICICI Bank Ltd 4.19%
Infosys Ltd 4.17%
Tata Motors Limited 2.87%
Maruti Suzuki India Ltd 2.72%
Larsen & Toubro Limited. 2.59%
Kotak Mahindra MF - Kotak Banking ETF - Dividend Payout Option 2.47%
IndusInd Bank Ltd. 2.05%
Others 53.09%
Total 93.34%
Debentures / Bonds % to Fund
Power Finance Corporation Ltd 0.75%
Power Grid Corporation of India Ltd 0.43%
LIC Housing Finance Ltd 0.42%
Housing Development Finance Corporation Ltd 0.14%
Sundaram Finance Ltd 0.11%
National Thermal Power Corporation Ltd 0.08%
UPL Ltd 0.03%
Steel Authority of India Ltd. 0.03%
Total 2.00%
Government Securities % to Fund
7.61% GOI Mat 09-May-2030 1.22%
8.97% GOI Mat 05-Dec-2030 0.99%
8.15% GOI Mat 24-Nov-2026 0.90%
9.20% GOI Mat 30-Sep-2030 0.57%
8.30% GOI Mat 31-Dec-2042 0.30%
8.32% GOI Mat 02-Aug-2032 0.13%
7.59% GOI Mat 20-Mar-2029 0.12%
8.13% Oil Bond Mat 16-Oct-2021 0.09%
8.13% GOI Mat 22-June-2045 0.02%
Total 4.33%
Deposits, Money Mkt Securities and Net Current Assets. 0.33%
Grand Total 100.00%
Debt Parameters
Portfolio Yield (%) 6.89%
Avg Maturity (In Months) 125.84
Modified Duration (In Years) 6.37
0.00%
0% to 40% 6.32%
93.34%
0.05%
Equity Managed Fund - Pension as on January 31, 2017
Fund Objective : To achieve long term capital appreciation by investing pre-dominantly in equity and equity related securities and balancing it by shifting assets to the fixed income securities depending on the fund
manager's views. The minimum allocation to equity will be 60%.
Fund ManagerNo. Of Funds Managed
% of Actual
0.28%
25.34%
25.02%
8.18%
7.82%
7.38%
5.79%
5.75%
4.33%
4.12%
3.50%
2.77%
Others
Financial Service Activities
Mfg of Motor Vehicles
Computer Programming
Mfg of Coke &Refined Petroleum
Mfg of Pharmaceuticals
Mfg of Tobacco Products
Government Securities
Mfg of Non-metallic mineral Products
Other Financial Activities
Mfg of Chemical Products
Sector Allocation as per NIC 2008% to Fund
8.20% 8.12%
26.58%
57.10%
0.00%
10.00%
20.00%
30.00%
40.00%
50.00%
60.00%
70.00%
80.00%
90.00%
100.00%
0 - 1 Yr 1 - 3 Yrs 3 - 10 Yrs Above 10 Yrs
Debt Maturity Profile
Sovereign
68.45%
AAA 28.74%
AA+ 2.28%AA & below
0.53%
Debt Rating Profile
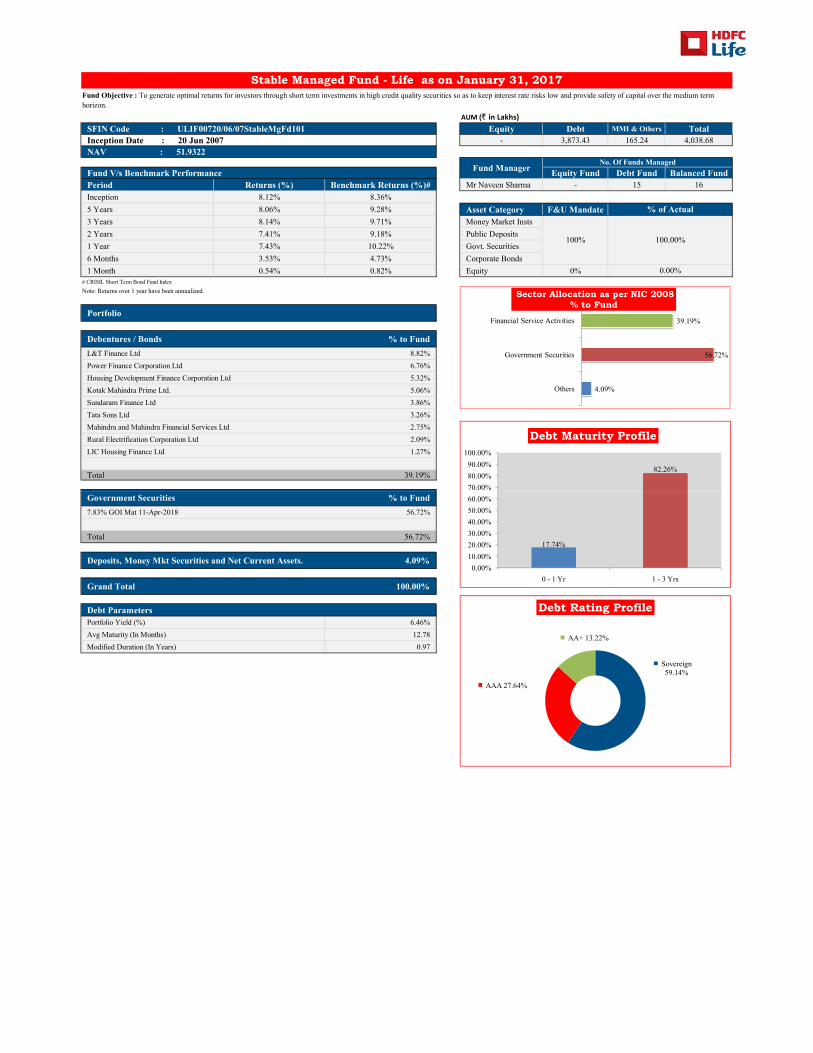
AUM (` in Lakhs)SFIN Code : ULIF00720/06/07StableMgFd101 Equity Debt MMI & Others TotalInception Date : 20 Jun 2007 - 3,873.43 165.24 4,038.68NAV : 51.9322
Fund V/s Benchmark Performance Equity Fund Debt Fund Balanced FundPeriod Returns (%) Benchmark Returns (%)# Mr Naveen Sharma - 15 16Inception 8.12% 8.36%5 Years 8.06% 9.28% Asset Category F&U Mandate3 Years 8.14% 9.71% Money Market Insts2 Years 7.41% 9.18% Public Deposits1 Year 7.43% 10.22% Govt. Securities6 Months 3.53% 4.73% Corporate Bonds1 Month 0.54% 0.82% Equity 0%
# CRISIL Short Term Bond Fund IndexNote: Returns over 1 year have been annualized.
Portfolio
Debentures / Bonds % to FundL&T Finance Ltd 8.82%Power Finance Corporation Ltd 6.76%Housing Development Finance Corporation Ltd 5.32%Kotak Mahindra Prime Ltd. 5.06%Sundaram Finance Ltd 3.86%Tata Sons Ltd 3.26%Mahindra and Mahindra Financial Services Ltd 2.75%Rural Electrification Corporation Ltd 2.09%LIC Housing Finance Ltd 1.27%
Total 39.19%
0.00%
Stable Managed Fund - Life as on January 31, 2017Fund Objective : To generate optimal returns for investors through short term investments in high credit quality securities so as to keep interest rate risks low and provide safety of capital over the medium term horizon.
Fund ManagerNo. Of Funds Managed
% of Actual
100% 100.00%
4.09%
56.72%
39.19%
Others
Government Securities
Financial Service Activities
Sector Allocation as per NIC 2008% to Fund
82.26%
70.00%80.00%90.00%
100.00%
Debt Maturity Profile
Government Securities % to Fund7.83% GOI Mat 11-Apr-2018 56.72%
Total 56.72%
Deposits, Money Mkt Securities and Net Current Assets. 4.09%
Grand Total 100.00%
Debt ParametersPortfolio Yield (%) 6.46%Avg Maturity (In Months) 12.78Modified Duration (In Years) 0.97
17.74%
0.00%10.00%20.00%30.00%40.00%50.00%60.00%
0 - 1 Yr 1 - 3 Yrs
Sovereign 59.14%
AAA 27.64%
AA+ 13.22%
Debt Rating Profile

AUM (` in Lakhs)SFIN Code : ULIF01420/06/07StableMgFd101 Equity Debt MMI & Others TotalInception Date : 20 Jun 2007 - 1,992.58 132.88 2,125.46NAV : 51.8473
Fund V/s Benchmark Performance Equity Fund Debt Fund Balanced FundPeriod Returns (%) Benchmark Returns (%)# Mr Naveen Sharma - 15 16Inception 8.10% 8.36%5 Years 8.01% 9.28% Asset Category F&U Mandate3 Years 8.05% 9.71% Money Market Insts2 Years 7.32% 9.18% Public Deposits1 Year 7.25% 10.22% Govt. Securities6 Months 3.41% 4.73% Corporate Bonds1 Month 0.54% 0.82% Equity 0%
# CRISIL Short Term Bond Fund IndexNote: Returns over 1 year have been annualized.
Portfolio
Debentures / Bonds % to FundLIC Housing Finance Ltd 7.22%Mahindra and Mahindra Financial Services Ltd 5.22%Sundaram Finance Ltd 2.71%L&T Finance Ltd 2.39%Rural Electrification Corporation Ltd 0.98%Tata Sons Ltd 0.95%
Total 19.48%
Government Securities % to Fund7.83% GOI Mat 11-Apr-2018 74.26%
0.00%
Stable Managed Fund - Pension as on January 31, 2017Fund Objective : To generate optimal returns for investors through short term investments in high credit quality securities so as to keep interest rate risks low and provide safety of capital over the medium term horizon.
Fund ManagerNo. Of Funds Managed
% of Actual
100% 100.00%
6.25%
74.26%
19.48%
Others
Government Securities
Financial Service Activities
Sector Allocation as per NIC 2008% to Fund
87.24%
80.00%90.00%
100.00%
Debt Maturity Profile
Total 74.26%
Deposits, Money Mkt Securities and Net Current Assets. 6.25%
Grand Total 100.00%
Debt ParametersPortfolio Yield (%) 6.35%Avg Maturity (In Months) 13.20Modified Duration (In Years) 1.01
12.76%
0.00%10.00%20.00%30.00%40.00%50.00%60.00%70.00%
0 - 1 Yr 1 - 3 Yrs
Sovereign 79.22%AAA 15.33%
AA+ 5.45%
Debt Rating Profile
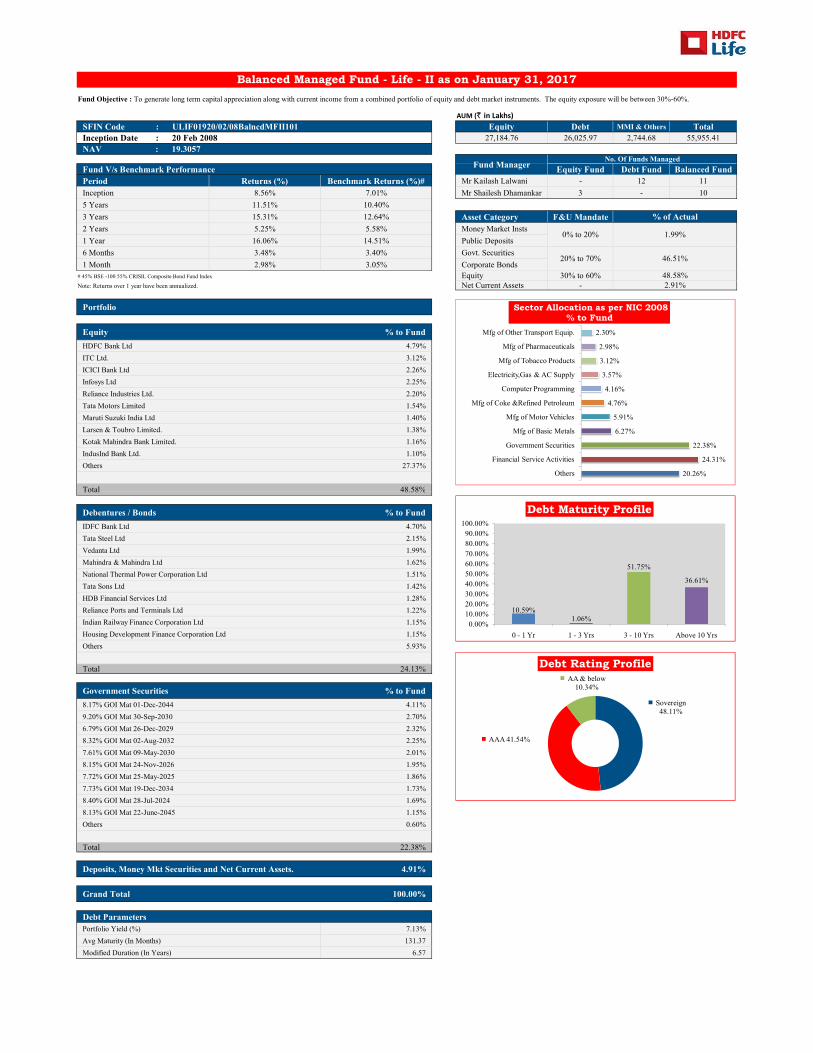
AUM (` in Lakhs)SFIN Code : ULIF01920/02/08BalncdMFII101 Equity Debt MMI & Others TotalInception Date : 20 Feb 2008 27,184.76 26,025.97 2,744.68 55,955.41NAV : 19.3057
Fund V/s Benchmark Performance Equity Fund Debt Fund Balanced FundPeriod Returns (%) Benchmark Returns (%)# Mr Kailash Lalwani - 12 11Inception 8.56% 7.01% Mr Shailesh Dhamankar 3 - 105 Years 11.51% 10.40%3 Years 15.31% 12.64% Asset Category F&U Mandate2 Years 5.25% 5.58% Money Market Insts1 Year 16.06% 14.51% Public Deposits6 Months 3.48% 3.40% Govt. Securities1 Month 2.98% 3.05% Corporate Bonds
# 45% BSE -100 55% CRISIL Composite Bond Fund Index Equity 30% to 60%Note: Returns over 1 year have been annualized. Net Current Assets -
Portfolio
Equity % to FundHDFC Bank Ltd 4.79%ITC Ltd. 3.12%ICICI Bank Ltd 2.26%Infosys Ltd 2.25%Reliance Industries Ltd. 2.20%Tata Motors Limited 1.54%Maruti Suzuki India Ltd 1.40%Larsen & Toubro Limited. 1.38%Kotak Mahindra Bank Limited. 1.16%IndusInd Bank Ltd. 1.10%Others 27.37%
Total 48.58%
0% to 20% 1.99%
20% to 70% 46.51%
48.58%2.91%
Balanced Managed Fund - Life - II as on January 31, 2017Fund Objective : To generate long term capital appreciation along with current income from a combined portfolio of equity and debt market instruments. The equity exposure will be between 30%-60%.
Fund ManagerNo. Of Funds Managed
% of Actual
20.26%
24.31%
22.38%
6.27%
5.91%
4.76%
4.16%
3.57%
3.12%
2.98%
2.30%
Others
Financial Service Activities
Government Securities
Mfg of Basic Metals
Mfg of Motor Vehicles
Mfg of Coke &Refined Petroleum
Computer Programming
Electricity,Gas & AC Supply
Mfg of Tobacco Products
Mfg of Pharmaceuticals
Mfg of Other Transport Equip.
Sector Allocation as per NIC 2008% to Fund
Total 48.58%
Debentures / Bonds % to FundIDFC Bank Ltd 4.70%Tata Steel Ltd 2.15%Vedanta Ltd 1.99%Mahindra & Mahindra Ltd 1.62%National Thermal Power Corporation Ltd 1.51%Tata Sons Ltd 1.42%HDB Financial Services Ltd 1.28%Reliance Ports and Terminals Ltd 1.22%Indian Railway Finance Corporation Ltd 1.15%Housing Development Finance Corporation Ltd 1.15%Others 5.93%
Total 24.13%
Government Securities % to Fund8.17% GOI Mat 01-Dec-2044 4.11%9.20% GOI Mat 30-Sep-2030 2.70%6.79% GOI Mat 26-Dec-2029 2.32%8.32% GOI Mat 02-Aug-2032 2.25%7.61% GOI Mat 09-May-2030 2.01%8.15% GOI Mat 24-Nov-2026 1.95%7.72% GOI Mat 25-May-2025 1.86%7.73% GOI Mat 19-Dec-2034 1.73%8.40% GOI Mat 28-Jul-2024 1.69%8.13% GOI Mat 22-June-2045 1.15%Others 0.60%
Total 22.38%
Deposits, Money Mkt Securities and Net Current Assets. 4.91%
Grand Total 100.00%
Debt ParametersPortfolio Yield (%) 7.13%Avg Maturity (In Months) 131.37Modified Duration (In Years) 6.57
10.59%1.06%
51.75%
36.61%
0.00%10.00%20.00%30.00%40.00%50.00%60.00%70.00%80.00%90.00%
100.00%
0 - 1 Yr 1 - 3 Yrs 3 - 10 Yrs Above 10 Yrs
Debt Maturity Profile
Sovereign 48.11%
AAA 41.54%
AA & below 10.34%
Debt Rating Profile

AUM (` in Lakhs)SFIN Code : ULIF01820/02/08DefnsvFdII101 Equity Debt MMI & Others TotalInception Date : 20 Feb 2008 2,990.87 7,544.70 566.06 11,101.62NAV : 21.2224
Fund V/s Benchmark Performance Equity Fund Debt Fund Balanced FundPeriod Returns (%) Benchmark Returns (%)# Mr Naveen Sharma - 15 16Inception 9.16% 7.60% Mr Farokh Pandole - - 135 Years 10.62% 10.09%3 Years 13.36% 12.36% Asset Category F&U Mandate2 Years 7.63% 8.03% Money Market Insts1 Year 15.29% 14.14% Public Deposits6 Months 4.70% 4.90% Govt. Securities1 Month 2.36% 2.13% Corporate Bonds
# 22.5% BSE -100 77.5% CRISIL Composite Bond Fund Index Equity 15% to 30%Note: Returns over 1 year have been annualized. Net Current Assets -
Portfolio
Equity % to FundHDFC Bank Ltd 2.57%ITC Ltd. 1.64%Reliance Industries Ltd. 1.27%Larsen & Toubro Limited. 1.12%Infosys Ltd 1.05%Maruti Suzuki India Ltd 1.03%Tata Consultancy Services Ltd. 1.00%Kotak Mahindra Bank Limited. 0.87%Tata Motors Limited 0.83%ICICI Bank Ltd 0.76%Others 14.81%
0% to 20% 4.74%
50% to 85% 67.96%
26.94%0.36%
Defensive Managed Fund - Life - II as on January 31, 2017Fund Objective : To enhance long term returns for a portfolio predominantly invested in fixed income securities by taking a moderate to medium exposure to equity and equity related securities. The equity exposure will be between 15%-30%.
Fund ManagerNo. Of Funds Managed
% of Actual
13.29%
34.07%
25.73%
5.36%
4.49%
4.33%
4.11%
3.26%
2.21%
1.64%
1.50%
Others
Government Securities
Financial Service Activities
Electricity,Gas & AC Supply
Mfg of Basic Metals
Mfg of Chemical Products
Mfg of Coke &Refined Petroleum
Mfg of Motor Vehicles
Computer Programming
Mfg of Tobacco Products
Warehousing
Sector Allocation as per NIC 2008% to Fund
Total 26.94%
Debentures / Bonds % to FundState Bank of India 3.07%East North Interconnection Co Ltd 3.02%Tata Capital Housing Finance Limited 2.94%Bajaj Finance Ltd 2.93%UPL Ltd 2.89%ICICI Securities Primary Dealership Ltd 1.99%Nuclear Power Corporation of India Ltd 1.94%IOT Utkal Energy Services Limited 1.89%Vedanta Ltd 1.82%Mahindra and Mahindra Financial Services Ltd 1.52%Others 9.87%
Total 33.89%
Government Securities % to Fund7.83% GOI Mat 11-Apr-2018 9.17%8.32% GOI Mat 02-Aug-2032 9.13%8.83% GOI Mat 12-Dec-2041 4.41%9.20% GOI Mat 30-Sep-2030 3.63%8.15% GOI Mat 24-Nov-2026 3.34%7.61% GOI Mat 09-May-2030 1.94%7.59% GOI Mat 20-Mar-2029 1.19%8.28% GOI Mat 21-Sep-2027 1.02%7.72% GOI Mat 25-May-2025 0.23%
Total 34.07%
Deposits, Money Mkt Securities and Net Current Assets. 5.10%
Grand Total 100.00%
Debt ParametersPortfolio Yield (%) 6.97%Avg Maturity (In Months) 100.71Modified Duration (In Years) 5.05
10.42%
21.97%31.06%
36.56%
0.00%10.00%20.00%30.00%40.00%50.00%60.00%70.00%80.00%90.00%
100.00%
0 - 1 Yr 1 - 3 Yrs 3 - 10 Yrs Above 10 Yrs
Debt Maturity Profile
Sovereign 50.13%
AAA 34.47%
AA+ 9.98%
AA & below 5.42%
Debt Rating Profile

AUM (` in Lakhs)SFIN Code : ULIF02020/02/08EquityMFII101 Equity Debt MMI & Others TotalInception Date : 20 Feb 2008 59,995.42 5,446.80 946.05 66,388.27NAV : 18.2562
Fund V/s Benchmark Performance Equity Fund Debt Fund Balanced FundPeriod Returns (%) Benchmark Returns (%)# Mr Shailesh Dhamankar 3 - 10Inception 8.61% 6.09% Mr Naveen Sharma - 15 165 Years 12.33% 10.89%3 Years 17.32% 13.06% Asset Category F&U Mandate2 Years 1.97% 1.77% Money Market Insts1 Year 16.25% 15.09% Public Deposits6 Months 1.07% 1.06% Govt. Securities1 Month 4.62% 4.49% Corporate Bonds
# 80% BSE- 100 20% CRISIL Composite Bond Fund Index Equity 60% to 100%Note: Returns over 1 year have been annualized. Net Current Assets -
Portfolio
Equity % to FundHDFC Bank Ltd 8.99%ITC Ltd. 5.53%ICICI Bank Ltd 4.08%Infosys Ltd 4.06%Reliance Industries Ltd. 4.05%Tata Motors Limited 2.78%Larsen & Toubro Limited. 2.58%Maruti Suzuki India Ltd 2.57%Kotak Mahindra MF - Kotak Banking ETF - Dividend Payout Option 2.24%IndusInd Bank Ltd. 1.99%Others 51.50%
0% to 15% 1.14%
0% to 40% 8.20%
90.37%0.29%
Equity Managed Fund - Life - II as on January 31, 2017Fund Objective : To achieve long term capital appreciation by investing pre-dominantly in equity and equity related securities and balancing it by shifting assets to the fixed income securities depending on the fund manager's views. The minimum allocation to equity will be 60%.
Fund ManagerNo. Of Funds Managed
% of Actual
25.40%
26.58%
9.79%
7.56%
7.00%
5.53%
5.42%
3.94%
3.50%
2.65%
2.63%
Others
Financial Service Activities
Mfg of Motor Vehicles
Computer Programming
Mfg of Coke &Refined Petroleum
Mfg of Tobacco Products
Mfg of Pharmaceuticals
Mfg of Non-metallic mineral …
Other Financial Activities
Mfg of Chemical Products
Mfg of Other Transport Equip.
Sector Allocation as per NIC 2008% to Fund
Total 90.37%
Debentures / Bonds % to FundMahindra Vehicle Manufacturers Ltd 1.95%LIC Housing Finance Ltd 1.24%Power Finance Corporation Ltd 1.05%Indiabulls Housing Finance Ltd 0.66%Housing Development Finance Corporation Ltd 0.47%Power Grid Corporation of India Ltd 0.24%IDFC Bank Ltd 0.14%National Thermal Power Corporation Ltd 0.07%L&T Shipbuilding Ltd 0.03%Steel Authority of India Ltd. 0.03%
Total 5.90%
Government Securities % to Fund7.61% GOI Mat 09-May-2030 0.97%8.13% Oil Bond Mat 16-Oct-2021 0.57%9.20% GOI Mat 30-Sep-2030 0.37%8.30% GOI Mat 31-Dec-2042 0.26%8.32% GOI Mat 02-Aug-2032 0.07%7.16% GOI Mat 20-May-2023 0.04%8.12% GOI Mat 10-Dec-2020 0.02%
Total 2.30%
Deposits, Money Mkt Securities and Net Current Assets. 1.43%
Grand Total 100.00%
Debt ParametersPortfolio Yield (%) 6.88%Avg Maturity (In Months) 73.81Modified Duration (In Years) 4.05
12.21% 15.70%
51.65%
20.45%
0.00%10.00%20.00%30.00%40.00%50.00%60.00%70.00%80.00%90.00%
100.00%
0 - 1 Yr 1 - 3 Yrs 3 - 10 Yrs Above 10 Yrs
Debt Maturity Profile
Sovereign 28.03%
AAA 71.54%
AA & below 0.43%
Debt Rating Profile

AUM (` in Lakhs)SFIN Code : ULIF02120/02/08GrwthFndII101 Equity Debt MMI & Others TotalInception Date : 20 Feb 2008 296,156.01 - 17,450.28 313,606.28NAV : 15.8162
Fund V/s Benchmark Performance Equity Fund Debt Fund Balanced FundPeriod Returns (%) Benchmark Returns (%)# Mr Priyank Singhal 8 - - Inception 7.07% 5.57%5 Years 12.89% 11.16% Asset Category F&U Mandate3 Years 18.02% 13.31% Money Market Insts2 Years 1.97% -0.40% Public Deposits1 Year 15.39% 15.42% Govt. Securities6 Months 0.75% -0.27% Corporate Bonds1 Month 4.94% 5.31% Equity 90% to 100%
# BSE-100 Net Current Assets -Note: Returns over 1 year have been annualized.
Portfolio
Equity % to FundHDFC Bank Ltd 9.24%ITC Ltd. 6.02%Infosys Ltd 4.78%Reliance Industries Ltd. 4.14%ICICI Bank Ltd 3.79%Maruti Suzuki India Ltd 3.51%Larsen & Toubro Limited. 3.36%Tata Motors Limited 2.96%Mahindra & Mahindra Ltd. 2.76%SBI-ETF Nifty Bank 2.65%Others 51.22%
0% to 10% 5.47%
0% 0.00%
94.44%0.09%
Growth Fund - Life - II as on January 31, 2017Fund Objective : To generate long term capital appreciation from a diversified portfolio of equity and equity related securities.
Fund ManagerNo. Of Funds Managed
% of Actual
23.98%
23.89%
10.57%
8.43%
7.42%
6.02%
5.61%
4.05%
3.53%
3.36%
3.13%
Others
Financial Service Activities
Mfg of Motor Vehicles
Computer Programming
Mfg of Coke &Refined Petroleum
Mfg of Tobacco Products
Mfg of Pharmaceuticals
Mfg of Non-metallic mineral …
Other Financial Activities
Civil Engineering
Mfg of Electrical Equipment
Sector Allocation as per NIC 2008% to Fund
Total 94.44%
Deposits, Money Mkt Securities and Net Current Assets. 5.56%
Grand Total 100.00%
100.00%
80.00%
90.00%
100.00%
0 - 1 Yr
Debt Maturity Profile

AUM (` in Lakhs)SFIN Code : ULIF01520/02/08LiquidFdII101 Equity Debt MMI & Others TotalInception Date : 20 Feb 2008 - - 5,757.08 5,757.08NAV : 19.725
Fund V/s Benchmark Performance Equity Fund Debt Fund Balanced FundPeriod Returns (%) Benchmark Returns (%)# Mr Kailash Lalwani - 12 11Inception 7.78% 7.68%5 Years 7.51% 8.45% Asset Category F&U Mandate3 Years 7.12% 8.25% Money Market Insts2 Years 6.66% 7.77% Public Deposits1 Year 6.33% 7.52% Govt. Securities6 Months 3.05% 3.39% Corporate Bonds1 Month 0.44% 0.52% Equity 0%
# CRISIL Liquid Fund IndexNote: Returns over 1 year have been annualized.
Portfolio
Deposits, Money Mkt Securities and Net Current Assets. 100.00%
Grand Total 100.00%
Debt ParametersPortfolio Yield (%) 6.56%Avg Maturity (In Months) 2.56Modified Duration (In Years) 0.21
0% 0.00%
0.00%
Liquid Fund - Life - II as on January 31, 2017Fund Objective : To deliver returns linked to Money Market levels with minimal interest rate risk and minimal credit risk so as to provide a high level of safety of capital.
Fund ManagerNo. Of Funds Managed
% of Actual
100% 100.00%
0.89%
74.63%
24.47%
Others
Government Securities
Financial Service Activities
Sector Allocation as per NIC 2008% to Fund
100.00%100.00%
Debt Maturity Profile
80.00%
90.00%
0 - 1 Yr
Sovereign 75.31%AAA 24.69%
Debt Rating Profile

AUM (` in Lakhs)SFIN Code : ULIF01720/02/08SecureMFII101 Equity Debt MMI & Others TotalInception Date : 20 Feb 2008 - 20,115.43 1,858.08 21,973.51NAV : 21.5653
Fund V/s Benchmark Performance Equity Fund Debt Fund Balanced FundPeriod Returns (%) Benchmark Returns (%)# Mr Badrish Kulhalli - 13 4Inception 8.91% 8.19%5 Years 9.91% 9.78% Asset Category F&U Mandate3 Years 11.91% 12.09% Money Market Insts2 Years 9.63% 10.48% Public Deposits1 Year 15.16% 13.77% Govt. Securities6 Months 6.28% 6.41% Corporate Bonds1 Month 1.05% 1.20% Equity 0%
# CRISIL Composite Bond Fund Index Net Current Assets -Note: Returns over 1 year have been annualized.
Portfolio
Debentures / Bonds % to FundNational Thermal Power Corporation Ltd 9.18%Mahindra and Mahindra Financial Services Ltd 7.95%Power Grid Corporation of India Ltd 5.53%Housing Development Finance Corporation Ltd 3.90%Larsen & Toubro Ltd 3.38%Mahindra & Mahindra Ltd 2.88%IDFC Bank Ltd 2.84%Bajaj Finance Ltd 2.82%Tata Sons Ltd 2.60%Indian Railway Finance Corporation Ltd 2.11%Others 9.08%
0% to 25% 0.34%
75% to 100% 91.54%
0.00%8.11%
Secured Managed Fund - Life - II as on January 31, 2017Fund Objective : To provide reasonable returns through investments in high credit quality debt instruments while maintaining an optimal level of interest rate risk.
Fund ManagerNo. Of Funds Managed
% of Actual
8.46%
39.28%
26.32%
15.69%
3.38%
2.88%
1.55%
1.43%
1.02%
Others
Government Securities
Financial Service Activities
Electricity,Gas & AC Supply
Civil Engineering
Mfg of Motor Vehicles
Mfg of Coke &Refined Petroleum
Warehousing
Mfg of Chemical Products
Sector Allocation as per NIC 2008% to Fund
Total 52.26%
Government Securities % to Fund9.20% GOI Mat 30-Sep-2030 5.66%7.72% GOI Mat 25-May-2025 5.59%8.17% GOI Mat 01-Dec-2044 5.48%6.79% GOI Mat 26-Dec-2029 5.47%7.61% GOI Mat 09-May-2030 4.52%8.40% GOI Mat 28-Jul-2024 3.17%7.73% GOI Mat 19-Dec-2034 2.90%8.15% GOI Mat 24-Nov-2026 2.88%8.13% GOI Mat 22-June-2045 1.38%8.32% GOI Mat 02-Aug-2032 1.13%Others 1.11%
Total 39.28%
Deposits, Money Mkt Securities and Net Current Assets. 8.46%
Grand Total 100.00%
Debt ParametersPortfolio Yield (%) 7.03%Avg Maturity (In Months) 119.59Modified Duration (In Years) 6.13
2.99%9.28%
53.53%
34.20%
0.00%10.00%20.00%30.00%40.00%50.00%60.00%70.00%80.00%90.00%
100.00%
0 - 1 Yr 1 - 3 Yrs 3 - 10 Yrs Above 10 Yrs
Debt Maturity Profile
Sovereign 42.91%
AAA 54.60%
AA+ 2.50%
Debt Rating Profile

AUM (` in Lakhs)SFIN Code : ULIF01620/02/08StableMFII101 Equity Debt MMI & Others TotalInception Date : 20 Feb 2008 - 4,953.60 236.17 5,189.76NAV : 19.2289
Fund V/s Benchmark Performance Equity Fund Debt Fund Balanced FundPeriod Returns (%) Benchmark Returns (%)# Mr Naveen Sharma - 15 16Inception 7.53% 8.38%5 Years 7.66% 9.28% Asset Category F&U Mandate3 Years 7.58% 9.71% Money Market Insts2 Years 6.70% 9.18% Public Deposits1 Year 6.55% 10.22% Govt. Securities6 Months 3.11% 4.73% Corporate Bonds1 Month 0.54% 0.82% Equity 0%
# CRISIL Short Term Bond Fund IndexNote: Returns over 1 year have been annualized.
Portfolio
Debentures / Bonds % to FundPower Finance Corporation Ltd 9.89%Rural Electrification Corporation Ltd 8.91%National Bank for Agriculture & Rural Development 7.99%Indian Railway Finance Corporation Ltd 7.98%Housing Development Finance Corporation Ltd 7.62%Tata Sons Ltd 7.39%LIC Housing Finance Ltd 6.93%Mahindra and Mahindra Financial Services Ltd 5.83%Sundaram Finance Ltd 5.22%L&T Finance Ltd 2.92%
0.00%
Stable Managed Fund - Life - II as on January 31, 2017Fund Objective : To generate optimal returns for investors through short term investments in high credit quality securities so as to keep interest rate risks low and provide safety of capital over the medium term horizon.
Fund ManagerNo. Of Funds Managed
% of Actual
100% 100.00%
4.55%
70.66%
24.79%
Others
Financial Service Activities
Government Securities
Sector Allocation as per NIC 2008% to Fund
80 00%90.00%
100.00%
Debt Maturity Profile
Total 70.66%
Government Securities % to Fund7.83% GOI Mat 11-Apr-2018 11.37%7.46% GOI Mat 28-Aug-2017 8.05%6.25% GOI Mat 02-Jan-2018 3.86%8.07% GOI Mat 03-Jul-2017 1.51%
Total 24.79%
Deposits, Money Mkt Securities and Net Current Assets. 4.55%
Grand Total 100.00%
Debt ParametersPortfolio Yield (%) 6.58%Avg Maturity (In Months) 9.70Modified Duration (In Years) 0.86
59.00%
41.00%
0.00%10.00%20.00%30.00%40.00%50.00%60.00%70.00%80.00%
0 - 1 Yr 1 - 3 Yrs
Sovereign 25.97%
AAA 65.51%
AA+ 8.52%
Debt Rating Profile

AUM (` in Lakhs)
SFIN Code : ULIF03004/08/08BondOprtFd101 Equity Debt MMI & Others Total
Inception Date : 04 Aug 2008 - 3,168.07 462.82 3,630.88
NAV : 18.9386
Fund V/s Benchmark Performance Equity Fund Debt Fund Balanced Fund
Period Returns (%) Benchmark Returns (%)# Mr Naveen Sharma - 15 16
Inception 7.84% 8.79%
5 Years 8.16% 9.78% Asset Category F&U Mandate
3 Years 10.41% 12.09% Money Market Insts 0% to 5%
2 Years 8.43% 10.48% Public Deposits 0% to 15%
1 Year 14.33% 13.77% Govt. Securities 50% to 60%
6 Months 4.91% 6.41% Corporate Bonds 20% to 30%
1 Month 0.70% 1.20% Equity 0%
# CRISIL Composite Bond Fund Index Net Current Assets -
Note: Returns over 1 year have been annualized.
Portfolio
Debentures / Bonds % to Fund
Tata Sons Ltd 7.64%
Steel Authority of India Ltd. 6.55%
Mahindra Vehicle Manufacturers Ltd 5.72%
State Bank Of Patiala 2.92%
Reliance Ports and Terminals Ltd 2.59%
Power Grid Corporation of India Ltd 1.86%
Tata Steel Ltd 1.38%
Mahindra and Mahindra Financial Services Ltd 1.04%
Total 29.70%
Government Securities % to Fund
8.83% GOI Mat 12-Dec-2041 30.20%
8.30% GOI Mat 31-Dec-2042 10.81%
7.61% GOI Mat 09-May-2030 5.93%
9.23% GOI Mat 23-Dec-2043 4.75%
7.16% GOI Mat 20-May-2023 1.70%
8.20% GOI Mat 15-Feb-2022 1.47%
7.68% GOI Mat 15-Dec-2023 1.17%
6.25% GOI Mat 02-Jan-2018 0.96%
7.83% GOI Mat 11-Apr-2018 0.56%
Total 57.55%
Deposits, Money Mkt Securities and Net Current Assets. 12.75%
Grand Total 100.00%
Debt Parameters
Portfolio Yield (%) 7.11%
Avg Maturity (In Months) 170.77
Modified Duration (In Years) 6.91
8.26%
57.55%
29.70%
0.00%
2.07%
Bond Opportunities Fund as on January 31, 2017
Fund Objective : To provide reasonable returns through investments in high credit quality debt instruments while maintaining an optimal level of interest rate risk.
Fund ManagerNo. Of Funds Managed
% of Actual
2.42%
4.48%
57.55%
19.86%
7.93%
5.72%
2.59%
1.86%
Others
Government Securities
Financial Service Activities
Mfg of Basic Metals
Mfg of Motor Vehicles
Warehousing
Electricity,Gas & AC Supply
Sector Allocation as per NIC 2008% to Fund
11.89%16.08%
19.24%
52.79%
0.00%
10.00%
20.00%
30.00%
40.00%
50.00%
60.00%
70.00%
80.00%
90.00%
100.00%
0 - 1 Yr 1 - 3 Yrs 3 - 10 Yrs Above 10 Yrs
Debt Maturity Profile
Sovereign
65.96%AAA 24.95%
AA & below
9.09%
Debt Rating Profile

AUM (` in Lakhs)SFIN Code : ULIF03204/08/08Large-CapF101 Equity Debt MMI & Others TotalInception Date : 04 Aug 2008 5,830.59 - 247.04 6,077.63NAV : 21.2592
Fund V/s Benchmark Performance Equity Fund Debt Fund Balanced FundPeriod Returns (%) Benchmark Returns (%)# Mr Shailesh Dhamankar 3 - 10Inception 8.98% 8.16%5 Years 10.52% 10.49% Asset Category F&U Mandate3 Years 13.11% 12.03% Money Market Insts 0% to 5%2 Years -0.87% -1.42% Public Deposits 0%1 Year 15.83% 13.19% Govt. Securities 0%6 Months 0.30% -0.89% Corporate Bonds 0%1 Month 4.42% 4.59% Equity 95% to 100%
# Nifty 50 Net Current Assets -Note: Returns over 1 year have been annualized.
Portfolio
Equity % to FundHDFC Bank Ltd 9.11%ITC Ltd. 7.17%Reliance Industries Ltd. 5.76%Infosys Ltd 5.27%ICICI Bank Ltd 4.47%Tata Motors Limited 4.12%Maruti Suzuki India Ltd 3.59%Larsen & Toubro Limited. 3.38%Kotak Mahindra Bank Limited. 3.14%Tata Consultancy Services Ltd. 2.65%Others 47.26%
Large Cap Fund as on January 31, 2017Fund Objective : To generate long term capital appreciation from a diversified portfolio of pre-dominantly in large cap equity and equity related securities.
Fund ManagerNo. Of Funds Managed
% of Actual2.88%0.00%0.00%0.00%
95.94%1.19%
18.13%
23.35%
11.38%
10.55%
8.48%
7.17%
6.47%
4.48%
3.48%
3.38%
3.13%
Others
Financial Service Activities
Mfg of Motor Vehicles
Computer Programming
Mfg of Coke &Refined Petroleum
Mfg of Tobacco Products
Mfg of Pharmaceuticals
Mfg of Chemical Products
Mfg of Other Transport Equip.
Civil Engineering
Mfg of Basic Metals
Sector Allocation as per NIC 2008% to Fund
Total 95.94%
Deposits, Money Mkt Securities and Net Current Assets. 4.06%
Grand Total 100.00%
100.00%
80.00%
90.00%
100.00%
0 - 1 Yr
Debt Maturity Profile

AUM (` in Lakhs)SFIN Code : ULIF03304/08/08ManagerFnd101 Equity Debt MMI & Others TotalInception Date : 04 Aug 2008 29,945.11 16,640.49 2,463.72 49,049.33NAV : 24.452
Fund V/s Benchmark Performance Equity Fund Debt Fund Balanced FundPeriod Returns (%) Benchmark Returns (%)# Mr Shailesh Dhamankar 3 - 10Inception 10.91% N/A Mr Naveen Sharma - 15 165 Years 11.25% N/A3 Years 16.61% N/A Asset Category F&U Mandate2 Years 5.78% N/A Money Market Insts1 Year 18.57% N/A Public Deposits6 Months 3.14% N/A Govt. Securities1 Month 3.52% N/A Corporate Bonds
# NA Equity 10% to 45%Note: Returns over 1 year have been annualized. Net Current Assets -
Portfolio
Equity % to FundHDFC Bank Ltd 3.22%ITC Ltd. 2.58%Reliance Industries Ltd. 2.06%Infosys Ltd 1.92%Hindustan Petroleum Corporation Ltd. 1.88%ICICI Bank Ltd 1.61%Tata Motors Limited 1.49%UPL Limited 1.37%Maruti Suzuki India Ltd 1.29%Shriram Transport Finance Company Ltd 1.24%Others 42.40%
0% to 25% 3.92%
5% to 65% 33.93%
61.05%1.11%
Manager's Fund as on January 31, 2017Fund Objective : The Manager's Fund dynamically manages the asset allocation between equity and fixed income instruments to deliver higher returns through the equity exposure, combined with the stability of the fixed income exposure. The fund returns are likely to be volatile due to the market movements.
Fund ManagerNo. Of Funds Managed
% of Actual
21.75%
27.23%
15.27%
5.80%
5.51%
5.49%
5.47%
4.33%
3.35%
3.22%
2.58%
Others
Financial Service Activities
Government Securities
Mfg of Chemical Products
Mfg of Pharmaceuticals
Mfg of Motor Vehicles
Mfg of Coke &Refined Petroleum
Computer Programming
Electricity,Gas & AC Supply
Mfg of Basic Metals
Mfg of Tobacco Products
Sector Allocation as per NIC 2008% to Fund
Total 61.05%
Debentures / Bonds % to FundTata Sons Ltd 3.81%LIC Housing Finance Ltd 2.65%Housing Development Finance Corporation Ltd 2.17%Axis Bank Ltd 1.34%Reliance Ports and Terminals Ltd 1.28%Yes Bank Ltd 1.05%Mahindra & Mahindra Ltd 0.83%Bajaj Finance Ltd 0.83%Tata Steel Ltd 0.82%East North Interconnection Co Ltd 0.80%Others 3.10%
Total 18.66%
Government Securities % to Fund7.59% GOI Mat 20-Mar-2029 6.24%8.28% GOI Mat 15-Feb-2032 3.87%8.32% GOI Mat 02-Aug-2032 3.24%8.30% GOI Mat 31-Dec-2042 0.87%7.68% GOI Mat 15-Dec-2023 0.56%7.61% GOI Mat 09-May-2030 0.44%8.83% GOI Mat 12-Dec-2041 0.02%8.97% GOI Mat 05-Dec-2030 0.01%8.30% GOI Mat 02-Jul-2040 0.01%
Total 15.27%
Deposits, Money Mkt Securities and Net Current Assets. 5.02%
Grand Total 100.00%
Debt ParametersPortfolio Yield (%) 6.99%Avg Maturity (In Months) 103.75Modified Duration (In Years) 5.67
17.22% 12.82%
31.11%38.85%
0.00%10.00%20.00%30.00%40.00%50.00%60.00%70.00%80.00%90.00%
100.00%
0 - 1 Yr 1 - 3 Yrs 3 - 10 Yrs Above 10 Yrs
Debt Maturity Profile
Sovereign 45.00%
AAA 46.75%
AA+ 3.85% AA & below 4.40%
Debt Rating Profile

AUM (` in Lakhs)SFIN Code : ULIF03104/08/08Mid-capFnd101 Equity Debt MMI & Others TotalInception Date : 04 Aug 2008 6,693.75 - 112.11 6,805.86NAV : 38.118
Fund V/s Benchmark Performance Equity Fund Debt Fund Balanced FundPeriod Returns (%) Benchmark Returns (%)# Mr Nishit Dholakia 3 - 8Inception 16.70% 9.95% Mr Vishwas Katela 1 - 85 Years 18.00% 16.97%3 Years 29.75% 26.79% Asset Category F&U Mandate2 Years 10.08% 9.42% Money Market Insts 0% to 5%1 Year 24.20% 23.42% Public Deposits 0%6 Months 2.07% 1.55% Govt. Securities 0%1 Month 5.83% 6.87% Corporate Bonds 0%
# BSE Mid Cap Index Equity 95% to 100%Note: Returns over 1 year have been annualized. Net Current Assets -
Portfolio
Equity % to FundHindustan Petroleum Corporation Ltd. 6.76%Bajaj Finserv Ltd 6.44%UPL Limited 4.79%LIC Housing Finance Limited 4.13%Shriram Transport Finance Company Ltd 3.72%Petronet LNG Ltd 3.16%Glenmark Pharmaceuticals Ltd 2.93%MRF Ltd. 2.66%Cummins India Ltd. 2.63%Mahindra & Mahindra Finacial Services Limited 2.58%Others 58.56%
Mid Cap Fund as on January 31, 2017Fund Objective : To generate long term capital appreciation from a diversified portfolio of pre-dominantly in mid cap equity and equity related securities.
Fund ManagerNo. Of Funds Managed
% of Actual1.85%0.00%0.00%0.00%98.35%-0.20%
22.76%
13.33%
11.46%
8.88%
6.56%
4.17%
3.32%
2.92%
2.66%
2.63%
Financial Service Activities
Mfg of Chemical Products
Mfg of Pharmaceuticals
Mfg of Coke &Refined Petroleum
Mfg of Electrical Equipment
Electricity,Gas & AC Supply
Mfg of Food Products
Mfg of Fabricated Metal Products
Mfg of Rubber & Plastics Products
Mfg of Machinery & Equipment
Sector Allocation as per NIC 2008% to Fund
Total 98.35%
Deposits, Money Mkt Securities and Net Current Assets. 1.65%
Grand Total 100.00%
21.33%Others
100.00%
80.00%
90.00%
100.00%
0 - 1 Yr
Debt Maturity Profile

AUM (` in Lakhs)SFIN Code : ULIF02904/08/08MoneyPlusF101 Equity Debt MMI & Others TotalInception Date : 04 Aug 2008 - 1,648.47 103.20 1,751.67NAV : 16.8386
Fund V/s Benchmark Performance Equity Fund Debt Fund Balanced FundPeriod Returns (%) Benchmark Returns (%)# Mr Kailash Lalwani - 12 11Inception 6.32% 7.66%5 Years 6.28% 8.45% Asset Category F&U Mandate3 Years 6.68% 8.25% Money Market Insts 0% to 30%2 Years 6.17% 7.77% Public Deposits 0% to 20%1 Year 6.03% 7.52% Govt. Securities 40% to 100%6 Months 2.97% 3.39% Corporate Bonds 0% to 10%1 Month 0.43% 0.52% Equity 0%
# CRISIL Liquid Fund Index Net Current Assets -Note: Returns over 1 year have been annualized.
Portfolio
Government Securities % to Fund7.83% GOI Mat 11-Apr-2018 94.11%
Total 94.11%
Deposits, Money Mkt Securities and Net Current Assets. 5.89%
Grand Total 100.00%
Debt ParametersPortfolio Yield (%) 6.25%Avg Maturity (In Months) 13.77
Money Plus Fund as on January 31, 2017Fund Objective : To generate optimal returns from investments biased to the highest credit quality at the short end of the yield curve, such that interest rate risks and credit risks are low.
Fund ManagerNo. Of Funds Managed
% of Actual3.63%0.00%94.11%0.00%0.00%2.27%
5.89%
94.11%
Others
Government Securities
Sector Allocation as per NIC 2008% to Fund
96.29%
70.00%80.00%90.00%
100.00%
Debt Maturity Profile
Modified Duration (In Years) 1.06
3.71%0.00%
10.00%20.00%30.00%40.00%50.00%60.00%70.00%
0 - 1 Yr 1 - 3 Yrs
Sovereign 100.00%
Debt Rating Profile

AUM (` in Lakhs)SFIN Code : ULIF02608/10/08BalncdMFII101 Equity Debt MMI & Others TotalInception Date : 08 Oct 2008 18,439.11 16,025.66 1,083.44 35,548.21NAV : 26.3735
Fund V/s Benchmark Performance Equity Fund Debt Fund Balanced FundPeriod Returns (%) Benchmark Returns (%)# Mr Kailash Lalwani - 12 11Inception 12.91% 10.34% Mr Farokh Pandole - - 135 Years 11.85% 10.40%3 Years 16.09% 12.64% Asset Category F&U Mandate2 Years 6.18% 5.58% Money Market Insts1 Year 16.37% 14.51% Public Deposits6 Months 3.56% 3.40% Govt. Securities1 Month 3.51% 3.05% Corporate Bonds
# 45% BSE -100 55% CRISIL Composite Bond Fund Index Equity 30% to 60%Note: Returns over 1 year have been annualized. Net Current Assets -
Portfolio
Equity % to FundHDFC Bank Ltd 4.98%ITC Ltd. 3.18%Reliance Industries Ltd. 2.41%Larsen & Toubro Limited. 2.12%Infosys Ltd 2.01%Tata Consultancy Services Ltd. 1.92%Maruti Suzuki India Ltd 1.89%Tata Motors Limited 1.64%Kotak Mahindra Bank Limited. 1.63%ICICI Bank Ltd 1.46%Others 28.63%
Total 51.87%
0% to 20% 0.14%
20% to 70% 45.08%
51.87%2.90%
Balanced Managed Fund - Pension - II as on January 31, 2017Fund Objective : To generate long term capital appreciation along with current income from a combined portfolio of equity and debt market instruments. The equity exposure will be between 30%-60%.
Fund ManagerNo. Of Funds Managed
% of Actual
18.92%
23.27%
23.11%
6.97%
6.47%
5.21%
4.24%
3.48%
3.18%
2.60%
2.55%
Others
Government Securities
Financial Service Activities
Mfg of Basic Metals
Mfg of Motor Vehicles
Mfg of Coke &Refined Petroleum
Computer Programming
Electricity,Gas & AC Supply
Mfg of Tobacco Products
Civil Engineering
Mfg of Non-metallic mineral …
Sector Allocation as per NIC 2008% to Fund
Total 51.87%
Debentures / Bonds % to FundIDFC Bank Ltd 4.18%Vedanta Ltd 2.76%Tata Steel Ltd 1.78%National Thermal Power Corporation Ltd 1.54%Bajaj Finance Ltd 1.35%Reliance Ports and Terminals Ltd 1.21%Mahindra & Mahindra Ltd 1.01%HDB Financial Services Ltd 0.93%IOT Utkal Energy Services Limited 0.93%L&T Shipbuilding Ltd 0.91%Others 5.21%
Total 21.81%
Government Securities % to Fund8.17% GOI Mat 01-Dec-2044 4.77%9.20% GOI Mat 30-Sep-2030 2.91%8.40% GOI Mat 28-Jul-2024 2.71%6.79% GOI Mat 26-Dec-2029 2.31%8.32% GOI Mat 02-Aug-2032 2.29%8.15% GOI Mat 24-Nov-2026 1.96%7.72% GOI Mat 25-May-2025 1.86%7.73% GOI Mat 19-Dec-2034 1.73%7.61% GOI Mat 09-May-2030 1.15%8.13% GOI Mat 22-June-2045 0.97%Others 0.59%
Total 23.27%
Deposits, Money Mkt Securities and Net Current Assets. 3.05%
Grand Total 100.00%
Debt ParametersPortfolio Yield (%) 7.16%Avg Maturity (In Months) 140.54Modified Duration (In Years) 6.81
6.56%0.62%
53.87%
38.95%
0.00%10.00%20.00%30.00%40.00%50.00%60.00%70.00%80.00%90.00%
100.00%
0 - 1 Yr 1 - 3 Yrs 3 - 10 Yrs Above 10 Yrs
Debt Maturity Profile
Sovereign 51.62%
AAA 36.70%
AA & below 11.67%
Debt Rating Profile

AUM (` in Lakhs)SFIN Code : ULIF02508/10/08DefnsvFdII101 Equity Debt MMI & Others TotalInception Date : 08 Oct 2008 2,117.96 5,389.44 244.13 7,751.53NAV : 23.2173
Fund V/s Benchmark Performance Equity Fund Debt Fund Balanced FundPeriod Returns (%) Benchmark Returns (%)# Mr Naveen Sharma - 15 16Inception 10.82% 9.59% Mr Farokh Pandole - - 135 Years 10.70% 10.09%3 Years 13.37% 12.36% Asset Category F&U Mandate2 Years 7.64% 8.03% Money Market Insts1 Year 15.68% 14.14% Public Deposits6 Months 4.90% 4.90% Govt. Securities1 Month 2.47% 2.13% Corporate Bonds
# 22.5% BSE -100 77.5% CRISIL Composite Bond Fund Index Equity 15% to 30%Note: Returns over 1 year have been annualized. Net Current Assets -
Portfolio
Equity % to FundHDFC Bank Ltd 2.57%ITC Ltd. 1.62%Reliance Industries Ltd. 1.29%Larsen & Toubro Limited. 1.13%Maruti Suzuki India Ltd 1.13%Infosys Ltd 1.05%Tata Consultancy Services Ltd. 1.01%Kotak Mahindra Bank Limited. 0.88%Tata Motors Limited 0.84%ICICI Bank Ltd 0.78%Others 15.03%
0% to 20% 1.47%
50% to 85% 69.53%
27.32%1.68%
Defensive Managed Fund - Pension - II as on January 31, 2017Fund Objective : To enhance long term returns for a portfolio predominantly invested in fixed income securities by taking a moderate to medium exposure to equity and equity related securities. The equity exposure will be between 15%-30%.
Fund ManagerNo. Of Funds Managed
% of Actual
30.95%
27.38%
9.31%
5.28%
4.03%
3.59%
2.69%
2.22%
1.62%
1.56%
Government Securities
Financial Service Activities
Electricity,Gas & AC Supply
Mfg of Basic Metals
Mfg of Coke &Refined Petroleum
Mfg of Motor Vehicles
Warehousing
Computer Programming
Mfg of Tobacco Products
Mfg of Chemical Products
Sector Allocation as per NIC 2008% to Fund
Total 27.32%
Debentures / Bonds % to FundNuclear Power Corporation of India Ltd 7.46%Capital First Ltd. 6.83%State Bank of India 3.69%Reliance Ports and Terminals Ltd 2.69%Rural Electrification Corporation Ltd 2.63%Vedanta Ltd 2.22%IOT Utkal Energy Services Limited 1.60%Bajaj Finance Ltd 1.53%Mahindra and Mahindra Financial Services Ltd 1.50%East North Interconnection Co Ltd 1.45%Others 6.97%
Total 38.57%
Government Securities % to Fund8.32% GOI Mat 02-Aug-2032 10.08%7.61% GOI Mat 09-May-2030 6.95%8.83% GOI Mat 12-Dec-2041 4.67%9.20% GOI Mat 30-Sep-2030 3.91%7.83% GOI Mat 11-Apr-2018 2.49%7.68% GOI Mat 15-Dec-2023 2.05%9.23% GOI Mat 23-Dec-2043 0.80%
Total 30.95%
Deposits, Money Mkt Securities and Net Current Assets. 3.15%
Grand Total 100.00%
Debt ParametersPortfolio Yield (%) 7.13%Avg Maturity (In Months) 124.55Modified Duration (In Years) 6.26
11.36%Others
6.13% 6.77%
38.99%48.11%
0.00%10.00%20.00%30.00%40.00%50.00%60.00%70.00%80.00%90.00%
100.00%
0 - 1 Yr 1 - 3 Yrs 3 - 10 Yrs Above 10 Yrs
Debt Maturity Profile
Sovereign 44.52%
AAA 37.85%
AA+ 11.00%
AA & below 6.63%
Debt Rating Profile

AUM (` in Lakhs)SFIN Code : ULIF02708/10/08EquityMFII101 Equity Debt MMI & Others TotalInception Date : 08 Oct 2008 38,167.34 3,757.38 233.45 42,158.17NAV : 27.0587
Fund V/s Benchmark Performance Equity Fund Debt Fund Balanced FundPeriod Returns (%) Benchmark Returns (%)# Mr Shailesh Dhamankar 3 - 10Inception 13.73% 11.52% Mr Naveen Sharma - 15 165 Years 12.31% 10.89%3 Years 17.45% 13.06% Asset Category F&U Mandate2 Years 1.99% 1.77% Money Market Insts1 Year 16.57% 15.09% Public Deposits6 Months 1.08% 1.06% Govt. Securities1 Month 4.62% 4.49% Corporate Bonds
# 80% BSE- 100 20% CRISIL Composite Bond Fund Index Equity 60% to 100%Note: Returns over 1 year have been annualized. Net Current Assets -
Portfolio
Equity % to FundHDFC Bank Ltd 8.98%ITC Ltd. 5.54%ICICI Bank Ltd 4.08%Infosys Ltd 4.07%Reliance Industries Ltd. 4.05%Tata Motors Limited 2.79%Larsen & Toubro Limited. 2.58%Maruti Suzuki India Ltd 2.57%Kotak Mahindra MF - Kotak Banking ETF - Dividend Payout Option 2.35%Kotak Mahindra Bank Limited. 2.03%Others 51.50%
0% to 15% 0.39%
0% to 40% 8.91%
90.53%0.16%
Equity Managed Fund - Pension - II as on January 31, 2017Fund Objective : To achieve long term capital appreciation by investing pre-dominantly in equity and equity related securities and balancing it by shifting assets to the fixed income securities depending on the fund manager's views. The minimum allocation to equity will be 60%.
Fund ManagerNo. Of Funds Managed
% of Actual
24.35%
26.34%
9.14%
7.56%
7.00%
5.54%
5.48%
4.03%
3.94%
3.74%
2.88%
Others
Financial Service Activities
Mfg of Motor Vehicles
Computer Programming
Mfg of Coke &Refined Petroleum
Mfg of Tobacco Products
Mfg of Pharmaceuticals
Government Securities
Mfg of Non-metallic mineral …
Other Financial Activities
Mfg of Chemical Products
Sector Allocation as per NIC 2008% to Fund
Total 90.53%
Debentures / Bonds % to FundMahindra Vehicle Manufacturers Ltd 1.31%LIC Housing Finance Ltd 1.11%Rural Electrification Corporation Ltd 0.88%Sundaram Finance Ltd 0.81%UPL Ltd 0.23%ICICI Securities Primary Dealership Ltd 0.22%Power Finance Corporation Ltd 0.20%National Thermal Power Corporation Ltd 0.08%Tata Sons Ltd 0.05%
Total 4.88%
Government Securities % to Fund7.16% GOI Mat 20-May-2023 1.22%7.61% GOI Mat 09-May-2030 0.77%7.68% GOI Mat 15-Dec-2023 0.55%8.20% GOI Mat 15-Feb-2022 0.43%8.32% GOI Mat 02-Aug-2032 0.39%8.13% Oil Bond Mat 16-Oct-2021 0.35%8.28% GOI Mat 15-Feb-2032 0.11%8.30% GOI Mat 31-Dec-2042 0.08%8.13% GOI Mat 22-June-2045 0.07%8.79% GOI Mat 08-Nov-2021 0.05%Others 0.01%
Total 4.03%
Deposits, Money Mkt Securities and Net Current Assets. 0.55%
Grand Total 100.00%
Debt ParametersPortfolio Yield (%) 6.91%Avg Maturity (In Months) 76.81Modified Duration (In Years) 4.41
13.48%2.48%
68.70%
15.34%
0.00%10.00%20.00%30.00%40.00%50.00%60.00%70.00%80.00%90.00%
100.00%
0 - 1 Yr 1 - 3 Yrs 3 - 10 Yrs Above 10 Yrs
Debt Maturity Profile
Sovereign 45.22%
AAA 43.03%
AA+ 11.70%AA & below
0.05%
Debt Rating Profile

AUM (` in Lakhs)SFIN Code : ULIF02808/10/08GrwthFndII101 Equity Debt MMI & Others TotalInception Date : 08 Oct 2008 181,593.42 - 10,651.69 192,245.11NAV : 30.0379
Fund V/s Benchmark Performance Equity Fund Debt Fund Balanced FundPeriod Returns (%) Benchmark Returns (%)# Mr Priyank Singhal 8 - - Inception 15.11% 12.19%5 Years 12.80% 11.16% Asset Category F&U Mandate3 Years 17.93% 13.31% Money Market Insts2 Years 1.84% -0.40% Public Deposits1 Year 15.30% 15.42% Govt. Securities6 Months 0.68% -0.27% Corporate Bonds1 Month 4.94% 5.31% Equity 90% to 100%
# BSE-100 Net Current Assets -Note: Returns over 1 year have been annualized.
Portfolio
Equity % to FundHDFC Bank Ltd 9.24%ITC Ltd. 6.01%Infosys Ltd 4.78%Reliance Industries Ltd. 4.13%ICICI Bank Ltd 3.80%Maruti Suzuki India Ltd 3.49%Larsen & Toubro Limited. 3.36%Tata Motors Limited 2.96%Mahindra & Mahindra Ltd. 2.76%SBI-ETF Nifty Bank 2.65%Others 51.29%
0% to 10% 5.45%
0% 0.00%
94.46%0.09%
Growth Fund - Pension - II as on January 31, 2017Fund Objective : To generate long term capital appreciation from a diversified portfolio of equity and equity related securities.
Fund ManagerNo. Of Funds Managed
% of Actual
24.02%
23.91%
10.56%
8.39%
7.41%
6.01%
5.59%
4.04%
3.52%
3.36%
3.17%
Others
Financial Service Activities
Mfg of Motor Vehicles
Computer Programming
Mfg of Coke &Refined Petroleum
Mfg of Tobacco Products
Mfg of Pharmaceuticals
Mfg of Non-metallic mineral …
Other Financial Activities
Civil Engineering
Mfg of Electrical Equipment
Sector Allocation as per NIC 2008% to Fund
Total 94.46%
Deposits, Money Mkt Securities and Net Current Assets. 5.54%
Grand Total 100.00%
100.00%
80.00%
90.00%
100.00%
0 - 1 Yr
Debt Maturity Profile

AUM (` in Lakhs)SFIN Code : ULIF02208/10/08LiquidFdII101 Equity Debt MMI & Others TotalInception Date : 08 Oct 2008 - - 4,481.45 4,481.45NAV : 18.6892
Fund V/s Benchmark Performance Equity Fund Debt Fund Balanced FundPeriod Returns (%) Benchmark Returns (%)# Mr Kailash Lalwani - 12 11Inception 7.78% 7.64%5 Years 7.53% 8.45% Asset Category F&U Mandate3 Years 7.17% 8.25% Money Market Insts2 Years 6.72% 7.77% Public Deposits1 Year 6.41% 7.52% Govt. Securities6 Months 3.07% 3.39% Corporate Bonds1 Month 0.44% 0.52% Equity 0%
# CRISIL Liquid Fund IndexNote: Returns over 1 year have been annualized.
Portfolio
Deposits, Money Mkt Securities and Net Current Assets. 100.00%
Grand Total 100.00%
Debt ParametersPortfolio Yield (%) 6.57%Avg Maturity (In Months) 2.38Modified Duration (In Years) 0.20
0% 0.00%
0.00%
Liquid Fund - Pension - II as on January 31, 2017Fund Objective : To deliver returns linked to Money Market levels with minimal interest rate risk and minimal credit risk so as to provide a high level of safety of capital.
Fund ManagerNo. Of Funds Managed
% of Actual
100% 100.00%
0.45%
74.65%
24.90%
Others
Government Securities
Financial Service Activities
Sector Allocation as per NIC 2008% to Fund
100.00%100.00%
Debt Maturity Profile
80.00%
90.00%
0 - 1 Yr
Sovereign 74.99%AAA 25.01%
Debt Rating Profile

AUM (` in Lakhs)SFIN Code : ULIF02408/10/08SecureMFII101 Equity Debt MMI & Others TotalInception Date : 08 Oct 2008 - 13,899.04 1,268.19 15,167.23NAV : 21.3346
Fund V/s Benchmark Performance Equity Fund Debt Fund Balanced FundPeriod Returns (%) Benchmark Returns (%)# Mr Badrish Kulhalli - 13 4Inception 9.41% 8.83%5 Years 9.95% 9.78% Asset Category F&U Mandate3 Years 11.96% 12.09% Money Market Insts2 Years 9.70% 10.48% Public Deposits1 Year 15.28% 13.77% Govt. Securities6 Months 6.38% 6.41% Corporate Bonds1 Month 1.02% 1.20% Equity 0%
# CRISIL Composite Bond Fund Index Net Current Assets -Note: Returns over 1 year have been annualized.
Portfolio
Debentures / Bonds % to FundNational Thermal Power Corporation Ltd 8.69%Mahindra and Mahindra Financial Services Ltd 8.50%Power Grid Corporation of India Ltd 6.10%Housing Development Finance Corporation Ltd 3.71%Larsen & Toubro Ltd 3.58%Bajaj Finance Ltd 3.06%IDFC Bank Ltd 3.04%Tata Sons Ltd 2.22%Indian Railway Finance Corporation Ltd 2.12%Mahindra & Mahindra Ltd 1.82%Others 9.33%
0% to 25% 0.06%
75% to 100% 91.64%
0.00%8.30%
Secured Managed Fund - Pension - II as on January 31, 2017Fund Objective : To provide reasonable returns through investments in high credit quality debt instruments while maintaining an optimal level of interest rate risk.
Fund ManagerNo. Of Funds Managed
% of Actual
8.36%
39.47%
26.80%
15.78%
3.58%
1.82%
1.69%
1.51%
0.99%
Others
Government Securities
Financial Service Activities
Electricity,Gas & AC Supply
Civil Engineering
Mfg of Motor Vehicles
Mfg of Coke &Refined Petroleum
Warehousing
Mfg of Chemical Products
Sector Allocation as per NIC 2008% to Fund
Total 52.17%
Government Securities % to Fund9.20% GOI Mat 30-Sep-2030 5.73%7.72% GOI Mat 25-May-2025 5.71%8.17% GOI Mat 01-Dec-2044 5.37%6.79% GOI Mat 26-Dec-2029 5.31%7.61% GOI Mat 09-May-2030 4.68%8.40% GOI Mat 28-Jul-2024 3.19%7.73% GOI Mat 19-Dec-2034 2.92%8.15% GOI Mat 24-Nov-2026 2.80%8.13% GOI Mat 22-June-2045 1.52%8.32% GOI Mat 02-Aug-2032 1.12%Others 1.11%
Total 39.47%
Deposits, Money Mkt Securities and Net Current Assets. 8.36%
Grand Total 100.00%
Debt ParametersPortfolio Yield (%) 7.03%Avg Maturity (In Months) 119.97Modified Duration (In Years) 6.14
2.35%9.55%
53.93%
34.17%
0.00%10.00%20.00%30.00%40.00%50.00%60.00%70.00%80.00%90.00%
100.00%
0 - 1 Yr 1 - 3 Yrs 3 - 10 Yrs Above 10 Yrs
Debt Maturity Profile
Sovereign 43.07%AAA 54.60%
AA+ 2.33%
Debt Rating Profile

AUM (` in Lakhs)SFIN Code : ULIF02308/10/08StableMFII101 Equity Debt MMI & Others TotalInception Date : 08 Oct 2008 - 4,012.55 252.43 4,264.98NAV : 18.4107
Fund V/s Benchmark Performance Equity Fund Debt Fund Balanced FundPeriod Returns (%) Benchmark Returns (%)# Mr Naveen Sharma - 15 16Inception 7.59% 8.59%5 Years 7.70% 9.28% Asset Category F&U Mandate3 Years 7.60% 9.71% Money Market Insts2 Years 6.72% 9.18% Public Deposits1 Year 6.62% 10.22% Govt. Securities6 Months 3.23% 4.73% Corporate Bonds1 Month 0.55% 0.82% Equity 0%
# CRISIL Short Term Bond Fund IndexNote: Returns over 1 year have been annualized.
Portfolio
Debentures / Bonds % to FundPower Finance Corporation Ltd 9.90%L&T Finance Ltd 8.41%Rural Electrification Corporation Ltd 8.28%National Bank for Agriculture & Rural Development 7.29%Indian Railway Finance Corporation Ltd 7.28%Sundaram Finance Ltd 6.58%Tata Sons Ltd 6.42%LIC Housing Finance Ltd 5.57%Housing Development Finance Corporation Ltd 3.57%Mahindra and Mahindra Financial Services Ltd 1.66%Others 1.24%
0.00%
Stable Managed Fund -Pension - II as on January 31, 2017Fund Objective : To generate optimal returns for investors through short term investments in high credit quality securities so as to keep interest rate risks low and provide safety of capital over the medium term horizon.
Fund ManagerNo. Of Funds Managed
% of Actual
100% 100.00%
5.92%
66.20%
27.88%
Others
Financial Service Activities
Government Securities
Sector Allocation as per NIC 2008% to Fund
0 00%80.00%90.00%
100.00%
Debt Maturity Profile
Total 66.20%
Government Securities % to Fund7.83% GOI Mat 11-Apr-2018 24.82%7.46% GOI Mat 28-Aug-2017 2.36%8.07% GOI Mat 03-Jul-2017 0.71%
Total 27.88%
Deposits, Money Mkt Securities and Net Current Assets. 5.92%
Grand Total 100.00%
Debt ParametersPortfolio Yield (%) 6.57%Avg Maturity (In Months) 11.89Modified Duration (In Years) 1.00
34.43%
65.57%
0.00%10.00%20.00%30.00%40.00%50.00%60.00%70.00%
0 - 1 Yr 1 - 3 Yrs
Sovereign 29.64%
AAA 54.42%
AA+ 15.94%
Debt Rating Profile

AUM (` in Lakhs)SFIN Code : ULIF03501/01/10BlueChipFd101 Equity Debt MMI & Others TotalInception Date : 05 Jan 2010 290,481.05 - 25,095.56 315,576.61NAV : 17.3482
Fund V/s Benchmark Performance Equity Fund Debt Fund Balanced FundPeriod Returns (%) Benchmark Returns (%)# Mr Nishit Dholakia 3 - 8Inception 8.10% 7.06%5 Years 12.76% 11.16% Asset Category F&U Mandate3 Years 17.91% 13.31% Money Market Insts2 Years 2.73% -0.40% Public Deposits1 Year 15.25% 15.42% Govt. Securities6 Months 0.58% -0.27% Corporate Bonds1 Month 4.78% 5.31% Equity 80% to 100%
# BSE-100 Net Current Assets -Note: Returns over 1 year have been annualized.
Portfolio
Equity % to FundHDFC Bank Ltd 9.17%ITC Ltd. 5.85%Infosys Ltd 4.86%Reliance Industries Ltd. 4.31%ICICI Bank Ltd 3.66%Larsen & Toubro Limited. 3.44%Maruti Suzuki India Ltd 3.36%Kotak Mahindra MF - Kotak Banking ETF - Dividend Payout Option 2.81%Tata Motors Limited 2.65%Kotak Mahindra Bank Limited. 2.64%Others 49 30%
0% to 20% 8.53%
0% 0.00%
92.05%-0.58%
BlueChip Fund as on January 31, 2017Fund Objective : The fund aims to provide medium to long term capital appreciation by investing in a portfolio of pre-dominantly large cap companies which can perform through economic and market cycles. The fund will invest at least 80% of the AUM in companies which have a market capitalization greater than the company with the least weight in BSE100 index. The fund may also invest upto 20% in money market instruments/cash.
Fund ManagerNo. Of Funds Managed
% of Actual
25.62%
24.40%
9.50%
8.38%
6.93%
5.87%
5.85%
3.88%
3.44%
3.44%
2.69%
Others
Financial Service Activities
Mfg of Motor Vehicles
Computer Programming
Mfg of Coke &Refined Petroleum
Mfg of Pharmaceuticals
Mfg of Tobacco Products
Other Financial Activities
Mfg of Non-metallic mineral …
Civil Engineering
Mfg of Chemical Products
Sector Allocation as per NIC 2008% to Fund
Others 49.30%
Total 92.05%
Deposits, Money Mkt Securities and Net Current Assets. 7.95%
Grand Total 100.00%
100.00%
80.00%
90.00%
100.00%
0 - 1 Yr
Debt Maturity Profile

AUM (` in Lakhs)
SFIN Code : ULIF03401/01/10IncomeFund101 Equity Debt MMI & Others Total
Inception Date : 05 Jan 2010 - 162,503.86 23,260.14 185,764.00
NAV : 18.457
Fund V/s Benchmark Performance Equity Fund Debt Fund Balanced Fund
Period Returns (%) Benchmark Returns (%)# Mr Naveen Sharma - 15 16
Inception 9.05% 8.70%
5 Years 9.68% 9.78% Asset Category F&U Mandate
3 Years 11.39% 12.09% Money Market Insts
2 Years 9.12% 10.48% Public Deposits
1 Year 14.46% 13.77% Govt. Securities
6 Months 6.25% 6.41% Corporate Bonds
1 Month 1.15% 1.20% Equity 0%
# CRISIL Composite Bond Fund Index Net Current Assets -
Note: Returns over 1 year have been annualized.
Portfolio
Debentures / Bonds % to Fund
Rural Electrification Corporation Ltd 8.54%
Power Finance Corporation Ltd 4.29%
LIC Housing Finance Ltd 4.26%
Reliance Ports and Terminals Ltd 4.21%
Mahindra and Mahindra Financial Services Ltd 4.19%
IDFC Bank Ltd 3.48%
ICICI Bank Ltd 2.77%
East North Interconnection Co Ltd 2.42%
Mahindra & Mahindra Ltd 2.19%
Au Financiers (India) Limited 1.89%
Others 18.33%
Total 56.56%
Government Securities % to Fund
7.59% GOI Mat 20-Mar-2029 10.03%
7.61% GOI Mat 09-May-2030 5.74%
8.33% GOI Mat 07-Jun-2036 3.32%
8.15% GOI Mat 24-Nov-2026 2.97%
8.32% GOI Mat 02-Aug-2032 1.91%
9.20% GOI Mat 30-Sep-2030 1.51%
8.28% GOI Mat 21-Sep-2027 1.50%
7.72% GOI Mat 26-Oct-2055 1.46%
8.83% GOI Mat 12-Dec-2041 0.79%
8.60% GOI Mat 02-Jun-2028 0.56%
Others 1.14%
Total 30.92%
Deposits, Money Mkt Securities and Net Current Assets. 12.52%
Grand Total 100.00%
Debt Parameters
Portfolio Yield (%) 7.04%
Avg Maturity (In Months) 106.79
Modified Duration (In Years) 5.68
80% to 100% 87.48%
0.00%
2.65%
Income Fund as on January 31, 2017
Fund Objective : The fund aims to provide superior returns through investments in high credit quality debt instruments while maintaining an optimal level of interest rate risk. The fund may also invest upto 20% in
money market instruments/cash.
Fund ManagerNo. Of Funds Managed
% of Actual
0% to 20% 9.87%
12.52%
41.79%
30.92%
5.81%
4.21%
2.33%
1.63%
0.57%
0.22%
0.00%
Others
Financial Service Activities
Government Securities
Electricity,Gas & AC Supply
Warehousing
Mfg of Motor Vehicles
Mfg of Basic Metals
Broadcasting & Programming
Mfg of Chemical Products
Postal & Courier
Sector Allocation as per NIC 2008% to Fund
13.40% 11.00%
38.87% 36.73%
0.00%
10.00%
20.00%
30.00%
40.00%
50.00%
60.00%
70.00%
80.00%
90.00%
100.00%
0 - 1 Yr 1 - 3 Yrs 3 - 10 Yrs Above 10 Yrs
Debt Maturity Profile
Sovereign
35.34%
AAA 56.95%
AA+ 3.02%
AA & below
4.69%
Debt Rating Profile

AUM (` in Lakhs)SFIN Code : ULIF03601/01/10OpprtntyFd101 Equity Debt MMI & Others TotalInception Date : 05 Jan 2010 545,070.42 - 60,959.70 606,030.12NAV : 23.1773
Fund V/s Benchmark Performance Equity Fund Debt Fund Balanced FundPeriod Returns (%) Benchmark Returns (%)# Mr Nishit Dholakia 3 - 8Inception 12.61% 10.44%5 Years 17.27% 16.77% Asset Category F&U Mandate3 Years 29.81% 26.91% Money Market Insts2 Years 10.02% 8.37% Public Deposits1 Year 23.32% 23.62% Govt. Securities6 Months 4.21% 4.34% Corporate Bonds1 Month 5.76% 7.40% Equity 80% to 100%
# Nifty Midcap 100 Net Current Assets -Note: Returns over 1 year have been annualized.
Portfolio
Equity % to FundMRF Ltd. 2.69%The Ramco Cements Ltd 2.67%Hindustan Zinc Ltd. 2.56%Cadila Healthcare Ltd 2.52%Havells India Ltd 2.50%Indraprastha Gas Ltd 2.17%Torrent Pharmaceuticals Limited 2.15%Voltas Ltd 2.04%Mahindra & Mahindra Finacial Services Limited 1.93%Emami Ltd 1.62%Oth 67 12%
0% to 20% 10.71%
0% 0.00%
89.94%-0.65%
Opportunities Fund as on January 31, 2017Fund Objective : The fund aims to generate long term capital appreciation by investing pre-dominantly in mid cap stocks which are likely to be the blue chips of tomorrow. The fund will invest in stocks which have a market capitalization equal to or lower than the market capitalization of the highest weighted stock in the NSE CNX Midcap Index. The fund may also invest upto 20% in money market instruments/cash.
Fund ManagerNo. Of Funds Managed
% of Actual
34.57%
14.86%
9.97%
7.00%
6.76%
5.43%
5.40%
4.71%
4.51%
3.49%
3.30%
Others
Financial Service Activities
Mfg of Pharmaceuticals
Mfg of Chemical Products
Mfg of Electrical Equipment
Mfg of Non-metallic mineral …
Mfg of Machinery & Equipment
Mfg of Rubber & Plastics Products
Electricity,Gas & AC Supply
Mfg of Basic Metals
Computer Programming
Sector Allocation as per NIC 2008% to Fund
Others 67.12%
Total 89.94%
Deposits, Money Mkt Securities and Net Current Assets. 10.06%
Grand Total 100.00%
3 .57%
100.00%
80.00%
90.00%
100.00%
0 - 1 Yr
Debt Maturity Profile

AUM (` in Lakhs)SFIN Code : ULIF03701/01/10VantageFnd101 Equity Debt MMI & Others TotalInception Date : 05 Jan 2010 17,186.75 6,957.53 1,766.94 25,911.23NAV : 19.5705
Fund V/s Benchmark Performance Equity Fund Debt Fund Balanced FundPeriod Returns (%) Benchmark Returns (%)# Mr Naveen Sharma - 15 16Inception 9.95% N/A Mr Farokh Pandole - - 135 Years 12.51% N/A3 Years 18.62% N/A Asset Category F&U Mandate2 Years 5.78% N/A Money Market Insts1 Year 16.21% N/A Public Deposits6 Months 2.69% N/A Govt. Securities1 Month 4.25% N/A Corporate Bonds
# NA Equity 10% to 70%Note: Returns over 1 year have been annualized. Net Current Assets -
Portfolio
Equity % to FundHDFC Bank Ltd 6.64%ITC Ltd. 3.89%Reliance Industries Ltd. 3.09%Maruti Suzuki India Ltd 2.73%Larsen & Toubro Limited. 2.69%Infosys Ltd 2.55%Tata Consultancy Services Ltd. 2.45%Kotak Mahindra Bank Limited. 2.07%Tata Motors Limited 2.04%ICICI Bank Ltd 1.85%Others 36.33%
0% to 40% 5.91%
10% to 70% 26.85%
66.33%0.91%
Vantage Fund as on January 31, 2017Fund Objective : The Vantage Fund dynamically manages the asset allocation between equity and fixed income instruments to deliver higher returns through equity exposure, combined with the stability of the fixed income exposure. The fund returns are likely to be volatile due to market movements.
Fund ManagerNo. Of Funds Managed
% of Actual
24.59%
12.62%
9.11%
6.93%
5.39%
3.89%
3.68%
3.62%
3.26%
2.99%
Financial Service Activities
Government Securities
Mfg of Motor Vehicles
Mfg of Coke &Refined Petroleum
Computer Programming
Mfg of Tobacco Products
Mfg of Chemical Products
Electricity,Gas & AC Supply
Mfg of Non-metallic mineral …
Mfg of Pharmaceuticals
Sector Allocation as per NIC 2008% to Fund
Total 66.33%
Debentures / Bonds % to FundICICI Securities Primary Dealership Ltd 2.22%Mahindra Vehicle Manufacturers Ltd 2.00%Housing Development Finance Corporation Ltd 1.95%Power Grid Corporation of India Ltd 1.75%IOT Utkal Energy Services Limited 1.54%Rural Electrification Corporation Ltd 1.20%East North Interconnection Co Ltd 0.86%Reliance Ports and Terminals Ltd 0.81%LIC Housing Finance Ltd 0.74%Power Finance Corporation Ltd 0.43%Others 0.72%
Total 14.23%
Government Securities % to Fund8.32% GOI Mat 02-Aug-2032 7.89%7.59% GOI Mat 20-Mar-2029 2.04%7.68% GOI Mat 15-Dec-2023 1.84%8.28% GOI Mat 21-Sep-2027 0.51%8.15% GOI Mat 24-Nov-2026 0.18%6.35% Oil Bond Mat 23-Dec-2024 0.14%8.97% GOI Mat 05-Dec-2030 0.01%
Total 12.62%
Deposits, Money Mkt Securities and Net Current Assets. 6.82%
Grand Total 100.00%
Debt ParametersPortfolio Yield (%) 6.91%Avg Maturity (In Months) 102.14Modified Duration (In Years) 5.29
23.93%Others
19.48%
1.87%
37.43%41.22%
0.00%10.00%20.00%30.00%40.00%50.00%60.00%70.00%80.00%90.00%
100.00%
0 - 1 Yr 1 - 3 Yrs 3 - 10 Yrs Above 10 Yrs
Debt Maturity Profile
Sovereign 46.99%
AAA 50.50%
AA+ 1.06%AA & below
1.46%
Debt Rating Profile

AUM (` in Lakhs)SFIN Code : ULIF03901/09/10BalancedFd101 Equity Debt MMI & Others TotalInception Date : 08 Sep 2010 276,627.49 132,349.62 13,787.80 422,764.91NAV : 17.0488
Fund V/s Benchmark Performance Equity Fund Debt Fund Balanced FundPeriod Returns (%) Benchmark Returns (%)# Mr Kailash Lalwani - 12 11Inception 8.69% 7.72% Mr Shailesh Dhamankar 3 - 105 Years 11.50% 10.61%3 Years 15.53% 12.82% Asset Category F&U Mandate2 Years 3.63% 3.95% Money Market Insts1 Year 15.89% 14.76% Public Deposits6 Months 2.21% 2.40% Govt. Securities1 Month 3.62% 3.67% Corporate Bonds
# 60% BSE-100 40% CRISIL Composite Bond Fund Index Equity 40% to 80%Note: Returns over 1 year have been annualized. Net Current Assets -
Portfolio
Equity % to FundHDFC Bank Ltd 6.74%ITC Ltd. 4.12%ICICI Bank Ltd 2.94%Infosys Ltd 2.94%Reliance Industries Ltd. 2.87%Tata Motors Limited 2.04%Larsen & Toubro Limited. 1.93%Maruti Suzuki India Ltd 1.84%Kotak Mahindra Bank Limited. 1.45%IndusInd Bank Ltd. 1.44%Others 37.13%
Total 65.43%
0% to 20% 1.51%
0% to 60% 31.31%
65.43%1.76%
Balanced Fund as on January 31, 2017Fund Objective : To invest in Debt and Equity securities so as to combine the stability of Debt instruments with the long term capital appreciation potential of Equities.
Fund ManagerNo. Of Funds Managed
% of Actual
22.74%
28.93%
15.73%
5.93%
5.42%
5.30%
4.12%
3.96%
2.96%
2.70%
2.20%
Others
Financial Service Activities
Government Securities
Mfg of Motor Vehicles
Computer Programming
Mfg of Coke &Refined Petroleum
Mfg of Tobacco Products
Mfg of Pharmaceuticals
Electricity,Gas & AC Supply
Mfg of Non-metallic mineral Products
Other Financial Activities
Sector Allocation as per NIC 2008% to Fund
Total 65.43%
Debentures / Bonds % to FundLIC Housing Finance Ltd 1.89%Indian Railway Finance Corporation Ltd 1.78%IDFC Bank Ltd 1.47%Housing Development Finance Corporation Ltd 1.33%Tata Sons Ltd 1.24%Mahindra and Mahindra Financial Services Ltd 1.17%Indiabulls Housing Finance Ltd 1.17%Power Grid Corporation of India Ltd 0.89%Reliance Ports and Terminals Ltd 0.72%HDB Financial Services Ltd 0.63%Others 3.27%
Total 15.57%
Government Securities % to Fund7.61% GOI Mat 09-May-2030 3.68%8.17% GOI Mat 01-Dec-2044 2.84%6.79% GOI Mat 26-Dec-2029 2.28%9.20% GOI Mat 30-Sep-2030 2.02%7.73% GOI Mat 19-Dec-2034 0.93%8.13% GOI Mat 22-June-2045 0.72%7.88% GOI Mat 19-Mar-2030 0.64%8.20% GOI Mat 24-Sep-2025 0.55%8.00% Oil Bond Mat 23-Mar-2026 0.49%8.15% GOI Mat 24-Nov-2026 0.47%Others 1.12%
Total 15.73%
Deposits, Money Mkt Securities and Net Current Assets. 3.26%
Grand Total 100.00%
Debt ParametersPortfolio Yield (%) 6.99%Avg Maturity (In Months) 127.14Modified Duration (In Years) 6.40
10.00% 11.76%
32.94%
45.29%
0.00%10.00%20.00%30.00%40.00%50.00%60.00%70.00%80.00%90.00%
100.00%
0 - 1 Yr 1 - 3 Yrs 3 - 10 Yrs Above 10 Yrs
Debt Maturity Profile
Sovereign 50.25%
AAA 46.71%
AA+ 1.24%AA & below
1.80%
Debt Rating Profile

AUM (` in Lakhs)SFIN Code : ULIF04001/09/10HighestNAV101 Equity Debt MMI & Others TotalInception Date : 08 Sep 2010 250,883.49 609,622.47 19,823.55 880,329.51NAV : 13.9074
Fund V/s Benchmark Performance Equity Fund Debt Fund Balanced FundPeriod Returns (%) Benchmark Returns (%)# Mr Badrish Kulhalli - 13 4Inception 5.29% N/A Mr Farokh Pandole - - 135 Years 7.58% N/A3 Years 9.45% N/A Asset Category F&U Mandate2 Years 2.23% N/A Money Market Insts1 Year 8.87% N/A Public Deposits6 Months 1.81% N/A Govt. Securities1 Month 1.67% N/A Corporate Bonds
# NA Equity 0% to 100%Note: Returns over 1 year have been annualized. Net Current Assets -
Portfolio
Equity % to FundHDFC Bank Ltd 2.66%ITC Ltd. 2.00%ICICI Bank Ltd 1.82%Infosys Ltd 1.70%Reliance Industries Ltd. 1.58%Tata Consultancy Services Ltd. 1.09%Larsen & Toubro Limited. 1.09%Kotak Mahindra Bank Limited. 1.08%Tata Motors Limited 0.98%State Bank of India. 0.94%Others 13.55%
28.50%1.84%
Highest NAV Guarantee Fund as on January 31, 2017Fund Objective : To Generate Returns from Hybrid asset Allocation Portfolio over 10 year Term of Fund
Fund ManagerNo. Of Funds Managed
% of Actual
0% to 100% 69.66%
8.37%
37.47%
29.56%
6.55%
3.73%
3.57%
2.47%
2.44%
2.11%
2.00%
1.73%
Others
Financial Service Activities
Government Securities
Electricity,Gas & AC Supply
Computer Programming
Civil Engineering
Mfg of Motor Vehicles
Warehousing
Mfg of Coke &Refined Petroleum
Mfg of Tobacco Products
Mfg of Pharmaceuticals
Sector Allocation as per NIC 2008% to Fund
Total 28.50%
Debentures / Bonds % to FundRural Electrification Corporation Ltd 6.36%LIC Housing Finance Ltd 5.64%Power Finance Corporation Ltd 4.90%Power Grid Corporation of India Ltd 4.71%Export and Import Bank of India 3.02%Larsen & Toubro Ltd 2.41%Reliance Ports and Terminals Ltd 2.22%Housing Development Finance Corporation Ltd 2.01%Tata Sons Ltd 1.64%Bajaj Finance Ltd 1.48%Others 5.31%
Total 39.69%
Government Securities % to Fund7.80% GOI Mat 11-Apr-2021 8.80%8.12% GOI Mat 10-Dec-2020 7.84%8.79% GOI Mat 08-Nov-2021 7.66%8.83% GOI Mat 25-Nov-2023 1.89%8.13% GOI Mat 21-Sep-2022 1.21%7.94% CG Mat 24-May-2021 0.96%8.08% GOI Mat 02-Aug-2022 0.59%8.35% GOI Mat 14-May-2022 0.43%8.20% GOI Mat 15-Feb-2022 0.17%
Total 29.56%
Deposits, Money Mkt Securities and Net Current Assets. 2.25%
Grand Total 100.00%
Debt ParametersPortfolio Yield (%) 6.85%Avg Maturity (In Months) 53.84Modified Duration (In Years) 3.64
2.78% 2.35%
94.88%
0.00%10.00%20.00%30.00%40.00%50.00%60.00%70.00%80.00%90.00%
100.00%
0 - 1 Yr 1 - 3 Yrs 3 - 10 Yrs
Debt Maturity Profile
Sovereign 42.68%
AAA 56.95%
AA & below 0.37%
Debt Rating Profile

AUM (` in Lakhs)
SFIN Code : ULIF03801/09/10ShortTrmFd101 Equity Debt MMI & Others Total
Inception Date : 14 Sep 2010 - 15,104.42 1,581.95 16,686.36
NAV : 16.2444
Fund V/s Benchmark Performance Equity Fund Debt Fund Balanced Fund
Period Returns (%) Benchmark Returns (%)# Mr Naveen Sharma - 15 16
Inception 7.89% 8.83%
5 Years 7.94% 9.28% Asset Category F&U Mandate
3 Years 8.16% 9.71% Money Market Insts
2 Years 7.23% 9.18% Public Deposits
1 Year 7.63% 10.22% Govt. Securities
6 Months 3.79% 4.73% Corporate Bonds
1 Month 0.65% 0.82% Equity 0%
# CRISIL Short Term Bond Fund Index
Note: Returns over 1 year have been annualized.
Portfolio
Debentures / Bonds % to Fund
Power Finance Corporation Ltd 9.77%
Nabha Power Limited 9.21%
Rural Electrification Corporation Ltd 8.55%
Housing Development Finance Corporation Ltd 8.27%
IL & FS Ltd 7.61%
Crompton Greaves Consumer Electricals Ltd 6.20%
LIC Housing Finance Ltd 6.13%
Ultratech Cement Ltd 6.09%
Sundaram Finance Ltd 4.75%
UPL Ltd 4.42%
Others 16.22%
Total 87.22%
Government Securities % to Fund
7.83% GOI Mat 11-Apr-2018 2.74%
7.46% GOI Mat 28-Aug-2017 0.49%
8.07% GOI Mat 03-Jul-2017 0.06%
Total 3.30%
Deposits, Money Mkt Securities and Net Current Assets. 9.48%
Grand Total 100.00%
Debt Parameters
Portfolio Yield (%) 6.83%
Avg Maturity (In Months) 18.66
Modified Duration (In Years) 1.36
0.00%
Short Term Fund as on January 31, 2017
Fund Objective : To invest in Government securities, high grade corporate bonds and money market instruments with a maximum outstanding maturity limit of 3 years
Fund ManagerNo. Of Funds Managed
% of Actual
100% 100.00%
6.48%
60.35%
9.21%
6.20%
6.09%
4.42%
3.30%
2.08%
1.86%
Others
Financial Service Activities
Electricity,Gas & AC Supply
Mfg of Electrical Equipment
Mfg of Non-metallic mineral …
Mfg of Chemical Products
Government Securities
Mfg of Basic Metals
Civil Engineering
Sector Allocation as per NIC 2008% to Fund
21.24%
78.76%
0.00%
10.00%
20.00%
30.00%
40.00%
50.00%
60.00%
70.00%
80.00%
90.00%
100.00%
0 - 1 Yr 1 - 3 Yrs
Debt Maturity Profile
Sovereign
3.64%
AAA 76.41%
AA+ 10.81%
AA & below
9.14%
Debt Rating Profile

AUM (` in Lakhs)SFIN Code : ULIF04126/10/10CaptlGuaFd101 Equity Debt MMI & Others TotalInception Date : 02 Nov 2010 1,174.23 180.10 9.77 1,364.10NAV : 15.0255
Fund V/s Benchmark Performance Equity Fund Debt Fund Balanced FundPeriod Returns (%) Benchmark Returns (%)# Mr Badrish Kulhalli - 13 4Inception 6.73% N/A Mr Farokh Pandole - - 135 Years 9.48% N/A3 Years 11.15% N/A Asset Category F&U Mandate2 Years -3.00% N/A Money Market Insts1 Year 10.59% N/A Public Deposits6 Months -1.67% N/A Govt. Securities1 Month 3.79% N/A Corporate Bonds
# NA Equity 0% to 100%Note: Returns over 1 year have been annualized. Net Current Assets -
Portfolio
Equity % to FundITC Ltd. 6.25%ICICI Bank Ltd 5.67%HDFC Bank Ltd 5.57%Infosys Ltd 5.30%Reliance Industries Ltd. 4.94%Tata Consultancy Services Ltd. 3.39%Larsen & Toubro Limited. 3.39%Kotak Mahindra Bank Limited. 3.36%Tata Motors Limited 3.06%State Bank of India. 2.92%Others 42.23%
86.08%0.51%
Capital Guarantee Fund as on January 31, 2017Fund Objective : To Generate Returns from Hybrid asset Allocation Portfolio with a guarantee that the corpus at the end of the investment horizon is at least equal to initial Capital.
Fund ManagerNo. Of Funds Managed
% of Actual
0% to 100% 13.41%
31.08%
11.64%
7.69%
7.01%
6.25%
5.95%
5.39%
3.83%
3.56%
3.39%
Financial Service Activities
Computer Programming
Mfg of Motor Vehicles
Government Securities
Mfg of Tobacco Products
Mfg of Coke &Refined Petroleum
Mfg of Pharmaceuticals
Mfg of Chemical Products
Electricity,Gas & AC Supply
Civil Engineering
Sector Allocation as per NIC 2008% to Fund
Total 86.08%
Debentures / Bonds % to FundRural Electrification Corporation Ltd 4.64%LIC Housing Finance Ltd 1.56%
Total 6.20%
Government Securities % to Fund8.79% GOI Mat 08-Nov-2021 4.80%7.80% GOI Mat 11-Apr-2021 1.92%8.08% GOI Mat 02-Aug-2022 0.18%8.12% GOI Mat 10-Dec-2020 0.12%
Total 7.01%
Deposits, Money Mkt Securities and Net Current Assets. 0.72%
Grand Total 100.00%
Debt ParametersPortfolio Yield (%) 6.77%Avg Maturity (In Months) 54.38Modified Duration (In Years) 3.60
14.20%Others
1.54%
98.46%
0.00%10.00%20.00%30.00%40.00%50.00%60.00%70.00%80.00%90.00%
100.00%
0 - 1 Yr 3 - 10 Yrs
Debt Maturity Profile
Sovereign 53.08%
AAA 46.92%
Debt Rating Profile

AUM (` in Lakhs)SFIN Code : ULIF04224/01/11PenGuaFnd1101 Equity Debt MMI & Others TotalInception Date : 01 Feb 2011 1,752.50 9,731.90 446.41 11,930.81NAV : 15.9333
Fund V/s Benchmark Performance Equity Fund Debt Fund Balanced FundPeriod Returns (%) Benchmark Returns (%)# Mr Badrish Kulhalli - 13 4Inception 8.07% N/A Mr Farokh Pandole - - 135 Years 8.47% N/A3 Years 10.17% N/A Asset Category F&U Mandate2 Years 7.22% N/A Money Market Insts1 Year 11.10% N/A Public Deposits6 Months 3.97% N/A Govt. Securities1 Month 1.49% N/A Corporate Bonds
# NA Equity 0% to 30%Note: Returns over 1 year have been annualized. Net Current Assets -
Portfolio
Equity % to FundHDFC Bank Ltd 1.10%ITC Ltd. 1.06%Reliance Industries Ltd. 0.80%Infosys Ltd 0.76%ICICI Bank Ltd 0.70%IndusInd Bank Ltd. 0.67%Larsen & Toubro Limited. 0.59%Tata Consultancy Services Ltd. 0.50%Tata Motors Limited 0.43%Maruti Suzuki India Ltd 0.37%Others 7.71%
14.69%3.67%
Pension Guarantee Maximus Fund as on January 31, 2017Fund Objective : The fund aims to deliver steady returns through mix of Debt & Equities.
Fund ManagerNo. Of Funds Managed
% of Actual
70% to 100% 81.64%
58.63%
18.49%
9.81%
1.69%
1.12%
1.06%
1.03%
0.81%
0.60%
0.59%
Financial Service Activities
Electricity,Gas & AC Supply
Warehousing
Computer Programming
Mfg of Motor Vehicles
Mfg of Tobacco Products
Mfg of Coke &Refined Petroleum
Mfg of Pharmaceuticals
Mfg of Chemical Products
Civil Engineering
Sector Allocation as per NIC 2008% to Fund
Total 14.69%
Debentures / Bonds % to FundReliance Ports and Terminals Ltd 9.69%Rural Electrification Corporation Ltd 9.31%Torrent Power Ltd 9.24%Power Finance Corporation Ltd 9.21%Tata Sons Ltd 8.95%Housing Development Finance Corporation Ltd 8.79%Power Grid Corporation of India Ltd 8.69%LIC Housing Finance Ltd 5.96%IL & FS Ltd 5.75%Export and Import Bank of India 5.05%Others 0.88%
Total 81.53%
Government Securities % to Fund7.80% GOI Mat 11-Apr-2021 0.04%
Total 0.04%
Deposits, Money Mkt Securities and Net Current Assets. 3.74%
Grand Total 100.00%
Debt ParametersPortfolio Yield (%) 7.18%Avg Maturity (In Months) 52.28Modified Duration (In Years) 3.38
6.17%Others
0.08%
99.92%
0.00%10.00%20.00%30.00%40.00%50.00%60.00%70.00%80.00%90.00%
100.00%
0 - 1 Yr 3 - 10 Yrs
Debt Maturity Profile
Sovereign 0.04%
AAA 88.63%
AA & below 11.33%
Debt Rating Profile

AUM (` in Lakhs)SFIN Code : ULIF04818/06/12PenSuPls12101 Equity Debt MMI & Others TotalInception Date : 06 Dec 2012 125,484.76 97,726.50 5,888.47 229,099.73NAV : 14.223
Fund V/s Benchmark Performance Equity Fund Debt Fund Balanced FundPeriod Returns (%) Benchmark Returns (%)# Mr Badrish Kulhalli - 13 4Inception 8.85% N/A Mr Farokh Pandole - - 135 Years N/A N/A3 Years 11.62% N/A Asset Category F&U Mandate2 Years 2.81% N/A Money Market Insts1 Year 10.19% N/A Public Deposits6 Months 1.80% N/A Govt. Securities1 Month 2.90% N/A Corporate Bonds
# NA Equity 0% to 60%Note: Returns over 1 year have been annualized. Net Current Assets -
Portfolio
Equity % to FundHDFC Bank Ltd 5.20%ITC Ltd. 3.86%ICICI Bank Ltd 3.48%Infosys Ltd 3.28%Reliance Industries Ltd. 3.05%Tata Consultancy Services Ltd. 2.09%Larsen & Toubro Limited. 2.09%Kotak Mahindra Bank Limited. 1.99%Tata Motors Limited 1.89%State Bank of India. 1.80%Others 26.05%
0% to 40% 1.57%
40% to 100% 42.66%
54.77%1.00%
Pension Super Plus Fund - 2012 as on January 31, 2017Fund Objective : The fund aims to invest in Equity, Fixed Income Instruments, Liquid Mutual Funds and Money Market Instruments and actively manage the asset allocation between these categories to provide benefits at least equal to the guaranteed benefits.
Fund ManagerNo. Of Funds Managed
% of Actual
36.89%
15.33%
7.20%
6.23%
4.75%
3.86%
3.57%
3.34%
2.91%
2.37%
Financial Service Activities
Electricity,Gas & AC Supply
Computer Programming
Mfg of Coke &Refined Petroleum
Mfg of Motor Vehicles
Mfg of Tobacco Products
Warehousing
Mfg of Pharmaceuticals
Government Securities
Mfg of Chemical Products
Sector Allocation as per NIC 2008% to Fund
Total 54.77%
Debentures / Bonds % to FundNuclear Power Corporation of India Ltd 5.40%Housing Development Finance Corporation Ltd 4.85%National Bank for Agriculture & Rural Development 4.35%Power Grid Corporation of India Ltd 4.20%IDFC Bank Ltd 3.87%National Thermal Power Corporation Ltd 3.29%Reliance Ports and Terminals Ltd 3.11%IOT Utkal Energy Services Limited 2.55%Bajaj Finance Ltd 2.39%Power Finance Corporation Ltd 2.14%Others 3.59%
Total 39.75%
Government Securities % to Fund8.83% GOI Mat 25-Nov-2023 2.42%8.08% GOI Mat 02-Aug-2022 0.23%7.16% GOI Mat 20-May-2023 0.11%8.15% GOI Mat 11-Jun-2022 0.09%8.20% GOI Mat 15-Feb-2022 0.05%
Total 2.91%
Deposits, Money Mkt Securities and Net Current Assets. 2.57%
Grand Total 100.00%
Debt ParametersPortfolio Yield (%) 7.26%Avg Maturity (In Months) 108.52Modified Duration (In Years) 6.43
13.56%Others
12.56%1.60%
44.81% 41.03%
0.00%10.00%20.00%30.00%40.00%50.00%60.00%70.00%80.00%90.00%
100.00%
0 - 1 Yr 1 - 3 Yrs 3 - 10 Yrs Above 10 Yrs
Debt Maturity Profile
Sovereign 6.82%
AAA 89.44%
AA+ 1.64% AA & below 2.11%
Debt Rating Profile

AUM (` in Lakhs)SFIN Code : ULIF05301/08/13EquityPlus101 Equity Debt MMI & Others TotalInception Date : 24 Jun 2014 1,393.41 0.11 229.94 1,623.46NAV : 11.3604
Fund V/s Benchmark Performance Equity Fund Debt Fund Balanced FundPeriod Returns (%) Benchmark Returns (%)# Mr Shailesh Dhamankar 3 - 10Inception 5.01% 4.78%5 Years N/A N/A Asset Category F&U Mandate3 Years N/A N/A Money Market Insts2 Years -0.74% -1.42% Public Deposits1 Year 14.93% 13.19% Govt. Securities6 Months 1.38% -0.89% Corporate Bonds1 Month 4.70% 4.59% Equity 80% to 100%
# Nifty 50 Net Current Assets -Note: Returns over 1 year have been annualized.
Portfolio
Equity % to FundITC Ltd. 6.91%HDFC Bank Ltd 6.35%Reliance Industries Ltd. 5.02%ICICI Bank Ltd 4.19%Infosys Ltd 3.68%Tata Motors Limited 3.36%Larsen & Toubro Limited. 3.06%Maruti Suzuki India Ltd 2.98%Kotak Mahindra Bank Limited. 2.76%State Bank of India. 2.31%Others 45.21%
0% to 20% 14.15%
0% to 20% 0.01%
85.83%0.01%
Equity Plus Fund as on January 31, 2017Fund Objective : To generate long term capital appreciation in line or better than Nifty index returns.
Fund ManagerNo. Of Funds Managed
% of Actual
28.27%
21.84%
9.73%
7.68%
6.92%
6.91%
6.25%
4.03%
3.06%
2.71%
2.60%
Others
Financial Service Activities
Mfg of Motor Vehicles
Computer Programming
Mfg of Coke &Refined Petroleum
Mfg of Tobacco Products
Mfg of Pharmaceuticals
Mfg of Chemical Products
Civil Engineering
Mfg of Other Transport Equip.
Electricity,Gas & AC Supply
Sector Allocation as per NIC 2008% to Fund
Total 85.83%
Debentures / Bonds % to FundNational Thermal Power Corporation Ltd 0.01%
Total 0.01%
Deposits, Money Mkt Securities and Net Current Assets. 14.16%
Grand Total 100.00%
Debt ParametersPortfolio Yield (%) 6.08%Avg Maturity (In Months) 0.08Modified Duration (In Years) 0.01
99.95%
0.05%0.00%10.00%20.00%30.00%40.00%50.00%60.00%70.00%80.00%90.00%
100.00%
0 - 1 Yr 3 - 10 Yrs
Debt Maturity Profile
AAA 100.00%
Debt Rating Profile
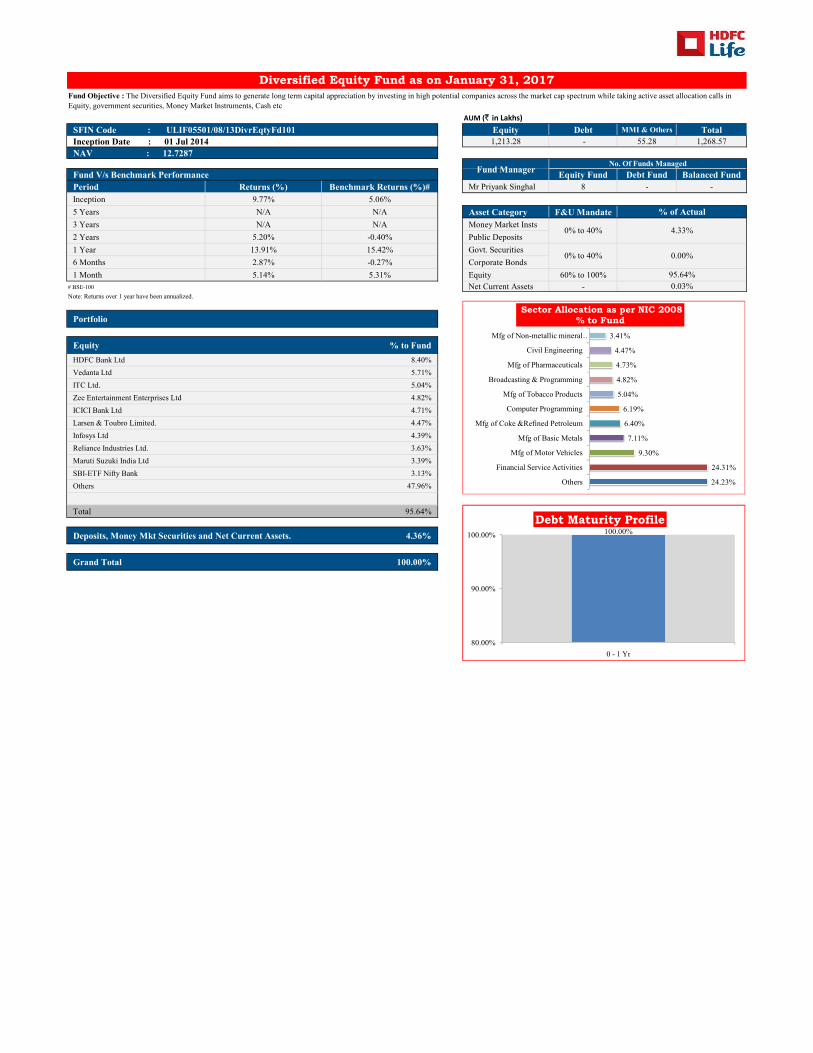
AUM (` in Lakhs)SFIN Code : ULIF05501/08/13DivrEqtyFd101 Equity Debt MMI & Others TotalInception Date : 01 Jul 2014 1,213.28 - 55.28 1,268.57NAV : 12.7287
Fund V/s Benchmark Performance Equity Fund Debt Fund Balanced FundPeriod Returns (%) Benchmark Returns (%)# Mr Priyank Singhal 8 - - Inception 9.77% 5.06%5 Years N/A N/A Asset Category F&U Mandate3 Years N/A N/A Money Market Insts2 Years 5.20% -0.40% Public Deposits1 Year 13.91% 15.42% Govt. Securities6 Months 2.87% -0.27% Corporate Bonds1 Month 5.14% 5.31% Equity 60% to 100%
# BSE-100 Net Current Assets -Note: Returns over 1 year have been annualized.
Portfolio
Equity % to FundHDFC Bank Ltd 8.40%Vedanta Ltd 5.71%ITC Ltd. 5.04%Zee Entertainment Enterprises Ltd 4.82%ICICI Bank Ltd 4.71%Larsen & Toubro Limited. 4.47%Infosys Ltd 4.39%Reliance Industries Ltd. 3.63%Maruti Suzuki India Ltd 3.39%SBI-ETF Nifty Bank 3.13%Others 47.96%
0% to 40% 4.33%
0% to 40% 0.00%
95.64%0.03%
Diversified Equity Fund as on January 31, 2017Fund Objective : The Diversified Equity Fund aims to generate long term capital appreciation by investing in high potential companies across the market cap spectrum while taking active asset allocation calls in Equity, government securities, Money Market Instruments, Cash etc
Fund ManagerNo. Of Funds Managed
% of Actual
24.23%
24.31%
9.30%
7.11%
6.40%
6.19%
5.04%
4.82%
4.73%
4.47%
3.41%
Others
Financial Service Activities
Mfg of Motor Vehicles
Mfg of Basic Metals
Mfg of Coke &Refined Petroleum
Computer Programming
Mfg of Tobacco Products
Broadcasting & Programming
Mfg of Pharmaceuticals
Civil Engineering
Mfg of Non-metallic mineral …
Sector Allocation as per NIC 2008% to Fund
Total 95.64%
Deposits, Money Mkt Securities and Net Current Assets. 4.36%
Grand Total 100.00%
100.00%
80.00%
90.00%
100.00%
0 - 1 Yr
Debt Maturity Profile
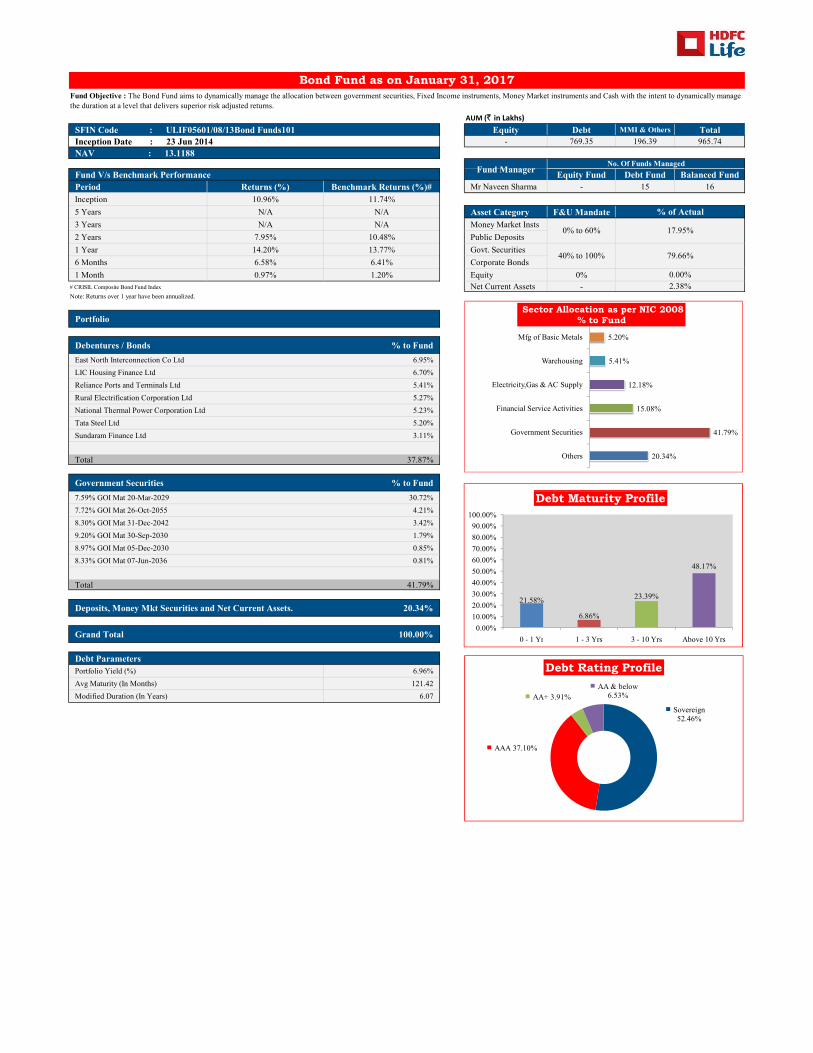
AUM (` in Lakhs)SFIN Code : ULIF05601/08/13Bond Funds101 Equity Debt MMI & Others TotalInception Date : 23 Jun 2014 - 769.35 196.39 965.74NAV : 13.1188
Fund V/s Benchmark Performance Equity Fund Debt Fund Balanced FundPeriod Returns (%) Benchmark Returns (%)# Mr Naveen Sharma - 15 16Inception 10.96% 11.74%5 Years N/A N/A Asset Category F&U Mandate3 Years N/A N/A Money Market Insts2 Years 7.95% 10.48% Public Deposits1 Year 14.20% 13.77% Govt. Securities6 Months 6.58% 6.41% Corporate Bonds1 Month 0.97% 1.20% Equity 0%
# CRISIL Composite Bond Fund Index Net Current Assets -Note: Returns over 1 year have been annualized.
Portfolio
Debentures / Bonds % to FundEast North Interconnection Co Ltd 6.95%LIC Housing Finance Ltd 6.70%Reliance Ports and Terminals Ltd 5.41%Rural Electrification Corporation Ltd 5.27%National Thermal Power Corporation Ltd 5.23%Tata Steel Ltd 5.20%Sundaram Finance Ltd 3.11%
Total 37.87%
Government Securities % to Fund
0% to 60% 17.95%
40% to 100% 79.66%
0.00%2.38%
Bond Fund as on January 31, 2017Fund Objective : The Bond Fund aims to dynamically manage the allocation between government securities, Fixed Income instruments, Money Market instruments and Cash with the intent to dynamically manage the duration at a level that delivers superior risk adjusted returns.
Fund ManagerNo. Of Funds Managed
% of Actual
20.34%
41.79%
15.08%
12.18%
5.41%
5.20%
Others
Government Securities
Financial Service Activities
Electricity,Gas & AC Supply
Warehousing
Mfg of Basic Metals
Sector Allocation as per NIC 2008% to Fund
7.59% GOI Mat 20-Mar-2029 30.72%7.72% GOI Mat 26-Oct-2055 4.21%8.30% GOI Mat 31-Dec-2042 3.42%9.20% GOI Mat 30-Sep-2030 1.79%8.97% GOI Mat 05-Dec-2030 0.85%8.33% GOI Mat 07-Jun-2036 0.81%
Total 41.79%
Deposits, Money Mkt Securities and Net Current Assets. 20.34%
Grand Total 100.00%
Debt ParametersPortfolio Yield (%) 6.96%Avg Maturity (In Months) 121.42Modified Duration (In Years) 6.07
21.58%
6.86%
23.39%
48.17%
0.00%10.00%20.00%30.00%40.00%50.00%60.00%70.00%80.00%90.00%
100.00%
0 - 1 Yr 1 - 3 Yrs 3 - 10 Yrs Above 10 Yrs
Debt Maturity Profile
Sovereign 52.46%
AAA 37.10%
AA+ 3.91%AA & below
6.53%
Debt Rating Profile

AUM (` in Lakhs)SFIN Code : ULIF05801/08/13ConsertvFd101 Equity Debt MMI & Others TotalInception Date : 11 Jul 2014 - 157.58 149.94 307.52NAV : 12.5677
Fund V/s Benchmark Performance Equity Fund Debt Fund Balanced FundPeriod Returns (%) Benchmark Returns (%)# Mr Naveen Sharma - 15 16Inception 9.33% 9.55%5 Years N/A N/A Asset Category F&U Mandate3 Years N/A N/A Money Market Insts2 Years 7.90% 9.18% Public Deposits1 Year 9.52% 10.22% Govt. Securities6 Months 4.22% 4.73% Corporate Bonds1 Month 0.47% 0.82% Equity 0%
# CRISIL Short Term Bond Fund Index Net Current Assets -Note: Returns over 1 year have been annualized.
Portfolio
Debentures / Bonds % to FundHousing Development Finance Corporation Ltd 6.60%Power Grid Corporation of India Ltd 4.40%IDFC Bank Ltd 3.42%Rural Electrification Corporation Ltd 3.42%Power Finance Corporation Ltd 3.29%
Total 21.12%
Government Securities % to Fund8.15% GOI Mat 24-Nov-2026 24.89%8.15% GOI Mat 11-Jun-2022 4.46%
0% to 60% 47.47%
40% to 100% 51.24%
0.00%1.29%
Conservative Fund as on January 31, 2017Fund Objective : The Conservative Fund is a pure Debt Fund which invests in Government securities, high grade Fixed Income Instruments, Liquid Mutual Fund and Money Market Instruments. The fund aims to deliver stable returns by investing in the short end of the yield curve to limit the volatility and risk of the Fund.
Fund ManagerNo. Of Funds Managed
% of Actual
48.76%
30.12%
16.73%
4.40%
Others
Government Securities
Financial Service Activities
Electricity,Gas & AC Supply
Sector Allocation as per NIC 2008% to Fund
100 00%
Debt Maturity Profile
8.12% GOI Mat 10-Dec-2020 0.64%8.20% GOI Mat 15-Feb-2022 0.14%
Total 30.12%
Deposits, Money Mkt Securities and Net Current Assets. 48.76%
Grand Total 100.00%
Debt ParametersPortfolio Yield (%) 6.44%Avg Maturity (In Months) 37.69Modified Duration (In Years) 2.25
58.11%
3.46%
38.43%
0.00%10.00%20.00%30.00%40.00%50.00%60.00%70.00%80.00%90.00%
100.00%
0 - 1 Yr 1 - 3 Yrs 3 - 10 Yrs
Sovereign 58.78%
AAA 41.22%
Debt Rating Profile
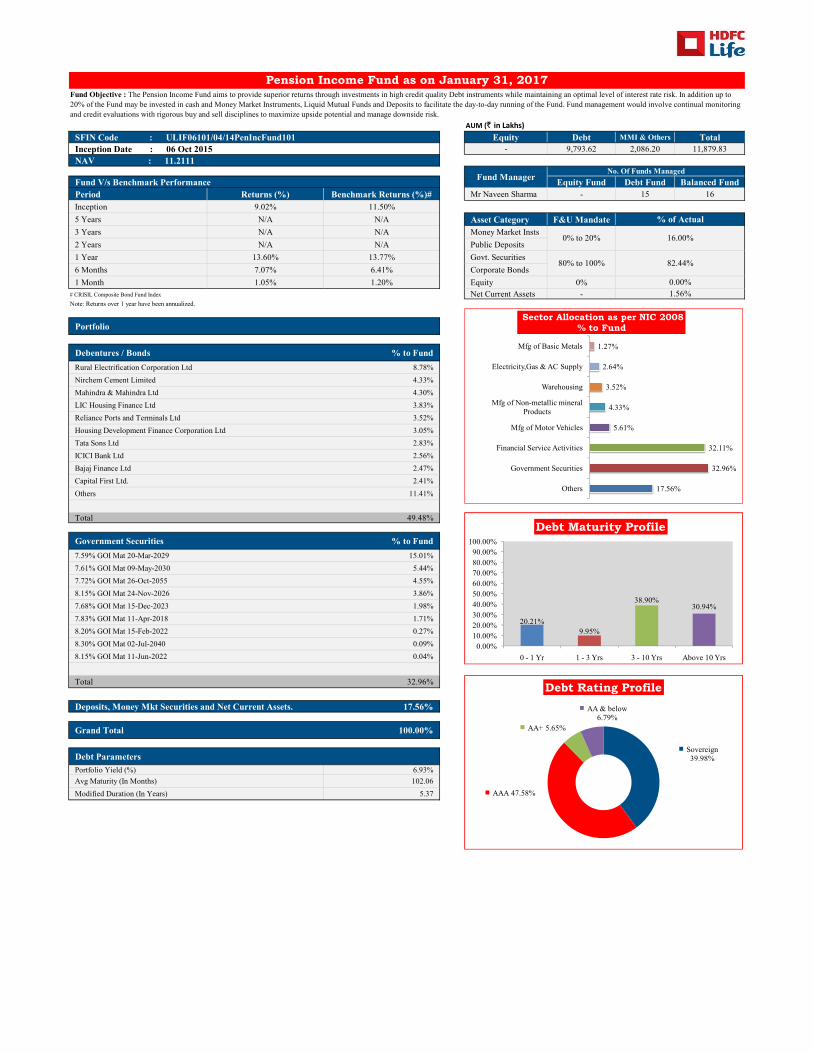
AUM (` in Lakhs)SFIN Code : ULIF06101/04/14PenIncFund101 Equity Debt MMI & Others TotalInception Date : 06 Oct 2015 - 9,793.62 2,086.20 11,879.83NAV : 11.2111
Fund V/s Benchmark Performance Equity Fund Debt Fund Balanced FundPeriod Returns (%) Benchmark Returns (%)# Mr Naveen Sharma - 15 16Inception 9.02% 11.50%5 Years N/A N/A Asset Category F&U Mandate3 Years N/A N/A Money Market Insts2 Years N/A N/A Public Deposits1 Year 13.60% 13.77% Govt. Securities6 Months 7.07% 6.41% Corporate Bonds1 Month 1.05% 1.20% Equity 0%
# CRISIL Composite Bond Fund Index Net Current Assets -Note: Returns over 1 year have been annualized.
Portfolio
Debentures / Bonds % to FundRural Electrification Corporation Ltd 8.78%Nirchem Cement Limited 4.33%Mahindra & Mahindra Ltd 4.30%LIC Housing Finance Ltd 3.83%Reliance Ports and Terminals Ltd 3.52%Housing Development Finance Corporation Ltd 3.05%Tata Sons Ltd 2.83%ICICI Bank Ltd 2.56%Bajaj Finance Ltd 2.47%Capital First Ltd. 2.41%Oth 11 41%
0% to 20% 16.00%
80% to 100% 82.44%
0.00%1.56%
Pension Income Fund as on January 31, 2017Fund Objective : The Pension Income Fund aims to provide superior returns through investments in high credit quality Debt instruments while maintaining an optimal level of interest rate risk. In addition up to 20% of the Fund may be invested in cash and Money Market Instruments, Liquid Mutual Funds and Deposits to facilitate the day-to-day running of the Fund. Fund management would involve continual monitoring and credit evaluations with rigorous buy and sell disciplines to maximize upside potential and manage downside risk.
Fund ManagerNo. Of Funds Managed
% of Actual
17.56%
32.96%
32.11%
5.61%
4.33%
3.52%
2.64%
1.27%
Others
Government Securities
Financial Service Activities
Mfg of Motor Vehicles
Mfg of Non-metallic mineral Products
Warehousing
Electricity,Gas & AC Supply
Mfg of Basic Metals
Sector Allocation as per NIC 2008% to Fund
Others 11.41%
Total 49.48%
Government Securities % to Fund7.59% GOI Mat 20-Mar-2029 15.01%7.61% GOI Mat 09-May-2030 5.44%7.72% GOI Mat 26-Oct-2055 4.55%8.15% GOI Mat 24-Nov-2026 3.86%7.68% GOI Mat 15-Dec-2023 1.98%7.83% GOI Mat 11-Apr-2018 1.71%8.20% GOI Mat 15-Feb-2022 0.27%8.30% GOI Mat 02-Jul-2040 0.09%8.15% GOI Mat 11-Jun-2022 0.04%
Total 32.96%
Deposits, Money Mkt Securities and Net Current Assets. 17.56%
Grand Total 100.00%
Debt ParametersPortfolio Yield (%) 6.93%Avg Maturity (In Months) 102.06Modified Duration (In Years) 5.37
20.21%9.95%
38.90%30.94%
0.00%10.00%20.00%30.00%40.00%50.00%60.00%70.00%80.00%90.00%
100.00%
0 - 1 Yr 1 - 3 Yrs 3 - 10 Yrs Above 10 Yrs
Debt Maturity Profile
Sovereign 39.98%
AAA 47.58%
AA+ 5.65%
AA & below 6.79%
Debt Rating Profile
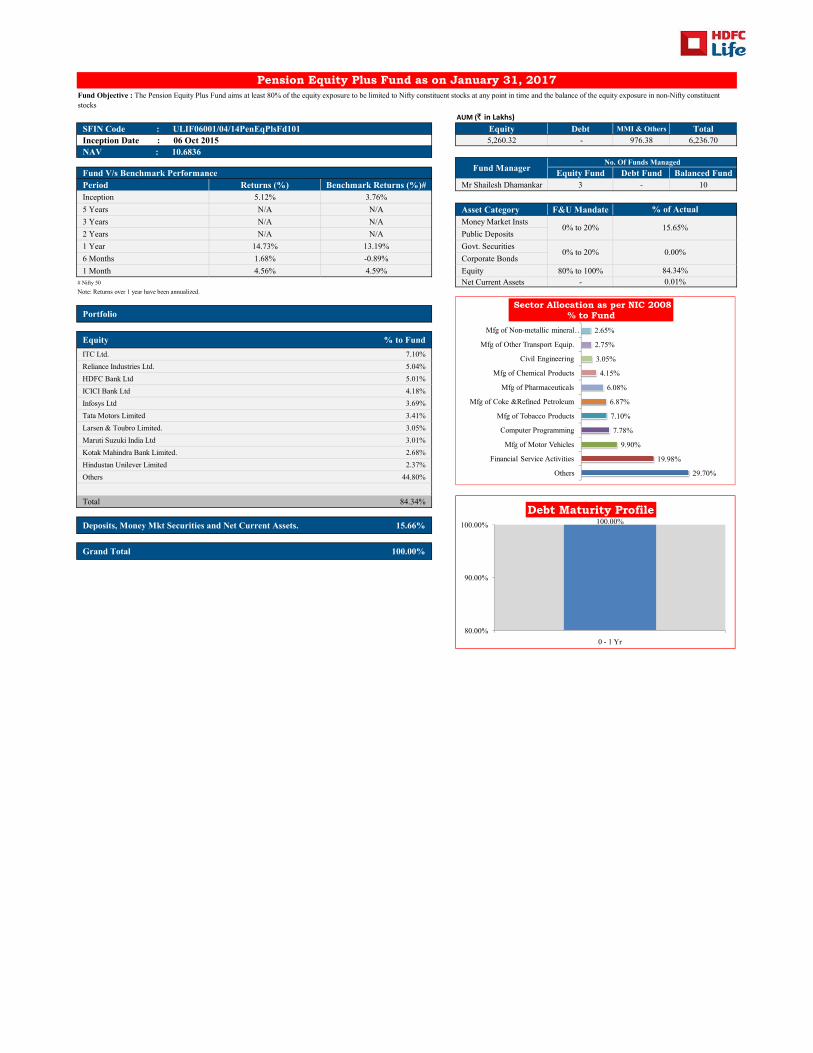
AUM (` in Lakhs)SFIN Code : ULIF06001/04/14PenEqPlsFd101 Equity Debt MMI & Others TotalInception Date : 06 Oct 2015 5,260.32 - 976.38 6,236.70NAV : 10.6836
Fund V/s Benchmark Performance Equity Fund Debt Fund Balanced FundPeriod Returns (%) Benchmark Returns (%)# Mr Shailesh Dhamankar 3 - 10Inception 5.12% 3.76%5 Years N/A N/A Asset Category F&U Mandate3 Years N/A N/A Money Market Insts2 Years N/A N/A Public Deposits1 Year 14.73% 13.19% Govt. Securities6 Months 1.68% -0.89% Corporate Bonds1 Month 4.56% 4.59% Equity 80% to 100%
# Nifty 50 Net Current Assets -Note: Returns over 1 year have been annualized.
Portfolio
Equity % to FundITC Ltd. 7.10%Reliance Industries Ltd. 5.04%HDFC Bank Ltd 5.01%ICICI Bank Ltd 4.18%Infosys Ltd 3.69%Tata Motors Limited 3.41%Larsen & Toubro Limited. 3.05%Maruti Suzuki India Ltd 3.01%Kotak Mahindra Bank Limited. 2.68%Hindustan Unilever Limited 2.37%Others 44.80%
0% to 20% 15.65%
0% to 20% 0.00%
84.34%0.01%
Pension Equity Plus Fund as on January 31, 2017Fund Objective : The Pension Equity Plus Fund aims at least 80% of the equity exposure to be limited to Nifty constituent stocks at any point in time and the balance of the equity exposure in non-Nifty constituent stocks
Fund ManagerNo. Of Funds Managed
% of Actual
29.70%
19.98%
9.90%
7.78%
7.10%
6.87%
6.08%
4.15%
3.05%
2.75%
2.65%
Others
Financial Service Activities
Mfg of Motor Vehicles
Computer Programming
Mfg of Tobacco Products
Mfg of Coke &Refined Petroleum
Mfg of Pharmaceuticals
Mfg of Chemical Products
Civil Engineering
Mfg of Other Transport Equip.
Mfg of Non-metallic mineral …
Sector Allocation as per NIC 2008% to Fund
Total 84.34%
Deposits, Money Mkt Securities and Net Current Assets. 15.66%
Grand Total 100.00%
100.00%
80.00%
90.00%
100.00%
0 - 1 Yr
Debt Maturity Profile

AUM (` in Lakhs)SFIN Code : ULIF06301/04/15CapGrwthFd101 Equity Debt MMI & Others TotalInception Date : 21 Oct 2016 442.26 - 97.51 539.77NAV : 10.2713
Fund V/s Benchmark Performance Equity Fund Debt Fund Balanced FundPeriod Returns (%) Benchmark Returns (%)# Mr Priyank Singhal 8 - - Inception 2.71% -1.77%5 Years N/A N/A Asset Category F&U Mandate3 Years N/A N/A Money Market Insts2 Years N/A N/A Public Deposits1 Year N/A N/A Govt. Securities6 Months N/A N/A Corporate Bonds1 Month 4.89% 5.31% Equity 80% to 100%
# BSE-100 Net Current Assets -Note: Returns over 1 year have been annualized.
Portfolio
Equity % to FundHDFC Bank Ltd 6.99%Vedanta Ltd 6.59%ITC Ltd. 5.28%ICICI Bank Ltd 4.84%Zee Entertainment Enterprises Ltd 4.74%Infosys Ltd 3.86%DB Corp Ltd 3.58%Larsen & Toubro Limited. 3.56%Kotak Mahindra Bank Limited. 3.03%State Bank of India. 2.56%Others 36.90%
0% to 20% 18.02%
0% to 20% 0.00%
81.93%0.05%
Capital Growth Fund as on January 31, 2017Fund Objective : To generate long term capital appreciation through investments in companies, money market instruments and fixed income securities
Fund ManagerNo. Of Funds Managed
% of Actual
33.69%
21.05%
7.56%
6.39%
5.28%
5.10%
4.74%
4.42%
4.15%
4.03%
3.59%
Others
Financial Service Activities
Mfg of Basic Metals
Mfg of Motor Vehicles
Mfg of Tobacco Products
Computer Programming
Broadcasting & Programming
Mfg of Coke &Refined Petroleum
Publishing Activities
Mfg of Pharmaceuticals
Other Financial Activities
Sector Allocation as per NIC 2008% to Fund
Total 81.93%
Deposits, Money Mkt Securities and Net Current Assets. 18.07%
Grand Total 100.00%
100.00%
80.00%
90.00%
100.00%
0 - 1 Yr
Debt Maturity Profile

AUM (` in Lakhs)SFIN Code : ULIF06401/04/15CapSecFund101 Equity Debt MMI & Others TotalInception Date : 21 Oct 2016 - 388.93 46.46 435.39NAV : 10.2854
Fund V/s Benchmark Performance Equity Fund Debt Fund Balanced FundPeriod Returns (%) Benchmark Returns (%)# Mr Badrish Kulhalli - 13 4Inception 2.85% 2.98%5 Years N/A N/A Asset Category F&U Mandate3 Years N/A N/A Money Market Insts2 Years N/A N/A Public Deposits1 Year N/A N/A Govt. Securities6 Months N/A N/A Corporate Bonds1 Month 0.91% 1.20% Equity 0%
# CRISIL Composite Bond Fund Index Net Current Assets -Note: Returns over 1 year have been annualized.
Portfolio
Government Securities % to Fund7.80% GOI Mat 11-Apr-2021 15.89%7.61% GOI Mat 09-May-2030 13.85%7.49% GOI Mat 16-Apr-2017 13.82%8.40% GOI Mat 28-Jul-2024 12.57%8.79% GOI Mat 08-Nov-2021 10.02%8.32% GOI Mat 02-Aug-2032 9.51%8.17% GOI Mat 01-Dec-2044 7.70%7.72% GOI Mat 25-May-2025 5.49%7.59% GOI Mat 11-Jan-2026 0.49%
Total 89.33%
0% to 20% 9.07%
80% to 100% 89.33%
0.00%1.60%
Capital Secure Fund as on January 31, 2017Fund Objective : Higher potential returns due to higher duration and credit exposure
Fund ManagerNo. Of Funds Managed
% of Actual
10.67%
89.33%
Others
Government Securities
Sector Allocation as per NIC 2008% to Fund
70 00%
80.00%
90.00%
100.00%
Debt Maturity Profile
Deposits, Money Mkt Securities and Net Current Assets. 10.67%
Grand Total 100.00%
Debt ParametersPortfolio Yield (%) 6.59%Avg Maturity (In Months) 98.46Modified Duration (In Years) 4.99
23.26%
45.18%
31.56%
0.00%
10.00%
20.00%
30.00%
40.00%
50.00%
60.00%
70.00%
0 - 1 Yr 3 - 10 Yrs Above 10 Yrs
Sovereign 100.00%
Debt Rating Profile

AUM (` in Lakhs)SFIN Code : ULIF05110/03/11DiscontdPF101 Equity Debt MMI & Others TotalInception Date : 10 Mar 2011 - 262,471.02 11,408.23 273,879.26NAV : 15.7074
Fund V/s Benchmark Performance Equity Fund Debt Fund Balanced FundPeriod Returns (%) Benchmark Returns (%)# Mr Kailash Lalwani - 12 11Inception 7.95% N/A5 Years 7.98% N/A Asset Category F&U Mandate3 Years 7.89% N/A Money Market Insts 0% to 40%2 Years 7.30% N/A Public Deposits 0%1 Year 6.94% N/A Govt. Sec (Including Tbills) 60% to 100%6 Months 3.31% N/A Corporate Bonds1 Month 0.52% N/A Equity
# NA Net Current Assets -Note: Returns over 1 year have been annualized.
Portfolio
Government Securities % to Fund7.49% GOI Mat 16-Apr-2017 42.12%7.99% GOI Mat 09-Jul-2017 35.24%8.07% GOI Mat 03-Jul-2017 10.72%91 Days Tbill Mat 16-Mar-2017 5.53%7.83% GOI Mat 11-Apr-2018 1.25%182 Day T-Bill Mat 29-June-2017 0.89%7.46% GOI Mat 28-Aug-2017 0.08%
Total 95.83%
Deposits, Money Mkt Securities and Net Current Assets. 4.17%
Grand Total 100.00%
Policy Discontinued Fund - Life as on January 31, 2017Fund Objective : The Fund aims to deliver steady returns through investments in low risk Money Market instruments and Government securities.
Fund ManagerNo. Of Funds Managed
% of Actual2.98%0.00%
95.83%
0% 0.00%
1.19%
2.05%
95.83%
2.12%
Others
Government Securities
Financial Service Activities
Sector Allocation as per NIC 2008% to Fund
98.73%
70.00%80.00%90.00%
100.00%
Debt Maturity Profile
Debt ParametersPortfolio Yield (%) 6.16%Avg Maturity (In Months) 3.91Modified Duration (In Years) 0.32
1.27%0.00%
10.00%20.00%30.00%40.00%50.00%60.00%
0 - 1 Yr 1 - 3 Yrs
Sovereign 97.84%
AAA 2.16%
Debt Rating Profile

AUM (` in Lakhs)SFIN Code : ULIF05201/10/13DiscontdPF101 Equity Debt MMI & Others TotalInception Date : 01 Oct 2013 - 33,544.18 1,042.39 34,586.57NAV : 12.8585
Fund V/s Benchmark Performance Equity Fund Debt Fund Balanced FundPeriod Returns (%) Benchmark Returns (%)# Mr Kailash Lalwani - 12 11Inception 7.83% N/A5 Years N/A N/A Asset Category F&U Mandate3 Years 7.81% N/A Money Market Insts 0% to 40%2 Years 7.23% N/A Public Deposits 0%1 Year 6.88% N/A Govt. Sec (Including Tbills) 60% to 100%6 Months 3.32% N/A Corporate Bonds1 Month 0.52% N/A Equity
# NA Net Current Assets -Note: Returns over 1 year have been annualized.
Portfolio
Government Securities % to Fund7.49% GOI Mat 16-Apr-2017 45.61%7.99% GOI Mat 09-Jul-2017 15.19%91 Days Tbill Mat 16-Mar-2017 12.14%8.07% GOI Mat 03-Jul-2017 9.38%7.83% GOI Mat 11-Apr-2018 7.39%7.46% GOI Mat 28-Aug-2017 7.28%
Total 96.99%
Deposits, Money Mkt Securities and Net Current Assets. 3.01%
Grand Total 100.00%
Policy Discontinued Fund - Pension as on January 31, 2017Fund Objective : The Fund aims to deliver steady returns through investments in low risk Money Market instruments and Government securities.
Fund ManagerNo. Of Funds Managed
% of Actual1.48%0.00%
96.99%
0% 0.00%
1.53%
1.78%
96.99%
1.23%
Others
Government Securities
Financial Service Activities
Sector Allocation as per NIC 2008% to Fund
92.50%
60 00%70.00%80.00%90.00%
100.00%
Debt Maturity Profile
Debt ParametersPortfolio Yield (%) 6.18%Avg Maturity (In Months) 4.20Modified Duration (In Years) 0.34
7.50%0.00%
10.00%20.00%30.00%40.00%50.00%60.00%
0 - 1 Yr 1 - 3 Yrs
Sovereign 98.74%
AAA 1.26%
Debt Rating Profile


