

Myanmar's International Trade Competitiveness through the effect of
FDI Comparing with Successful FDI promoted Asia Countries
Dissertation
Presented to
Graduate School of
Humanities and Social Sciences
(Doctor`s Course)
OKAYAMA UNIVERSITY
In Partial Fulfillment
of the Requirements for the Degree of
Doctor of Philosophy in Economics (経済学)
By
KHIN MAR THET
December 2018

i
TABLE Of CONTENTS
Acknowledgement……………………………………………………………… vii-viii
Abbreviations…………………………………………………...……………… ix
Abstract………………………………………………………………………… x-xi
INTRODUCTION
Backgrounds of the Study----------------------------------------------------------------- 1-5
Objectives of the Study and Research Context----------------------------------------- 5-7
Organizational Structure of the Study --------------------------------------------------- 7-8
CHAPTER I: Evolution of Myanmar Trade Structure and Foreign Direct Investment
1.1. Introduction------------------------------------------------------------------------ 9-10
1.2. Historical Background ---------------------------------------------------------- 11-13
1.3. Trade Flow and Structure from 1988 onwards-------------------------------- 13-17
1.3.1 Trade Flow and Structure in Market Oriented Period
1.3.2 Trade Flow in Democratic Government Period (2011-2015)
1.3.3 Trade Flow in Current Public Democratic Government Period (2015 onwards)
1.4. Overview Trade Pattern and Policy-------------------------------------------- 18-27
1.5. Foreign Direct Investment in Myanmar--------------------------------------- 27-33
1.5.1 Background
1.5.2. Recent FDI trends
1.5.3. Future FDI Trends
1.6 Conclusion ------------------------------------------------------------------------- 33-34
CHAPTER II: The Influential Determinants of FDI Inflow in Myanmar
2.1. Introduction----------------------------------------------------------------------- 35-36
2.2. Previous Literature Review---------------------------------------------------- 36-38

ii
2.3. The Current Foreign Direct Investment Situation in Myanmar------------ 38-39
2.4. The influential determinants of the FDI in Myanmar----------------------- 39-48
2.4.1. Myanmar Investment Law
2.4.2. Current Financial sector
2.4.3. Special Economic Zones (SEZs)
2.4.4. Labour Utilization
2.4.5. Infrastructure Development
2.4.6. Tax Exemption
2.4.7. Trade Policy Issue
2.5. Policy Implications--------------------------------------------------------------- 49-50
CHAPTERI III: “Does the Gravity Model of Trade explain Myanmar’s Trade
Structure?”
3.1. Introduction------------------------------------------------------------------------ 51-53
3.2. Theoretical Framework and Previous Literature Perspective--------------- 53-58
3.3. Empirical Methodology --------------------------------------------------------- 58-61
3.4. Data Description------------------------------------------------------------------ 61-65
3.4.1. The ASEAN Dummy
3.4.2. Trade Conformity Index
3.5. Empirical Results, Discussion, and Hypothesis Testing--------------------- 65-79
3.6. Conclusion and Finding --------------------------------------------------------- 80-82
CHAPTER IV: The Effects of Trade Openness and Exchange Rate Volatility on
Foreign Direct Investment of ASEAN and Myanmar
4.1 Introduction-------------------------------------------------------------------------- 83-92
4.1.1 The Relationship between Exports and FDI Net Inflows into Myanmar
4.1.2 Current Exchange rate System -----------------------------------------------
4.1.3. Trade Restrictions, Uncertainty and Sanction Effect ---------------------

iii
4.1.4. Influences on investment in Myanmar-------------------------------------
4.2. Theoretical background of FDI-------------------------------------------------- 92-95
4.3. Empirical Literature--------------------------------------------------------------- 95-99
4.4. Empirical Framework and Model------------------------------------------------ 99-101
4.5. Data Description and Sources of Data------------------------------------------- 101-106
4.6. Results Discussion, Policy implication and Conclusion---------------------- 106-117
4.6.1. The OLS regression estimations -------------------------------------------
4.6.2 The Fixed Effect and Random Effect estimation -------------------------
4.7 Policy Implication and Conclusion----------------------------------------------- 117-118
CONCLUSION
Major contributions and Policy Implication --------------------------------------------- 119-123
Limitations of the study and suggestions for future research -------------------------- 123-124
Bibliography -------------------------------------------------------------------------------- 125-134

iv
List of Tables
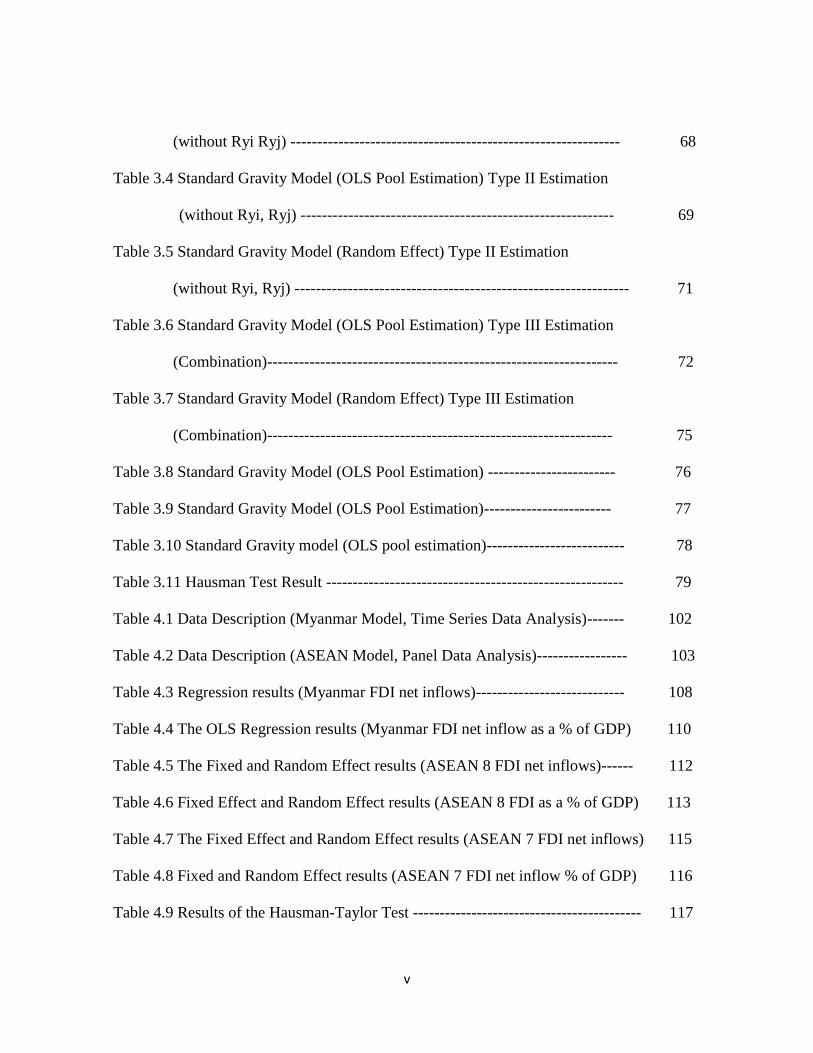
Table 1.1 Composition of Trade (1938-1962)-------------------------------------------- 12
Table 1.2 Myanmar External Trade (2011-12 to 2017-2018 January)---------------- 15
Table 1.3 Myanmar Export Structure (2013-14 to 2017-18 January) ---------------- 15
Table 1.4 Import Structure of Myanmar (2013-14 to 2017-18 January) ------------- 16
Table 1.5 Top Ten Trade Partners (2015-16 to 2018 January) ------------------------ 17
Table 1.6 Evolution of trade policy in Myanmar (1990 onwards)-------------------- 19
Table 1.7 External Trade (1948-49 to 1985-86) ---------------------------------------- 20
Table 1.8 External Trade (1980-2017) --------------------------------------------------- 22
Table 1.9 Permitted Foreign Direct Investment (1988-89 to 2017-18)--------------- 30
Table 1.10 Yearly Approved Amount of Foreign Investment (by Sector) ---------- 31
Table 1.11 Yearly Approved Amount of Foreign Investment (by country) -------- 32
Table 2.1 Thilawa SEZ Investment (by Sector)----------------------------------------- 42
Table 2.2 The Employment Opportunities from Investment Enterprises
(2011-2012 to 2017-2018)-------------------------------------------------------- 44
Table 2.3 List of existing Infrastructure Enterprises under the Foreign Investment
Law----------------------------------------------------------------------------------- 45
Table 3.1 Data description----------------------------------------------------------------- 64
Table 3.2 Standard Gravity Model (OLS Pool Estimation) Type I Estimation
(without Ryi Ryj)-------------------------------------------------------------- 67
Table 3.3 Standard Gravity Model (Random Effect) Type I Estimation
v
(without Ryi Ryj) -------------------------------------------------------------- 68
Table 3.4 Standard Gravity Model (OLS Pool Estimation) Type II Estimation
(without Ryi, Ryj) ----------------------------------------------------------- 69
Table 3.5 Standard Gravity Model (Random Effect) Type II Estimation
(without Ryi, Ryj) --------------------------------------------------------------- 71
Table 3.6 Standard Gravity Model (OLS Pool Estimation) Type III Estimation
(Combination)------------------------------------------------------------------ 72
Table 3.7 Standard Gravity Model (Random Effect) Type III Estimation
(Combination)----------------------------------------------------------------- 75
Table 3.8 Standard Gravity Model (OLS Pool Estimation) ------------------------ 76
Table 3.9 Standard Gravity Model (OLS Pool Estimation)------------------------ 77
Table 3.10 Standard Gravity model (OLS pool estimation)-------------------------- 78
Table 3.11 Hausman Test Result -------------------------------------------------------- 79
Table 4.1 Data Description (Myanmar Model, Time Series Data Analysis)------- 102
Table 4.2 Data Description (ASEAN Model, Panel Data Analysis)----------------- 103
Table 4.3 Regression results (Myanmar FDI net inflows)---------------------------- 108
Table 4.4 The OLS Regression results (Myanmar FDI net inflow as a % of GDP) 110
Table 4.5 The Fixed and Random Effect results (ASEAN 8 FDI net inflows)------ 112
Table 4.6 Fixed Effect and Random Effect results (ASEAN 8 FDI as a % of GDP) 113
Table 4.7 The Fixed Effect and Random Effect results (ASEAN 7 FDI net inflows) 115
Table 4.8 Fixed and Random Effect results (ASEAN 7 FDI net inflow % of GDP) 116
Table 4.9 Results of the Hausman-Taylor Test ------------------------------------------- 117

vi
List of Charts
Figure 1 Exports from ASEAN 10 countries (2000-2017)--------------------------- 2
Figure 2 Imports into 10 ASEAN countries (2000-2017) ---------------------------- 4
Figure 1.1 Myanmar Export (1952-1953 to 1985-1986)-------------------------------- 21
Figure 1.2 Myanmar Exports (1980-2017)------------------------------------------------ 24
Figure 1.3 Myanmar Imports (1980-2017)----------------------------------------------- 25
Figure 1.4 Export Value, Import Value and Trade Balance (2000-2017)------------ 25
Figure 1.5 Myanmar’s Main Trade Partner (2018 - 2018 January) US$ in millions 26
Figure 1.6 Myanmar GDP Growth (Annual %) 1961-2016----------------------------- 27
Figure 1.7 Myanmar FDI, net inflows (% of GDP) 2000-2016------------------------ 28
Figure 1.8 Approved Amount of FDI Inflows into Myanmar (2011-12 to 2017-18) 32
Figure 4.1 The Relationship between Exports and FDI Net Inflows into Myanmar
(1990 -2017)-------------------------------------------------------------------------- 86
Figure 4.2 FDI and Exports share of GDP in Myanmar (1990-2014)----------------- 87
Figure 4.3 Exchange Rate Volatility in Myanmar (1990-2017)----------------------- 89
Figure 4.4 FDI net inflows in ASEAN countries---------------------------------------- 104
Figure 4.5 Trade Openness in ASEAN countries---------------------------------------- 105
Figure 4.6 Exchange Rate Volatility in ASEAN countries---------------------------- 106

vii
Acknowledgement
This dissertation could not have been completed without helping and supporting of many
people. I am incredibly grateful to my advisor Professor Masao Tsuri, for giving the excellent
guidance, kind patient, and strong support with his comprehensive knowledge and persistent
desire for research to be accomplished successfully. Moreover, I would particularly like to
thank my co-supervisors, Professor Kensaku Kishida, Professor Jian Teng, Professor
Masahiro Taguchi, and Hisashi Sawaki for their invaluable guidance and helpful suggestion
throughout this research. I can’t have left to express my special thanks to Professor Dr.
Heather A. Montgomery who taught me a lot of research knowledge and got many research
experiences from her excellent guidance while I studied in International Christian University
in Tokyo, Japan. I ever would like to give my thanks to all Professors who have provided me
with their academic advice and sharp criticisms to keep this study on the right track.
The government of Myanmar, the government of Japan, (Ministry of Education, Culture,
Sports, Science and Technology (MEXT or Monbukagakusho Scholarship), Yangon
University of Economics and Okayama University Graduate School of Humanities and
Social Science have also been a source of support throughout my doctoral study and granting
me a scholarship to make this study possible.
I would like to express my sincere gratitude to all of them. First of all, I would like to
give special thanks to Professor Dr. Phyu Phyu Ei, Head of Department of Applied
Economics, Yangon University of Economics and Professor Dr. Cho Cho Thein, Head of
Department of Economics, Yangon University of Economics for their kind attention and

viii
giving valuable suggestions, excellent guidance to be fruitful accomplishments. I would also
like to give a heartfelt special thanks to Professor Dr. Tun Aung, Rector, Meiktila University
of Economics and Professor Dr. Thida Kyu, Pro-Rector, Meiktila University of Economics
for introducing this great chance to me. I would also like to give a special thanks to Professor
Dr. Htay Htay Lwin, Rector-Retd, Cooperative University for her kind support and
encouragement since I was started as a teaching staff in life. Professor Dr. Kyaw Min Htun,
Pro-Rector (Retd), Yangon University of Economics who ever supported me to recommend
my effort to do further study abroad. I also would like to thanks to Daw Kay Khine Nyein,
Associate Professor, Department of Economics, Meiktila University of Economics who ever
intentionally give me advice and suggestion whenever I need concerns with my research
works.
I would also like to express my enormous gratitude to my parents, all family members
and relatives that I have received strong support and endless encouragement along my
doctoral study life in Japan. I am very grateful to their kind understanding and fruitful support.
I will forever be thankful to all of my former teachers who encouraged and supported me to
be owned bright future along the whole life. Finally, I would like to thank all my colleague,
friends for standing by my side throughout the whole study period and their endless love and
friendship.

ix
Abbreviations
ASEAN Association of Southeast Asian Nations
CBM Central Bank of Myanmar
CIL Citizens' Investment Law
CLM Cambodia, Lao and Myanmar
DICA Directorate of Investment and Company Administration
DOTs Direction of Trade Statistics
EU European Union
ERIA Economic Research Institute for ASEAN and East Asia
FDI Foreign Direct Investment
FIL Foreign Investment Law
GDP Gross Domestic Product
GSP Generalized System of Preferences
IFS IMF International Financial Statistics
ISI Import-Substituting Industrialization strategy
MIL Myanmar Investment Law
MIC Myanmar Investment Commission
NIEs Newly Industrial Economies
NES Myanmar National Export Strategy
OECD Organization for Economic Co-operation and Development
OLS Ordinary Least Square
SEZs Special Economic Zones
SMEs Small and Medium Enterprises
UNCTAD United Nations Conference on Trade and Development
US United States
WTO World Trade Organization

x
Abstract
Trade can promote the development of a country by improving factors such as
technological progress, the importation of technical knowhow, greater access to resources,
the expansion of markets and attracting foreign direct investment (FDI). This study mainly
focuses on how Myanmar’s trade competitiveness can increase through higher foreign direct
investment inflows by comparing Myanmar to other Asian countries with successful FDI
inflows.
When analyzing the main theme, this study is divided into four parts. Firstly, it describes
the evolution of Myanmar’s trade development and foreign direct investment inflows while
explaining historical background conditions, the current situation and recent and possible
future trends of FDI by examining past data.
Secondly, it determines the influential determinants of FDI inflow in Myanmar and
describes the current Myanmar economy. Many different factors affect FDI inflows and it is
believed that FDI contributes to the improvement of an economy by enhancing a nation’s
economic growth.
Thirdly, an analysis of the trade structure between Myanmar and 20 partner countries
estimated with a standard gravity model using panel data. Although GDP and distance
variables can explain Myanmar’s trade structure, an ASEAN dummy cannot explain what
Myanmar still needs to do in cooperation with ASEAN for trade improvement. According to
the Trade Conformity Index (TCI), Myanmar’s trade structure shows that trade volume
increases with falling complementary trade and it has an increasingly competitive trade

xi
structure using differentiated product models with intra-industry trade. The standard gravity
model can explain Myanmar’s trade structure and flow.
The final part of this study explores the impact of trade openness and exchange rate
volatility on foreign direct investment in Myanmar and the eight ASEAN member countries
covered by the dates of this case study (1990-2014).
Some consequences of the previous long-term sanctions imposed by the US and the EU
were that Myanmar could not promote its trade sector and had difficulty attracting foreign
direct investment. Exchange rate volatility was inversely related to FDI inflow due to
Myanmar’s long history of using a de facto multiple exchange rate system. In the analysis of
ASEAN countries, trade openness and the export per GDP ratio were directly related to FDI
inflow as a percentage of GDP and proves that a nation’s free trade policies contribute to
foreign direct investment inflow per GDP. The larger the exchange rate volatility, the greater
the impact on FDI inflow in ASEAN countries can be shown for both explained variables.
The analysis model proves that exchange rate volatility’s impact on FDI inflow is an
appropriate explanation regarding Myanmar’s FDI inflow and also proves that trade
openness affected FDI inflow per GDP in ASEAN countries.

1
INTRODUCTION
Background of the Study
Trade is one influential way towards economic development for countries all over the
world. Moreover, trade played a vital role in the historical development of Third World
countries. Likewise, international trade allows for the efficient allocation of resources and
supports human welfare by applying a division of labor. In addition, trade can promote the
development of the country by improving its technological progress, the importation of
technical knowhow, greater access to resources and an expansion of markets that come from
specialization, encourage strong competition and attract foreign direct investment (FDI). Most
ASEAN countries have achieved outstanding economic progress by partaking in regional
integration. In 1992, Myanmar joined the regional cooperation agreement called the Greater
Mekong Sub Region (GMS) which including China, Thailand, Laos, Cambodia and Vietnam
to raise trade and cross-border investment. Similarly, Myanmar is attempting to strengthen its
economy with membership in the Association of Southeast Asian Nations (ASEAN) and has
chances to utilize its singular geographic position as a link between South and Southeast Asia,
which can offer new opportunities. As ASEAN is among the fastest growing economies in
the world, stronger integration between member countries will allow ASEAN to continue to
out-perform the rest of the global economy.
Since the Democratic government took power and changed many administrative systems
in the country, Myanmar has a chance to create new economic opportunities through trade
sector openness, encouraging foreign direct investment and moderating its financial sector

2
properly. Myanmar’s long-time policy of self-reliance allowed the country to survive in
isolation for many decades without taking much support from the world economy or regional
communities. Many economic reforms have been made in the trade sector and other essential
sectors. As a market economy, the foreign trade policy of Myanmar is mainly a self-
determining one and has remained at the center of debate on the economic policies
implemented in Myanmar. Nevertheless, transforming to an open-door policy and its related
trade growth are the most powerful forces to strengthen Myanmar’s economy. With this
favorable situation, Myanmar may develop its trade sector development by setting up
appropriate trade policies accompanied by the utilization of domestic natural resources and
human resources.
Figure 1 Exports from ASEAN 10 countries (2000-2017)
Source: IMF: International Financial Statistics (IFS)
0.00
50,000.00
100,000.00
150,000.00
200,000.00
250,000.00
300,000.00
350,000.00
400,000.00
450,000.00
500,000.00
Ex
port
s ($
mil
s)
Year
10 ASEAN countries Exports (2000-2017)
Brunei Cambodia Indonesia Laos Malaysia
Myanmar Philippines Singapore Thailand Vietnam
3
Among the exports from 10 ASEAN countries (2000-2017), Singapore was the largest
exporter followed by Malaysia, with Thailand in the third position. Indonesia, Vietnam and
the Philippines followed in relative positions. All of these countries experienced a substantial
increase in export value since 2001 with slight changes during this period. In addition, after
international financial crisis in 2008, exports decreased in nearly all of these countries and
from 2016 to 2017 their exports also increased. Myanmar, Cambodia, Laos and Brunei had
far lower export totals without a substantial difference between them. (Fig. 1)
Many different factors affect the volume and distribution of FDI in developing countries
around the world. Many researchers have found that the primary determinants of major FDI
inflows including political stability, favorable policies regarding tax and subsidies, the
existence of an appropriate business environment, better administrative procedures and low
level of corruption. Since globalization, the world economy is more characterized by
increased integration and ties with between countries in which Foreign Direct Investment
(FDI) constitutes a business phenomenon of vital importance and frequency. Likewise, it is
believed that FDI contributes to the improvement of macroeconomic outcomes of the host
countries, and from there it can enhance a nation’s economic growth.
When checking the imports of 10 ASEAN countries (2000-2017), Singapore is also in
the highest position with Thailand following in second position and Malaysia third. Indonesia,
Vietnam and the Philippines followed in relative positions. Like the above-mentioned export
values, these countries had a substantial increase in import values since 2001 with slight
changes during the period. However, in 2009, after the 2008 international financial crisis,
imports decreased substantially and increased later in the period. Myanmar, Cambodia, Laos

4
and Brunei had the lowest import values without a substantial difference between them
although there was a small increase later in the period. (Fig. 2)
Figure 2 Imports into 10 ASEAN countries (2000-2017)
Source: IMF: International Financial Statistics (IFS)
Myanmar has a significant probability to promote its economic development based on an
FDI export-oriented driven growth strategy through East Asia's production networks such as
that adopted by Vietnam in the past two decades. Likewise, FDI is a critical element for the
development of Myanmar in the future, considering that the most advanced ASEAN countries,
plus countries such as Malaysia, Thailand and China that have shown good economic
performances after receiving large amounts of FDI. On the other hand, these countries have
deregulated FDI policies and have demonstrated outstanding accomplishment in attracting
FDI.
0.00
50,000.00
100,000.00
150,000.00
200,000.00
250,000.00
300,000.00
350,000.00
400,000.00
Import
s ($
mil
s)
Year
10 ASEAN countries Imports (2000-2017)
Brunei Cambodia Indonesia Laos Malaysia
Myanmar Philippines Singapore Thailand Vietnam

5
Like other Asian countries including China, Bangladesh, Cambodia, and Vietnam,
Special Economic Zones (SEZs) in Myanmar have played an essential role in jumpstarting
manufacturing activity to attract FDI (IMF Country Report, 2018). Like China and Vietnam,
Myanmar has the comparative advantage of lower labor cost. FDI has played a central role in
transforming Vietnam from a country exporting mainly commodities to one exporting a
diversified set of products. Vietnam also took some practical steps while experiencing a string
of success in various aspect of FDI promotion and has carried out measures to attract FDI in
line with deepening integration into the regional and world economies. Following their
example, Myanmar has also gained considerable trade competitiveness in attracting FDI in
export-oriented labor-intensive sectors.
Objectives of the Study and Research Context
This research aims to achieve four primary objectives:
Firstly, the objective of this study was to investigate the evolution of Myanmar’s trade
sector and foreign direct investment inflows into Myanmar by showing both the historical
background conditions and the current situation. This historical description will weigh factors
for improving the process and draw out some hindering conditions for the improvement of
trade and FDI in Myanmar.
Secondly, this paper points out the influential determinants of FDI inflow in Myanmar
by showing the current situation of Myanmar’s economy as a case study. Many researchers
have described the primary determinants of major FDI inflows. Since globalization, the world
economy is more characterized by increasing integration and ties between countries in which

6
FDI constitutes a business phenomenon of vital importance and frequency. Likewise, many
different factors affect the volume and distribution of FDI in developing countries of the world
and it is believed that FDI contributes to the improvement of macroeconomic outcomes of the
host countries and enhances a nation’s economic growth.
Thirdly, this study intends to assess Myanmar’s trade potential and complementary trade
in the future by empirically investigating its trade flows by comparing them with trading
partner countries. It seeks to draw out the strengths and weaknesses of Myanmar’s trade
competitiveness by analysing bilateral trade partner countries by using the trade conformity
index (TCI).
Finally, this paper endeavors to make a comparison and find the determinants of FDI by
comparing Myanmar with Asian countries that have successfully promoted FDI and trade
impacts on FDI. In analyzing the impacts of FDI on key economic variables, this research
seeks to prove the impact of trade openness, exchange rate volatility and other economic
variables on FDI inflow by focusing on seven ASEAN countries (excluding Singapore, Brunei,
and Timor-Leste and Myanmar) by using the panel data analysis of fixed effect and random
effect model estimation and a Hausman test to check whether REM is appropriate or not. It
intends to find the proper techniques and means for FDI promotion in Myanmar using OLS
estimation. It also attempts to highlight appropriate ways and methods for trade sector
development through FDI promotion in Myanmar. Finally, it seeks to point out the negative
and positive effects of FDI, along with future trends in FDI and trade potential that Myanmar
will face in the coming future.
This research seeks to answer the following research questions:

7
1. What are the influential factors on Myanmar’s trade structures, flows and patterns?
2. What are the influential determinants of FDI inflows to Myanmar?
3. Does the gravity model of trade explains Myanmar’s trade structure and trade pattern
using the trade conformity index?
4. How can trade openness, exchange rate volatility and key economic variables impact
FDI inflow to Myanmar and other ASEAN countries?
Organizational Structure of the Study
This study is organized into six parts:
First, an introduction to the background of the study, the objectivities of the research, the
context of the study and the organizational structure of the study.
Chapter 1 summarizes the evolution of Myanmar’s trade structure and foreign direct
investment with explanations of the historical background of trade and FDI, the evolution of
trade structures and policies, the relationship between Myanmar’s trade policy and its political
situation, recent and future FDI trends provided by examining data reported in past years.
Chapter 2 is a qualitative analysis of the influential determinants of FDI inflow into
Myanmar using the current economy as a case study. This part of the study is made up of four
sections; exploring some perspectives from previous literature, current FDI trends in
Myanmar, the influential determinants of FDI in Myanmar, and FDI policy implication for
Myanmar.
Chapter 3 investigates the current trade structure and flow in Myanmar using the gravity
model to compare the country with the bilateral trade partners including both Asian and

8
Western countries. This research endeavour is made up of five sections; exploring the
theoretical framework and some perspectives from previous literature, illustrating the
empirical methodology, data description and finally discussing the empirical results and
conclusion of the main findings along with some remarks.
Chapter 4 verifies the effects of trade openness and exchange rate volatility on foreign
direct investment in ASEAN and Myanmar using panel data and time series data analysis.
This chapter of the study contains the following five sections; exploring some perspectives
from previous literature, the theoretical foundation of FDI, illustrating the research
methodology and empirical model, data description and sources of data and finally explaining
the results, including a discussion on policy implications, and the conclusion of the study.
Finally, there is a summary highlighting how and what this study can contribute to Myanmar
and other ASEAN countries’ FDI and trade improvement. As for policy implications, weaknesses
and strong points are described along with some of the limitations of the study with some
suggestions for further potential research concerns about foreign direct investment and trade
issues for the future.

9
CHAPTER I
Evolution of Myanmar Trade Structure and Foreign Direct Investment
1.1 Introduction
The objective of this study was to investigate the evolution of Myanmar’s trade sector and
foreign direct investment (FDI) inflows into Myanmar. The qualitative analysis based on
descriptive studies uses secondary data from Myanmar governmental organizations,
international organizations and other relevant publications. This study contains four sections;
exploring the historical background of Myanmar trade structure, explaining trade flow and
structure from 1988 onwards, presenting an overview of trade patterns and policy, and finally
describing foreign direct investment in Myanmar.
Myanmar is located in mainland Southeast Asia and also situated on the dynamic
crossroads linking Southeast Asia, Western China (Yunnan) and the Indian sub-continent.
Myanmar has a potentially vast market and is a sub-regional economic nodal link progressing
towards international integration. At the beginning of the sixteenth century, during the times
of Burmese kings, Myanmar traded with neighboring Southeast Asian countries and exported
mainly rice to European countries (Myan Than (1992), p 6). When the British annexed
Myanmar in 1886, the country adopted a laissez-faire system with free trade. After the
Revolutionary Council took power in 1962, the government introduced an import substitution
industrialization (ISI) policy to encourage foreign investment.
In 1998, under the market-oriented economics system, government liberalized trade and
set three basic categories of trade: trade, transit trade, and border trade (Myat Thein (2004)).

10
Though the government stated that export promotion and import substitutions would be the
main planks of trade policy, export rules and regulations were revised during 1998-99. After
the 2010 election, the democratic government adopted an open-door policy to create more
economic opportunities. At the same time, Myanmar passed trade liberalization and had a
strong desire for free and fair trade with the rest of the world. Myanmar has adopted bilateral
trade policies as well as testing multilateral trading policies in practice. The composition of
both export and import changed after 2010 onwards.
Historically, Myanmar has been familiar with foreign investment and external business
operations since the seventeenth century. Foreign direct investment has played a significant
role in the recently industrializing countries of Southeast Asia. Singapore, Malaysia, Hong
Kong, China, and Thailand have been large recipients of FDI inflow since 1985. Myanmar’s
FDI inflow has greatly increased since 1988. Most of the investment come from Asia Pacific
and Association of Southeast Asian Nation (ASEAN) countries. Most of the FDI was in the
primary (mostly agricultural) sector, the secondary (manufacturing) sector was second and
the tertiary (services) sector was third during the SLORC government period between 1988
and 1997. After several burdensome trade restrictions were lifted in 2016, the business
environment is set for dramatic improvement. The resultant new environment has
substantially eased the way for international trade and investment and has provided a better
selection of business partners. Myanmar is now encouraging an export-driven growth strategy
through promoting FDI inflows. This study seeks to highlight the evolution of Myanmar’s
trade structure and foreign direct investment to promote economic development.

11
1.2. Historical Background
After the British annexation of Lower Burma in the early 1850s, Upper Burma controlled
foreign trade, and Lower Burma adopted a free trade policy. Mali (as cited by Myat Thein
(2004)) said, “Laissez-faire and competitive enterprise, two adjuncts of Anglo-Saxon
liberalism, were the basic principles of commercial policy of British rule in Burma. As the
Suez Canal opened in 1869, Myanmar had some experience in foreign trade as an export
economy and the largest rice exporter in the world at the time. The general trade patterns of
Myanmar and other Southeast Asian countries were the same at the time.
In 1957, U Nu welcomed the active participation of private enterprises in the national
economy by guaranteeing them against nationalization for ten years and the government
discouraged all economic activities of foreigners. Myanmar’s trade sector flourished
considerably with 11 agricultural products accounting for about 44% of total import, and an
estimated 50% of GDP being related to export in parliamentary democracy period. As for the
composition of export, rice products became more prominent in the post-war years than in the
pre-war period. Rice was the major earner of foreign exchange and accounted for more than
50% of export earnings and forest products, mainly teak, came to be the second most
important export. In 1957-58, the trade surplus disappeared or became minimal level due to
the declining unit value of export. Many studies mentioned that the commercial policy of the
government to levy very low tariffs on the import of industrial raw materials and machinery
led many entrepreneurs to set up small-scale factories to evade the relatively higher tariffs on
finished goods and these industries were very import dependent import substituting industries.

12
Table 1.1 compares the composition of trade between 1938-39 and 1962-63. Rice and rice
products were by far the largest portion of trade.
Table 1.1 Composition of Trade (1938-1962, %)
Products 1938-39 1962-63
Rice and Rice Products 46.7 67.3
Other Agricultural Products 6.7 17.2
Oil 22.8 -
Timber 6.9 10.5
Metals and Ore 11.9 3.3
Others 5.0 1.7
Total 100 100
Source: Myat Thein (2004) Economic Development of Myanmar, p 31
After the Revolutionary Council took over power in 1962, the government adopted the
“Burmese Way to Socialism” as its political ideology and pursued a self-reliant socialist
economy. The government controlled the trade sector as a monopoly handled by state
producers. Export were indirectly taxed by maintaining national buying prices of commodities
below their international prices by State Owned Economic Enterprises (SEE). Import were
managed under government priorities and the availability of foreign exchange. However, rice
export fell sharply, and this decline directly led to a drastic decline in export earnings and
indirectly led to a decrease in import, savings, investment, and growth in GDP. The value of
import was mainly determined by export revenues due to the government neither eager to take
official development assistance (ODA) nor to borrow substantially from abroad. The shortage
of foreign exchange limited the amount of consumer goods that could be imported, and a black
market appeared. External trade by the private sector was conducted by market-determined
parallel exchange rates (Mya Than and Myat Thein (2004)). In the early 1980s, Myanmar’s

13
external trade direction changed slightly. The economic situation in the country had worsened,
and it gave rise to three distinct economies: the nominal official economy, and two hmaung-
kho (literally: “taking refuge in the dark”) black-market economies in 1967 Myat Thein (2004).
1. 3. Trade Flow and Structure from 1988 onwards
1. 3. 1 Trade Flow and Structure in Market-Oriented Period
After the State Law and Order Restoration Council (SLORC) government took over
political power in 1988, it introduced a market-oriented economic system and became
outward-looking in orientation. The SLORC government set encouraging private investment
and entrepreneurial activity, opening the economy to foreign direct investment and promoting
export as the main objectives of economic reforms. In 1989 foreign trade was liberalized to
allow private participation and an “open-door” policy towards FDI and foreign trading firms.
The state monopoly on both domestic and foreign trade was abolished, making way for private
trading Tin Maung Maung Than (2007). Exporters and importers had permission to be
registered and getting permission for foreigners to set up companies, opening the economy to
direct foreign investment and promoting export were key points for trade development.
The government introduced an “import first and export later” system, allowing foreign
companies to import commodities for sale on a consignment basis, In 1996, the government
decided on three basic principles to guide trade policy: Trade activities 1) should be in the
interest of the State and the people, 2) should not be a burden on the people, and 3) should
envisage a long-term stable trading system rather than gaining short-term profit. The “Import
first and export later” scheme has varied over time due to various economic and political
situations. Some export products such as agricultural products, forest products, petroleum

14
products, and precious stones and minerals are controlled by SEEs. Importers can import all
the same products that are controlled by importing SEEs and the Ministry of Commerce. The
official exchange rate only applies to within the public sector, and the private sector has no
chance for any allocation of foreign exchange at the official exchange rate. It was difficult to
conduct normal trade and economic relations with the outside world at the official exchange
rate. However, the open-door policy generated significant changes and trade volume with
neighboring countries expanded.
1. 3. 2 Trade Flow in the Democratic Government Period (2011-2015)
While adopting a free trade policy, the new democratic government made many reforms
to all sectors of the economy including trade. To promote the external sector and accelerate
integration into the world economy, the government tried to open the economy more freely
and revised trade-related legislation such as preparing a competition law, a consumer
protection law, and comprehensive intellectual property legislation. To develop trade, the
government set four main objectives: 1) To support internal and external trade activities for
the economic development of the country, 2) To upgrade the commercial efficiency of public
and private trading houses, 3) To increase the foreign exchange earnings of the country by
export promotion, and 4) To encourage the trade-related activity of cooperative and private
entrepreneurs. The government formalized border trade by designating official points of entry
and setting up customs and banking facilities.
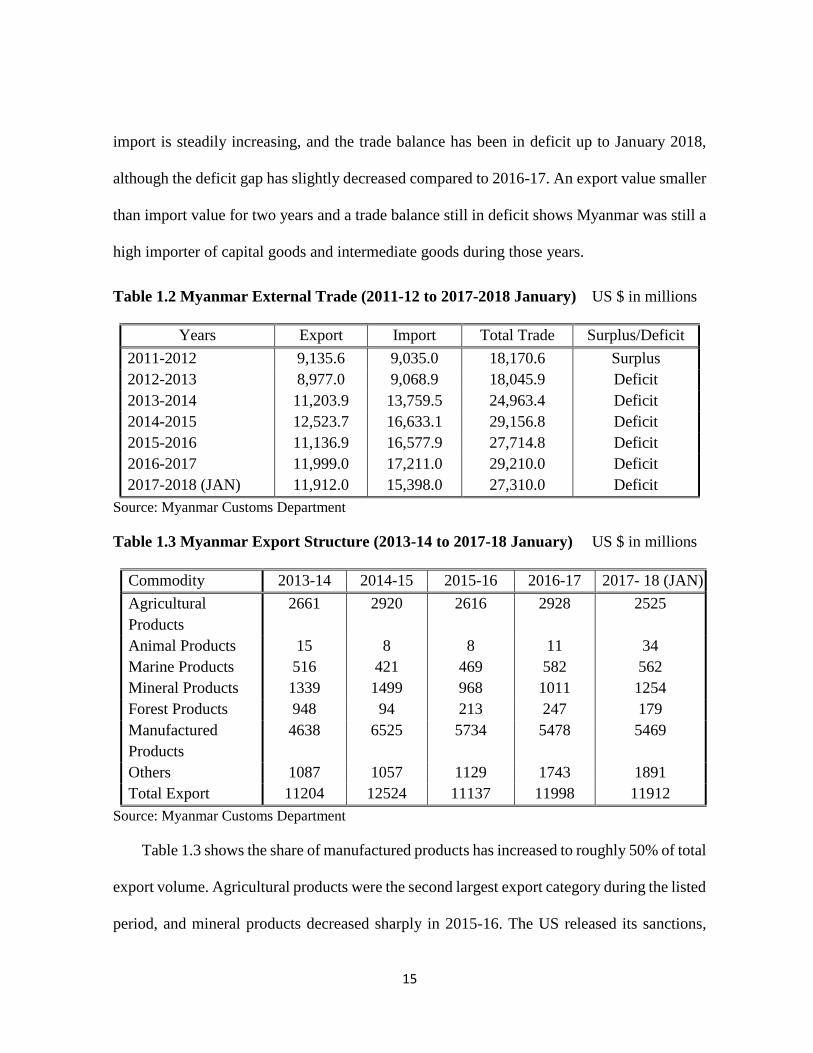
Table 1.2 shows import increasing over time and the trade balance shows a deficit
consecutively from 2012-13 onwards. Export volume also increased considerably although
import increased parallel to export and have generated a long-term trade deficit. Currently,
15
import is steadily increasing, and the trade balance has been in deficit up to January 2018,
although the deficit gap has slightly decreased compared to 2016-17. An export value smaller
than import value for two years and a trade balance still in deficit shows Myanmar was still a
high importer of capital goods and intermediate goods during those years.
Table 1.2 Myanmar External Trade (2011-12 to 2017-2018 January) US $ in millions
Years Export Import Total Trade Surplus/Deficit
2011-2012 9,135.6 9,035.0 18,170.6 Surplus
2012-2013 8,977.0 9,068.9 18,045.9 Deficit
2013-2014 11,203.9 13,759.5 24,963.4 Deficit
2014-2015 12,523.7 16,633.1 29,156.8 Deficit
2015-2016 11,136.9 16,577.9 27,714.8 Deficit
2016-2017 11,999.0 17,211.0 29,210.0 Deficit
2017-2018 (JAN) 11,912.0 15,398.0 27,310.0 Deficit
Source: Myanmar Customs Department
Table 1.3 Myanmar Export Structure (2013-14 to 2017-18 January) US $ in millions
Commodity 2013-14 2014-15 2015-16 2016-17 2017- 18 (JAN)
Agricultural
Products
2661 2920 2616 2928 2525
Animal Products 15 8 8 11 34
Marine Products 516 421 469 582 562
Mineral Products 1339 1499 968 1011 1254
Forest Products 948 94 213 247 179
Manufactured
Products
4638 6525 5734 5478 5469
Others 1087 1057 1129 1743 1891
Total Export 11204 12524 11137 11998 11912
Source: Myanmar Customs Department
Table 1.3 shows the share of manufactured products has increased to roughly 50% of total
export volume. Agricultural products were the second largest export category during the listed
period, and mineral products decreased sharply in 2015-16. The US released its sanctions,

16
which gave Myanmar favorable trade conditions such as a considerable improvement in the
industrial sector and an increase in FDI inflows, and manufactured products were the largest
export category. However, agricultural products still dominated with the second largest share
in Myanmar’s export structure.
Table 1.4 shows capital good and intermediate goods import are higher than other
categories due to Myanmar’s need to set up and develop the industrial sector and to promote
export. capital goods and consumer goods import slightly decreased from 2016-17 to 2017-
18 January and the total value of import also decreased.
Table 1.4 Import Structure of Myanmar (2013-14 to 2017-18 January) US $ in millions
Commodity 2013-14 2014-15 2015-16 2016-17 2017-18
(JAN)
Capital Goods 5692 8038 8254 6920 5451
Intermediate Goods 5684 5682 4821 6165 6200
Consumer Goods 2384 2913 3503 4126 3747
Total Import 13760 16633 16578 17211 15398
Source: Myanmar Customs Department
1. 3. 3 Trade Flow in the Current Democratic Public Government Period (2015 onwards)
After the November 2015 election, the National League for Democracy (NLD) become
the country’s first civilian government and has allowed for significant economic reforms in
both domestic and external sectors. Trade and investment in Myanmar have soared, buoyed
by ongoing efforts to liberalize the economy and a successful political transition. The export
promotion policy of the government was the extension and exploration of foreign markets to

17
promote the export of traditional and value‐added products by utilizing natural and human
resources effectively.
Table 1.5 Top Ten Trade Partners (2015-16 to 2018 January) US$ in millions
Country 2013-14 2014-15 2015-16 2016-17 2017-18 (Jan)
China 7033 9712 10992 10805 9684
Thailand 5666 5711 4866 4288 4074
Singapore 3604 4895 3696 2967 3100
Japan 1809 2305 1846 2032 1558
India 1636 1340 1712 1943 1257
Malaysia 948 1009 750 980 931
Indonesia 499 636 742 827 840
Korea 1570 863 657 866 635
Usa 104 544 197 691 618
Vietnam 281 321 347 494 592
Source: Myanmar Ministry of Commerce
Import policy emphasized the importation of capital goods as a priority, raw materials for
production, other essential products to provide for public health and export promotion. The
business environment was set for dramatic improvement after several heavy trade restrictions
were lifted in 2016. Myanmar was added to the US’s Generalized System of Preferences
(GSP), which exempted US-bound export from high import taxes, which were another
significant trade restriction. Although China has been the largest trade partner for Myanmar
for a long time, its overall significance has decreased compared to previous years. Thailand is
the second and Singapore is the third largest trading partner at present. Bilateral trade with
Japan increased in 2017-1018. (see Table 1.5).
18
1. 4. Overview Trade Pattern and Policy
The importance of foreign trade in Myanmar can measured by the “trade openness ratio”,
which estimates how an economy is open to attract foreign trade. Foreign trade did revive
during the parliament regime overthrown in 1962. With the collaboration of some enlightened
socialist scholars, the government drafted an economic plan that strongly advocated an
"outward-looking" development strategy, in part inspired by the strong free trade views of Dr.
Hla Myint. This plan was, however, rejected. Until 1988, Myanmar adopted an inward-
looking and self-reliant pattern of development policy, all the vital means of production and
distribution were nationalized, and foreign trade became a monopoly of the state. Since
foreign trade came to be a monopoly of the state in 1962, export volume and value declined
significantly from 1964-65 to 1970-71. Myanmar’s evolution of trade policy and structure
from 1990 onwards is shown in Table 1.6 with some facts to compare each period’s policy
and structures.
The long-term plan began with a Four-Year Plan in 1974 which was together comprised
the Twenty-Year Plan (1974-75 to 1993-94). Although it emphasized industrialization, it
allowed spending on the agricultural sector and addressed inefficiency in public sectors (Mya
Than and Joseph L.H. Tan (1990)). Another reason for export volume decreases in that period
was the 1973 world oil price shock, which hit the Myanmar economy and external sector.
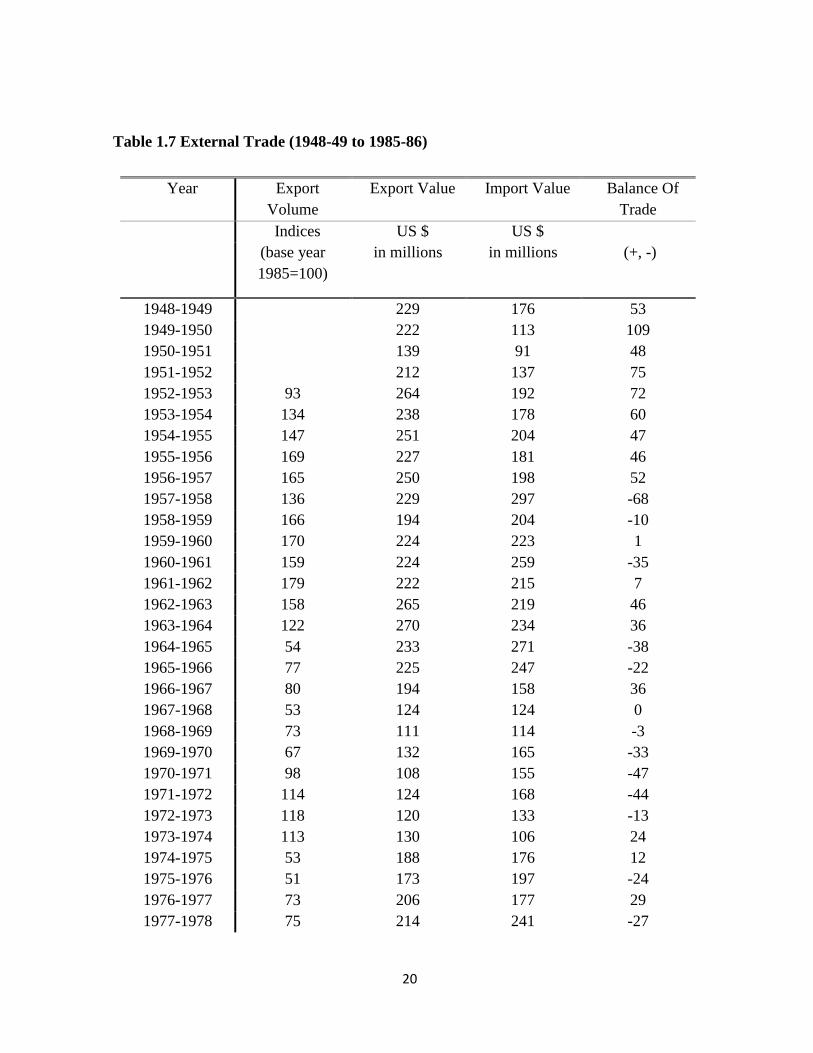
Export volume rapidly decreased from US$113 million in 1973-74 to US$53 million in 1974-
75. In the early 1980s, the direction of Myanmar’s external trade showed little change from
the past. (see Figure 1.1 and Table 1.7).

19
Table 1.6 Evolution of trade policy in Myanmar (1990 onwards)
Years
Economic
System
Trade
policy
Instruments
of Trade
Sanctions
1990-2010
Military Regime
Market
oriented
economic
system
Liberalization of
domestic and
foreign trade,
active
participation of
private business
in foreign trade
“Import first
and export
later” scheme,
export and
import on a
consignment
basis
EU-US
sanctions
2011-2015
Democratization
Market
economic
system
Export
promotion free
trade policy
(open-door
policy) Inviting
foreign direct
investment to
develop trade to
promote export
Reduction and
exemption of
commercial tax
on export,
income tax on
income from
CMP export,
state trading
monopolies
abolished
EU reinstated
GSP, US
allows
resumption of
the GSP
2016 to present
Democratic
Public
Government
Market
economic
system
Free trade policy
export driven
growth strategy
To promote
exporting value-
added goods
and finished
goods instead of
exporting raw
materials
Sanction
release
Source: Author’s creation
After 1988, the Myanmar government undertook reforms intended to enhance the
transparency of trade-related policies and regulations, thereby increasing public
accountability. A Foreign Exchange Certificate (FEC), equivalent to the US one-dollar value,
was introduced in February 1993. In April 2012, the government formally abolished the dual
20
Table 1.7 External Trade (1948-49 to 1985-86)
Year Export
Volume
Export Value Import Value Balance Of
Trade
Indices US $ US $
(base year
1985=100)
in millions in millions (+, -)
1948-1949 229 176 53
1949-1950 222 113 109
1950-1951 139 91 48
1951-1952 212 137 75
1952-1953 93 264 192 72
1953-1954 134 238 178 60
1954-1955 147 251 204 47
1955-1956 169 227 181 46
1956-1957 165 250 198 52
1957-1958 136 229 297 -68
1958-1959 166 194 204 -10
1959-1960 170 224 223 1
1960-1961 159 224 259 -35
1961-1962 179 222 215 7
1962-1963 158 265 219 46
1963-1964 122 270 234 36
1964-1965 54 233 271 -38
1965-1966 77 225 247 -22
1966-1967 80 194 158 36
1967-1968 53 124 124 0
1968-1969 73 111 114 -3
1969-1970 67 132 165 -33
1970-1971 98 108 155 -47
1971-1972 114 124 168 -44
1972-1973 118 120 133 -13
1973-1974 113 130 106 24
1974-1975 53 188 176 12
1975-1976 51 173 197 -24
1976-1977 73 206 177 29
1977-1978 75 214 241 -27

21
1978-1979 67 242 307 -65
1979-1980 97 383 319 64
1980-1981 98 472 353 119
1981-1982 99 462 373 89
1982-1983 114 391 409 -18
1983-1984 124 278 268 10
1984-1985 118 301 239 62
1985-1986 100 303 283 20
Sources: Myat Thein (2004) Economic Development of Myanmar, page -75.
exchange rate system, which had hindered foreign trade and investment. The current exchange
rate is a “managed float regime” that closely reflects the true market rate. Nevertheless, the
private financial sector, foreign exchange market, and regulatory framework remain
significantly underdeveloped.
Figure 1.1 Myanmar Export (1952-1953 to 1985-1986)
Sources: Myat Thein (2004) Economic Development of Myanmar, page-75.
Dunn and Mutti (2004) stated that a country’s terms of trade (i.e. the ratio of an index of
a country’s export prices to an index of import prices) are determined in the world markets
for its export and import. Myanmar is a primary products exporter and manufactured and
0
50
100
150
200
250
300
350
400
450
500
195
2-1
953
195
3-1
954
195
4-1
955
195
5-1
956
195
6-1
957
195
7-1
958
195
8-1
959
195
9-1
960
196
0-1
961
196
1-1
962
196
2-1
963
196
3-1
964
196
4-1
965
196
5-1
966
196
6-1
967
196
7-1
968
196
8-1
969
196
9-1
970
197
0-1
971
197
1-1
972
197
2-1
973
197
3-1
974
197
4-1
975
197
5-1
976
197
6-1
977
197
7-1
978
197
8-1
979
197
9-1
980
198
0-1
981
198
1-1
982
198
2-1
983
198
3-1
984
198
4-1
985
198
5-1
986
Exp
ort
Vo
lum
e(i
nd
ices)
an
d V
alu
e(U
S$
mil
s)
Year
Myanmar Export(1952-1953 to 1985-1986)
Export Volume Export Value

22
investment goods importer at unfavorable terms of trade. Many developing countries
experience that their terms of trade are unstable because they export large volumes of a small
number of primary products into highly competitive markets. Moreover, sometimes, the home
country cannot be offset by a nominal depreciation or devaluation of money due to rapid
inflation. From 1980 to 1985, Myanmar’s export volume and values roughly followed this
trend. After the military government took power in 1988, export values were larger than the
export volume.
Table 1.8 External Trade (1980-2017)
Year Export Volume Import Volume Export
Value
Import
Value
Balance
of Trade
Change
(%)
Indices Change
(%)
Indices US $mils US $mils US
$mils
Base year
1985=100
Base year
1985=100
1980 17.041 100.29 4.094 100.79 415 785 -370
1981 1.596 101.92 11.043 113.30 446 823 -377
1982 -0.17 101.74 11.954 128.69 391 409 -18
1983 15.579 120.52 -18.702 108.41 378 268 110
1984 -10.593 108.98 -3.005 105.25 301 239 62
1985 -8.975 100.00 -5.249 100.00 303 283 20
1986 19.564 119.56 -18.513 81.49 288 304 -17
1987 -18.677 97.23 0.281 81.72 219 268 -50
1988 10.701 107.64 -20.77 64.74 147 244 -97
1989 27.734 137.49 -8.459 59.27 215 194 20
1990 14.456 157.37 47.997 87.71 409 668 -259
1991 -2.774 153.00 -8.642 80.13 527 1,068 -541
1992 37.068 209.71 -0.478 79.75 684 1,046 -362
1993 15.751 242.75 41.806 113.09 864 1,280 -416
1994 -2.663 236.28 11.846 126.49 940 1,538 -598
1995 -2.479 230.43 29.536 163.85 1,198 2,342 -1,144
1996 16.268 267.91 8.038 177.02 1,183 2,678 -1,495
1997 27.731 342.20 29.123 228.57 1,132 2,862 -1,729
1998 28.34 439.19 25.462 286.77 1,139 2,358 -1,220
1999 54.634 679.13 -2.607 279.29 1,393 2,528 -1,134

23
2000 30.39 885.52 -10.065 251.18 2,174 3,221 -1,047
2001 40.772 1246.56 21.467 305.10 2,901 2,799 102
2002 9.799 1368.71 -15.563 257.62 2,956 2,856 100
2003 -3.054 1326.91 -6.412 241.10 2,656 2,780 -123
2004 -2.16 1298.25 -16.748 200.72 2,896 2,741 155
2005 17.46 1524.93 -2.9 194.90 3,765 2,707 1,058
2006 41.535 2158.30 44.598 281.82 4,415 2,887 1,528
2007 15.38 2490.25 81.707 512.09 5,146 3,790 1,356
2008 0.285 2497.35 21.133 620.31 6,650 4,652 1,997
2009 13.116 2824.90 2.334 634.79 7,006 3,669 3,337
2010 8.958 3077.95 12.711 715.47 7,704 4,278 3,426
2011 8.597 3342.57 23.005 880.07 8,208 8,712 -504
2012 1.008 3376.26 18.071 1039.10 9,160 8,004 1,156
2013 10.747 3739.11 17.258 1218.43 11,543 12,200 -656
2014 -5.318 3540.26 -13.705 1051.45 11,551 16,459 -4,907
2015 -3.02 3433.34 14.028 1198.94 12,247 17,132 -4,885
2016 2.72 3526.73 6.143 1272.59 11,725 15,921 -4,196
2017 10.444 3895.06 10.015 1400.05 11,158 18,051 -6,893
Sources: IMF, Direction of Trade Statistics (May 2018), World Economic Outlook Database (Sept
2011) and World Economic Outlook Database (April, 2018). Following the IMTS 2010 methodology,
export is recorded on free-on-board (FOB) basis, and import are recorded on cost, insurance, and
freight (CIF) basis. Reported by current price.
Table 1.8 shows Myanmar’s export and import volumes from 1980-2017. This result in
higher costs and lowers trade competitiveness for Myanmar’s products generate that
Myanmar’s export are relatively low price primary products and import are high-price
manufactured products. To have more favorable terms of trade, the government needs to
encourage export processing and manufacturing industries or export promotion. Another weak
point for exporters is that they are unsure of being able to get their goods into stable markets
in Western countries due to the severe economic sanctions of the US and EU since 2003.
Basically, Myanmar’s main export products are primary goods such as rice, pulse and beans;
forest product like teak; and natural gas (since the 1990s). Garment export expanded
significantly in 1999-2000 as well as natural gas export from offshore fields. Natural gas and
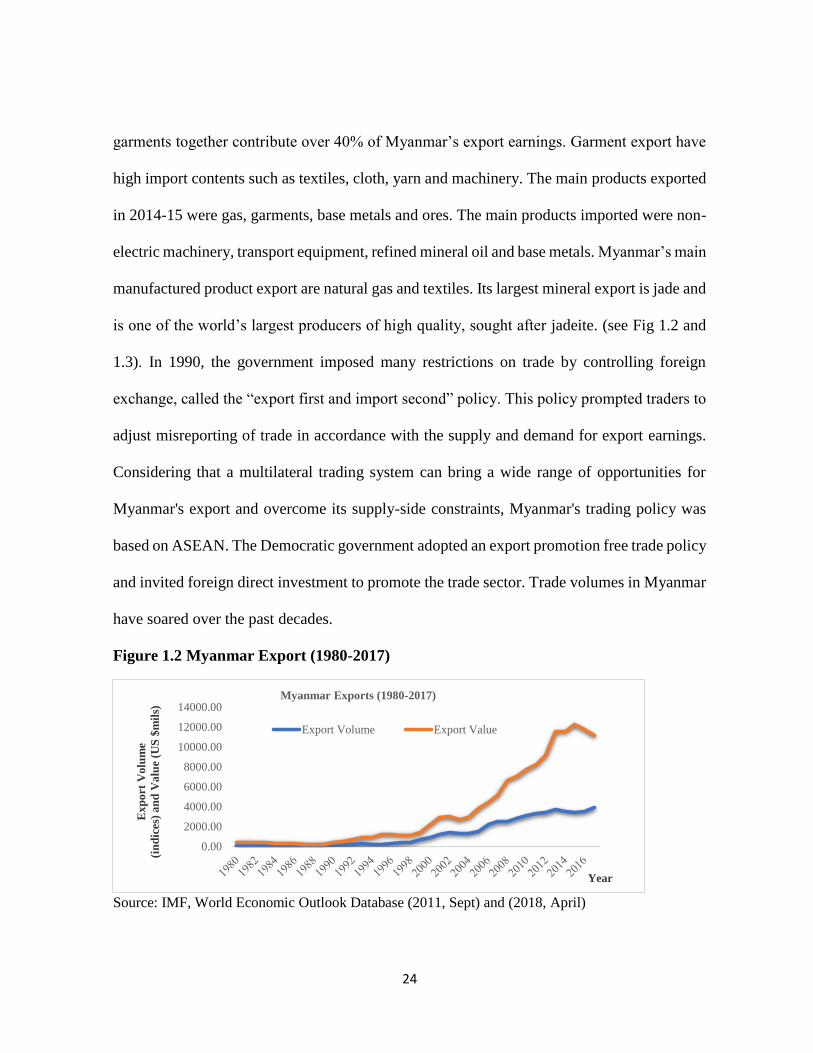
24
garments together contribute over 40% of Myanmar’s export earnings. Garment export have
high import contents such as textiles, cloth, yarn and machinery. The main products exported
in 2014-15 were gas, garments, base metals and ores. The main products imported were non-
electric machinery, transport equipment, refined mineral oil and base metals. Myanmar’s main
manufactured product export are natural gas and textiles. Its largest mineral export is jade and
is one of the world’s largest producers of high quality, sought after jadeite. (see Fig 1.2 and
1.3). In 1990, the government imposed many restrictions on trade by controlling foreign
exchange, called the “export first and import second” policy. This policy prompted traders to
adjust misreporting of trade in accordance with the supply and demand for export earnings.
Considering that a multilateral trading system can bring a wide range of opportunities for
Myanmar's export and overcome its supply-side constraints, Myanmar's trading policy was
based on ASEAN. The Democratic government adopted an export promotion free trade policy
and invited foreign direct investment to promote the trade sector. Trade volumes in Myanmar
have soared over the past decades.
Figure 1.2 Myanmar Export (1980-2017)
Source: IMF, World Economic Outlook Database (2011, Sept) and (2018, April)
0.00
2000.00
4000.00
6000.00
8000.00
10000.00
12000.00
14000.00
Ex
po
rt V
olu
me
(in
dic
es)
an
d V
alu
e (U
S $
mil
s)
Year
Myanmar Exports (1980-2017)
Export Volume Export Value

25
Figure 1.3 Myanmar Import (1980-2017)
Source: IMF, World Economic Outlook Database (2011, Sept) and (2018, April)
Figure 1.4 Export Value, Import Value and Trade Balance (2000-2017)
Source: IMF, World Economic Outlook Database (2018, April)
The European Commission (EC) (The Report: Myanmar 2017) reported the Myanmar’s
total trade rose by 32.8%, 28.1% and 24.5 % in 2010, 2011 and 2012, respectively. Trade
continued recording double-digit growth in 2013-14. Import growth drove growing trade
volumes, as well as an expanding trade deficit, and the EC reported that import to Myanmar
rose significantly during that period. Manufactured product export increased in export share
0.00
5000.00
10000.00
15000.00
20000.00
198
0
198
2
198
4
198
6
198
8
199
0
199
2
199
4
199
6
199
8
200
0
200
2
200
4
200
6
200
8
201
0
201
2
201
4
201
6Imp
ort
Vo
lum
e (i
nd
ices
)
and
Val
ue
(US
$ m
ils)
Year
Myanmar Imports (1980-2017)
Import Volume Import Value
-10,000
-5,000
0
5,000
10,000
15,000
20,000
Exp
ort
, Im
po
rt V
alu
e (U
S$
mil
s)
Year
Export, Import Value and Trade Balance (2000-2017)
Export value Import value Trade Balance
26
to roughly 50% of total export volume. Agricultural export was the second largest category in
2013-14, and mineral products decreased sharply in 2015-16 (Figure 1.4).
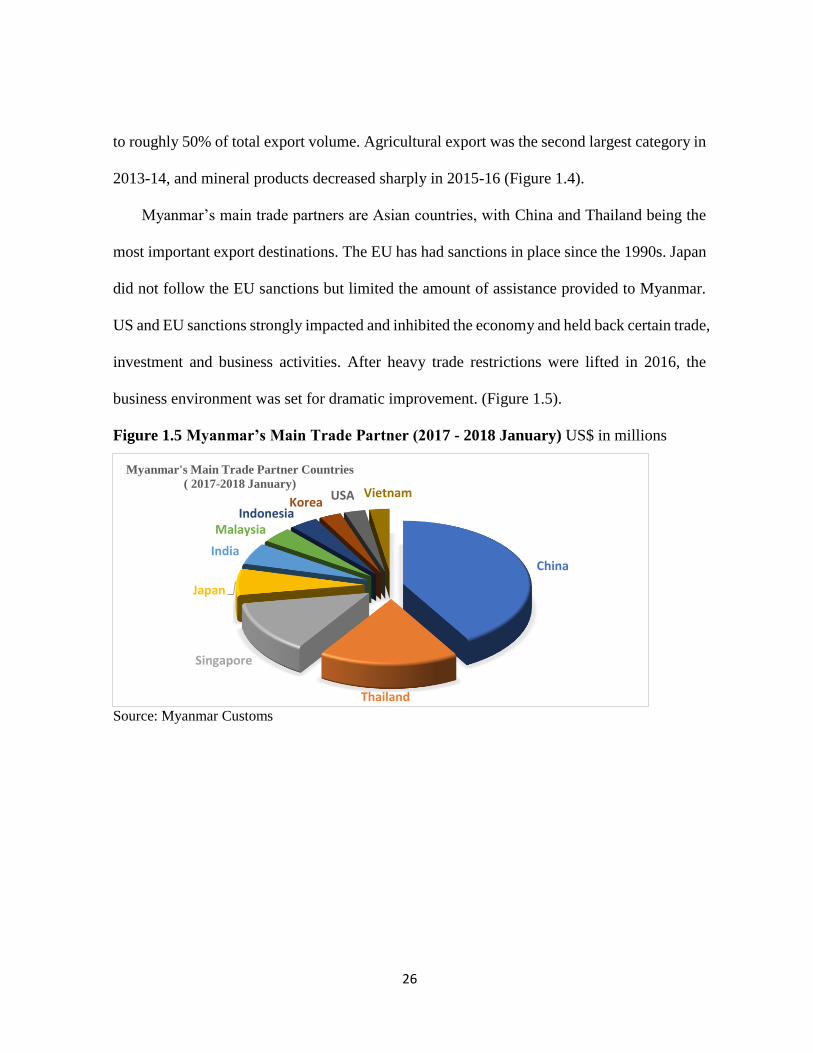
Myanmar’s main trade partners are Asian countries, with China and Thailand being the
most important export destinations. The EU has had sanctions in place since the 1990s. Japan
did not follow the EU sanctions but limited the amount of assistance provided to Myanmar.
US and EU sanctions strongly impacted and inhibited the economy and held back certain trade,
investment and business activities. After heavy trade restrictions were lifted in 2016, the
business environment was set for dramatic improvement. (Figure 1.5).
Figure 1.5 Myanmar’s Main Trade Partner (2017 - 2018 January) US$ in millions
Source: Myanmar Customs
China
Thailand
Singapore
Japan
India
MalaysiaIndonesia
KoreaUSA Vietnam
Myanmar's Main Trade Partner Countries
( 2017-2018 January)

27
Figure 1.6 Myanmar GDP Growth (Annual %) 1961-2016
Source: World Bank
Export volumes are tied to explain business cycles, rising with expansions and declining
in recessions. Myanmar’s GDP growth rate substantially declined in 1964, 1967 and 1988.
The import substitution industrialization policy not only inhibited the promotion of export,
but imports as well. This may have had a strong impact on the nation’s GDP growth but then
recovered by 1968. Because of the political instability in 1988, the GDP growth rate seriously
dropped. However, it recovered starting in 1989 although it slightly fluctuated throughout the
1990s. Export and import values have dramatically risen since 2000 and especially export
values substantially increased during that period. In 2011, the GDP growth rate declined but
after that slightly changed until 2016 (Figure 1.6).
1.5. Foreign Direct Investment in Myanmar
1.5.1. Background
After the annexation of Lower Burma to British India, there was an extensive influx of
foreign capital, business, and laborers. Famous Burmese teaks attracted European countries
-15
-10
-5
0
5
10
15
20
1961 1966 1971 1976 1981 1986 1991 1996 2001 2006 2011 2016
Gro
wth
rat
e(%
)
Year
Myanmar GDP Growth (Annual %) 1961-2016

28
such as the Portuguese. Before the Second World War, Myanmar received a very high flow
of foreign investment and operated a huge foreign trade sector compared with other Southeast
Asian countries. In 1955, The Anti-Fascist People's Freedom League (AFPFL) government
invited foreign and local private businesses to operate in designated industries, guaranteed
against nationalization for a period of ten years. After enacted 1962 the Burma Investment
Act, the policy of “going it alone” under the mistaken notion of self-reliance significantly
limited the size of total investment and the rate of economic growth (Tun Wai, as cited by
Myat Thein, 2004).
Figure 1.7 Myanmar FDI, net inflows (% of GDP) 2000-2016
Source: World Bank
Figure 1.7 shows Myanmar FDI net inflows (% of GDP) during 2000-2016. Net inflows
as a percentage of GDP have been trending upwards with slight fluctuations during the
democratic government period from 2011-2016. The government has striven for many
economic reforms and has actively invited foreign investors to enter Myanmar, thus the FDI
inflows have increased later in the period shown.
0
2
4
6
8
1998 2000 2002 2004 2006 2008 2010 2012 2014 2016 2018
% o
f G
DP
Year
Myanmar FDI, Net Inflows (% of GDP) 2000-2016

29
To shape the market-oriented economic policy, the government enacted the Foreign
Investment Law (FIL) in November,1988. FIL aimed to bring in more foreign capital and
offer investment incentives and guarantees to foreign investors. FIL was revised in 2012. To
overcome infrastructure bottlenecks, attract FDI and increase export, the Myanmar Economic
Zone Law was enacted in 2011. This law provided additional tax incentives for investment in
several strategic locations along Myanmar's 1,300-mile-long coast.
1. 5. 2. Recent FDI trends
FDI has increased based on the development and diversification of the economy from
agriculture and natural resources into one oriented more towards manufacturing and services
while reintegrating into the world economy. Not only local and domestic investment increased
but foreign direct investment also surged. FIL was revised in 2016 to improve foreign capital
and import technology required to improve the Myanmar economy. The Myanmar
government is promoting and striving to implement a path of economic reform and is well
placed to learn from the experiences of other ASEAN member countries about developing
and facilitating investment in crucial sectors.
Recently, the civilian government of Myanmar promulgated the new Myanmar
Investment Law (MIL), signed into law by the president on October 18, 2016. MIL combines
the CIL with the FIL. The law aims to transform Myanmar’s current investment framework,
merging regulations for foreign and domestic investors into a single law, as well as create a
new project approval processes, tax incentives and land use regulations aimed at bolstering
flagging foreign direct investment flows. The new law represented a critical component of

30
economic liberalization, with Reuters reporting that major companies were waiting to see the
legislation before committing funds to new projects.
Table 1.9 Permitted Foreign Direct Investment (1988-89 to 2017-18) US$ in millions
Investment 1988-1989 to 2010-2011 Up to 2017 (December) Total
no. amount no. amount no. amount
FDI 454 36,038 968 39,096 1422 75,134
SEZ - 87 1,223 87 1,223
Total 454 36,038 1055 40,319 1509 76,357
Sources: Myanmar Directorate of Investment and Company Administration (DICA).
The Directorate of Investment and Company Administration (DICA) shows that the total
permitted amount of FDI for the period from 1988 to December 2017 reached US$ 76.3 billion
(see Table 1.9). A new strategy to attract investment along with a growing percentage of
inward investment has gone towards Myanmar’s new special economic zones (SEZs). The
SEZ Law outlines investor incentives at three SEZs operating in Myanmar: Thilawa,
Kyaukphu, and Dawei. As the permitted amount of foreign investment, oil and gas sector is
the largest, manufacturing is the second, and power is the third largest position during 2011-
12 to 2017(December) that shown in Table 1.10.

31
Table 1.10 Yearly Approved Amount of Foreign Investment (by Sector) US$ millions
Sector 2015-16 2016-17 2017-18 2011-12 to 2017-18 (Dec)
Manufacturing 1069 1180 1556.48 7568
Power 360 910 363 6428
Oil and Gas 4818 - - 8595
Hotel and Tourism 288 404 154.44 1940
Mining 29 - 1.31 104
Agriculture 7 - 131.29 208
Livestock & Fisheries 8 97 23.81 257
Transport
&Communication
1931 3081 653.1 8535
Real Estate 729 748 1062.44 3760
Industrial Estate 10 - 34.04 44
Other Services 236 231 804.42 1662
Total 9485.62 6649.81 4784.31 39101
Sources: Myanmar Directorate of Investment and Company Administration (DICA)
With many changes of policy reform concerns with foreign investment, approved
investment increased in current period. Figure 1.8 and Table 1.11 show the approved amount
of FDI inflows in Myanmar from 2010-11 to 2017-18 by country. Singapore provided the
largest FDI and Thailand was the second most invested country in Myanmar. The top 10
investing countries are Asian countries except the UK and the Netherlands.

32
Figure 1.8 Approved Amount of FDI Inflows into Myanmar (2011-12 to 2017-18) US$ in
millions
Sources: Myanmar Directorate of Investment and Company Administration (DICA)
Table 1.11 Yearly Approved Amount of Foreign Investment (by country) US$ millions
Country 2015-16 2016-17 2017-18 2011-12 to
2017-18 (Dec)
Singapore 4251 3821 1726 16854
China 3324 483 1291 10243
Viet Nam 5 1386 19 2075
U. K 75 54 209 1679
Hong Kong 225 214 212 1468
Thailand 236 423 108 1423
The Netherlands 438 5 533 1288
Malaysia 257 21 21 979
Korea 128 66 233 872
Japan 220 60 96 576
Sources: Myanmar Directorate of Investment and Company Administration (DICA).
Singapore
China
Viet Nam
U. K
Hong Kong
Thailand
The NetherlandsMalaysia
KoreaJapan
Approved Amount of FDI inflows in Myanmar
(2011-12 to 2017-18 December)

33
1.5.3. Future FDI Trends
Myanmar has many favorable factors to attract foreign investors’ attention. It is
strategically located between two economic giants, China and India, borders growth markets
like Thailand. Myanmar has access to the Bay of Bengal as well as she is the second largest
land area in Southeast Asia and a relatively youthful labor populous country. Some massive
obstacle to attracting investment in the manufacturing sector are insufficient power,
communications, roads, railways, bridges and ports. Yangon and Mandalay are the top two
cities regarding population and the accumulation of companies that continue to attract new
investments. It is highly probable that economic activity in Yangon will spread out to the Bago
and Thilawa Special Economic Zone. Japan has given assistance to support infrastructure for
the SEZs and to operate a one-stop service center in Thilawa to compete with other SEZs in
neighboring countries and to attract many foreign companies. Thilawa’s image as an SEZ has
been developing and the amount of FDI in the Thilawa SEZ increased significantly in 2018.
Japan is the largest investor country in the Thilawa SEZ. Economic experts expect that
investors from the US and some European countries will invest in the Thilawa SEZ in the
future.
1.6. Conclusions
Because of unstable policy, complicated political situations, the encouragement of
foreign trade was hindered in the late 1990s. Myanmar has had some failures of achievability,
reliability, suitability, simplicity, and stability in implementing trade policy. A multilateral
trading system i.e. the system which allows large number of countries to agree to trade with
each other. The World Trade Organization (WTO) is part of this system and it can bring a wide

34
range of opportunities for Myanmar's export and to overcome its supply-side constraints.
However, Myanmar's trading policy was based on ASEAN in past. According to the several
factors assess on 2018’s investment position, Myanmar was depressed by global commodity
prices and reduce India’s agriculture import quotas although Myanmar trade and investment
has expanded rapidly since 2011. However, according to the Myanmar Report (2018), the new
opportunities created by China’s Belt and Rod Initiative are set to play a significant role in
supporting Myanmar’s trade and investment growth over the medium term. The decision
demonstrated Myanmar’s commitment to the World Trade Organization (WTO) policies and
boded well for future liberalization (The Report, Myanmar (2013), Oxford Business Group).
Attracting and benefit from FDI is a key challenge for Myanmar. Myanmar need to set
appropriate general policies to enhance the economic growth. These are stable
macroeconomic policy, effective financial markets, better infrastructure facilities, more
reliable trade, and investment policy, supporting skilled labors to develop human resource
development and so forth.
35
CHAPTER II
The Influential Determinants of FDI Inflow in Myanmar
2.I. Introduction
Other things remaining the same, the effectiveness of FDI policy in any country may be
gauged by examining the trends in foreign investment approvals and actual inflow. A great
deal of evidence shows that FDI has contributed significantly to the economic and industrial
development of ASEAN economies. FDI flows are often accompanied by valuable resources
such as technology, organizational capability, managerial skills, and marketing know-how. In
the last two decades, the involvement of developing countries in international trade has
increased while FDI has expanded rapidly as capital inflows.
Many different factors affect the volume and distribution of FDI in developing countries
around the world. Many researchers have found that the primary determinants of major FDI
inflows include political stability, favorable tax and subsidy policies, the existence of an
appropriate business environment, better administrative procedures and a low level of
corruption. Since globalization, the world economy has been characterized by increased
integration and ties between countries in which foreign direct investment (FDI) constitutes a
business phenomenon of vital importance and frequency. FDI contributes to the improvement
of macroeconomic outcomes of host countries and from there it can enhance a nation’s
economic growth.
According to international reports, Myanmar is one of the most difficult markets in the
world in which to operate a business even though the government is implementing political

36
and economic reforms aimed at promoting the country’s participation in the global economy.
Like other ASEAN countries, Myanmar has built its development strategy on export-led
development based partly on FDI. However, FDI has played less of a role in Myanmar than
other countries in the region. Previously, due to the impact of economic sanctions, potential
investors from many OECD countries did not consider Myanmar as a location for investments.
Myanmar experienced the largest economic impact among the countries in the Mekong region.
Myanmar has a large amount of economic potential from the benefits of economic integration
and infrastructure development in the Mekong region.
Most of the investment that Myanmar has received has gone to natural resource sectors
with only a negligible role for foreign investors in manufacturing or services (OECD
Investment Report, 2014). Nowadays, the Democratic government is adopting an open-door
policy and favors creating economic opportunities to build a modern developed nation. The
objective of this paper is to point out the influential determinants of FDI inflow in Myanmar
using the current economy as a case study. This study is made up of the following four
sections; exploring some perspectives from previous literature, current FDI trends in
Myanmar, the influential determinants of FDI in Myanmar, and FDI policy implications.
2.2. Previous Literature Review
Previous studies have focused on the pull factors, features of the host countries that attract
or deter FDI inflows, but foreign investment is not attracted to less developed countries except
in cases with cheap labor or abundant raw materials. There has been a proliferation of policy-
oriented studies seeking to make a country’s investment climate more attractive to both

37
foreign and local investors. Foreign direct investment contributes to the development of many
countries by improving infrastructure, transferring technical skills, raising entrepreneurial
abilities and elevating financial resources regarding both government revenue and foreign
exchange.
Many researchers have analyzed FDI and foreign trade with the different points of view.
This study mainly points out the determinants of FDI in developing countries. In previous
studies, the determinants of FDI have generally fallen into three categories; a focus on core
factors influencing the decision to invest in a country or industry, a more macro-oriented
functional relationship between FDI and possible determinants, and finally, why FDI is
preferred to other forms of investment based on different resource allocation decisions. When
analyzing the main determinants of FDI, country-specific characteristics are widely accepted,
especially for factors related to the host country market.
FDI analysis is often based on either horizontal foreign direct investment or vertical
foreign direct investment. Horizontal foreign direct investment is often done by multinational
corporations which replicate their production processes in foreign facilities located near large
customer bases. Vertical foreign direct investment is based on the theory of comparative
advantage and it is one of the fastest-growing types of FDI into developing countries from
developed countries. Vertical FDI requires a substantial fixed cost investment in a foreign
affiliate in a country with the appropriate characteristics (Krugman, Obstfeld & Melitz, 2012).
A nation’s chance of attracting and receiving FDI depends on the development of the host
country’s infrastructure and institutions by making efforts at fundamental reform.

38
Yousaf, Hussain & Ahmad (2003) analyzed the volume and determinants of FDI in a
sample of 15 developing countries. The FDI flow into developing countries took various paths
and its volume was modest at the beginning of the 1980s but has tended to rise in subsequent
years. Ferris, S.P., Thompson, G.R. & Valsan, C. (1997) analyze FDI in Guyana in Latin
America and pointed out the important determinants of FDI compared with 11 other Latin
American countries. Goldberg & Kolstad (1995) analyzed exchange rate variability and
demand uncertainty and explored the implications of short-term exchange rate variability for
FDI flows. Real exchange rate variability influences the location of production facilities for
risk-averse parent companies and fixed productive factors. Yu-Chen & Santanu (2011)
studied the relationship between labor cost and FDI in India, specifically the effects of foreign-
owned firms paying higher wages than their domestic counterparts.
2.3. The Current Foreign Direct Investment Situation in Myanmar
Myanmar is the second largest country in Southeast Asia, and the 12th most populous
country in all of Asia. With 55% of people under the age of 30, Myanmar’s population is well
positioned to capitalize on an expansion of the economy. Although the international record on
natural resource-based exports as a means of promoting economic development is unsure,
Myanmar’s natural resource exports can play a vital role in development, and a well-regulated
resource sector can generate high growth in income, investment, and trade while laying a
foundation for the diversification of exports and domestic activity over time.
After the Democratic government came into power in 2011, the United States, Japan, and
ASEAN have started to seek ways to invest in Myanmar. According to data from the Asian

39
Development Bank (ADB), the country’s GDP expanded by 8.5% in 2014-15, and the
government estimated 2015-16 GDP growth at 9-10%. In 2016, GDP reached US$62.6 billion.
Thirty years ago, there was very little foreign investment and Myanmar only engaged in small
international trade. On November 30, 2015, the Directorate of Investment and Company
Administration (DICA) stated that the total amount of FDI from 1988 to November 2015 had
reached US$58.2 billion, including manufacturing enterprises and oil and gas companies
which were responsible for one-third of the total investment, at US$19.6 billion. However,
this amount has seen a significant drop after FDI reached a peak in 2014.
After adopting a liberalization policy, the government continues to open the economy to
attract FDI and enhance trade. “Liberalization is a key word here right now. We have grown
rapidly in recent years, and we expect to see increased economic activity for the foreseeable
future”, said U Aung Naing Oo, secretary of the Myanmar Investment Commission (MIC)
and director-general of the Directorate of Investment and Company Administration (DICA).
The Report Myanmar (2015).
2.4. The influential determinants of FDI in Myanmar
Previous studies have focused on the pull factors, features of the host countries that attract
or deter FDI inflows, but foreign investment is not attracted to less developed countries except
in cases with cheap labor or abundant raw materials. FDI may be one key element for the
development of Myanmar in the future. The government has initiated a broad range of reforms
to open its economy to foreign trade and investment. Myanmar has a rich natural resources
base, a young labor force and a strategic geographic location between the two economics

40
giants India and China and stands to benefit from greater global and regional economic
integration, including its membership in ASEAN. Many different factors affect the volume
and distribution of FDI in developing countries around the world.
2.4.1. Myanmar Investment Law
The government released a draft of the Myanmar Investment Law in February 2015 which
had been in the works since 2014 and was ratified by Parliament in 2016. The new law
replaced both the 2012 Foreign Investment Law and the Myanmar Citizens Investment Law
of 2013 with comprehensive legislation aimed at bringing all investment regulations under
one framework. The objective of this law was to develop responsible investment business
which does not cause harm to the natural environment, employs human resources, has a high
production function for services, trading, technology, agriculture, livestock and industrial
sectors. According to the Myanmar Investment Law, the MIC will also evaluate all investment
permit applications according to specific key factors including whether the investment will
result in a significant level of domestic employment, if the economic activity will involve the
import and use of heavy equipment or advanced technology, how much economic activity
will be added to the domestic economy and the degree that the economic activity will uplift
the living standards of Myanmar’s citizens.
2.4.2. Current Financial sector
Financial sector development is still at an early stage in Myanmar. It remains firmly
underdeveloped and repressed, with financial intermediation almost entirely dominated by an
unsophisticated banking sector. The government has prepared a financial sector roadmap to

41
foster financial development with a new foreign exchange management law. There are further
plans to open the banking industry to foreign participation, and developing the capital market
with the launch of a stock exchange in 2016. Moreover, the Central Bank established a regular
liberalization program to allow the entry of private domestic banks and the establishment of
representative offices for private foreign banks.
In 2012, the Foreign Exchange Management Law was adopted, and it allows both locals
and foreigners to deal with foreign currency in Myanmar. According to this law, it requires
all foreign exchange transactions to occur through banks that have been authorized by the
Central Bank of Myanmar to deal in foreign exchange. As such, foreign investors may now
open foreign currency accounts at authorized banks within Myanmar and maintain these
accounts abroad, as well as remit foreign currency abroad, subject to the approval of the
relevant government authorities. As foreign exchange is absorbed and spent in the economy,
the real exchange rate could appreciate, reducing the competitiveness of Myanmar’s trade-
exposed firms and sectors. Currently, Myanmar faces the devaluation of the kyat, and the
exchange rate of the kyat with the US dollar is weaker than previous.
2.4.3. Special Economic Zones
The term Special Economic Zone (SEZ) is used to describe the delineated geographic
areas within which have a different legal and regulatory regime relating to business and
trading activities. (Responsible Investment in Myanmar, 2017). Nowadays, SEZs are powerfully
linked to national economic development plans, and are a base for innovation and new
institutions for market economy success. A growing percentage of inward investment has gone
towards Myanmar’s new special economic zones. SEZs play a central role in Myanmar’s

42
efforts to attract investment and to promote competitive semi-manufactured and manufactured
goods with significant local value addition. If the SEZs become successful, they will continue
to be a high priority target for the government as a means to attract foreign investment. By
September 2015, during the first phase of Thilawa SEZ, launched in 2013, 48 firms had signed
contracts to set up operations in Thilawa, with many of those companies involved in garment
manufacturing. The second SEZ is in Dawei, situated in southern Myanmar, with another SEZ
in Kyaukphyu, in the state of Arakan, and both projects have begun to attract interest from
foreign corporations. SEZs offer a variety of investment opportunities for foreign investors.
Table 2.1 Thilawa SEZ Investment (by Sector)
Sr No Sector 2017-2018
Amount Value (US $ mil) Percent
1
Manufacturing
6
185
74
2 Trade
47 19
3 Real Estate
8 3
4 Transport and Supporting
7.48 3
5 Services
1.35 0.5
Total
248.6 100
Sources: Directorate of Investment and Company Administration(DICA) in Myanmar
Table 2.1 shows the sectoral FDI inflow in Thilawa SEZ in FY 2017-2018. The foreign
direct investment entered in the manufacturing sector was the largest with 74% of all
investment. Currently in the Thilawa SEZ, Japan is the largest investor, contributing 33% of
all investment in 2017-2018.

43
2.4.4. Labor Utilization
According to the 2014 Myanmar Census, 65.6% of the population are of working age (15
- 64 years old). This population is well educated, with a high literacy rate of 93% and wide
spread basic competency in English. As a labor abundant country, Myanmar has the
comparative advantage of lower labor cost in attracting FDI to export-oriented labor-intensive
sectors. There is growing evidence that factors such as the right to collective bargaining,
worker safety, education, due process and a commitment to ethical, social and environmental
norms provide an attractive and sustainable environment for investment. Although
Myanmar’s rank in basic literacy rate is high, education and labor skills need to improve in
order to attract more FDI.
With the influx of FDI into Myanmar, the government need to confirm the positive effects
of creating employment and needs to check whether workers have the ability to absorb and
work with standardized technologies. At the same time, technology education and vocational
training are crucial for human resource development. As the condition of the Greater Mekong
Sub-region (GMS) East-West Economic Corridor and the Three Pagoda Pass Road are
improved, and labor costs in Thailand rise, there is a chance for more labor-intensive industry
to be relocated to Myanmar. However, the current infrastructures in these locations for
investors are still limited.

44
Table 2.2 The Employment Opportunities from Investment Enterprises (2011-2012 to
2017-2018)
Sr.
No.
Fiscal
Year
Foreign Investment
Enterprises
Nationality's
investment Enterprise Total
Domestic Foreign Domestic Foreign Domestic Foreign
1 2011/12 6814 465 9015 160 15829 625
2 2012/13 62412 719 18871 198 81283 917
3 2013/14 77597 1373 17269 187 94866 1560
4 2014/15 115500 2587 12626 134 128126 2721
5 2015/16 94922 2341 29418 238 124340 2579
6 2016/17 65830 2019 9743 145 75573 2164
7 2017/18 78146 1964 12612 281 90758 2245
Total 501221 11468 109554 1343 610775 12811
Sources: Directorate of Investment and Company Administration(DICA) in Myanmar
The availability of adequately skilled labor is crucial for attracting firms engaged in
export-oriented FDI. U Maung Nanda Aung, the executive director of Heritage Capital
Investment, points out the challenge of finding skilled labor in Myanmar, and that the
education level is low compared with the rest of the world. However, currently, employment
opportunities are increasing compared due to higher FDI inflow. In the modern global
investment climate, investors confer importance to labor and environmental standards,
corporate governance, and political stability. (see Table 2.2)
2.4.5. Infrastructure Development
Good infrastructure is not only a driver of FDI inflow, but also a pre-requisite for positive
spillovers from FDI onto the host country’s economy. If a country's infrastructure is sufficient,
the country will have spillover benefits from FDI and attain a higher level of growth.

45
Therefore, especially for developing countries, the larger the investment in infrastructure, the
greater the FDI inflows can lead to even faster growth.
The lack of infrastructure in Myanmar is an important obstacle to meeting the needs of society
and to enterprise and economic development. The openness for FDI should be considered with
the capacity of the macro economy and the location of Myanmar, compared with other
ASEAN countries in various indicators of investment climates. A huge obstacle to attracting
investment in the manufacturing sector is insufficient power, communications, roads, railways,
bridges and ports. The government has stated that its investment priorities include the
construction of road and rail networks, power plants, water treatment plants industrial parks
and special economic zones (SEZ) to meet the demand for new infrastructure
Table 2.3 List of existing Infrastructure Enterprises under the Foreign Investment Law
Sr. No Sector No.
Investment Amount
(US $ in millions) Percent (%)
1 Power Sector 14 14685.1 63.6
2 Transport Sector(Air) 2 666.2 2.9
3 Transport Sector(Port) 9 527.1 2.3
4 Telecommunication
Sector
22
7076.4 30.6
5 Transport Sector (Road) 1 143.2 0.6
FDI Infrastructure
Project
48 23098 100
FDI Total Project 61276
%of FDI total Project 37.7
Sources: Directorate of Investment and Company Administration(DICA) in Myanmar
Although logistics infrastructure is an important factor for investment, Myanmar’s
current logistic infrastructure is poorer than other countries. The government is building
physical roads to becoming Asia’s “crossroads” through investments. Recently, the Oxford
46
Business Group issued of The Report: Myanmar 2018, which states that Myanmar is expected
to require at least US$60 billion of new investment over the next 15 to 20 years to fulfill the
country’s rapid urbanization and massive infrastructure agenda set by the Ministry of
Transport and Communication in September 2017. The government’s emphasis on
establishing effective national and international supply chains for future economic growth,
improvements in infrastructure (particularly power infrastructure, road, rail, air, and ports)
have the highest priority in order to attract FDI. Limited infrastructure capacity is also a major
issue hindering the promotion of industrial activities. Table 2.3 shows a list of infrastructure
enterprises and their existing value of investment as approved by the Foreign Investment Law.
FDI in hydroelectric power plants is permitted as a joint venture or build-operate-transfer
(BOT) scheme. The Ministry of Construction seeks to encourage private sector investment in
infrastructure development and uses BOT projects or joint ventures for the constructions of
roads, inland cargo depots, ports, and airports. The government is conducting various
infrastructural projects under BOT or other Public Private Partnerships (PPP) agreements with
investors from the private sector.
2.4.6. Tax Exemption
Tax exemption is an influential factor for attracting FDI to a host country. From the
spillover effects of the introduction of new technologies and the enhancement of human
capital (skills), FDI can positively affect domestic income and policymakers frequently re-
examine their tax rules to ensure the attractiveness of FDI. Moreover, governments should
47
constantly check the competitiveness of their tax environment for FDI, but ensure that an
appropriate share of domestic tax is collected from multinationals.
Some previous studies have found that FDI was becoming increasingly sensitive to
taxation and the long-run impact of corporate tax reform is one uncertainty of how tax factors
into FDI decisions, including what investors consider to be favorable tax rates. Similar to
comparisons regarding location and market size, foreign investors normally compare tax
burdens in different locations. It should be noted that a low tax burden alone cannot
compensate for a largely weak or unattractive FDI environment. However, tax incentives can
be a major factor in investment location decisions for some foreign investors, especially,
export-oriented companies.
Employees of companies incorporated in Myanmar and established under the foreign
investment law are treated as residents and their income is taxed at a rate of 25%. Commercial
tax is payable on goods that are imported or produced in Myanmar as well as trading sales
and services. Recently, as the next step to promote and invite FDI, the current government is
preparing many incentive schemes and policies to attract multi-national enterprises with
promulgation of a new foreign investment law established in October 2016. Under the new
Foreign Investment Law, the government will give income tax exemptions in designated
zones. Zone 1 is the least developed region and will have an exemption for seven years. Zone
2 is a moderately developed region and will have an exemption for five years. Zone 3 is an
adequately developed region and will have an exemption for three years. The government
may also allow more favorable exemptions and relief for locations where Myanmar citizen-
owned businesses are operated or for other investor economic activities.

48
2.4.7. Trade Policy Issues
Appropriate trade policies are not only predictable, consistent and transparent, but lower
the risks for investors, which is particularly important for foreign firms. Empirical researchers
point out that if trade policies are unpredictable, FDI will be lower. Another problem is trade-
related infrastructure shortages for exports. These trade facilitation challenges are
compounded by broad investment climate weaknesses, especially those affecting small to
medium size businesses and entrepreneurs, with difficulties in access to finance to support
export-oriented activities and capacity challenges in trade promotion institutions.
The previous government enacted the New Export and Import Law of September 2012,
aiming to align Myanmar’s trade policy with international rules and regulations, as well as
promoting trade facilitation. Concerning the trade facilitation measures, the Ministry of
Commerce is responsible for monitoring export and import license applications. However, the
institutional, infrastructure and capacity challenges mentioned earlier are key impediments to
Myanmar benefitting from trade development schemes, such as the Generalized System of
Preferences (GSP) benefits reissued by the EU in July 2013 and the US in 2016. Since 2012,
many of the previous trade sanctions have been lifted. An important trade policy and export
promotion strategy was launched in March 2015 called NEX 2015-19, which was created in
cooperation with the World Trade Organization. It is a road map to supporting workable,
diversified economic development through trade. In line with this policy, the government
started a 12-point economic strategy in July 2016 and set its trade policy objectives.

49
2.5. Policy Implications
Recently, a new trend in FDI of shifting investments from the natural resource and energy
sectors to the manufacturing sector has improved FDI growth, but Myanmar’s FDI is still not
on a level comparable to neighboring countries. Inward FDI stock in Myanmar is much lower
than that of neighboring countries. Some authors point out that if Myanmar chooses the right
national development strategy, enhances open trade and investment strategies and learns from
economies with similar experiences, the country can catch up to its neighbors and partners in
the region. Some economic experts point out that government promotions to attract FDI are
irrespective of the realization of an investment boom in the country. Facilitating labor
intensive manufacturing and the accompanying support service activities would further raise
trade, investment and income-earning opportunities as well as attract further foreign
investment critical to transforming Myanmar’s economy. Likewise, the country’ success in
getting the benefits from foreign direct investment will allow infrastructure development and
better institutions through trade and investment liberalization.
Although the government is supporting value-added activities, exports continue to be
heavily concentrated in raw materials such as natural gas, gems and other minerals with much
of the incoming investment going to these areas in recent years. However, the government
transactions rules and regulations have some weakness. Domestic reforms are necessary to
build international confidence in the growth of commercial and investment ties with Myanmar
and to lift the country’s trade and growth potential. Recent economic, political and social
restructuring changes offer better reasons for investment since the party led by Daw Aung San
Suu Kyi gained power in 2016. Effective public investment, policy-making and power sharing

50
are fundamental to sustainable trade-oriented growth, the development of the capacities and
welfare of Myanmar’s people and the peace and political settlement necessary to sustain
growth in the long term.

51
CHAPTER III
“Does the Gravity Model of Trade explain Myanmar’s Trade Structure? "
3.I. Introduction
There is an overwhelming consensus that participating in international trade can be a
dynamic and genuine driving force for economic development. In developing countries, trade
can be seen as the backbone of their economies and can expand markets from local to global.
Growing bilateral trade raises income levels and benefits both countries financially.
Moreover, trade between neighbouring countries is useful for economic growth and to fulfil
people’s needs at the same time. Furthermore, trade allows businesses in developing countries
to access the technologies essential for improving their productivity and competitiveness.
Today’s world trade is wider and stronger than ever before. Historically, countries’ exports
have depended on their climate and natural resource endowment.
Myanmar is located on mainland Southeast Asia and situated on a dynamic crossroads
linking Southeast Asia, Western China (Yunnan) and the Indian sub-continent. Its
geographical location makes Myanmar a vast potential market and a sub-regional economic
nodal link between regions. Most of the countries in the Association of Southeast Asian
Nations (ASEAN) have made outstanding economic progress by adopting regional
integration. Myanmar can try to strengthen its economy through ASEAN and utilizing its
singular geographic position as a link between South and Southeast Asia, a position which
favours taking on new opportunities. As ASEAN becomes one of the fastest-growing
economies in the world, the integration between ASEAN member countries grows stronger,
and it continues to out-perform the rest of the global economy. The gravity model of GDP and

52
total trade value in the ASEAN region can show the original trade condition of Myanmar at
the regional level. Even though Myanmar has emphasized economic integration with ASEAN
member countries by joining the ASEAN Free Trade Area (AFTA), it does not seem to have
brought about trade diversity. Stronger ties with other ASEAN member countries may be
needed. Thailand is still the primary trading partner for Myanmar, alongside China and India.
The higher the degree of complementary trade, the larger the differences in factor endowment
and trade flow increase. For a long time, the US and Western trade sanctions weakened the
ability of the Myanmar economy to be competitive in the global market. One important fact
is that Myanmar has always imported more than it exports. According to the 2013 Trade
Policy Review, in 2012-2013 many export taxes were removed, and others were only levied
on a few natural resource products – namely, gems, oil and gas, teak and other timber. The
intent was not only to make Myanmar’s exports more competitive on world markets, but also
to reduce the tax component in export prices. The Myanmar government strived to promote
trade by making major policy changes in the trade sector, and all exports, besides a few
specific goods, became free from commercial tax (Myanmar Investment Guide, 2014).
Moreover, the establishment of the ASEAN Economic Community (AEC) in 2015 was a
major high point in the regional economic incorporation agenda. To harmonize with the
principles of transparency, simplicity, efficiency and consistency of integration with the
ASEAN Single Window (ASW), Myanmar has been implementing its own National Single
Window (NSW). In the future, Myanmar's trade potential may improve not only with ASEAN
partners, but also globally, thereby enhancing Myanmar's role as a trading partner.

53
The objectives of the study are to understand Myanmar’s trade potential and
complementary trade in future. This can be done by testing its trade flows empirically and
comparing them with twenty other trade partners during the period of 2003 to 2015 – thirteen
years in all – and considering the following questions: Does the Gravity Model of Trade
explain Myanmar’s trade structure? How can Myanmar’s trade pattern be solved using the
trade conformity index (TCI)? What is the role of ASEAN in Myanmar’s trade sector
development?
When analysing this data three empirical equations were considered, using total trade
value, export value and import value as explanatory variables to evaluate the model. The
Hausman-Taylor test is one method for testing the random effect model. The fixed effect
model (FEM) is also appropriate for this analysis.
Myanmar’s trade structure and flow estimates can be analysed by applying the standard
gravity model to panel data. There are four sections to consider: the theoretical framework
and perspectives of some previous literature, a look at empirical methodology, a description
of the data, and finally a discussion of empirical results, leading to this study’s main findings
and remarks.
3.2. Theoretical Framework and Previous Literature Perspectives
There is an overwhelming consensus that participating in international trade can be a
dynamic and genuine driving force for economic development. In developing countries, trade
can be seen as the backbone of their economies and can expand markets from local to global.
Growing bilateral trade raises income levels and benefits both countries financially.

54
Moreover, trade between neighbouring countries is useful for economic growth and to fulfil
people’s needs at the same time. Furthermore, trade allows businesses in developing countries
to access the technologies essential for improving their productivity and competitiveness.
Today’s world trade is wider and stronger than ever before. Historically, countries’ exports
have depended on their climate and natural resource endowment.
The use of the gravity model of international trade theory intends to explain the bilateral
trade flows and patterns between two economies. It assumes two economies that influence
each other directly related to their economic size (GDP) and inversely related to their distance.
Outside of these primary variables, some anomalous trade between the two countries is either
much higher or much lower than the gravity model predicts, and economists are searching for
an explanation to this. In addition to a mutual understanding of the determining factors of
trade between countries, there are also important points in trade policy formulation. Deardorff
(1998), and Evenett and Keller (1998) found the Heckscher–Ohlin model perspective to be
consistent with the gravity equations and pointed out that the standard gravity equation can
be obtained from the Heckscher–Ohlin model with both perfect and imperfect product
specializations.
Another one of the principal uses of gravity models is to help us to identify anomalies in
trade, which are cultural affinities and trade agreements. Other relevant variables can be used
as additional explanatory variables, such as population, per capita GDP, land area, and many
dummy variables including common language, adjacency and economic integration.
Although international trade theories attempt to explain a country’s trade flow, an empirical
analysis of focused models may generate different results. The gravity equation can provide

55
a useful multivariate approach for assessing the impacts of regional trade agreements on the
level and direction of bilateral trade flows. The distance between partners is inversely related
to the degree of bilateral trade. To test this hypothesis, researchers Nguyen (2009), Nuroglu
and Dreca (2011), and Walsh (2008) use the Hausman test, while other researchers like
Keying Keum(2008) use the Linder hypothesis. Nguyen (2009) employed the Hausman–
Taylor estimation to panel data for thirty-nine countries from 1988–2002, and noted that trade
flows increased proportionately with GDP, and also that the formation of AFTA resulted in
significant trade increase among its members. Walsh (2008) mainly uses the gravity model’s
underlying variables tested with a Hausman–Taylor test, and also used a fixed effect model
(FEM), random effect model (REM) and the Breusch–Pagan test to compare REM to Pooled
Ordinary Least Squares (OLS). Keying Keum(2008) studied the trade and tourism flow in
Korea using a panel data gravity model analysis incorporating the Linder hypothesis.
Nuroglu and Dreca (2011) analysed the total trade flow by applying a modified gravity
model which also shows that the distance, GDP per capita, and GDP and population of trade
partners are major determinants of total trade flows and imports. Hout & Kakinaka (2007)
analysed trade structure and trade flow by focusing on the basic gravity model of GDP, per
capita GDP, and distance, as well as a standard gravity model of trade conformity index,
exchange rate volatility and the ASEAN dummy. Rahman and Ara (2010) analysed trade
potential by using the dynamic gravity approach with other relevant bilateral trade factors like
tariffs, trade agreements, language, trade facilitation, and non-tariff barriers.
Sohn (2001, 2005) identified trade patterns in Korea by assuming that a Heckscher–Ohlin
model explains bilateral trade flows between countries. His findings prove that South Korea's

56
trade flows could follow a Heckscher–Ohlin model. Hout & Kakinaka (2007)’s findings show
that the positive and significant coefficient on the TCI implies that a Heckscher–Ohlin
approach could be useful in explaining trade patterns. Trade flows are significantly dependent
on inter-industry trade, which comes from differences in factor endowment and monopolistic
competition.
Arabi and Ibrahim (2012) analysed Sudan’s trade patterns in light of the gravity model
using the TCI. The result showed that Sudan and its Arab trade partners have a competitive
trade structure through intra-industry trade. This means that Sudan can encourage more
economic reforms to promote trade with Arab countries and other partners. The reason is that
most of Sudan's exports to Arab countries are in the form of live and slaughtered animals,
cotton, gum Arabic, and groundnuts.
Aung (2009) analysed the structure of Myanmar's exports and the implications for
economic development, incorporating the gravity model of trade as one part of his analysis.
The author divided his study into two parts. The first part of the study points out the regional
integration and bilateral trade flow of ASEAN members plus China, India, Korea and Japan.
The second analysis shows Myanmar's trade structure based on the core gravity model
variables plus three dummy variables: neighbouring nations, domestic crisis, and regional
financial crisis. The empirical results showed that Myanmar mainly trades with neighbouring
countries, and that political unrest has a strong effect on Myanmar’s trade structure.
Lwin (2009) points out that the trade patterns of Cambodia, Laos and Myanmar (CLM),
which includes Myanmar, follow the gravity model. This analysis mainly intends to identify
the determining factors of each country’s bilateral trade flows and policy implication for

57
promoting trade. The result indicates that the GDP for each CLM nation is largely related to
their partner countries’ GDP as well as other stated variables. The CLM countries need to
promote bilateral trade with their nearby partner countries. When analysing bilateral trade in
Myanmar, one important dummy variable, sanction is used as an extra variable in the model
to examine the impact of trade sanctions. Myanmar’s actual trade volume is lower than its
trade potential with many Asian trading partner countries.
Kubo (2014) applied the gravity model to Myanmar’s non-natural resources export
potential after the lifting of economic sanctions. This study is broken into two parts. First, it
uses data from 10 ASEAN countries to analyse export potential by calculating counterfactual
exports with gravity equation regression. Second is the analysis of the effect of economic
sanctions on bilateral trade flows, using a dummy variable. His conclusion shows that
Myanmar’s actual export of non-resource goods during 2005-2010 was one-fifth of its
potential, implying that exporting to neighbouring countries failed to compensate for export
losses to Western sanctions.
Hout & Kakinaka’s (2007) model was used in this study, but some explanatory variables
are different due to the limited data available about Myanmar’s economy. In this study, the
main focus was on the standard gravity model as applied to Myanmar and its partner countries’
real GDP, and the bilateral trade flow between them. However, unlike Hout & Kakinaka
(2007), real GDP per capita was ignored, and TCI was calculated based on one year’s
import/export market share between Myanmar and its partner countries. Like Nguyen (2009),
Nuroglu and Dreca (2011) and Walsh (2008), the Hausman-Taylor test was used. However,
the precedent of Keying Keum (2010) was followed and the Linder hypothesis was
58
incorporated. However, some researchers neglect hypothesis testing in their gravity model of
trade analysis.
3.3. Empirical Methodology
Many empirical studies and analyses of international trade have accepted that the gravity
equation is linked to a number of models, including the Ricardian, the Heckscher–Ohlin, and
the monopolistic competition models. It is at the heart of any model of trade (Kimura & Lee,
2006). The empirical methodology here is based on a panel data analysis of trade structure
and trade flow in Myanmar using the gravity model, following Hout & Kakinaka (2007).
Nguyen (2009) and Nguyen (2010) also followed this panel data analysis to estimate trade
flow. There is a related data set consisting of the total trade flow among Myanmar and 20 of
its trade partner countries. Export and import values act as dependent variables, while
independent variables consist of Myanmar’s GDP, its partner countries’ GDP, Myanmar GDP
times with partner country’s GDP and the distance between Myanmar and its partner
countries. These variables serve as an approximation for economic size and purchasing power
of the two economies, and bilateral trade volume will rise when a country’s GDP and per
capita GDP increase. Moreover, the distance between Myanmar and its partner countries is
taken as a proxy for the cost of trade, which reflects various trade resistance factors like market
access barriers, transportation costs, and delivery time.
To analyse the peculiarities of Myanmar’s trade patterns, three new variables are the
ASEAN trade network, exchange rate volatility, and the trade complementarity index (TCI).
TCI can measure the degree of complementary trade between two countries and reflect

59
different factor endowments, which is in line with the Heckscher-Olin model. In previous
studies about Myanmar’s trade structure, TCI was not used as a single variable. Concerning
exchange rate volatility, every economy is still influenced by the exchange rate between local
currency and the US dollar. VOL is an explanatory variable used to incorporate the impact of
exchange rate volatility in this gravity equation, and I calculate the exchange rate volatility
between the US dollar and the partner country’s currency. From a theoretical point of view,
exchange rate fluctuation between countries is an essential monitor for trade as it allows trade,
discourages risk, and covers the risk of profit uncertainty related to international transactions.
Since regional trade cooperation is important in determining Myanmar’s trade flows,
including ASEAN as a dummy variable sets a standard which will be set to unity if the country
is a member of ASEAN, and zero otherwise.
The empirical gravity equation used combines the basic gravity model with the standard
gravity model, plus three new variables. The standard gravity model could be analysed with
these three conditions to clarify the result:
lnTij =0+1 lnYi +2lnYj + 3 lnYi Yj + 4lnDij +5ASEANij +6VOLj+ 7TCIij + it
-------------- (1)
lnExij =0+1 lnYi +2lnYj + 3 lnYi Yj + 4lnDij +5ASEANi j+6VOLj+ 7TCIij + it
------------(2)
lnImij =0+1 lnYi +2lnYj + 3 lnYi Yj + 4lnDij+5ASEANij+6VOLj+ 7TCIij + it
-----------(3)
In these equations, Tijt, Exij and Imij denote total trade value, export value and import
value between Myanmar and Country J. Yi, and Yj indicate the GDP of Myanmar and Country

60
J, respectively. Dij refers to the distance between Myanmar and Country J. ASEANij is a
dummy variable; it will be set to unity if Country J belongs to ASEAN, and zero otherwise.
VOLj indicates the volatility of the nominal exchange rate between the US dollar and Country
J’s currency. TCIij is the trade conformity index, or measure of trade complementarities
between bilateral trade. it is an error term, while 1, 2, 3, 4, 5, 6, and 7 are coefficients.
With reliable empirical methodology, a random effects model is appropriate, though
many researchers only use two methods for estimating unobserved effects from panel data
models. Even though these methods are somewhat harder to describe and implement, several
econometric packages support them. The fixed effects estimator uses a transformation to
remove the unobserved effect ai before estimation. The random effects estimator is attractive
when the unobserved effect is uncorrelated with all the explanatory variables. (Wooldridge,
2013, p. 466). In usual pooled OLS, standard errors ignore this correlation. The random effect
transformation subtracts a fraction of the time average, but a fixed effects estimator subtracts
the time average of the corresponding variable. One advantage of random effect is that all
explanatory variables are constant over time because the unobserved effect is uncorrelated
with all explanatory variables (Wooldridge, 2013). In many applications, the primary reason
for using panel data is to allow the unobserved effect to correlate with the explanatory
variables.
The Hausman–Taylor test supports empirical methodology. Hausman (1978) first
proposed such a test, and some econometrics packages routinely apply the Hausman test under
the full set of random effect assumptions. The idea is that one uses the random effects
estimates unless the Hausman test eliminates them (Wooldridge, 2013, p. 478). I use the

61
Hausman test to examine whether the specification of the REM is correct or not. When
analyzing this model practically, it should be noted that it contains both time-variant variables
like GDP, exchange rate, and the ASEAN dummy, as well as time-invariant variables, such
as distance.
3.4. Data Description
The pooled OLS estimation uses panel data to test the empirical gravity equation and
covers a period from 2003 to 2015, totaling 13 years. It investigates Myanmar’s trade structure
and trade flow by comparing the 20 trading partner countries, including 10 Asian countries
and 10 Western countries. Data related to Myanmar was gathered from international
organizations such as the International Monetary Fund (IMF), which issued data called
International Financial Statistics (IFS) and Direction of Trade Statistics (DOTS) in the IMF
World Economic Outlook Database (2016). Other data sources were the International Trade
Statistics of International Trade Center (UNCTAD), the World Trade Organization (WTO),
the International Trade Centre of Trade Statistics for International Business Development
(Trade Map), and distances were found from the World Clock – Worldwide
(https://www.timeanddate.com/worldclock/).
All data is shown in US dollars and GDP is adjusted by the US GDP deflator as a real
term, with distance measured in kilometers (km). Trade data is computed as total trade value,
with export value and import value shown separately in this analysis. The main source of this
information is DOTS. The distance between countries measured is from Myanmar’s capital
city, Naypyidaw, to each partner country’s capital city. Times are taken from the World Clock

62
– Worldwide website. Exchange rate volatility is calculated from the partner countries’
exchange rate volatility by computing the standard deviation for each country. It is not
difficult to get exchange rates from the IMF, and all rates are identical for the members of
European Union as they all use the same currency, the euro.
3.4.1. The ASEAN Dummy
As Myanmar is member of ASEAN, the ASEAN dummy variable is used in this study as
a measure of unity if the partner country is also an ASEAN member, and otherwise it is
considered to be zero. Using an ASEAN dummy is one key point for this analysis as ASEAN
is a critical regional organization for ASEAN member countries. In Myanmar’s current trade
position, import is a more favorable point than export. The customs duties levied on the import
of machinery, spare parts, and other inputs range from nil to 40 percent of the imported goods’
value (Asia Tax Guide, 2013).
3.4.2. Trade Conformity Index
The TCI measures the degree of trade complementarity or competitiveness between two
countries. The TCI is calculated using a three-digit number assigned under the Standard
International Trade Classification (SITC). It represents the commodities that are produced by
a nation with similar factors and technology. Following the ways of Sohn (2005) and Hout &
Kakinaka (2007), the TCI measures the degree of trade complementarity between two
countries and reflects factor endowment differences. The higher the degree of trade
complementarity, the larger the differences in factor endowment and trade flow increase, as
checked against the Heckscher–Ohlin model. The TCI between country i and country j is

63
calculated in the following form:
𝑇𝐶𝐼𝑖𝑗 = ∑ 𝑋𝑘𝑖𝑛𝑘=1 𝑀𝑘𝑗 [∑ 𝑋𝑘𝑖
2𝑛𝑘=1 ∑ 𝑀𝑘𝑗
2𝑛𝑘=1 ]
−1
2 --------------(4)
where TCI equals trade conformity index, i and j refer to a country and its potential trade
partner, and k means a commodity group. Xki is the share of commodity group k in the exports
of country i, Mkj is the commodity group k’s share in the imports of the country j. Xki is the
share of commodity group k in Myanmar's export to her partner countries, and Mkj is the
share of product k in the partner country’s import from Myanmar. If the empirical result is
captured by the measure of trade structure, it will be consistent with the Heckscher–Ohlin
model of factor endowment difference between countries with inter-industry trade.
The TCI ranged from zero to one. The TCI is one means in which Myanmar’s export
share is related to its partner countries’ import share, and Myanmar has an equal trade share
against its partner countries. Where TCI equals zero, Myanmar’s export share is smaller than
its partner country’s import share, and Myanmar does not have a perfectly fair-trade share
against its partner country. The TCI is calculated based on a trade map of export and import
shares of Myanmar and its partner countries. Myanmar and its partner countries’ bilateral
trade in 2015 is a uniform commodity group of 85 electrical and electronic equipment products
gathered from International Trade Centre of Trade Statistics for International Business
Development (Trade Map).
However, the trade indicators to calculate various useful trade indices with the underlying
UN Comtrade data show the TCI can support relevant information on predictions for
intraregional trade. One benefit of this is that the values for states considering the formation

64
of a regional trade agreement can be compared with others that have formed or tried to create
similar arrangements. The World Bank calculates the TC trade indicator with this equation:
TCij = 100(1 – sum (|mik – xij| / 2)) ------------------(5)
Here, xij is the share of good i in global exports of country j and mik is the country k’s
share of good i in all imports (Trade Indicator-World Bank). The index is zero if one country
exports no product that is imported by the other, and if the export and import shares are both
exactly 100.
Table 3.1 Data description
Variables
Unit N Mean
Max Min Std. Dev.
Total Trade Value USD (mil) 260 869.22 24474.32 0.19 2291.68
Export Value USD (mil) 260 340.77 14161.96 0.00 1103.20
Import Value USD (mil) 260 528.47 10325.56 0.03 1322.94
Myanmar Real GDP USD (bil) 260 38.46 61.00 14.00 18.74
Partner Countries’
Real GDP
USD (bil) 260 2257.52 16349.00 97.00 3336.17
Myanmar and
Partner Countries
Real GDPs
USD (bil)
260 91570.44 997610.00 1345.00 158570
Distance km 260 5804.73 13472.00 815.00 3629.63
ASEAN Dummy 260 0.25 1.00 0.00 0.43
Trade Conformity
Index %
260 0.18 0.92 0.00 0.30
Exchange Rate
Volatility US $
260 0.0380 0.1225 0.00 0.0294
Sources: International Monetary Fund: Direction of Trade Statistics, World Economic Outlook
Database, International Trade Statistics of International Trade Center, World Clock-Worldwide.
65
Sohn (2005) explains that the estimate of the coefficient becomes positive when trade
volume increases with the rising trade complementarities; this is precisely what is represented
by the Heckscher–Ohlin trade model of inter-industry trade. On the other hand, the coefficient
becomes negative when the trade volume increases with the falling trade complementarities.
This could occur where trade volume increases with increasing competitive trade
structure and represents the differentiated product model of intra-industry trade. International
trade allows for the creation of an integrated market that is larger than any one country’s
market. Thus, it is possible to simultaneously offer consumers a greater variety of products
and lower prices. The type of trade generated by this model is an intra-industry trade
(Krugman, Obstfeld, & Melitz, 2012, p. 178). Regarding ‘inter-industry’ and ‘intra-industry,’
there is an important difference. In theory, the trade of products that belong to different
industries is called inter-industry trade. By contrast, scholars define intra-industry trade as the
trading of similar products that belong to the same industry. This has been a key factor in trade
growth in recent decades.
3.5. Empirical Results, Discussion, and Hypothesis Testing
This study solves a gravity equation that combines the basic gravity model with the
standard gravity model. Panel data analysis allows more variability and reduces the
multicollinearity between variables and some time-invariant factors characterized by trading
partners affecting Myanmar’s trade structure and trade flow. If this point is ignored,
regressions may occur from an omitted variable problem. As a consequence, the inconsistent
and biased coefficients can be overcome by controlling for unobserved individual effects in

66
the random effects model (REM). As model evaluation data analysis, three empirical
equations are used to prove the model’s accuracy: total trade, export value, and import value.
This study uses the three types of estimation concerning GDP. One uses only Myanmar’s
GDP and the partner country’s GDP with other variables; a second one is Myanmar’s GDP
times to partner country’s GDP and other variables; the last one is a full model which
combines both types and all other variables in the analysis. OLS estimation and random effect
estimation are shown separately. The Hausman test can examine whether the REM or FEM
specification is appropriate. The estimated results are shown in Table 3.2 to Table 3.11,
respectively. Standard errors are fully robust standard errors in all test results.
Table 3.2 shows the OLS estimation result for three explanatory variables: total trade
value, export value, and import value. It does not include the Myanmar’s GDP times to partner
country’ GD to clarify Myanmar’s trade structure with the gravity model. All results from the
explanatory variables are similar, except where the coefficient of Myanmar’s GDP is negative
and therefore insignificant when using export as a dependent variable. When considered with
standard gravity, Myanmar’s trade structure also matches previous studies.
Other explanatory variables, such as the ASEAN dummy, partner countries’ exchange
rate volatility, and the TCI, do not differ like they did in the previous estimation, and they
stand as statistically insignificant. However, the ASEAN dummy has a slightly negative
relationship with the export value of Myanmar. If the partner countries’ exchange rate is
unstable, it will impact Myanmar’s trade improvement. However, there is not a strong
relationship between Myanmar and partner countries’ exchange rate in this model.

67
Table 3.2 Standard Gravity Model (OLS Pool Estimation) Type I Estimation
(without RyiRyj)
Dependent variables: total trade value, export value and import value
Note: *, **, and *** denote statistical significance within 10%, 5%, and 1% respectively. Numbers
in parentheses are t-statistics.
Total Trade
Ln (Tot)
Export
Ln (Ex)
Import
Ln (Im)
Constant 20.36***
(8.6)
21.69***
(9.65)
18.84***
(5.04) Ln Ryi 0.36***
(2.51)
-0.07
(-0.36)
0.82***
(6.28)
Ln Ryj 1.1***
(5.99)
1.2***
(6.4)
1.14***
(6.29)
Ln Distance -2.9 ***
(-11.3)
-3.06***
(-16.62)
-3.03***
(-6.52)
ASEAN Dummy 0.25
(0.44)
-0.39
(-0.78)
0.62
(0.87)
TCI -0.27
(-0.59)
-0.36
(-1.02)
-0.18
(-0.26)
E.R. Volatility 3.32
(0.49)
1.01
(0.10)
0.46
(0.07)
F-Statistics 129.16*** 76.28*** 124.52***
Adjusted R-Squared 0.75 0.64 0.74
No. of Observations 260 253 260

68
Table 3.3 Standard Gravity Model (Random Effect) Type I Estimation
(without Ryi Ryj) Dependent variables: total trade value, export value and import value
Note: *, **, and *** denote statistical significance within 10%, 5%, and 1% respectively. Numbers
in parentheses are t-statistics.
The TCI shows a negative coefficient value which is insignificant in all three variables.
If this index is statistically significant, trade volume increases with increasingly competitive
trade structure and represents a differentiated product model within intra-industry trade. To
be precise, Myanmar is still dependent on its natural resources. Adjusted R-squared and F-
statistics show the model’s fitness to be used for data analysis. Table 3.3 shows random effect
results, and its outcome is nearly the same as Table 3.2, albeit smaller than the adjusted R-
squared. However, F-statistics show statistical significance within one percent.
Total Trade
Ln (Tot)
Export
Ln (Ex)
Import
Ln (Im)
Constant 20.53***
(8.73)
22.19***
(9.39)
19.9***
(4.49) Ln Ryi 0.38**
(2.47)
-0.08
(-0.42)
1.01***
(7.66)
Ln Ryj 1.05***
(5.7)
1.31***
(6.78)
0.53***
(3.12)
(3.12) Ln Distance -2.88***
(-11.23)
-3.22***
(-14.14)
-2.7***
(-5.93)
ASEAN Dummy 0.17
(0.29)
-0.31
(-0.66)
-0.14
(-0.15)
TCI -0.30
(-1.05)
-0.42
(-1.51)
-0.12
(-0.37)
E.R. Volatility 3.06
(0.46)
2.8
(0.28)
-1.62
(-0.21)
F-Statistics 29.2*** 18.34*** 50.96***
Adjusted R-Squared 0.40 0.29 0.54
No. of Observations 260 253 260

69
Table 3.4 Standard Gravity Model (OLS Pool Estimation) Type II Estimation
(without Ryi, Ryj) Dependent variables: total trade value, export value and import value
Note: *, **, and *** denote statistical significance within 10%, 5%, and 1% respectively. Numbers
in parentheses are t-statistics.
These tables (Table 3.4 and 3.5) show the OLS estimation result and random effect result
of the coefficient of Myanmar’s GDP times with the partner country’s GDP for the three
explained variables without including separate form variables. The results show that the
coefficient of Myanmar’s GDP times to the partner country’s GDP positively affects
Myanmar’s trade flow, export values, and import values. These numbers are statistically
significant within one percent. This outcome, which is supported by previous studies, serves
as robust evidence that the GDP can visibly explain Myanmar’s trade structure with standard
gravity. Distance follows the previous researcher’s outcome.
Total Trade
Ln (Tot)
Export
Ln (Ex)
Import
Ln (Im)
Constant 19.02***
(6.58)
19.91***
(5.76)
18.29***
(4.84) Ln Ryi Yj 0.85***
(7.88)
0.75***
(5.16)
1.03***
(9.75)
Ln Distance -2.73***
(-9.86)
-2.81***
(-10.32)
-2.96***
(-6.57)
ASEAN Dummy -0.02
(-0.04)
-0.9
(-1.46)
0.50
(0.68)
TCI -0.11
(-0.25)
-0.04
(-0.96)
-0.11
(-0.16)
E.R. Volatility 2.82
(0.4)
1.38
(0.13)
0.25
(0.04)
F-Statistics 136.02*** 70.78*** 146.95***
Adjusted R-Squared 0.72 0.58 0.74
No. of Observations 260 253 260

70
The ASEAN dummy, partner countries’ exchange rate volatility, and TCI are not
statistically significant in all equations. However, the ASEAN dummy is negatively related to
total trade and export value, but positively related to import value. This means that the
development of Myanmar’s export sector is not wholly dependent on ASEAN, while ASEAN
has an insignificant impact on import. The coefficient of TCI values is negative for total value,
export value, and import value, but not significant in any case. Partner countries’ exchange
rate volatility has a significant and negative impact on Myanmar’s total trade and import,
reaching five percent when import is a dependent variable. The lesser the exchange volatility
of partner countries, the larger the total trade and import values. As with the random effect
model, adjusted R-squared and F-statistics can actively show the usefulness of the model.
The explanatory results of Table 3.5 are nearly the same as Table 3.4, but with a
negative ASEAN dummy, the random effect test shows a statistical significance within 10%.
The effect of the exchange rate volatility of partner countries on import is negative, but not
significant.

71
Table 3.5 Standard Gravity Model (Random Effect) Type II Estimation
(without Ryi, Ryj) Dependent variables: total trade value, export value and import value
Note: *, **, and *** denote statistical significance within 10%, 5%, and 1% respectively. Numbers
in parentheses are t-statistics.
When discussing OLS regression results, explanatory variables are Myanmar’s GDP,
partner countries’ GDPs, Myanmar’s GDP times to partner countries, distance, the ASEAN
dummy, the TCI, and partner countries’ exchange rate volatility, shown in US dollars. Table
3.6 shows the result of the OLS regression of standard gravity for the three explained
variables; total value, export value, and import value.
Total Trade
Ln (Tot)
Export
Ln (Ex)
Import
Ln (Im)
Constant 20.9***
(6.32)
22.36***
(5.53)
19.52***
(5.32)
Ln Ryiyj 0.58***
(6.89)
0.43***
(2.77)
0.86***
(13.83)
Ln Distance -2.61***
(-7.29)
-2.7***
(-6.32)
-2.88***
(-6.82)
ASEAN Dummy -0.38
(-0.53)
-1.33*
(-1.87)
0.27
(0.34)
TCI -0.17
(-0.53)
-0.02
(-0.04)
-0.16
(-0.51)
E.R. Volatility 1.69
(0.22)
1.23
(0.11)
-0.51
(-0.08)
F-Statistics 32.4*** 14.45*** 59.92***
Adjusted R-Squared 0.38 0.21 0.53
No. of Observations 260 253 260
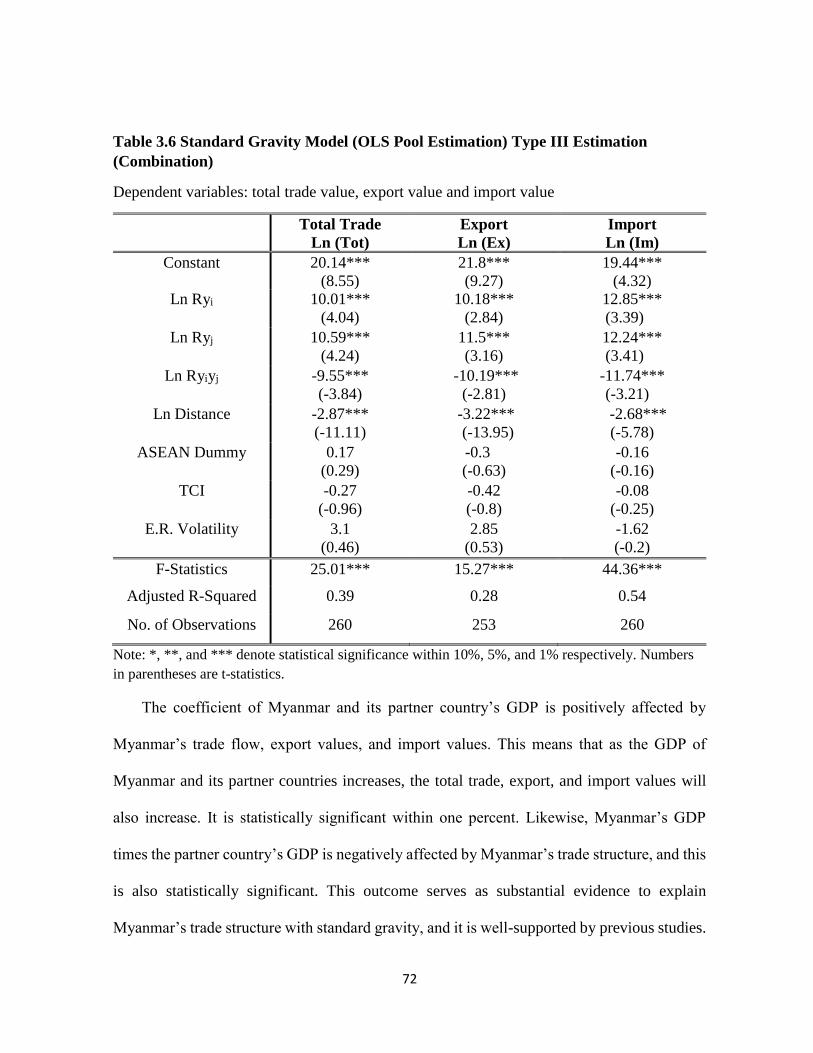
72
Table 3.6 Standard Gravity Model (OLS Pool Estimation) Type III Estimation
(Combination)
Dependent variables: total trade value, export value and import value
Total Trade
Ln (Tot)
Export
Ln (Ex)
Import
Ln (Im)
Constant 20.14***
(8.55)
21.8***
(9.27)
19.44***
(4.32) Ln Ryi 10.01***
(4.04)
10.18***
(2.84)
(2.84)
12.85***
(3.39)
Ln Ryj 10.59***
(4.24)
11.5***
(3.16)
12.24***
(3.41)
Ln Ryiyj -9.55***
(-3.84)
-10.19***
(-2.81)
(-2.81)
-11.74***
(-3.21)
Ln Distance -2.87***
(-11.11)
-3.22***
(-13.95)
-2.68***
(-5.78)
ASEAN Dummy 0.17
(0.29)
-0.3
(-0.63)
-0.16
(-0.16)
TCI -0.27
(-0.96)
-0.42
(-0.8)
-0.08
(-0.25)
E.R. Volatility 3.1
(0.46)
2.85
(0.53)
-1.62
(-0.2)
F-Statistics 25.01*** 15.27*** 44.36***
Adjusted R-Squared 0.39 0.28 0.54
No. of Observations 260 253 260
Note: *, **, and *** denote statistical significance within 10%, 5%, and 1% respectively. Numbers
in parentheses are t-statistics.
The coefficient of Myanmar and its partner country’s GDP is positively affected by
Myanmar’s trade flow, export values, and import values. This means that as the GDP of
Myanmar and its partner countries increases, the total trade, export, and import values will
also increase. It is statistically significant within one percent. Likewise, Myanmar’s GDP
times the partner country’s GDP is negatively affected by Myanmar’s trade structure, and this
is also statistically significant. This outcome serves as substantial evidence to explain
Myanmar’s trade structure with standard gravity, and it is well-supported by previous studies.

73
The results show that the distance is inversely related and statistically significant within one
percent in all three types of rational equations. The larger the distance between the countries,
the lesser the trade value between those two countries, a finding which harmonizes with the
previous gravity model concept of trade.
As a member of ASEAN, ASEAN has a relationship with Myanmar for exports and
imports. Some ASEAN countries, especially Thailand and Singapore, trade more with
Myanmar than others. The ASEAN dummy has a positive effect relative to export, import,
and total trade structure, but that effect is statistically insignificant. The problem with this
analysis is that only five members of ASEAN are included rather than the whole organization.
Therefore, the ASEAN dummy cannot thoroughly explain Myanmar’s total trade flow, even
though Myanmar is part of ASEAN and an active participant in AFTA, and Thailand and
Singapore are among Myanmar's top five trading partners in this region.
Another explanatory variable, partner countries’ exchange rate volatility, is directly
affected by all three dependent variables, but it stands as statistically insignificant. The
exchange rate volatility variable in this model measures the effect of Myanmar’s partner
countries’ exchange rate volatility on imports of US dollars versus the local currency. If the
partner countries’ exchange rates are stable, their trade relationship with Myanmar will
improve. The exchange volatility of partner countries is based solely on those countries’
exchange rates with the US dollar only. Although exchange rate volatility is one critical point
for trade between countries, there is not a strong relationship between Myanmar and its partner
countries’ exchange rates in this model.
74
The trade conformity index (TCI) is a core variable for this analysis. The TCI shows
Myanmar's inter-industry trade following the Heckscher–Ohlin model of comparative
advantages of factor endowment differences between nations. It has a negative coefficient
value,but is insignificant in all three variables. Sohn (2005) showed that if the estimate of the
coefficient is positive and greater than zero, trade volume increases with the rising trade
complementarities. On the other hand, the coefficient becomes negative when the trade
volume increases with the falling trade complementarities. This could occur where trade
volume increases with increasing competitive trade structure and represents the differentiated
product model of intra-industry trade. Intra-industry trade plays an even more prominent role
in the trade of manufactured goods among advanced industrial nations, which accounts for
much global trade. The proportion of intra-industry trade among global trade has steadily
grown over the last half century (Krugman, Obstfeld, and Melitz, 2012, p. 169). Adjusted R-
squared and F-statistics show that this model is acceptable for data analysis.
Table 3.7 shows the result of the random effects model of standard gravity with the three
explained variables (total trade, export value, and import value) concerning Myanmar’s trade
with its partner countries. The empirical results show that both the distance between Myanmar
and its partner countries and also their respective GDPs are statistically significant within one
percent in all three types of rational equations, a finding which matches the gravity model
concept of trade. Table 3.7 shows results similar to the OLS method in Table 3.6.

75
Table 3.7 Standard Gravity Model (Random Effect) Type III Estimation
(Combination)
Dependent variables: total trade value, export value and import value
Total Trade
Ln (Tot)
Export
Ln (Ex)
Import
Ln (Im)
Constant 19.99***
(8.5)
21.28***
(9.63)
18.42***
(4.94) Ln Ryi 10.85***
(3.75)
(3.75)
11.48***
(3.11)
(3.11)
12.73***
(2.98)
Ln Ryj 11.50***
(3.94)
(1.22)
12.66***
(3.41)
(-3.06)
12.94***
(3.11)
Ln Ryiyj -10.40***
(-3.57)
(-1.1)
-11.46***
(-3.08)
(-3.08)
-11.81***
(-2.83)
Ln Distance -2.89***
(-18.10)
-3.06***
(-16.62)
-3.03***
(-.6.5)
ASEAN Dummy 0.25
(0.44)
-0.39
(-0.77)
0.62
(0.87)
TCI -0.27
(-0.58)
-0.36
(-1.32)
-0.18
(-0.25)
E.R. Volatility 3.32
(0.48)
0.99
(0.10)
0.46
(0.07)
F-Statistics 110.99*** 65.48*** 106.99***
Adjusted R-Squared 0.75 64 0.74
No. of Observations 260 253 260
Note: *, **, and *** denote statistical significance within 10%, 5%, and 1% respectively. Numbers
in parentheses are t-statistics.
The OLS regression results of the standard gravity equation as the dependent variable of
total trade value leaving with one new variable (ASEAN dummy, exchange rate volatility,
and TCI). Each estimation results in a similar outcome, and the original gravity variables are
significant within one percent and can therefore confirm the trade structure. However, there
is no provable result from the new gravity model, even though one variable was left from the
estimation like the full standard gravity model. Myanmar’s GDP times to partner countries’

76
GDP is negatively related to Myanmar’s total value, and it’s statistically significant within
one percent. (see Table 3.8)
Table 3.8 Standard Gravity Model (OLS Pool Estimation)
Dependent variable: total trade value
Without TCI Without Exchange
Rate Volatility
Without ASEAN
Dummy
Constant 19.27***
(8.09)
20.56***
(8.53)
20.94***
(9.44) Ln Ryi 10.9***
(3.73)
10.88***
(3.84)
10.88***
(3.67)
Ln Ryj 11.54***
(3.93)
11.52***
(4.02)
11.49***
(3.89)
Ln Ryiyj -10.45***
(-3.56)
-10.43***
(-3.66)
-10.42***
(-3.51)
Ln Distance -2.82***
(-10.86)
-2.94***
(-11.34)
-2.98***
(-13.25)
ASEAN Dummy 0.33
(0.53)
0.17
(0.26)
-
TCI - -0.38
(-0.86)
-0.36
(-0.62)
E.R. Volatility 3.98
(0.62)
-- 2.73
(0.38)
F-Statistics 129.3*** 128.59*** 129.24***
Adjusted R-Squared 0.75 0.75 0.75
No. of Observations 260 260 260
Note: *, **, and *** denote statistical significance within 10%, 5%, and 1% respectively. Numbers
in parentheses are t-statistics.

77
Table 3.9 Standard Gravity Model (OLS Pool Estimation)
Dependent variable: export value
Without TCI Without Exchange
Rate Volatility
Without ASEAN
Dummy
Constant 20.35***
(7.31)
21.43***
(9.02)
19.79***
(10.12)
Ln Ryi 11.52***
(3.14)
11.5***
(3.18)
11.49***
(3.16)
Ln Ryj 12.67***
(3.44)
12.68***
(3.49)
12.74***
(3.47)
Ln Ryiyj -11.48***
(-3.1)
-11.48***
(-3.14)
-11.49***
(-3.12)
Ln Distance -2.95***
(-11.77)
-3.07***
(-15.89)
-2.93***
(-14.71)
ASEAN Dummy -0.29
(-0.5)
-0.41
(-0.74)
-
TCI - -0.39
(-1.04)
-0.22
(-0.51)
E.R. Volatility 1.94
(0.21)
- 1.76
(0.18)
F-Statistics 76.17*** 76.65*** 75.91***
Adjusted R-Squared 0.64 0.64 0.69
No. of Observations 253 253 253
Note: *, **, and *** denote statistical significance within 10%, 5%, and 1% respectively. Numbers
in parentheses are t-statistics.
The OLS regression results of the standard gravity equation as the dependent variable of
export value and import value leaving with one new variable (ASEAN dummy, exchange rate
volatility, and TCI). Each estimation results in a similar outcome, and the original gravity
variables are significant within one percent and can therefore confirm the trade structure.
Myanmar’s GDP times to partner countries’ GDP is negatively related to Myanmar’s total
trade value, and it’s statistically significant within one percent. (see Table 3.9)

78
Table 3.10 Standard Gravity model (OLS pool estimation)
Dependent variable: import value
Without TCI Without Exchange
Rate Volatility
Without ASEAN
Dummy
Constant 17.95***
(6.00)
18.50***
(5.12)
20.8***
(6.5)
Ln Ryi 12.77 ***
(2.99)
12.74***
(2.99)
12.8***
(2.92)
(1.3) Ln Ryj 12.97***
(3.11)
12.95***
(1.13)
12.92***
(3.04)
Ln Ryiyj -11.84***
(-2.84)
-11.81***
(-2.84)
-11.86***
(-2.77)
Ln Distance -2.97***
(-7.34)
-3.03***
(-6.55)
-3.23***
(-7.99)
ASEAN Dummy 0.67
(0.97)
0.61
(0.8)
--
TCI -- -0.19
(-0.30)
-0.42
(-0.53)
E.R. Volatility 0.9
(0.15)
-- -1.02
(-0.15)
F-Statistics 125.1*** 125.3*** 121.8***
Adjusted R-squared 0.74 0.74 0.74
No. of Observations 260 260 260
Note: *, **, and *** denote statistical significance within 10%, 5%, and 1% respectively. Numbers
in parentheses are t-statistics.
When analyzing Myanmar’s trade structure, import has more influence than export, and
the import value is larger than export during this period. US and Western sanctions greatly
affected Myanmar’s economy and trade sector. If we ignore the TCI and exchange rate
volatility, ASEAN is a strong influencing factor on Myanmar’s trade sector improvement.
The ASEAN dummy is negatively related to export value and positively to import value, but
not significant in either case. If we do not include the TCI and ASEAN dummy, exchange rate
volatility is positively related to import value but negatively to export value. However, the

79
TCI leads to the same outcome in both two estimations without including the other two
variables in the model (see Table 3.10)
Table 3.11 Hausman Test Result
Appropriateness of Fixed Effect Model (FEM) or Random Effect Model (REM)
Equations 1 Equations 2 Equations 3
Total Trade Value REM REM FEM
Export Value REM REM FEM
Import Value REM REM REM
Sources: own calculations
The Hausman test is the best statistical test to decide whether the fixed or random effect model
is appropriate for all empirical models of gravity analysis. Walsh (2008) first used the
Hausman-Taylor model to estimate the gravity equation for services trade. He found the
random effects model is a superior model for his empirical analysis, proved that it suffers from
heterogeneity bias in the gravity model, and avoided the problems associated with trying to
account for time-invariant variables using a fixed-effects model. The null hypothesis is that
the random effect model is an appropriate and alternative hypothesis that the fixed effect
model is appropriate. If chi-square statistics are not significant, it cannot reject Ho and accept
H1. In previous studies, it was found that the random effect model is appropriate when
comparing them. Due to time-invariant variables, the fixed effect model is inappropriate for
analysis. All testing from Type I and Type II indicates that the random effect model is
appropriate, but Type III estimation of dependent variables shows that the fixed effect model
is appropriate. Therefore, we can conclude that the random effect model is appropriate for
analyzing Myanmar’s trade structure and flow with the standard gravity model.

80
3.6. Conclusion and Finding
This analysis points out concerns with Myanmar’s trade structure, but indicates that the
trade flow will continue to flourish in the future. Based on this study's empirical result, the
gravity model can explain Myanmar’s trade structure and flow completely with the outcomes
in the model. Like Sohn (2005), Hout & Kakinaka (2007), and Arabi, K. & Ibrahim (2012),
the positive and significant coefficient of the TCI implies that a Heckscher–Ohlin presumption
could be appropriate in explaining trade patterns. Trade flows are significantly dependent on
the inter-industry trade that comes from factor endowment difference, and the intra-industry
trade that comes from monopolistic competition. Thus, the trade with developed countries
results in a TCI that reflects large endowment differences, hence inter-industry trade. As
Myanmar’s economy is mainly based on natural resource exports, that means that Myanmar
needs to promote trade competitiveness on the world market.
Though endowed with many natural resources and human resources, Myanmar is
experiencing a lag in economic development compared to other Southeast Asian countries.
Myanmar could not utilize her resources efficiently for an extended period. Foreign exchange
rate instability has had serious effects on trade sector development and the nation’s trade
value. It hinders foreign direct investment and dampens the enthusiasm of potential investors.
In the past, bilateral trade between Myanmar and Western countries was quite weak, although
neighboring countries are the most important trade partners for Myanmar. For a long time, the
United States of America’s sanctions on Myanmar affected the economy and likely prevented
trade sector development and trade flow. Since the democratic government took power and
converted the administrative system, Myanmar has had a chance to create new economic
81
opportunities and promote openness in the trade sector. Exports are crucial for economic
development, and export production tends to be more labor-intensive and creates new jobs for
the domestic market. Tariff protection in Myanmar is relatively light as it is still a developing
country, even compared to other ASEAN countries. With a few exceptions, most imported
goods are subject to duties and must be declared to the Myanmar Customs Department
accordingly.
Currently, the new government is striving to promote Myanmar’s economy by reviewing
and enacting foreign economic policy to improve trade sector and economic development.
With the exception of Thailand, ASEAN countries trade far less with Myanmar than they do
with their other neighbors. Previous researchers didn’t use the trade conformity index (TCI)
when analyzing Myanmar’s trade structure. The ASEAN dummy shows that Myanmar still
needs to tie itself closer to ASEAN for trade improvement. Partner counties’ exchange rate
volatility has a positive effect on total trade and exports,but does not affect imports. One of
the weaknesses of this analysis is the absence of a comparison between Myanmar and its
partner country’s exchange rate volatility. The TCI generates trade volume increases with
falling trade complementarities as well as with increasing competitive trade structure, and it
represents the differentiated product model with intra-industry trade. Myanmar’s level of trade
performance is still lower than other ASEAN member countries and neighboring countries.
FEM does not allow for estimating time-invariant variables. However, REM has the
advantage of handling these kinds of explanatory variables and matches with this analysis and
the Hausman test matches with this analysis. Although some results were shown as

82
statistically insignificant, the standard gravity model can completely explain the trade
structure and flow of Myanmar.

83
CHAPTER IV
The Effects of Trade Openness and Exchange Rate Volatility on Foreign Direct
Investment in Myanmar and ASEAN
4.1 Introduction
Developing countries were focused on export-oriented industries and foreign direct
investment (FDI) emerged as the most important source of external resource inflow.
International trade and FDI are leading factors that drive economic growth. When analyzing
the main determinants of FDI, country-specific characteristics are widely accepted, especially
factors related to the host country market. UNCTAD (1998) highlighted that the
characteristics of host markets are major driving factors of FDI flows. Trade facilitation
challenges allow broader investment climate weaknesses, especially those affecting small and
medium-sized enterprises (SMEs) and entrepreneurs, difficulties accessing financing to
support export-oriented activities, and capacity challenges in trade promotion institutions. An
analysis of the long-term challenges of economically integrating the Association of South East
Asian Nations (ASEAN) through trade and FDI indicated that trade flows and inward FDI
mutually reinforce each other and that a larger market tends to attract more even more inward
FDI) (Kawai & Naknoi, 2016).
Myanmar is rich in natural resources, has a young labor force and is in a strategic
geographic location between the two economics giants of India and China. The government
has initiated a broad range of reforms to open its economy to foreign trade and foreign
investment in Myanmar. As one of the least developed countries in the region, capital

84
inadequacies highlight the difficulties in promoting large scale production and exports.
Myanmar has various agricultural and forestry resources, marine resources in coastal areas
and it is possible that a wide range of efficient agricultural, forest and fishery products needed
in overseas consumer markets could be produced and exported. However, Myanmar faced
some politically motivated economic sanctions and there were few foreign investors apart
from neighboring and some Asian countries. Although imports had a strong effect on
Myanmar’s economy, export promotion stagnated, which in turn had a negative effect on FDI
inflows into Myanmar.
Since 2011, trade and investment have expanded rapidly in Myanmar, bolstered by
economic liberalization, legal reforms, a large untapped domestic market and a favorable
geographic position sharing borders with Bangladesh, China, India, Laos and Thailand.
Sufficient infrastructure development is an essential prerequisite to encourage industrial and
agricultural growth and has the highest priority in order to attract FDI into Myanmar. As
Myanmar is a labor abundant country, low labor cost is one essential point in attracting FDI
for export-oriented labor-intensive sectors. Facilitating labor-intensive manufacturing and the
associated supporting service activities would raise trade, investment and income-earning
opportunities as well as attract additional foreign investment. The exchange rate and price
stability (inflation) are other factors that determine investment into Myanmar.
This paper analyzes the impact of trade openness, exchange rate volatility and other
determinants of economic variables on FDI inflow focusing on Myanmar by using ordinary
least squares (OLS) estimation. Furthermore, there is an analysis of eight ASEAN countries
(excluding Brunei, Timor-Leste and Myanmar) using a panel data analysis of random effect

85
model estimation and the Hausman test to check whether a random effect model (REM) or a
fixed effect model (FEM) is appropriate. The main research theme is how trade and key
economic variables impact FDI inflow to Myanmar and ASEAN countries. This study
contains five sections; exploring the perspective of previous literature, the theoretical
foundation of FDI, research methodology and empirical models, data description and sources
and finally the results with a discussion of policy implications and the conclusion of the study.
4.1.1 The Relationship between Exports and FDI Net Inflows into Myanmar
The relationship between trade and FDI varies with the motives and determinants of FDI.
Myanmar’s trade openness ratio has been falling over time, and the ratio of foreign trade as a
proportion of GDP is one of the lowest among developing countries. After the military
government took political power in 1988, there were many economic reforms, including trade
sector improvement. From 1990 to 1999, FDI inflows and exports fluctuated with each other.
From 2000 onward, exports increased higher than FDI inflows (Fig. 4.1). However, in 2010,
exports and FDI inflows reached the same point. Since 2010, exports and FDI inflows are
nearly parallel.

86
Figure 4.1 The Relationship between Exports and FDI Net Inflows into Myanmar (1990-
2017)
Source: IMF Direction of Trade Statistics, World Economic Outlook Database, The Global
Economy.
For decades Myanmar’s foreign trade has only contributed a tiny percentage of the
country's GDP and the trade openness ratio is lower than in other Asia countries. After the
military government took political power in 1988, and the subsequent economic reforms, a
large amount of FDI began entering into Myanmar’s economy and FDI percentage of GDP
was higher than exports percentage of GDP at that time. However, after US sanctions were
imposed in 1997, FDI net inflows as a percentage of GDP declined from 3.23% in 1997 to
just 0.95% in 2002. The highest point of FDI as a percentage of GDP was 4.85% in 2011 and
the lowest point was 0.82% in 2005 after the US 2003 sanctions. On the other hand, exports
as a percentage of GDP continued to increase until 2009. However, by 2011 FDI’s share of
the GDP reached its highest point of 4.85% while exports declined to 13.8 %. This period is
0.00
2,000.00
4,000.00
6,000.00
8,000.00
10,000.00
12,000.00
14,000.00
1985 1990 1995 2000 2005 2010 2015 20200.0
500.0
1000.0
1500.0
2000.0
2500.0
3000.0
Exp
ort
s (U
S$
mil
s)
Year
FD
I N
et i
nfl
ow
s (U
S$
mil
s)
The Relationship between Exports and FDI in Myanmar (1990-2014)
FDI Net inflows Exports

87
also when the democratically elected government started to take over political power and there
were huge FDI inflows into Myanmar’s economy during that period. (see Figure 4.2)
Figure 4.2 FDI and Exports share of GDP in Myanmar (1990-2014)
Source: IMF Direction of Trade Statistics, World Economic Outlook Database, The Global
Economy.
4.1.2 Current Exchange rate System
In the global market, exchange rates are essential not only for improving international
trade but also for comparing the prices of goods and services produced in different countries.
Myanmar adopted a fixed exchange rate system and external trade by the private sector was
conducted by market-determined parallel exchange rates. (Mya Than and Myat Thein (2000).
In 1990, the government imposed many restrictions on trade by controlling foreign exchange,
which was called the “export first and import second” policy. This policy prompted traders to
misreport their trade in accordance with the supply and demand for export earnings. Changes
0.00
1.00
2.00
3.00
4.00
5.00
6.00
0.00
10.00
20.00
30.00
40.00
50.00
1985 1990 1995 2000 2005 2010 2015 2020
FDI n
et in
flo
ws
(% o
f G
DP
)
Exp
ort
s (%
of
GD
P)
Year
FDI net inflows and Exports as a percentage of GDP
Exports FDI

88
in this policy allowed importers to settle import bills with foreign exchange that did not
originate from formal exports. The pre-reform foreign exchange system in Myanmar had at
least two features that exerted adverse effects on the economy. First, administrative controls
on foreign exchange and trade segmented the foreign exchange market into the public and
private sector. Different exchange rates were applied to the different segments, resulting in an
inefficient allocation of resources. Secondly, there was no formal channel for exporters and
importers in the private sector to convert currencies, which led them to make transactions in
the parallel market, where exchange rates exhibited high volatility (Kubo, 2014).
In April 2012, Myanmar introduced a managed floating exchange rate system and began
daily two-way multiple-price auctions of US dollars with authorized dealer banks. Foreign
exchange management reform allowed the government to abolish the “export first and import
second” policy. After changing to the managed floating exchange rate system, market
activities smoothed out and international financial transactions were solved efficiently,
exchange rate volatility peaked in 2012. (Figure 4.3).

89
Figure 4.3 Exchange Rate Volatility in Myanmar (1990-2017)
Source: IMF International Financial Statistics
4.1.3. Trade Restrictions, Uncertainty and Sanction Effect
The Index of Economic Freedom (2007) showed that Myanmar was among the five most
repressive economies in the world. International sanctions aimed to restrict financial aid,
blocked access to assets, and reversed investment flows. The comprehensive economic
sanctions imposed on Myanmar by the United States and OECD countries in 2003 impacted
its economy, especially trade and financial development. Alamgir (2011) pointed out that
Western trade sanctions curtailed the potential spread of an independent trading class and any
concentration of commercial influence that may have arisen in conjunction with such a class.
Even though the US had banned new investments in Myanmar in 1997, the US was still the
largest export destination for Myanmar’s products in 1999–2000 and continued to be one of
Myanmar’s most important trading partners until 2003.
0.0000
0.0050
0.0100
0.0150
0.0200
0.0250
0.0300
0.0350
0.0400
0.0450
-0.1000
0.0000
0.1000
0.2000
0.3000
0.4000
0.5000
0.6000
1985 1990 1995 2000 2005 2010 2015 2020
Myanmar Exchange Rate Volatility(1990-2017)
Exchange Rate Volatility E/R Volatility without 2012
90
Due to the United States imposed import sanctions in July 2003, the garment industry
was greatly damaged. More than eighty percent of the US’s imports from Myanmar were
clothes and nearly half of the garment industry’s products were exported to the United States.
(Kudo, 2005). Most garment firms were part of larger multinational corporations that have
direct investments in many developing countries and Myanmar was no exception to this model.
Many of the investing companies, which included Japanese and Korean firms, quit their
projects in Myanmar. Around 40% of South Korean citizens are reported to have left the
country by 2006. The potentially major effect on Myanmar’s economy was somewhat offset
by other trading partners, especially in Asia.
4.1.4. Influences on investment in Myanmar
Sophisticated regional production networks have formed during the development of Asia and
economic roles have changed over time leading to a regional clustering of supply chains based on
close industrial interconnections. This has paved the way for closer regional integration,
facilitating trade within those supply chains. Myanmar is at the center of an emerging Asia that
will drive growth in global trade, investment and middle-class consumption in the coming
decades. A favorable point for foreign investors is Myanmar’s low labor costs, strategic
location and significant domestic market potential, as well as links to larger ASEAN
marketplaces, which make it an attractive destination for investment. Myanmar is changing
step by step towards democratization and restrictions on doing business are being relaxed,
creating huge opportunities for foreign business investment since the US and the EU have
suspended sanctions. Special economic zones (SEZs) is also expected to boost exports and

91
reduce the trade deficit under an export strategy prioritizing value-added manufacturing. The
direction of Myanmar’s external trade is mainly with Asian countries.
SMEs are the backbone of Myanmar’s economy and they can promote not only basic
goods and services but also trade, upgrading the standard of living and helping alleviate
poverty. Developments intended to promote trade among SMEs are a credit guarantee system
to strengthen industrial development, addressing the shortage of electricity and other
improvements to an infrastructure that is ranked the lowest among ASEAN countries. Large
corporations will continue to need as much help as possible from SMEs until they develop
their own complete supply chains.
To promote and invite FDI, the government of Myanmar tried many incentive schemes
and policies to attract multi-national enterprises by allowing investment in sectors that needed
to be developed, and for the proportionate development of regions and states. A commission
may grant one or more tax exemption or relief when investors apply for such exemption or
relief (Myanmar Foreign Investment law, 2016). With respect to income tax exemptions, the
commission will issue a notification with the approval of the Ministry of the Office of the
Union Government to designate the least developed regions as zone 1, moderately developed
regions as zone 2, and adequately developed regions as zone 3. Moreover, the income tax
exemption is granted to investment businesses in each zone for a period of consecutive years;
7 years in zone 1, five years in zone 2 and 3 years in zone 3. The government may also allow
more favorable exemptions and relief for locations where Myanmar citizen-owned businesses
are operated or for other economic activities.

92
There are many significant impediments to efficient investment such as the approval
process, contract enforcement, the cost and complexity of doing business, right through to the
need to build the economic, financial and physical foundations for a market-based system.
Another restrictive point is very weak performance on international measures of the ease of
doing business and the quality of the investment climate in Myanmar. In the World Bank’s
latest Doing Business Report, Myanmar ranked 182nd out of 189 economies in 2014 in the
administrative and regulatory complexity of starting and operating a local firm, including
accessing licenses, electricity availability, credit and property, and the extent of investor
protection. This illustrates major deficiencies in Myanmar’s business and investment climate
and highlights the fact that investing in Myanmar can be time-consuming, costly and risky.
Some specific policy and institutional weaknesses that affect Myanmar’s attractiveness as an
investment destination include 1) human capital, 2) rights and the rule of law (the commercial
and legal system in Myanmar fall short of minimum requirements), 3) infrastructure deficit,
4) limited development of financial markets, and 5) weak intellectual property (IP) protection.
4.2. Theoretical background of FDI
The fundamental theoretical framework of FDI was introduced as four distinct schools of
thought elucidated by MacDougall (1960), Hymer (1976), Buckley and Casson (1976),
Agarwal (1980), Casson (1982), Helleiner (1989), Dunning (1983) and Vos (1994). These are
the neoclassical, industrial organization, eclectic, and portfolio choice paradigms.
The conventional neoclassical paradigm was framed on a principle concern with
international capital flows. It claims that under unconstrained capital mobility between

93
countries, there are positive welfare effects for both capital exporting and capital importing
countries given exclusive factor endowment, the political environment, the expected rate of
return, information asymmetries, and government economic policies on taxation and other
incentives.
According to the industrial organization theory, it is assumed that foreign enterprises
have oligopoly-like powers in the host country markets with markets that are imperfect and
have barriers to entry derived from unique firm specific attributes such as product technology,
managerial skills or economies of scale. Because of this, foreign investors are assumed to
consider not only the rates of return, but also the risks associated of a portfolio of foreign
investment which takes into account the element of uncertainty accompanying these types of
capital flows.
The eclectic theory is based on concepts matching the traditional Heckscher-Ohlin-
Samuelson trade model seeking to explain the spatial distribution of some varieties of output.
Moreover, it tries to explain trade in manufactured and skilled labor-intensive commodities
across countries with factor endowment differentials.
Like the industrial organization theory, the portfolio choice theory is focused on the
element of uncertainty in connection with capital flows and also on the observation that
fluctuations in rates of return on capital domestically, and even more so internationally, are
not perfectly correlated.
The above theories have been put forward by the researchers to explain foreign direct
investment. But no single theory fits the different types of direct investment made by
multinational corporations or countries in any given region. The applicability of the approach

94
differs with the type and origin of investment, and there are also FDI theories that relate FDI
to international trade. In previous studies, the determinants of FDI have been divided into
three categories. First, a focus on the core factors influencing the decision to invest in a
particular country or industry. The second category is more macro-oriented and seeks to
establish a functional relationship between FDI and possible determinants. The final category
deals with why FDI is preferred to other forms of investment based on resource allocations
decisions. When analyzing the main determinants of FDI, country-specific characteristics are
widely accepted, especially factors related to the host country market. It is believed that
characteristics of host markets are major driving factors of FDI flows (UNCTAD, 1998).
FDI can be classified two different ways. Multinational corporations that replicate their
production processes in foreign facilities located near large customer bases are categorized as
horizontal foreign direct investment. The outcome of the theory of comparative advantage is
called vertical foreign direct investment (FDI). Vertical FDI is one of the fastest-growing
types of FDI, and is behind the large increase in FDI inflows to developing countries and also
flows between developed countries dominated by horizontal FDI. Vertical FDI requires a
substantial fixed cost investment in a foreign affiliate in a country with the appropriate
characteristics (Krugman, Obstfeld & Melitz, 2012).
The impacts of host country trade openness on inward FDI are extensively discussed in
previous empirical studies and remain a controversial question (Tolentino, 2010). The
international business theory claims that FDI is attracted to host countries that easily fit into
global production and trade patterns. (Vernon, 1966). One of the studies, (Liargovas &
Skandalis, 2005) also provide strong support for the positive relationship between trade

95
openness and FDI. From a theoretical perspective, exchange rate volatility is seen as a crucial
factor that exerts effects on FDI and is usually regarded as an indicator of business risk,
according to several academic studies that have highlighted the relationship between FDI
flows and the volatility of exchange rates (Tolentino, 2010).
As for a macro-economic perspective, market-seeking FDI is unattractive to countries
with unpredictable and volatile inflation rates. High levels of inflation add uncertainty to an
investment, such as making price-setting difficult, increasing difficulties in forecasting profit,
and causing problems for long-term cooperation. Therefore, high inflation discourages export-
oriented FDI. Real exchange rate variability and fixed productive factors influence the
location of production facilities for risk-averse investors and their parent companies. Due to
a non-negative correlation between export demand and exchange rate shocks, multinational
corporations optimally locate some productive capacity abroad, and as exchange rate volatility
rises, the capacity share abroad increases and becomes more correlated with export demand
shocks (Goldberg & Kolstad, 1995).
Most studies of the determinants of FDI have focused on the pull factors or features of
the host countries that attract or deter FDI inflows and have shown that foreign investment is
usually not attracted to less developed countries other than for cheap labor, raw materials or
favorable relative labor costs. A way that less developed nations can attract more FDI is by
developing infrastructure and fundamentally reforming institutions.
4.3. Empirical Literature
There are many studies on trade openness and FDI. Among them, some have found a
positive relationship between trade openness and FDI flows (Biglaiser & DeRouen, 2006;

96
Chakrabarti, 2001). Although it is rare to find, some studies have empirically tested the impact
of trade openness on FDI (Tsai, 1994; Asiedu, 2002; Mottaleb, 2007). Others have found a
negative relationship between trade openness and FDI inflows. (Seim,2009) Theoretically,
Liargovas and Skandalis (2011) mention previous (Dunning, 1993) views that the effect of
trade openness on the inflow of FDI varies according to the motivation for engaging in FDI
activities.
The impact of openness on trade depends on the type of investment. Alizenman et al.
(2005) analyzed two -way linkages of FDI and trade. The result is reasonable of the
relationship between FDI and Trade expecting that if goods will be strong and possibly
bidirectional. However, it is less evident about the impact of trade on FDI and it should be
different for, because countries’ stages of development or FDI inflows and outflows react
differently with different types of trade flows. The results find that of the linear feedback
between trade and FDI by Granger causality test from FDI grows flows to trade openness
(50%) and from trade to FDI (31%).
According to Liargovas and Skandalis (2012), trade openness plays a positive and
significant role in attracting FDI inflows in the context of developing countries. The authors
claim to have found a direct causality in which trade openness leads to foreign direct
investment inflows. Their hypothesis is that FDI inflows are positively related to trade
openness, so that the higher the trade openness score of a country, the larger the amount of
the FDI inflows. Trade openness allows foreign investors to freely enter the country, and to
establish their businesses without fearing protectionism, compete locally against local
competitors, and exercise their voice with the local governments. Thus, countries with higher

97
levels of trade openness are more likely to receive FDI inflows than countries with lower
levels of trade openness and more trade restrictions (Alshammari, 2015)
The positive impact of trade on FDI has been found to be quite vigorous depending on
the type of econometric method used and countries considered, with trade liberalization
leading to more FDI inflow in a host country (Babatunde, 2011). Aug* (2007) and Asiedu
(2002) studied the determinants of FDI. The results show that infrastructure development and
a higher return on investment are important factors that drive the attraction of FDI. Ang (2008)
concluded that financial development, infrastructure development and trade openness
promote FDI inflow.
Moreover, Neumayer and de Soysa (2005) stated their view that countries that are more
open to trade have higher inflows of FDI. Several empirical studies have shown that the role
of trade openness and good infrastructure cannot be ignored in the attraction of FDI; Asiedu,
2002, 2003, 2006). The positive impact of trade openness on FDI varies across regions
(Asiedu, 2002). Tsaurai (2015) focused on the causal relation between trade openness and
FDI in Zimbabwe and proved that there is no long-term relationship between FDI and trade
openness in Zimbabwe. According to his analysis, the literature on the relationship between
trade openness and FDI has four views (trade openness led FDI, FDI led trade openness,
feedback view and the no relationship view).
Mina (2007) proved that trade openness, institutional quality and infrastructural
development attracted FDI into Gulf Cooperation Council (GCC) countries. He showed a both
positive and significant impact of trade openness on FDI in GCC countries. Kandiero and
Chitiga (2006) analyzed the impact of openness to trade on FDI inflows in Africa, especially,

98
the impact on manufactured goods, primary commodities and services using cross-country
data from selected African countries. They find that openness to trade promotes FDI in both
sub-Saharan and non-sub-Saharan Africa. Liargovas and Skandalis (2011) found that trade
openness contributes positively to the inflow of FDI in developing economies and quoted the
view of Omisakin et al., (2009) that FDI inflows are an important source of supply funds for
domestic investment and promoting capital formation in the host country.
Exchange Rate Stability is the annual percentage change in the exchange rate of a
currency against the United States dollar. It is used here as a proxy for exchange rate risk.
According to the risk aversion theory, FDI decreases as exchange rate volatility increases
(Kosteletou & Liargovas, 2000). In other words, a stable exchange rate may positively affect
FDI. (Liargovas & Skandalis, 2011). Ang (2007) examined the determinants of FDI for
Malaysia and the interesting results found that higher macroeconomic uncertainty induced
more FDI inflows. According to his point of view, increases in the level of financial
development, infrastructure development, and trade openness promote FDI and a higher
statutory corporate tax rate and appreciation of the real exchange rate appear to discourage
FDI inflows.
Kudo and Kumagai (2014) mentioned the fact that attracting and gaining benefit from
FDI is a key challenge for Myanmar. To enhance economic growth in Myanmar, an
appropriate policy for attracting foreign investments and absorbing benefits from them are
important. These policies include creating a stable macroeconomy, effective financial markets,
better infrastructure, an open trade and investment policy and a supply of skilled workers. A

99
consistent, long-sighted and clear-cut policy on foreign investment is required. Practically no
East Asian country has achieved high economic growth without a strong export sector.
Previous studies (Loree & Guisinger, 1995, 2000; Asiedu, 2002) point out the essential
impact of available physical infrastructure in the host country on FDI decision making. An
empirical model based on panel data can be applied to three approaches: the common intercept
model, the random effects model and the fixed effects model (Bushra, Aamrah & Ali, 2003).
An analysis of FDI in Latin America with a special focus on the Guyanese economy showed
that gross domestic product, imports, exports, infrastructure, and political risk had significant
influences on the decision of multinational corporations to invest abroad and proposed
specific policy initiatives to stimulate foreign capital inflows to Guyana (Ferris, Thompson,
& Valsan, 1997).
4.4. Empirical Framework and Model
There are many points of view concerning how to analyze the determinants of FDI. The
determinants of FDI depend on a diversity of characteristics of the host country such as the
exchange rate, market size and potential, openness, political stability or risk, labor costs, trade
costs and investment costs Bloningen (2014). Balasubbramanyam and Mahambare (2003)
showed the impact of FDI on the following locational factors: market-related factors,
economic growth-related factors, resource endowments, infrastructure facilities,
macroeconomic and political stability, a stable and transparent policy framework, a distortion-
free FDI and trade regime and fiscal and monetary incentives. Asiedu (2002, 2003) and Ang*
(2005) labeled their variables to evaluate FDI as trade openness, exchange rate volatility and

100
infrastructure. Liargovas and Skandalis (2011) developed a model in which FDI has five main
determinants: (1) exchange rate stability, (2) nominal GDP, (3) GDP per capita, (4) political
risk and (5) trade openness. Ang’s (2007) model includes the explanatory variables of trade
openness, financial development, the annual growth rate of GDP, infrastructure
development, the real exchange rate, the statutory corporate tax rate and macroeconomic
uncertainty.
Based on earlier works, the empirical model of this study is specified as follows:
fdiit = i + 1 toit+2 ervolit + 3 ln pindexit + 4 labforceit + 5 ercit + ui + it -----------(1)
Where the variable fdiit is the value of FDI net inflows country i during a certain period
t, toit means trade openness ratio, ervolit is exchange rate volatility, ercit is electricity
production capacity inside the country, labforceit is the labor force, and pindexit is the price
index during this period. it is the error term, i is the fixed effects term and are coefficients.
Although Tolentino (2010) mentioned that the impact of trade openness in host countries
on inward FDI is still a controversial topic for many empirical researchers, this analysis
mainly focusses on the impact of trade openness on FDI. The research methodology
emphasizes the view of Bushra, Aamrah & Ali (2003) and other previous empirical literature
about FDI and uses reliable macroeconomics theories and econometric model by having two
focuses of analysis. The first focus is on ordinary least square (OLS) estimation based on a
time series data analysis of Myanmar and the second focus is a fixed and random effect
estimation of panel data analysis of the trade openness ratio and another priority economic
variables impact of FDI in ASEAN countries (excluding Myanmar, Singapore, Brunei and
Timor-Leste).

101
The fixed and random effect model estimators are followed by many researchers who
mostly use two methods for estimating unobserved effects panel data models. Even though
these methods are somewhat harder to describe and implement, several econometric packages
support them. The random effect estimator is useful when the unobserved effect is
uncorrelated with all of the explanatory variables (Wooldridge, 2013). One advantage of
random effect (RE) is that all explanatory variables are constant over time because the
unobserved effect is uncorrelated with those variables (Wooldridge, 2013). In many
applications, the primary reason for using panel data is to allow the unobserved effect to
correlate with the explanatory variables. In fact, the ideal random effects assumption includes
all of the fixed effects assumptions plus, the additional requirement that ai is independent of
all explanatory variables in all time periods (Woodridge,2012).
4.5. Data Description and Sources of Data
This study based on well-known facts about FDI to prove the model’s soundness as a
robust empirical methodology concerning international trade and investment. The dependent
variables are the FDI net inflow value in millions of current US dollars and FDI net inflow
value as a percentage of GDP. In the second part, a cross section of fixed and random effects
using balanced panel data of annual FDI net inflow values of eight ASEAN countries
(Cambodia, Indonesia, Laos, Malaysia, the Philippines, Singapore, Thailand, and Vietnam)
while excluding Brunei, Timor-Leste and Myanmar. The data period covers 25 years (1990–
2014) for both types of estimation.
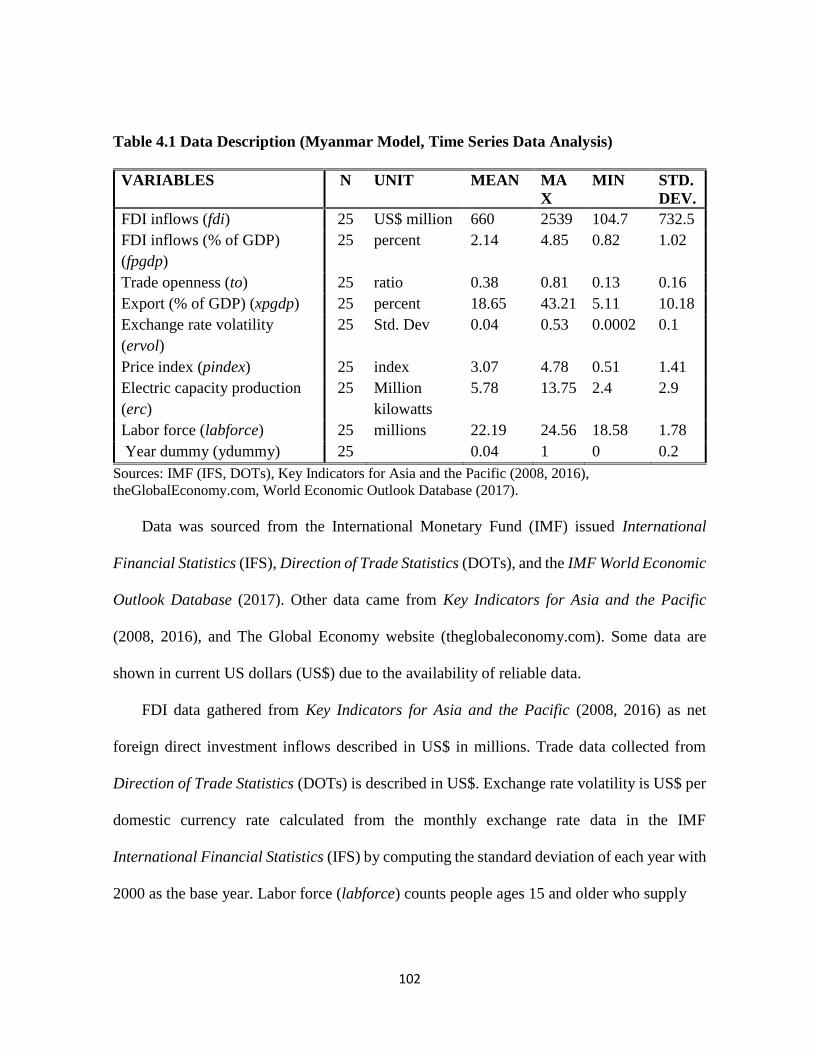
102
Table 4.1 Data Description (Myanmar Model, Time Series Data Analysis)
VARIABLES N UNIT MEAN MA
X
MIN STD.
DEV.
FDI inflows (fdi) 25 US$ million 660 2539 104.7 732.5
FDI inflows (% of GDP)
(fpgdp)
25 percent 2.14 4.85 0.82 1.02
Trade openness (to) 25 ratio 0.38 0.81 0.13 0.16
Export (% of GDP) (xpgdp) 25 percent 18.65 43.21 5.11 10.18
Exchange rate volatility
(ervol)
25 Std. Dev 0.04 0.53 0.0002 0.1
Price index (pindex) 25 index 3.07 4.78 0.51 1.41
Electric capacity production
(erc)
25 Million
kilowatts
5.78 13.75 2.4 2.9
Labor force (labforce) 25 millions 22.19 24.56 18.58 1.78
Year dummy (ydummy) 25 0.04 1 0 0.2
Sources: IMF (IFS, DOTs), Key Indicators for Asia and the Pacific (2008, 2016),
theGlobalEconomy.com, World Economic Outlook Database (2017).
Data was sourced from the International Monetary Fund (IMF) issued International
Financial Statistics (IFS), Direction of Trade Statistics (DOTs), and the IMF World Economic
Outlook Database (2017). Other data came from Key Indicators for Asia and the Pacific
(2008, 2016), and The Global Economy website (theglobaleconomy.com). Some data are
shown in current US dollars (US$) due to the availability of reliable data.
FDI data gathered from Key Indicators for Asia and the Pacific (2008, 2016) as net
foreign direct investment inflows described in US$ in millions. Trade data collected from
Direction of Trade Statistics (DOTs) is described in US$. Exchange rate volatility is US$ per
domestic currency rate calculated from the monthly exchange rate data in the IMF
International Financial Statistics (IFS) by computing the standard deviation of each year with
2000 as the base year. Labor force (labforce) counts people ages 15 and older who supply

103
Table 4.2 Data Description (ASEAN Model, Panel Data Analysis)
variables N UNIT MEA
N
MAX MIN STDE
V.
FDI inflow (fdi) 200 US$ million 4894 69540 -4702 10594
FDI inflow (% of GDP)
(fpgdp)
200 percent 4.67 26.52 -2.54 5.36
Export (% of GDP)
(xpgdp)
200 percent 74.21 377.61 2.85 71.64
Trade openness (to) 200 ratio 1.29 4.1 0.06 0.95
Exchange rate volatility
(ervol)
200 Std. Dev 0.0772 2.9443 0 0.2716
Price index (pindex) 200 index 81.5 240 5.64 39.4
Labor force (labforce) 200 millions 29.2 123.06 1.51 31.74
Electric capacity production
(erc)
200 Million
kilowatts
52.62 216.26 0.2 48.6
Sources: IMF (IFS, DOTs), Key Indicators for Asia and the Pacific (2008, 2016),
theGlobalEconomy.com, World Economic Outlook Database (2017).
labor for the production of goods and/or services during a specified period. It includes people
who are currently employed, people who are unemployed but seeking work and first-time job-
seekers. Not everyone who works is included, however. Unpaid workers, family workers, and
students are often omitted, and some countries do not count members of the armed forces.
Labor force size also tends to vary during the year as seasonal workers enter and leave (The
Global Economy). Electric capacity production (erc) is shown by total installed electricity
capacity (million kilowatts). Price index (pindex) and GDP are collected from the World
Economic Outlook Database (2017).
Figure (4.4) shows the growing trend of FDI inflows into ASEAN countries from 1990-
2014. Among the eight countries, Singapore is the largest FDI recipient, although FDI
decreased significantly in 2008 during the international financial crisis. Indonesia followed
Singapore in increased FDI inflows. However, Malaysia, Vietnam and Thailand slightly

104
caught up in FDI inflows towards the end of the time period. Cambodia and Laos had the least
FDI inflows and have not seen massive FDI inflows in recent years.
Figure 4.4 FDI net inflows in ASEAN countries
Sources: Key Indicators for Asia and the Pacific (2008, 2016)
For years, many Asian countries have adopted an export growth and outward looking
development policy. However, a low trade openness ratio for a country does not necessarily
indicate high obstacles to foreign trade,but could be due to factors such as size and geographic
remoteness from potential trading partners. Singapore and Vietnam have the highest trade
openness ratios of all of the countries in this study. Singapore leveraging its vantage point on
the international shipping route along the Malacca Strait and its geographic proximity to two
major global producers of tropical products to become a leading regional and global player in
trans-shipment, processing, and services (Intal & Chen, 2017). Vietnam enacted many
economic reforms, especially regarding trade and FDI. However, since 2010 the trade
openness in Singapore, Malaysia and Vietnam has decreased. (see Fig 4.5)
-20000.0
0.0
20000.0
40000.0
60000.0
80000.0
1990 1992 1994 1996 1998 2000 2002 2004 2006 2008 2010 2012 2014
FD
I n
et i
nfl
ow
s (U
S$ m
ils)
Year
FDI Net inflows in ASEAN (1990-2014)
Cambodia Indonesia Lao Malaysia
Philippines Singapore Thailand Vietnam

105
Figure 4.5 Trade Openness in ASEAN countries
Sources: IMF Direction of Trade Statistics
Exchange rate volatility was calculated based on the year 2000 (Figure 4.6). In 1997, the
Asian Financial Crisis (AFC) impacted many ASEAN countries and Indonesia, Malaysia,
Thailand, the Philippines and Laos had higher exchange rate volatility than Singapore,
Vietnam and Cambodia did. Although the Global Financial Crisis (GFC) in 2008 had a large
effect on the US and some other countries, ASEAN countries’ exchange rates did not
experience much volatility. The AFC and the GFC were two watershed events where
exchange rate regimes broke down, at least temporarily, as evidenced by large depreciations
and currency volatility during those episodes. (IMF working paper, 2016).
0.00
0.50
1.00
1.50
2.00
2.50
3.00
3.50
4.00
4.50
1985 1990 1995 2000 2005 2010 2015 2020
trad
e op
enn
ess
(rati
o)
Year
Trade Openness in ASEAN countries (1990-2014)
Cambodia Indonesia Lao Malaysia
Philippines Singapore Thailand Vietnam

106
Figure 4.6 Exchange Rate Volatility in ASEAN countries
Sources: IMF International Financial statistics
4.6. Results Discussion, Policy implication and Conclusion
The empirical model was analyzed based on two dependent variables, FDI net inflow
values and FDI percent of GDP using time series data analysis of OLS estimation for
Myanmar’s FDI model. (Tables 6.1 and 6.2). Standard errors were calculated both in the usual
way and with multicollinearity diagnostic tests in each table. In addition, these outcomes had
serial correlation checking and removed from each model’s estimation. After checking the
unit root test, the results were better and more valid than previous estimations with the original
data. Some variables represent first difference, and some are second difference data
estimations. Because of multicollinearity diagnostic tests in year dummy and exchange rate
0
0.2
0.4
0.6
0.8
1
1.2
1.4
1.6
1.8
1990 1995 2000 2005 2010 2015 2020
Ex
chan
ge
Rat
e vola
tili
ty
Year
ASEAN Exchange Rate Volatility (1990-2014)
Cambodia Indonesia
Lao Malaysia
Philippines Singapore
Thailand Vietnam
Base Year 2000=1

107
volatility, when the year dummy is skipped in the estimation the outcomes are better than the
previous estimations.
For the ASEAN model, each regression was estimated using cross section effect and
random effect and standard errors were calculated heteroscedasticity robot standard error and
solved with a multicollinearity diagnostic test in estimation. The estimation was divided into
two cases; an ASEAN 8 estimation and an ASEAN 7 estimation (leaving out Singapore) even
though the outcomes were not so different between them.
Both explained variables prove significant in the estimation model. F statistic was mostly
significant in all of the estimations. For Myanmar, FDI net inflow value as a percentage of
GDP can explain better than the FDI net inflows. Generally, the Hausman-Taylor test result
shows that a fixed effect model is appropriate for ASEAN 8 and a random effect model is
appropriate for ASEAN 7. There is a slight difference between the outcomes of trade openness
ratio and export ratio of GDP when estimated separately.
4.6.1. The OLS regression estimations
For Myanmar, many different types of estimation were done. (1) All variables, (2) exports
as a percentage of GDP, (3) other variables without trade effect, (4) all variables without year
dummy, and (5) only trade openness and exchange rate volatility.
In Table (4.3), trade openness and exports per GDP ratio are directly related to FDI net
inflow values and both are insignificant in all estimations. These results match with Liargovas
& Skandalis (2012), Alshammari (2015), and Babatunde’s (2011) views on the positive effect
of trade on FDI, and that trade liberalization leads to more FDI inflow in a host country.

108
Myanmar faced the US and Europe’s long-term sanctions. If Myanmar adopted a free trade
policy and sanctions do not impact the trade sector, Myanmar can build the foreign investors’
trust in investing in the country. Exchange rate volatility can explain Myanmar FDI net
inflows and were negatively related and significant at a 1% and 5% level in all estimations
except when including year dummy. Kosteletou and Liargovas (2000) and Liargovas and
Table 4.3 Regression results (Myanmar FDI net inflows)
Dependent Variables (Fdi Net Inflows)
variables 1 2 3 4 5
constant 106 143 161 134 237 (341) (150) (147) (152) (148)
Trade openness (1st diff) 1071 - - 1022 434 (1394) (1255) (1307)
Export per GDP(1st diff) - 16.8 - - - (20.6)
Exchange rate volatility -2680 -4082** -4251*** -4046** -5809*** (14663) (1427) (1399) (1434) (1314)
Electricity Production (2nd Diff) 506* 496* 440* 504* - (266) (255) (243) (257)
Price Index (2nd Diff) 5.49 6.81 6.73 5.28 - (24.2) (23.3) (23.1) (23.4)
Labor Force (2nd Diff) 1733 2263 2176 1697 - (2958) (2787) (2759) (2846)
Year Dummy -694 - - - - (7418)
F-Statistic 4.86*** 6.19*** 7.72** 6.19*** 9.89***
R-Squared 0.65 0.65 0.63 0.65 0.49
No: Of Observation 23 23 23 23 23
1. *, **, *** statistical significance of 10%, 5%, and 1% respectively
2. (1) All variables
(2) Exports as a percentage of GDP
(3) Other variables without trade effect
(4) All variables without year dummy
(5) Only trade openness and exchange rate volatility

109
Skandalis (2011) showed that FDI decreases as exchange rate volatility increases and that a
stable exchange rate may affect positively FDI. The results of this model mainly support that
exchange rate stability can increase FDI inflows to Myanmar. Although Myanmar officially
used a fixed exchange rate system, the actual condition was more similar to a multiple
exchange rate system.
The coefficient of electricity production is positively related to FDI inflow, but it is only
10% significant. To attract FDI into a country, electricity production is essential for a stable
business environment and this critical infrastructure can’t be neglected. This matches with
Ang’s (2007, 2008) views that infrastructure development promotes FDI. If Myanmar can
provide sufficient electrical energy for business operations, investors will note this fact
favorably when deciding whether to do business in Myanmar. Other variables were
statistically insignificant in each estimation. The labor force is directly related to FDI net
inflows and insignificant. Although Myanmar is one of the most labor abundant countries in
Asia, FDI inflows did not strongly impact the labor force. Because many ASEAN countries
are labor abundant countries, only skilled labor is a critical point for foreign investors. If
foreign investors can efficiently use skilled labor, it could generate many opportunities for
employment in Myanmar, and be a favorable point for foreign investors to invest in Myanmar.
In all regressions, the F-statistic was significant and R2 can explain explained variables over
60 percent.

110
Table 4.4 The OLS Regression results (Myanmar FDI net inflow as a % of GDP)
Dependent Variables (FDI % Of GDP)
Variables 1 2 3 4 5
Constant 0.01 0.31 0.33 0.29 0.19 (0.46) (0.2) (0.2) (0.21) (0.21)
Trade Openness (1st Diff) 1.82 - - 1.33 2.24 (1.9) (1.73) (1.9)
Exports Per GDP (1st Diff) - 0.02 - - - (0.03)
Exchange Rate Volatility 9.5 -4.22** -4.41** -4.14* -4.09** (19.96) (1.98) (1.92) (1.98) (1.92)
Electricity Production (2nd
Diff)
-0.22 -0.26 -0.33 -0.24
(0.36) (0.35) (0.34) (0.36)
Price Index (2nd Diff) 0.01 0.01 0.01 0.01 (0.03) (0.03) (0.03) (0.03)
Labor Force (2nd Diff) 12.48*** 12.84*** 12.7*** 12.12*** (4.02) (3.87) (3.8) (3.93)
Year Dummy -6.94 - - - (10.09)
F-Statistic 3.03** 3.6*** 4.5** 3.67** 3.06**
R-Squared 0.53 0.51 0.5 0.52 0.22
No: of Observation 23 23 23 23 24
1. *, **, *** statistical significance of 10%, 5%, and 1% respectively
2. (1) All variables
(2) Exports as a percentage of GDP
(3) Other variables without trade effect
(4) All variables without year dummy
(5) Only trade openness and exchange rate volatility
Table (4.4) shows explanatory variables impact on Myanmar FDI net inflow as a
percentage of GDP. Like the FDI inflows model, trade openness and exports per GDP were
directly related to FDI per GDP but insignificant in estimation. Long-term sanctions affected
the trade sector’s ability to contribute to the GDP ratio significantly and impact FDI per GDP.
Some previous studies reported that not only were trade and FDI related to each other but

111
could also contribute to GDP. The coefficient of exchange rate volatility was inversely related
and significant in all estimations. The larger the exchange rate stability in Myanmar, the
greater the FDI flows in GDP will increase. Labor force is positively related to the FDI per
GDP ratio and significant at a 1% level. When FDI inflow increases, the existing labor force
can be used efficiently and contributes to GDP. The coefficient of electricity production
inversely impacts FDI per GDP and was statistically insignificant. In all regressions, the F-
statistic was significant and R2 can explain explained variables over 50 percent.
4.6.2 The Fixed Effect and Random Effect estimation
To compare ASEAN 8 trade openness and other variable impacts one FDI net inflows, an
ASEAN 7 (without Singapore) analysis was done. When skipping the trade openness variable
in estimation, nearly the same outcome appeared. Singapore is a highly developed country
and is the brightest economy in ASEAN even though it has the smallest amount of land in the
region. Different types of estimations are shown in these tables to describe the outcome of the
model. The Hausman-Taylor test showed that a fixed effect is appropriate for ASEAN 8, but
if Singapore is left in the estimation, then a random effect model is appropriate.

112
Table 4.5 The Fixed and Random Effect results (ASEAN 8 FDI net inflows)
Dependent Variables (FDI Net Inflows)
FEM
(All
variables)
FEM
Without
TO
REM
(All
Variables)
REM
Without TO
Constant (c) 5654 4117** -695 2384 (3530.4) (1728.1) (1874.9) (4393)
Trade Openness (to) -1011 - 1742 - (1789.3) (1310.9)
Exchange Rate Volatility (ervol) 1681** 1912** 1943** 1741** (734.5) (735.5) (829.4) (780.2)
Electricity production (erc) 73*** 72*** 56.02*** 59.8*** (22.9) (23) (19.03) 21.3
Price Index (pindex) 49*** 49*** 39.3*** 43*** (15.2) (15.1) (12.7) (14.2)
Labor Force (labforce) -254** -245** -101 -148 (117.8) (112.7) (62.4) (100.5)
F-statistic 17.7*** 19.3*** 4.09*** 4.97***
R2 0.53 0.53 0.09 0.09
No: of obs: 200 200 200 200
*, **, *** statistical significance of 10%, 5%, and 1% respectively. Standard errors are
heteroskedasticity robot methods.

113
Table 4.6 Fixed Effect and Random Effect results (ASEAN 8 FDI as a % of GDP)
Dependent Variables (FDI Net Inflows Percentage
of GDP) FEM
(All
variables)
FEM
Without
TO
REM
(All
variables)
REM
Without TO
Constant (c) 1.59 3.28*** 1.18 3.62 (1.35) (0.63) (1.28) (2.33)
Trade Openness (to) 1.1 - 1.9** - (0.93) (0.91)
Exchange Rate Volatility (ervol) 1.89** 1.63** 1.97** 1.62** (0.83) (0.81) (0.84) (0.81)
Electricity Production (erc) -0.04*** -0.03*** -0.03*** -0.03*** (0.01) (0.01) (0.01) (0.009)
Price Index (pindex) 0.04*** 0.04*** 0.04*** 0.04*** (0.01) (0.007) (0.01) (0.007)
Labor Force (labforce) 0.01 -0.001 -0.02 -0.02 (0.04) (0.04) (0.02) (0.04)
F-statistics 40.6*** 43.8*** 7.6*** 5.8***
R2 0.72 0.72 0.16 0.11
No. of observations 200 200 200 200
*, **, *** statistical significance of 10%, 5%, and 1% respectively. Standard errors are
heteroskedasticity robot methods.
The trade openness ratio is directly related to FDI net inflows but insignificant. However,
trade openness was significant in FDI as a percentage of GDP. Liargovas and Skandalis (2011)
and Kandiero and Chitiga (2006) found that trade openness contributes positively to the inflow
of FDI in developing economies. Meaning that the more open the trade, the larger the FDI
inflows contribution to GDP. Trade openness plays a harmonizing role to FDI inflow in
ASEAN countries since Indonesia, Malaysia, Thailand, Singapore and the Philippines have
long used an open-door policy and FDI driven export growth strategy. Trade openness reduces
the weaknesses of trade barriers and ultimately allows the import of materials and machinery

114
as well as exports to foreign markets. This echoes former studies on the positive relationship
between openness and inward FDI. (see Tables 4.5 and 4.6)
The results found the expected signs of the key variables; exchange rate volatility, labor
force and price index were positive and statistically significant in all estimations. Exchange
rate volatility’s impact on FDI is positive and significant which means that exchange rate
volatility directly effects FDI net inflows in ASEAN 8 countries and the more the exchange
rate fluctuates, the greater the FDI inflow. In the past, many ASEAN countries adopted FDI
based on an export driven growth strategy. East Asian countries’ experiences show that an
export driven growth strategy can attract FDI inflow and if the trade sector improves and freer
trade policies are adopted, even more FDI will enter, and the host country can absorb benefits
such as technology, management skills, employment and foreign expertise.
Even though many ASEAN countries faced the Asian Financial Crisis 1997, FDI inflows
into these countries did not stop, but there was an impact on Thailand, Singapore and
Malaysia. The extent of exchange rate changes and turning points differ across ASEAN
countries they have also adopted different exchange rate systems. An IMF Working Paper
(2016) showed that Indonesia, the Philippines, and Thailand “target” inflation and profess
floating exchange rates, while Malaysia and Singapore “monitor” the value of their currencies
against undisclosed baskets. Singapore relies on the exchange rate to conduct its monetary
policy.
Electric production capacity and the price index are positively related and statistically
significant at 1% and 10% respectively and can be proven in all types of estimation. Electric
production capacity is positively related to FDI net inflows, meaning that if the host country

115
can produce a sufficient level of electricity, FDI inflows will increase. However, producing
more electricity can incur expenditures and be inversely related to GDP. Price stability in the
country is a favorable point to attract FDI. The labor force is indirectly related to FDI net
inflows but statistically insignificant. Practically speaking, a host country should have ea large
enough labor force as well as enough skilled labor to persuade foreign investors.
Tables (4.7) and (4.8) show the empirical results of the effects of FDI net inflows and FDI as
a percent of GDP in the ASEAN 7 model.
Table 4.7 The Fixed Effect and Random Effect results (ASEAN 7 FDI net inflows)
Dependent variables (FDI Net Inflows)
FEM
(All variables)
FEM
Without TO
REM
(All Variables)
REM
Without
TO
Constant (c) -15669** -18687** -4380 -6158 (7528) (8242) (4553) (4707)
Trade Openness(to) -2087** - -735 - (929) (821)
Exchange Rate Volatility ervol 134 393* 212 293 (278) (237) (279) (246)
Electricity Production (erc) 163*** 157*** 154*** 155*** (44.7) 47 (48.36) 49.9
Price Index (pindex) 17.3*** 10.62** 12.17** 9.38** (4.86) (4.14) (4.96) 4.74
Labor Force (labforce) 222** 246** 56.46 74.86 (104) (111) 58.02 60.5
F-statistic 12.3*** 12.74*** 13.12*** 16.18***
R2 0.45 0.44 0.28 0.28
No. of Observations 175 175 175 175
*, **, *** statistical significance of 10%, 5%, and 1% respectively. Standard errors are
heteroskedasticity robot methods.
Trade openness had a negative effect on FDI net inflows significant at a 5% level only in
the fixed effect estimation,but was insignificant in the random effect model. This matches the
analyses of Seim (2009) and Tsaurai (2015). This result also found the impact on FDI per

116
GDP. Exchange rate volatility was directly related to FDI inflows and FDI as a percentage of
GDP significant at 10%. This means that the larger the exchange rate volatility in the host
country, the more FDI inflows can contribute to the GDP. The larger the price index effect,
the greater the impact on FDI and this means that price stability is a critical point contributing
to FDI per GDP for ASEAN countries. However, Tshifhiwa Vitor (2011) mentioned a
negative relationship between the price index and FDI. The labor force participation rate and
electric production capacity was not different from the ASEAN 8 analysis.
Table 4.8. Fixed and Random Effect results (ASEAN 7 FDI net inflow % of GDP)
Dependent Variables (FDI Percentage of GDP)
FEM
(All
variables)
FEM
Without
TO
REM
(All
Variables)
REM
Without
TO
Constant (c) -14.7 -14.8* -4.42 -5.03 (8.91) (8.83) (4.37) (5.36)
Trade Openness (to) -0.07 - 0.73 - (0.8) (0.67
Exchange Rate Volatility (ervol) 1.55* 1.56* 1.43* 1.4* (0.82) (0.82) (0.86) (0.84)
Electricity Production (erc) -0.15*** -0.15*** -0.09*** -0.14*** (0.03) (0.03) (0.06) (0.02)
Price Index (pindex) 0.04*** 0.04*** 0.03*** 0.03*** (0.007) (0.006) (0.006) (0.006)
Labor Force (labforce) 0.23** 0.24* 0.09 0.1 (0.12) (0.12) (0.06) (0.07)
F-statistic 18.5*** 20.4*** 10.3*** 11.2
R2 0.56 0.56 0.23 0.21
No. of observations 175 175 175 175
*, **, *** statistical significance of 10%, 5%, and 1% respectively. Standard errors are
heteroskedasticity robot methods.
Table (4.9) shows the results of the Hausman-Taylor test. According to the results, the 2
test is mostly insignificant in many types of estimation and cannot reject H0 (the random effect

117
model is appropriate) and therefore the random effect model is appropriate for this analysis.
Generally, random effect is better than fixed effect because fixed effect is based on time
invariant variables.
Table 4.9 Results of the Hausman-Taylor Test
Dependent Variable ASEAN 8 ASEAN 8 ASEAN 7 ASEAN 7
(All
Variables)
Without
Trade
(All
Variables)
Without
Trade
FDI Net Inflows FEM REM REM REM
FDI Net Inflows as a % of GDP FEM REM REM REM
4.7 Policy Implication and Conclusion
FDI is one favorable determinant of economic development for developing countries.
Some ASEAN countries (especially Singapore, Thailand, Malaysia, Indonesia and the
Philippines) absorbed FDI efficiently which increased their GDP. Likewise, Vietnam is also
accelerating their adoption of free trade policies which is catching up the country’s FDI
inflow. Currently, these ASEAN countries have already achieved their economic momentum
applied by FDI inflow to their economies. Trade openness and exchange rate stability are the
essential key points for promoting FDI inflow for ASEAN countries. However, due to the
previous long-term US and EU sanctions, Myanmar’s economy cannot promote the trade
sector and this is a weak point for attracting foreign investment. Currently, the lifting of the
US and EU sanctions has allowed Myanmar an opportunity to surge and expand export-
oriented industries to penetrate the intra-regional markets of India, China and Thailand, as
well as traditional export markets such as the United States and the European Union.

118
Myanmar is a labor abundant country like other ASEAN countries and has a comparative
advantage in lower labor cost for attracting FDI in export-oriented labor-intensive sectors
although this has not been applied efficiently yet. Myanmar tries to promote the export of
value-added and finished goods instead of exporting raw materials. To promote export-
oriented private industries, foreign investment is an essential source of capital for capital
deficient country like Myanmar. Myanmar needs to improve their infrastructure to allow
businesses to operate smoothly to attract more FDI. Currently Myanmar has considerable
political stability which is a key point for both the trade sector and FDI.
This study was based on two types of data analysis; a time series data analysis of
Myanmar FDI inflows and a panel data analysis of ASEAN 8 FDI inflow with fixed effect
and random effect models checked with Hausman-Taylor test. For Myanmar, trade openness
and export per GDP variables had positive effects on FDI but were insignificant. Exchange
rate volatility was inversely related to FDI due to Myanmar’s long-time usage of a multiple
exchange rate system.
However, in the ASEAN analysis, the trade openness and export per GDP ratio were
directly related to FDI inflow as a percentage of GDP, and it can be proved that a nation’s free
trade policies strongly contribute to FDI inflows per GDP. The larger the exchange rate
volatility, the greater the impact on FDI inflow in ASEAN for both explained variables.
Electricity production and the price index also can explain the model’s specification. The
analysis model can prove that exchange rate volatility’s impact on FDI inflows is an
appropriate variable to explain Myanmar’s FDI inflow and that trade openness effects on FDI
inflow per GDP were proven in the ASEAN analysis.

119
CONCLUSIONS
This study has explored the inter-relationship between trade and FDI by analyzing the future
potential of Myanmar’s trade and other essential variable impacts on FDI. Moreover, this analysis
comparatively studied eight ASEAN countries’ trade and FDI undertakings and economic growth
achievements. Additionally, this study highlighted the on-going process of the relationship
between trade and FDI in developing countries, especially in Myanmar, where developing the
nation’s economy is a huge influence on the process.
This work has laid out the evolution of trade and FDI in Myanmar as a case study by
describing the different historical eras. It has confirmed the trade structure, flows, patterns and
policy implications of Myanmar’s economy in different time periods and under different
economic systems that were adopted. In addition, there was an examination of influential
determinants of foreign direct investment with justifications as to why these factors are critical
and specifically why they are crucial for Myanmar and other developing countries.
Major contributions and implications
This study showed the overall evolution of trade and FDI in Myanmar’s economy, the
determinants of FDI and the current FDI situation in Myanmar, the trade structure, pattern and
trade flows in Myanmar along with the impacts of trade and other variable impacts on FDI in both
Myanmar and comparatively with other ASEAN countries. The empirical analysis of Myanmar’s
trade structure employed an augmented gravity model to test the hypotheses developed in the
study and fixed and random effect models showed strong support for proving the model
120
specification. The quantitative and empirical analysis of trade openness and other variable
impacts on FDI shows the impact of Myanmar’s trade competitiveness on FDI inflows in
comparison with other ASEAN countries.
Myanmar’s implementation of its trade policy has allowed for failures of achievability,
reliability, suitability, simplicity, and stability. Likewise, a multilateral trading system could
bring a wide range of opportunities for Myanmar's exports and overcome its supply-side
constraints. Attracting and benefiting from FDI is a key challenge for Myanmar and
appropriate general policies to enhance economic growth, a stable macroeconomic policy,
effective financial markets, better infrastructure, more reliable trade and investment policy
and support for skilled labor are needed. Nowadays, adopting an open-door policy and
creating the economic opportunities to build a modern developed nation, Myanmar’s
government needs to focus on FDI inflows. Most of the investment that Myanmar has received
until now has gone into natural resource sectors with only a negligible role for foreign
investors in manufacturing or services.
Myanmar’s FDI growth has lagged compared with neighboring countries and total FDI
is also much lower than that of neighboring countries. Some economic experts claim that if
Myanmar chooses the right national development strategy, learns from the experiences of
other economies on a similar path, and promotes adequate preparations for attracting FDI
irrespective of the realization of an investment boom in the country, Myanmar can catch up
to its neighbors and partners in the region by enhancing open trade and investment strategies.
Although the government is currently supporting value-added economic activities,
exports continue to be heavily concentrated in raw materials such as natural gas, gems and

121
other minerals. The country has weak transaction rules and regulations, and especially
domestic reforms are necessary to build international confidence. Economic experts expect
that some US and European investors might invest in the Thilawa SEZ in near future, the
government need to overcome some massive obstacles such as that of insufficient power,
communications, roads, railways, bridges and ports to raise production to attract investment
in the manufacturing sector. In this way, the growth of commercial and investment ties can
lift the country’s trade and growth potential.
Myanmar’s trade structure and trade flows were compared with its trading partners and
analyzed with gravity model of trade. Based on this study's empirical results, the gravity
model can explain Myanmar’s trade structure and flow completely.
Though endowed with many natural and human resources, Myanmar’s economic
development is lagging behind that of other South East Asia countries. Myanmar could not
utilize her resources efficiently for an extended period due to Western sanctions. These long-
term sanctions hampered trade sector and trade flow development, hindered foreign direct
investment, dampened investor enthusiasm and made for weak bilateral trade with Western
countries and as a result, neighboring countries like Thailand and China became the main
trading partners for Myanmar.
In addition, foreign exchange rate instability seriously affects trade sector development
and a nation’s trade value. Checking Myanmar’s trade structure with the Trade Conformity
Index highlights the increasingly competitive trade structure as trade volume increases with
falling complementary trade and represents a differentiated product model with intra-industry
trade.

122
In the future, Myanmar's trade potential may improve not only with ASEAN partners but
also globally, thereby enhancing Myanmar's role as a trading nation is a turning point. When
the Democratic government took power and changed the administrative system, Myanmar
gained the potential to create new economic opportunities to promote the trade sector.
Myanmar still needs its ties for economic cooperation with ASEAN for trade improvement
because Myanmar’s total trade value is far behind all other ASEAN members, except for
Thailand. To harmonize with the principles of transparency, simplicity, efficiency and
consistency to further integrate with the ASEAN Single Window (ASW) for customs
clearance, Myanmar has implemented a National Single Window (NSW).
The ASEAN countries of Singapore, Thailand, Malaysia and Indonesia and the
Philippines have been especially efficient at absorbing FDI to promote their GDP, so
Myanmar might be able to achieve economic growth by inviting more FDI inflows. Due to
prior trade restrictions, Myanmar’s economy and trade sector have been weak at attracting
foreign investment. However, the current economy is favorable for Myanmar’s economy to
expand exports and to penetrate the intra-regional markets in India, China and Thailand, as
well as traditional export markets, such as the United States and the European Union. To
promote exports, some activities will be necessary, such as supporting skilled labor, absorbing
updated technology, upgrading infrastructure facilities with modern technology and importing
equipment to produce quality products. As a newly prosperous country, any foreign exchange
rate monitoring policy should be effective and intentionally react to foreign exchange markets.
To open trade and capital flow to what is a relatively small economy, there is a need to monitor

123
exchange rate stability to avoid changes in the value of the trade-weighted effective exchange
rate, both nominal and real.
Finally, this study determined the impact of trade and exchange rate volatility on foreign
direct investment in Myanmar by comparing it with eight ASEAN countries. Both explained
variables utilized in each estimation could be explained. The trade openness ratio was directly
related to FDI net inflow and proved that a nation’s free trade policy affected FDI inflow for
ASEAN countries, but did not prove an effect in an FDI inflow analysis of Myanmar.
Exchange rate volatility’s impact on FDI inflow was significantly to Myanmar’s FDI inflow
but wasn’t related to ASEAN FDI inflow. If exchange rate volatility increases, FDI inflow
will decrease. If a host country’s export sector improved, FDI inflow also increased. The
favorable export market of a host country can attract FDI.
Limitations of the study and suggestions for future research
There were some restrictions in this study, especially those arising from limitations in
data. While the research compared bilateral trade between Myanmar and other trading partner
countries, some variables were skipped in this research due to limited ability of data about
Myanmar. One of the weak points of this analysis is the absence of a comparison of Myanmar
versus ASEAN exchange rate volatility. In addition, some of previous empirical studies of
trade openness and exchange rate volatility’s impact on FDI have been conducted at an
industry or firm level. Studying the relationship between trade and FDI at a firm or industry
level can provide greater and more accurate insight into the interaction of trade and FDI.
However, FDI and some other required data was unavailable. In the future, it would be

124
interesting to obtain enough valid data to further research the relationship between trade and
FDI not only for Myanmar, but also for other ASEAN countries.

125
Bibliography
Adenutsi, D.E. (2007). Effects of Trade Openness and Foreign direct investment on industrial
performance in Ghana. Central University Collage. Retrieved from
https://mpra.ub.uni-muenchen.de/37116/1/MPRA_paper_37116.pdf
Agosin, M.R. & Machado, R. (2006). Openness and the international allocation of foreign
direct investment. Journal of Development Studies, 43 (7), 1234-1247.
Agarwal, J. (1980). Determinants of Foreign Direct Investment: A Survey.
Welwirtschaftliches Archives, 116, 739-773.
Aizenman, J. & Noy, I. (2005). FDI and Trade - Two Way Linkages? University of California,
Economics Department, Working Paper No. 598. Retrieved from
https://www.econstor.eu/bitstream/10419/83838/1/wp-598.pdf
Akinlo, E. (2004). Foreign direct investment and growth in Nigeria an empirical investigation.
Journal of Policy Modeling, 26, 627–639.
Alam, M., Gazi S. & Taufique, K. (2009). Import Inflows of Bangladesh: the Gravity Model
Approach. International Journal of Economics and Finance. 1.
DOI:10.5539/ijef.v1n1p131.
Alamgir, J. (2008). Myanmar’s Free Trade and Political Consequences. Asian Survey 48(6),
977-996.
Ali Hammad, M.M. (2015). The Effect of Trade Openness on Foreign Direct
Investment in Sudan: An Empirical Analysis (1990-2012). A dissertation submitted to
the University of Gezira.
Alshammari, A., Hammoudeh, M. & Pavlovic, M. (2015). Governance, Regulations, Trade
Openness and FDI Inflows: Empirical Study. International Journal of Economics and
Finance, 7(12).
Anastasia, A. & Liargovas, P. (2014). Foreign Direct Investment and Growth: EU, EMU, and
Transition Economies. Journal of Economic Integration, 29(3), 470-495.
Arabi, K. & Ibrahim, O. (2012). Does Gravity Model Fit Sudan’s Trade Patterns?
International Journal of Economics and Finance, 4(6). DOI:10.5539/ijef.v4n6p157

126
ASEAN Tax Guide (2013). KPMG Asia Pacific Tax Centre. Retrieved from
https://assets.kpmg.com/content/dam/kpmg/pdf/2013/12/asean-tax-guide-v2.pdf
Asia Development Bank. (2008). Key Indicators for Asia and the Pacific 2008. 39th edition.
Retrievedfrom
https://www.adb.org/sites/default/files/publication/27728/key-indicators-2008.pdf.
Asia Development Bank (2012). Myanmar in Transition: Opportunities and Challenges.
Retrieved from https://www.adb.org/sites/default/files/publication/29942/myanmar-
transition.pdf
Asia Development Bank. (2012). Key Indicators for Asia and the Pacific 2012. 43rd edition.
Retrieved from https://www.adb.org/sites/default/files/publication/29940/ki2012.pdf
Asiedu, E. (2002). On the determinants of foreign direct investment to developing countries:
is Africa different? World Development, 30(1), 107–119.
Aung, N. M. (2009). An Analysis of the Structure of Myanmar’s Export and Its Implications
for Economic Development. PhD dissertation, University of Tokyo.
Asiedu, E. (2006). Foreign direct investment in Africa: The role of natural resources, market
size, government policy, institutions and political instability. World Economy, 29(1), 63-
77.
Babatunde, A. (2011). Trade openness, infrastructure, FDI and growth in Sub-Saharan
African countries. Journal of Management Policy and Practice, 12(7), 27-36.
Balasubramanvan V & V Mahambare (2003). Foreign Direct Investment in India, Working
papers, Lancaster University Management School, Economics Department. No 539987.
Bano, S. & Tabbada, J. (2015). Foreign Direct Investment Outflows: Asian Developing
Countries. Journal of Economic Integration, 30(2), 359-398.
Biglaiser, G. & DeRouen, K. (2006). Economic reforms and inflows of foreign direct
investment in Latin America. Latin American Research Review, 41(1), 51–75.
Bishwanath, G. & Etsuro, I. (1999). Foreign Direct Investment in Asia. Economic and
Political Weekly, 34(22), M50-M60.

127
Bruce A. Blonigen,(2009), A Review Of The Empirical Literature On FDI Determinants
NEBR Working Paper Series, National Bureau Of Economic Research, 1050
Massachusetts Avenue Cambridge, Ma 02138 April 2005.
Bushra, Y., Aamrah, H. & Ali, M. (2003). Analysis of Factors Affecting Foreign Direct
Investment in Developing Countries. Pakistan Economic and Social Review, 41(1/2),
59-75.
Casson, M. (1982). The Theory of Foreign Direct Investment. International Capital
Movements. London: Macmillan. 22-57.
Ceglowski, J. (2006). Does Gravity Matter in a Service Economy? Review of WORLD
Economics, 142(2), 307-329.
Chakrabarti, A. (2001). The determinants of foreign direct investments: sensitivity analyses
of cross-country regressions. Kyklos, 54(1), 89-114.
Cheng, L.K. & Kwan, Y.K. (2000). What are the determinants of the location of foreign direct
investment? The Chinese experience. Journal of International Economics, 51(2), 379-
400.
Cine, W.R. (1982). Can the East Asia Model of Development be Generalized? World
Development 10(2).
Deardorff, A.V. (1995). Determinants of Bilateral Trade: Does Gravity Work in a
Neoclassical World? National Bureau of Economics Research, Working Paper 5377.
Directorate of Investment and Company Administration. (2014). Myanmar Investment
Guide. Retrieved from https://www.dica.gov.mm/files/document-
files/myanmarinvestmentguide_2014.pdf
Dornbush, R. (1998). Purchasing Power Parity, in the New Palgrave Dictionary of
Economics. London, Macmillan.
Dua, P. & Rashid, A.I. (1995). Foreign Direct Investment and Economic Activity in India.
Indian Economic Review, New Series, 33(2), 153-168.
Dunning, J. H. (1993). Multinational Enterprises and the Global Economy. Harlow, Essex:
Addison Wesley.

128
Evenett, S.J. & Keller, W. (1988). On Theories Explaining the Success of the Equation.
National Bureau of Economic Research, Working Paper, 6529.
Ferris, S.P., Thompson, G.R. & Valsan, C. (1997). Analysis of Foreign Direct Investment in
Latin America: The Case of the Guyanese Economy. Pakistan Economic and Social
Review, 35(1), 11-24.
Goldberg, L. & Kolstad, C. (1995). Foreign Direct Investment, Exchange Rate Variability and
Demand Uncertainty. International Economic Review, 36(4), 855-873.
Greenlee, W. & McBeth, A. (2014). ASEAN Guide 2014-2015: The long road ahead:
Implementing the Asian Economic Community (AEC). Retrieved from
https://www.dfdl.com/wp-content/uploads/2014/12/the-long-road-ahead-
implementing-the-asian-economic-community-aec-asean-guide-2014-2015.pdf
Helleiner, G.K. (1989). Transnational Corporations and Direct Foreign Investment. Handbook
of Development Economics, Elsevier, Amsterdam: 1442-1480.
Hout, N. & Kakinaka, M. (2007). Trade Structure Trade Flows in Cambodia: A Gravity
Model, ASEAN Economic Bulletin.
Hirsch, S. & Bijaoui, I. (1985). R&D intensity and export performance: A micro view. Review
of World Economics, 121(2), 238–251.
Hla, P. M. (n.d.). Progress Report on AFTA: Changes and Implications for Myanmar Trade
Policy. Yangon.
Honduras. Countries at the crossroads 2007. (2007). Retrieved from
https://freedomhouse.org/report/countries-crossroads/2007/honduras.
International Monetary Fund (2015). World Economic Outlook. Washington D.C:
International Monetary Fund.
Intal, P. & Chen, L. (2017). ASEAN and Member States: Transformation and Integration,
ASEAN@50, Vol. 3.
James B. Ang∗ (2007). Determinants of foreign direct investment in Malaysia. Journal of
Policy Modeling 30 (2008) 185–189.
Kandiero, T. & Chitiga, M. (2006). Trade openness and foreign direct Investment in Africa.
South African Journal of Economic and Management Sciences, 9(3), 355-370.
129
Kawai, M & Naknoi, K (2015). ASEAN economic integration through trade and foreign direct
investment: Long-term challenges, ADBI Working Paper, No. 545, Asian Development Bank
Institute (ADBI), Tokyo.
K Keum (2008), Tourism flows and trade theory: a panel data analysis with the gravity model,
Published online: 7 November 2008. © Springer-Verlag 2008.
Khine, T. (2008). Foreign Direct Investment Relations Between Myanmar and ASEAN.
Institute of Developing Economies, Japan External Trade Organization (IDE-JETRO).
IDE Discussion Paper, volume 149, 2008-04.
Kim, C.S. & Park, M.S. (2012). Trade, Foreign Direct Investment and International Flow of
Labor in OECD Countries. Journal of International and Area Studies, 19(2), 1-12.
Kim, S. (2006). An Analysis of Cambodia’s Trade Flow: A Gravity Model. Retrieved from
https://papers.ssrn.com/sol3/papers.cfm?abstract_id=1008121
Kimura, F. & Lee, H.H. (2006). The Gravity Equation in International Trade in Services.
Review of World Economics, 142 (1), 92-121.
Klasra, M.A. (2011). Foreign direct investment, trade openness and economic growth in
Pakistan and Turkey: An investigation using bounds test. Qual Quant, 45(1), 223-231.
Klyuev, V. & Dao, T. (2016). Evolution of Exchange Rate Behavior in the ASEAN-5
Countries. International Monetary Fund Working Paper, Retrieved from
https://www.imf.org/external/pubs/ft/wp/2016/wp16165.pdf
Krugman, P.R., Obstfeld, M., & Melitz, M.J. (2012). International economics: theory &
policy. Boston, MA: Pearson Addison-Wesley.
Kubo, K. (2012). Trade Policies and Trade Misreporting in Myanmar: ASEAN Economic
Bulletin, 29, 2. 146-159.
Kubo, K. (2013). Myanmar’s Non-Resources Export Potential After the Lifting the
Economic Sanctions: A Gravity Model Analysis. Institute of Developing Economies,
Japan External Trade Organization, discussion paper. Retrieved from
https://ir.ide.go.jp/?action=pages_view_main&active_action=repository_view_main_i
tem_detail&item_id=37749&item_no=1&page_id=39&block_id=158

130
Kubo, K. (2014). Foreign Exchange Market Reform in Myanmar, Achievements, and
Challenges. Journal of South East Asian Economies 31(2), 210-224.
Kudo, T. & Kumagai, S. (2014). Export-oriented and FDI-driven Growth Strategy for
Myanmar, Institute of Developing Economies, Japan External Trade Organization,
discussion paper. Retrieved from
http://www.ide.go.jp/library/English/Publish/Download/Brc/pdf/13_02.pdf
Girma, S., Görg, H. & Pisu, M. (2008). Exporting, Linkages and Productivity Spillovers from
Foreign Direct Investment, The Canadian Journal of Economics, 41(1), 320-340.
Goldberg, L. & Kolstad, C. (1995). Foreign Direct Investment, Exchange Rate Variability and
Demand Uncertainty. International Economic Review, 36(4), 855-873.
Liargovas, P.G. & Skandalis, K.S. (2012). Foreign direct investment and trade openness: The
case of developing economies. Social Indicators Research, 106(2), 323-331.
List of countries ordered by: Labor force, female (% of total labor force). (2017). Retrieved
fromhttps://www.populationpyramid.net/hnp/labor-force-female-of-total-labor
force/2015
Loree, D.W. & Guisinger, S.E. (1995) Policy and non-policy determinants of US equity
foreign direct investment. Journal of International Business Studies, 26(2), 281-299.
Mina, W. (2007). The location determinants of FDI in the GCC countries. Journal of
Multinational Financial Management, 17(4), 336-348.
Ministry of Economy, Trade, and Industry, Japan (2015). Myanmar Industrial Development
Vision. Retrieved from http://www.meti.go.jp/meti_lib/report/2015fy/000937.pdf
Mottaleb, K.A. (2007). Determinants of foreign direct investment and its impact on economic
growth in developing countries. Retrieved from http://mpra.ub.unimuencchen.
de/94571/1/MPRA_paper_9457.pdf
Mphigalae, T.V. (2011). The impact of trade openness on foreign direct investment (FDI)
inflows in emerging market economies, a mini-thesis. University of the Western Cape.
Myanmar Trade and Investment Strategy, Consultation Paper, February 2015. Retrieved from
https://mdricesd.files.wordpress.com/2015/04/trade-invest-en.pdf.
131
Myanmar Trade and Investment Strategy, Consultation Paper, February 2015. Retrieved from
https://mdricesd.files.wordpress.com/2015/04/trade-invest-en.pdf
Myint, U. (2009). Myanmar Economy: A Comparative View. Institute for Security and
Development Policy. Retrieved from
http://www.eaber.org/sites/default/files/U%20Myint%20-
%20Myanmar%20Economy,%20a%20comparative%20view%20(Dec%202010).pdf
Naing, D.Z.Z. (2015). Trade Policy Reform in Myanmar. Yangon University of Economics.
Retrieved from https://goo.gl/vjuqc7
Nandar Hlaing, N.S (2014). The Review and Evaluation of Industrial Policy Especially
SMEs Development of CLMV countries. ASEAN - Canada Research Partnership
Working Paper No. 6, Retrieved from https://www.rsis.edu.sg/wp-
content/uploads/rsis-pubs/NTS/resources/db/uploadedfiles/SME%20paper.pdf.
Nash, R. (2017). Responsible Investment in Myanmar Lessons from experiences of SEZ
developments. OXFAM Discussion Paper, Retrieved from https://policy-
practice.oxfam.org.uk/publications/responsible-investment-in-myanmar-lessons-from-
experiences-of-sez-developments-620179
Neumayer, E. & de Soysa, I. (2005). Trade openness, foreign direct investment and child
labour. World Development, 33(1), 43-63.
N. Kosteletou & P. Liargovas. (2000). Foreign Direct Investment and Real Exchange Rate
Interlinkages, Open Economies Review, Volume 11, Issue 2, pp 135–148, April 2000.
Nguyen, B.X. (2010). The Determinants of Vietnamese’s Export Flows Statics and Dynamic
Panel Data Approaches. International Journal of Economics and International
Finance, 2(4).
Nguyen N.B. & Jonathan. H. (2002). Trade Liberalization and Foreign Direct Investment in
Vietnam. ASEAN Economic Bulletin, 19(3), 302-318.
Nguyen, K.T. (2009). Gravity Model by Panel Data Approach: An Empirical Implication
with ASEAN Free Trade Area. ASEAN Economic Bulletin, 26(3). 266-299.
Normaz, W., Ismail, P.S. & Maurice, K. (2009). The Effect of ASEAN Economic Integration
on Foreign Direct Investment. Journal of Economic Integration, 24(3), 385-407.

132
Nu Lwin, N. (2009). Analysis on International Trade of CLM Countries. Institute of
Developing Economies. IDE Discussion Paper No. 215.
Nuroglu, E. & Dreca, N. (2011). Analysing Bilateral Trade Flow of Bosnia Herzegovina
Under the Framework of Gravity Model. Journal of Business and Economics, 3(1) 30-
50.
OECD investment policy reviews: Myanmar 2014. (2014). Paris: OECD Publishing.
Retrieved from http://www.oecd.org/daf/inv/investment-policy/Myanmar-IPR-
2014.pdf
OECD (2011). Trade Openness. OECD Science, Technology, and Industry Scoreboard 2011.
OECD (2014), OECD Investment Policy Reviews: Myanmar 2014, OECD Publishing.
Omisakin et al., (2009). Foreign Direct Investment, Trade Openness and Growth in Negria,
Journal of Economic Theory 3(2): 13-18, 2009. ISSN 1994-8212.
Oxford Business Group. (2016). The Report, Myanmar 2016: An Export-oriented and FDI-
driven Growth Strategy for Myanmar. Institute for Developing Economies.
Oxford Business Group. (2017). The Report, Myanmar 2017: An Export-oriented and FDI-
driven Growth Strategy for Myanmar. Institute for Developing Economies.
Oxford Business Group. (2018). The Report, Myanmar 2018: An Export-oriented and FDI-
driven Growth Strategy for Myanmar. Institute for Developing Economies.
Rahman, M.M. & Ara, L.A. (2010). Bangladesh Trade Potential: Dynamic Gravity
Approach. Journal of International Trade Law and Policy, 9(2), 130-147.
Rahman, M.M. (2009). Australia’s Global Trade Potential: Evidence from Gravity Model
Analysis. Proceedings of the 2009 Oxford Business and Economics 24 Conference
(OBEC). Retrieved from https://eprints.usq.edu.au/5537/1/Rahman_OBEC_09_PV.pdf
Seim, T. (2009). FDI and openness: Differences in response across countries line, Chr.
Michelsen Institute. http://www.nek.lu.se/ryde/NordicEcont09/Papers/seim.pdf.
Sohn, C.H. (2001). A Gravity Model Analysis of the Korea’s Trade Patterns and The Effect
of Regional Trading Arrangement. Korea Institute for International Economic Policy
Working Paper Series. Retrieved from
http://www.agi.or.jp/user04/751_220_20110622151514.pdf

133
Sohn, C.H. (2005). Does the Gravity Model Explain South Korea’s Trade Flows? Japanese
Economic Review, 56(4). 417-430 https://doi.org/10.1111/j.1468-5876.2005.00338.x
Than, M. (1992). Myanmar’s External Trade: An Overview of the Southeast Asian Context.
Singapore: ASEAN Economic Research Unit, Institute of South East Asian Studies.
Than, M and Thein, M. (2000). “Financial Resources for Development in Myanmar: Lessons
from Asia.Institute of South East Asian Studies. Singapore.
Thein, M. (2004). Economic Development of Myanmar. Singapore: Institute of Southeast
Asian Studies.
Tinbergen, J. (1962). Shaping the World Economy, Suggestions for an International Economic
Policy, New York, USA. Twentieth Century Fund.
Tolentino, P.E. (2010). Home country macroeconomic factors and outward FDI of China and
India. Journal of International Management, 16(2), 102-120.
Tsai, P. (1994). Determinants of Foreign Direct Investment and its Impact on Economic
Growth. Journal of Economic Development,19(1), 137-163.
Tsaurai, K. (2015). Trade Openness and FDI in Zimbabwe: What does data tell us?.
Corporate Ownership & Control, 12(4), ???
Vernon, R. (1996). International Investment and International Trade in the Product Cycle.The
Quarterly Journal of Economics, Volume 80, Issue 2, 1 May 1966, Pages 190–
207,https://doi.org/10.2307/1880689
Ullah, M. & Inaba, K. (2014). Liberalization and FDI Performance: Evidence from ASEAN
and SAFTA Member Countries, Journal of Economic Structures, The Official
Journal of the Pan-Pacific Association of Input-Output Studies. Retrieved from
https://journalofeconomicstructures.springeropen.com/articles/10.1186/s40008-014-
0006-z.
Walsh, K. (2008). Trade in Services: Does Gravity Hold? Journal of World Trade 42(2),
315-334.
Wang, L. (2011). Application of Gravity Model: Measurement of International
Competitiveness of Trade in Services. Studies in Sociology of the Science, 2(2), 50-
56.

134
Why Investment in Myanmar. Retrieved from
https://www.gbs.com.vn/index.php/en/faq/myanmar/2548-why-invest-in-myanmar
Wooldridge, J. (2012). Introductory Econometrics: A Modern Approach. Cengage Learning.
World Bank Group. Trade Indicators. Retrieved from
https://wits.worldbank.org/wits/wits/witshelp/Content/Utilities/e1.trade_indicators.htm
Yousaf, M.M., Hussain, Z. & Ahmad, N. (2003). Analysis of Factors Affecting Foreign Direct
Investment in Developing Countries. Pakistan Economic and Social Review, 41(1/2),
59-
Yu-Cheng, L. & Santanu, S. (2011). Labour Cost & Foreign Direct Investment-Evidence from
India. Indian Journal of Industrial Relations, 46(3), 396-411.
Zakaria, M., Naqvi, H.A. & Fida, B.A. (2014). Openness and FDI in Pakistan: What does the
data tell us? Middle East Journal of Scientific Research, 19(12), 1587-1597.
Zhang, Q. & Felmingham, B. (2001). The relationship between inward direct foreign
investment and China’s provincial export trade. China Economic Review, 12(1), 82-99.
Notes
Attending and presenting papers in International Conference
1. Khin Mar Thet “The Impacts of Trade and Exchange Rate Stability on Foreign Dire
ct Investment: Case Study of ASEAN and Myanmar”
Presented to KEA-APEA International Conference held by Korea University, Seoul, Korea
In July 14 -15, 2017.
2. Khin Mar Thet “The Effects of Trade Openness and Exchange Rate Volatility on
Foreign Direct Investment of ASEAN and Myanmar”
Presented to the 16th International Conference of the Japan Economic Policy Association
held by the University of Ryukyu Okinawa Nov 4-5, 2017.
Journal Submission for publication
1.Khin Mar Thet: “Evolution of Myanmar Trade Structure and Foreign Direct Investment”
Journal of Humanities and Social Sciences, The Graduate School of Humanities and Social
Science, Okayama University (Submitted).
2. Khin Mar Thet: “The Influential Determinants of FDI Inflow in Myanmar” submitted to
Yangon University of Economics Research Journal, Yangon University of Economics,
Accepted (27.11.2018)


