

2013
New Mexico Youth Risk and Resiliency Survey (YRRS)
Middle School Survey Results
Los Alamos County
Grades 7-8
New Mexico Department of Health
New Mexico Public Education Department
UNM Prevention Research Center
New Mexico 2013 YRRS
Middle School
Suggested citation:Green D, Peñaloza L, and FitzGerald C. 2014. New Mexico Youth Risk and Resiliency Survey: Middle School Survey
Results 2013, Los Alamos County. Epidemiology and Response Division, New Mexico Department of Health;
School and Family Support Bureau, New Mexico Public Education Department; and University of New Mexico
Prevention Research Center.
2

New Mexico 2013 YRRS
Middle School
UNIVERSITY OF NEW MEXICO DIVISION FOR PREVENTION AND POPULATION SCIENCES,
HEALTH EVALUATION AND RESEARCH TEAM
Linda J. Peñaloza, PhD, Associate Research Professor*
Laura Gutman, PhD, Multi-Media Development Specialist
Courtney FitzGerald, MSSW, LMSW, Associate Scientist II
Leona Woelk, MA, Associate Scientist II
José Canaca, MD, Associate Scientist I
Eric Chrisp, MS, Associate Scientist II
ACKNOWLEDGEMENTS
This report is a product of the NM Youth Risk and Resiliency Survey (YRRS), a project that characterizes
risk behaviors and resiliency/protective factors among New Mexico youth. The YRRS is a joint project of
the New Mexico Department of Health (NMDOH) and the New Mexico Public Education Department
(PED), with support and technical assistance from the University of New Mexico Prevention Research
Center (UNM PRC); the Office of Substance Abuse Prevention, Behavioral Health Services Division (OSAP-
BHSD); the Albuquerque Area Southwest Tribal Epidemiology Center (AASTEC); and the Division of
Adolescent and School Health, Centers for Disease Control and Prevention (CDC-DASH). Gratitude is
extended to the individuals listed below for their contribution toward developing and producing this
report. (Individuals who served on the NM-YRRS 2013 Steering Committee are identified by an asterisk
(*).)
NEW MEXICO DEPARTMENT OF HEALTH
Retta Ward, MPH, Cabinet Secretary, New Mexico Department of Health
Michael Landen, MD, MPH, State Epidemiologist and Director, Epidemiology and Response Division*
Toby Rosenblatt, Burea Chief, Injury and Behavioral Epidemiology Bureau
Lori Zigich, MPH, Survey Section Manager, Injury and Behavioral Epidemiology Bureau*
Dan Green, MPH, Survey Epidemiologist, Injury and Behavioral Epidemiology Bureau*
James Padilla, MS, Tobacco Epidemiologist, Tobacco Use Prevention and Control Program*
James Farmer, MPH, Health Services Manager, Office of School and Adolescent Health*
NEW MEXICO HUMAN SERVICES DEPARTMENT, BEHAVIORAL HEALTH SERVICES DIVISION
Karen Cheman, MPH, Prevention Staff Manager, Office of Substance Abuse Prevention *
ALBUQUERQUE AREA SOUTHWEST TRIBAL EPIDEMIOLOGY CENTER
Kevin English, RPh, MPH, Director
Judith Espinoza, MPH, Epidemiologist*
Ophelia Spencer, Tribal Survey Coordinator
NEW MEXICO PUBLIC EDUCATION DEPARTMENT
Hanna Skandera, Secretary of Education
Paul Aguilar, Deputy Secretary, Finance and Operations
Denise Koscielniak, Director, Federal Programs
Dean Hopper, Director, Coordinated School Health & Wellness Bureau
Cris Kimbrough, Deputy Director, Coordinated School Health & Wellness Bureau*
Gabrielle Abousleman, HIV/STI Prevention Education Coordinator, Coordinated School
Health & Wellness Bureau
3

New Mexico 2013 YRRS
Middle School
4
New Mexico 2013 YRRS
Middle School
Topic Page
7
9
15
16
21
23
27
31
35
37
39
43
45
49
61
77
81
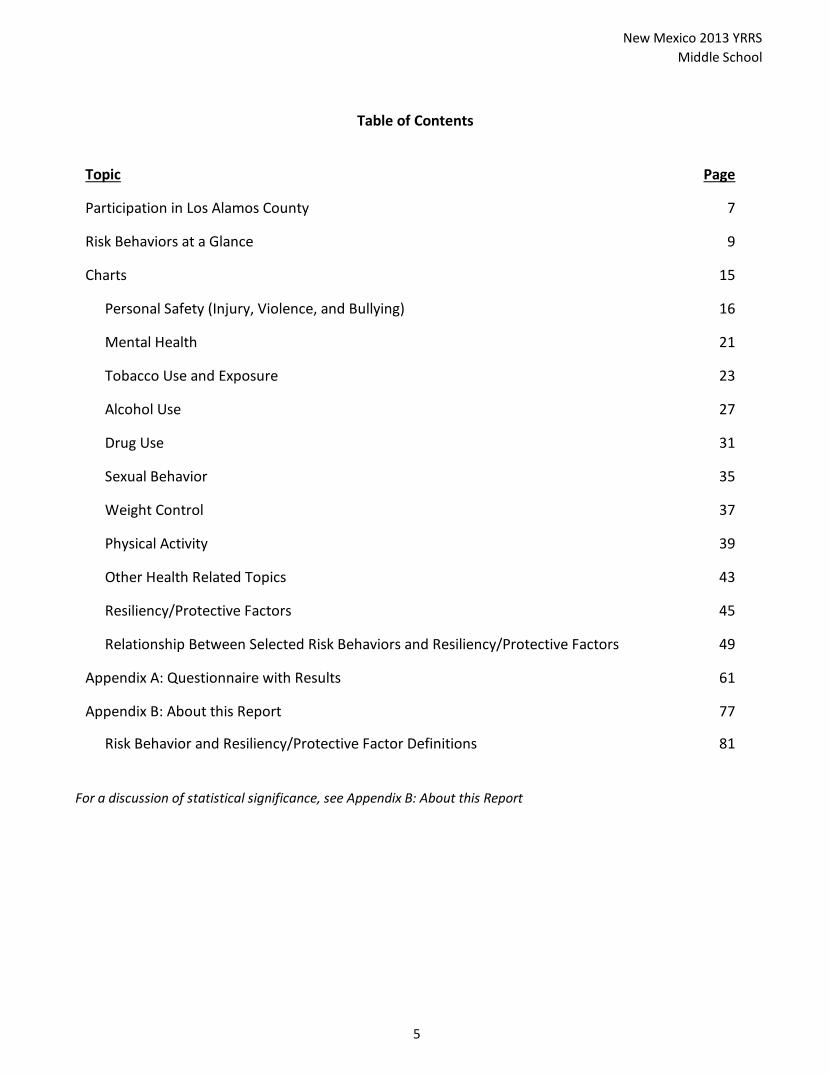
Other Health Related Topics
Resiliency/Protective Factors
Weight Control
Physical Activity
Charts
Personal Safety (Injury, Violence, and Bullying)
For a discussion of statistical significance, see Appendix B: About this Report
Table of Contents
Participation in Los Alamos County
Risk Behaviors at a Glance
Appendix A: Questionnaire with Results
Relationship Between Selected Risk Behaviors and Resiliency/Protective Factors
Mental Health
Tobacco Use and Exposure
Alcohol Use
Drug Use
Sexual Behavior
Appendix B: About this Report
Risk Behavior and Resiliency/Protective Factor Definitions
5

New Mexico 2013 YRRS
Middle School
6

New Mexico 2013 YRRS
Middle School
Profile of students surveyed
Number of students Percent (%)
who responded
Total 138 (100%)
Gender
Girls 75 (54.3%)
Boys 63 (45.7%)
Race/Ethnicity
American Indian or Alaska Native 12 (8.7)
Asian 10 (7.2)
Black or African-American 3 (2.2)
Hispanic 40 (29.0)
Native Hawaiian or Pacific Islander 3 (2.2)
White 99 (71.7)
Grade Level
6th 0 (0.0%)
7th 76 (57.6%)
8th 61 (52.6%)
Ungraded or other 1 (0.9%)
A high response rate produces survey results that are more representative of the student population. A
response rate of at least 60% allows generalization of results to the entire student body. A response rate
of 70% is excellent and allows a high degree of confidence in results. Response rates below 60% are
considered low, and caution should be exercised in interpreting results. Low response rates indicate that
the data may represent only students who participated in the survey and not necessarily the entire
student body.
New Mexico Youth Risk and Resiliency Survey
Participation in Los Alamos County
(Totals may be more than 100% because respondents
were allowed to choose multiple race/ethnicities)
Middle School (Grades 7-8)
The response rate for Los Alamos County was 60%.
7

New Mexico 2013 YRRS
Middle School
8
New Mexico 2013 YRRS
Middle School
% (95% CI) % (95% CI)
38.1 (26.5-51.2) 74.0 (68.8-78.6)
4.0 (1.4-10.5) 5.7 (4.5-7.2)
45.0 (34.0-56.5) 32.0 (29.4-34.6)
40.4 (28.8-53.1) 45.8 (42.7-49.0)
45.2 (34.3-56.5) 46.0 (43.8-48.3)
26.4 (18.4-36.2) 18.6 (16.8-20.5)
23.4 (15.0-34.6) 20.9 (19.0-23.0)
18.1 (13.3-24.3) 13.6 (11.9-15.6)
9.3 (4.2-19.4) 7.8 (6.8-8.9)
8.2 (3.9-16.2) 4.6 (3.8-5.7)
3.6 (1.3-9.7) 4.5 (3.5-5.9)
3.0 (0.8-10.4) 3.0 (2.4-3.8)
35.3 (25.8-46.1) 30.7 (27.5-34.1)
18.9 (12.4-27.6) 25.7 (22.4-29.2)
11.5 (6.4-19.8) 9.2 (7.8-11.0)
5.7 (3.0-10.5) 3.9 (3.0-5.0)
9.0 (4.9-16.0) 11.9 (10.1-14.1)
15.4 (10.8-21.4) 15.7 (13.4-18.4)
5.2 (2.1-12.3) 5.0 (3.9-6.5)
8.3 (5.5-12.2) 10.2 (8.6-12.2)
7.5 (4.6-11.9) 7.3 (6.1-8.7)
5.6 (3.1-9.9) 3.3 (2.7-4.1)
9.7 (6.2-14.9) 9.3 (8.4-10.3)
8.2 (5.1-13.2) 5.5 (4.8-6.2)
3.7 (1.4-9.5) 3.1 (2.6-3.6)
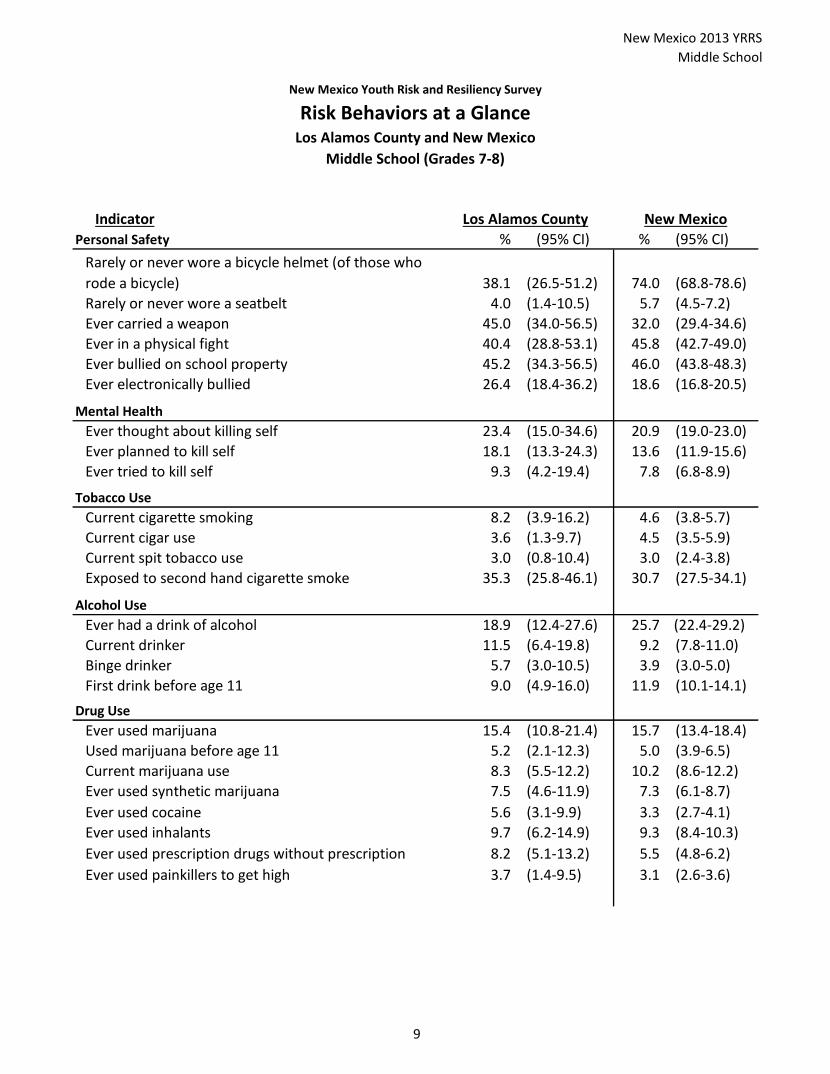
Current cigar use
Alcohol Use
Current drinker
Binge drinker
First drink before age 11
Drug Use
Los Alamos County New Mexico
Personal Safety
Rarely or never wore a seatbelt
New Mexico Youth Risk and Resiliency Survey
Risk Behaviors at a Glance
Ever tried to kill self
Ever used marijuana
Used marijuana before age 11
Current marijuana use
Ever used synthetic marijuana
Ever used painkillers to get high
Ever used prescription drugs without prescription
Indicator
Mental Health
Tobacco Use
Ever electronically bullied
Ever thought about killing self
Ever planned to kill self
Los Alamos County and New Mexico
Current spit tobacco use
Exposed to second hand cigarette smoke
Middle School (Grades 7-8)
Current cigarette smoking
Ever had a drink of alcohol
Rarely or never wore a bicycle helmet (of those who
rode a bicycle)
Ever used cocaine
Ever used inhalants
Ever carried a weapon
Ever in a physical fight
Ever bullied on school property
9
New Mexico 2013 YRRS
Middle School
% (95% CI) % (95% CI)
6.3 (2.3-16.6) 8.3 (6.8-10.0)
3.4 (3.0-10.5) 3.0 (3.0-5.0)
43.4 (4.9-16.0) 58.8 (10.1-14.1)
22.1 (13.0-25.5) 25.3 (19.2-22.7)
32.3 (17.2-33.5) 46.4 (21.8-26.4)
20.0 (78.3-92.1) 20.0 (78.2-80.9)
8.1 (59.0-79.8) 6.3 (66.7-72.4)
8.9 (83.9-92.3) 13.3 (71.9-78.3)
69.4 (10.8-21.4) 57.1 (13.4-18.4)
41.1 (2.1-12.3) 35.0 (3.9-6.5)
10.7 (5.5-12.2) 30.7 (8.6-12.2)
26.6 (4.6-11.9) 33.0 (6.1-8.7)
68.1 (3.1-9.9) 35.4 (2.7-4.1)
66.7 (6.2-14.9) 63.6 (8.4-10.3)
47.8 (5.1-13.2) 43.5 (4.8-6.2)
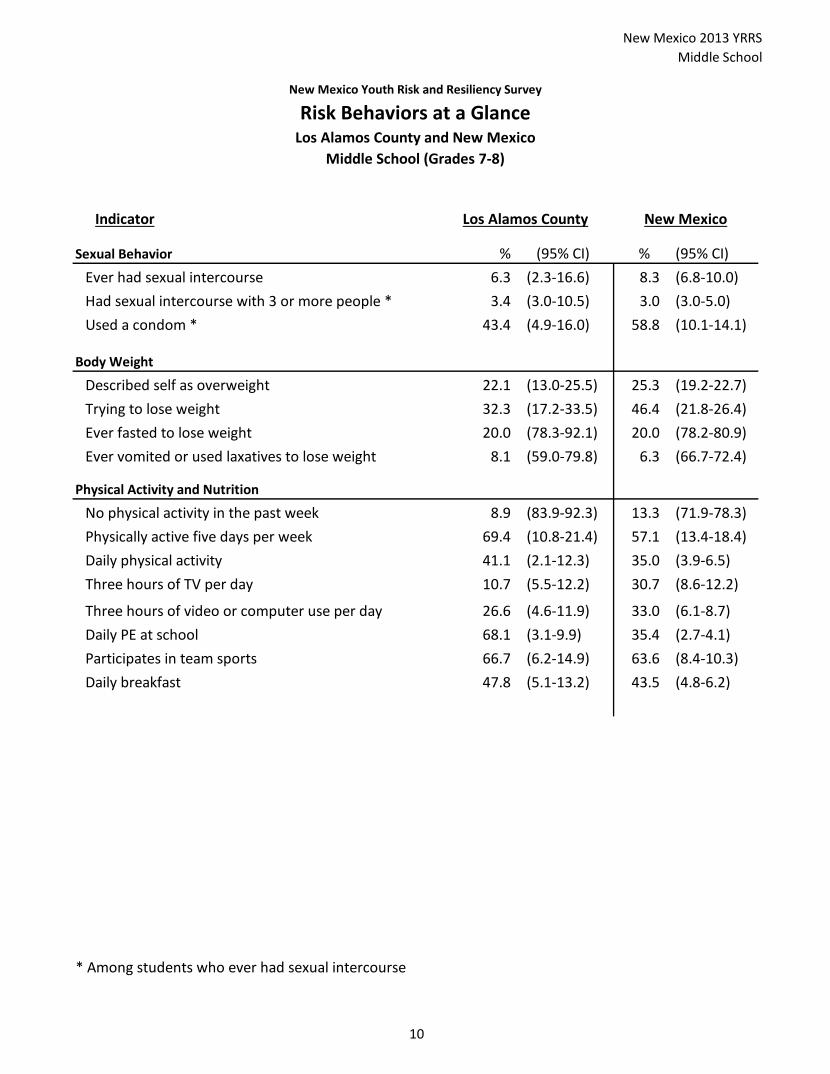
No physical activity in the past week
Daily physical activity
Middle School (Grades 7-8)
Indicator
New Mexico Youth Risk and Resiliency Survey
Risk Behaviors at a GlanceLos Alamos County and New Mexico
Los Alamos County New Mexico
Body Weight
Physical Activity and Nutrition
Sexual Behavior
Ever had sexual intercourse
Had sexual intercourse with 3 or more people *
Used a condom *
Described self as overweight
Trying to lose weight
Participates in team sports
Ever vomited or used laxatives to lose weight
Ever fasted to lose weight
Physically active five days per week
* Among students who ever had sexual intercourse
Three hours of TV per day
Three hours of video or computer use per day
Daily PE at school
Daily breakfast
10

New Mexico 2013 YRRS
Middle School
Personal Safety
Mental Health
Tobacco Use
* Statistically significant difference.
New Mexico Youth Risk and Resiliency Survey
Risk Behaviors at a GlanceLos Alamos County and New Mexico
Middle School (Grades 7-8)
74.0
5.7
32.0
45.8
46.0
18.6
20.9
13.6
7.8
4.6
4.5
3.0
30.7
38.1
4.0
45.0
40.4
45.2
26.4
23.4
18.1
9.3
8.2
3.6
3.0
35.3
0 50 100
Rarely or never wore a bicycle helmet*
Rarely or never wore a seatbelt
Ever carried a weapon
Ever in a physical fight
Ever bullied on school property
Ever electronically bullied
Ever thought about killing self
Ever planned to kill self
Ever tried to kill self
Current cigarette smoking
Current cigar use
Current spit tobacco use
Exposed to second hand cigarette smoke
Percent (%)
NM Los Alamos County
11

New Mexico 2013 YRRS
Middle School
Alcohol Use
Drug Use
Sexual Behavior
No statistically significant differences.
Los Alamos County and New Mexico
Middle School (Grades 7-8)
New Mexico Youth Risk and Resiliency Survey
Risk Behaviors at a Glance
25.7
9.2
3.9
11.9
15.7
5.0
10.2
7.3
3.3
9.3
5.5
3.1
8.3
3.0
58.8
18.9
11.5
5.7
9.0
15.4
5.2
8.3
7.5
5.6
9.7
8.2
3.7
6.3
3.4
43.4
0 50 100
Ever had a drink of alcohol
Current drinker
Binge drinker
First drink before age 11
Ever used marijuana
Used marijuana before age 11
Current marijuana use
Ever used synthetic marijuana
Ever used cocaine
Ever used inhalants
Ever used prescription drugs without prescription
Ever used painkillers to get high
Ever had sexual intercourse
Had sexual intercourse with 3 or more people
Used a condom
Percent (%)
NM Los Alamos County
12

New Mexico 2013 YRRS
Middle School
Body Weight
Physical Activity and Nutrition
* Statistically significant difference.
New Mexico Youth Risk and Resiliency Survey
Risk Behaviors at a GlanceLos Alamos County and New Mexico
Middle School (Grades 7-8)
25.3
46.4
20.0
6.3
13.3
57.1
35.0
30.7
33.0
35.4
63.6
43.5
22.1
32.3
20.0
8.1
8.9
69.4
41.1
10.7
26.6
68.1
66.7
47.8
0 50 100
Described self as overweight
Trying to lose weight*
Ever fasted to lose weight
Ever vomited or used laxatives to lose weight
No physical activity in the past week
Physically active five days per week
Daily physical activity
Three hours of TV per day*
Three hours of video or computer use per day
Daily PE at school*
Participates in team sports
Daily breakfast
Percent (%)
NM Los Alamos County
13

New Mexico 2013 YRRS
Middle School
14

New Mexico 2013 YRRS
Middle School
Los Alamos County
Charts
For definitions of risk behaviors, see Appendix C.
15

New Mexico 2013 YRRS
Middle School
Personal Safety
Behaviors Associated with Personal Safetyby Year, Los Alamos CountyGrades 7-8, 2009-2013
2009 2011 2013
Never or rarely wore bicyle
helmet 12.9 33.2 38.1
Never or rarely wore a seat belt 2.0 2.8 4.0
0
20
40
60
80
100
Perc
ent
(%)
16

New Mexico 2013 YRRS
Middle School
Personal SafetyNew Mexico and Los Alamos CountyGrades 7-8, 2013
By Gender, Los Alamos County
By Grade, Los Alamos County
74.0
5.7
38.1
4.0
0
20
40
60
80
100
Rarely or never wore bicyle helmet Rarely or never wore a seat belt
Perc
ent
(%)
NM Los Alamos
25.6
4.1
49.2
3.9
0
20
40
60
80
100
Rarely or never wore bicyle helmet Rarely or never wore a seat belt
Perc
ent
(%)
Female Male
32.0
0.0
44.4
6.2
0
20
40
60
80
100
Rarely or never wore bicyle helmet Rarely or never wore a seat belt
Pe
rce
nt
(%)
7th 8th
17

New Mexico 2013 YRRS
Middle School
Personal Safety
Behaviors Associated with Personal Safetyby Year, Los Alamos CountyGrades 7-8, 2009-2013
2009 2011 2013
Ever in a physical fight 51.2 36.8 40.4
Ever carried a weapon 46.0 35.6 45.0
Ever bullied on school property 46.4 45.2
Ever electronically bullied 18.0 26.4
0
20
40
60
80
100
Perc
ent
(%)
18

New Mexico 2013 YRRS
Middle School
Personal SafetyNew Mexico and Los Alamos CountyGrades 7-8, 2013
By Gender, Los Alamos County
By Grade, Los Alamos County
32.0
45.8 45.0 40.4
0
20
40
60
80
100
Ever carried a weapon Ever in a physical fight
Perc
ent
(%)
NM Los Alamos
23.8 28.0
64.6
51.8
0
20
40
60
80
100
Ever carried a weapon Ever in a physical fight
Pe
rce
nt
(%)
Female Male
45.0 41.7 43.8
37.6
0
20
40
60
80
100
Ever carried a weapon Ever in a physical fight
Perc
ent
(%)
7th 8th
19

New Mexico 2013 YRRS
Middle School
Personal Safety: BullyingNew Mexico and Los Alamos CountyGrades 7-8, 2013
By Gender, Los Alamos County
By Grade, Los Alamos County
46.0
18.6
45.2
26.4
0
20
40
60
80
100
Ever bullied at school Ever electronically bullied
Perc
ent
(%)
NM Los Alamos
49.0 40.6 41.7
13.2
0
20
40
60
80
100
Ever bullied at school Ever electronically bullied
Perc
ent
(%)
Female Male
49.0
24.0
42.1
29.4
0
20
40
60
80
100
Ever bullied at school Ever electronically bullied
Perc
ent
(%)
7th 8th
20

New Mexico 2013 YRRS
Middle School
Mental Health
Behaviors Associated with Mental Healthby Year, Los Alamos CountyGrades 7-8, 2009-2013
2009 2011 2013
Ever thought about suicide 13.7 14.5 23.4
Ever planned to kill self 6.3 9.7 18.1
Ever attempted suicide 1.9 4.5 9.3
0
20
40
60
80
100
Perc
ent
(%)
21

New Mexico 2013 YRRS
Middle School
Mental HealthNew Mexico and Los Alamos CountyGrades 7-8, 2013
By Gender, Los Alamos County
By Grade, Los Alamos County
20.9 13.6
23.3
7.8
23.4 18.1
28.4
9.3
0
20
40
60
80
100
Ever thought about killing self
Ever planned to kill self
Suicidal ideations: Either thought about or planned to kill self
Ever tried to kill self
Perc
ent
(%)
NM Los Alamos
28.8 24.7
33.7
10.7 18.3
12.1
23.5
8.0
0
20
40
60
80
100
Ever thought about killing self
Ever planned to kill self
Suicidal ideations: Either thought about or planned to kill self
Ever tried to kill self
Pe
rce
nt
(%)
Female Male
27.7
18.0
32.3
10.9 17.2 16.6
22.8
5.6
0
20
40
60
80
100
Ever thought about killing self
Ever planned to kill self
Suicidal ideations: Either thought about or planned to kill self
Ever tried to kill self
Perc
ent
(%)
7th 8th
22
New Mexico 2013 YRRS
Middle School
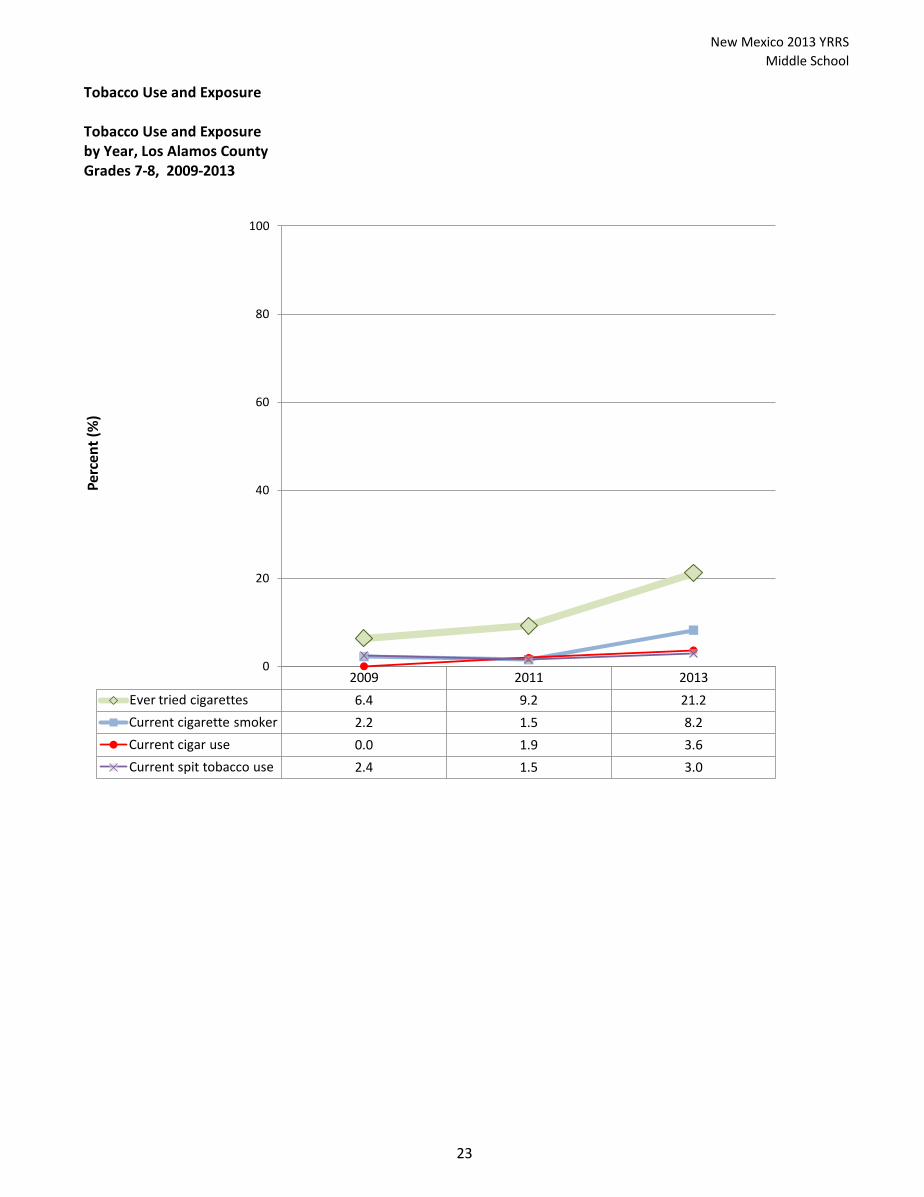
Tobacco Use and Exposure
Tobacco Use and Exposureby Year, Los Alamos CountyGrades 7-8, 2009-2013
2009 2011 2013
Ever tried cigarettes 6.4 9.2 21.2
Current cigarette smoker 2.2 1.5 8.2
Current cigar use 0.0 1.9 3.6
Current spit tobacco use 2.4 1.5 3.0
0
20
40
60
80
100
Perc
ent
(%)
23
New Mexico 2013 YRRS
Middle School
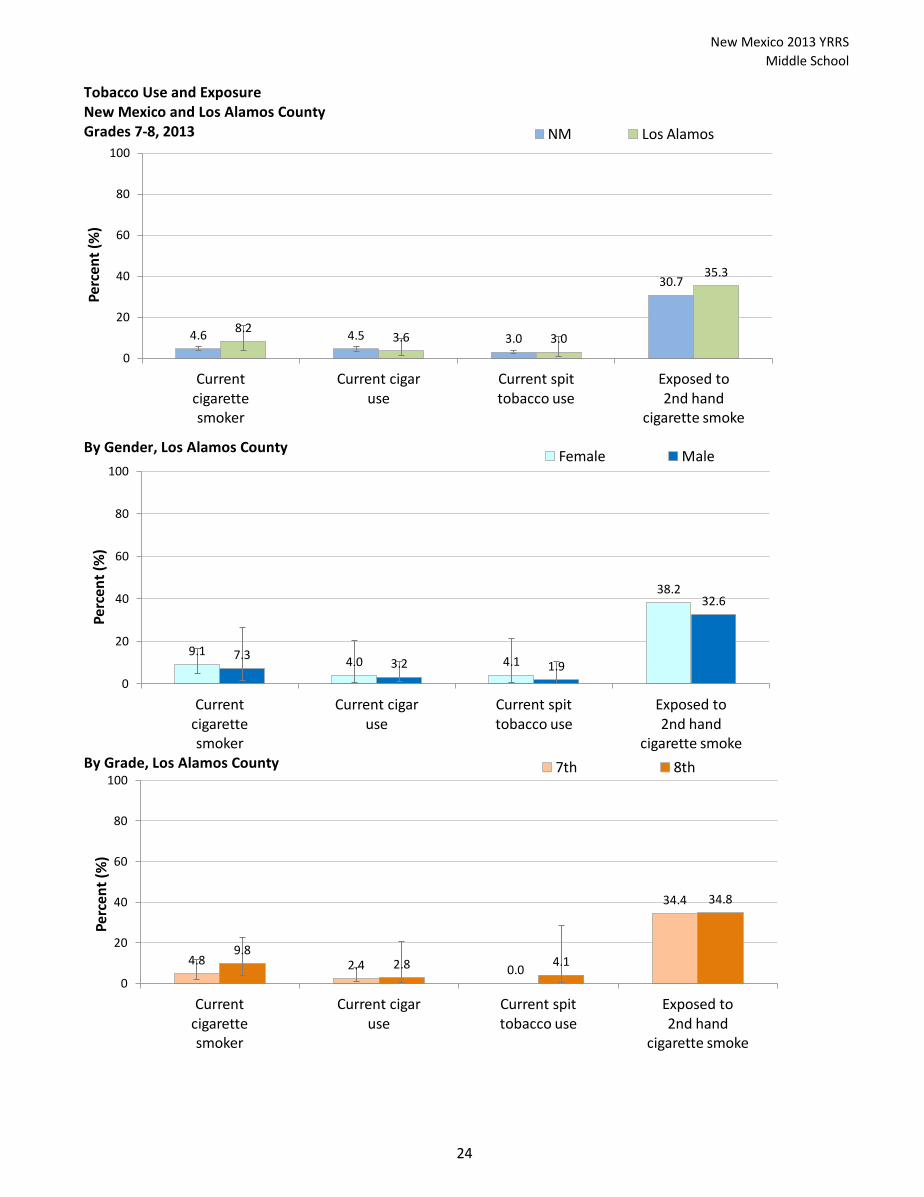
Tobacco Use and ExposureNew Mexico and Los Alamos CountyGrades 7-8, 2013
By Gender, Los Alamos County
By Grade, Los Alamos County
4.6 4.5 3.0
30.7
8.2 3.6 3.0
35.3
0
20
40
60
80
100
Current cigarette smoker
Current cigar use
Current spit tobacco use
Exposed to 2nd hand
cigarette smoke
Perc
ent
(%)
NM Los Alamos
9.1 4.0 4.1
38.2
7.3 3.2 1.9
32.6
0
20
40
60
80
100
Current cigarette smoker
Current cigar use
Current spit tobacco use
Exposed to 2nd hand
cigarette smoke
Perc
ent
(%)
Female Male
4.8 2.4 0.0
34.4
9.8 2.8 4.1
34.8
0
20
40
60
80
100
Current cigarette smoker
Current cigar use
Current spit tobacco use
Exposed to 2nd hand
cigarette smoke
Perc
ent
(%)
7th 8th
24

New Mexico 2013 YRRS
Middle School
Tobacco Use: Cigarettes
New Mexico and Los Alamos CountyGrades 7-8, 2013
By Gender, Los Alamos County
By Grade, Los Alamos County
20.2
4.4 4.6 1.6
21.2
7.5 8.2 2.0
0
20
40
60
80
100
Ever tried cigarettes
Smoked cigarettes before age 11
Current cigarette smoker
Smoked cigarettes on school property
Perc
ent
(%)
NM Los Alamos
17.5
7.8 9.1 4.1
24.4
7.3 7.3 0.0
0
20
40
60
80
100
Ever tried cigarettes
Smoked cigarettes before age 11
Current cigarette smoker
Smoked cigarettes on school property
Perc
ent
(%)
Female Male
17.1
7.6 4.8
0.0
24.1
5.2 9.8
4.1
0
20
40
60
80
100
Ever tried cigarettes
Smoked cigarettes before age 11
Current cigarette smoker
Smoked cigarettes on school property
Perc
ent
(%)
7th 8th
25

New Mexico 2013 YRRS
Middle School
Behaviors of Current Cigarette SmokersNew Mexico and Los Alamos CountyGrades 7-8, 2013
By Gender, Los Alamos County
By Grade, Los Alamos County
13.3 6.8
58.9
47.9 52.1
20.8
0.0
63.1
16.5
83.5
0
20
40
60
80
100
Frequent cigarette smoking
Bought cigarettes in a store
Tried to quit smoking *
Successful quit attempt **
Unuccessful quit attempt **
Perc
ent
(%)
NM Los Alamos
0.0 0.0
54.9
0.0
100.0
45.4
0.0
72.7
27.3
72.7
0
20
40
60
80
100
Frequent cigarette smoking
Bought cigarettes in a store
Tried to quit smoking *
Successful quit attempt **
Unuccessful quit attempt **
Perc
ent
(%)
Female Male
28.0
0.0
100.0
0.0
100.0
0.0 0.0
57.7
27.2
72.8
0
20
40
60
80
100
Frequent cigarette smoking
Bought cigarettes in a store
Tried to quit smoking *
Successful quit attempt **
Unuccessful quit attempt **
Perc
ent
(%)
7th 8th
* Among current cigarette smokers.
** Among current cigarette smokers who tried to quit in the past 12 months.
26

New Mexico 2013 YRRS
Middle School
Alcohol Use
Alcohol Useby Year, Los Alamos CountyGrades 7-8, 2009-2013
2009 2011 2013
Ever had a drink of alcohol 9.1 14.7 18.9
Current drinker 5.6 6.3 11.5
Binge drinker 1.2 1.0 5.7
First drink before age 11 5.8 8.0 9.0
Ever rode in a car with drinking
driver 15.8 16.2 18.4
0
20
40
60
80
100
Perc
ent
(%)
27

New Mexico 2013 YRRS
Middle School
Alcohol UseNew Mexico and Los Alamos CountyGrades 7-8, 2013
By Gender, Los Alamos County
By Grade, Los Alamos County
25.7
9.2 3.9
18.9 11.5
5.7
0
20
40
60
80
100
Ever had a drink of alcohol Current drinker Binge drinker
Perc
ent
(%)
NM Los Alamos
13.8 12.4 7.7
23.6
10.6 3.9
0
20
40
60
80
100
Ever had a drink of alcohol Current drinker Binge drinker
Perc
ent
(%)
Female Male
17.0 11.4
3.4
19.1
9.7 6.2
0
20
40
60
80
100
Ever had a drink of alcohol Current drinker Binge drinker
Perc
ent
(%)
7th 8th
28
New Mexico 2013 YRRS
Middle School
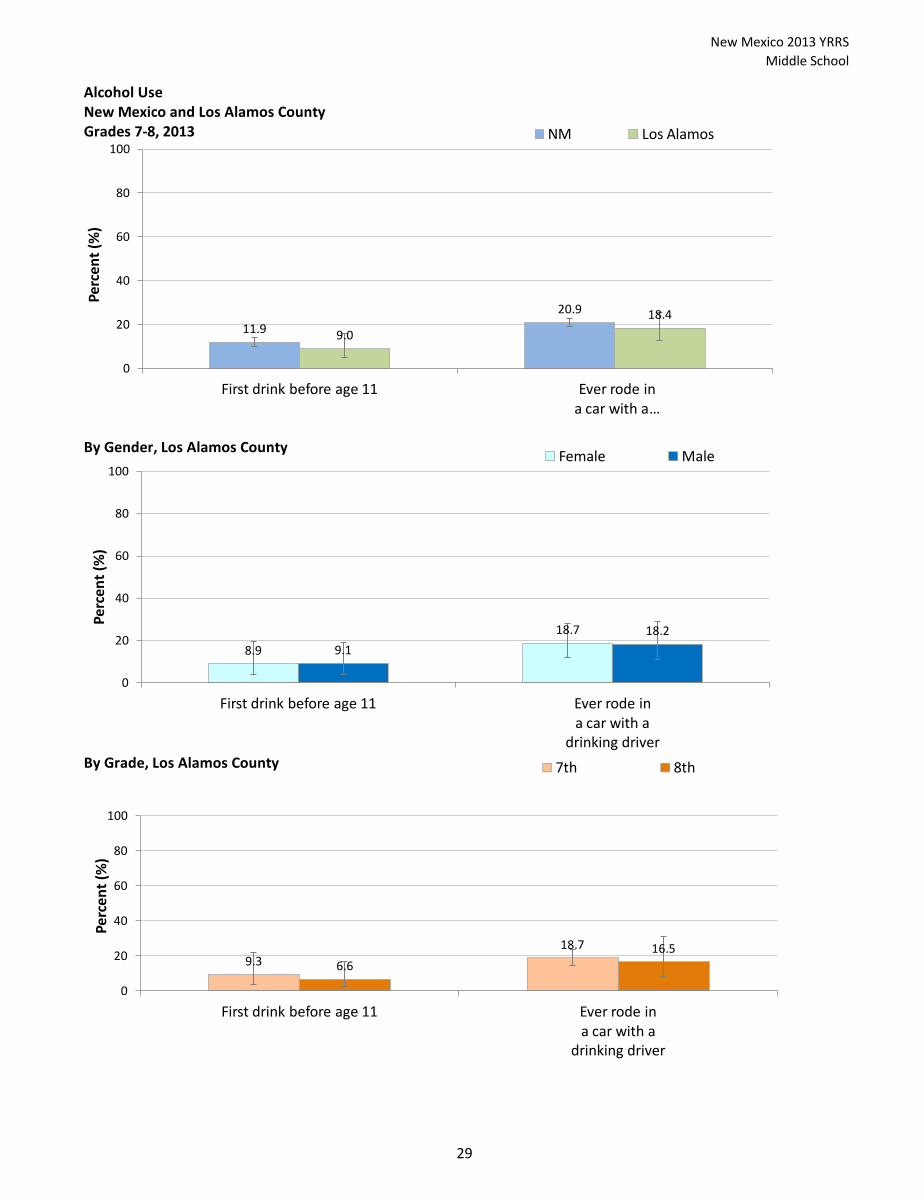
Alcohol UseNew Mexico and Los Alamos CountyGrades 7-8, 2013
By Gender, Los Alamos County
By Grade, Los Alamos County
11.9
20.9
9.0
18.4
0
20
40
60
80
100
First drink before age 11 Ever rode in a car with a …
Perc
ent
(%)
NM Los Alamos
8.9
18.7
9.1
18.2
0
20
40
60
80
100
First drink before age 11 Ever rode in a car with a
drinking driver
Perc
ent
(%)
Female Male
9.3 18.7
6.6
16.5
0
20
40
60
80
100
First drink before age 11 Ever rode in a car with a
drinking driver
Perc
ent
(%)
7th 8th
29

New Mexico 2013 YRRS
Middle School
Alcohol Use: Access and AttitudesNew Mexico and Los Alamos CountyGrades 7-8, 2013
By Gender, Los Alamos County
By Grade, Los Alamos County
24.0
79.6
69.6 75.3
24.4
86.6
70.4
88.8
0
20
40
60
80
100
Easy to get alcohol
My parents feel it would be
"Very wrong" for me to drink
alcohol
I think it would be "Very wrong"
for someone my age to drink alcohol
There is a moderate or great risk of harm
from regular alcohol use
Perc
ent
(%)
NM Los Alamos
27.4
88.2
73.2
92.3
21.8
85.2
67.8
85.5
0
20
40
60
80
100
Easy to get alcohol
My parents feel it would be
"Very wrong" for me to drink
alcohol
I think it would be "Very wrong"
for someone my age to drink alcohol
There is a moderate or great risk of harm
from regular alcohol use
Perc
ent
(%)
Female Male
25.8
84.4
75.4
87.9
21.2
90.9
66.5
91.6
0
20
40
60
80
100
Easy to get alcohol
My parents feel it would be
"Very wrong" for me to drink
alcohol
I think it would be "Very wrong"
for someone my age to drink alcohol
There is a moderate or great risk of harm
from regular alcohol use
Perc
ent
(%)
7th 8th
30
New Mexico 2013 YRRS
Middle School
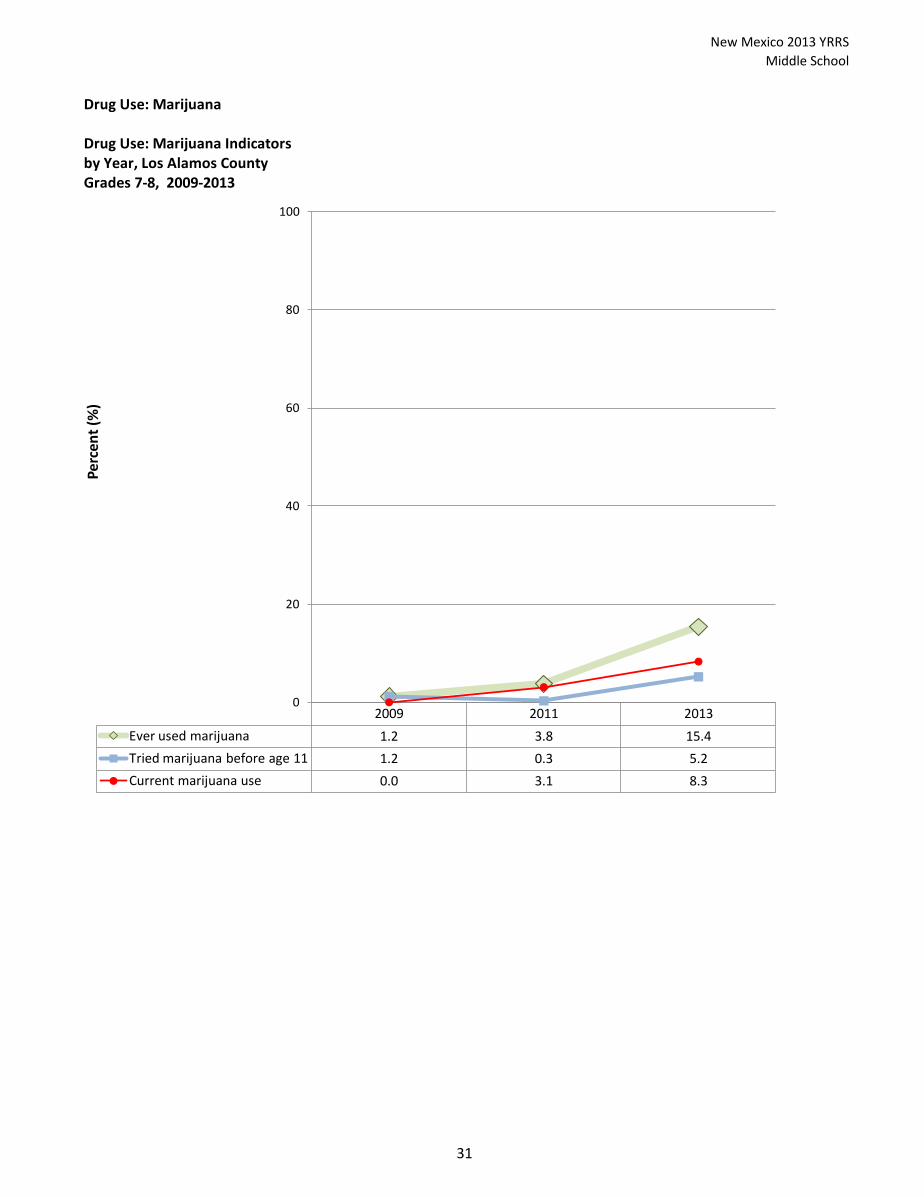
Drug Use: Marijuana
Drug Use: Marijuana Indicatorsby Year, Los Alamos CountyGrades 7-8, 2009-2013
2009 2011 2013
Ever used marijuana 1.2 3.8 15.4
Tried marijuana before age 11 1.2 0.3 5.2
Current marijuana use 0.0 3.1 8.3
0
20
40
60
80
100
Perc
ent
(%)
31

New Mexico 2013 YRRS
Middle School
Drug Use: MarijuanaNew Mexico and Los Alamos CountyGrades 7-8, 2013
By Gender, Los Alamos County
By Grade, Los Alamos County
15.7
5.0 10.2
15.4
5.2 8.3
0
20
40
60
80
100
Ever used marijuana
Tried marijuana before age 11
Current marijuana use
Perc
ent
(%)
NM Los Alamos
11.3 4.8
10.1
19.2
5.7 6.7
0
20
40
60
80
100
Ever used marijuana
Tried marijuana before age 11
Current marijuana use
Perc
ent
(%)
Female Male
13.4 7.0 8.4
15.7
1.4 6.2
0
20
40
60
80
100
Ever used marijuana
Tried marijuana before age 11
Current marijuana use
Perc
ent
(%)
7th 8th
32

New Mexico 2013 YRRS
Middle School
Drug Use
Drug Use Indicatorsby Year, Los Alamos CountyGrades 7-8, 2009-2013
2009 2011 2013
Ever used synth. marijuana 7.5
Ever used cocaine 3.3 1.0 5.6
Ever used inhalants 13.1 7.6 9.7
Ever used prescription drug
improperly 4.3 8.2
Ever used painkiller to get high 1.0 3.7
0
20
40
60
80
100
Perc
ent
(%)
33

New Mexico 2013 YRRS
Middle School
Drug Use: Other drugsNew Mexico and Los Alamos CountyGrades 7-8, 2013
By Gender, Los Alamos County
By Grade, Los Alamos County
7.3 3.3
9.3 5.5 3.1 1.7
7.5 5.6 9.7 8.2
3.7 1.0 0
20
40
60
80
100
Synthetic marijuana
Cocaine Inhalants Prescription drugs
without prescription
Painkillers to get high
Illegal injection
drugs
Perc
ent
(%)
NM Los Alamos
10.2 5.4
12.7 9.3 5.4
0.0 5.0 5.9 7.0 7.3
2.0 2.0
0
20
40
60
80
100
Synthetic marijuana
Cocaine Inhalants Prescription drugs
without prescription
Painkillers to get high
Illegal injection
drugs
Perc
ent
(%)
Female Male
5.7 6.5 9.4 8.8 0.0 0.0
7.5 2.7
8.2 5.7 5.5 0.0
0
20
40
60
80
100
Synthetic marijuana
Cocaine Inhalants Prescription drugs
without prescription
Painkillers to get high
Illegal injection
drugs
Perc
ent
(%)
7th 8th
34

New Mexico 2013 YRRS
Middle School
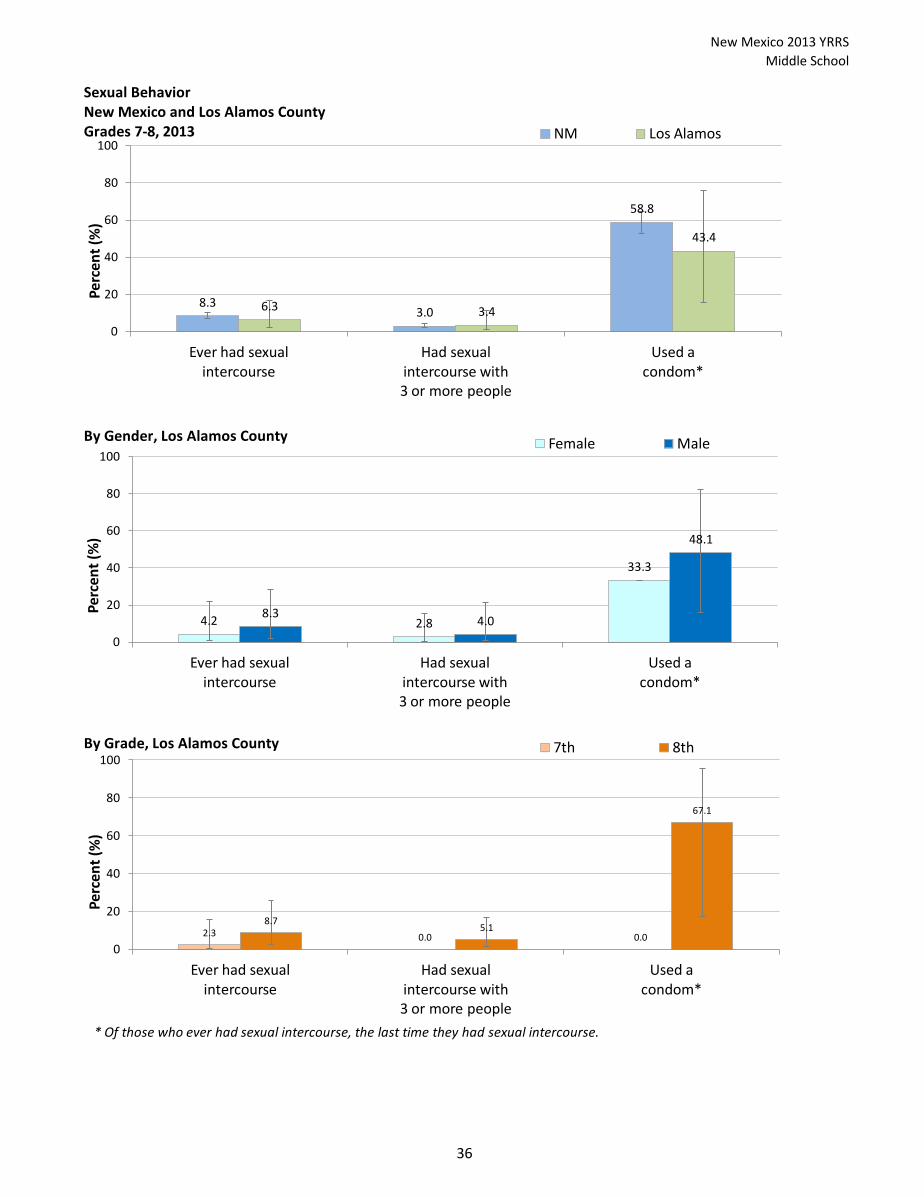
Sexual Behavior
Sexual Behavior Indicatorsby Year, Los Alamos CountyGrades 7-8, 2009-2013
2009 2011 2013
Ever had sexual intercourse
2.2 5.2 6.3
Had sexual intercourse
with 3 or more people 1.8 3.4
Used a condom * 56.1 36.6 43.4
0
20
40
60
80
100
Perc
ent
(%)
* Of those who ever had sexual intercourse, the last time they had sexual intercourse.
35
New Mexico 2013 YRRS
Middle School
Sexual BehaviorNew Mexico and Los Alamos CountyGrades 7-8, 2013
By Gender, Los Alamos County
By Grade, Los Alamos County
8.3 3.0
58.8
6.3 3.4
43.4
0
20
40
60
80
100
Ever had sexual intercourse
Had sexual intercourse with 3 or more people
Used a condom*
Perc
ent
(%)
NM Los Alamos
4.2 2.8
33.3
8.3 4.0
48.1
0
20
40
60
80
100
Ever had sexual intercourse
Had sexual intercourse with 3 or more people
Used a condom*
Perc
ent
(%)
Female Male
2.3 0.0 0.0
8.7 5.1
67.1
0
20
40
60
80
100
Ever had sexual intercourse
Had sexual intercourse with 3 or more people
Used a condom*
Perc
ent
(%)
7th 8th
* Of those who ever had sexual intercourse, the last time they had sexual intercourse.
36
New Mexico 2013 YRRS
Middle School
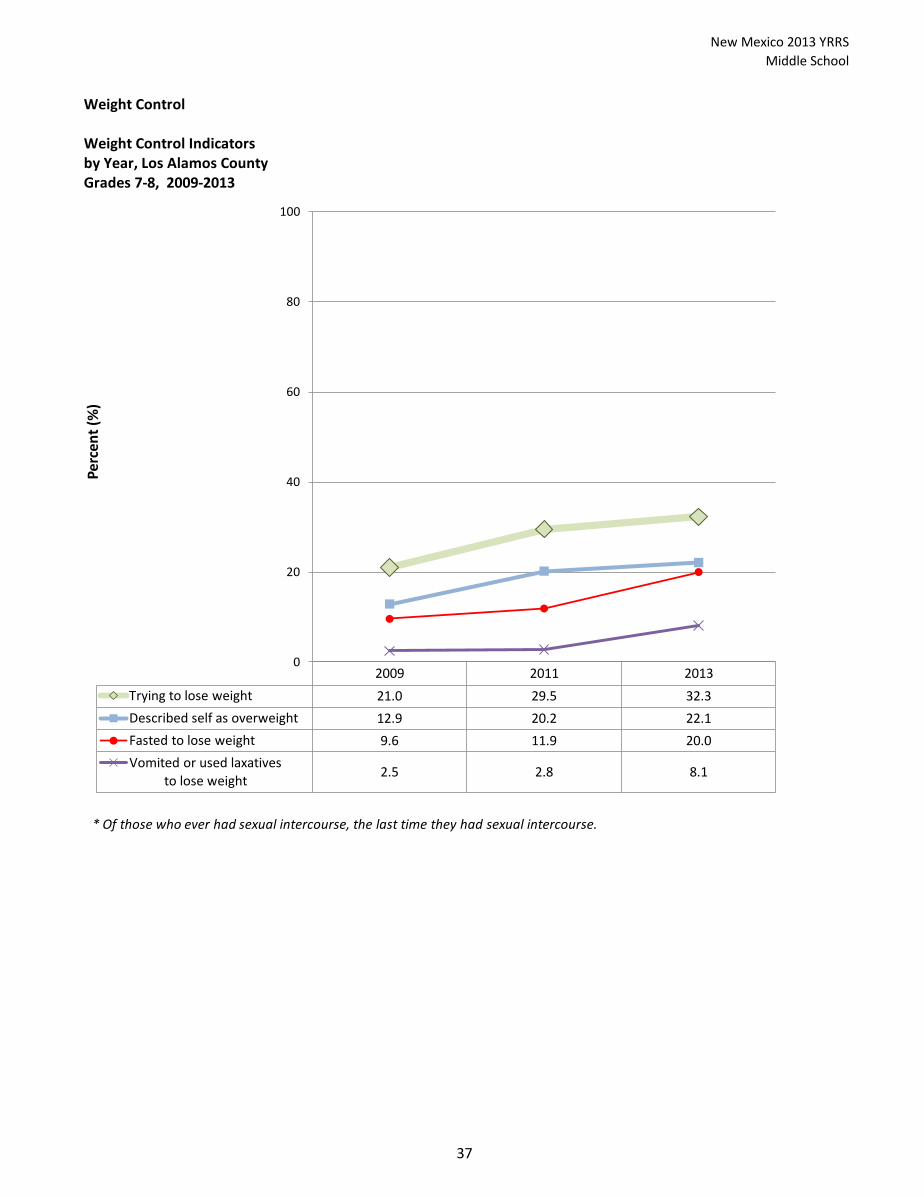
Weight Control
Weight Control Indicatorsby Year, Los Alamos CountyGrades 7-8, 2009-2013
2009 2011 2013
Trying to lose weight 21.0 29.5 32.3
Described self as overweight 12.9 20.2 22.1
Fasted to lose weight 9.6 11.9 20.0
Vomited or used laxatives
to lose weight 2.5 2.8 8.1
0
20
40
60
80
100
Perc
ent
(%)
* Of those who ever had sexual intercourse, the last time they had sexual intercourse.
37

New Mexico 2013 YRRS
Middle School
Weight ControlNew Mexico and Los Alamos CountyGrades 7-8, 2013
By Gender, Los Alamos County
By Grade, Los Alamos County
25.3
46.4
20.0
6.3
22.1
32.3
20.0
8.1
0
20
40
60
80
100
Described self as overweight
Trying to lose weight
Fasted to lose weight
Vomited or used laxatives to lose weight
Perc
ent
(%)
NM Los Alamos
21.0
35.3 28.1
13.7
23.1 29.6
12.6
3.1
0
20
40
60
80
100
Described self as overweight
Trying to lose weight
Fasted to lose weight
Vomited or used laxatives to lose weight
Perc
ent
(%)
Female Male
20.6
31.5
18.9
8.6
24.2
33.9
19.5
5.6
0
20
40
60
80
100
Described self as overweight
Trying to lose weight
Fasted to lose weight
Vomited or used laxatives to lose weight
Perc
ent
(%)
7th 8th
38
New Mexico 2013 YRRS
Middle School
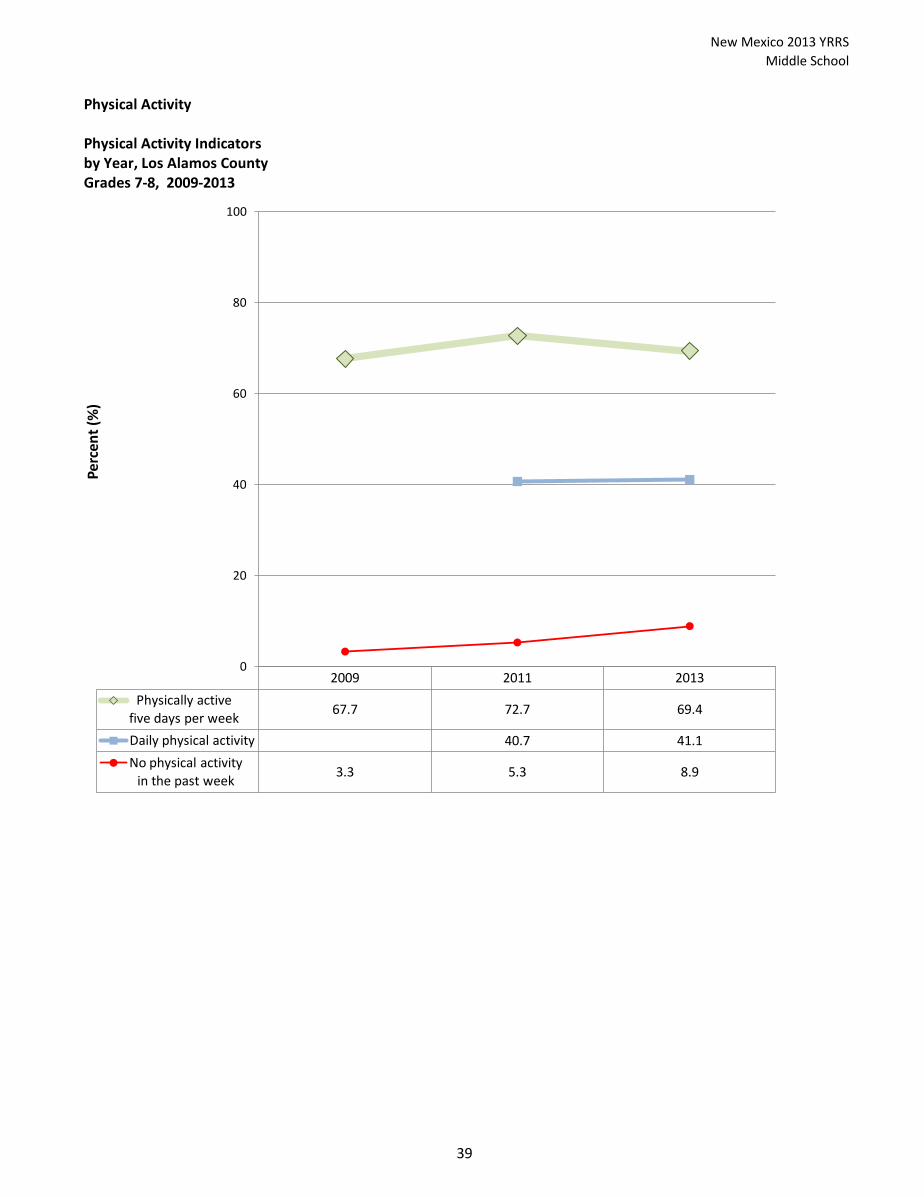
Physical Activity
Physical Activity Indicatorsby Year, Los Alamos CountyGrades 7-8, 2009-2013
2009 2011 2013
Physically active five days per week
67.7 72.7 69.4
Daily physical activity 40.7 41.1
No physical activity
in the past week 3.3 5.3 8.9
0
20
40
60
80
100
Perc
ent
(%)
39
New Mexico 2013 YRRS
Middle School
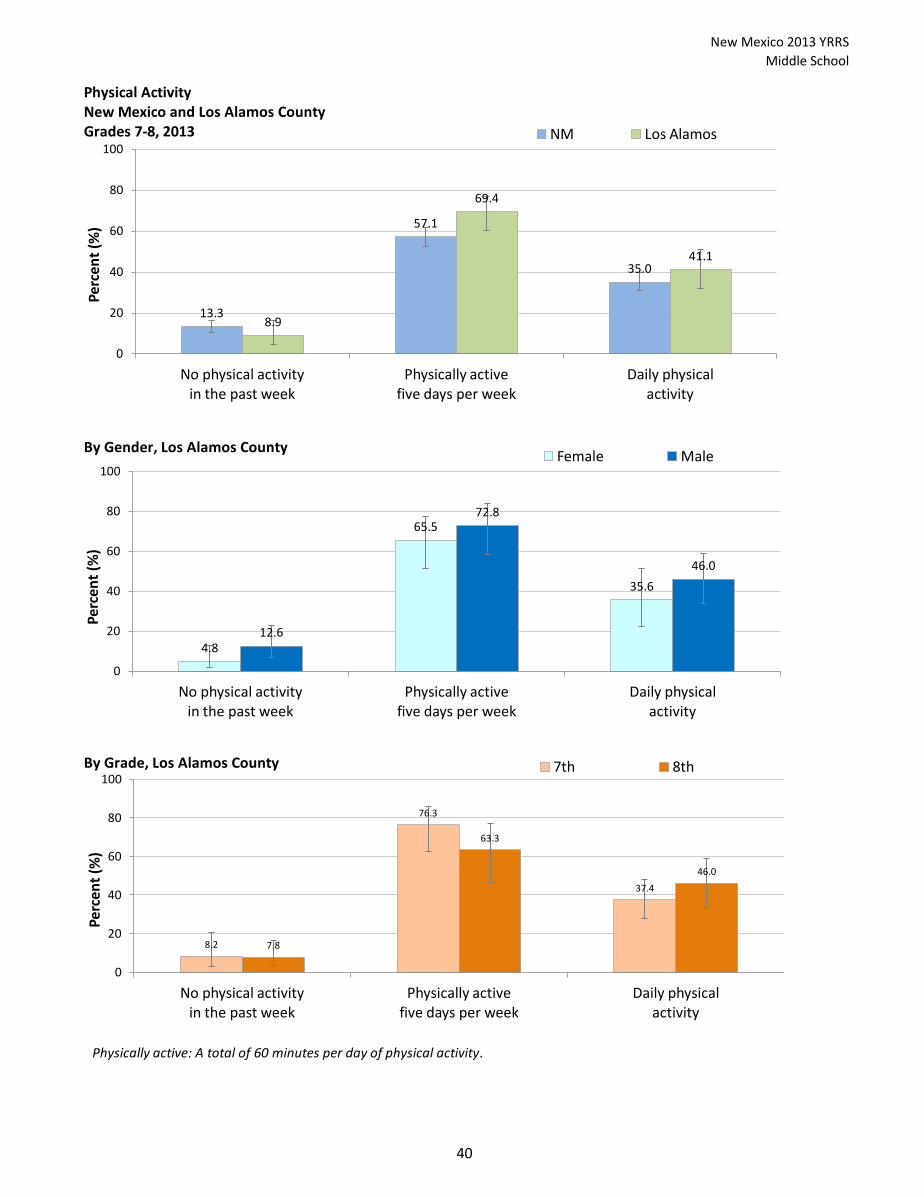
Physical ActivityNew Mexico and Los Alamos CountyGrades 7-8, 2013
By Gender, Los Alamos County
By Grade, Los Alamos County
13.3
57.1
35.0
8.9
69.4
41.1
0
20
40
60
80
100
No physical activity in the past week
Physically active five days per week
Daily physical activity
Perc
ent
(%)
NM Los Alamos
4.8
65.5
35.6
12.6
72.8
46.0
0
20
40
60
80
100
No physical activity in the past week
Physically active five days per week
Daily physical activity
Perc
ent
(%)
Female Male
8.2
76.3
37.4
7.8
63.3
46.0
0
20
40
60
80
100
No physical activity in the past week
Physically active five days per week
Daily physical activity
Perc
ent
(%)
7th 8th
Physically active: A total of 60 minutes per day of physical activity.
40

New Mexico 2013 YRRS
Middle School
Physical Activity
Physical Activity Indicatorsby Year, Los Alamos CountyGrades 7-8, 2009-2013
2009 2011 2013
Three hours of TV per day 10.7 13.8 10.7
Three hours of video or
computer use per day 8.9 14.2 26.6
Daily PE at school 0.0 48.5 68.1
0
50
100
Perc
ent
(%)
41

New Mexico 2013 YRRS
Middle School
Physical ActivityNew Mexico and Los Alamos CountyGrades 7-8, 2013
By Gender, Los Alamos County
By Grade, Los Alamos County
30.7 33.0 35.4
63.6
10.7
26.6
68.1 66.7
0
20
40
60
80
100
Three hours of TV per day
Three hours of video or computer
use per day
Daily PE at school
Participates in team sports
Perc
ent
(%)
NM Los Alamos
4.2
25.4
63.5 69.2
16.6
27.6
72.2 64.4
0
20
40
60
80
100
Three hours of TV per day
Three hours of video or computer
use per day
Daily PE at school
Participates in team sports
Perc
ent
(%)
Female Male
5.1
23.5
67.6 65.9
17.0
30.5
70.2 67.6
0
20
40
60
80
100
Three hours of TV per day
Three hours of video or computer
use per day
Daily PE at school
Participates in team sports
Perc
ent
(%)
7th 8th
42

New Mexico 2013 YRRS
Middle School
Other Health-Related TopicsNew Mexico and Los Alamos CountyGrades 7-8, 2013
By Gender, Los Alamos County
By Grade, Los Alamos County
43.5 45.8
19.5 19.0
47.8
82.2
25.7 27.7
0
20
40
60
80
100
Daily breakfast
Taught about HIV in school
Ever told has asthma
Sometimes or often not
enough food to eat
Perc
ent
(%)
NM Los Alamos
40.3
82.5
28.1 28.9
54.5
81.8
23.5 26.6
0
20
40
60
80
100
Daily breakfast
Taught about HIV in school
Ever told has asthma
Sometimes or often not
enough food to eat
Perc
ent
(%)
Female Male
45.9
87.6
29.4 25.8
50.9
75.8
22.3 28.2
0
20
40
60
80
100
Daily breakfast
Taught about HIV in school
Ever told has asthma
Sometimes or often not
enough food to eat
Perc
ent
(%)
7th 8th
43

New Mexico 2013 YRRS
Middle School
44

New Mexico 2013 YRRS
Middle School
Resiliency/Protective Factors
45

New Mexico 2013 YRRS
Middle School
Resiliency/Protective Factors: In the homeNew Mexico and Los Alamos CountyGrades 7-8, 2013
By Gender, Los Alamos County
By Grade, Los Alamos County
81.4 88.4 89.6 89.6
0
20
40
60
80
100
A parent or guardian is interested in my school work
A parent or guardian knows where I am and who I am with when
I am not home
Perc
ent
(%)
NM Los Alamos
84.7 93.4 94.2
86.0
0
20
40
60
80
100
A parent or guardian is interested in my school work
A parent or guardian knows where I am and
who I am with when I am not home
Perc
ent
(%)
Female Male
89.8 88.6 91.4 92.6
0
20
40
60
80
100
A parent or guardian is interested in my school work
A parent or guardian knows where I am and who I am with when
I am not home
Perc
ent
(%)
7th 8th
46

New Mexico 2013 YRRS
Middle School
Resiliency/Protective Factors: In the schoolNew Mexico and Los Alamos CountyGrades 7-8, 2013
By Gender, Los Alamos County
By Grade, Los Alamos County
85.7
39.1
86.5
54.0
0
20
40
60
80
100
There are clear behavioral rules …
Gets mostly A's in school
Perc
ent
(%)
NM Los Alamos
86.9
63.7
86.1
44.6
0
20
40
60
80
100
There are clear behavioral rules …
Gets mostly A's in school
Perc
ent
(%)
Female Male
88.2
53.2
86.4
56.1
0
20
40
60
80
100
There are clear behavioral rules …
Gets mostly A's in school
Perc
ent
(%)
7th 8th
47

New Mexico 2013 YRRS
Middle School
Resiliency/Protective Factors: In the community and with peersNew Mexico and Los Alamos CountyGrades 7-8, 2013
By Gender, Los Alamos County
By Grade, Los Alamos County
84.7
65.1
75.9
91.2
75.5 80.4
0
20
40
60
80
100
Outside home and school, an
adult really cares about me
Outside home and school, I am involved
in group activities
I have a friend who really cares
about me
Perc
ent
(%)
NM Los Alamos
94.0
79.9
90.4 88.7
71.7 71.2
0
20
40
60
80
100
Outside home and school, an
adult really cares about me
Outside home and school, I am involved
in group activities
I have a friend who really cares
about me
Perc
ent
(%)
Female Male
92.3
74.2 74.6
92.1
78.6
88.9
0
20
40
60
80
100
Outside home and school, an
adult really cares about me
Outside home and school, I am involved
in group activities
I have a friend who really cares
about me
Perc
ent
(%)
7th 8th
48

New Mexico 2013 YRRS
Middle School
Relationship Between Selected Risk Behaviors and
Resiliency/Protective Factors
49

New Mexico 2013 YRRS
Middle School
Got mostly A's in schoolby Selected Resiliency FactorsLos Alamos CountyGrades 7-8, 2013
How to read this chart:- Of those who said it was 'Very much true' that a parent or other adult was interested in their school work, 59.0%
got mostly A's in school
- Of those who said it was 'A little or pretty much true' that a parent or other adult was interested in their school
work, 44.6% got mostly A's in school
- Of those who said it was 'Not true at all' that a parent or other adult was interested in their school work, 23.2% got
mostly A's in school
59.0
62.9
55.7
52.4
59.6
64.6
44.6
44.3
53.9
58.2
49.9
41.9
23.2
0.0
25.4
55.4
34.2
37.0
0 20 40 60 80 100
In my home, there is a parent or some other adult who is interested in my school
work
When I am not at home, one of my parents or guardians knows where I am
and who I am with
In my school, there are clear rules about what students can and cannot do
Outside of my home and school, there is an adult who really cares about me
I have a friend about my own age who really cares about me
Outside of my home and school, I am a part of clubs, sports teams, church,
temple, or other group
Percent (%)
Very much true A little or pretty much true Not true at all
50
New Mexico 2013 YRRS
Middle School
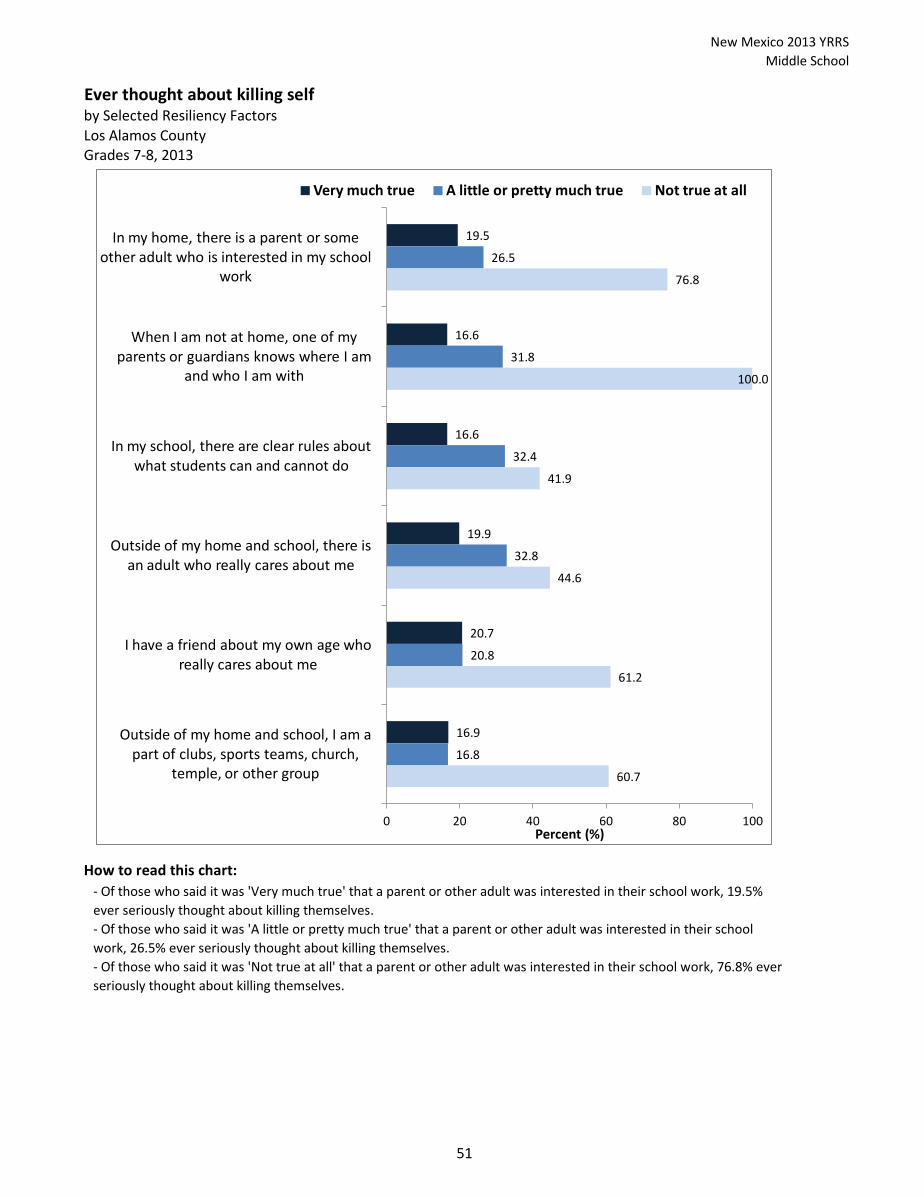
Ever thought about killing self
Los Alamos CountyGrades 7-8, 2013
How to read this chart:
- Of those who said it was 'A little or pretty much true' that a parent or other adult was interested in their school
work, 26.5% ever seriously thought about killing themselves.
by Selected Resiliency Factors
- Of those who said it was 'Very much true' that a parent or other adult was interested in their school work, 19.5%
ever seriously thought about killing themselves.
- Of those who said it was 'Not true at all' that a parent or other adult was interested in their school work, 76.8% ever
seriously thought about killing themselves.
19.5
16.6
16.6
19.9
20.7
16.9
26.5
31.8
32.4
32.8
20.8
16.8
76.8
100.0
41.9
44.6
61.2
60.7
0 20 40 60 80 100
In my home, there is a parent or some other adult who is interested in my school
work
When I am not at home, one of my parents or guardians knows where I am
and who I am with
In my school, there are clear rules about what students can and cannot do
Outside of my home and school, there is an adult who really cares about me
I have a friend about my own age who really cares about me
Outside of my home and school, I am a part of clubs, sports teams, church,
temple, or other group
Percent (%)
Very much true A little or pretty much true Not true at all
51

New Mexico 2013 YRRS
Middle School
Ever attempted to kill self
Los Alamos CountyGrades 7-8 2013
How to read this chart:
by Selected Resiliency Factors
- Of those who said it was 'Very much true' that a parent or other adult was interested in their school work, 6.4%
ever attempted to kill themselves.- Of those who said it was 'A little or pretty much true' that a parent or other adult was interested in their school
work, 9.0% ever attempted to kill themselves.
- Of those who said it was 'Not true at all' that a parent or other adult was interested in their school work, 61.2% ever
attempted to kill themselves.
6.4
4.3
5.9
6.4
8.4
5.2
9.0
13.8
12.8
11.4
4.5
5.9
61.2
100.0
25.4
36.0
38.9
29.8
0 20 40 60 80 100
In my home, there is a parent or some other adult who is interested in my school
work
When I am not at home, one of my parents or guardians knows where I am
and who I am with
In my school, there are clear rules about what students can and cannot do
Outside of my home and school, there is an adult who really cares about me
I have a friend about my own age who really cares about me
Outside of my home and school, I am a part of clubs, sports teams, church,
temple, or other group
Percent (%)
Very much true A little or pretty much true Not true at all
52

New Mexico 2013 YRRS
Middle School
Ever tried cigarettes
Los Alamos CountyGrades 7-8, 2013
How to read this chart:
by Selected Resiliency Factors
- Of those who said it was 'Very much true' that a parent or other adult was interested in their school work, 14.5%
ever tried smoking a cigarette.
- Of those who said it was 'A little or pretty much true' that a parent or other adult was interested in their school
work, 32.2% ever tried smoking a cigarette.
- Of those who said it was 'Not true at all' that a parent or other adult was interested in their school work, 63.8% ever
tried smoking a cigarette.
14.5
6.9
18.0
18.5
16.9
14.5
32.2
37.8
22.6
24.9
17.0
12.6
63.8
100.0
58.5
43.9
73.2
60.8
0 20 40 60 80 100
In my home, there is a parent or some other adult who is interested in my school
work
When I am not at home, one of my parents or guardians knows where I am
and who I am with
In my school, there are clear rules about what students can and cannot do
Outside of my home and school, there is an adult who really cares about me
I have a friend about my own age who really cares about me
Outside of my home and school, I am a part of clubs, sports teams, church,
temple, or other group
Percent (%)
Very much true A little or pretty much true Not true at all
53

New Mexico 2013 YRRS
Middle School
Ever had a drink of alcohol
Los Alamos CountyGrades 7-8, 2013
How to read this chart:
- Of those who said it was 'A little or pretty much true' that a parent or other adult was interested in their school
work, 36.1% ever had a drink of alcohol.
by Selected Resiliency Factors
- Of those who said it was 'Very much true' that a parent or other adult was interested in their school work, 8.8%
ever had a drink of alcohol.
- Of those who said it was 'Not true at all' that a parent or other adult was interested in their school work, 76.8% ever
had a drink of alcohol.
8.8
7.6
19.6
16.8
16.3
12.2
36.1
32.2
15.1
22.7
19.8
17.3
76.8
100.0
58.5
36.0
38.9
46.2
0 20 40 60 80 100
In my home, there is a parent or some other adult who is interested in my school
work
When I am not at home, one of my parents or guardians knows where I am
and who I am with
In my school, there are clear rules about what students can and cannot do
Outside of my home and school, there is an adult who really cares about me
I have a friend about my own age who really cares about me
Outside of my home and school, I am a part of clubs, sports teams, church,
temple, or other group
Percent (%)
Very much true A little or pretty much true Not true at all
54

New Mexico 2013 YRRS
Middle School
Current drinking
Los Alamos CountyGrades 7-8, 2013
How to read this chart:
by Selected Resiliency Factors
- Of those who said it was 'Very much true' that a parent or other adult was interested in their school work, 7.6%
engaged in current drinking.
- Of those who said it was 'A little or pretty much true' that a parent or other adult was interested in their school
work, 16.2% engaged in current drinking.
- Of those who said it was 'Not true at all' that a parent or other adult was interested in their school work, 48.2%
engaged in current drinking.
7.6
4.2
7.9
10.3
9.1
4.7
16.2
18.9
12.3
3.6
10.1
8.0
48.2
100.0
58.5
43.9
37.2
41.2
0 20 40 60 80 100
In my home, there is a parent or some other adult who is interested in my school
work
When I am not at home, one of my parents or guardians knows where I am
and who I am with
In my school, there are clear rules about what students can and cannot do
Outside of my home and school, there is an adult who really cares about me
I have a friend about my own age who really cares about me
Outside of my home and school, I am a part of clubs, sports teams, church,
temple, or other group
Percent (%)
Very much true A little or pretty much true Not true at all
55

New Mexico 2013 YRRS
Middle School
Ever used marijuana
Los Alamos CountyGrades 7-8, 2013
How to read this chart:
by Selected Resiliency Factors
- Of those who said it was 'Very much true' that a parent or other adult was interested in their school work, 9.8%
ever used marijuana.
- Of those who said it was 'A little or pretty much true' that a parent or other adult was interested in their school
work, 25.4% ever used marijuana.
- Of those who said it was 'Not true at all' that a parent or other adult was interested in their school work, 48.2% ever
used marijuana.
9.8
3.4
12.3
13.3
11.9
10.3
25.4
29.2
16.1
13.9
11.7
8.5
48.2
100.0
58.5
43.9
60.7
46.2
0 20 40 60 80 100
In my home, there is a parent or some other adult who is interested in my school
work
When I am not at home, one of my parents or guardians knows where I am
and who I am with
In my school, there are clear rules about what students can and cannot do
Outside of my home and school, there is an adult who really cares about me
I have a friend about my own age who really cares about me
Outside of my home and school, I am a part of clubs, sports teams, church,
temple, or other group
Percent (%)
Very much true A little or pretty much true Not true at all
56

New Mexico 2013 YRRS
Middle School
Ever used synthetic marijuana
Los Alamos CountyGrades 7-8, 2013
How to read this chart:
- Of those who said it was 'A little or pretty much true' that a parent or other adult was interested in their school
work, 9.4% ever used synthetic marijuana.
by Selected Resiliency Factors
- Of those who said it was 'Very much true' that a parent or other adult was interested in their school work, 3.4%
ever used synthetic marijuana.
- Of those who said it was 'Not true at all' that a parent or other adult was interested in their school work, 63.8% ever
used synthetic marijuana.
3.4
1.2
3.1
5.8
9.0
3.4
9.4
13.6
8.8
3.6
4.6
6.1
63.8
100.0
58.5
35.1
12.3
24.8
0 20 40 60 80 100
In my home, there is a parent or some other adult who is interested in my school
work
When I am not at home, one of my parents or guardians knows where I am
and who I am with
In my school, there are clear rules about what students can and cannot do
Outside of my home and school, there is an adult who really cares about me
I have a friend about my own age who really cares about me
Outside of my home and school, I am a part of clubs, sports teams, church,
temple, or other group
Percent (%)
Very much true A little or pretty much true Not true at all
57

New Mexico 2013 YRRS
Middle School
Ever had sexual intercourse
Los Alamos CountyGrades 7-8, 2013
How to read this chart:
by Selected Resiliency Factors
- Of those who said it was 'Very much true' that a parent or other adult was interested in their school work, 4.1%
ever had sexual intercourse.
- Of those who said it was 'A little or pretty much true' that a parent or other adult was interested in their school
work, 7.2% ever had sexual intercourse.
- Of those who said it was 'Not true at all' that a parent or other adult was interested in their school work, 39.5% ever
had sexual intercourse.
4.1
0.0
6.0
5.5
5.5
1.2
7.2
12.6
1.7
7.4
0.0
3.9
39.5
100.0
78.4
15.6
38.9
27.5
0 20 40 60 80 100
In my home, there is a parent or some other adult who is interested in my school
work
When I am not at home, one of my parents or guardians knows where I am
and who I am with
In my school, there are clear rules about what students can and cannot do
Outside of my home and school, there is an adult who really cares about me
I have a friend about my own age who really cares about me
Outside of my home and school, I am a part of clubs, sports teams, church,
temple, or other group
Percent (%)
Very much true A little or pretty much true Not true at all
58

New Mexico 2013 YRRS
Middle School
Physically active five days per week
Los Alamos CountyGrades 7-8, 2013
How to read this chart:- Of those who said it was 'Very much true' that a parent or other adult was interested in their school work, 73.6%
were physically active on at least five days per week.
- Of those who said it was 'A little or pretty much true' that a parent or other adult was interested in their school
work, 60.4% were physically active on at least five days per week.
- Of those who said it was 'Not true at all' that a parent or other adult was interested in their school work, 51.8%
were physically active on at least five days per week.
by Selected Resiliency Factors
73.6
77.6
75.5
75.1
73.9
81.6
60.4
59.5
65.6
56.1
65.4
68.9
51.8
0.0
16.1
37.3
48.6
31.1
0 20 40 60 80 100
In my home, there is a parent or some other adult who is interested in my school
work
When I am not at home, one of my parents or guardians knows where I am
and who I am with
In my school, there are clear rules about what students can and cannot do
Outside of my home and school, there is an adult who really cares about me
I have a friend about my own age who really cares about me
Outside of my home and school, I am a part of clubs, sports teams, church,
temple, or other group
Percent (%)
Very much true A little or pretty much true Not true at all
59

New Mexico 2013 YRRS
Middle School
60

New Mexico 2013 YRRS
Middle School
Appendix A
Questionnaire with Results
61

New Mexico 2013 YRRS
Middle School
2013 Middle School Questionnaire
NM YRRS
Los Alamos County
Number of
responses %
1. How old are you?
A. 10 years old or younger 1 0.7%
B. 11 years old 1 0.7%
C. 12 years old 54 39.1%
D. 13 years old 68 49.3%
E. 14 years old 14 10.1%
F. 15 years old 0 0.0%
G. 16 years old or older 0 0.0%
2. What is your sex?
A. Female 75 54.3%
B. Male 63 45.7%
3. In what grade are you?
A. 6th grade 0 0.0%
B. 7th grade 76 57.6%
C. 8th grade 61 52.6%
D. Ungraded or other grade 1 0.9%
4. Are you Hispanic or Latino?
A. Yes 40 30.3%
B. No 92 69.7%
5. What is your race? (Select one or more responses.)
A. American Indian or Alaska Native 12 10.3%
B. Asian 10 8.6%
C. Black or African American 3 2.6%
D. Native Hawaiian or Other Pacific Islander 3 2.6%
E. White 99 85.3%
62

New Mexico 2013 YRRS
Middle School
Weighted
Percent
(%) (95% CI)
6. During the past 12 months, how would you describe your grades in school?
A. Mostly A’s 51.9 (39.4-64.0)
B. Mostly B’s 29.2 (21.5-38.2)
C. Mostly C’s 8.6 (6.0-12.2)
D. Mostly D’s 3.5 (1.5-8.0)
E. Mostly F’s 2.8 (0.7-10.7)
F. None of these grades 0.0 (.-.)
G. Not sure 4.0 (2.5-6.5)
7. Which one of these groups best describes you?
A. American Indian or Alaska Native 3.5 (1.8-6.8)
B. Asian 5.0 (2.6-9.5)
C. Black or African American 2.8 (0.7-10.6)
D. Hispanic or Latino 22.9 (15.6-32.3)
E. Native Hawaiian or Other Pacific Islander 0.7 (0.1-5.2)
F. White 65.0 (54.5-74.2)
Personal Safety
The next 3 questions ask about personal safety.
8. When you ride a bicycle, how often do you wear a helmet?
A. I do not ride a bicycle 14.1 (8.3-23.0)
B. Never wear a helmet 20.4 (15.4-26.6)
C. Rarely wear a helmet 12.3 (7.1-20.6)
D. Sometimes wear a helmet 6.3 (3.6-10.7)
E. Most of the time wear a helmet 20.2 (16.3-24.9)
F. Always wear a helmet 26.7 (18.6-36.6)
9. How often do you wear a seat belt when riding in a car?
A. Never 1.0 (0.2-6.2)
B. Rarely 3.0 (1.1-7.6)
C. Sometimes 4.3 (1.3-12.9)
D. Most of the time 28.8 (19.8-39.7)
E. Always 63.0 (50.3-74.1)
63
New Mexico 2013 YRRS
Middle School
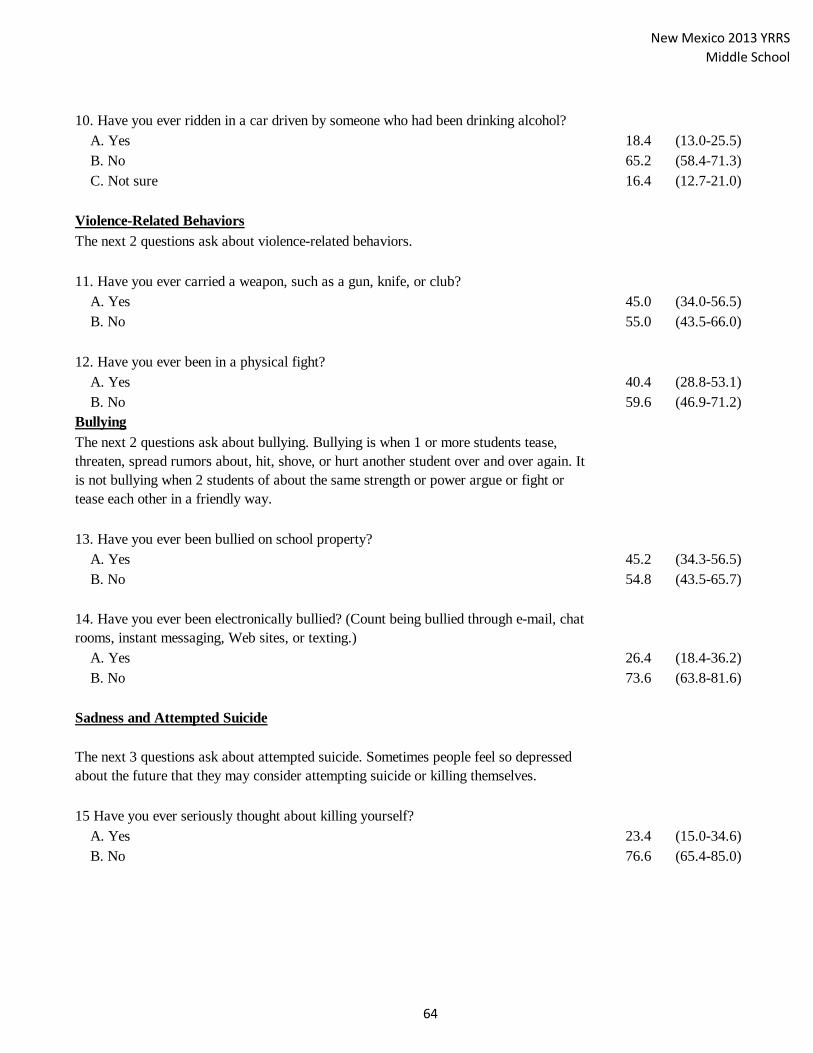
10. Have you ever ridden in a car driven by someone who had been drinking alcohol?
A. Yes 18.4 (13.0-25.5)
B. No 65.2 (58.4-71.3)
C. Not sure 16.4 (12.7-21.0)
Violence-Related Behaviors
The next 2 questions ask about violence-related behaviors.
11. Have you ever carried a weapon, such as a gun, knife, or club?
A. Yes 45.0 (34.0-56.5)
B. No 55.0 (43.5-66.0)
12. Have you ever been in a physical fight?
A. Yes 40.4 (28.8-53.1)
B. No 59.6 (46.9-71.2)
Bullying
The next 2 questions ask about bullying. Bullying is when 1 or more students tease,
threaten, spread rumors about, hit, shove, or hurt another student over and over again. It
is not bullying when 2 students of about the same strength or power argue or fight or
tease each other in a friendly way.
13. Have you ever been bullied on school property?
A. Yes 45.2 (34.3-56.5)
B. No 54.8 (43.5-65.7)
14. Have you ever been electronically bullied? (Count being bullied through e-mail, chat
rooms, instant messaging, Web sites, or texting.)
A. Yes 26.4 (18.4-36.2)
B. No 73.6 (63.8-81.6)
Sadness and Attempted Suicide
The next 3 questions ask about attempted suicide. Sometimes people feel so depressed
about the future that they may consider attempting suicide or killing themselves.
15 Have you ever seriously thought about killing yourself?
A. Yes 23.4 (15.0-34.6)
B. No 76.6 (65.4-85.0)
64
New Mexico 2013 YRRS
Middle School
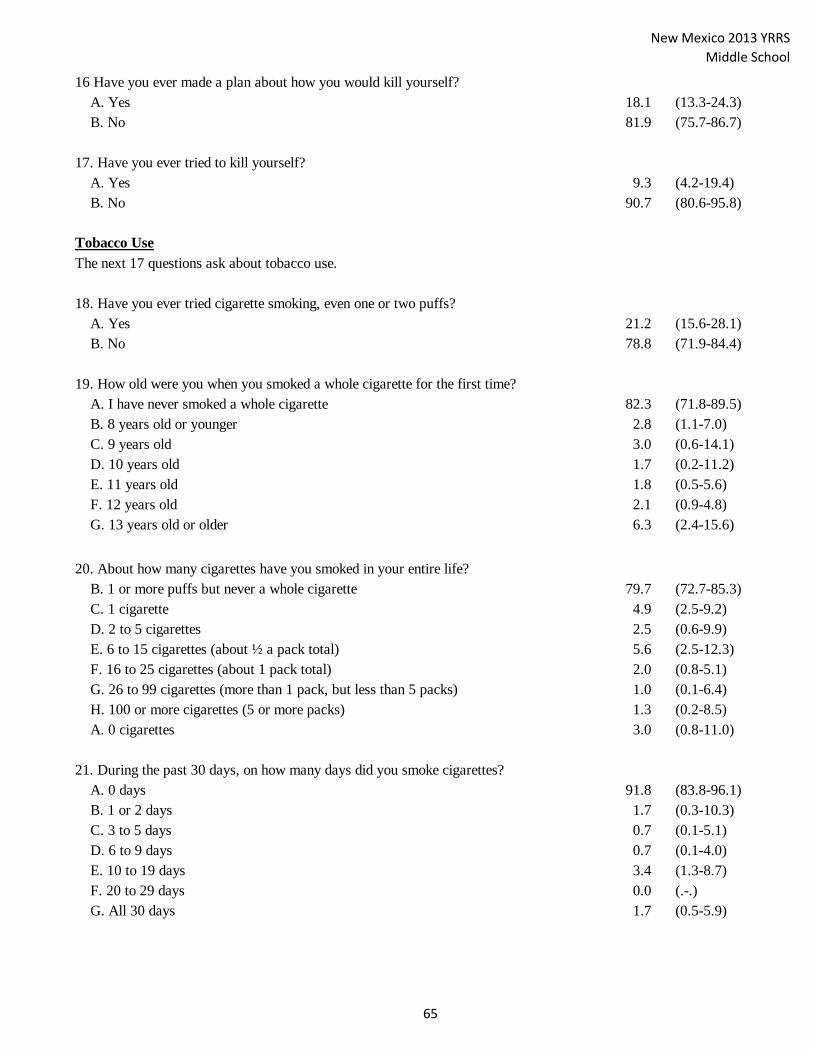
16 Have you ever made a plan about how you would kill yourself?
A. Yes 18.1 (13.3-24.3)
B. No 81.9 (75.7-86.7)
17. Have you ever tried to kill yourself?
A. Yes 9.3 (4.2-19.4)
B. No 90.7 (80.6-95.8)
Tobacco Use
The next 17 questions ask about tobacco use.
18. Have you ever tried cigarette smoking, even one or two puffs?
A. Yes 21.2 (15.6-28.1)
B. No 78.8 (71.9-84.4)
19. How old were you when you smoked a whole cigarette for the first time?
A. I have never smoked a whole cigarette 82.3 (71.8-89.5)
B. 8 years old or younger 2.8 (1.1-7.0)
C. 9 years old 3.0 (0.6-14.1)
D. 10 years old 1.7 (0.2-11.2)
E. 11 years old 1.8 (0.5-5.6)
F. 12 years old 2.1 (0.9-4.8)
G. 13 years old or older 6.3 (2.4-15.6)
20. About how many cigarettes have you smoked in your entire life?
B. 1 or more puffs but never a whole cigarette 79.7 (72.7-85.3)
C. 1 cigarette 4.9 (2.5-9.2)
D. 2 to 5 cigarettes 2.5 (0.6-9.9)
E. 6 to 15 cigarettes (about ½ a pack total) 5.6 (2.5-12.3)
F. 16 to 25 cigarettes (about 1 pack total) 2.0 (0.8-5.1)
G. 26 to 99 cigarettes (more than 1 pack, but less than 5 packs) 1.0 (0.1-6.4)
H. 100 or more cigarettes (5 or more packs) 1.3 (0.2-8.5)
A. 0 cigarettes 3.0 (0.8-11.0)
21. During the past 30 days, on how many days did you smoke cigarettes?
A. 0 days 91.8 (83.8-96.1)
B. 1 or 2 days 1.7 (0.3-10.3)
C. 3 to 5 days 0.7 (0.1-5.1)
D. 6 to 9 days 0.7 (0.1-4.0)
E. 10 to 19 days 3.4 (1.3-8.7)
F. 20 to 29 days 0.0 (.-.)
G. All 30 days 1.7 (0.5-5.9)
65

New Mexico 2013 YRRS
Middle School
22. Have you ever smoked cigarettes daily, that is, at least one cigarette every day for 30
days?
A. Yes 4.5 (1.7-11.7)
B. No 95.5 (88.3-98.3)
23. During the past 30 days, on how many days did you smoke cigarettes on school
property?
A. 0 days 98.0 (93.0-99.5)
B. 1 or 2 days 0.7 (0.1-4.2)
C. 3 to 5 days 0.7 (0.1-4.4)
D. 6 to 9 days 0.7 (0.1-4.4)
E. 10 to 19 days 0.0 (.-.)
F. 20 to 29 days 0.0 (.-.)
G. All 30 days 0.0 (.-.)
24. During the past 30 days, how did you usually get your own cigarettes? (Select only
one response.)
A. I did not smoke cigarettes during the past 30 days 91.6 (83.1-96.1)
B. I bought them in a store such as a convenience store, supermarket, discount store,
or gas station 0.0 (.-.)
C. I bought them from a vending machine 0.0 (.-.)
D. I gave someone else money to buy them for me 2.8 (0.7-10.7)
E. I borrowed (or bummed) them from someone else 1.8 (0.4-7.3)
F. A person 18 years old or older gave them to me 0.7 (0.1-4.5)
G. I took them from a store or family member 1.7 (0.5-6.2)
H. I got them some other way 1.4 (0.4-4.2)
25. During the past 30 days, what brand of cigarettes did you usually smoke? (Select
only one response.)
A. I did not smoke cigarettes during the past 30 days 88.1 (81.8-92.5)
B. I do not have a usual brand 4.2 (1.8-9.4)
C. Camel 1.3 (0.4-4.5)
D. Marlboro 4.6 (1.5-12.9)
E. Newport 0.0 (.-.)
F. Virginia Slims 0.0 (.-.)
G. GPS, Basic, or Doral 0.0 (.-.)
H. Some other brand 1.7 (0.4-7.2)
66
New Mexico 2013 YRRS
Middle School
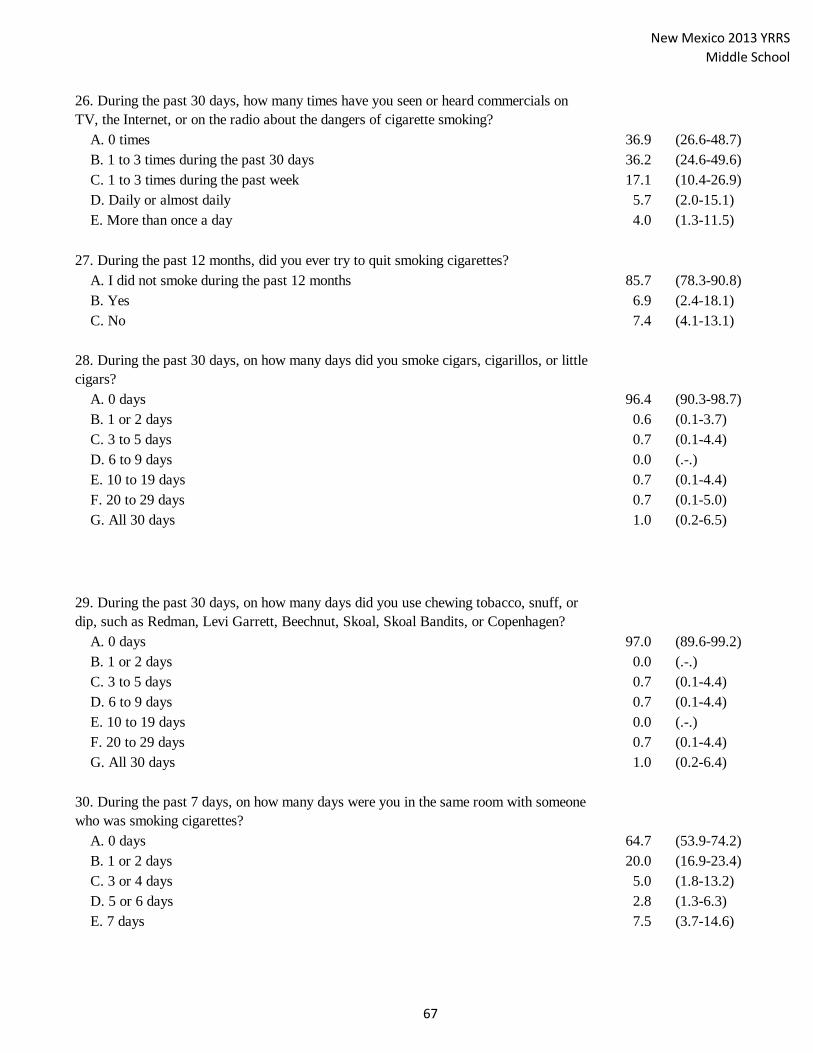
26. During the past 30 days, how many times have you seen or heard commercials on
TV, the Internet, or on the radio about the dangers of cigarette smoking?
A. 0 times 36.9 (26.6-48.7)
B. 1 to 3 times during the past 30 days 36.2 (24.6-49.6)
C. 1 to 3 times during the past week 17.1 (10.4-26.9)
D. Daily or almost daily 5.7 (2.0-15.1)
E. More than once a day 4.0 (1.3-11.5)
27. During the past 12 months, did you ever try to quit smoking cigarettes?
A. I did not smoke during the past 12 months 85.7 (78.3-90.8)
B. Yes 6.9 (2.4-18.1)
C. No 7.4 (4.1-13.1)
28. During the past 30 days, on how many days did you smoke cigars, cigarillos, or little
cigars?
A. 0 days 96.4 (90.3-98.7)
B. 1 or 2 days 0.6 (0.1-3.7)
C. 3 to 5 days 0.7 (0.1-4.4)
D. 6 to 9 days 0.0 (.-.)
E. 10 to 19 days 0.7 (0.1-4.4)
F. 20 to 29 days 0.7 (0.1-5.0)
G. All 30 days 1.0 (0.2-6.5)
29. During the past 30 days, on how many days did you use chewing tobacco, snuff, or
dip, such as Redman, Levi Garrett, Beechnut, Skoal, Skoal Bandits, or Copenhagen?
A. 0 days 97.0 (89.6-99.2)
B. 1 or 2 days 0.0 (.-.)
C. 3 to 5 days 0.7 (0.1-4.4)
D. 6 to 9 days 0.7 (0.1-4.4)
E. 10 to 19 days 0.0 (.-.)
F. 20 to 29 days 0.7 (0.1-4.4)
G. All 30 days 1.0 (0.2-6.4)
30. During the past 7 days, on how many days were you in the same room with someone
who was smoking cigarettes?
A. 0 days 64.7 (53.9-74.2)
B. 1 or 2 days 20.0 (16.9-23.4)
C. 3 or 4 days 5.0 (1.8-13.2)
D. 5 or 6 days 2.8 (1.3-6.3)
E. 7 days 7.5 (3.7-14.6)
67

New Mexico 2013 YRRS
Middle School
31. Do you think smoke from other people’s cigarettes is harmful to you?
A. Definitely yes 54.6 (44.8-64.1)
B. Probably yes 34.8 (27.6-42.8)
C. Probably not 6.9 (3.5-13.0)
D. Definitely not 3.7 (2.0-6.8)
32. Do you think that you will try smoking a cigarette soon?
A. I have already tried smoking cigarettes 14.5 (9.5-21.3)
B. Yes 4.2 (2.2-7.9)
C. No 81.3 (75.2-86.2)
33. Do you think you will smoke a cigarette at anytime during the next year?
A. Definitely yes 5.7 (2.6-12.0)
B. Probably yes 4.4 (2.1-8.9)
C. Probably not 11.3 (7.2-17.3)
D. Definitely not 78.6 (70.5-85.0)
34. If one of your best friends offered you a cigarette, would you smoke it?
A. Definitely yes 3.0 (1.1-7.6)
B. Probably yes 6.1 (3.1-11.6)
C. Probably not 14.3 (7.1-26.6)
D. Definitely not 76.6 (63.4-86.1)
Alcohol
The next 8 questions ask about drinking alcohol. This includes drinking beer, wine, wine
coolers, and liquor such as rum, gin, vodka, or whiskey. For these questions, drinking
alcohol does not include drinking a few sips of wine for religious purposes.
35. Have you ever had a drink of alcohol, other than a few sips?
A. Yes 18.9 (12.4-27.6)
B. No 81.1 (72.4-87.6)
36. How old were you when you had your first drink of alcohol other than a few sips?
A. I have never had a drink of alcohol other than a few sips 80.4 (70.9-87.4)
B. 8 years old or younger 5.8 (3.1-10.6)
C. 9 years old 1.3 (0.2-8.3)
D. 10 years old 1.9 (0.4-8.2)
E. 11 years old 1.8 (0.4-7.3)
F. 12 years old 3.6 (1.4-9.1)
G. 13 years old or older 5.2 (2.4-10.8)
68

New Mexico 2013 YRRS
Middle School
37. During the past 30 days, on how many days did you have at least one drink of
alcohol?
A. 0 days 88.5 (80.2-93.6)
B. 1 or 2 days 6.4 (3.4-12.0)
C. 3 to 5 days 1.7 (0.4-7.0)
D. 6 to 9 days 0.7 (0.1-5.0)
E. 10 to 19 days 1.7 (0.5-5.6)
F. 20 to 29 days 0.0 (.-.)
G. All 30 days 1.0 (0.2-6.4)
38. During the past 30 days, on how many days did you have 5 or more drinks of alcohol
in a row, that is, within a couple of hours?
A. 0 days 94.3 (89.5-97.0)
B. 1 day 2.4 (1.0-5.4)
C. 2 days 1.7 (0.4-6.7)
D. 3 to 5 days 0.0 (.-.)
E. 6 to 9 days 0.0 (.-.)
F. 10 to 19 days 0.0 (.-.)
G. 20 or more days 1.7 (0.5-5.5)
39. If you wanted to get some beer, wine, or hard liquor (for example, vodka, whiskey,
or gin), how easy would it be for you to get?
A. Very hard 48.6 (41.7-55.5)
B. Sort of hard 27.0 (20.1-35.2)
C. Sort of easy 14.8 (8.3-25.1)
D. Very easy 9.6 (6.1-14.8)
40. How wrong do your parents feel it would be for you to drink alcohol (beer, wine, or
hard liquor) regularly?
A. Very wrong 86.6 (78.3-92.1)
B. Wrong 9.6 (4.5-19.5)
C. A little bit wrong 2.1 (0.8-5.5)
D. Not wrong at all 1.7 (0.5-5.6)
41. How wrong do you think it is for someone your age to drink alcohol (beer, wine, or
hard liquor) regularly?
A. Very wrong 70.4 (59.0-79.8)
B. Wrong 20.8 (13.5-30.7)
C. A little bit wrong 7.2 (3.8-13.3)
D. Not wrong at all 1.6 (0.5-5.0)
69
New Mexico 2013 YRRS
Middle School
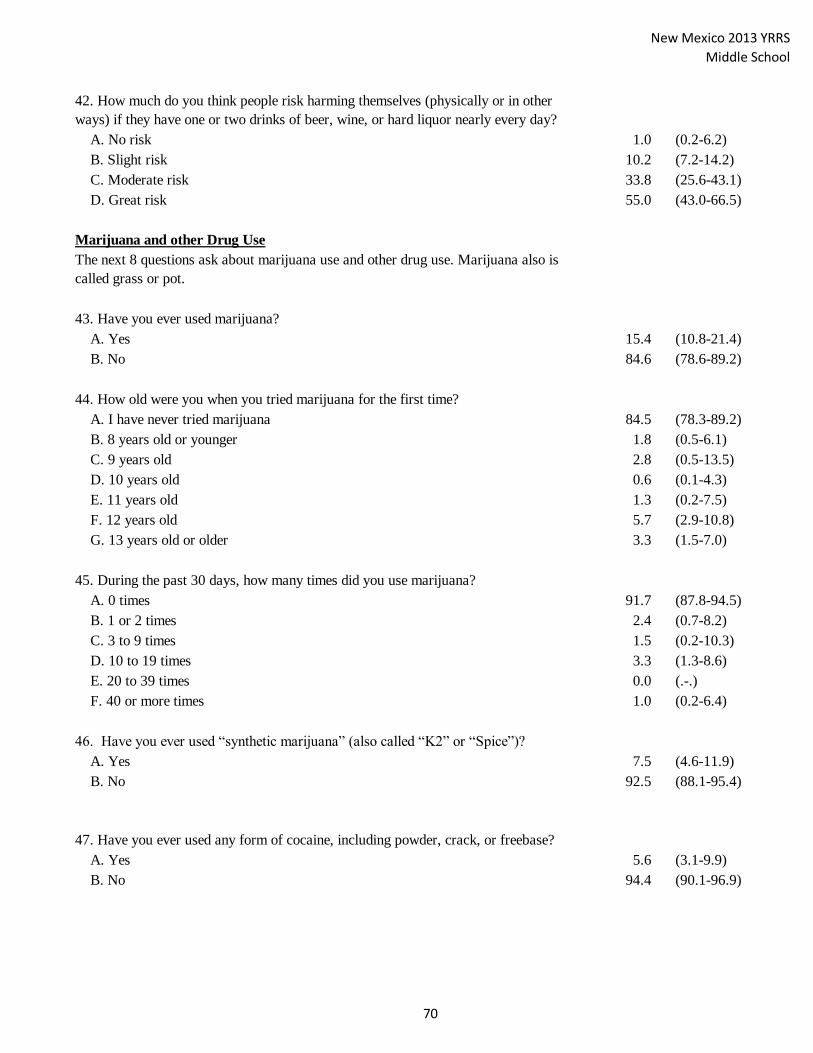
42. How much do you think people risk harming themselves (physically or in other
ways) if they have one or two drinks of beer, wine, or hard liquor nearly every day?
A. No risk 1.0 (0.2-6.2)
B. Slight risk 10.2 (7.2-14.2)
C. Moderate risk 33.8 (25.6-43.1)
D. Great risk 55.0 (43.0-66.5)
Marijuana and other Drug Use
The next 8 questions ask about marijuana use and other drug use. Marijuana also is
called grass or pot.
43. Have you ever used marijuana?
A. Yes 15.4 (10.8-21.4)
B. No 84.6 (78.6-89.2)
44. How old were you when you tried marijuana for the first time?
A. I have never tried marijuana 84.5 (78.3-89.2)
B. 8 years old or younger 1.8 (0.5-6.1)
C. 9 years old 2.8 (0.5-13.5)
D. 10 years old 0.6 (0.1-4.3)
E. 11 years old 1.3 (0.2-7.5)
F. 12 years old 5.7 (2.9-10.8)
G. 13 years old or older 3.3 (1.5-7.0)
45. During the past 30 days, how many times did you use marijuana?
A. 0 times 91.7 (87.8-94.5)
B. 1 or 2 times 2.4 (0.7-8.2)
C. 3 to 9 times 1.5 (0.2-10.3)
D. 10 to 19 times 3.3 (1.3-8.6)
E. 20 to 39 times 0.0 (.-.)
F. 40 or more times 1.0 (0.2-6.4)
46. Have you ever used “synthetic marijuana” (also called “K2” or “Spice”)?
A. Yes 7.5 (4.6-11.9)
B. No 92.5 (88.1-95.4)
47. Have you ever used any form of cocaine, including powder, crack, or freebase?
A. Yes 5.6 (3.1-9.9)
B. No 94.4 (90.1-96.9)
70

New Mexico 2013 YRRS
Middle School
48. Have you ever sniffed glue, or breathed the contents of spray cans, or inhaled any
paints or sprays to get high?
A. Yes 9.7 (6.2-14.9)
B. No 90.3 (85.1-93.8)
49. Have you ever taken a prescription drug (such as OxyContin, Percocet, Vicodin,
codeine, Adderall, Ritalin, or Xanax) without a doctor’s prescription?
A. Yes 8.2 (5.1-13.2)
B. No 91.8 (86.8-94.9)
50. Have you ever used a pain killer to get high, like Vicodin, OxyContin (also called
Oxy or OC), or Percocet (also called Percs)?
A. Yes 3.7 (1.4-9.5)
B. No 96.3 (90.5-98.6)
51. Have you ever used a needle to inject any illegal drug into your body?
A. Yes 1.0 (0.2-6.4)
B. No 99.0 (93.6-99.8)
Sexual Behavior
The next 4 questions ask about sexual intercourse.
52. Have you ever had sexual intercourse?
A. Yes 6.3 (2.3-16.6)
B. No 93.7 (83.4-97.7)
53. How old were you when you had sexual intercourse for the first time?
A. I have never had sexual intercourse 94.6 (86.2-98.0)
B. 8 years old or younger 1.0 (0.2-6.7)
C. 9 years old 1.2 (0.2-9.1)
D. 10 years old 1.0 (0.2-6.7)
E . 11 years old 0.0 (.-.)
F. 12 years old 0.0 (.-.)
G. 13 years old or older 2.0 (0.3-13.2)
54. With how many people have you ever had sexual intercourse?
A. I have never had sexual intercourse 93.7 (83.4-97.7)
B. 1 person 2.2 (0.6-8.2)
C. 2 people 0.7 (0.1-4.6)
D. 3 people 0.0 (.-.)
E. 4 people 1.4 (0.2-9.0)
F. 5 people 1.0 (0.2-6.5)
G. 6 or more people 1.0 (0.2-6.5)
71
New Mexico 2013 YRRS
Middle School
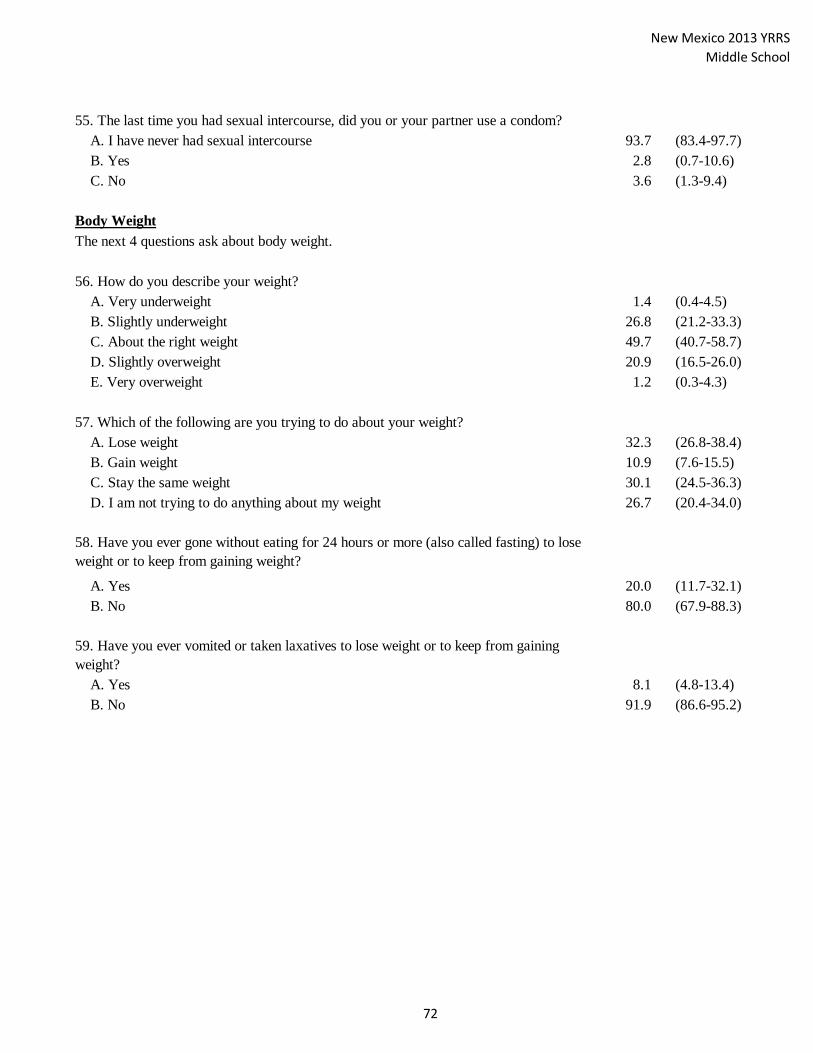
55. The last time you had sexual intercourse, did you or your partner use a condom?
A. I have never had sexual intercourse 93.7 (83.4-97.7)
B. Yes 2.8 (0.7-10.6)
C. No 3.6 (1.3-9.4)
Body Weight
The next 4 questions ask about body weight.
56. How do you describe your weight?
A. Very underweight 1.4 (0.4-4.5)
B. Slightly underweight 26.8 (21.2-33.3)
C. About the right weight 49.7 (40.7-58.7)
D. Slightly overweight 20.9 (16.5-26.0)
E. Very overweight 1.2 (0.3-4.3)
57. Which of the following are you trying to do about your weight?
A. Lose weight 32.3 (26.8-38.4)
B. Gain weight 10.9 (7.6-15.5)
C. Stay the same weight 30.1 (24.5-36.3)
D. I am not trying to do anything about my weight 26.7 (20.4-34.0)
58. Have you ever gone without eating for 24 hours or more (also called fasting) to lose
weight or to keep from gaining weight?
A. Yes 20.0 (11.7-32.1)
B. No 80.0 (67.9-88.3)
59. Have you ever vomited or taken laxatives to lose weight or to keep from gaining
weight?
A. Yes 8.1 (4.8-13.4)
B. No 91.9 (86.6-95.2)
72
New Mexico 2013 YRRS
Middle School
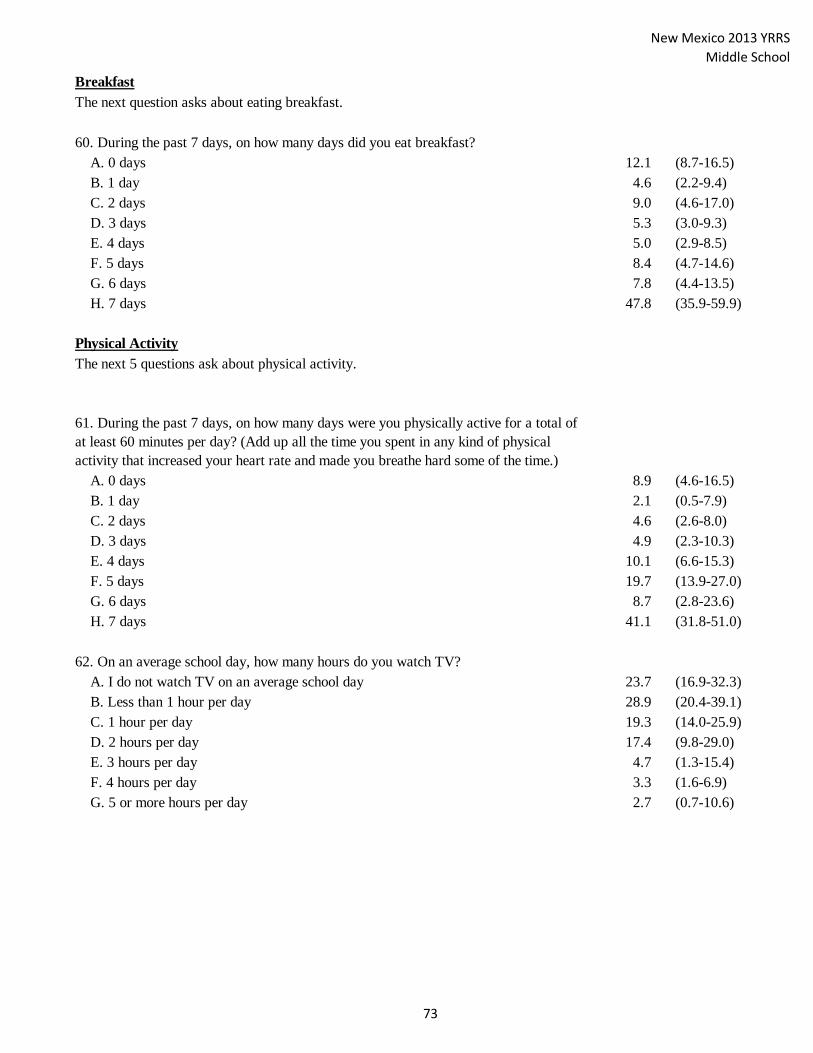
Breakfast
The next question asks about eating breakfast.
60. During the past 7 days, on how many days did you eat breakfast?
A. 0 days 12.1 (8.7-16.5)
B. 1 day 4.6 (2.2-9.4)
C. 2 days 9.0 (4.6-17.0)
D. 3 days 5.3 (3.0-9.3)
E. 4 days 5.0 (2.9-8.5)
F. 5 days 8.4 (4.7-14.6)
G. 6 days 7.8 (4.4-13.5)
H. 7 days 47.8 (35.9-59.9)
Physical Activity
The next 5 questions ask about physical activity.
61. During the past 7 days, on how many days were you physically active for a total of
at least 60 minutes per day? (Add up all the time you spent in any kind of physical
activity that increased your heart rate and made you breathe hard some of the time.)
A. 0 days 8.9 (4.6-16.5)
B. 1 day 2.1 (0.5-7.9)
C. 2 days 4.6 (2.6-8.0)
D. 3 days 4.9 (2.3-10.3)
E. 4 days 10.1 (6.6-15.3)
F. 5 days 19.7 (13.9-27.0)
G. 6 days 8.7 (2.8-23.6)
H. 7 days 41.1 (31.8-51.0)
62. On an average school day, how many hours do you watch TV?
A. I do not watch TV on an average school day 23.7 (16.9-32.3)
B. Less than 1 hour per day 28.9 (20.4-39.1)
C. 1 hour per day 19.3 (14.0-25.9)
D. 2 hours per day 17.4 (9.8-29.0)
E. 3 hours per day 4.7 (1.3-15.4)
F. 4 hours per day 3.3 (1.6-6.9)
G. 5 or more hours per day 2.7 (0.7-10.6)
73
New Mexico 2013 YRRS
Middle School
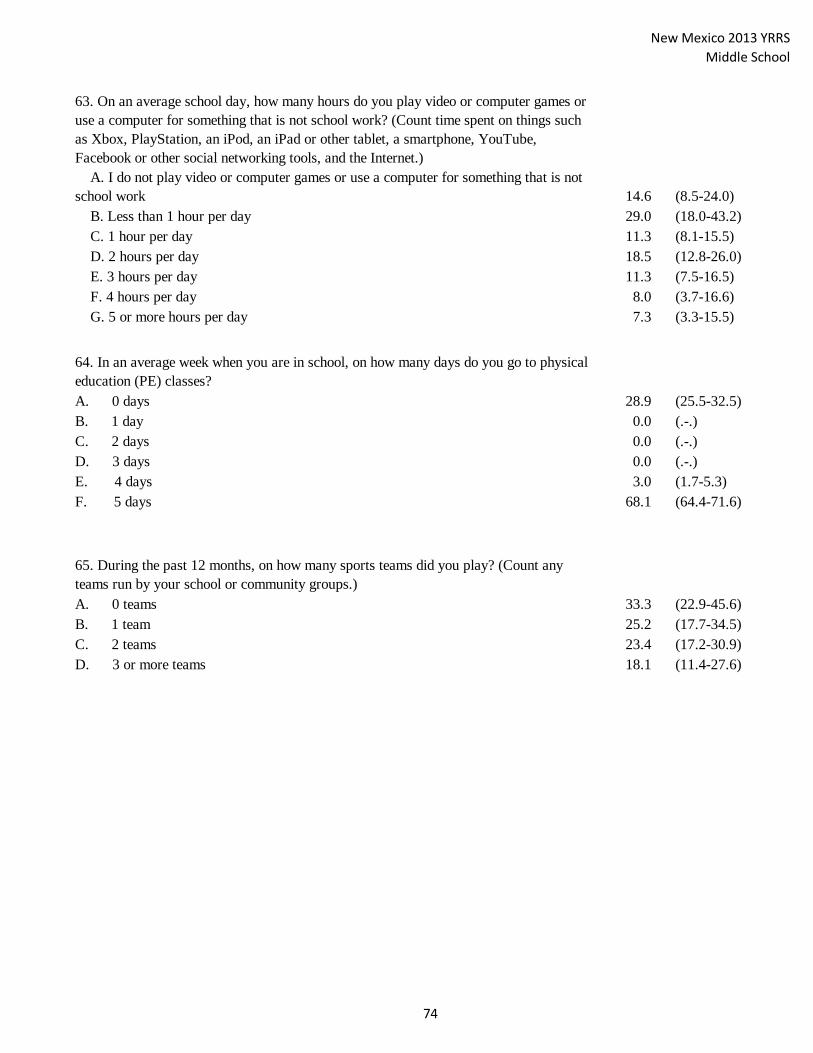
63. On an average school day, how many hours do you play video or computer games or
use a computer for something that is not school work? (Count time spent on things such
as Xbox, PlayStation, an iPod, an iPad or other tablet, a smartphone, YouTube,
Facebook or other social networking tools, and the Internet.)
A. I do not play video or computer games or use a computer for something that is not
school work 14.6 (8.5-24.0)
B. Less than 1 hour per day 29.0 (18.0-43.2)
C. 1 hour per day 11.3 (8.1-15.5)
D. 2 hours per day 18.5 (12.8-26.0)
E. 3 hours per day 11.3 (7.5-16.5)
F. 4 hours per day 8.0 (3.7-16.6)
G. 5 or more hours per day 7.3 (3.3-15.5)
64. In an average week when you are in school, on how many days do you go to physical
education (PE) classes?
A. 0 days 28.9 (25.5-32.5)
B. 1 day 0.0 (.-.)
C. 2 days 0.0 (.-.)
D. 3 days 0.0 (.-.)
E. 4 days 3.0 (1.7-5.3)
F. 5 days 68.1 (64.4-71.6)
65. During the past 12 months, on how many sports teams did you play? (Count any
teams run by your school or community groups.)
A. 0 teams 33.3 (22.9-45.6)
B. 1 team 25.2 (17.7-34.5)
C. 2 teams 23.4 (17.2-30.9)
D. 3 or more teams 18.1 (11.4-27.6)
74

New Mexico 2013 YRRS
Middle School
Health-Related Topics
The next 3 questions ask about other health-related topics.
66. Have you ever been taught about AIDS or HIV infection in school?
A. Yes 82.2 (80.6-83.7)
B. No 12.3 (9.7-15.5)
C. Not sure 5.5 (2.8-10.7)
67. Has a doctor or nurse ever told you that you have asthma?
A. Yes 25.7 (19.6-33.0)
B. No 67.8 (60.7-74.2)
C. Not sure 6.4 (3.3-12.1)
68. Do you have enough food to eat, sometimes not enough to eat, or often not enough to
eat?
A. Enough food to eat 72.3 (65.0-78.6)
B. Sometimes not enough to eat 25.5 (19.4-32.7)
C. Often not enough to eat 2.2 (0.8-5.7)
Resiliency Factors
How true do you feel the following 7 statements are for you?
69. My friends get into a lot of trouble.
A. Not true at all 39.1 (31.6-47.2)
B. A little true 48.9 (40.4-57.4)
C. Pretty much true 7.9 (3.6-16.5)
D. Very much true 4.1 (2.4-6.9)
70. I have a friend about my own age who really cares about me.
A. Not true at all 8.4 (4.0-16.7)
B. A little true 11.2 (6.1-19.4)
C. Pretty much true 24.6 (15.1-37.4)
D. Very much true 55.8 (45.5-65.7)
71. Outside of my home and school, there is an adult who really cares about me.
A. Not true at all 7.6 (3.7-14.9)
B. A little true 1.2 (0.1-9.0)
C. Pretty much true 15.5 (10.2-22.8)
D. Very much true 75.8 (64.7-84.2)
75
New Mexico 2013 YRRS
Middle School
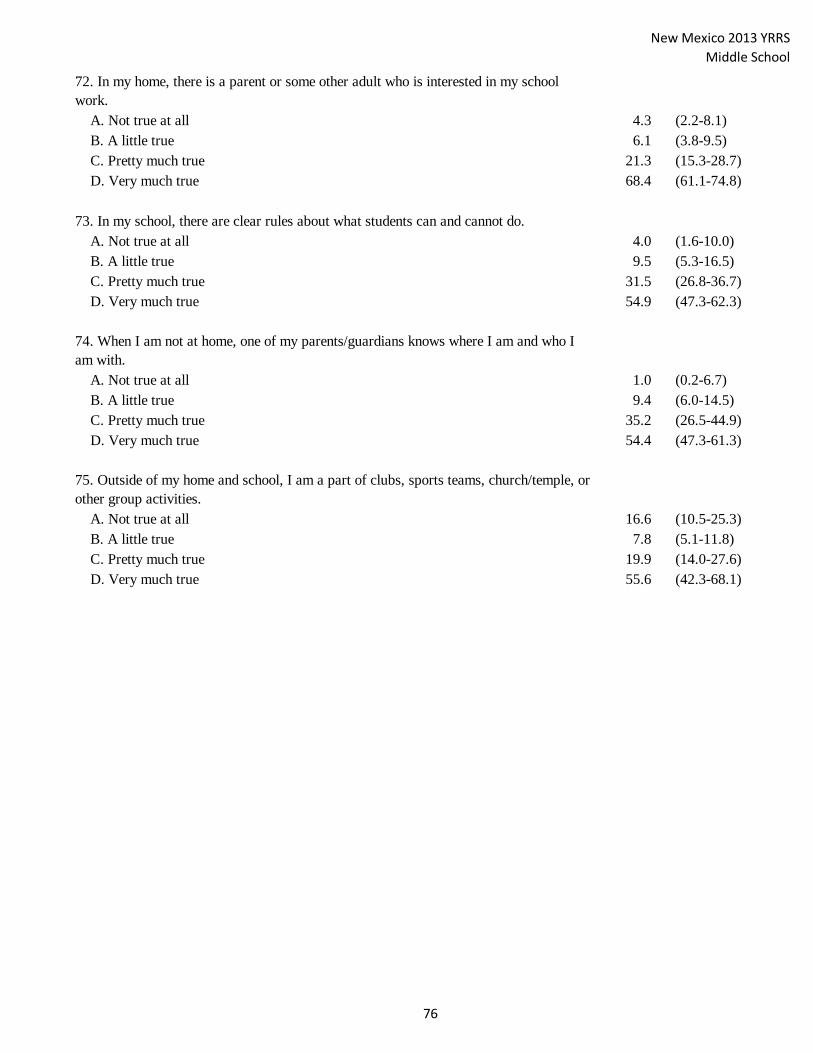
72. In my home, there is a parent or some other adult who is interested in my school
work.
A. Not true at all 4.3 (2.2-8.1)
B. A little true 6.1 (3.8-9.5)
C. Pretty much true 21.3 (15.3-28.7)
D. Very much true 68.4 (61.1-74.8)
73. In my school, there are clear rules about what students can and cannot do.
A. Not true at all 4.0 (1.6-10.0)
B. A little true 9.5 (5.3-16.5)
C. Pretty much true 31.5 (26.8-36.7)
D. Very much true 54.9 (47.3-62.3)
74. When I am not at home, one of my parents/guardians knows where I am and who I
am with.
A. Not true at all 1.0 (0.2-6.7)
B. A little true 9.4 (6.0-14.5)
C. Pretty much true 35.2 (26.5-44.9)
D. Very much true 54.4 (47.3-61.3)
75. Outside of my home and school, I am a part of clubs, sports teams, church/temple, or
other group activities.
A. Not true at all 16.6 (10.5-25.3)
B. A little true 7.8 (5.1-11.8)
C. Pretty much true 19.9 (14.0-27.6)
D. Very much true 55.6 (42.3-68.1)
76
New Mexico 2013 YRRS
Grades 6-8
Appendix B
About this Report
77
New Mexico 2013 YRRS
Grades 6-8
nmhealth.org/go/youth.
In some cases with very few students in a particular age or gender group, data have been
suppressed to protect the anonymity of the individual respondents. Suppressed data are
marked with "--". In cases where there are fewer than 50 respondents per grade level or
gender, grade level or gender charts have been omitted.
Appendix B: About this Report
This report contains county level results from the 2013 New Mexico Middle School Youth
Risk and Resiliency Survey (YRRS). The YRRS is a statewide survey of public school
students in middle schools and high schools throughout New Mexico. Statewide and county
level results are available at
www.YouthRisk.org, and
School district reports are available only with permission from the appropriate school district
superintendent. Forms for this are permission are available under the "Requesting Data" link
on the youthrisk.org site. Together, these documents comprise a useful tool for those working
on youth-related issues at the state and local level.
The YRRS is organized into two major content areas: risk behaviors and protective
(resiliency) factors. Risk behaviors include behaviors associated with unintentional injury,
violence, mental health, tobacco use, alcohol use, drug use, sexual activity, physical activity,
and nutrition. Protective or resiliency factors are measures of the positive and supportive
relationships, experiences, activities, resources and values that encourage healthy youth
development. Resiliency factors and related traits include caring and supportive relationships
in the family, school, community and with peers; boundaries set by the family and school;
positive peer support; meaningful participation and constructive use of time in school and
outside of school.
Using the Report
The main section of this report consists of a module of results for each main topic area of
the YRRS. Each module starts with a set of line charts illustrating change in behavior over
the years of the survey (for counties or school districts that only have one recent year of data,
the line charts are omitted). The line charts are followed by one or more sets of three bar
charts. The first bar chart in each set compares the county prevalence of a group of
behaviors to the NM prevalence for the same behaviors; the second compares the county
prevalence for girls to that of boys for the same behaviors, and the third compares the county
prevalence for each grade level.
Following the section on distinct risk and resiliency factors is a section that illustrates the
relationship between risk behaviors and protective factors. This section consists of a set of
bar charts, each showing the prevalence of a particular risk behavior for students with varying
levels of selected protective factors.
78
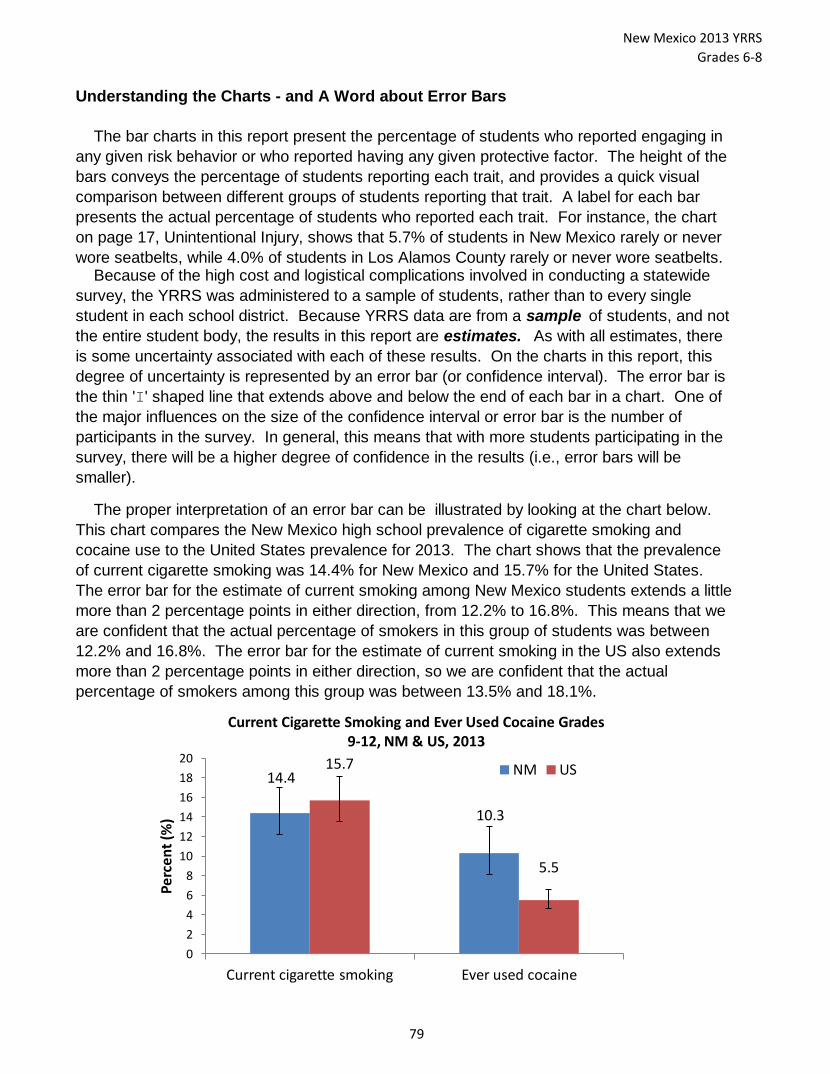
New Mexico 2013 YRRS
Grades 6-8
Understanding the Charts - and A Word about Error Bars
The bar charts in this report present the percentage of students who reported engaging in
any given risk behavior or who reported having any given protective factor. The height of the
bars conveys the percentage of students reporting each trait, and provides a quick visual
comparison between different groups of students reporting that trait. A label for each bar
presents the actual percentage of students who reported each trait. For instance, the chart
on page 17, Unintentional Injury, shows that 5.7% of students in New Mexico rarely or never
wore seatbelts, while 4.0% of students in Los Alamos County rarely or never wore seatbelts. Because of the high cost and logistical complications involved in conducting a statewide
survey, the YRRS was administered to a sample of students, rather than to every single
student in each school district. Because YRRS data are from a sample of students, and not
the entire student body, the results in this report are estimates. As with all estimates, there
is some uncertainty associated with each of these results. On the charts in this report, this
degree of uncertainty is represented by an error bar (or confidence interval). The error bar is
the thin 'I' shaped line that extends above and below the end of each bar in a chart. One of
the major influences on the size of the confidence interval or error bar is the number of
participants in the survey. In general, this means that with more students participating in the
survey, there will be a higher degree of confidence in the results (i.e., error bars will be
smaller).
The proper interpretation of an error bar can be illustrated by looking at the chart below.
This chart compares the New Mexico high school prevalence of cigarette smoking and
cocaine use to the United States prevalence for 2013. The chart shows that the prevalence
of current cigarette smoking was 14.4% for New Mexico and 15.7% for the United States.
The error bar for the estimate of current smoking among New Mexico students extends a little
more than 2 percentage points in either direction, from 12.2% to 16.8%. This means that we
are confident that the actual percentage of smokers in this group of students was between
12.2% and 16.8%. The error bar for the estimate of current smoking in the US also extends
more than 2 percentage points in either direction, so we are confident that the actual
percentage of smokers among this group was between 13.5% and 18.1%.
14.4
10.3
15.7
5.5
0
2
4
6
8
10
12
14
16
18
20
Current cigarette smoking Ever used cocaine
Pe
rce
nt
(%)
Current Cigarette Smoking and Ever Used Cocaine Grades 9-12, NM & US, 2013
NM US
79

New Mexico 2013 YRRS
Grades 6-8
How does knowing the upper and lower limits of our error bars help us? While it appears at
first glance that New Mexico has a lower prevalence of smoking than the United States
(14.4% vs. 15.7%), a closer look at the error bars shows a more complicated picture. The
error bars for the New Mexico estimate (12.2%–16.8%) and the US estimate (13.5%-18.1%)
overlap. Because of this overlap, we do not have a high degree of confidence that the
prevalence of smoking in New Mexico was actually different from the prevalence in the United
States. In other words, the difference between the prevalence of smoking in New Mexico and
the United States was not statistically significant. For cocaine use it appears that New Mexico had a higher prevalence than the United
States (10.3% vs. 5.5%). The error bar for New Mexico extends from 8.1% to 13.0%, and the
error bar for the United States extends from 4.7% to 6.6%. Because the higher bound of the
US error bar (6.6%) is lower than the lower bound of the NM error bar (8.1%), these error
bars do not overlap. For cocaine use, we are confident in saying that the New Mexico
prevalence was higher than the US prevalence. In other words, the difference between the
prevalence of cocaine use in New Mexico and the United States was a statistically significant
difference.
For some small school districts, error bars have been removed from this report. With small
populations, the number of students sampled can approach the total student population. In
these cases, error bars would have limited meaning because with a high percentage of
students surveyed, there is less uncertainty around the estimates than error bars suggest.
14.4
10.3
15.7
5.5
0
2
4
6
8
10
12
14
16
18
20
Current cigarette smoking Ever used cocaine
Pe
rce
nt
(%)
Current Cigarette Smoking and Ever Used Cocaine Grades 9-12, NM & US, 2013
NM US Error bars do overlap - There is not a statistically significant difference between the US and NM rates.
Error bars do not overlap - There is a statistically significant difference between the US and NM rates.
80
New Mexico 2013 YRRS
Grades 6-8
Personal Safety (Injury, Violence, and Bullying)
Rarely or never wore a bike helmet
Rarely or never wore a seatbelt
Ever carried a weapon
Ever been in a physical fight
Ever bullied on school property
Ever bullied electronically
Mental Health
Ever seriously thought about killing self
Ever planned to kill self
Ever tried to kill self
Tobacco Use
Ever smoked cigarettes
First smoked a cigarette before age 11
Smoked at least one whole cigarette in life
Current cigarette smoking (Smoked cigarettes at least once in the past 30 days)
Non-smoker
Frequent cigarette smoking
Risk Behavior and Resiliency/Protective Factor Definitions
Of those who rode a bicycle, answered 'Never' or 'Rarely' to the question, When you ride
a bicycle, how often do you wear a helmet?
Answered 'Never' or 'Rarely' to the question, How often do you wear a seat belt when
riding in a car?
Answered 'Yes' to the question, Have you ever carried a weapon, such as a gun, knife,
or club?
Answered 'Yes' to the question, Have you ever been in a physical fight?
Answered 'Yes' to the question, Have you ever been bullied on school property?
Answered 'Yes' to the question, Have you ever been electronically bullied? (Include
being bullied through e-mail, chat rooms, instant messaging, Web sites, or texting.)
Answered 'Yes' to the question, Have you ever seriously thought about killing
yourself?
Answered 'Yes' to the question, Have you ever made a plan about how you would
kill yourself?
Answered 'Yes' to the question, Have you ever tried to kill yourself?
Answered 'Yes' to the question, Have you ever tried cigarette smoking, even
one or two puffs?
Answered '10 years old' or younger to the question, How old were you when
you smoked a whole cigarette for the first time?
Answered '1 cigarette' or more to the question, About how many cigarettes
have you smoked in your entire life?
Answered '1 or 2 days' or more to the question, During the past 30 days,
on how many days did you smoke cigarettes?
Answered '0 days' to the question, During the past 30 days, on how many
days did you smoke cigarettes?
Answered '20 to 29 days' or more to the question, During the past 30 days,
on how many days did you smoke cigarettes?
81

New Mexico 2013 YRRS
Grades 6-8
Smoked on school property
Of those who smoked in the past 12 months, tried to quit smoking
Successful quit attempt by one who smoked in the past 12 months
Unsuccessful quit attempt by one who smoked in the past 12 months
Current cigar smoking
Current spit tobacco use
Exposed to second hand cigarette smoke
Alcohol Use
Ever drank alcohol
Drank alcohol before age 11
Current drinking
Binge drinking (Had 5 or more drinks on a single occasion at least once in the past 30 days)
It would be very easy or sort of easy to get alcohol
My parents think my regular alcohol use would be wrong
Answered '1 or 2 days' or more to the question, During the past 30 days,
on how many days did you smoke cigarettes on school property?
Answered 'Yes' to the question, During the past 12 months, did you ever try
to quit smoking cigarettes? , among those who answered 'Yes' or 'No' to the
Answered 'Yes' to the question, During the past 12 months, did you ever try
to quit smoking cigarettes?
- and -
Answered '0 days' to the question, During the past 30 days, on how many days
did you smoke cigarettes? (i.e., were currently non-smokers.)
Answered 'Yes' to the question, During the past 12 months, did you ever try
to quit smoking cigarettes?
Answered 'Yes' to the question, Have you ever had a drink of alcohol, other
than a few sips?
Answered '10 years old' or younger to the question, How old were you when
you had your first drink of alcohol other than a few sips?
Answered '1 or 2 days' or more to the question, During the past 30 days,
on how many days did you have at least one drink of alcohol?
- and -
Answered '1 or 2 days' or more to the question, During the past 30 days,
on how many days did you smoke cigarettes? (i.e., were current smokers.)
Answered '1 or 2 days' or more to the question, During the past 30 days,
on how many days did you smoke cigars, cigarillos, or little cigars?
Answered '1 or 2 days' or more to the question, During the past 30 days,
on how many days did you use chewing tobacco, snuff, or dip, such as Redman,
Answered '1 or 2 days' or more to the question, During the past 7 days, on how
many days were you in the same room with someone who was smoking cigarettes?
Answered '1 day' or more to the question, During the past 30 days, on how
many days did you have 5 or more drinks of alcohol in a row, that is, within
Answered 'Very easy' or 'Sort of easy' to the question, If you wanted to get
some beer, wine, or hard liquor (for example, vodka, whiskey, or gin),
Answered 'Very wrong' or 'Wrong' to the question, How wrong do your parents
feel it would be for you to drink alcohol (beer, wine, or hard liquor) regularly?
82

New Mexico 2013 YRRS
Grades 6-8
I think regular alcohol use by people my age is very wrong
People face great risk from daily alcohol use
Ever rode in a car with a drinking driver
Drug use
Ever used marijuana
First used marijuana before age 11
Current marijuana use
Ever used a prescription drug without a doctor's prescription
Ever used a painkiller to get high
Ever used cocaine
Ever used inhalants
Ever used illegal injection drugs
Sexual Activity
Ever had sexual intercourse
Had sexual intercourse before age 11
Had sexual intercourse with three or more people in lifetime
Used a condom (among those who ever had sexual intercourse)
Answered 'Yes' to the question, Have you ever ridden in a car driven by someone who
had been drinking alcohol?
Answered 'Yes' to the question, Have you ever sniffed glue, or breathed the
contents of spray cans, or inhaled any paints or sprays to get high?
Answered 'Very wrong' or 'Wrong' to the question, How wrong do you think it
is for someone your age to drink alcohol (beer, wine, or hard liquor) regularly?
Answered great risk to the question, How much do you think people risk
harming themselves (physically or in other ways) if they have one or two
Answered 'Yes' to the question, Have you ever used marijuana?
Answered '10 years old' or younger to the question, How old were you when
you tried marijuana for the first time?
Answered '1 or 2 times' or more to the question, During the past 30 days,
how many times did you use marijuana?
Answered 'Yes' to the question, Have you ever taken a prescription drug
(such as OxyContin, Percocet, Vicodin, codeine, Adderall, Ritalin, or Xanax)
without a doctor’s prescription?
Answered 'Yes' to the question, Have you ever used a pain killer to get high, like
Vicodin, OxyContin (also called Oxy or OC), or Percocet (also called Percs)?
Answered 'Yes' to the question, Have you ever used any form of cocaine,
including powder, crack, or freebase?
Answered 'Yes' to the question, Have you ever used a needle to inject any
illegal drug into your body?
Answered 'Yes' to the question, Have you ever had sexual intercourse?
Answered '10 years old' or younger to the question, How old were you when
you had sexual intercourse for the first time?
Answered '3 people' or more to the question, With how many people have
you ever had sexual intercourse?
Answered 'Yes' to the question, The last time you had sexual intercourse,
did you or your partner use a condom?
- among those who -
Answered 'Yes' to the question, Have you ever had sexual intercourse?
83

New Mexico 2013 YRRS
Grades 6-8
Taught about HIV/AIDS
Body Weight and Weight Control
Self-described as slightly or very overweight
Trying to lose weight
Ever fasted to lose weight
Ever vomited or used laxatives to lose weight
Physical Activity
No physical activity in the past week
Physically active five days per week
Daily physical activity
At least one day/week of physical education
Daily physical education at school
Resiliency/Protective Factors
Gets mostly A's in school
Answered 'Yes' to the question, Have you ever vomited or taken laxatives to
lose weight or to keep from gaining weight?
Answered 'Yes' to the question, Have you ever been taught about AIDS or HIV
infection in school?
Answered 'Very overweight' or 'Slightly overweight' to the question, How do
you describe your weight?
Answered 'Lose weight' to the question, Which of the following are you trying
to do about your weight?
Answered 'Yes' to the question, Have you ever gone without eating for 24 hours
or more (also called fasting) to lose weight or to keep from gaining weight?
Unless otherwise noted, responses to other resiliency/protective factor questions refer to
respondents who answered "Pretty much true" or "Very much true" to the questionnaire item
indicated.
Answered 'Mostly A's' to the question, During the past 12 months, how would you
describe your grades in school?
Answered '0 days' to the question, During the past 7 days, on how many days
were you physically active for a total of at least 60 minutes per day? (Add up all
the time you spend in any kind of physical activity that increases your heart rate
and makes you breathe hard some of the time.)
Answered '5 days' or more to the question, During the past 7 days, on how many
days were you physically active for a total of at least 60 minutes per day? (Add up
all the time you spend in any kind of physical activity that increases your heart rate
and makes you breathe hard some of the time.)
Answered '7 days' to the question, During the past 7 days, on how many
days were you physically active for a total of at least 60 minutes per day? (Add up
all the time you spend in any kind of physical activity that increases your heart rate
and makes you breathe hard some of the time.)
Answered '1 day' or more to the question, In an average week when you are
in school, on how many days do you go to physical education (PE) classes?
Answered '5 days' to the question, In an average week when you are in school,
on how many days do you go to physical education (PE) classes?
84

New Mexico 2013 YRRS
Middle School

New Mexico 2013 YRRS
Middle School
Los Alamos County


