
On the deactivation of cobalt-based Fischer-Tropsch synthesiscatalystsCitation for published version (APA):Moodley, D. J. (2008). On the deactivation of cobalt-based Fischer-Tropsch synthesis catalysts. Eindhoven:Technische Universiteit Eindhoven. https://doi.org/10.6100/IR637807
DOI:10.6100/IR637807
Document status and date:Published: 01/01/2008
Document Version:Publisher’s PDF, also known as Version of Record (includes final page, issue and volume numbers)
Please check the document version of this publication:
• A submitted manuscript is the version of the article upon submission and before peer-review. There can beimportant differences between the submitted version and the official published version of record. Peopleinterested in the research are advised to contact the author for the final version of the publication, or visit theDOI to the publisher's website.• The final author version and the galley proof are versions of the publication after peer review.• The final published version features the final layout of the paper including the volume, issue and pagenumbers.Link to publication
General rightsCopyright and moral rights for the publications made accessible in the public portal are retained by the authors and/or other copyright ownersand it is a condition of accessing publications that users recognise and abide by the legal requirements associated with these rights.
• Users may download and print one copy of any publication from the public portal for the purpose of private study or research. • You may not further distribute the material or use it for any profit-making activity or commercial gain • You may freely distribute the URL identifying the publication in the public portal.
If the publication is distributed under the terms of Article 25fa of the Dutch Copyright Act, indicated by the “Taverne” license above, pleasefollow below link for the End User Agreement:www.tue.nl/taverne
Take down policyIf you believe that this document breaches copyright please contact us at:[email protected] details and we will investigate your claim.
Download date: 10. Apr. 2020
On the Deactivation of Cobalt-based Fischer-Tropsch Synthesis Catalysts
PROEFSCHRIFT ter verkrijging van de graad van doctor aan de Technische Universiteit Eindhoven, op gezag van de Rector Magnificus, prof.dr.ir. C.J. van Duijn, voor een commissie aangewezen door het College voor Promoties in het openbaar te verdedigen op donderdag 6 november 2008 om 16.00 uur door Denzil James Moodley geboren te Port Shepstone, Zuid-Afrika
Dit proefschrift is goedgekeurd door de promotor: prof.dr. J.W. Niemantsverdriet Copromotor: dr. J. van de Loosdrecht Denzil J Moodley Technische Universiteit Eindhoven, 2008 A catalogue record is available from the Eindhoven University of Technology Library ISBN: 978-90-386-1399-4 Copyright © 2008 by Denzil J Moodley The research described in this thesis was carried out at the Schuit Institute of Catalysis within the Laboratory of Inorganic Chemistry and Catalysis, Eindhoven University of Technology, The Netherlands. Financial support was provided by Sasol Technology (Pty) Ltd. Cover design by Denzil J Moodley and Paul Verspaget (Verspaget & Bruinink). Front: A slurry bubble column Fischer-Tropsch synthesis reactor. Back: The Oryx Gas-to-Liquid plant in Ras Laffan, Qatar. Permission to use drawings was obtained from Sasol Ltd. Printed at the Universiteitdrukkerij, Eindhoven University of Technology.

Dedicated to my parents

Contents Chapter 1 Introduction and outline 1 Chapter 2 Experimental Techniques 19 Chapter 3 The impact of cobalt aluminate formation on the deactivation 35
of cobalt-based Fischer-Tropsch synthesis catalysts Chapter 4 The formation and influence of carbon on cobalt-based 55
Fischer-Tropsch synthesis catalysts: A Review Chapter 5 Carbon deposition as a deactivation mechanism of 91
cobalt-based Fischer-Tropsch synthesis catalysts under realistic conditions
Chapter 6 Factors that influence carbon formation on Co/Al2O3 catalysts 117 Chapter 7 Opportunities to study the behaviour of cobalt nanoparticles 137
by using model FTS catalysts: Initial results and outlook Summary 157 Samenvatting 161 Acknowledgements 165 List of Publications 169 Curriculum Vitae 171

Chapter 1
Introduction and outline 1.1 Fischer-Tropsch synthesis –a brief historical overview and current
prospects The early 20th century was an exciting period in the development of catalysis. The
development of the ammonia synthesis process marked the start of large scale
heterogeneous catalysis as well as high pressure continuous processing [1]. It was also
during this time that the reaction of mixtures of H2/CO (synthesis gas or syngas) to
hydrocarbons was discovered. Sabatier and Serendens reported in 1902 that methane
can be formed by passing syngas over nickel and cobalt [2]. The production of liquid
hydrocarbons from syngas, over a cobalt oxide catalyst was first claimed, at least
qualitatively, in a patent granted to BASF in 1913 [3]. At that time much research was
conducted towards developing a process for the conversion of Germany’s abundant
coal reserves into fuels and chemicals. The German research efforts yielded two
important discoveries. The first was the direct liquefaction of coal with H2 at about
477 °C and up to 700 bar in the presence of finely divided iron catalysts by Friedrich
Bergius in Rheinau-Mannheim [4]. The second discovery in the 1920’s, was the
production of hydrocarbons (synthol) in measurable amounts from syngas over
alkalized iron catalysts at 100-150 bar, 400-450 ºC by Franz Fischer and Hans
Tropsch at the Kaiser-Wilhelm (presently Max Plank) Institute for Coal Research in
Mülheim [5]. Later, Fischer and Tropsch succeeded in producing mainly
hydrocarbons with cobalt and iron catalysts at much milder conditions (1 bar, 250-
300 ºC) [6]. This was a significant finding as they had hoped to produce liquid
hydrocarbon motor fuels.
The patent rights for the Fischer-Tropsch synthesis (FTS) were acquired by
Ruhrchemie AG in 1934 and soon after, the industrial application of the FT process
Chapter 1
started in Germany [7]. By 1938 there were nine plants in operation utilizing cobalt-
based catalysts at atmospheric pressure, having a combined capacity of about
13 000 bbl/day [8]*. These synthetic fuels were utilised by Germany during the
second World War and there is no doubt that the FTS was both a scientific and
technological success. Even though these plants ceased to operate after the war,
interest in the process remained due to the perception that the reserves of crude oil
were very limited. After this period the commercialisation of the iron catalyst
dominated, with cobalt being sidelined. Ruhrchemie and Lurgi formed an
Arbeitsgemeinschaft (ARGE) that optimised the fixed bed iron catalyst to produce
wax [9]. Based on syngas produced from methane, a gas-to-liquids (GTL), FTS plant
with a capacity of 7 200 bbl/day was built and operated by Hydrocarbon Research
Inc. in Brownsville, Texas, during the 1950s but a sharp increase in the price of
methane caused the plant to be shut down [10].
South Africa, like Germany had no crude oil but plenty of coal that could be
mined cheaply. Based on the world-wide prediction of increasing crude oil prices,
Sasol’s first FTS plant based on coal (approximately 2 200 bbl/day), employing iron-
based catalysts, came on stream in 1955 in Sasolburg, South Africa [11]. However,
even before construction of this plant was completed, the huge oil fields of the Middle
East were discovered and consequently the predicted rise in the price of crude oil did
not materialise and interest in the FTS all but disappeared. The oil embargo by OPEC
(Organization of the Petroleum Exporting Countries) in the early 1970’s led to a huge
increase in the price of oil and, hence, the economics of the FTS in South Africa
improved dramatically which led to the construction of two new and much larger
Sasol coal-to-liquid (CTL) plants which came on stream in 1980 and 1982 in
Secunda, South Africa. [11]. This period also marked the “rediscovery” of cobalt and
much research efforts were put into the development of new cobalt catalysts for
application in low temperature FTS [12]. Additionally there was a focus on
converting the largely untapped natural gas reserves into transportable liquid
products. In 1993, a 22 000 bbl/day GTL plant went into full production at Mossgas
(now PetroSA) in Mossel Bay, South Africa using the licensed iron catalyst and
circulating fluidised bed (i.e. CFB) reactor technology from Sasol [11]. A few months
* 1 bbl/day is approximately equivalent to 50 tons/yr
2
Introduction and outline
later Shell began operating a 12 000 bbl/day plant in Bintulu, Malaysia that converted
natural gas into high quality synthetic oil products and speciality chemicals using
cobalt-based catalysts [13]. The latest large scale GTL plant, employing cobalt
catalysts, in operation since 2007, is the Oryx-GTL plant in Qatar, with a nominal
capacity of 34 000 bbl/day, which is a joint venture between Sasol and Qatar
Petroleum [14].
Many companies have invested heavily into developing propriety FTS technology
with a preference towards cobalt-based FTS catalysts, either for their own use or for
licensing [15, 16]. These include Shell [13, 17], ExxonMobil [18], BP [19],
Syntroleum [20], Rentech [21], ENI/IFP/AXENS [22] and ConocoPhilips [23]. Sasol
is by far the largest producer of synthetic fuels and chemicals via the FTS and has
commercial experience with both CTL and GTL technology. The total production
from Sasol’s plants including licensed technology is in excess of 200 000 bbl/day.
Remarkably, today, 80 years after Fischer and Tropsch made their discovery there is
renewed interest in the process that bears their name. There are various factors that
have contributed to this:
• The rising price of crude oil. At the time of writing the oil price is over $100
barrel. This fact makes the production of synthetic fuels from alternative
sources attractive.
• Legislative constraints on fuel quality. Synthetic fuels, both produced from
natural gas and coal are much cleaner than those derived from crude oil, while
still being of a high quality. For example CTL diesel [24] has a sulphur
content of less than 5 ppm, aromatic content of less than 1% and a cetane
number of more than 70.
• Geopolitical reasons. Some countries may want to reduce their dependence on
crude oil. The United States, heavily dependent on the Middle East for crude
oil, has at its disposal the largest coal reserves in the world estimated at 270
billion recoverable tons [25]. CTL technology may play an important part in
producing synthetic fuels in the future.
• The China and India factor. These countries are home to more than a third of
the world’s population and are experiencing major economic growth. Their
3
Chapter 1
energy needs will increase drastically in the future. Both have large amounts
of reserves of coal (combined amount of 200 billion tons) that can be
converted to synthetic fuels. It is interesting to note that Sasol has announced
plans to set-up CTL plants in both India and China in the near future [26, 27].
• Biomass-to-liquids (BTL) and the carbon neutral economy. Biomass is the
only long-term carbon containing renewable for liquid fuels or for
synthesizing chemicals. The European Union plans to increase the fraction of
biogenic fuels from 2% in 2005 to 8% in 2020 [28]. The FTS can be used to
produce synfuels from gasified biomass. In 2007, Choren, a bioenergy
company built a 300 bbl/day BTL plant that uses Shell’s FTS technology to
transform biomass to biodiesel [29].
1.2 Overview of Gas-to-liquids (GTL) technology
Gas-to-liquids is the process of converting natural gas into transportable liquids and
has gained considerable interest in the last decade. There are several key factors that
drive growth in the GTL industry [16, 30, 31]:
• The need to monetize the large amount of existing stranded natural gas
reserves.
• The market demand for cleaner fuels and new cheaper chemical feedstocks.
• Technological development by existing and new role players which is leading
to cost effectiveness of FTS technology from development of more active
catalysts and improved reactor systems.
• Increased interest from gas-rich host countries.
• The need to diversify economies and to create new employment opportunities.
The GTL process can be divided into three steps; syngas generation, syngas
conversion and hydroprocessing [30]. Syngas generation typically accounts for more
than 50% of the capital expenditure in the process [32]. The methane molecule is very
stable and the reaction is very endothermic and therefore a high energy input is
required. Syngas can be generated from steam reforming, partial oxidation,
autothermal reforming or combined two step reforming of methane [30]. It should be
noted that the air separation unit (ASU) contributes to a large part of the cost of
4
Introduction and outline
syngas generation. Syngas conversion is at the heart of the process and the aim here is
to produce paraffinic wax using low temperature FTS, preferably on cobalt catalysts.
The high activity of cobalt combined with the exothermicity of the reaction makes
heat removal a key issue in this step. In the hydroprocessing step the wax is
hydroisomerised/hydrocracked to produce high quality diesel (C11-C18) and naphtha
(C5-C10). As mentioned before, diesel produced via GTL is virtually free of sulphur
and aromatic compounds, has a high cetane number and low particulate, NOx and CO
emissions [31].
There are currently two commercial GTL plants that employ cobalt-based FTS
catalysts. Since 1993, Shell has operated the Shell Middle Distillate Synthesis
(SMDS) plant based on offshore methane in Bintulu, Malaysia, which has a current
capacity of 14 700 bbl/day [13,17, 33]. The syngas is generated by the non-catalytic
partial oxidation of methane at high pressures and temperatures around 1500 ºC. The
FTS step is carried out in multi-tubular fixed bed reactors using a supported cobalt-
based catalyst. There are a large number of narrow tubes per reactor, which help to
cope with the reaction heat released [32]. Operation is at about 30 bar and 200-230 ºC
and the objective is to produce high quality waxes [32]. The waxes are worked-up
either to produce different wax specialities or hydrocracked over a catalyst to high
quality diesel and kerosene (C10-C13) fuels.
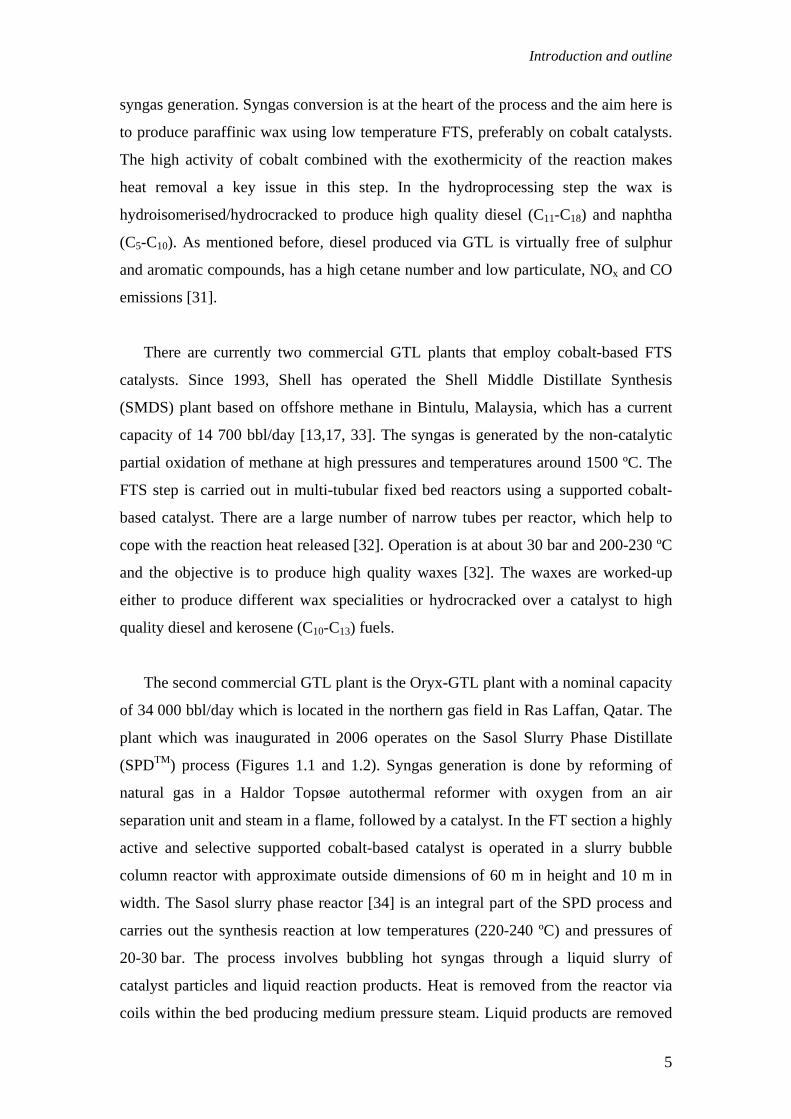
The second commercial GTL plant is the Oryx-GTL plant with a nominal capacity
of 34 000 bbl/day which is located in the northern gas field in Ras Laffan, Qatar. The
plant which was inaugurated in 2006 operates on the Sasol Slurry Phase Distillate
(SPDTM) process (Figures 1.1 and 1.2). Syngas generation is done by reforming of
natural gas in a Haldor Topsøe autothermal reformer with oxygen from an air
separation unit and steam in a flame, followed by a catalyst. In the FT section a highly
active and selective supported cobalt-based catalyst is operated in a slurry bubble
column reactor with approximate outside dimensions of 60 m in height and 10 m in
width. The Sasol slurry phase reactor [34] is an integral part of the SPD process and
carries out the synthesis reaction at low temperatures (220-240 ºC) and pressures of
20-30 bar. The process involves bubbling hot syngas through a liquid slurry of
catalyst particles and liquid reaction products. Heat is removed from the reactor via
coils within the bed producing medium pressure steam. Liquid products are removed
5
Chapter 1
from the reactor and the liquid hydrocarbon wax is separated from the catalyst. The
gas stream from the top of the reactor is cooled to recover light hydrocarbons and
reaction water. There are several advantages of using slurry bubble column over fixed
bed reactors and these include [35, 36, 37]:
• Isothermal, gradientless reactor with better temperature control/heat removal
due to large liquid volume;
• low maintenance/operating cost due in part to simple design and absence of
moving components;
• lower pressure drop , < 2 bar compared to 3-7 bar for a fixed bed;
• ability to use fine catalyst particles (< 300 µm) allowing large surface area per
unit volume and better liquid–solid mass transfer;
• higher yield per reactor volume and higher potential for scaling up; and
• higher on-line factor where the catalyst can be added and removed
continuously, allowing longer runs without reactor shutdown.
In the product upgrading step, the liquid hydrocarbon is hydrocracked to produce
diesel and naphtha using Chevron Isocracking™ technology.
It has been estimated that GTL (using FTS) is profitable at an oil price of
around $30 per barrel [38], but this is a moving target given rapidly increasing
engineering and construction costs. The oil price has continued increasing steadily for
the last few years and is now well above $100 per barrel. Additionally, it is estimated
that the world's vast natural gas reserves, estimated to have an oil equivalent of at
least 1 000 billion barrels, could meet human needs for at least another 60 years [31].
Significantly, about half of these reserves are uncommitted, which makes them ideal
for monetisation through GTL technology [31]. It is therefore believed that GTL
technology has a significant role to play in the global energy future. Many
multinational companies have shown interest in GTL and some have announced plans
to build plants. Table 1.1 shows the current and proposed GTL plants. The largest
plants will be built in Qatar, which has 15% of the world’s gas reserves [39].
6
Introduction and outline
Air separation unit
Natural gas
Oxygen
AutothermalReformer
Syngas
Sasol SlurryPhase DistillateTM
Reactor
Product upgrading
GTL diesel and GTL Naphtha
Figure 1.1 An overview of the Sasol Slurry Phase Distillate (SPDTM) process [31].
(c) (e) (b) (d) (d) (a)
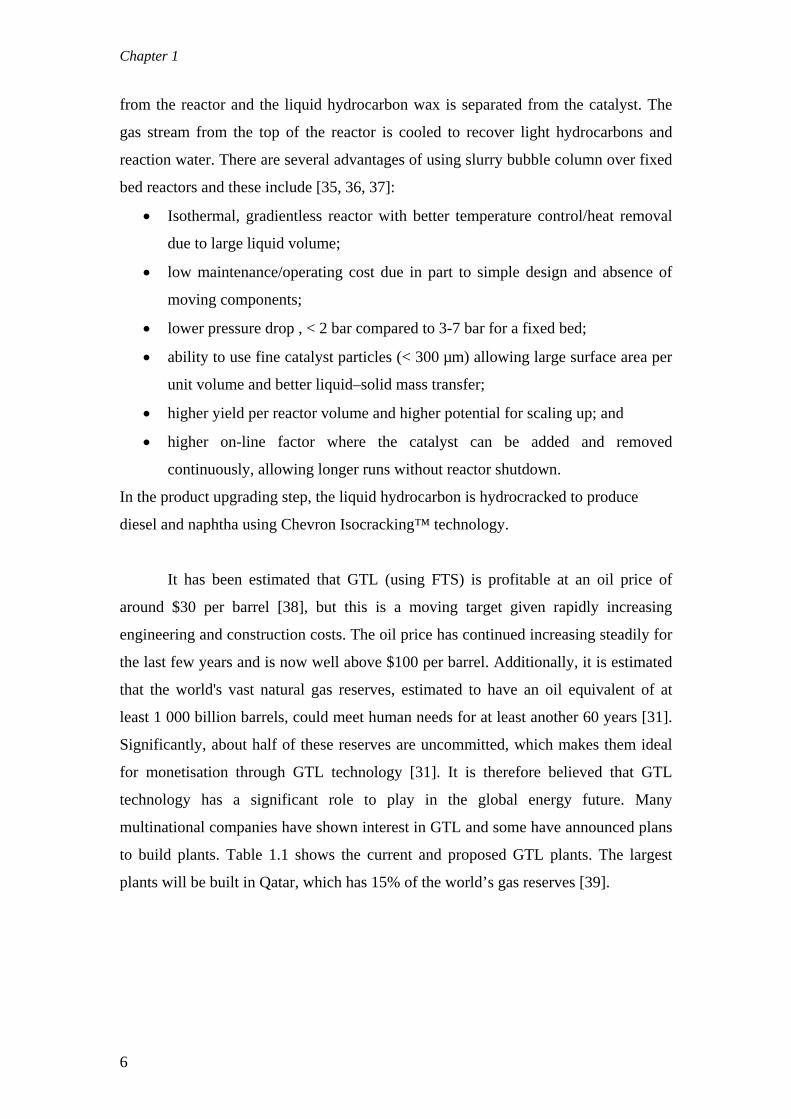
Figure 1.2 The Oryx-GTL plant in Ras Laffan, Qatar with a nominal capacity of
34 000 bbl/day (a) Air separation units (b) Gas superheater (c) Autothermal
reformers (d) Slurry bubble column FTS reactors (e) Catalyst hoppers.
7
Chapter 1
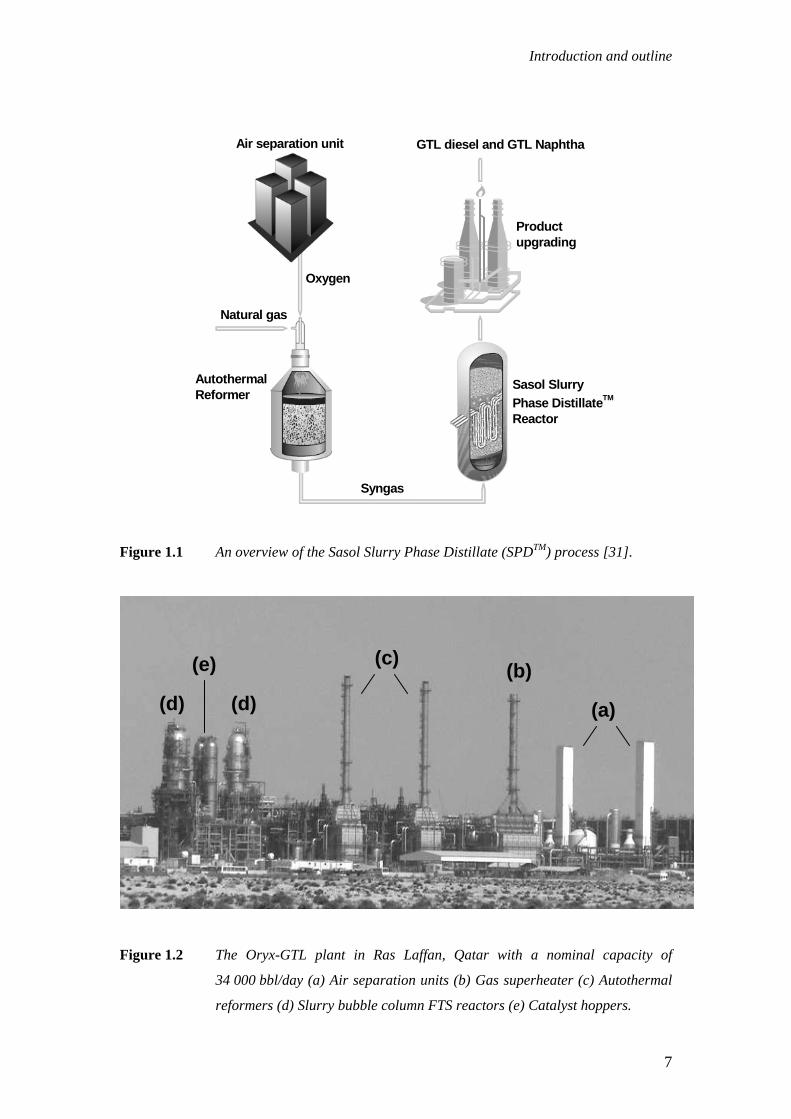
Table 1.1 Currently operating and recently announced FTS plants based on natural
gas, together with the location, companies and technologies involved.
Country
(Location)
Owner Technology Production
(bbl/day)
Start-up
South Africa (Mossel Bay)
PetroSA
Sasol CFB (Fe)
36 000
1992
Malaysia (Bintulu)
Shell SMDS Fixed bed (Co)
14 700 1993
South Africa (Sasolburg)
Sasol Sasol Slurry and Arge technology
(Fe)
5 000 (solely chemicals)
2004 (Changed over from coal to
natural gas)
Qatar (Ras Laffan)
Sasol/Qatar Petroleum
(Oryx-GTL)
Sasol SPD Slurry bed (Co)
34 000 2007
Nigeria (Escarvaros)
NNPC/Chevron (E-GTL)
Sasol SPD Slurry bed (Co)
34 000 2009 (Construction in
progress)
Qatar (Ras Laffan)
Qatar Petroleum/Shell
(Pearl)
SMDS Fixed bed (Co)
70 000 2009 (expansion to 140 000
bbl/day in 2011)
Trinidad (Pointe-à-
Pierre)
World GTL/ Petrotrin
Use of existing multi-tubular
fixed bed reactors from gas-to-
methanol plants (Co)
2 250 Production expected in last
quarter 2008
1.3 FTS catalysts
The overall process in FTS is comprised of a network of the elementary bond-
breaking and bond-formation steps. These include CO and H2 dissociation as well as
hydrogenation and chain growth (carbon coupling) on the metal surface. The balance
of the bond-breaking and bond-formation processes on the metal surface dictates the
choice of metal. Transition metals to the left in the periodic table will easily dissociate
CO, but the products, i.e., surface carbon and oxygen, are too strongly bound to the
surface thus blocking subsequent hydrogenation and carbon coupling reactions.
8
Introduction and outline
Transition metals to the right, on the other hand, are not active enough to dissociate
CO. The optimal metals are those which can promote CO dissociation, along with a
balanced degree of surface carbon hydrogenation and carbon coupling in order to
produce longer chain hydrocarbon products.
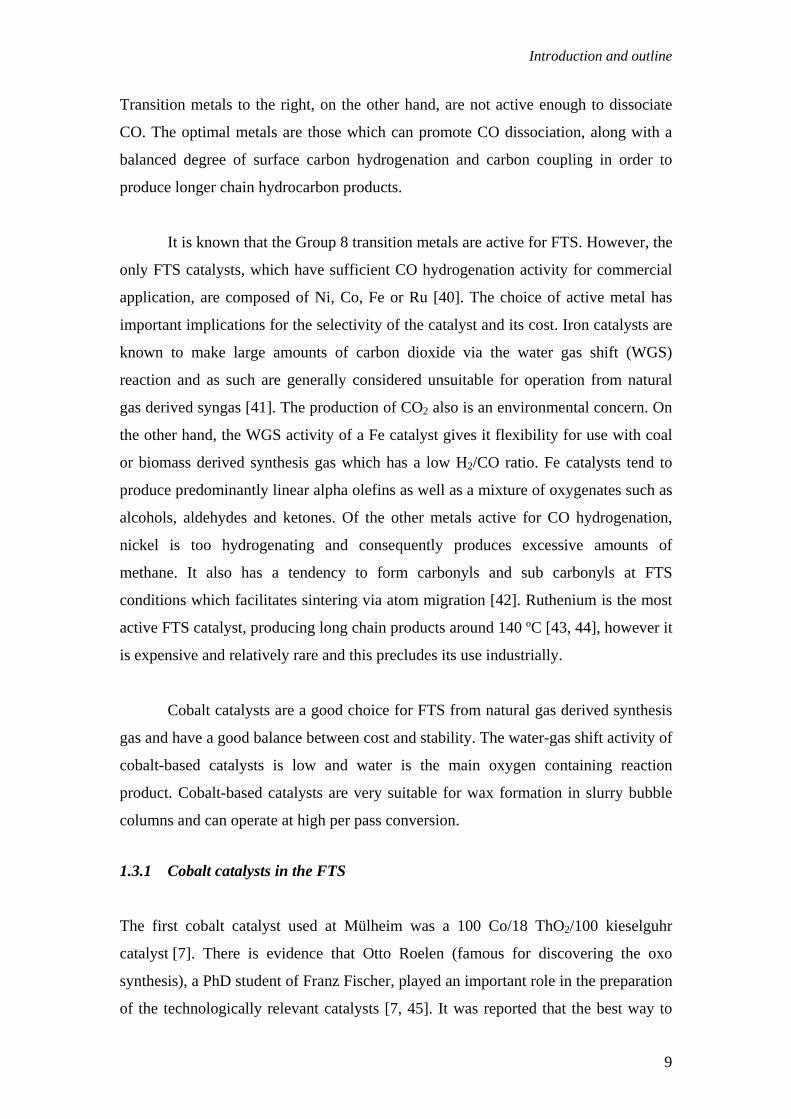
It is known that the Group 8 transition metals are active for FTS. However, the
only FTS catalysts, which have sufficient CO hydrogenation activity for commercial
application, are composed of Ni, Co, Fe or Ru [40]. The choice of active metal has
important implications for the selectivity of the catalyst and its cost. Iron catalysts are
known to make large amounts of carbon dioxide via the water gas shift (WGS)
reaction and as such are generally considered unsuitable for operation from natural
gas derived syngas [41]. The production of CO2 also is an environmental concern. On
the other hand, the WGS activity of a Fe catalyst gives it flexibility for use with coal
or biomass derived synthesis gas which has a low H2/CO ratio. Fe catalysts tend to
produce predominantly linear alpha olefins as well as a mixture of oxygenates such as
alcohols, aldehydes and ketones. Of the other metals active for CO hydrogenation,
nickel is too hydrogenating and consequently produces excessive amounts of
methane. It also has a tendency to form carbonyls and sub carbonyls at FTS
conditions which facilitates sintering via atom migration [42]. Ruthenium is the most
active FTS catalyst, producing long chain products around 140 ºC [43, 44], however it
is expensive and relatively rare and this precludes its use industrially.
Cobalt catalysts are a good choice for FTS from natural gas derived synthesis
gas and have a good balance between cost and stability. The water-gas shift activity of
cobalt-based catalysts is low and water is the main oxygen containing reaction
product. Cobalt-based catalysts are very suitable for wax formation in slurry bubble
columns and can operate at high per pass conversion.
1.3.1 Cobalt catalysts in the FTS
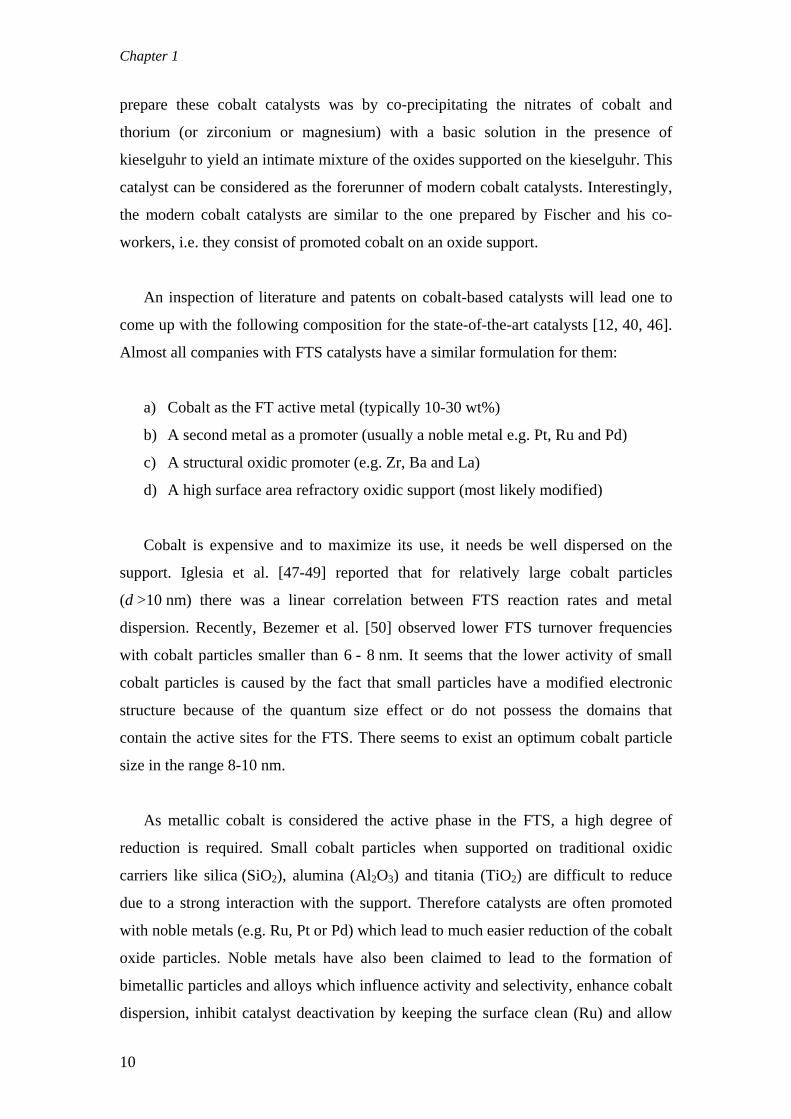
The first cobalt catalyst used at Mülheim was a 100 Co/18 ThO2/100 kieselguhr
catalyst [7]. There is evidence that Otto Roelen (famous for discovering the oxo
synthesis), a PhD student of Franz Fischer, played an important role in the preparation
of the technologically relevant catalysts [7, 45]. It was reported that the best way to
9
Chapter 1
prepare these cobalt catalysts was by co-precipitating the nitrates of cobalt and
thorium (or zirconium or magnesium) with a basic solution in the presence of
kieselguhr to yield an intimate mixture of the oxides supported on the kieselguhr. This
catalyst can be considered as the forerunner of modern cobalt catalysts. Interestingly,
the modern cobalt catalysts are similar to the one prepared by Fischer and his co-
workers, i.e. they consist of promoted cobalt on an oxide support.
An inspection of literature and patents on cobalt-based catalysts will lead one to
come up with the following composition for the state-of-the-art catalysts [12, 40, 46].
Almost all companies with FTS catalysts have a similar formulation for them:
a) Cobalt as the FT active metal (typically 10-30 wt%)
b) A second metal as a promoter (usually a noble metal e.g. Pt, Ru and Pd)
c) A structural oxidic promoter (e.g. Zr, Ba and La)
d) A high surface area refractory oxidic support (most likely modified)
Cobalt is expensive and to maximize its use, it needs be well dispersed on the
support. Iglesia et al. [47-49] reported that for relatively large cobalt particles
(d >10 nm) there was a linear correlation between FTS reaction rates and metal
dispersion. Recently, Bezemer et al. [50] observed lower FTS turnover frequencies
with cobalt particles smaller than 6 - 8 nm. It seems that the lower activity of small
cobalt particles is caused by the fact that small particles have a modified electronic
structure because of the quantum size effect or do not possess the domains that
contain the active sites for the FTS. There seems to exist an optimum cobalt particle
size in the range 8-10 nm.
As metallic cobalt is considered the active phase in the FTS, a high degree of
reduction is required. Small cobalt particles when supported on traditional oxidic
carriers like silica (SiO2), alumina (Al2O3) and titania (TiO2) are difficult to reduce
due to a strong interaction with the support. Therefore catalysts are often promoted
with noble metals (e.g. Ru, Pt or Pd) which lead to much easier reduction of the cobalt
oxide particles. Noble metals have also been claimed to lead to the formation of
bimetallic particles and alloys which influence activity and selectivity, enhance cobalt
dispersion, inhibit catalyst deactivation by keeping the surface clean (Ru) and allow
10
Introduction and outline
easier regeneration of the cobalt surface [51]. The noble metal promoter is usually
kept around 0.1-0.5 wt% due to cost but also due to the fact that higher amounts may
cause blocking of the cobalt if intimate mixing of the metals occurs. Structural
promoters affect the formation and stability of the active phase of a catalyst material.
It has been shown for Co/SiO2 catalysts that promotion with Zr results in a decreased
cobalt-silica interaction leading to a higher degree of reduction of cobalt and increase
in the metallic atoms on the surface [52, 53]. Zr promotion of Co/Al2O3 catalysts is
claimed to prevent the formation of cobalt aluminate [54].
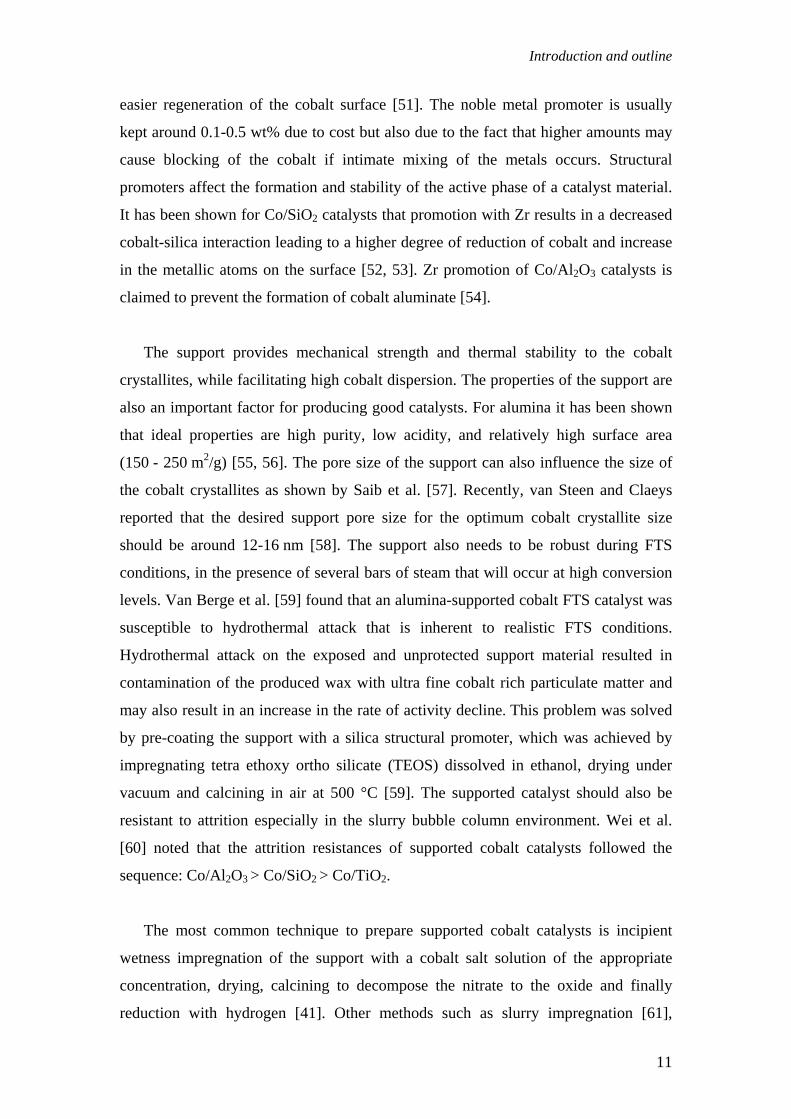
The support provides mechanical strength and thermal stability to the cobalt
crystallites, while facilitating high cobalt dispersion. The properties of the support are
also an important factor for producing good catalysts. For alumina it has been shown
that ideal properties are high purity, low acidity, and relatively high surface area
(150 - 250 m2/g) [55, 56]. The pore size of the support can also influence the size of
the cobalt crystallites as shown by Saib et al. [57]. Recently, van Steen and Claeys
reported that the desired support pore size for the optimum cobalt crystallite size
should be around 12-16 nm [58]. The support also needs to be robust during FTS
conditions, in the presence of several bars of steam that will occur at high conversion
levels. Van Berge et al. [59] found that an alumina-supported cobalt FTS catalyst was
susceptible to hydrothermal attack that is inherent to realistic FTS conditions.
Hydrothermal attack on the exposed and unprotected support material resulted in
contamination of the produced wax with ultra fine cobalt rich particulate matter and
may also result in an increase in the rate of activity decline. This problem was solved
by pre-coating the support with a silica structural promoter, which was achieved by
impregnating tetra ethoxy ortho silicate (TEOS) dissolved in ethanol, drying under
vacuum and calcining in air at 500 °C [59]. The supported catalyst should also be
resistant to attrition especially in the slurry bubble column environment. Wei et al.
[60] noted that the attrition resistances of supported cobalt catalysts followed the
sequence: Co/Al2O3 > Co/SiO2 > Co/TiO2.
The most common technique to prepare supported cobalt catalysts is incipient
wetness impregnation of the support with a cobalt salt solution of the appropriate
concentration, drying, calcining to decompose the nitrate to the oxide and finally
reduction with hydrogen [41]. Other methods such as slurry impregnation [61],
11
Chapter 1
kneading [62] and deposition-precipitation [63] of cobalt compounds have also been
reported. In order to prepare a catalyst with good activity and dispersion, each of these
preparation steps needs to be optimised. The conditions during calcination of
impregnated cobalt precursors have a significant influence on the performance of the
final catalyst. Van de Loosdrecht et al. [64] reported high metallic cobalt surface areas
and high catalytic activities when the concentration of nitrogen oxides and water was
kept low during calcination by employing a high flow rate. Similarly, the flow rate
during reduction should be kept high to avoid high partial pressures of the water
product which results in sintering [12, 41]. High calcination temperatures (> 350 ºC)
result in the diffusion of cobalt ions into the support, producing irreducible
compounds [65], while it was reported that too high reduction temperatures
(> 365 ºC) for the original Co/ThO2/Kieselguhr catalyst caused extensive loss of
surface area due to sintering [66].
1.3.2 Deactivation of cobalt-based catalysts
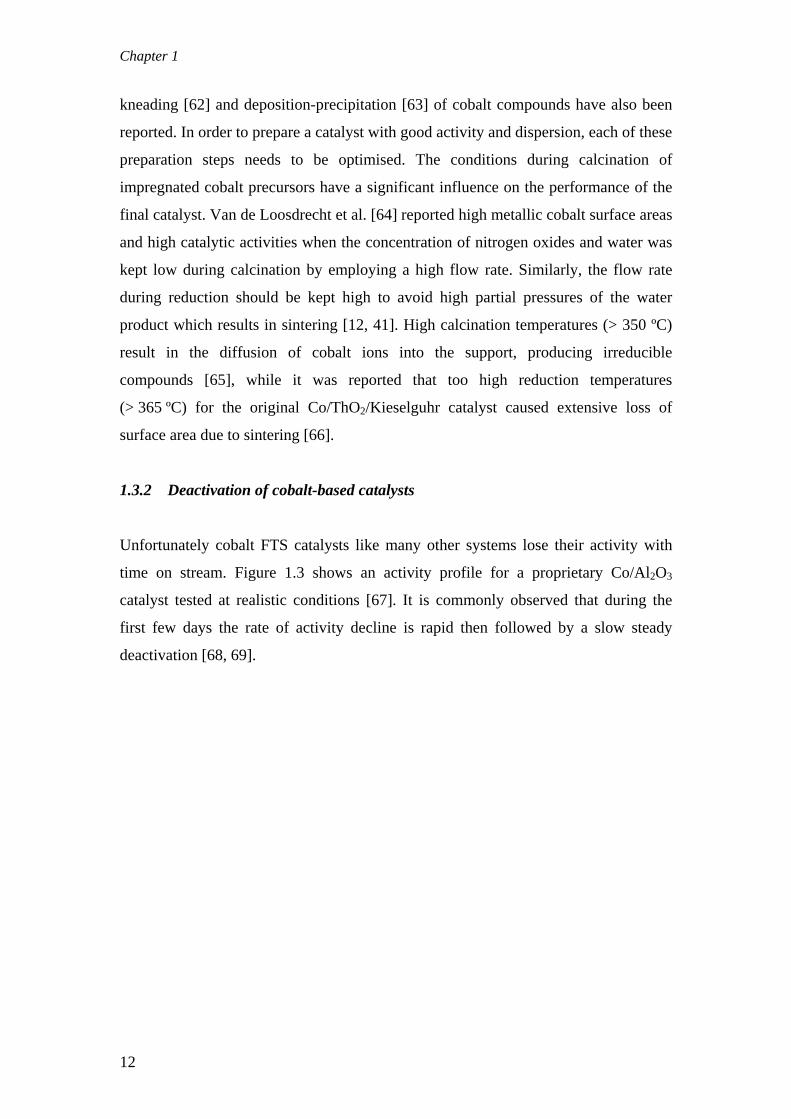
Unfortunately cobalt FTS catalysts like many other systems lose their activity with
time on stream. Figure 1.3 shows an activity profile for a proprietary Co/Al2O3
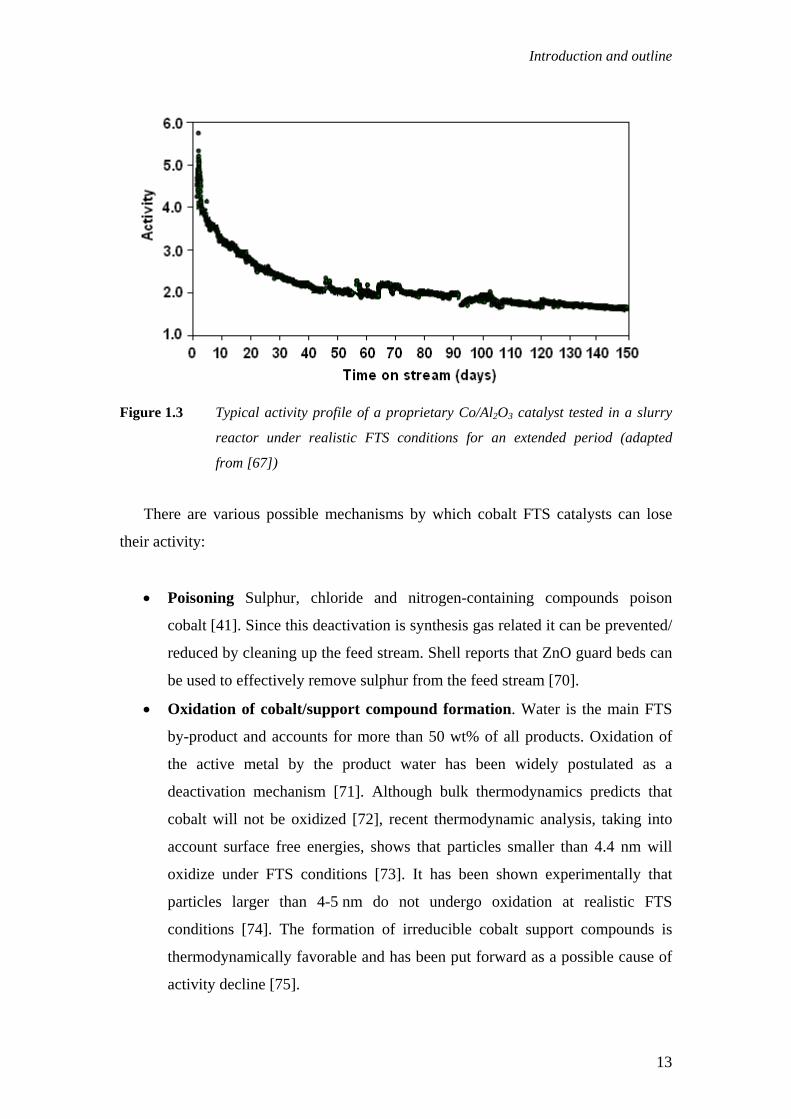
catalyst tested at realistic conditions [67]. It is commonly observed that during the
first few days the rate of activity decline is rapid then followed by a slow steady
deactivation [68, 69].
12
Introduction and outline
Figure 1.3 Typical activity profile of a proprietary Co/Al2O3 catalyst tested in a slurry
reactor under realistic FTS conditions for an extended period (adapted
from [67])
There are various possible mechanisms by which cobalt FTS catalysts can lose
their activity:
• Poisoning Sulphur, chloride and nitrogen-containing compounds poison
cobalt [41]. Since this deactivation is synthesis gas related it can be prevented/
reduced by cleaning up the feed stream. Shell reports that ZnO guard beds can
be used to effectively remove sulphur from the feed stream [70].
• Oxidation of cobalt/support compound formation. Water is the main FTS
by-product and accounts for more than 50 wt% of all products. Oxidation of
the active metal by the product water has been widely postulated as a
deactivation mechanism [71]. Although bulk thermodynamics predicts that
cobalt will not be oxidized [72], recent thermodynamic analysis, taking into
account surface free energies, shows that particles smaller than 4.4 nm will
oxidize under FTS conditions [73]. It has been shown experimentally that
particles larger than 4-5 nm do not undergo oxidation at realistic FTS
conditions [74]. The formation of irreducible cobalt support compounds is
thermodynamically favorable and has been put forward as a possible cause of
activity decline [75].
13
Chapter 1
• Sintering of the active phase. During the FTS, cobalt nanoparticles may
agglomerate and this will result in loss of active surface area [76, 77]. This
process may be facilitated by the presence of water.
• Fouling by wax. During low temperature FTS over cobalt-based catalysts
long chain waxes are produced. One of the plausible reasons for the activity
decline is the build up on the surface and in the catalyst pores of these waxes
which inhibit adsorption and slow down diffusion rates [41, 78].
• Deposition of inert/deactivating carbon phases. It has been previously
reported that inert carbon phases can form during extended runs and cause
blocking of the active phase [79]. The formation of bulk cobalt carbide may
also result in a decrease in activity [80].
• Surface reconstruction. Adsorbates may strongly chemisorb on the metal
surface and cause the surface to rearrange to a more stable configuration [81].
Large scale changes during model FTS conditions have been observed on a
flat cobalt surface which has been ascribed to the intrusive nature of CO [82].
It is interesting to note that many of the deactivation mechanisms that plague
modern cobalt catalysts were already identified for the original Co/ThO2/kieselguhr
catalyst operating in the first commercial plants in the late 1930’s. According to
Roelen [83], deactivation was due to sulphur, pore blocking by heavy wax, carbon
deposition and sintering. Additionally, he noted that oxidation of cobalt did not occur
over a period of six months nor was there any cobalt silicate formation.
1.4 Outline of the Thesis
Cobalt catalysts are the preferred choice of catalysts for GTL processes. Due to the
high cost of cobalt high catalyst stability is required. An understanding of the
deactivation mechanisms at play is important as this allows one to tailor process
conditions to ensure extended catalyst lifetimes. The knowledge of deactivation
mechanisms could also be used to rationally design new catalysts with enhanced
activity and stability. The research described in this thesis involved investigating the
deactivation of cobalt-based FTS catalysts. Attention was focused on cobalt aluminate
formation and carbon deposition as possible deactivation mechanisms.
14
Introduction and outline
• Chapter 3 focuses on cobalt aluminate formation during FTS. Catalyst
samples were drawn from a demonstration unit slurry reactor operating under
realistic FTS conditions (230 oC, 20 bar, % (H2+CO) conversion between 50-
70 %, feed gas composition of ca. 50 vol. % H2 and 25 vol. % CO) and
quantitatively characterized with X-ray adsorption near edge spectroscopy
(XANES). The influence of varying water partial pressures, in laboratory scale
reactors, on the formation of cobalt aluminate was investigated with XANES
and X-ray photoelectron spectroscopy (XPS).
• A review (Chapter 4) on carbon deposition on cobalt-based FTS catalysts was
undertaken to bring together existing open and patent literature on this topic to
provide a clearer picture on the formation and influence of carbon on cobalt-
based FTS catalysts.
• In Chapter 5 samples of cobalt catalysts tested in a demonstrated unit slurry
reactor, over an extended period, were characterized for carbon deposits. This
involved wax extraction of the catalysts, then applying temperature
programmed (TP) techniques to study the accumulation of the carbon. The
location of carbon deposits was also studied via a combination of energy-
filtered transmission electron microscopy (EFTEM), H2 chemisorption and
low energy ion scattering (LEIS).
• As a follow up on the topic of carbon deposition, Chapter 6 involved an
investigation into the factors that influence carbon deposition on cobalt-based
catalysts. We report on the impact of temperature and H2/CO ratio on the
build-up of carbonaceous species on Co/Pt/Al2O3 catalysts using both model
and realistic FTS tests. The influence of upset conditions on carbon deposition
and its subsequent effect on catalyst structure was also investigated.
• A strong point of Chapter 3 and 5 is that samples of the catalyst studied were
taken from a large scale reactor at realistic conditions, which makes the results
industrially relevant. However, real systems are complex and often to obtain
fundamental information, the complexity needs to be reduced using model
catalysts. Chapter 7 discusses some preliminary results of new potential
techniques that are able to shed light on the reactivity and morphology of
cobalt nanoparticles by using both spherical and flat model catalysts.
15
Chapter 1
1.5 References
[1] I. Chorkendorff, J.W. Niemantsverdriet, Concepts of Modern Catalysis and Kinetics, Wiley-
VCH, Weinheim, 2007. [2] P. Sabatier, J.B. Senderens, J. Soc. Chem. Ind. 21 (1902) 504. [3] A. Mittasch, C. Schneider, German Patent 293 787 (1913), to BASF. [4] F. Bergius, J. Billwiller, German Patent 301 231 (1919). [5] F. Fischer, H. Tropsch, Brennstoff-Chem. 4 (1923) 276. [6] F. Fischer, H. Tropsch, Brennstoff-Chem. 7 (1926) 97. [7] A.N. Stranges, “Germany’s Synthetic Fuel industry 1927-45”, Presentation at AIChE 2003,
New Orleans, LA. (www.fischertropsch.org). [8] N.R. Golumbic, Review of Fischer-Tropsch and Related Processes for Synthetic Liquid Fuel
Production, Information circular, 1947 (www.fischertropsch.org). [9] M. Dry, in: J. Anderson, M. Boudard (Eds.), Catalysis Science and Technology, Vol. 1,
Springer, Berlin, 1984. [10] M.E. Dry, Catal. Today 71 (2002) 227. [11] M.E. Dry, Endeavour 8 (1984) 2. [12] C.H. Bartholomew “History of Cobalt Catalyst Design for Fischer-Tropsch Synthesis”
Presentation at AIChE 2003, New Orleans, LA (www.fischertropsch.org). [13] H.M.V. van Wechem, M.M.G. Senden, Stud. Surf. Sci. Catal. 81 (1994) 43. [14] Petroleum Review, 60 (714), July 2006, p. 7 [15] J. Zhang, J. Chen, Y. Li, Y. Sun, J. Nat. Gas Chem. 11 (2002) 99. [16] T.H. Fleisch, R.A. Sills, M.D. Briscoe, J. Nat. Gas Chem. 11 (2002) 1. [17] J. Eilers, S.A. Posthuma, S.T. Sie, Catal. Lett. 7 (1990) 253. [18] B. Eisenberg, R.A. Fiato, Stud. Surf. Sci. Catal. 119 (1998) 943. [19] J.J.H.M. Font Freide, T.D. Gamlin, C. Graham, J.R. Hensman, B. Nay, C. Sharp, Top. Catal.
26 (2003) 3. [20] K.B. Arcuri, K.L. Agee, M.A. Agee, United States Patent 6 262 131 (2001), to Syntroleum. [21] E. Kintisch, Science 320 (2008) 306. [22] R. Zennaro, Oil Gas 2 (2007) 88. [23] R.L. Espinoza, Y. Jin, J. Kandaswamy, N. Srinivasan, United States Patent 7 012 104 (2006),
to ConocoPhilips. [24] P.W. Schwaberg, I.S. Myburgh, J.J. Botha, P.N. Roets, L.P. Dancuart, in: Proc. of the 11th
World Clean Air Congress, Durban, South Africa, September 1998. [25] “International Data: Coal”; Energy Information Agency, Washington, DC, 2007
(http://www.eia.doe.gov/pub/international/iea2003/table82.xls). [26] E. van de Venter, Sasol Coal-to-Liquids Developments, Presentation to Gasification
Technologies Council Conference, October 2005, San Francisco. [27] J. Sarkar, Platt's International Coal Report 840 (2007) 17. [28] H. Leibold, A. Hornung, H. Seifert, Powder Tech. 18 (2008) 265. [29] Chemische Rundschau 11 (2006) 21. [30] A.C. Vosloo, Fuel Proc. Tech. 71 (2001) 149. [31] Sasol GTL Brochure (www.sasol.com). [32] M.E. Dry, in: I.T. Horvath (Ed.), Encyclopedia of Catalysis, Vol. 3, Wiley, New York, 2003.
p. 347. [33] Information on SMDS in Bintulu (http://www.shell.com). [34] B. Jager, P. van Berge, A.P. Steynberg, Stud. Surf. Sci. Catal. 136 (2001) 63. [35] J.W.A. de Swart, R. Krishna, S.T. Sie. Stud. Surf. Sci. Catal. 107 (1997) 217. [36] B. Jager, R. Espinoza. Catal. Today 23 (1995) 17. [37] L. Sehabiague, R. Lemoine, A. Behkish, Y.J. Heintz, M. Sanoja, R. Oukaci, B.I. Morsi, J.
Chin. Inst. Chem. Eng. 39 (2008) 169. [38] O. van Vliet, A. Faaij, W. Turkenburg, “Developments in Fischer-Tropsch diesel in a WTW
chain perspective” Presentation at the International Conference on Transport and Environment, Milan , March 2007.
[39] PennWell Corporation, Oil Gas J.104 (2006) 47. [40] B.H. Davis, Ind. Eng. Chem. Res. 46 (2007) 8938.[41] M.E. Dry. Stud. Surf. Sci. Catal. 136 (2001) 63. [42] M. Agnelli, M. Kolb, C. Mirodatos, J. Catal. 148 (1994) 9. [43] M. Vannice, J Catal. 37 (1975) 462.
16
Introduction and outline
[44] C. Xiao, Z. Cai, T.Wang, Y. Kou, N. Yan, Angew. Chem. Int. Edit. 47 (2008) 746. [45] B. Cornils, W.A. Herrmann, M. Rasch, Angew. Chem. Int. Edit. 33 (1994) 2144. [46] R. Oukaci, A.H. Singleton, J.G. Goodwin Jr., Appl. Catal. A 186 (1999) 129. [47] E. Iglesia, Appl. Catal. A 161 (1997) 59. [48] E. Iglesia, S.C. Reyes, R.J. Madon, S.L. Soled, Adv. Catal. 39 (1993) 221. [49] S.L. Soled, E. Iglesia, R.A. Fiato, J.E. Baumgartner, H. Vroman, S. Miseo, Top. Catal. 26
(2003) 101. [50] G.L. Bezemer, J.H. Bitter, H.P.C.E. Kuipers, H. Oosterbeek, J.E. Holewijn, X. Xu, F.
Kapteijn, A.J. van Dillen, K.P. de Jong, J. Am. Chem. Soc. 128 (2006) 3956. [51] F. Morales, B.M. Weckhuysen, Catalysis (Royal Society of Chemistry) 19 (2006) 1.[52] A. Feller, M. Claeys, E. van Steen, J. Catal. 185 (1999) 120. [53] G.R. Moradi, M.M. Basir, A. Taeb, A. Kiennemann, Catal. Comm. 4 (2003) 27. [54] H. Xiong, Y. Zhang, K. Liew, J. Li, J. Mol. Catal. A 231 (2005) 145. [55] H. Beuther, C.L. Kibby, T.P. Kobylinski, R.B. Pannell, United States Patents 4 413 064
(1983); 4 493 905 (1985); 4 585 798 (1986), to Gulf Research & Development Company and 4 605 680 (1986); 4 613 624 (1986), to Chevron Research Company.
[56] T.P. Kobylinski, C.L. Kibby, R.B. Pannell, E.G. Eddy, United States Patents 4 605 676 (1986) and 4 605 679 (1986), to Chevron Research Company.
[57] A.M. Saib, M. Claeys, E. van Steen, Catal. Today 71 (2002) 395. [58] E. van Steen, M. Claeys, Chem. Eng. Technol. 31 (2008) 655. [59] P.J. van Berge, J. van de Loosdrecht, E.A. Caricato, S. Barradas, Patent
PCT/GB 99/00527 (1999), to Sasol Technology. [60] D.G. Wei, Y.L. Zhang, J.G. Goodwin, Appl. Catal. A 210 (2000) 129. [61] J. van de Loosdrecht, S. Barradas, E.A. Caricato, P.J. van Berge, J.L. Visagie, Prep. Symp.-
Am. Chem. Soc., Div. Fuel Chem. 45 (2000) 587. [62] A. Hoek, A.H. Joustra, J.K. Minderhoud, M.F. Post, Great Britain Patent 2 125 062 (1983) to
Shell Research Ltd. [63] C.M. Lok, Stud. Surf. Sci. Catal. 147 (2004) 283. [64] J. van de Loosdrecht, S. Barradas, E.A. Caricato, N.G. Ngwenya, P.S. Nkwanyana, M.A.S.
Rawat, B.H. Sigwebela, P.J. van Berge, J.L. Visagie, Top. Catal. 26 (2003) 121. [65] W. Chu, P.A. Chernavskii, L. Gengembre, G. A. Pankina, P. Fongarland, A.Y. Khodakov, J.
Catal. 252 (2007) 215. [66] V. Haensel, CIOS File No. 30, Item XXX-1, Kaiser Wilhelm Institut für Kohlenforschung,
Mülheim, CIOS Target No. 30/6.01, Fuels and Lubricants, June 15, 1945 (http://www.fischertropsch.org).
[67] White paper, “Fischer Tropsch Catalyst Test on Coal-Derived Synthesis Gas”, Syntroleum Corporation. (www.syntroleum.com).
[68] P.J. van Berge, R.C. Everson, Stud. Surf. Sci. Catal. 107 (1997) 207. [69] M.K. Niemela, A.O. Krause, Catal. Lett. 42 (1996) 161. [70] M.J. van der Burgt, J. van Klinken, S.T. Sie, in: Proc. Synfuels Worldwide Symp.,
Washington, DC, 11–13 November, 1985. [71] J. van de Loosdrecht, B. Balzhinimaev, J.-A. Dalmon, J.W. Niemantsverdriet, S.V. Tsybulya,
A.M. Saib, P.J. van Berge, J.L. Visagie, Catal. Today 123 (2007) 293. [72] P.J. van Berge, J. van de Loosdrecht, S. Barradas, A.M. van der Kraan, Catal. Today 58
(2000) 321. [73] E. van Steen, M. Claeys, M.E. Dry, J. van de Loosdrecht, E.L. Viljoen, J.L. Visagie, J. Phys.
Chem. B 109 (2005) 3575. [74] A.M. Saib, A. Borgna, J. van de Loosdrecht, P.J. van Berge, J.W. Niemantsverdriet, Appl.
Catal. A 312 (2006) 12. [75] G. Jacobs, P.M. Patterson. Y. Zhang, T. Das, J. Li, B. Davis, Appl. Catal. A 233 (2002) 215. [76] G.Z. Bian, N. Fujishita, T. Mochizuki, W.S. Ning, M. Yamada, Appl. Catal. A 252 (2003)
251. [77] M.J. Overett, B. Breedt, E. du Plessis, W. Erasmus, J. van de Loosdrecht, Prepr. Pap.-Am.
Chem. Soc., Div. Pet. Chem. 53 (2008) 126. [78] I. Puskas, Catal. Lett. 22 (1993) 283. [79] J.J.H.M. Font Freide, T.D. Gamlin, R.J. Hensman, B. Nay, C. Sharp, J. Nat. Gas Chem. 13
(2004) 1. [80] R.B. Anderson, W.K. Hall, A. Krieg, B. Seligman, J. Am. Chem. Soc. 71 (1949) 183.[81] I.M. Ciobîcã, R.A. van Santen, P.J. van Berge, J. van de Loosdrecht, Surf. Sci. 602 (2008) 17. [82] J. Wilson, C. de Groot, J. Phys. Chem. 99 (1995) 7860.
17

Chapter 1
[83] British Intelligence Objectives Sub-committee. Interrogation of Dr Otto Roelen of Ruhrchemie A.G. B.I.O.S. – Final report No 447; Item no 30 (1945). (http://www.fischer-tropsch.org.).
18
Chapter 2
Experimental Techniques In order to study the formation of cobalt aluminate, carbon deposition or the
behaviour of cobalt nanoparticles under different reaction conditions as outlined in
the previous chapter, appropriate analytical methods had to be selected. X-ray
adsorption near-edge spectroscopy (XANES) was chosen to study the formation of
cobalt aluminate as it is a powerful technique to differentiate phases in a catalyst and
can be used in a pseudo in-situ manner on wax-covered cobalt-based FTS catalysts
tested at realistic conditions. However, due to the wax layer present, it is difficult to
analyse the catalysts for deleterious carbon deposits and subsequently a wax-
extraction procedure was developed. X-ray photo-electron spectroscopy (XPS) was
used to give information on the surface properties of wax-extracted and carbon-
deposited catalysts. Temperature programmed (TP) techniques were applied to
determine the amount and nature of the carbon deposits on the catalysts. The location
of deleterious carbon was investigated with energy filtered transmission electron
microscopy (EFTEM) and low energy ion scattering (LEIS). TEM and in-situ TEM
was performed on model cobalt catalysts to gauge the potential of this technique to
observe the behaviour of cobalt nanoparticles when treated under model conditions.
The following section briefly describes the above-mentioned characterization and
pre-treatment techniques used in this study.
Chapter 2
2.1 X-ray absorption near-edge spectroscopy (XANES)
X-ray absorption spectroscopy (XAS) is a useful method to investigate chemical
composition and local structure [1, 2]. During the experiment the material under
investigation is targeted with a monochromatic X-ray beam which is produced by
synchrotron radiation. The basic process involves the photoelectric effect: a photon is
absorbed by an atom or ion and an electron is emitted from an inner shell. A parallel
monochromatic x-ray beam of intensity I0 passing through a sample of thickness x
will get a reduced intensity I according to the expression:
ln (I0 /I) = µ x (2.1)
where µ is the linear absorption coefficient, which depends on the type of atoms and
the density of the material. At certain energies where the absorption increases
drastically, it gives rise to an absorption edge. Each such edge occurs when the energy
of the incident photons is just sufficient to cause excitation of a core electron of the
absorbing atom to a continuum state, i.e. to produce a photoelectron. Thus, the
energies of the absorbed radiation at these edges correspond to the binding energies of
electrons in the K, L, M, etc, shells of the absorbing elements. When the
photoelectron leaves the absorbing atom, its wave is backscattered by the
neighbouring atoms. Consequently the X-ray adsorption spectrum exhibits oscillation
of fine structure that extends beyond the absorption edge.
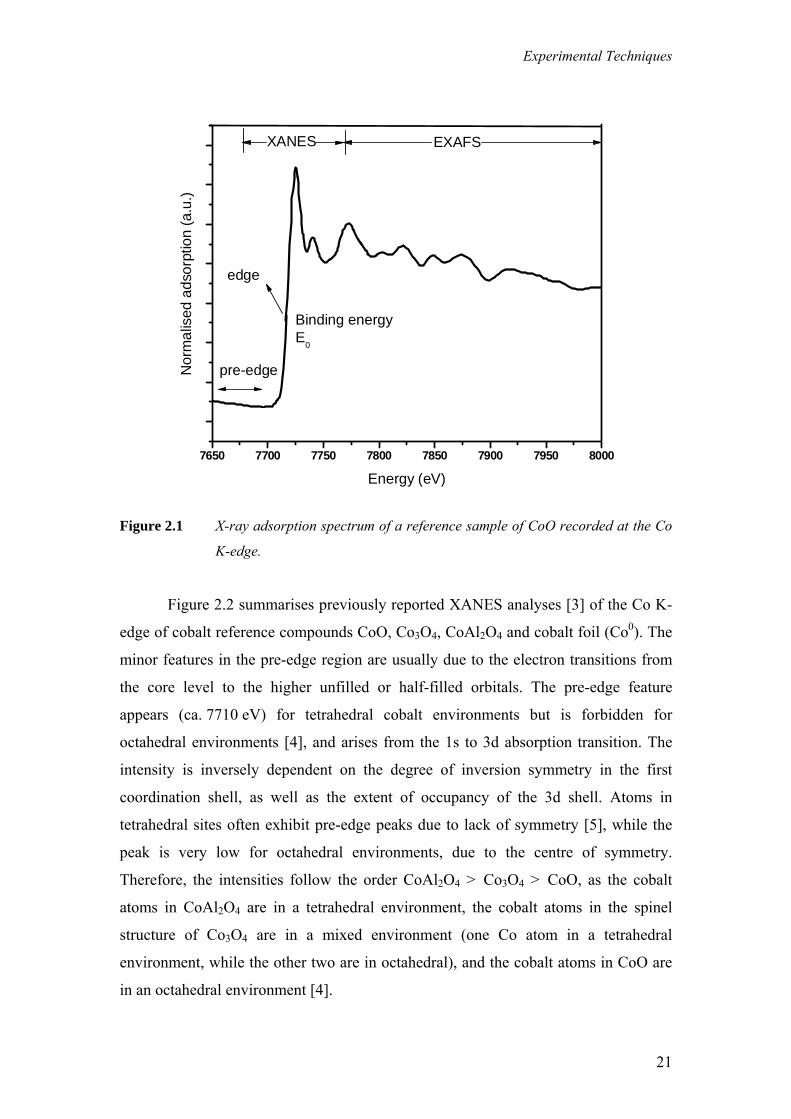
An X-ray absorption spectrum (Figure 2.1) is generally divided into three
sections: 1) pre-edge (E < E0); 2) X-ray absorption near edge structure (XANES),
where the energy of the incident x-ray beam is E = E0 ± 50 eV and 3) extended X-ray
absorption fine structure (EXAFS), which starts approximately from 50 eV and
continues up to 1000 eV above the edge. Analysis of the XANES region, near the
adsorption edge, gives chemical information, oxidation state and sometimes co-
ordination around the absorbing atom. The interpretation of the XANES region can be
done with the help of spectra of reference compounds and constructing linear
combinations of references to fit the spectrum of the sample being measured.
20
Experimental Techniques
7650 7700 7750 7800 7850 7900 7950 8000
Nor
mal
ised
ads
orpt
ion
(a.u
.)
Energy (eV)
edge
Binding energyE0
pre-edge
XANES EXAFS
Figure 2.1 X-ray adsorption spectrum of a reference sample of CoO recorded at the Co
K-edge.
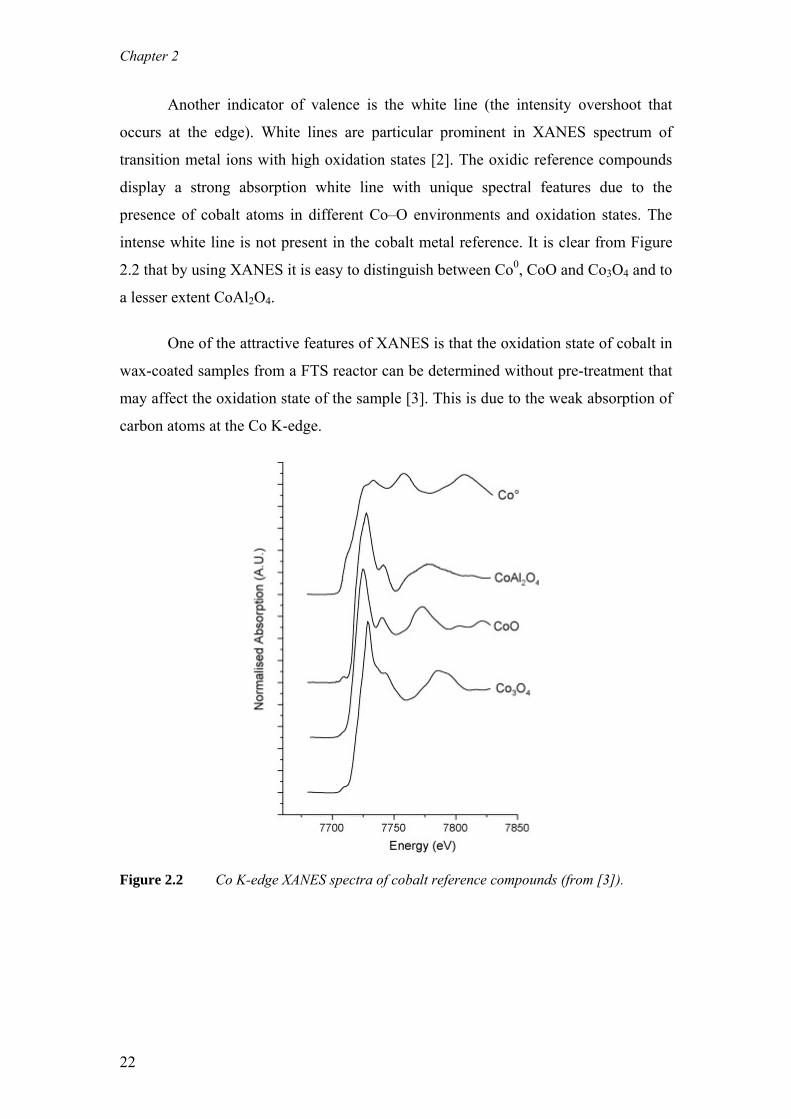
Figure 2.2 summarises previously reported XANES analyses [3] of the Co K-
edge of cobalt reference compounds CoO, Co3O4, CoAl2O4 and cobalt foil (Co0). The
minor features in the pre-edge region are usually due to the electron transitions from
the core level to the higher unfilled or half-filled orbitals. The pre-edge feature
appears (ca. 7710 eV) for tetrahedral cobalt environments but is forbidden for
octahedral environments [4], and arises from the 1s to 3d absorption transition. The
intensity is inversely dependent on the degree of inversion symmetry in the first
coordination shell, as well as the extent of occupancy of the 3d shell. Atoms in
tetrahedral sites often exhibit pre-edge peaks due to lack of symmetry [5], while the
peak is very low for octahedral environments, due to the centre of symmetry.
Therefore, the intensities follow the order CoAl2O4 > Co3O4 > CoO, as the cobalt
atoms in CoAl2O4 are in a tetrahedral environment, the cobalt atoms in the spinel
structure of Co3O4 are in a mixed environment (one Co atom in a tetrahedral
environment, while the other two are in octahedral), and the cobalt atoms in CoO are
in an octahedral environment [4].
21
Chapter 2
Another indicator of valence is the white line (the intensity overshoot that
occurs at the edge). White lines are particular prominent in XANES spectrum of
transition metal ions with high oxidation states [2]. The oxidic reference compounds
display a strong absorption white line with unique spectral features due to the
presence of cobalt atoms in different Co–O environments and oxidation states. The
intense white line is not present in the cobalt metal reference. It is clear from Figure
2.2 that by using XANES it is easy to distinguish between Co0, CoO and Co3O4 and to
a lesser extent CoAl2O4.
One of the attractive features of XANES is that the oxidation state of cobalt in
wax-coated samples from a FTS reactor can be determined without pre-treatment that
may affect the oxidation state of the sample [3]. This is due to the weak absorption of
carbon atoms at the Co K-edge.
Figure 2.2 Co K-edge XANES spectra of cobalt reference compounds (from [3]).
22
Experimental Techniques
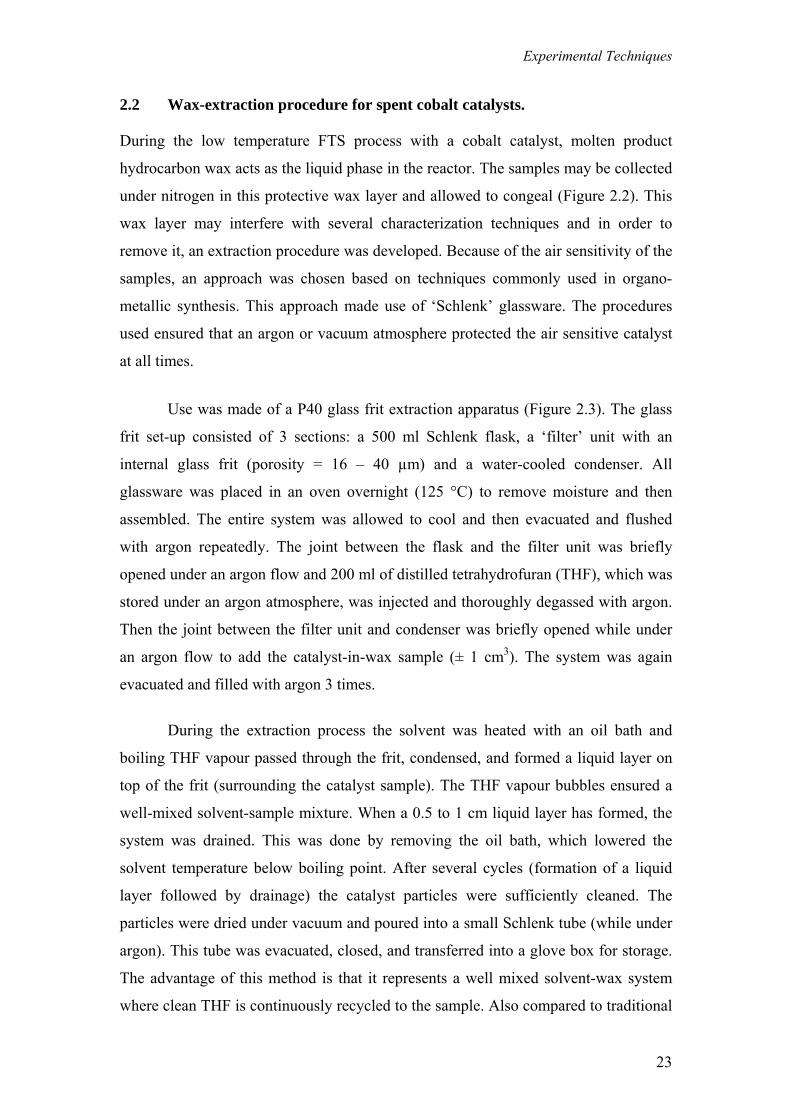
2.2 Wax-extraction procedure for spent cobalt catalysts. During the low temperature FTS process with a cobalt catalyst, molten product
hydrocarbon wax acts as the liquid phase in the reactor. The samples may be collected
under nitrogen in this protective wax layer and allowed to congeal (Figure 2.2). This
wax layer may interfere with several characterization techniques and in order to
remove it, an extraction procedure was developed. Because of the air sensitivity of the
samples, an approach was chosen based on techniques commonly used in organo-
metallic synthesis. This approach made use of ‘Schlenk’ glassware. The procedures
used ensured that an argon or vacuum atmosphere protected the air sensitive catalyst
at all times.
Use was made of a P40 glass frit extraction apparatus (Figure 2.3). The glass
frit set-up consisted of 3 sections: a 500 ml Schlenk flask, a ‘filter’ unit with an
internal glass frit (porosity = 16 – 40 µm) and a water-cooled condenser. All
glassware was placed in an oven overnight (125 °C) to remove moisture and then
assembled. The entire system was allowed to cool and then evacuated and flushed
with argon repeatedly. The joint between the flask and the filter unit was briefly
opened under an argon flow and 200 ml of distilled tetrahydrofuran (THF), which was
stored under an argon atmosphere, was injected and thoroughly degassed with argon.
Then the joint between the filter unit and condenser was briefly opened while under
an argon flow to add the catalyst-in-wax sample (± 1 cm3). The system was again
evacuated and filled with argon 3 times.
During the extraction process the solvent was heated with an oil bath and
boiling THF vapour passed through the frit, condensed, and formed a liquid layer on
top of the frit (surrounding the catalyst sample). The THF vapour bubbles ensured a
well-mixed solvent-sample mixture. When a 0.5 to 1 cm liquid layer has formed, the
system was drained. This was done by removing the oil bath, which lowered the
solvent temperature below boiling point. After several cycles (formation of a liquid
layer followed by drainage) the catalyst particles were sufficiently cleaned. The
particles were dried under vacuum and poured into a small Schlenk tube (while under
argon). This tube was evacuated, closed, and transferred into a glove box for storage.
The advantage of this method is that it represents a well mixed solvent-wax system
where clean THF is continuously recycled to the sample. Also compared to traditional
23
Chapter 2
Sohxlet extraction, the progress is easily visible and the sample can be transferred
easier under vacuum.
Hydrocarbon wax
Cobalt catalyst in wax
Figure 2.3 A picture of catalyst in wax and representation of the glass frit set-up. 2.3 X-ray photoelectron spectroscopy (XPS) XPS is a widely applied surface science technique that is used to probe the first few
nanometers of the sample [2]. XPS is able to give information on the elements present
and associated chemical bonds (chemical state) in the surface of the material. XPS
like XAS is based on the photoelectric effect which involves the emission of electrons
by atoms after the absorption of X-rays. The kinetic energy of the emitted
photoelectron depends on the energy of the adsorbed light according to the following
equation [2]:
Ek = h ν – Eb- φ (2.2) where
Ek is the kinetic energy of the photoelectron
h is Planck’s constant
ν is the frequency of the absorbed radiation
24
Experimental Techniques
Eb is the binding energy of the photoelectron with respect to the Fermi level of the
sample
φ is the work function of the spectrometer
If a material is irradiated with a source of known energy, the binding energy of
the electron in the atom can be determined by measuring its kinetic energy after
ejection. The binding energy of the electron is directly related to the atom it originates
from and thus carries element specific information. Frequently used X-ray sources for
XPS are Mg Kα (1253.6 eV) and Al Kα (1486.3 eV). In XPS the intensity, N(E), of
electrons is measured as a function of their kinetic energy, but in an XPS spectrum the
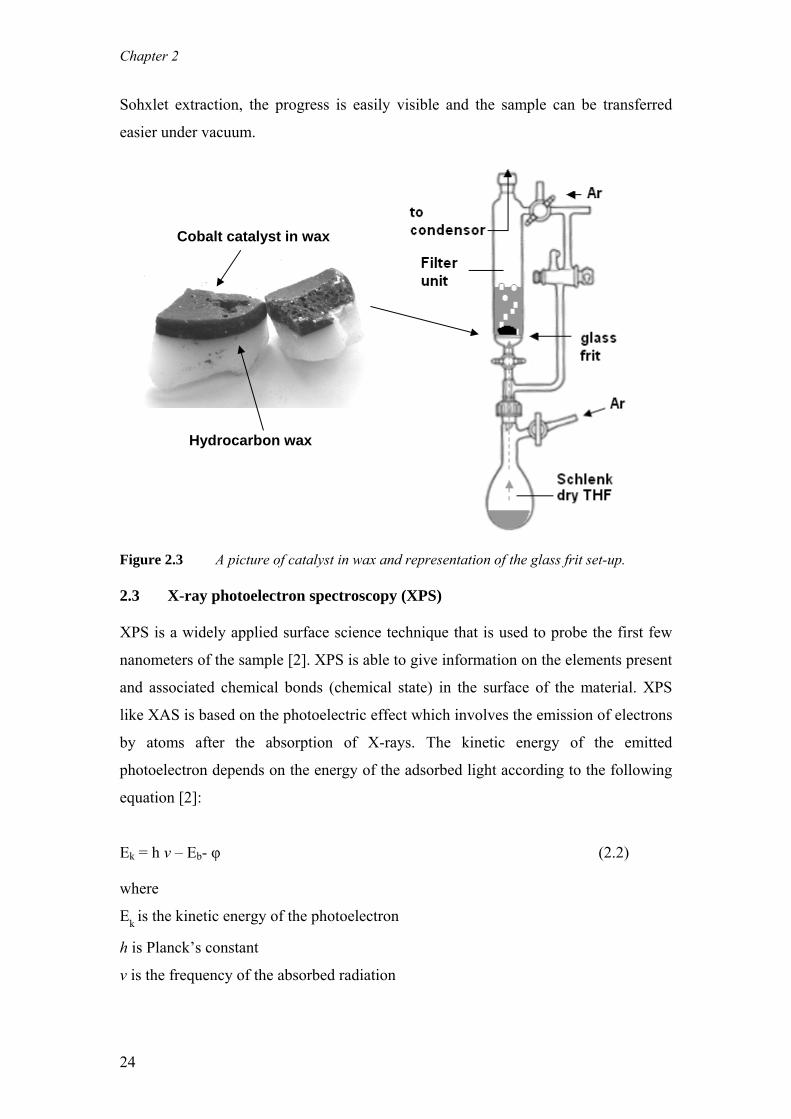
intensity is usually plotted as a function of the binding energy. Figure 2.4 shows an
XPS spectrum of a calcined silica supported cobalt catalyst which has been prepared
by spin coating an aqueous solution of cobalt nitrate onto a SiO2/Si (100) wafer.
1000 800 600 400 200 0
Co 2s
O 1s
Co 3p
Co LMM
Si 2pSi 2sC1s
O 1s
Co 2p
Binding energy (eV)
XPS
inte
nsity
(a.u
.)
O KLL
Figure 2.4 Wide scan XPS spectrum of a calcined Co/SiO2 flat model catalyst.
Peaks due to Co, Si, O and C (from the ever-present hydrocarbon
contamination) are visible and can be assigned using binding energy tables. In
addition to the photo-electron peaks, Auger peaks (for example Co LMM) are also
visible. When the photoelectron is emitted the atom is in an exited state with a hole in
25
Chapter 2
its core level. This core hole is filled by an electron from a higher shell. The energy
released from this transition is taken up by another electron, the Auger electron which
is emitted with an element specific kinetic energy.
Because the set of binding energies is characteristic of an element, XPS can be
used to analyse the composition of samples. Binding energies are not only element
specific but contain chemical information as well: the energy levels of core electrons
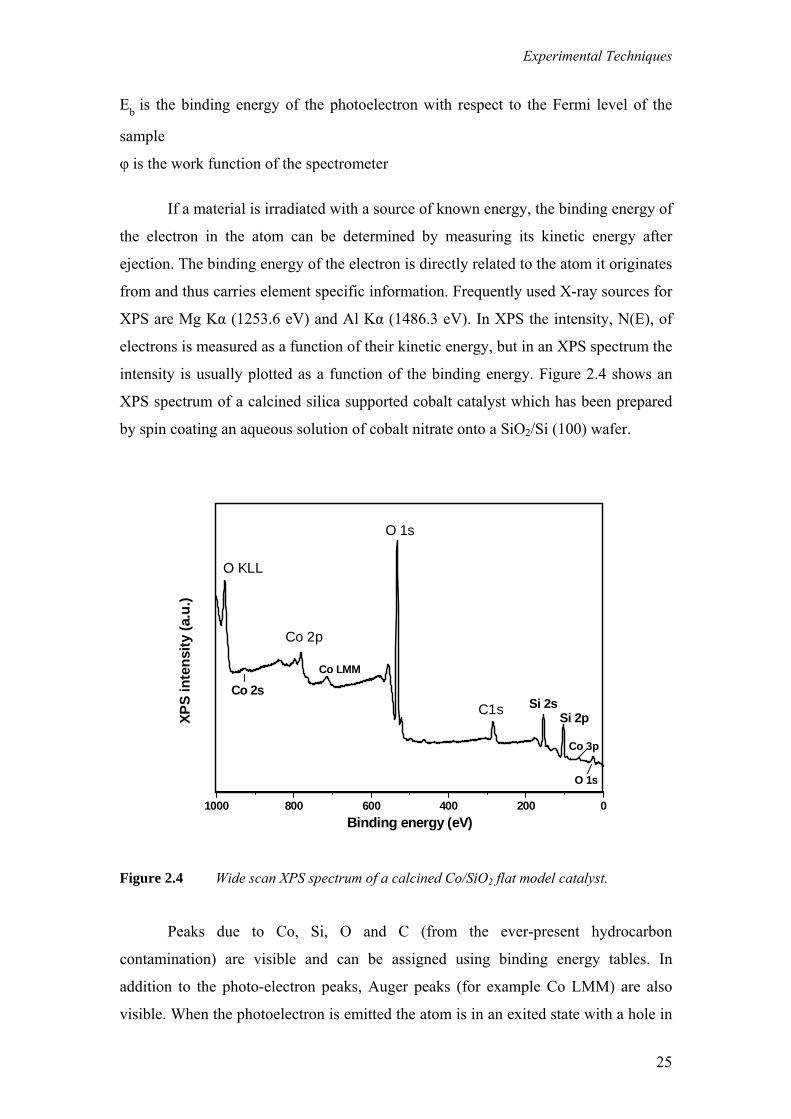
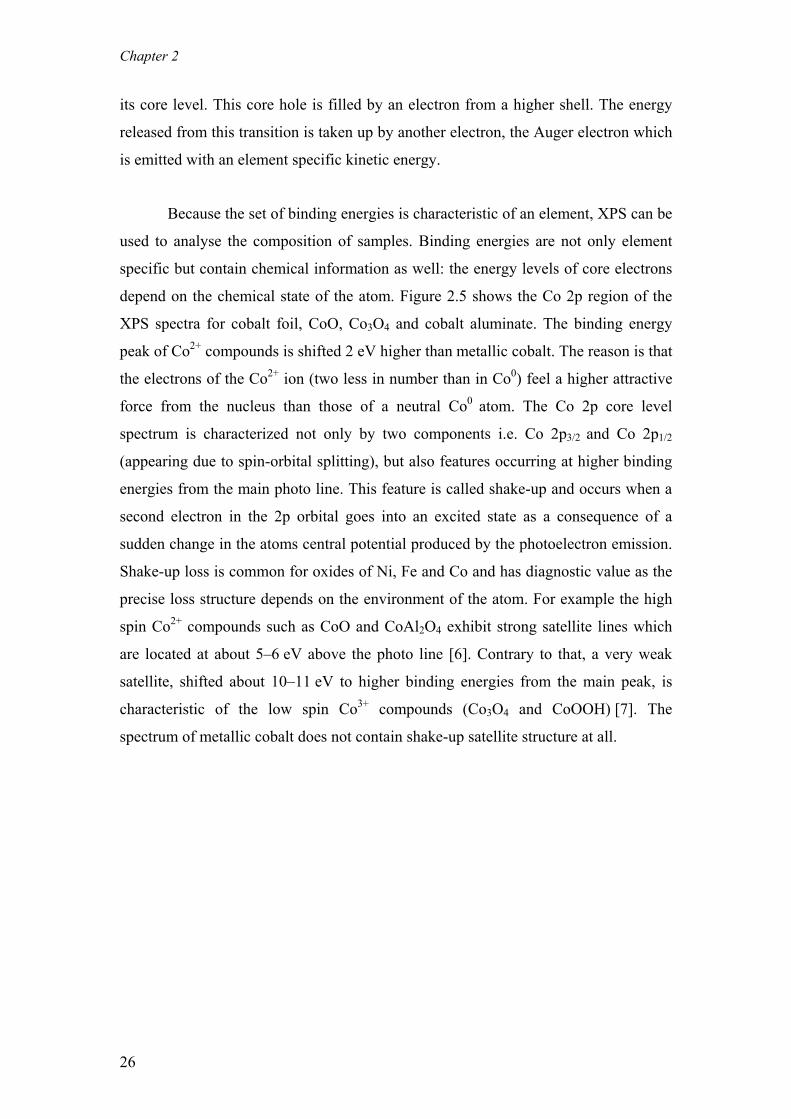
depend on the chemical state of the atom. Figure 2.5 shows the Co 2p region of the
XPS spectra for cobalt foil, CoO, Co3O4 and cobalt aluminate. The binding energy
peak of Co2+ compounds is shifted 2 eV higher than metallic cobalt. The reason is that
the electrons of the Co2+ ion (two less in number than in Co0) feel a higher attractive
force from the nucleus than those of a neutral Co0 atom. The Co 2p core level
spectrum is characterized not only by two components i.e. Co 2p3/2 and Co 2p1/2
(appearing due to spin-orbital splitting), but also features occurring at higher binding
energies from the main photo line. This feature is called shake-up and occurs when a
second electron in the 2p orbital goes into an excited state as a consequence of a
sudden change in the atoms central potential produced by the photoelectron emission.
Shake-up loss is common for oxides of Ni, Fe and Co and has diagnostic value as the
precise loss structure depends on the environment of the atom. For example the high
spin Co2+ compounds such as CoO and CoAl2O4 exhibit strong satellite lines which
are located at about 5–6 eV above the photo line [6]. Contrary to that, a very weak
satellite, shifted about 10–11 eV to higher binding energies from the main peak, is
characteristic of the low spin Co3+ compounds (Co3O4 and CoOOH) [7]. The
spectrum of metallic cobalt does not contain shake-up satellite structure at all.
26
Experimental Techniques
810 805 800 795 790 785 780 775
Co foil
B inding energy (eV)
CoO
CoAl2O4
Co 2p1/2
Co3O4
Co 2p3/2
shake-up
Arb
itra
ry u
nit
s
Figure 2.5 Co 2p region of XPS spectrum of in-house measured cobalt reference
compounds.
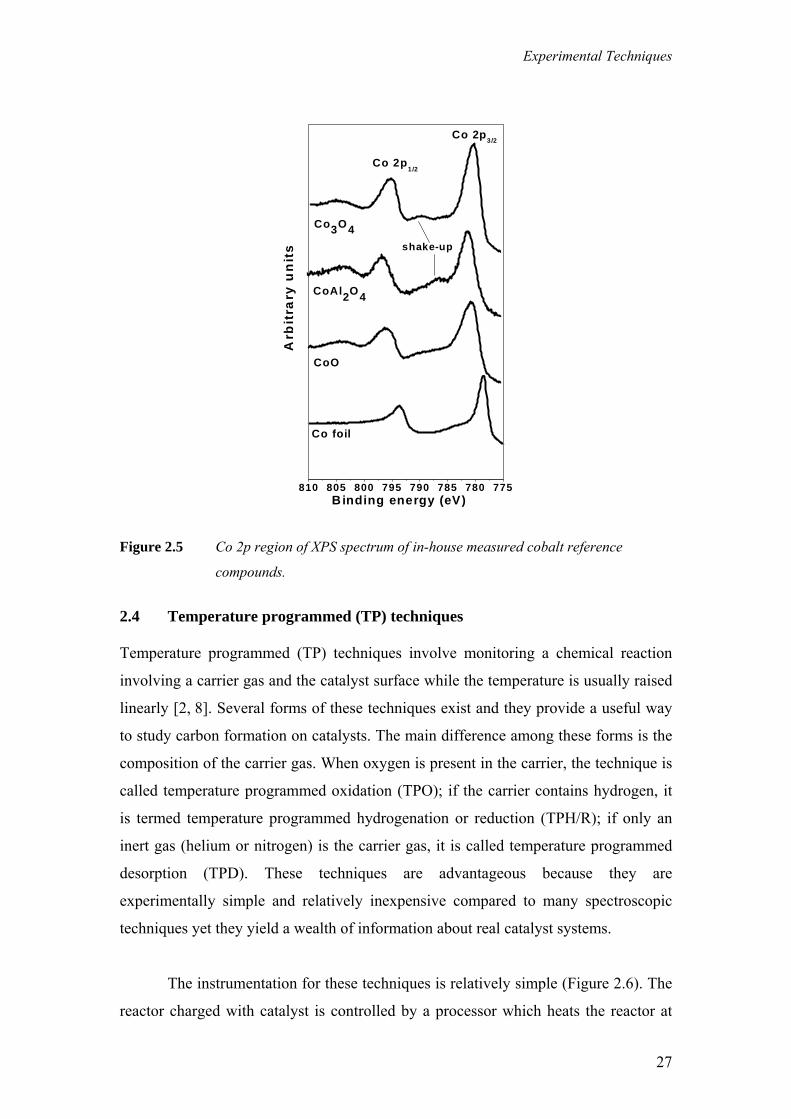
2.4 Temperature programmed (TP) techniques Temperature programmed (TP) techniques involve monitoring a chemical reaction
involving a carrier gas and the catalyst surface while the temperature is usually raised
linearly [2, 8]. Several forms of these techniques exist and they provide a useful way
to study carbon formation on catalysts. The main difference among these forms is the
composition of the carrier gas. When oxygen is present in the carrier, the technique is
called temperature programmed oxidation (TPO); if the carrier contains hydrogen, it
is termed temperature programmed hydrogenation or reduction (TPH/R); if only an
inert gas (helium or nitrogen) is the carrier gas, it is called temperature programmed
desorption (TPD). These techniques are advantageous because they are
experimentally simple and relatively inexpensive compared to many spectroscopic
techniques yet they yield a wealth of information about real catalyst systems.
The instrumentation for these techniques is relatively simple (Figure 2.6). The
reactor charged with catalyst is controlled by a processor which heats the reactor at
27
Chapter 2
rates of typically 0.1-20 °C/min. In the case of TPH the catalyst containing
carbonaceous deposits is heated in hydrogen and this reacts to form predominantly
methane. The off gases are monitored by a mass spectrometer. The amount, reactivity,
location and in some cases kinetics of carbon burn off can be determined by TP
techniques.
COHe
O2
Mass spectrometer
Temperatureprogrammer
quartz reactorH2
Figure 2.6 An experimental set-up for a TP technique apparatus equipped with a mass
spectrometer (adapted from [2])
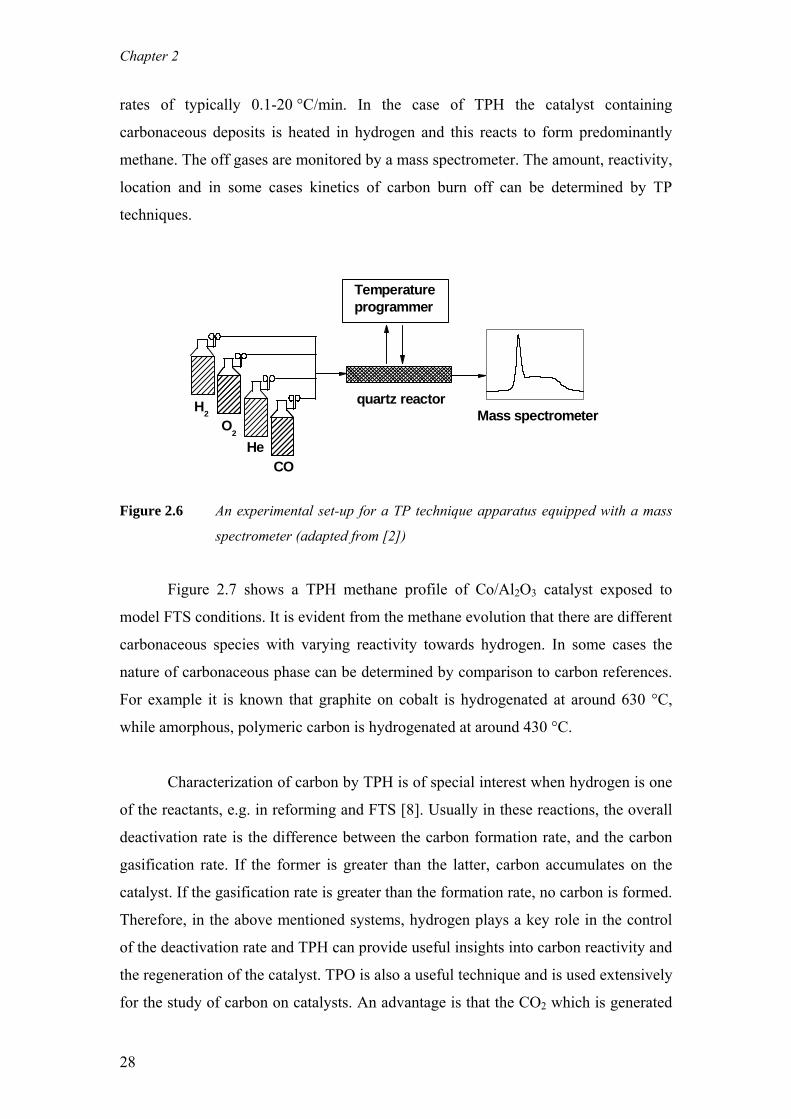
Figure 2.7 shows a TPH methane profile of Co/Al2O3 catalyst exposed to
model FTS conditions. It is evident from the methane evolution that there are different
carbonaceous species with varying reactivity towards hydrogen. In some cases the
nature of carbonaceous phase can be determined by comparison to carbon references.
For example it is known that graphite on cobalt is hydrogenated at around 630 °C,
while amorphous, polymeric carbon is hydrogenated at around 430 °C.
Characterization of carbon by TPH is of special interest when hydrogen is one
of the reactants, e.g. in reforming and FTS [8]. Usually in these reactions, the overall
deactivation rate is the difference between the carbon formation rate, and the carbon
gasification rate. If the former is greater than the latter, carbon accumulates on the
catalyst. If the gasification rate is greater than the formation rate, no carbon is formed.
Therefore, in the above mentioned systems, hydrogen plays a key role in the control
of the deactivation rate and TPH can provide useful insights into carbon reactivity and
the regeneration of the catalyst. TPO is also a useful technique and is used extensively
for the study of carbon on catalysts. An advantage is that the CO2 which is generated
28
Experimental Techniques
upon carbon gasification can be detected with a mass spectrometer, which can be
calibrated, to give quantitative information. The disadvantage is that oxygen reacts
much faster and the resolution between different carbon species in a TPO spectrum
may be compromised. Nevertheless, TPO provides a useful way to study carbon
phases that are resistant to hydrogen.
0 100 200 300 400 500 600Temperature (°C)
m/z = 15
Met
hane
inte
nsity
(a.u
)
Figure 2.7 TPH methane profile of a 20 wt% Co/Al2O3 catalyst after being exposed to
model FTS conditions for 4h (230 °C, 1 bar, H2/CO = 0.5).
2.5 Transmission electron microscopy (TEM) The transmission electron microscope (TEM) operates on the same basic principles as
the light microscope but uses electrons instead of light [2]. The resolution of a light
microscope is limited by the wavelength of light. TEMs use electrons as the "light
source" and their much lower wavelength (less than 1Å) makes it possible to get a
resolution a thousand times better than with a light microscope. A number of
phenomena can occur when a high energy (200 keV) electron source interacts with a
solid sample (Figure 2.8). A portion of the electrons may pass through without
suffering energy loss. These transmitted electrons form a two dimensional projection
of the object. Electrons can be diffracted enabling one to obtain dark-field images as
well as diffraction patterns. Electrons may also be backscattered. Electrons can lose
29
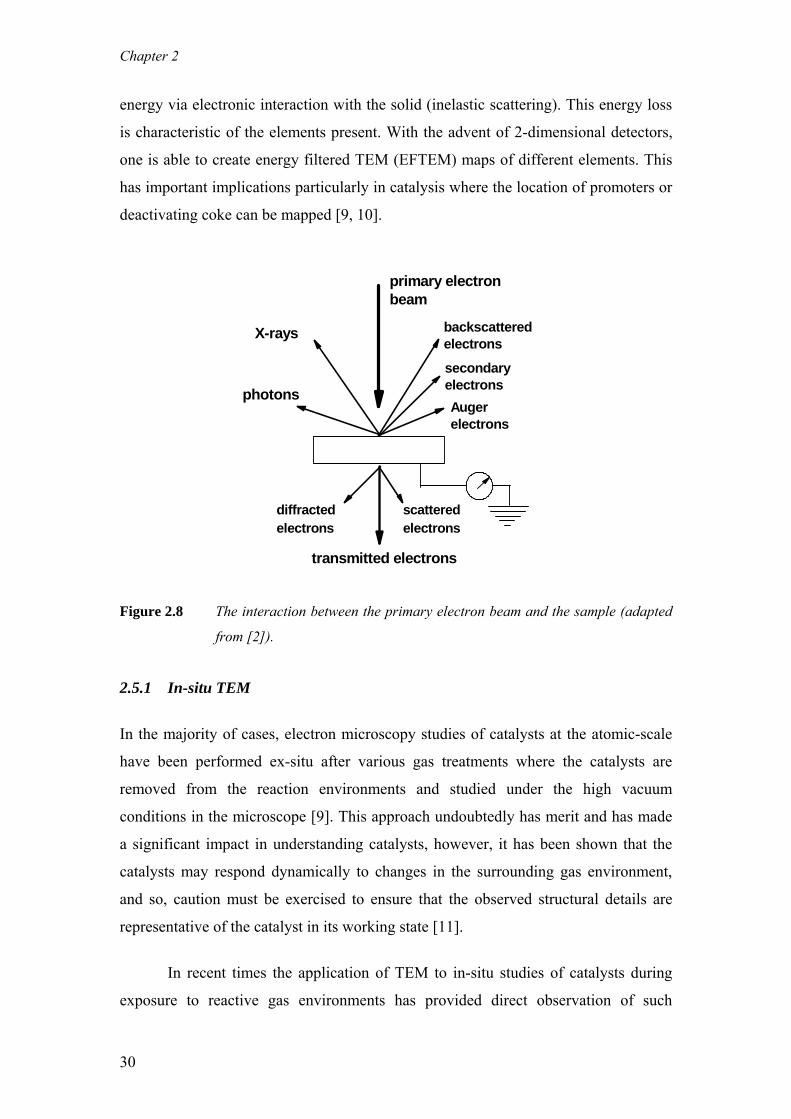
Chapter 2
energy via electronic interaction with the solid (inelastic scattering). This energy loss
is characteristic of the elements present. With the advent of 2-dimensional detectors,
one is able to create energy filtered TEM (EFTEM) maps of different elements. This
has important implications particularly in catalysis where the location of promoters or
deactivating coke can be mapped [9, 10].
transmitted electrons
scatteredelectrons
Auger electrons
secondary electrons
primary electron beam
backscattered electrons
X-rays
photons
diffractedelectrons
Figure 2.8 The interaction between the primary electron beam and the sample (adapted
from [2]).
2.5.1 In-situ TEM
In the majority of cases, electron microscopy studies of catalysts at the atomic-scale
have been performed ex-situ after various gas treatments where the catalysts are
removed from the reaction environments and studied under the high vacuum
conditions in the microscope [9]. This approach undoubtedly has merit and has made
a significant impact in understanding catalysts, however, it has been shown that the
catalysts may respond dynamically to changes in the surrounding gas environment,
and so, caution must be exercised to ensure that the observed structural details are
representative of the catalyst in its working state [11].
In recent times the application of TEM to in-situ studies of catalysts during
exposure to reactive gas environments has provided direct observation of such
30
Experimental Techniques
dynamic changes in catalyst structure [12]. Such studies are by no means trivial due to
the extremely small mean-free path of electrons in dense media (gases and solids),
and significant instrumental modifications are needed in order to confine a high-
pressure gas environment around the specimen area without affecting the microscope
performance. This may be accomplished in two ways; by the application of advanced
differential pumping systems and by using thin window cells [13]. These different
approaches assist in minimizing the degradation of the electron beam as it passes
through the gases by minimizing the gas volume.
Recent collaboration between Haldor Topsøe A/S and the FEI Company
resulted in an in-situ high resolution TEM (HRTEM) facility capable of providing the
first images with a resolution of 0.14 nm during exposure of the sample to reactive
gases and elevated temperatures [12]. The in-situ experiments described in Chapter 7
were performed on an FEI CM 300 microscope at Haldor Topsøe, Lyngby equipped
with the necessary gas lines (CO, H2 and H2O) and an in-situ sample holder with a
heating filament. The microscope is equipped with an FEG, a quadrupole mass
spectrometer (QMS), a Gatan image filter (GIF), and a Tietz F144 CCD for data
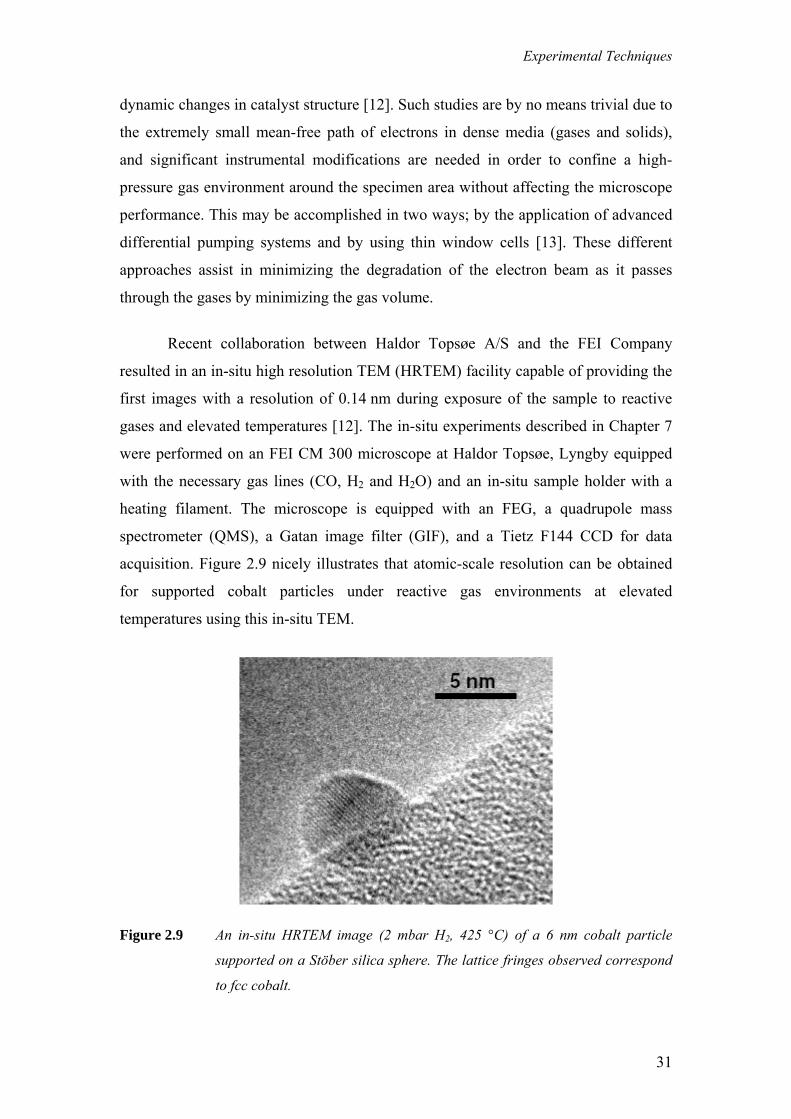
acquisition. Figure 2.9 nicely illustrates that atomic-scale resolution can be obtained
for supported cobalt particles under reactive gas environments at elevated
temperatures using this in-situ TEM.
Figure 2.9 An in-situ HRTEM image (2 mbar H2, 425 °C) of a 6 nm cobalt particle
supported on a Stöber silica sphere. The lattice fringes observed correspond
to fcc cobalt.
31
Chapter 2
2.6 Low energy ion scattering (LEIS) In a low energy ion scattering (LEIS) experiment, a light noble gas ion with a known
mass and energy is directed towards the surface that is studied [14]. At the surface,
the ion collides with an atom in the outermost atomic layer and the ion is scattered
back towards a detector. In the detector, the backscattered ions are sorted by their
energy. The energy of the backscattered ion is determined by the classic laws of
mechanics, the law of conservation of energy and the law of conservation of
momentum. This means that ions that scatter from a heavy atom will scatter back with
a higher energy than ions that scatter from a lighter atom. Thus, an analysis of the
energy of the backscattered ions will yield a spectrum of the masses of the surface
atoms. The information depth of LEIS is limited to one atomic layer, because of the
high neutralisation probability of the noble gas ions.
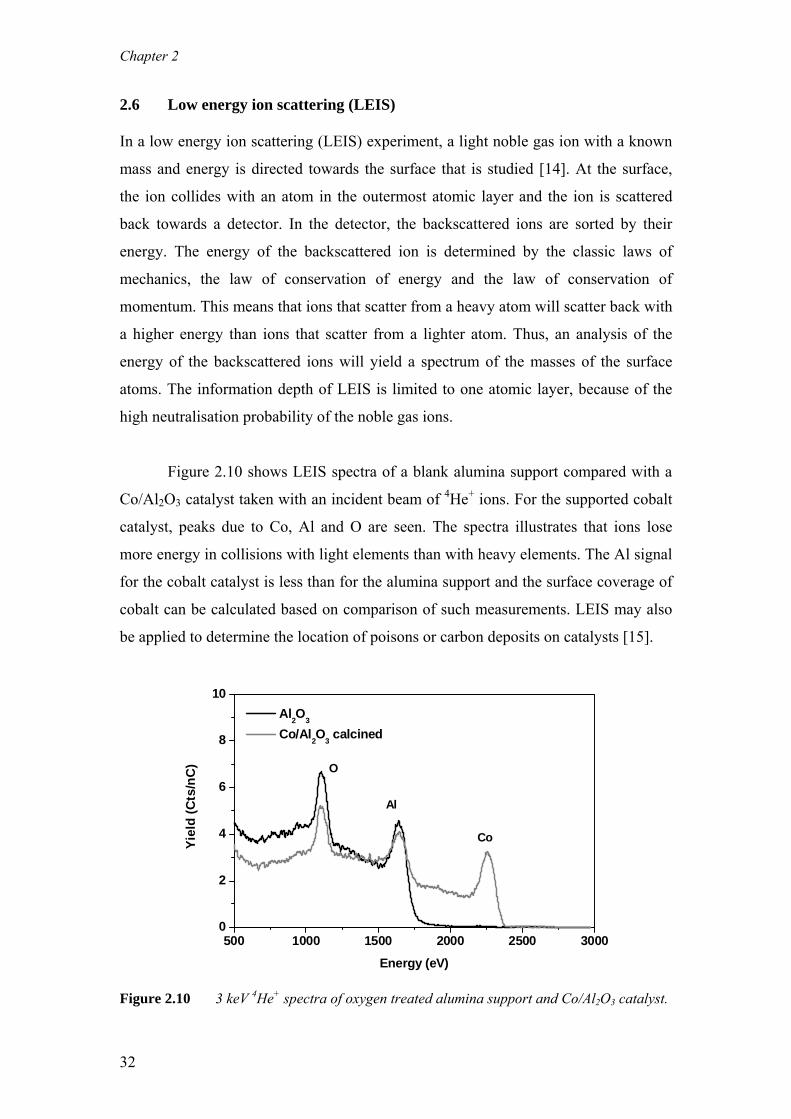
Figure 2.10 shows LEIS spectra of a blank alumina support compared with a
Co/Al2O3 catalyst taken with an incident beam of 4He+ ions. For the supported cobalt
catalyst, peaks due to Co, Al and O are seen. The spectra illustrates that ions lose
more energy in collisions with light elements than with heavy elements. The Al signal
for the cobalt catalyst is less than for the alumina support and the surface coverage of
cobalt can be calculated based on comparison of such measurements. LEIS may also
be applied to determine the location of poisons or carbon deposits on catalysts [15].
500 1000 1500 2000 2500 30000
2
4
6
8
10
Co
Al
Yiel
d (C
ts/n
C)
Energy (eV)
Al2O3
Co/Al2O3 calcined
O
Figure 2.10 3 keV 4He+ spectra of oxygen treated alumina support and Co/Al2O3 catalyst.
32
Experimental Techniques
2.7 References [1] D. C. Koningsberger, R. Prins (Eds.), X-ray Absorption, Wiley, New York, 1987. [2] J.W. Niemantsverdriet, Spectroscopy in Catalysis, 3rd ed., Wiley-VCH, Weinheim, 2007. [3] A.M. Saib, A. Borgna, J. van de Loosdrecht, P.J. van Berge, J.W. Niemantsverdriet, Appl.
Catal. A 312 (2006) 12. [4] A.M. Moen, D.G. Nicholson, Chem. Mater. 9 (1997) 1241. [5] J.C.J. Bart, Adv. Catal. 34 (1986) 203. [6] G. Fierro, M.L. Jacono, M. Inversi, P. Porta. Top. Catal. 10 (2000) 39. [7] Z. Zsoldos, L. Guczi, J. Phys. Chem. 96 (1992) 9393. [8] S. Bhatia, J. Beltramini, D.D. Do, Catal. Today 7 (1990) 309. [9] A.K. Datye, In: Handbook of Heterogeneous Catalysis, Vol. 2, G. Ertl, H. Knözinger, J.
Weitkamp, (Eds.), Wiley–VCH, New York (1997) 493. [10] M.D. Shannon, C.M. Lok, J.L. Casci, J. Catal. 249 (2007) 41. [11] P.L. Hansen, J.B. Wagner, S. Helveg, J.R. Rostrup-Nielsen, B.S. Clausen, H. Topsøe, Science
295 (2002) 2053. [12] S. Helveg, P.L. Hansen, Catal. Today 111 (2006) 68. [13] P.L. Hansen, S. Helveg, A.K. Datye, Adv. Catal. 50 (2006) 77. [14] H.H. Brongersma, M. Draxler, M. de Ridder, P. Bauer, Surf. Sci. Reports 62 (2007) 63. [15] J.M.A Harmsen, W.P.A. Jansen, J.H.B.J. Hoebink, J.C. Schouten, H.H. Brongersma, Catal.
Lett. 74 (2001) 133.
33

Chapter 2
34
Chapter 3
The impact of cobalt aluminate formation on the deactivation of cobalt-based Fischer-
Tropsch synthesis catalysts The aim of this study is to understand quantitatively, the role of cobalt aluminate
formation on the deactivation behaviour of cobalt-based Fischer-Tropsch synthesis
(FTS) catalysts. For this purpose, wax-coated samples were removed periodically
from an extended demonstration reactor run operated at commercially relevant FTS
conditions and analysed with X-ray Absorption Near Edge Spectroscopy (XANES).
With XANES, wax protected spent samples could be analysed in a pseudo in-situ
mode, i.e. without altering the oxidation state of cobalt that was present in the reactor
prior to sampling. It is clear from our measurements that during commercially
relevant FTS conditions the Co/Pt/Al2O3 catalyst undergoes reduction and ≤ 3 wt%
cobalt aluminate formation takes place. Based on the observation that the catalyst
undergoes a relatively rapid reduction and a very gradual but slight cobalt aluminate
formation it is proposed that this cobalt aluminate is formed from the residual cobalt
oxide present in the catalyst following reduction. Additionally, the formation of
aluminate was investigated with XANES and X- ray photoelectron spectroscopy (XPS)
on catalysts taken from laboratory continuous stirred tank reactor (CSTR) runs,
where the water partial pressure was varied between 1-10 bar. Even at high water
partial pressures (PH2O = 10 bar, PH2O/PH2= 2.2) around 10 wt% cobalt aluminate is
formed while the metallic fraction of cobalt remains constant.
Chapter 3
3.1 Introduction
In the next few decades natural gas is expected to become an important raw material
as an alternative to crude oil for the production of liquid fuels [1]. The Fischer-
Tropsch synthesis (FTS) is an integral part of gas-to-liquids (GTL) technology, which
involves the conversion of synthesis gas (H2/CO), derived from natural gas, to liquid
hydrocarbon fuels. These fuels have a low sulphur and aromatic content [2]. Cobalt-
based catalysts are the preferred choice due to their high per pass conversion,
selectivity towards linear hydrocarbons, and low selectivity towards CO2 [3, 4].
However, cobalt is an expensive metal and therefore high catalyst stability is desired.
In order to optimise the usage of a cobalt catalyst for such processes, an
understanding of the deactivation mechanisms at play is paramount.
The mentioned deactivation mechanisms in literature for cobalt-based
catalysts include: poisoning of the cobalt surface by sulphur and nitrogen compounds
[5,6]; oxidation of the metallic phase by product water to form an inactive oxidic
fraction [7]; sintering of the active phase facilitated by the product water and the
reaction conditions [8] reconstruction of cobalt surface due to the intrusive nature of
CO [9,10]; solid state transformation involving the diffusion of cobalt into the support
to form irreducible cobalt support compounds (e.g. aluminates and silicates) [11,12]
and the formation of inert carbon phases which can block the cobalt active
phase [13,14].
Due to the high costs of cobalt it is required that the catalyst has high
dispersion and catalysts are thus designed with small cobalt nanoparticles (around
6nm) well dispersed over a high surface area carrier like silica, titania or γ-alumina
[4]. Co/Al2O3 catalysts are usually prepared by: (a) impregnation of cobalt (II) nitrate
(b) thermal treatment in air to decompose the nitrate precursor and oxidise the cobalt
to Co3O4 and finally (c) reduction of the Co3O4 to metallic cobalt [15, 16]. In the case
of thermal treatment in air at high temperatures (> 350 °C), it is possible for cobalt
ions to diffuse into the support to produce cobalt support compounds which are only
reducible at harsh conditions (> 800 °C in H2) [7]. It is known that Co3O4 and γ-
alumina have isotopic crystal structures and this contributes to the ease of migration
of ions from cobalt oxide into the support during these oxidative treatments [17].
36
The impact of cobalt aluminate formation…
Additionally the ionic radius of trivalent cobalt (0.063 nm) and aluminium
(0.054 nm) are quite similar and during high temperature calcination it is possible that
Co3+ ions from Co3O4 are gradually replaced by Al3+ to produce a series of spinel
compounds which may include CoAl2O4 or Co2Al2O4 [18]. It was also shown that
during the reduction of Co/Al2O3 catalysts with hydrogen, water vapour is produced
which results in the formation of a non-reducible cobalt aluminate-like spinel [19].
Considering all of the above it may be expected that fresh cobalt on alumina catalysts
prepared via the above traditional route will contain a small amount of cobalt
aluminate. For example, Wang and Chen [20] have shown by TPR that catalysts with
20 wt% Co/Al2O3 do have the presence of a cobalt aluminate phase.
It is known from thermodynamic calculations by van Berge et al. [7] that bulk
Co will not oxidise to CoO or Co3O4 during standard FTS conditions, whereas the
formation of support compounds during the reaction such as cobalt aluminate is
favourable. It is argued that the latter does not take place to a significant extent seeing
as the formation of cobalt aluminate is kinetically hindered. This is supported by work
by Bolt [21] who showed that relatively severe hydrothermal treatment, i.e. steam at
500-800 oC, of Co/Al2O3 is required for the further formation of cobalt aluminate.
Water is always present in the FTS due to the removal of adsorbed oxygen,
which arises from the dissociation of CO on the metal surface, by hydrogen. The
amount of water will vary depending on the choice of reactor, catalytic system and
process conditions [22]. Commercially relevant FTS conditions (i.e. 230 oC, 20 bar,
H2+CO conversion between 50-70 %, feed gas composition of 50-60 vol. % H2 and
30-40 vol. % CO.) create water partial pressures in the range of 4-6 bar. In a slurry
phase reactor at these conditions, high water concentrations and low reactant
concentrations will exist throughout the entire reactor due to extensive back mixing
[23]. The produced water will not be converted to CO2 due to the low water gas shift
activity of cobalt [3].
Water has been shown to increase the rate of metal aluminate formation [21]
on model catalyst consisting of cobalt evaporated onto polycrystalline γ-alumina.
Various authors [11, 23, 24, 25] have also claimed that high water partial pressure
37
Chapter 3
increases the formation of aluminate on cobalt-based catalysts either during FTS or at
model conditions in mixtures of H2/H2O. Often the observed deactivation is ascribed
to the formation of aluminate as it is proposed that the irreducible cobalt-support
species is formed from/at the expense of active metallic cobalt.
Jacobs et al. [25] have showed using X-ray Absorption Near Edge
Spectroscopy (XANES) that high levels of water which occur at high conversions
(due to low space velocity employed) resulted in an irreversible deactivation of
platinum promoted Co/Al2O3 catalysts in the FTS due to the formation of a cobalt
aluminate like species from small cobalt clusters. Hilmen et al. [26] also ascribed the
deactivation observed under model conditions with their rhenium promoted Co/Al2O3
catalysts to the formation of a cobalt aluminate phase. The authors showed, using
XPS and TPR, that at 250 °C, and at PH2O/PH2 = 10, cobalt aluminate formation was
favoured [26].
Li and co-workers manipulated CO conversion by varying the space velocity
over platinum promoted Co/Al2O3 catalysts during FTS in a CSTR [11]. They found
that at high conversions and hence higher water partial pressures that there was an
irreversible deactivation of the catalyst. They also co-fed water and reported that
increasing the amount of added water to provide a PH2O = 8.35 bar and a ratio of
PH2O/PH2 = 0.59 in the feed resulted in a permanent deactivation of the catalyst. These
observations, along with increased CO2 selectivity led them to assume that either CoO
or Co2Al2O4 had formed at these conditions. Similarly Tavasoli et al. [27] showed
recently that alumina-supported cobalt catalysts deactivated at higher reaction rates
due to the high partial pressure of water. Rapid deactivation was noted for
PH2O/(PH2+PCO) > 0.55 and PH2O/PCO > 1.5. They postulated that the water aided in the
formation of irreducible cobalt aluminate which they detected by TPR.
Various techniques have been used to detect cobalt aluminate and these
include XPS [26], XRD [19], Raman spectroscopy [19] and TPR [20, 26]. XRD fails
to effectively differentiate between CoO and small amounts of cobalt aluminate while
TPR, Raman spectroscopy and XPS are most useful for unused calcined catalysts. As
an alternative, XANES is powerful technique that is able to differentiate between Coo,
CoO, Co3O4 and CoAl2O4 with a high sensitivity as compared to many other
38
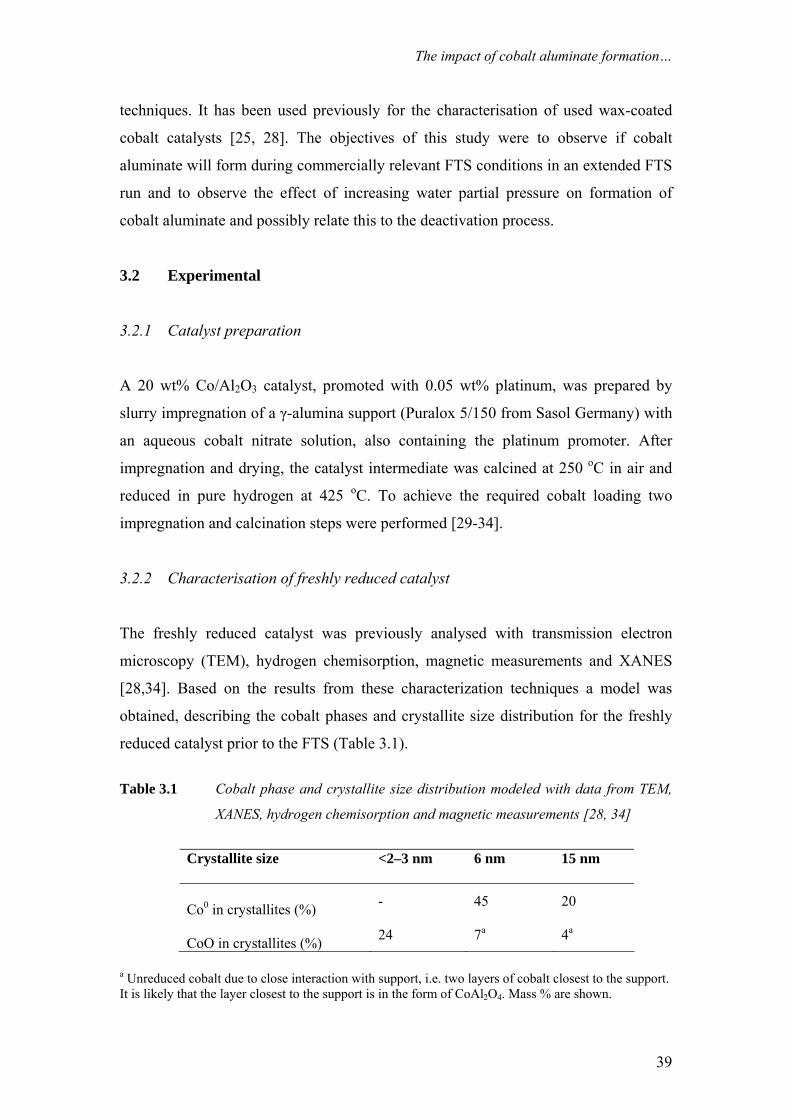
The impact of cobalt aluminate formation…
techniques. It has been used previously for the characterisation of used wax-coated
cobalt catalysts [25, 28]. The objectives of this study were to observe if cobalt
aluminate will form during commercially relevant FTS conditions in an extended FTS
run and to observe the effect of increasing water partial pressure on formation of
cobalt aluminate and possibly relate this to the deactivation process.
3.2 Experimental
3.2.1 Catalyst preparation
A 20 wt% Co/Al2O3 catalyst, promoted with 0.05 wt% platinum, was prepared by
slurry impregnation of a γ-alumina support (Puralox 5/150 from Sasol Germany) with
an aqueous cobalt nitrate solution, also containing the platinum promoter. After
impregnation and drying, the catalyst intermediate was calcined at 250 oC in air and
reduced in pure hydrogen at 425 oC. To achieve the required cobalt loading two
impregnation and calcination steps were performed [29-34].
3.2.2 Characterisation of freshly reduced catalyst
The freshly reduced catalyst was previously analysed with transmission electron
microscopy (TEM), hydrogen chemisorption, magnetic measurements and XANES
[28,34]. Based on the results from these characterization techniques a model was
obtained, describing the cobalt phases and crystallite size distribution for the freshly
reduced catalyst prior to the FTS (Table 3.1).
Table 3.1 Cobalt phase and crystallite size distribution modeled with data from TEM,
XANES, hydrogen chemisorption and magnetic measurements [28, 34]
Crystallite size
<2–3 nm
6 nm
15 nm
Co0 in crystallites (%) - 45 20
CoO in crystallites (%) 24 7a 4a
a Unreduced cobalt due to close interaction with support, i.e. two layers of cobalt closest to the support. It is likely that the layer closest to the support is in the form of CoAl2O4. Mass % are shown.
39
Chapter 3
3.2.3 Catalyst Testing
3.2.3.1. Demonstration unit run
The Co/Pt/Al2O3 catalyst was tested in a 100 bbl/day slurry bubble column reactor
with a diameter of 0.9 m at commercially relevant FTS conditions, i.e. 230 oC, 20 bar,
H2+CO conversion between 50-70 %, feed gas composition of 50-60 vol. % H2 and
30-40 vol. % CO. Direct comparison of catalyst performance can only be done at
exactly the same realistic test conditions. As this is difficult to achieve
experimentally, a model was developed using the Satterfield [35, 36] equation, rFT =
(kPH2PCO)/(1+KPCO)2, in which the observed catalytic performance can be
recalculated to exactly the same test conditions. For this study the Relative Intrinsic
(Fischer-Tropsch) Activity Factor (R.I.A.F.) was compared to an in-house baseline
catalyst.
3.2.3.2 Laboratory CSTR runs
Fischer–Tropsch synthesis tests were performed in a slurry-phase CSTR with a
reactor volume of 670 ml. The catalyst samples (i.e. 10–30 g) were pre-reduced at 380
to 425 °C for 16 h, in pure hydrogen at 1 bar, at a heating rate of 1°C/min, and
suspended, under an argon blanket, in 300 ml molten Fischer–Tropsch hydrogenated
wax (Sasol H1 hard wax) inside the reactor. Realistic FTS conditions were employed,
i.e., 230 ºC, ~10-20 bar, commercial synthesis gas as feed of composition: 50 vol%
H2, 25vol% CO and 25 vol% inerts. The PCO was kept at (4.0±0.2 bar) and PH2 at
(4.5±0.2 bar) while the PH2O was varied from 1-10 bar by adjusting the synthesis gas
conversion and the total pressure. The synthesis gas flows were regulated by Brooks
mass-flow controllers, and use was made of the ampoule-sampling technique as the
selected synthesis performance monitoring method [37].
3.2.4 XANES sample preparation
The sample preparation was done as previously in a glove box (0.1 ppm H2O, 2 ppm
O2) to prevent oxidation of the cobalt [28]. Catalyst samples in wax were removed
from the demonstration reactor at varying times-on-stream and at the end of each
40
The impact of cobalt aluminate formation…
laboratory run and cooled down under nitrogen so as to maintain the integrity of the
sample. XANES samples were prepared by pelletising 40-50 mg of wax-coated cobalt
catalyst removed from the reactor into a 1.3 cm2 disc. The samples were sealed in
Kapton tape and removed from the glove box prior to measurement. Previous
benchmarking experiments with in-situ and ex-situ reduced wax-protected samples
showed that the sample preparation method does not introduce artificial
oxidation [28].
3.2.5 XANES analyses of references and wax-coated catalysts
XANES measurements on reference compounds and wax-coated samples were
performed at the ELETTRA synchrotron facility (Trieste, Italy) using a beam line
with energy of 2-2.4 GeV. A double crystal monochromator (Si (111) and Si (311))
was used for varying the energy between the desired range. Measurements were
carried out at the K-edge of Co. Calibration was performed with a Co foil using the
first point of inflection of Co i.e. 7709 eV [38]. All spectra were recorded at liquid
nitrogen temperatures. The XANES spectra were extracted from raw data by a
conventional procedure. The pre-edge background was subtracted by using power
series curves. Subsequently, the spectra were normalized by dividing by the height of
the absorption edge. Spectra were quantified by fitting the experimental data with a
weighted linear combination of reference compounds (Co0, CoO, and CoAl2O4).
3.2.6 X-ray Photoelectron Spectroscopy analysis
Samples of the spent catalysts tested at various water partial pressures, protected in a
wax layer, were taken from the slurry-phase CSTR at the end of the reaction. The
catalyst was allowed to congeal under an inert nitrogen environment. Due to the
interference of this wax layer, prior to XPS analysis it was removed by an exhaustive
reflux extraction with dry, deoxygenated tetrahydrofuran (THF, b.p. 66 ºC) under an
argon (99.999%) environment for around 3 h, using a P40 glass frit. After extraction
the obtained catalyst particles were dried under vacuum at room temperature to
remove the THF. The catalyst was then transferred under vacuum using Schlenk
glassware into a glove box (2 ppm O2, 0.1 ppm H2O) for passivation. The samples
41
Chapter 3
were prepared in the glove box by crushing the wax-extracted, FTS catalyst samples
in a pestle and mortar. Afterwards, the powders were pressed into an indium layer on
top of standard stainless steel XPS stubs and transferred via the glove box into the
XPS prechamber.
The XPS measurements were carried out using a VG Escalab 200 MKII
spectrometer. An aluminum anode (Kα = 1486.6 eV) was used to generate the X-ray
radiation (240 W (20 mA; 12kV)). Measurements were carried out with a 0.1 s
dwelling time; 0.1 eV step for the selected regions. To obtain sufficient signal-to-
noise ratio the Co 2p region was scanned 80 – 120 times (i.e. making the total
measurement approximately 3 hours). During measurement the pressure in the main
chamber remained below 10-8 mbar.
3.3 Results and discussion
3.3.1 XANES analysis of reference compounds
Figure 3.1 shows XANES analyses of cobalt reference compounds CoO, Co3O4,
CoAl2O4, and cobalt foil (Co0). The oxidic reference compounds display a strong
absorption white line with unique spectral features due to the presence of cobalt atoms
in different Co–O environments and oxidation states. The XANES spectra of the
oxides also display a small pre-edge feature (ca. 7710 eV). This pre-edge feature
arises from the 1s–3d absorption transition and appears most strongly for tetrahedral
cobalt environments as compared to octahedral environments [39]. CoO consists of
Co2+ ions octahedrally coordinated to oxygen, whereas Co3O4 has a spinel type
structure with both tetrahedral Co2+ and octahedral Co3+ ions [39]. CoAl2O4 is a
normal spinel with Co2+ ions in tetrahedral sites [40]. Hence, this pre-edge feature is
most pronounced for CoAl2O4 and Co3O4. It is clear from Figure 3.1 that using
XANES it is easy to distinguish between Co0, CoO and Co3O4 and to a lesser extent
CoAl2O4. However if we use the derivative spectrum (Figure 3.2), it is clear that the
CoO and CoAl2O4 are clearly distinguishable.
42
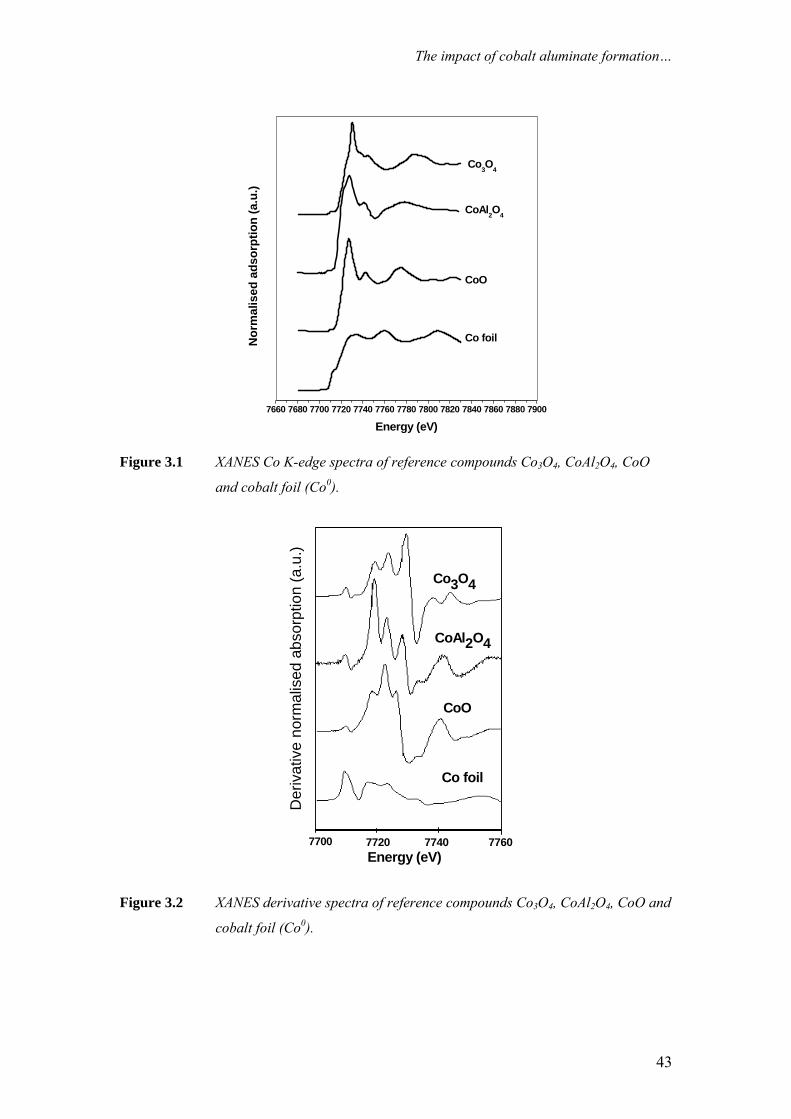
The impact of cobalt aluminate formation…
7660 7680 7700 7720 7740 7760 7780 7800 7820 7840 7860 7880 7900
Co foil
CoO
Co3O4
CoAl2O4
Energy (eV)
Nor
mal
ised
ads
orpt
ion
(a.u
.)
Figure 3.1 XANES Co K-edge spectra of reference compounds Co3O4, CoAl2O4, CoO
and cobalt foil (Co0).
Nor
mal
ised
ads
orpt
ion
(au)
77007700 7720 77607740Energy (eV)
Der
ivat
ive
norm
alis
ed a
bsor
ptio
n (a
.u.)
CoAl2O4
Co3O4
CoO
Co foil
Figure 3.2 XANES derivative spectra of reference compounds Co3O4, CoAl2O4, CoO and
cobalt foil (Co0).
43
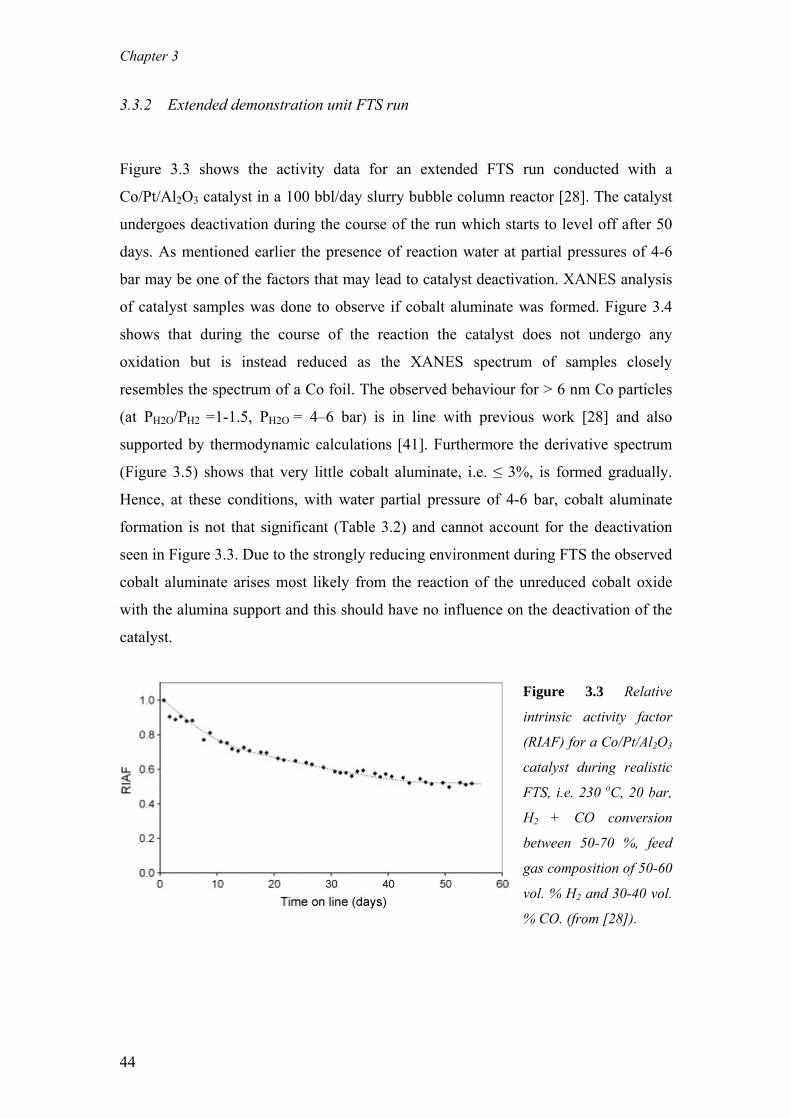
Chapter 3
3.3.2 Extended demonstration unit FTS run
Figure 3.3 shows the activity data for an extended FTS run conducted with a
Co/Pt/Al2O3 catalyst in a 100 bbl/day slurry bubble column reactor [28]. The catalyst
undergoes deactivation during the course of the run which starts to level off after 50
days. As mentioned earlier the presence of reaction water at partial pressures of 4-6
bar may be one of the factors that may lead to catalyst deactivation. XANES analysis
of catalyst samples was done to observe if cobalt aluminate was formed. Figure 3.4
shows that during the course of the reaction the catalyst does not undergo any
oxidation but is instead reduced as the XANES spectrum of samples closely
resembles the spectrum of a Co foil. The observed behaviour for > 6 nm Co particles
(at P /P =1-1.5H2O H2 , P = 4–6 barH2O ) is in line with previous work [28] and also
supported by thermodynamic calculations [41]. Furthermore the derivative spectrum
(Figure 3.5) shows that very little cobalt aluminate, i.e. ≤ 3%, is formed gradually.
Hence, at these conditions, with water partial pressure of 4-6 bar, cobalt aluminate
formation is not that significant (Table 3.2) and cannot account for the deactivation
seen in Figure 3.3. Due to the strongly reducing environment during FTS the observed
cobalt aluminate arises most likely from the reaction of the unreduced cobalt oxide
with the alumina support and this should have no influence on the deactivation of the
catalyst.
Figure 3.3 Relative
intrinsic activity factor
(RIAF) for a Co/Pt/Al2O3
catalyst during realistic
FTS, i.e. 230 oC, 20 bar,
H2 + CO conversion
between 50-70 %, feed
gas composition of 50-60
vol. % H2 and 30-40 vol.
% CO. (from [28]).
44
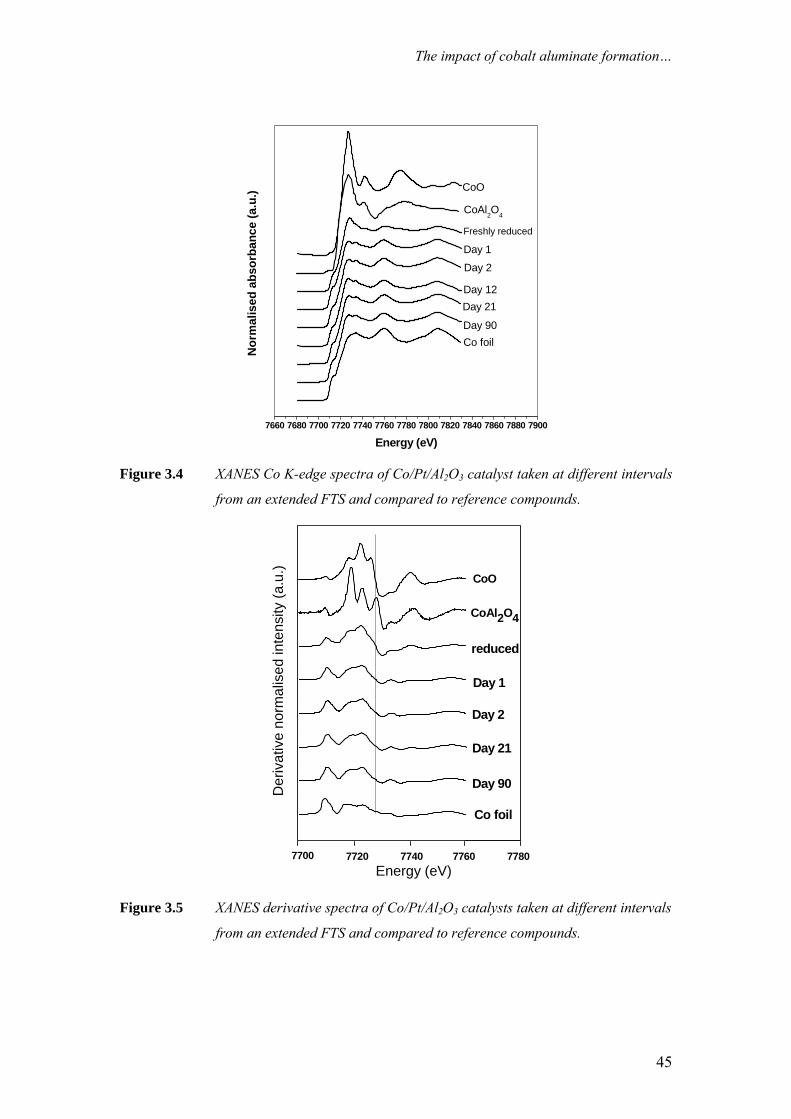
The impact of cobalt aluminate formation…
7660 7680 7700 7720 7740 7760 7780 7800 7820 7840 7860 7880 7900
Day 90
Day 21Day 12
Day 2
Day 1
Freshly reduced
Co foil
CoO
Energy (eV)
CoAl2O4
Nor
mal
ised
abs
orba
nce
(a.u
.)
Figure 3.4 XANES Co K-edge spectra of Co/Pt/Al2O3 catalyst taken at different intervals
from an extended FTS and compared to reference compounds.
7780776077407720
7700 77 20 7 740 7760
FTDU 61
CoO ref
CoAl2O 4 ref
Co 0 ref
Day 90
Day 21
Day 2
Day 1
Fresh
No
rma
lise
d A
bsor
ptio
n (A
.U.)
Energy (eV)
7700
CoO
CoAl2O4
reduced
Day 1
Day 2
Day 21
Day 90
Co foil
Der
ivat
ive
norm
alis
ed in
tens
ity (a
.u.)
Energy (eV)
Figure 3.5 XANES derivative spectra of Co/Pt/Al2O3 catalysts taken at different intervals
from an extended FTS and compared to reference compounds.
45
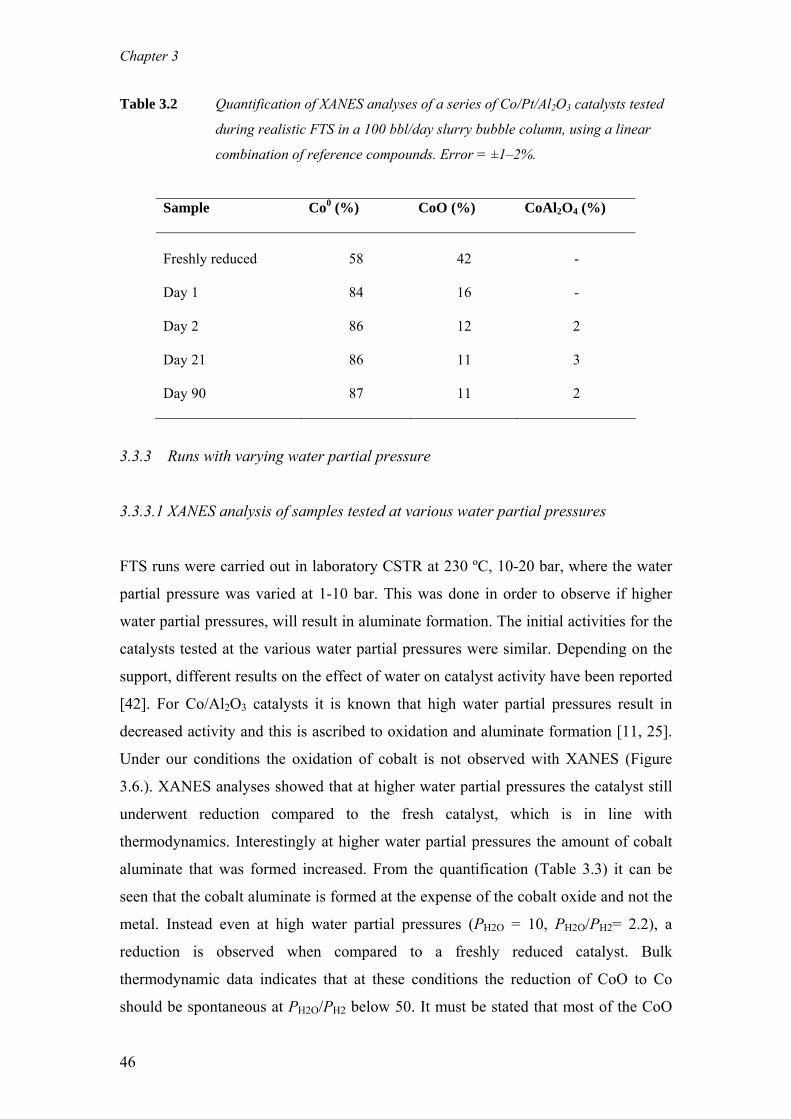
Chapter 3
Table 3.2 Quantification of XANES analyses of a series of Co/Pt/Al2O3 catalysts tested
during realistic FTS in a 100 bbl/day slurry bubble column, using a linear
combination of reference compounds. Error = ±1–2%.
Sample
Co0 (%)
CoO (%)
CoAl2O4 (%)
Freshly reduced
58
42
-
Day 1
84 16 -
Day 2
86 12 2
Day 21
86 11 3
Day 90
87 11 2
3.3.3 Runs with varying water partial pressure
3.3.3.1 XANES analysis of samples tested at various water partial pressures
FTS runs were carried out in laboratory CSTR at 230 ºC, 10-20 bar, where the water
partial pressure was varied at 1-10 bar. This was done in order to observe if higher
water partial pressures, will result in aluminate formation. The initial activities for the
catalysts tested at the various water partial pressures were similar. Depending on the
support, different results on the effect of water on catalyst activity have been reported
[42]. For Co/Al2O3 catalysts it is known that high water partial pressures result in
decreased activity and this is ascribed to oxidation and aluminate formation [11, 25].
Under our conditions the oxidation of cobalt is not observed with XANES (Figure
3.6.). XANES analyses showed that at higher water partial pressures the catalyst still
underwent reduction compared to the fresh catalyst, which is in line with
thermodynamics. Interestingly at higher water partial pressures the amount of cobalt
aluminate that was formed increased. From the quantification (Table 3.3) it can be
seen that the cobalt aluminate is formed at the expense of the cobalt oxide and not the
metal. Instead even at high water partial pressures (PH2O = 10, PH2O/PH2= 2.2), a
reduction is observed when compared to a freshly reduced catalyst. Bulk
thermodynamic data indicates that at these conditions the reduction of CoO to Co
should be spontaneous at PH2O/PH2 below 50. It must be stated that most of the CoO
46
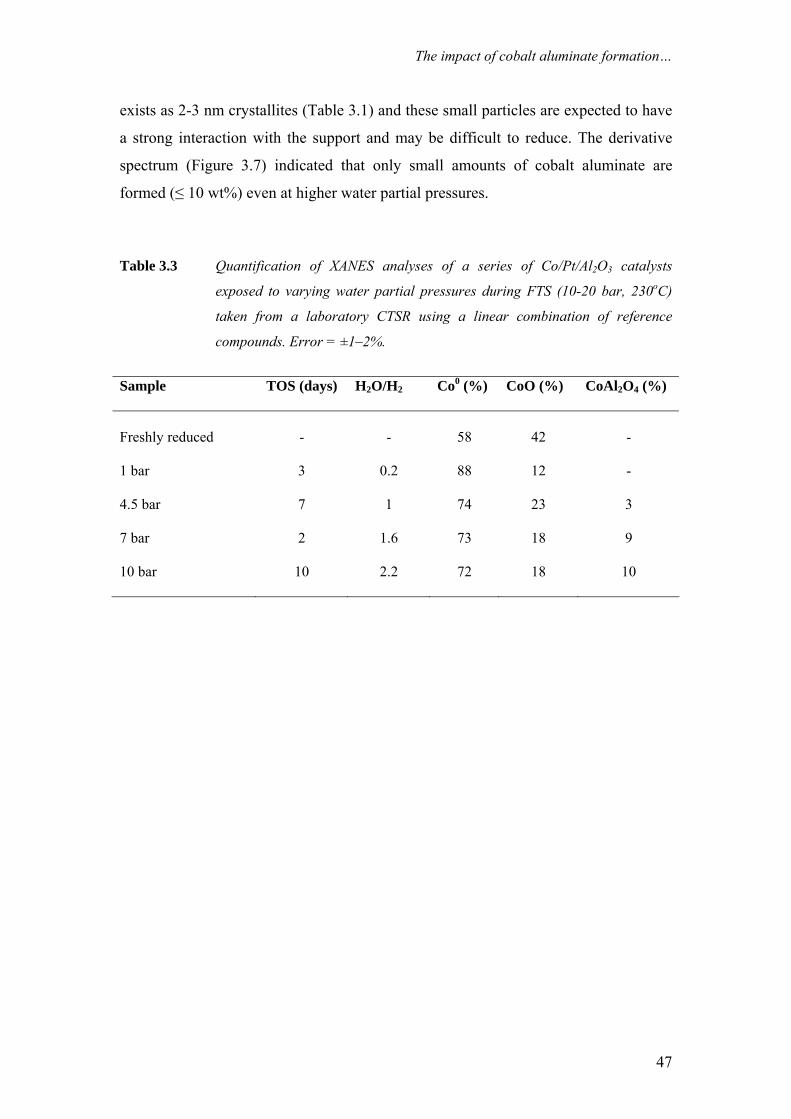
The impact of cobalt aluminate formation…
exists as 2-3 nm crystallites (Table 3.1) and these small particles are expected to have
a strong interaction with the support and may be difficult to reduce. The derivative
spectrum (Figure 3.7) indicated that only small amounts of cobalt aluminate are
formed (≤ 10 wt%) even at higher water partial pressures.
Table 3.3 Quantification of XANES analyses of a series of Co/Pt/Al2O3 catalysts
exposed to varying water partial pressures during FTS (10-20 bar, 230oC)
taken from a laboratory CTSR using a linear combination of reference
compounds. Error = ±1–2%.
Sample
TOS (days) H2O/H2 Co0 (%)
CoO (%)
CoAl2O4 (%)
Freshly reduced
-
-
58
42
-
1 bar
3 0.2 88 12 -
4.5 bar
7 1 74 23 3
7 bar
2 1.6 73 18 9
10 bar
10 2.2 72 18 10
47
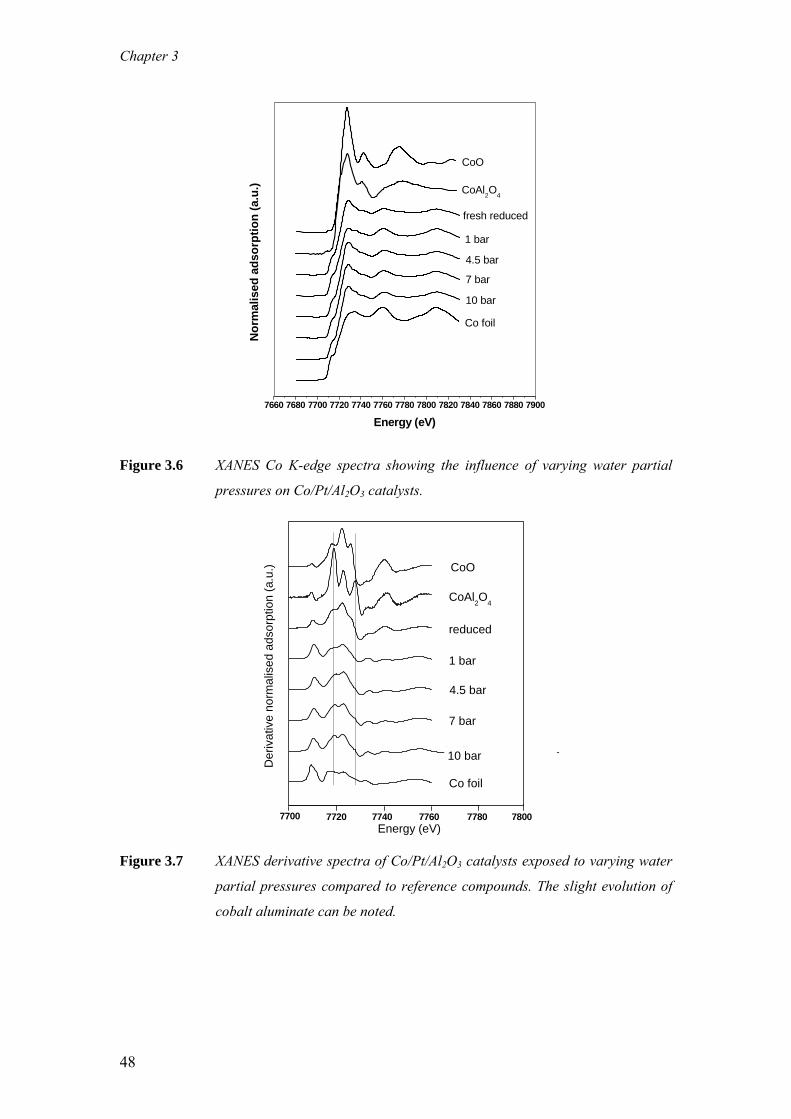
Chapter 3
7660 7680 7700 7720 7740 7760 7780 7800 7820 7840 7860 7880 7900
Nor
mal
ised
ads
orpt
ion
(a.u
.)
10 bar
7 bar
4.5 bar
1 bar
Co foil
CoO
Energy (eV)
CoAl2O4
fresh reduced
Figure 3.6 XANES Co K-edge spectra showing the influence of varying water partial
pressures on Co/Pt/Al2O3 catalysts.
78007780776077407720
7700 7720 7740 7760
Influence of PH2O
CoAl2O 4-ref
Coo-ref
10 bar H2O - H 2O /H 2 = 2.2
7 bar H 2O - H 2O /H2 = 1.6
4.5 bar H2O - H
2O/H
2 = 1
1 bar H2O - H 2O/H 2 = 0.2
HC200-Freshly reduced
CoO- ref
Der
ivat
ive
(Nor
mal
ised
Abs
orpt
ion)
Energy (eV)
7700
CoO
CoAl2O4
reduced
1 bar
4.5 bar
7 bar
10 bar
Co foil
Energy (eV)
Der
ivat
ive
norm
alis
ed a
dsor
ptio
n (a
.u.)
Figure 3.7 XANES derivative spectra of Co/Pt/Al2O3 catalysts exposed to varying water
partial pressures compared to reference compounds. The slight evolution of
cobalt aluminate can be noted.
48
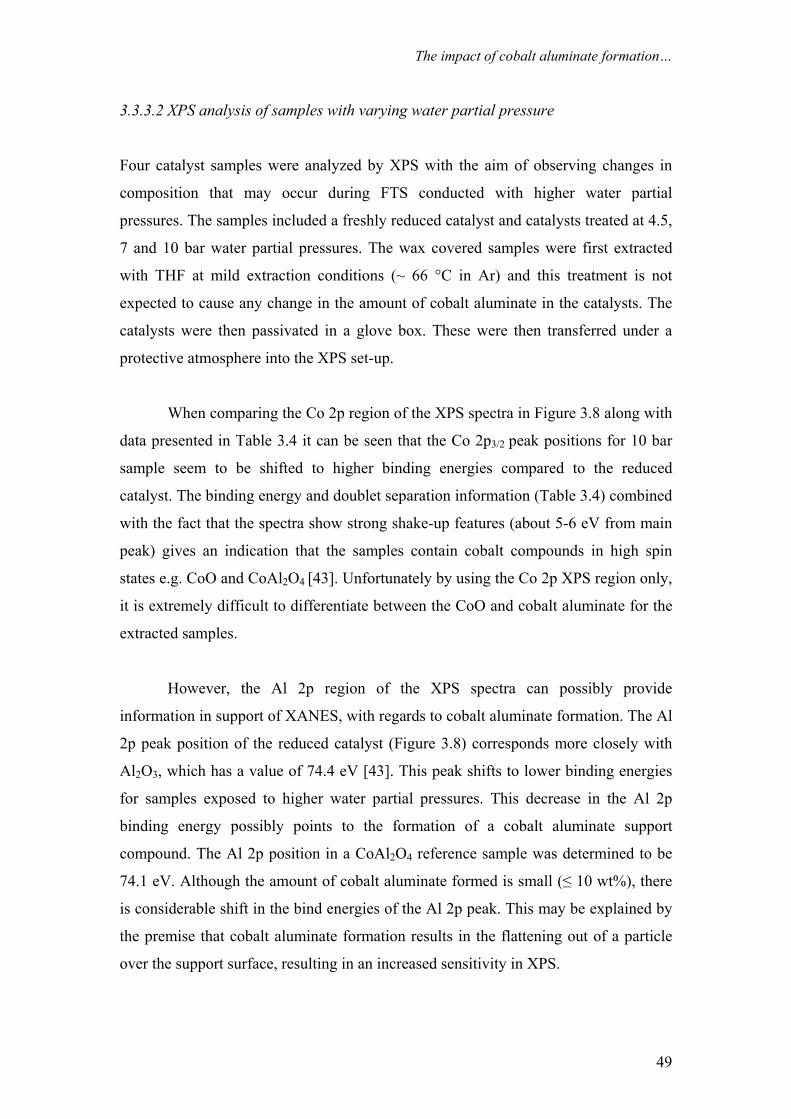
The impact of cobalt aluminate formation…
3.3.3.2 XPS analysis of samples with varying water partial pressure
Four catalyst samples were analyzed by XPS with the aim of observing changes in
composition that may occur during FTS conducted with higher water partial
pressures. The samples included a freshly reduced catalyst and catalysts treated at 4.5,
7 and 10 bar water partial pressures. The wax covered samples were first extracted
with THF at mild extraction conditions (~ 66 °C in Ar) and this treatment is not
expected to cause any change in the amount of cobalt aluminate in the catalysts. The
catalysts were then passivated in a glove box. These were then transferred under a
protective atmosphere into the XPS set-up.
When comparing the Co 2p region of the XPS spectra in Figure 3.8 along with
data presented in Table 3.4 it can be seen that the Co 2p3/2 peak positions for 10 bar
sample seem to be shifted to higher binding energies compared to the reduced
catalyst. The binding energy and doublet separation information (Table 3.4) combined
with the fact that the spectra show strong shake-up features (about 5-6 eV from main
peak) gives an indication that the samples contain cobalt compounds in high spin
states e.g. CoO and CoAl2O4 [43]. Unfortunately by using the Co 2p XPS region only,
it is extremely difficult to differentiate between the CoO and cobalt aluminate for the
extracted samples.
However, the Al 2p region of the XPS spectra can possibly provide
information in support of XANES, with regards to cobalt aluminate formation. The Al
2p peak position of the reduced catalyst (Figure 3.8) corresponds more closely with
Al2O3, which has a value of 74.4 eV [43]. This peak shifts to lower binding energies
for samples exposed to higher water partial pressures. This decrease in the Al 2p
binding energy possibly points to the formation of a cobalt aluminate support
compound. The Al 2p position in a CoAl2O4 reference sample was determined to be
74.1 eV. Although the amount of cobalt aluminate formed is small (≤ 10 wt%), there
is considerable shift in the bind energies of the Al 2p peak. This may be explained by
the premise that cobalt aluminate formation results in the flattening out of a particle
over the support surface, resulting in an increased sensitivity in XPS.
49
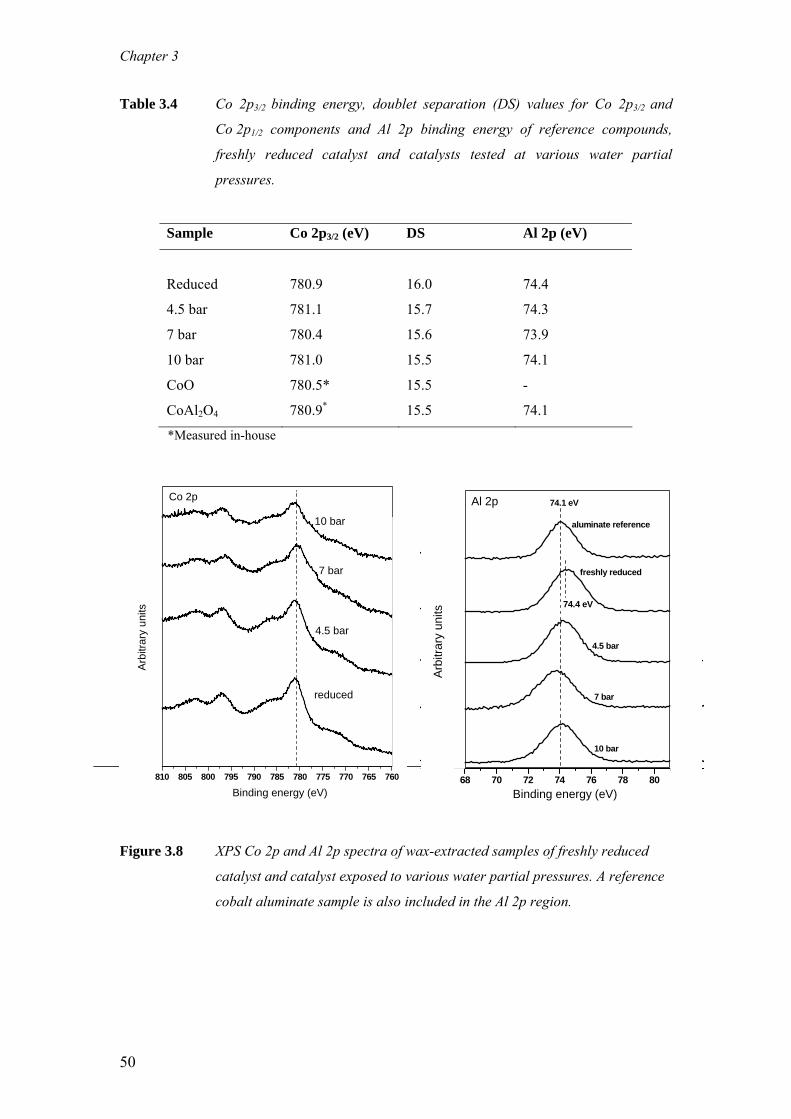
Chapter 3
Table 3.4 Co 2p3/2 binding energy, doublet separation (DS) values for Co 2p3/2 and
Co 2p1/2 components and Al 2p binding energy of reference compounds,
freshly reduced catalyst and catalysts tested at various water partial
pressures.
Sample Co 2p3/2 (eV) DS Al 2p (eV)
Reduced 780.9 16.0 74.4
4.5 bar 781.1 15.7 74.3
7 bar 780.4 15.6 73.9
10 bar 781.0 15.5 74.1
CoO 780.5* 15.5 -
CoAl2O4 780.9* 15.5 74.1
*Measured in-house
0 815 810 805 800 795 790 785 780 775 770 765 760
Arbi
trary
uni
ts
Binding energy (eV)
Arb
itrar
y un
its
reduced
4.5 bar
7 bar
10 bar
Co 2p
66 68 70 72 74 76 78 80 82Binding energy (eV)
10 bar
7 bar
Arb
itrar
y un
its
74.4 eV
4.5 bar
freshly reduced
aluminate reference
74.1 eVAl 2p
Figure 3.8 XPS Co 2p and Al 2p spectra of wax-extracted samples of freshly reduced
catalyst and catalyst exposed to various water partial pressures. A reference
cobalt aluminate sample is also included in the Al 2p region.
50
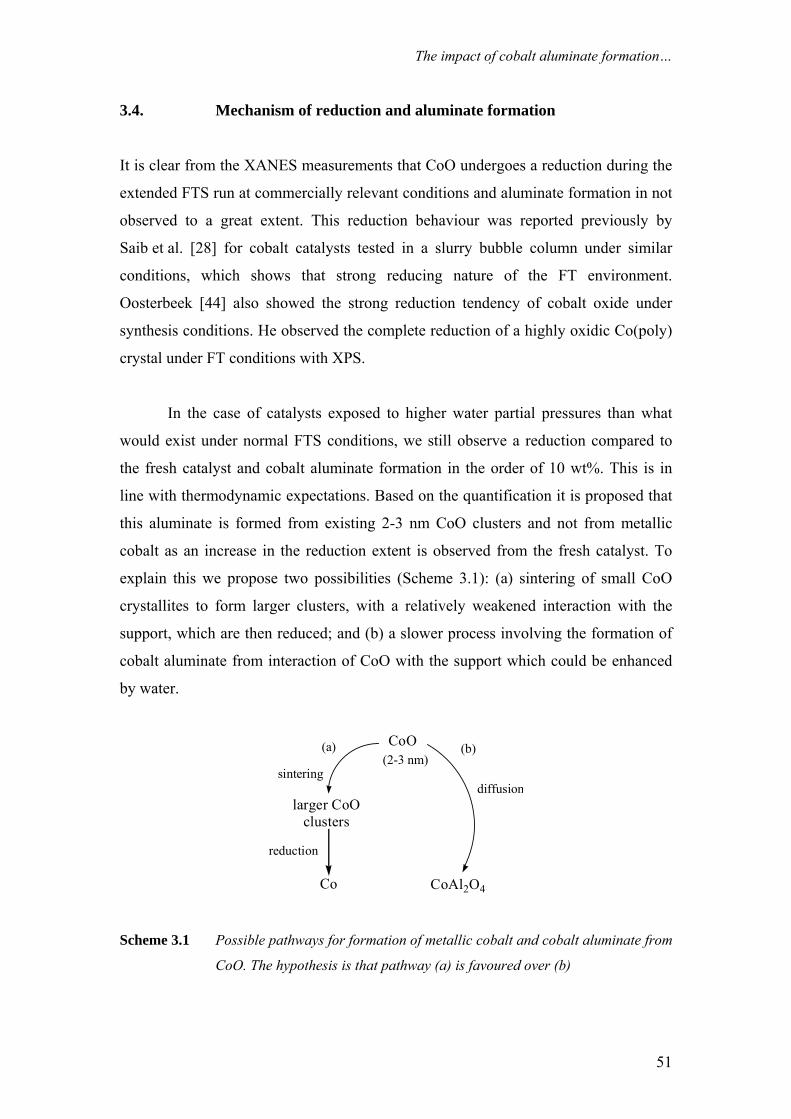
The impact of cobalt aluminate formation…
3.4. Mechanism of reduction and aluminate formation
It is clear from the XANES measurements that CoO undergoes a reduction during the
extended FTS run at commercially relevant conditions and aluminate formation in not
observed to a great extent. This reduction behaviour was reported previously by
Saib et al. [28] for cobalt catalysts tested in a slurry bubble column under similar
conditions, which shows that strong reducing nature of the FT environment.
Oosterbeek [44] also showed the strong reduction tendency of cobalt oxide under
synthesis conditions. He observed the complete reduction of a highly oxidic Co(poly)
crystal under FT conditions with XPS.
In the case of catalysts exposed to higher water partial pressures than what
would exist under normal FTS conditions, we still observe a reduction compared to
the fresh catalyst and cobalt aluminate formation in the order of 10 wt%. This is in
line with thermodynamic expectations. Based on the quantification it is proposed that
this aluminate is formed from existing 2-3 nm CoO clusters and not from metallic
cobalt as an increase in the reduction extent is observed from the fresh catalyst. To
explain this we propose two possibilities (Scheme 3.1): (a) sintering of small CoO
crystallites to form larger clusters, with a relatively weakened interaction with the
support, which are then reduced; and (b) a slower process involving the formation of
cobalt aluminate from interaction of CoO with the support which could be enhanced
by water.
CoO(2-3 nm)
larger CoO clusters
Co
sinteringdiffusion
CoAl2O4
reduction
(a) (b)
Scheme 3.1 Possible pathways for formation of metallic cobalt and cobalt aluminate from
CoO. The hypothesis is that pathway (a) is favoured over (b)
51
Chapter 3
As mentioned earlier, it is expected that the small CoO crystallites have a
strong interaction with the support. However water is known to affect the interface
energy between the support and crystallites and the dynamic gas environment that
exists can drive the sintering process [45]. Once the CoO crystallites sinter to above
4-5 nm then it is thermodynamically [41] and possibly kinetically favourable for them
to be transformed to Co in the highly reducing H2/CO environment [46].
The formation of cobalt aluminate is known to proceed via CoO as an
intermediate [7]. The presence of water can result in hydration of the alumina support
as reported by Oukaci et al. [47]. The hydrated alumina appears to enhance the
diffusion of small CoO particles in strong interaction with the support, during
prolonged treatment resulting in the formation of non-reducible cobalt aluminate. This
may explain why small amounts of aluminate are formed in the case of catalyst
exposed to higher water partial pressures [47]. It is expected that this is a kinetically
slow process as it involves diffusion into the support [48]. It is therefore believed that
the sintering/reduction process (a) is favoured over the transformation of CoO into
aluminate (b).
The observed deactivation in the demonstration unit can thus not be explained
by oxidation or aluminate formation. The reduction to Co metal should have resulted
in an increase in intrinsic catalyst activity however this was not the case. The
deactivation is most likely due to a complex interplay of other deactivation
mechanisms such as sintering (enhanced by water), surface reconstruction and carbon
deposition which may overshadow the effect of CoO reduction.
3.5 Conclusions
During this study we showed that XANES can distinguish between CoO, CoAl2O4
and Co0 in wax-coated cobalt on alumina FTS catalysts, taken from a 100 bbl/day
slurry bubble column reactor, with reasonable sensitivity. We did not observe
oxidation of > 6 nm Co crystallites at PH2O/PH2 ratios up to 2.2 but instead reduction
of CoO was noted. The amount of cobalt aluminate formed was small and it appears
that its formation is difficult during FTS (surface and bulk). Water does seem to
enhance aluminate formation but even at high water partial pressure (10 bar) less than
52
The impact of cobalt aluminate formation…
10 wt% cobalt aluminate formed and a reduction was observed compared to a fresh
catalyst. The cobalt aluminate that did form, resulted from existing CoO. This leads us
to the conclusion that cobalt aluminate formation does not influence deactivation of
cobalt catalysts during realistic FTS conditions. The observed deactivation is likely
due to an interplay between other phenomena which may include, sintering, surface
reconstruction and carbon deposition.
Acknowledgements
The authors would like to thank Mr. Tiny Verhoeven and Dr. Ionel Ciobîcă for
assistance during XANES measurements.
3.6 References
[1] R. Zennaro, Oil Gas 2 (2007) 88. [2] A.P. Steynberg, M.E. Dry (Eds.), Fischer-Tropsch Technology, Studies in Surface Science
and Catalysis, Vol. 152, Elsevier, 2004. [3] E. Iglesia, Appl. Catal. A 161 (1997) 59. [4] M. E. Dry, Appl. Catal. A 276 (2004) 1. [5] C.H. Bartholomew, R.M. Bowman, Appl. Catal. 15 (1985) 59. [6] J. Inga, P. Kennedy, S. Leviness, United States Patent Application 20050154069 A1 (2004) to
Syntroleum. [7] P.J van Berge, J. van de Loosdrecht, S. Barradas, A.M. van der Kraan, Catal. Today 58 (2000)
321. [8] G.Z. Bian, N. Fujishita, T. Mochizuki, W.S. Ning, M. Yamada, Appl. Catal. A 252 (2003)
251. [9] G.L. Bezemer, J.H. Bitter, H.P.C.E. Kuipers, H. Oosterbeek, J.E. Holewijn, X. Xu, F.
Kapteijn, A.J. van Dillen, K.P. de Jong, J. Am. Chem. Soc. 128 (2006) 3956. [10} J. Wilson, C. de Groot, J. Phys. Chem. 99 (1995) 7860. [11] J. Li, G. Jacobs, T. Das, B.H. Davis, Appl. Catal. A 228 (2002) 203. [12] G. Kiss, C. Kliewer, G.J. DeMartin, C.C. Culross, J.E. Baumgartner, J. Catal. 217 (2003) 127. [13] V. Gruver, R. Young, J. Engman, H.J. Robota, Prepr. Pap.-Am. Chem. Soc., Div. Pet. Chem.
50 (2005) 164. [14] J.J.H.M. Font Freide, T.D. Gamlin, R.J. Hensman, B. Nay, C. Sharp, J. Nat. Gas Chem. 13
(2004) 1. [15] J. van de Loosdrecht, S. Barradas, E.A. Caricato, N.G. Ngwenya, P.S. Nkwanyana, M.A.S.
Rawat, B.H. Sigwebela, P.J. van Berge, J.L. Visagie, Top. Catal. 26 (2003) 121. [16] R. Oukaci, A.H. Singleton, J.G. Goodwin Jr., Appl. Catal. A 186 (1999) 129. [17] F. Dumond, E. Marceau, M. Che, J. Phys. Chem. C, 111 (2007) 4780. [18] W. Chu, P.A. Chernavskii, L. Gengembre, G.A. Pankina, P. Fongarland, A.Y. Khodakov, J.
Catal. 252 (2007) 215. [19] B. Jongsomjit, J. Panpranot, J.G. Goodwin Jr., J. Catal. 204 (2001) 98. [20] W.J. Wang, Y.W. Chen, Appl. Catal. 77 (1991) 223. [21] P.H. Bolt, “Transition metal-aluminate formation in alumina-supported model catalysts”, PhD
thesis, University of Utrecht, The Netherlands, 1994. [22] R.B. Anderson, in: P.H. Emmett (Ed.), Catalysis, Vol. 4, Reinhold, New York, 1956. [23] D. Schanke, A.M. Hilmen, E. Bergene, K. Kinnari, E. Rytter, E. Ådnanes, A. Holmen, Catal.
Lett. 345 (1995) 269.
53
Chapter 3
[24] G. Jacobs, T.K. Das, P.M. Patterson, J. Li, L. Sanchez, B.H. Davis, Appl. Catal. A 247 (2003) 335.
[25] G. Jacobs, P.M. Patterson. Y. Zhang, T. Das, J. Li, B. Davis, Appl. Catal. A 233 (2002) 215. [26] A.M. Hilmen, D. Schanke, K.F. Hanssen, A. Holmen, Appl. Catal. A 186 (1999) 169. [27] A. Tavasoli, A. Nakhaeipour, K. Sadaghiani, Fuel Proc. Tech. 88 (2007) 461. [28] A.M. Saib, A. Borgna, J. van de Loosdrecht, P.J. van Berge, J.W. Niemantsverdriet, Appl.
Catal. A 312 (2006) 12. [29] P.J. van Berge, J. van de Loosdrecht, J.L. Visagie, United States Patent 6 806 226 (2004), to
Sasol. [30] P.J. van Berge, J. van de Loosdrecht, E. Caricato, S. Barradas, B.H. Sigwebela, United States
Patent 6 455 462 (2002), to Sasol. [31] P.J. van Berge, J. van de Loosdrecht, E. Caricato, S. Barradas, United States Patent 6 638 889
(2004), to Sasol. [32] R.L. Espinoza, J.L. Visagie, P.J. van Berge, F.H. Bolder, United States Patent 5 733 839
(1998), to Sasol. [33] P.J. van Berge, J. van de Loosdrecht, J.L. Visagie, T.J. van der Walt, H. Veltman, C. Sollie,
European Patent 1 444 040 B1 (2003), to Sasol. [34] P.J. van Berge, J. van de Loosdrecht, J.L. Visagie, United States Patent 6 385 690 (2004), to
Sasol. [35] C.A. Chanenchuk, I.C. Yates, C.N. Satterfield, Energy Fuels 5 (1991) 847. [36] I.C. Yates, C.N. Satterfield, Energy Fuels 5 (1991) 168. [37] H. Shultz, A. Geertsema, Erdöl und Kohle 20 (1985) 38. [38] www.csrri.iit.edu/periodic-table.html. [39] D. Bazin, I. Kovacs, L. Guczi, P. Parent, C. Laffon, F. de Groot, O. Ducreux, J. Lynch, J.
Catal. 189 (2000) 456. [40] M. Zayat, D. Levy, Chem. Mater. 12 (2000) 2763. [41] E. van Steen, M. Claeys, M. Dry, E. Viljoen, J. van de Loosdrecht, J.L. Visagie, J. Phys.
Chem. B 109 (2005) 3575. [42] Ø. Borg, S. Storsæter, S. Eri, H. Wigum, E. Rytter, A. Holmen, Catal. Lett. 107 (2006) 95. [43] N.S. McIntyre, M.G. Cook, Anal. Chem. 47 (1975) 2208. [44] H. Oosterbeek, Phys. Chem. Chem. Phys. 9 (2007) 3570. [45] P. Hansen, J.B. Wagner, S. Helveg, J.R. Rostrup-Nielsen, B.S. Clausen, H. Topsøe, Science
295 (2002) 2053. [46] A. M. Saib, “Towards a cobalt Fisher-Tropsch synthesis catalyst with enhanced stability: A
combined approach”, PhD thesis, Eindhoven University of Technology, The Netherlands, 2006.
[47] A. Sirijaruphana, A. Horvath, J.G. Goodwin Jr., R. Oukaci, Catal. Lett. 91 (2003) 89. [48] P.H. Bolt, F.H.P.M. Habraken, J.W. Geus, J. Solid State Chem. 135 (1998) 59.
54
Chapter 4
The formation and influence of carbon on cobalt-based Fischer-Tropsch synthesis
catalysts: A Review Cobalt-based Fischer-Tropsch synthesis (FTS) catalysts are the systems of choice for
use in gas-to-liquid (GTL) processes. As with most catalysts, cobalt systems partially
lose their activity with increasing time-on-stream. There are various mechanisms that
have been proposed for the deactivation of cobalt-based catalysts during realistic
FTS conditions. These include poisoning, sintering, oxidation, metal support
compound formation, restructuring of the active phase and carbon deposition. Most
of the recent research activities on cobalt catalyst deactivation during the FTS have
focused on loss of catalyst activity due to oxidation of the metal and support
compound formation. Relatively few recent studies have been conducted on the topic
of carbon deposition on cobalt-based FTS catalysts. The purpose of this review is to
integrate the existing open and patent literature to provide a clearer understanding
on the role of carbon as a deactivation mechanism.
Chapter 4
4.1 Introduction and scope The Fischer-Tropsch synthesis (FTS) is a process that converts synthesis gas into
mixtures of higher molecular weight hydrocarbons [1]. The FTS is at the heart of the
gas-to-liquids (GTL) process which converts natural gas to “clean” synfuels [2]. This
approach is attractive due to the rising oil price and the need to comply with more
stringent legislation on the quality of liquid fuels [3].
The two catalytically active metals for FTS which are used in industry are iron
(fused or precipitated) and cobalt (supported). Iron catalysts display higher water gas
shift activities (CO + H2O → CO2 + H2) and are more suitable for use with coal and
biomass-derived synthesis gas feeds, which have lower hydrogen content [4]. Cobalt
catalysts exhibit high per pass activities, have low water gas shift activity which leads
to improved carbon utilization and are suitable for use on synthesis gas produced via
reforming of natural gas [5]. Cobalt FTS catalysts yield mainly straight chain
hydrocarbons. Since cobalt is much more expensive than iron, dispersing the ideal
concentration and size of metal nanoparticles onto a support can help reduce catalyst
costs while maximizing activity and durability. However, as with almost all catalysts,
cobalt FTS catalysts also deactivate with time-on-stream.
Various mechanisms have been proposed for the deactivation of cobalt-based
catalysts during realistic FTS conditions. These include:
(a) Oxidation of the active phase and support compound formation
The oxidation of cobalt metal to inactive cobalt oxide by product water has long been
postulated to be a major cause of deactivation of supported cobalt FTS catalysts [6-
10]. Recent work has shown that the oxidation of cobalt metal to the inactive cobalt
oxide phase can be prevented by the correct tailoring of the ratio PH2O/PH2 and the
cobalt crystallite size [11]. Using a combination of model systems, industrial catalyst
and thermodynamic calculations it was concluded that Co crystallites > 6 nm will not
undergo any oxidation during realistic FTS, i.e. PH2O/PH2 = 1-1.5 [11-14].
Deactivation may also result from the formation of inactive cobalt support compounds
(e.g. aluminate). Cobalt aluminate formation which likely proceeds via the reaction of
56
The formation and influence of carbon on cobalt-based FTS catalysts: A Review
CoO with the support is thermodynamically favourable but kinetically restricted under
typical FTS conditions [6].
(b) Poisoning by contaminants in the synthesis gas feed
One of the causes of deactivation and selectivity changes is the strong chemisorption
of poisons on the metallic cobalt phase. According to Bartholomew [15] poisons may
(a) block active sites for the reaction (b) electronically modify the metals nearest
neighbour affecting chemisorption and dissociation of CO and (c) cause
reconstruction of the catalyst surface resulting in a more stable configuration. Sulphur
[16], halides and NH3/HCN [17-20] are generally the major poisons for cobalt
catalysts during FTS. Poisoning is synthesis gas feed related and can therefore be
minimised through synthesis gas purification steps, e.g. (1) ZnO guard beds reduce
sulphur levels significantly [21] and (2) a synthesis gas washing step with an aqueous
solution of alkaline ferrous sulphate promotes the absorption of the above-mentioned
impurities [22].
(c) Sintering of the cobalt active phase
To prepare a good catalyst in terms of activity and cost, cobalt nanoparticles have to
be well dispersed on a support which typically consists of alumina, silica or titania.
Small metal particles have a high surface free energy and tend to minimise this either
by changing shape or agglomerating together (sintering). Sintering results in
deactivation via the loss of catalytic surface area and has previously been reported
during FTS on cobalt catalysts [8, 23, and 24]. Sintering may occur via crystallite
migration and coalescence or by atom migration/ Oswald ripening [15]. The Hüttig
temperature of cobalt, at which atoms at defects become mobile, is 253 °C [25], close
to temperatures employed for realistic FTS conditions, supporting the above evidence
for sintering. It should also be noted that sintering of the active phase may be
facilitated by reaction water [15] and the formation of mobile sub-carbonyl
species [26].
57
Chapter 4
(d) Cobalt reconstruction
It has been observed that cobalt may undergo large scale reconstruction under a
synthesis gas environment [27]. Reconstruction is a thermodynamically driven
process that results in the stabilization of less reactive surfaces. Recent molecular
modeling calculations have shown that atomic carbon can induce the clock
reconstruction of an fcc cobalt (100) surface [28] (see section 4.4 for further details).
It has also been postulated and shown with in-situ X-ray adsorption spectroscopy
(XAS) on cobalt supported on carbon nanofibres that small particles (< 6 nm) undergo
a reconstruction during FTS which can result in decreased activity [29].
(e) Fouling by product wax and deposition of carbon
Although the FTS is considered a carbon in-sensitive reaction [30] deactivation of the
cobalt active phase by carbon deposition during FTS has been widely postulated [31-
38]. This mechanism, however, is hard to prove during realistic synthesis conditions
due to the presence of heavy hydrocarbon wax product and the potential spillover and
buildup of inert carbon on the catalyst support. Also, studies have been conducted on
supported cobalt catalysts that suggest deactivation by pore plugging of narrow
catalyst pores by the heavy (> C40) wax product [39, 40]. Very often regeneration
treatments which remove these carbonaceous phases from the catalyst result in
reactivation of the catalyst [32]. Many of the companies with experience in cobalt-
based FTS research report that these catalysts are negatively influenced by carbon
(Table 4.1).
The purpose of this review is to integrate the literature on this topic to provide
a clearer understanding on the role of carbon as a deactivation mechanism.
Characterization techniques that have been used as well as the minimization of
carbon, regeneration of catalysts and some selectivity implications will also be briefly
discussed.
58
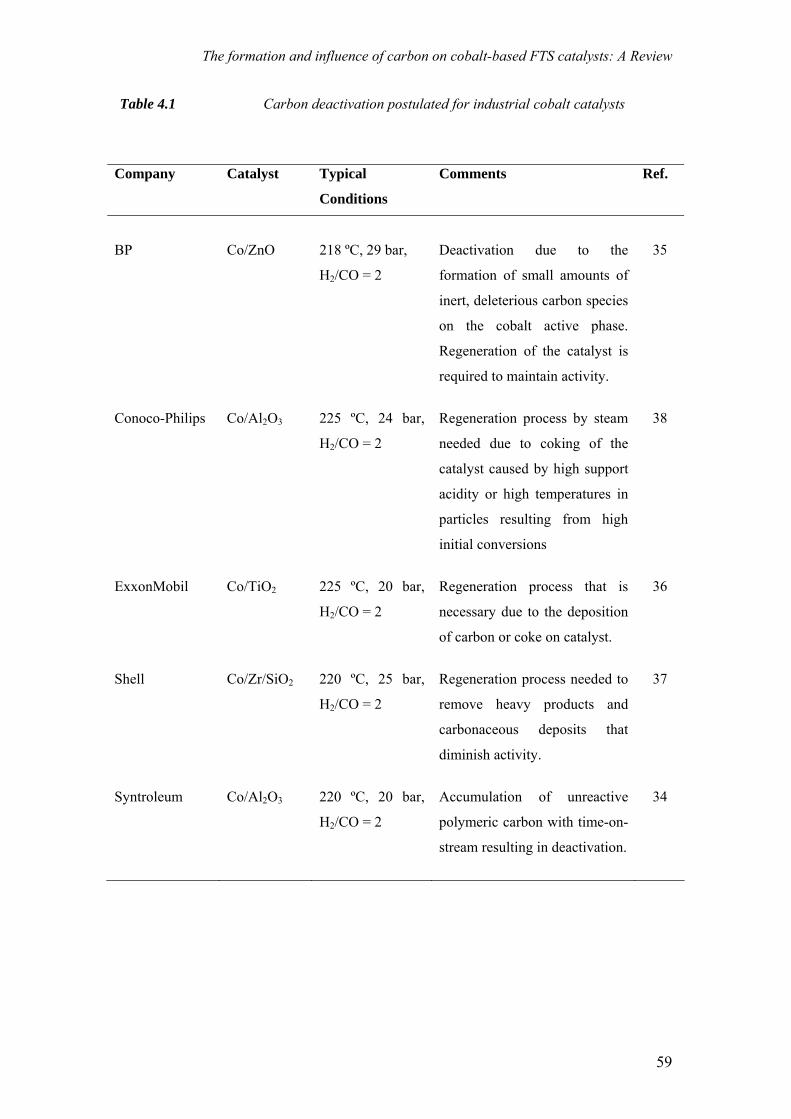
The formation and influence of carbon on cobalt-based FTS catalysts: A Review
Table 4.1 Carbon deactivation postulated for industrial cobalt catalysts
Company Catalyst Typical
Conditions
Comments Ref.
BP Co/ZnO 218 ºC, 29 bar,
H2/CO = 2
Deactivation due to the
formation of small amounts of
inert, deleterious carbon species
on the cobalt active phase.
Regeneration of the catalyst is
required to maintain activity.
35
Conoco-Philips Co/Al2O3 225 ºC, 24 bar,
H2/CO = 2
Regeneration process by steam
needed due to coking of the
catalyst caused by high support
acidity or high temperatures in
particles resulting from high
initial conversions
38
ExxonMobil Co/TiO2 225 ºC, 20 bar,
H2/CO = 2
Regeneration process that is
necessary due to the deposition
of carbon or coke on catalyst.
36
Shell Co/Zr/SiO2 220 ºC, 25 bar,
H2/CO = 2
Regeneration process needed to
remove heavy products and
carbonaceous deposits that
diminish activity.
37
Syntroleum Co/Al2O3 220 ºC, 20 bar,
H2/CO = 2
Accumulation of unreactive
polymeric carbon with time-on-
stream resulting in deactivation.
34
59
Chapter 4
4.2 Formation of carbon deposits on cobalt catalysts during FTS and
implications for activity
Carbonaceous species on metal surfaces can be formed as a result of interaction of
metals with carbon monoxide or hydrocarbons. In the FTS, where CO and H2 are
converted to various hydrocarbons, it is generally accepted that an elementary step in
the reaction is the dissociation of CO to form surface carbidic carbon and oxygen [1].
The latter is removed from the surface through the formation of gaseous H2O and CO2
(mostly in the case of Fe catalysts). The surface carbon if it remains in its carbidic
form is an intermediate in the FTS and can be hydrogenated to form hydrocarbons.
However, the surface carbidic carbon may also be converted to other less reactive
forms of carbon, which may build up over time and influence the activity of the
catalyst [15].
There are a number of ways that carbon may interact with a cobalt catalyst to
affect its performance during FTS:
(a) Carbon deposits or heavy hydrocarbons (> C100) may block the catalyst pores
causing diffusion problems [39].
(b) Carbon may adsorb on the metal surface irreversibly therefore acting as a
poison [35]. This irreversibly bonded carbon could also affect the adsorption
and dissociation of neighbouring species such as CO.
(c) Carbon could also go subsurface and play a role in electronic inhibition of
activity by affecting the adsorption and dissociation of CO [41].
(d) Carbon may bind to a metal surface and induce a surface reconstruction
whereby a more active metal plane is transformed to one with a lower
activity [28].
(e) At higher temperatures, out of the typical FT regime, carbon could encapsulate
the active metal thereby blocking access to reactants. In extreme cases carbon
filaments can also be formed which can result in the break up of catalyst
particles [42].
60
The formation and influence of carbon on cobalt-based FTS catalysts: A Review
4.3 Classification of carbon types on cobalt FTS catalysts
Figure 4.1 summarises the different routes that can potentially lead to carbon
deposition during FTS: (a) CO dissociation occurs on cobalt to form an adsorbed
atomic carbon, which is also referred to as surface carbide, which can further react to
produce the FT intermediates and products. The adsorbed atomic carbon may also
form bulk carbide or a polymeric type of carbon. Carbon deposition may also result
from the Boudouard reaction (b) and due to further reaction and dehydrogenation of
FTS product (what is commonly called coke) (c), a reaction which should be limited
at typical FT reaction conditions. Carbon formed on the surface of cobalt can also
spill over or migrate to the support. This is reported to readily occur on Co/Al2O3
catalysts [43]. The chemical nature of the carbonaceous deposits during FTS will
depend on the conditions of temperature and pressure, the age of the catalyst, the
chemical nature of the feed and the products formed.
It would be fitting at this stage to define in detail the various carbon species
for this review as often different terms are used in the literature. A representation of
the various carbon species is shown in Figure 4.2. Surface carbide or atomic carbon
can be defined as isolated carbon atoms with only carbon-metal bonds, resulting from
CO dissociation or disproportionation, the latter of which is not favoured on cobalt at
normal FTS conditions. Recent theoretical and experimental work has indicated that
the CO dissociation is preferred at the step sites so adsorbed surface carbide is
expected to be located near these sites [44, 45, 46].
CHx and hydrocarbon wax are respectively, the active intermediates formed by
the hydrogenation of surface carbide and products of FTS formed by chain growth
and hydrogenation of CHx intermediates. The hydrocarbon wax can contain molecules
with the number of carbon atoms in excess of 100. Bulk carbide refers to a crystalline
CoxC structure formed by the diffusion of carbon into bulk metal. Subsurface carbon
may be a precursor to these bulk species and is formed when surface carbon diffuses
into a octahedral position under the first surface layer of cobalt atoms.
Polymeric carbon refers to chains of carbon monomers (surface carbide) that
are connected by covalent bonds. It has been shown recently [47] that the barrier for
61
Chapter 4
C-C coupling on flat surfaces (1.22 eV) is half that for a step site (2.43 eV) and may
indicate that the growth of these polymeric species is favoured on terraces. Polymeric
carbon may also refer to carbon chains that contain hydrogen. In the case of CO
hydrogenation on ruthenium catalysts polymeric carbon has been identified as a less
reactive carbon that forms from polymerisation of CHx and has an alkyl group
structure [48].
Graphene is a single layer of carbon atoms densely packed into a benzene-ring
structure and may be considered a precursor to graphite. In graphite, each carbon
atom is covalently bonded to three other surrounding carbon atoms. The flat sheets of
carbon atoms are bonded into hexagonal structures, which are layered. These
graphitic species (or free carbon as they are often called) have strong carbon-carbon
bonds and weaker bonds to the metal surface. The Boudouard reaction (2CO → C +
CO2) at FTS temperatures (around 230 °C) has been reported on cobalt catalysts and
also results in the deposition of atomic carbon and its transformation to polymeric or
graphitic forms of carbon on the surface [49]. Typically at high temperature
Boudouard carbon can diffuse in cobalt to form metastable bulk carbide species [50].
The decomposition of the bulk carbide results in the formation of filaments and other
forms of carbon on the surface. Filaments consist of stacked cone-segment (frustum)
shaped graphite basal plane sheets and grow with a catalyst particle at their tip and, as
can be expected, lead to the break-up of the catalyst [50]. Another graphitic
nanomaterial produced by carbon deposition is encapsulated metal nanoparticles [50].
These are roughly spherical formations, consisting of catalyst particles surrounded by
graphitic carbon.
These different types of carbon tend to have different reactivities towards
gases such as hydrogen, oxygen or steam. Hence, a relatively simple technique such
as temperature programmed hydrogenation or oxidation can be used to classify them.
Table 4.2 summarises different reactivities of carbon species towards hydrogen.
62
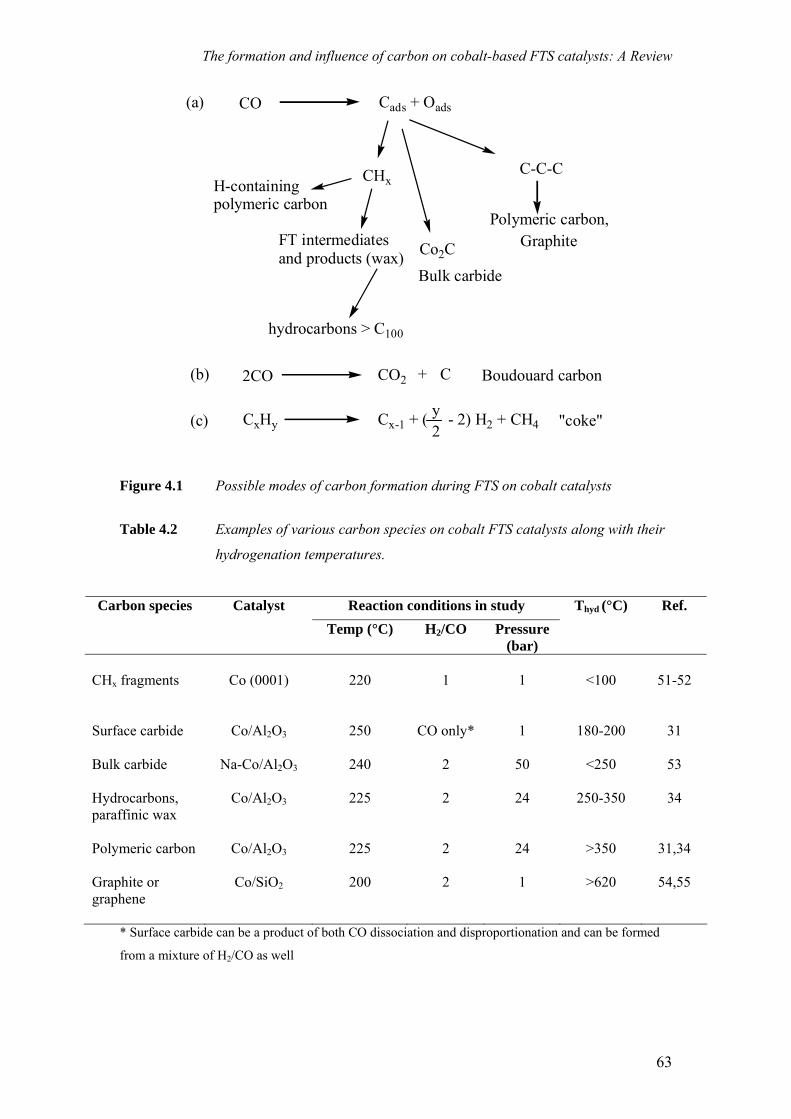
The formation and influence of carbon on cobalt-based FTS catalysts: A Review
CO Cads + Oads
CHx
FT intermediates and products (wax) Co2C
Bulk carbide
C-C-C
Polymeric carbon,
2CO CO2 +
(a)
(b)
Graphite
(c) CxHy Cx-1 + ( - 2) H2 + CH4y2
C
hydrocarbons > C100
H-containing polymeric carbon
Boudouard carbon
"coke"
Figure 4.1 Possible modes of carbon formation during FTS on cobalt catalysts
Table 4.2 Examples of various carbon species on cobalt FTS catalysts along with their
hydrogenation temperatures.
Reaction conditions in study Carbon species
Catalyst Temp (°C) H2/CO Pressure
(bar)
Thyd (°C) Ref.
CHx fragments
Co (0001)
220
1
1
<100
51-52
Surface carbide
Co/Al2O3
250
CO only*
1
180-200
31
Bulk carbide
Na-Co/Al2O3 240 2 50 <250
53
Hydrocarbons, paraffinic wax
Co/Al2O3 225 2 24 250-350 34
Polymeric carbon Co/Al2O3 225 2 24 >350 31,34
Graphite or graphene
Co/SiO2
200
2 1 >620
54,55
* Surface carbide can be a product of both CO dissociation and disproportionation and can be formed
from a mixture of H2/CO as well
63
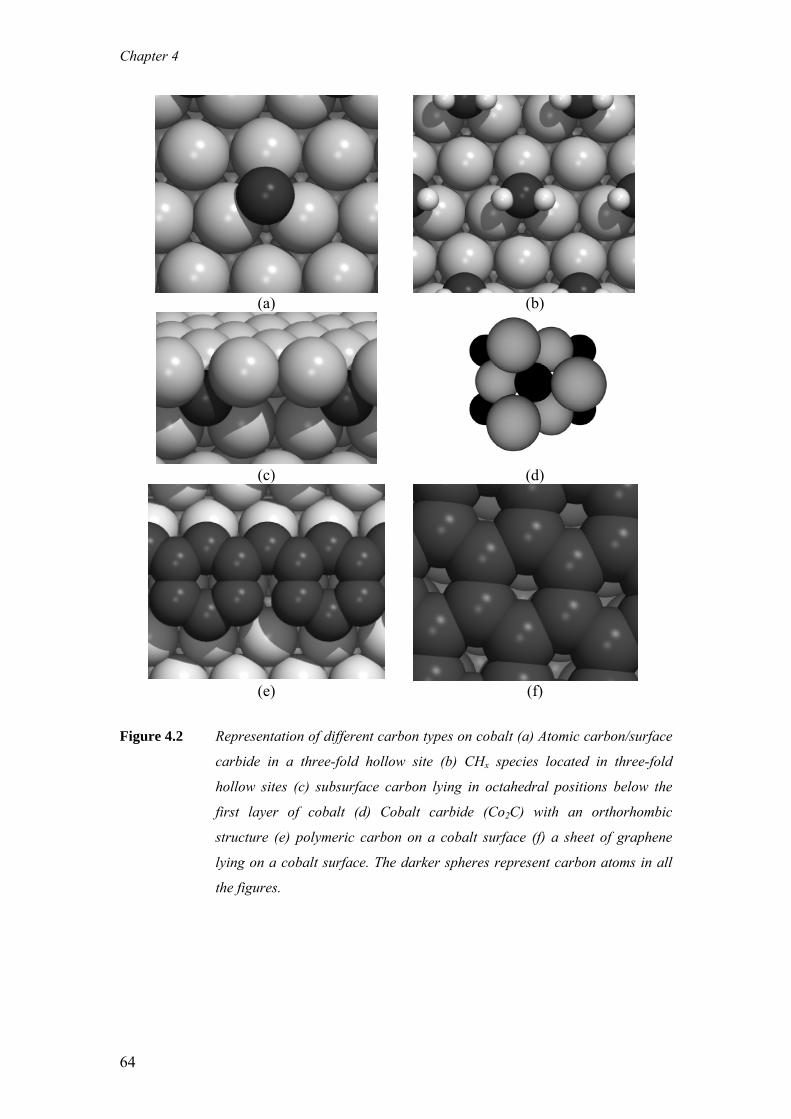
Chapter 4
(a)
(b)
(c)
(d)
(e) (f)
Figure 4.2 Representation of different carbon types on cobalt (a) Atomic carbon/surface
carbide in a three-fold hollow site (b) CHx species located in three-fold
hollow sites (c) subsurface carbon lying in octahedral positions below the
first layer of cobalt (d) Cobalt carbide (Co2C) with an orthorhombic
structure (e) polymeric carbon on a cobalt surface (f) a sheet of graphene
lying on a cobalt surface. The darker spheres represent carbon atoms in all
the figures.
64
The formation and influence of carbon on cobalt-based FTS catalysts: A Review
4.4 Factors that generally influence carbon deposition on catalysts for CO
hydrogenation
a) Temperature and pressure
Temperature plays an important role in determining the amount and type of the
carbon deposit. Generally during FTS at higher temperatures the amount of carbon
deposited will tend to increase [30, 31] but the case is often not so straightforward. An
example of temperature dependence on the rate of carbon deposition and deactivation
is the case of nickel CO hydrogenation catalysts, as studied by Bartholomew [56]. At
temperatures below 325 ºC the rate of surface carbidic carbon removal by
hydrogenation exceeds that of its formation so no carbon is deposited. However above
325 ºC, surface carbidic carbon accumulates on the surface since the rate of surface
carbidic carbon formation is greater and exceeds that of its hydrogenation. As surface
carbidic carbon accumulates (at 325-400 ºC), it is converted to a polymeric type of
carbon which deactivates the nickel catalyst; however, above 425 ºC the rate of
polymeric carbon hydrogenation exceeds that of formation and no deactivation
occurs.
Higher temperatures will also aid in the transformation of surface carbon
species into more stable species that will have decreased reactivity towards H2.
Nakamura et al. [49] showed that at 230 ºC, carburization of a Co/Al2O3 catalyst by
CO results in formation of mainly carbidic carbon. Such carbidic carbon converts to
graphitic carbon if the temperature is raised to around 430 °C [49]. Increasing the
exposure time to CO will also result in the formation of more stable carbon species
[57]. If the catalyst is exposed to a too high a temperature during FTS, undesired
carbonaceous phases will be formed, which may damage the structural integrity of the
catalyst (for example, carbon fibres or filaments).
Carbon deposition is a strong function of partial pressures of CO and H2 in the
gas phase. Rostrup-Nielsen showed that the amount of carbon deposited on the
catalyst uniformly increases with the combined hydrogen and carbon monoxide
pressure [58]. Moeller and Bartholomew [59] showed that amount of carbon
deposited on Ni catalysts was proportional to the partial pressure of CO. However,
65
Chapter 4
greater conversion at higher temperatures results in a corresponding decrease in PCO
and PH2, and may therefore lead to smaller amounts of carbon on the catalyst [60].
Higher conversions also lead to high water partial pressures which can also influence
carbon deposition. According to Dry the formation rate of Boudouard carbon is a
function of pressure for Fe catalysts [61]. He showed that at higher total pressure and
lower PH2/(PCO)2 ratio, the rate of carbon formation decreased.
b) Size and crystallographic nature of cobalt
Two studies [31, 58] have suggested that carbon deposition rates are greater on
smaller metal particles. This is most likely due to the presence of a higher
concentration of defects on the small particles which is known to enhance CO
dissociation. Furthermore it was found in the case of Co/Al2O3 catalysts that the
carbon formation rate and subsequent deactivation was higher for smaller cobalt
particles [31, 58]. The dissociation of adsorbed CO on a cobalt catalyst is also
sensitive to the crystallographic structure of the surface and it is known that
dissociation of CO occurs readily on more open surfaces. The dissociation of COads
and formation of surface carbidic carbon occurs preferentially on Co (1012) and
(1120) rather than on Co (0001) and (1010) planes [57, 62]. It is argued that CO
adsorption at step sites (which are widely available on high index surfaces) weakens
the C-O bond, which enables dissociation at lower temperatures. However, the carbon
formed at these highly reactive cobalt sites may have enhanced stability (i.e. be
strongly bound) and therefore, may act as a poison. Hence, the optimum cobalt site is
one which dissociates CO rapidly without leading to irreversible bonding of carbon.
c) Surface coverage of carbon
As the surface coverage of carbon increases, the deposited carbon becomes less
reactive as suggested by Koerts [52]. Using temperature programmed hydrogenation
he showed that the formation of reactive surface carbidic carbon decreased from 70%
to 10% as the surface coverage of carbon was increased towards 100%. Agrawal et al.
[33] showed on Co/Al2O3 that greater CO concentrations resulting in an increased
surface carbon concentration led to more rapid bulk carburization and rapid
deactivation. Hence, the balance between dissociation and hydrogenation must be
66
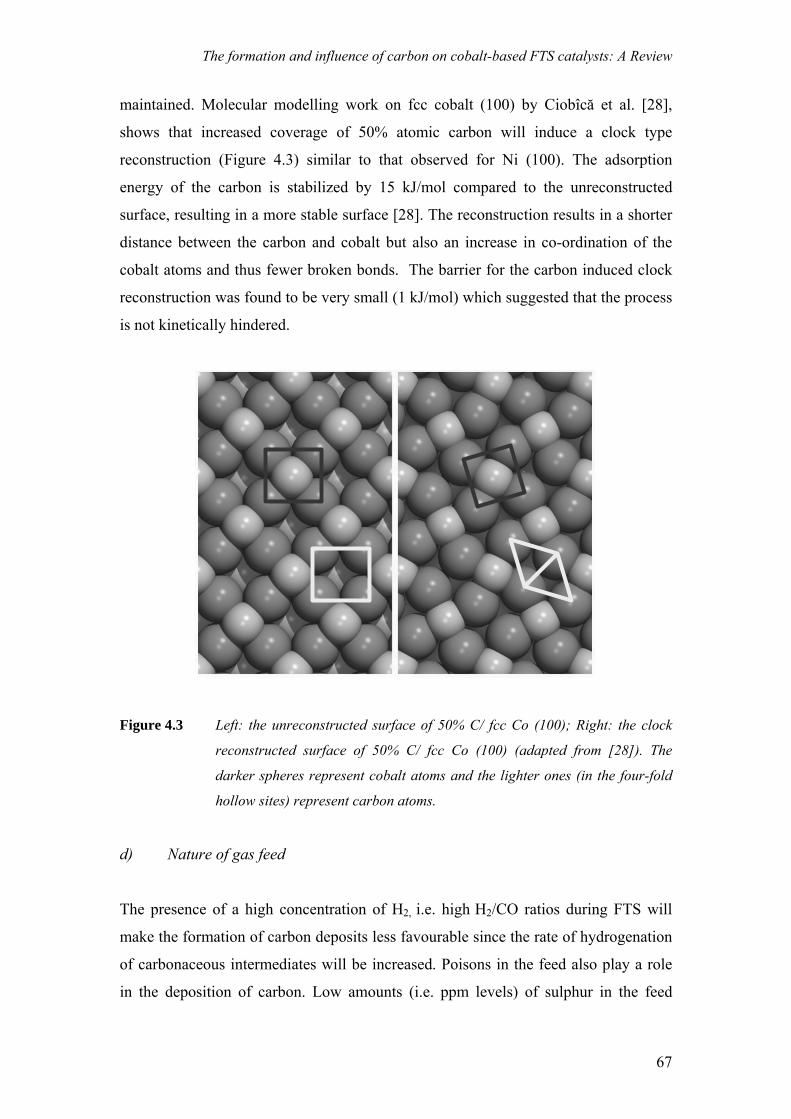
The formation and influence of carbon on cobalt-based FTS catalysts: A Review
maintained. Molecular modelling work on fcc cobalt (100) by Ciobîcă et al. [28],
shows that increased coverage of 50% atomic carbon will induce a clock type
reconstruction (Figure 4.3) similar to that observed for Ni (100). The adsorption
energy of the carbon is stabilized by 15 kJ/mol compared to the unreconstructed
surface, resulting in a more stable surface [28]. The reconstruction results in a shorter
distance between the carbon and cobalt but also an increase in co-ordination of the
cobalt atoms and thus fewer broken bonds. The barrier for the carbon induced clock
reconstruction was found to be very small (1 kJ/mol) which suggested that the process
is not kinetically hindered.
Figure 4.3 Left: the unreconstructed surface of 50% C/ fcc Co (100); Right: the clock
reconstructed surface of 50% C/ fcc Co (100) (adapted from [28]). The
darker spheres represent cobalt atoms and the lighter ones (in the four-fold
hollow sites) represent carbon atoms.
d) Nature of gas feed
The presence of a high concentration of H2, i.e. high H2/CO ratios during FTS will
make the formation of carbon deposits less favourable since the rate of hydrogenation
of carbonaceous intermediates will be increased. Poisons in the feed also play a role
in the deposition of carbon. Low amounts (i.e. ppm levels) of sulphur in the feed
67
Chapter 4
stream result in a decrease in carbon deposition on Co/Al2O3 catalysts [63]. It has
been shown that increased water concentrations result in a decreased formation of
carbon on nickel methanation catalysts [64].
4.5 Studies involving carbon formation on cobalt catalysts
(a) Studies on model cobalt systems at model FT conditions (CO + syngas)
Carbon deposition from CO on a cobalt catalyst at low pressures is known to be a
structure sensitive process. CO is adsorbed molecularly on the low index surfaces
(Co (0001)) but its dissociation occurs on the Co (1012), Co (1120) and
polycrystalline surfaces [57, 62]. Deposition of carbon on Co (1012) and the probable
formation of Co3C have been established by Auger electron spectroscopy (AES) and
low energy electron diffraction (LEED) techniques [65].
Two forms of carbon (carbidic and graphitic) have been observed by XPS on
polycrystalline cobalt foil during the disproportionation of CO by Nakamura [57]. The
dissociation of adsorbed CO occurred at temperatures higher than 60 ºC, and carbidic
carbon and adsorbed oxygen were formed on the cobalt surface. After the surface is
covered with adsorbed carbon and oxygen no further dissociation of adsorbed CO
occurs. Contrary to the dissociation of adsorbed CO, the deposition of carbon by the
concerted Boudouard reaction continues on the carbidic carbon-deposited surface.
The deposition of carbon increases with increasing exposure time and there is an
increase in its transformation to graphitic carbon [57].
Johnson et al. [66] studied CO hydrogenation on bimetallic catalysts
consisting of cobalt over layers on W (100) and (110) single crystals at 200 °C, 1 bar
at a H2/CO ratio of 2. AES spectra showed the post-reaction Co/W surfaces to have
high coverages of both carbon and oxygen, with carbon line shapes characteristic of
bulk carbidic carbon [66]. The catalytic activity apparently could not be correlated
with surface carbon level [66].
Lahtinen et al. [67, 68] studied CO hydrogenation on polycrystalline cobalt
foil at various temperatures at 1 bar and H2/CO ratio of 1.24. The cobalt surface was
68
The formation and influence of carbon on cobalt-based FTS catalysts: A Review
then characterized by AES immediately after the reaction without any further sample
treatment. The C/Co ratio was almost constant as temperature was increased to
252 ºC. No significant deactivation for CO hydrogenation was observed on the foils at
these conditions. At 297 ºC the C/Co ratio was significantly higher. From the peak
shape of the carbon KLL Auger lines it was deduced that carbon formed at 297 ºC is
in the graphitic form. Deactivation of the cobalt surface by carbon was observed at
276 °C. On these metal foils the hydrogenation of CO occurs in the presence of an
active carbidic over layer. The transformation of this overlayer into graphite leads to a
decrease in the catalytic activity of the metal surfaces.
The activity for CO hydrogenation was studied on Co (1120) and (1012)
oriented single cobalt crystals by Geerlings et al. [51]. The height of cobalt Auger
peak decreased while that of carbon increased due to the carbonaceous species on the
surface. On the grooved Co (1120) surfaces long chain hydrocarbon fragments grow,
however, on the stepped Co (1012) surface long chain fragments were not observed.
The authors stated that under FTS conditions, the step sites, which are very reactive
for CO dissociation under UHV conditions, are poisoned by carbon. As a result of
very strong binding of carbon atoms to these sites efficient hydrogenation seems
improbable. Hence, certain sites can aid carbon deposition and should be minimised.
Beitel et al. [69] studied CO hydrogenation on Co (0001) at 250 °C, 1 bar at a H2/CO
ratio of 2. They showed that the activity of a sputtered surface was greater than that of
an annealed surface. However the activity of both the surfaces declined over time.
They proposed that this could be due to the blocking of CO dissociation active sites
by carbon deposition or by blocking of CO dissociation by hydrocarbons and water at
defects. They conducted the experiments with clean syngas and sintering could be
eliminated for the most compact surface and hence the observed deactivation could be
due to carbon.
It has been shown that it is favourable for surface carbon to go into the first
subsurface layer of cobalt [70]. Diffusion to octahedral sites of the first subsurface
layer is thermodynamically preferred by 50-120 kJ/mol and the corresponding
activation energy is low. Theoretical calculations on the conversion of surface
carbidic to subsurface carbon on Co (0001) found that the electron withdrawing
power and therefore the poisoning effect on potential CO adsorption is maximal for
69
Chapter 4
subsurface carbon [41]. Metal dxz orbitals are less likely to accept electrons from the
CO 5σ orbital and thus metal-CO bonding will weaken. The dxz orbital will in turn be
less able to back donate into the CO 2π orbital resulting in additional metal-CO bond
weakening as well as reduced C-O bond weakening. The net result is that the presence
of subsurface carbon is likely to reduce both CO adsorption and dissociation
processes on nearby atoms. Also the conversion of surface carbon may be self-
catalyzing i.e., the more subsurface carbon, the greater electron withdrawing power
thus more carbon atoms are driven into the surface. This electronic effect may be
related to experimental work by Choi et al. [71] who investigated the surface
properties of 5 wt% Co/Al2O3 catalysts, exposed to CO at 250 oC, by employing
Infra-red (IR) and temperature programmed desorption (TPD) techniques. They found
that a carbon-deposited cobalt catalyst adsorbs CO more weakly as evidenced by a
new IR band at 2073 cm-1.
(b) Studies on supported catalysts at more realistic conditions
Lee et al. deposited carbon by CO disproportionation on Co/Al2O3 catalysts with
different loadings (2-20 wt% Co) at different CO deposition temperatures (250-
400 ºC) [31]. Two forms of carbon where observed upon temperature programmed
surface reaction with hydrogen: an atomic or surface carbidic carbon (hydrogenated at
~190 ºC) and polymeric carbon (hydrogenated at 430 ºC). A fraction of the carbon
was also resistant to hydrogenation at 600 ºC. They found that with increasing
temperature of deposition, the amount of carbon deposited increased and surface
carbidic carbon appears to be transformed into polymeric and graphitic carbon
(Figure 4.4a). These catalysts where carbon was artificially deposited on, were tested
in the FTS at 250-300 °C, H2/CO = 2 and 1 bar and exhibited lower activities when
compared to the fresh catalyst (Figure 4.4b). The loss of activity was ascribed to the
blockage of active sites by polymeric and or/graphitic carbon which is irreversibly
bound to the metal surface. Bulk carbide was not observed by AES and as such the
authors argued that the deactivation was not due to an electronic effect. This
experiment clearly establishes that stable carbon species generated from CO can be a
poison in FTS.
70
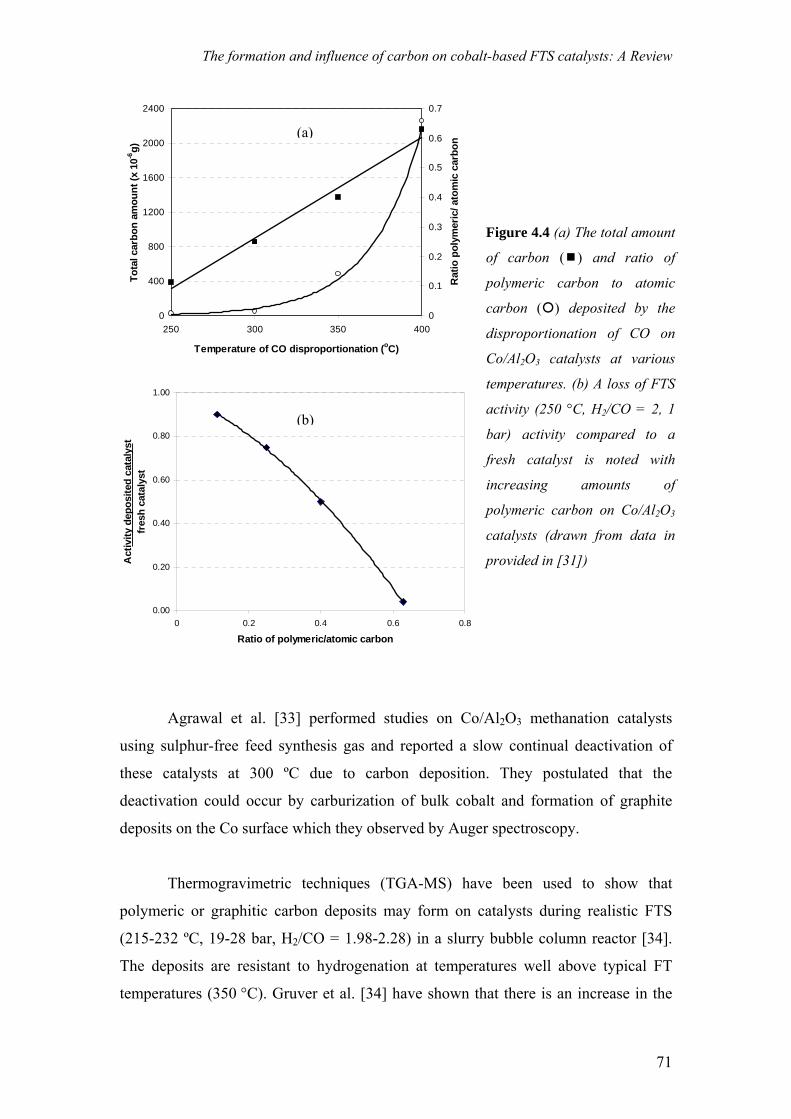
The formation and influence of carbon on cobalt-based FTS catalysts: A Review
0
400
800
1200
1600
2000
2400
250 300
Temperature of CO
Tota
l car
bon
amou
nt (x
10-6
g)0.6
0.7
n
0.00
0.20
0.40
0.60
0.80
1.00
0 0.2
Ratio of po
Act
ivity
dep
osite
d ca
taly
stfr
esh
cata
lyst
Agrawal et al. [33
using sulphur-free feed sy
these catalysts at 300 º
deactivation could occur b
deposits on the Co surface
Thermogravimetric
polymeric or graphitic car
(215-232 ºC, 19-28 bar, H
The deposits are resistant
temperatures (350 °C). Gr
(a)
350 400
disproportionation (oC)
0
0.1
0.2
0.3
0.4
0.5
Rat
io p
olym
eric
/ ato
mic
car
bo
Figure 4.4 (a) The total amount
of carbon ( ) and ratio of
polymeric carbon to atomic
carbon ( ) deposited by the
disproportionation of CO on
Co/Al2O3 catalysts at various
temperatures. (b) A loss of FTS
activity (250 °C, H2/CO = 2, 1
bar) activity compared to a
(b)0.4 0.6 0.8
lymeric/atomic carbon
fresh catalyst is noted with
increasing amounts of
polymeric carbon on Co/Al2O3
catalysts (drawn from data in
provided in [31])
] performed studies on Co/Al2O3 methanation catalysts
nthesis gas and reported a slow continual deactivation of
C due to carbon deposition. They postulated that the
y carburization of bulk cobalt and formation of graphite
which they observed by Auger spectroscopy.
techniques (TGA-MS) have been used to show that
bon deposits may form on catalysts during realistic FTS
2/CO = 1.98-2.28) in a slurry bubble column reactor [34].
to hydrogenation at temperatures well above typical FT
uver et al. [34] have shown that there is an increase in the
71
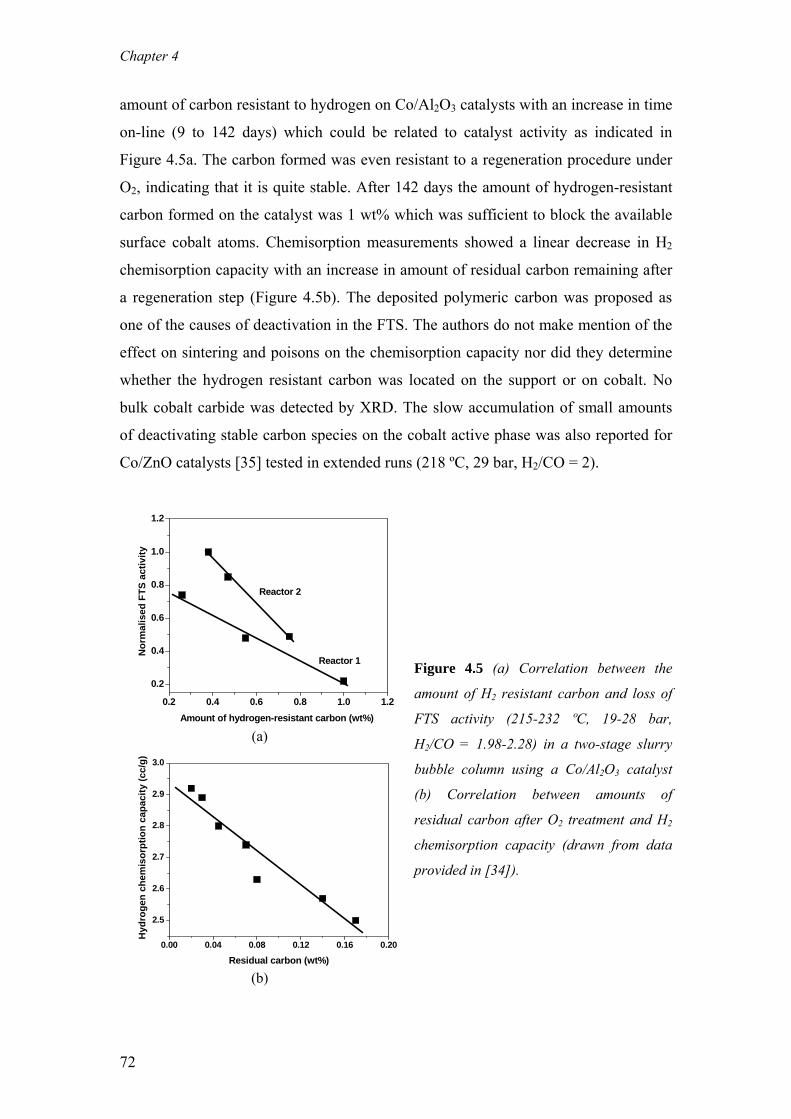
Chapter 4
amount of carbon resistant to hydrogen on Co/Al2O3 catalysts with an increase in time
on-line (9 to 142 days) which could be related to catalyst activity as indicated in
Figure 4.5a. The carbon formed was even resistant to a regeneration procedure under
O2, indicating that it is quite stable. After 142 days the amount of hydrogen-resistant
carbon formed on the catalyst was 1 wt% which was sufficient to block the available
surface cobalt atoms. Chemisorption measurements showed a linear decrease in H2
chemisorption capacity with an increase in amount of residual carbon remaining after
a regeneration step (Figure 4.5b). The deposited polymeric carbon was proposed as
one of the causes of deactivation in the FTS. The authors do not make mention of the
effect on sintering and poisons on the chemisorption capacity nor did they determine
whether the hydrogen resistant carbon was located on the support or on cobalt. No
bulk cobalt carbide was detected by XRD. The slow accumulation of small amounts
of deactivating stable carbon species on the cobalt active phase was also reported for
Co/ZnO catalysts [35] tested in extended runs (218 ºC, 29 bar, H2/CO = 2).
0.2 0.4 0.6 0.8 1.0 1.2
0.2
0.4
0.6
0.8
1.0
1.2
Reactor 1
Nor
mal
ised
FTS
act
ivity
Amount of hydrogen-resistant carbon (wt%)
Reactor 2
(a)
0.00 0.04 0.08 0.12 0.16 0.20
2.5
2.6
2.7
2.8
2.9
3.0
Hyd
roge
n ch
emis
orpt
ion
capa
city
(cc/
g)
Residual carbon (wt%)
(b)
Figure 4.5 (a) Correlation between the
amount of H2 resistant carbon and loss of
FTS activity (215-232 ºC, 19-28 bar,
H2/CO = 1.98-2.28) in a two-stage slurry
bubble column using a Co/Al2O3 catalyst
(b) Correlation between amounts of
residual carbon after O2 treatment and H2
chemisorption capacity (drawn from data
provided in [34]).
72
The formation and influence of carbon on cobalt-based FTS catalysts: A Review
Barbier et al. [54] employed temperature-programmed hydrogenation (TPH)
on the carbon species on used Co/SiO2 FTS catalysts (200 °C, H2/CO = 2, 1 bar) and
showed that the resulting methane evolution could be resolved into four peaks,
representing different types of carbon, which vary in reactivity toward hydrogen.
They showed that the formation of easily hydrogenated carbon decreased with
increasing time-on-stream while the carbon that was hydrogenated at higher
temperatures increased with time-on-stream. This observation points to the fact that
during the course of the reaction the slow formation of carbon phases that are resistant
to H2 occurs. They postulated that the nature of this carbon may be polymeric or even
graphitic.
Pore blockage by carbon or heavy products may cause a loss in activity over
time. Niemela and Krause [39] reported a loss of turnover frequency for Co/SiO2 FTS
catalysts due to preferential blocking of the narrowest catalyst pores by carbon.
Puskas [72] found unusually high amounts of wax in the pores on a
Co/Mg/diatomaceous earth catalyst tested in the FTS at 190 °C, 1-2 bar, H2/CO =
2.55 for 125 days. In a separate study it was concluded that pore plugging by the
waxy products resulted in a fast deactivation of such catalysts [73].
4.6 Bulk cobalt carbide formation in the FTS?
The formation and influence of bulk cobalt carbide during FTS has been a topic of
interest for many research groups. [74, 75, 76, 77]. There is a general trend of
decreasing bulk carbide stability as one goes from the left to the right of the periodic
table through the transition metals. It has been shown that the activation energy for
the diffusion of carbon into cobalt (145 kJ/mol) is much higher than that for iron (44-
69 kJ/mol). This translated to a 105 times slower diffusion of carbon into cobalt than
into iron [78]. Thus, it is reasonable to expect that cobalt will have a lesser tendency
to form carbides than iron. Two forms of cobalt carbide are generally known for
cobalt: Co2C which has an orthorhombic structure and Co3C which has structure
similar to cementite.
The formation of bulk cobalt carbide is quite a slow process since it requires
the diffusion of carbon into the cobalt bulk. It was reported that the full conversion of
73
Chapter 4
unsupported and reduced Co to Co2C only occurred after 500 h of exposure to pure
CO at 230 °C. Increasing the reaction temperature resulted in a faster rate of
carburization [79]. Bulk cobalt carbides are considered to be thermodynamically
metastable species and therefore Co2C will decompose to hcp cobalt and graphite
while Co3C will decompose to fcc cobalt and methane. Thermal decomposition of
bulk carbides under an inert atmosphere is believed to occur under 400 °C [79].
Hydrogenation of the bulk carbides is believed to be a fast process and occurs around
200 °C [80, 81].
Early work at the Bureau of Mines on Co/ThO2/kieselguhr catalysts showed
that bulk carbide was not an intermediate in the FTS nor was it catalytically active
[80]. Excessive amounts of carbides, produced by CO exposure prior to the reaction,
were found to severely inhibit the FTS activity. Carbiding of Co/ThO2/kieselguhr
catalysts in CO at 208 °C had a dramatic effect on catalyst activity, decreasing
conversion by 20% and increasing the formation of lighter hydrocarbons. The BET
surface area of the catalysts remained constant, however, the CO chemisorption
capacity decreased to 30% of the initial values before carbiding. In some cases, a
four-fold increase in activity was noticed after the hydrogenation of the carbide at
150-194 °C. Also it should be noted that XRD still showed the presence of bulk cobalt
carbide post reaction in the case of the pre-carbided catalysts exposed to synthesis
gas. This indicates that while the bulk carbide can be readily hydrogenated in pure
hydrogen it is stable for a considerable amount of time in synthesis gas mixtures at
FTS conditions.
Recent work done by Xiong et al. [82] on Co/AC (activated carbon) catalysts
showed that a Co2C species formed during the catalyst reduction in hydrogen at 500
°C. Evidence for the carbide in the Co/AC catalysts was obtained by X-ray diffraction
(XRD) and XPS measurements and the formation of this Co2C species reduced the
FTS activity over the Co-based catalysts. The presence of bulk carbide also seems to
enhance alcohol selectivity [83].
Several workers have reported that bulk carbide does not form readily during
normal FTS conditions [74, 80]. Bureau of Mines work showed using laboratory XRD
74
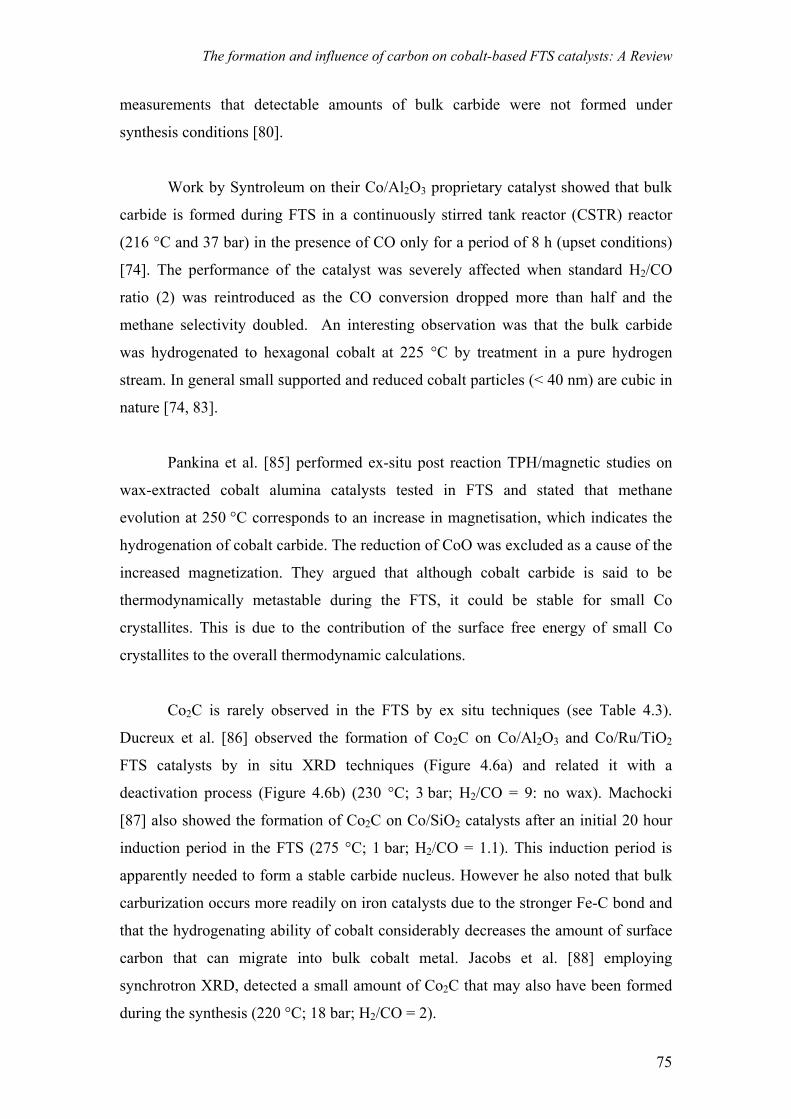
The formation and influence of carbon on cobalt-based FTS catalysts: A Review
measurements that detectable amounts of bulk carbide were not formed under
synthesis conditions [80].
Work by Syntroleum on their Co/Al2O3 proprietary catalyst showed that bulk
carbide is formed during FTS in a continuously stirred tank reactor (CSTR) reactor
(216 °C and 37 bar) in the presence of CO only for a period of 8 h (upset conditions)
[74]. The performance of the catalyst was severely affected when standard H2/CO
ratio (2) was reintroduced as the CO conversion dropped more than half and the
methane selectivity doubled. An interesting observation was that the bulk carbide
was hydrogenated to hexagonal cobalt at 225 °C by treatment in a pure hydrogen
stream. In general small supported and reduced cobalt particles (< 40 nm) are cubic in
nature [74, 83].
Pankina et al. [85] performed ex-situ post reaction TPH/magnetic studies on
wax-extracted cobalt alumina catalysts tested in FTS and stated that methane
evolution at 250 °C corresponds to an increase in magnetisation, which indicates the
hydrogenation of cobalt carbide. The reduction of CoO was excluded as a cause of the
increased magnetization. They argued that although cobalt carbide is said to be
thermodynamically metastable during the FTS, it could be stable for small Co
crystallites. This is due to the contribution of the surface free energy of small Co
crystallites to the overall thermodynamic calculations.
Co2C is rarely observed in the FTS by ex situ techniques (see Table 4.3).
Ducreux et al. [86] observed the formation of Co2C on Co/Al2O3 and Co/Ru/TiO2
FTS catalysts by in situ XRD techniques (Figure 4.6a) and related it with a
deactivation process (Figure 4.6b) (230 °C; 3 bar; H2/CO = 9: no wax). Machocki
[87] also showed the formation of Co2C on Co/SiO2 catalysts after an initial 20 hour
induction period in the FTS (275 °C; 1 bar; H2/CO = 1.1). This induction period is
apparently needed to form a stable carbide nucleus. However he also noted that bulk
carburization occurs more readily on iron catalysts due to the stronger Fe-C bond and
that the hydrogenating ability of cobalt considerably decreases the amount of surface
carbon that can migrate into bulk cobalt metal. Jacobs et al. [88] employing
synchrotron XRD, detected a small amount of Co2C that may also have been formed
during the synthesis (220 °C; 18 bar; H2/CO = 2).
75
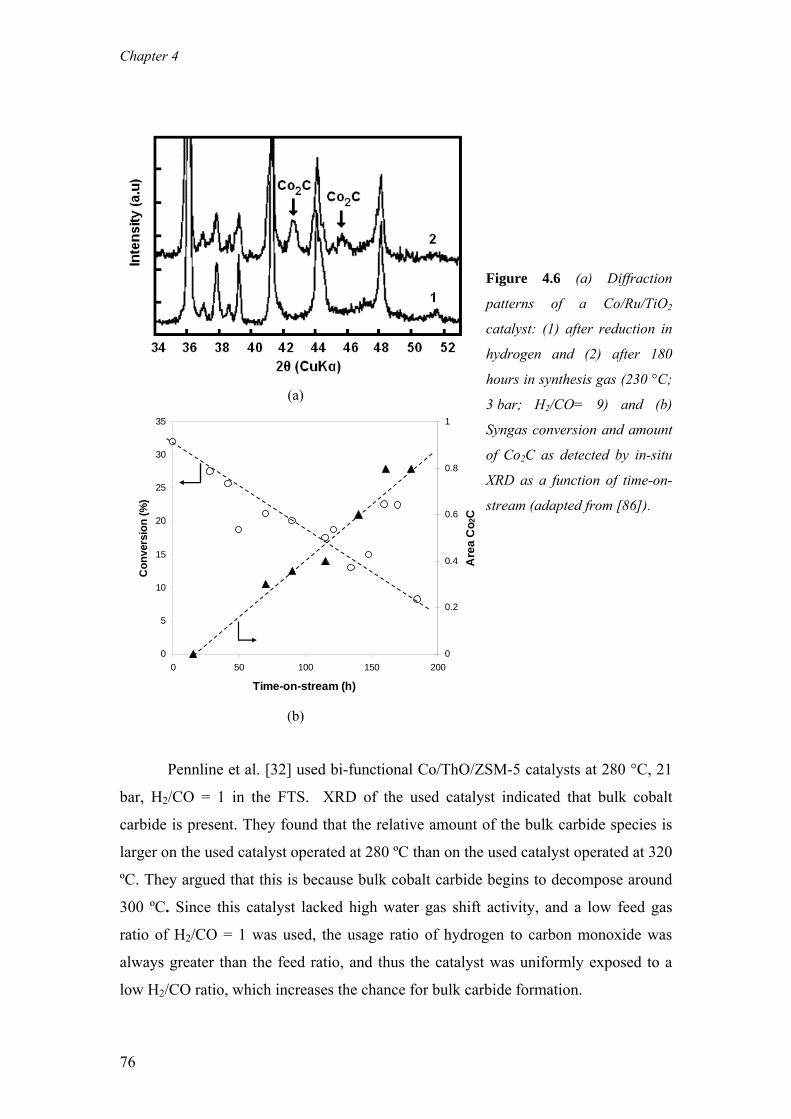
Chapter 4
(a)
0
5
10
15
20
25
30
35
0 50 100 150 200
Time-on-stream (h)
Con
vers
ion
(%)
0
0.2
0.4
0.6
0.8
1
Are
a C
o 2C
(b)
Figure 4.6 (a) Diffraction
patterns of a Co/Ru/TiO2
catalyst: (1) after reduction in
hydrogen and (2) after 180
hours in synthesis gas (230 °C;
3 bar; H2/CO= 9) and (b)
Syngas conversion and amount
of Co2C as detected by in-situ
XRD as a function of time-on-
stream (adapted from [86]).
Pennline et al. [32] used bi-functional Co/ThO/ZSM-5 catalysts at 280 °C, 21
bar, H2/CO = 1 in the FTS. XRD of the used catalyst indicated that bulk cobalt
carbide is present. They found that the relative amount of the bulk carbide species is
larger on the used catalyst operated at 280 ºC than on the used catalyst operated at 320
ºC. They argued that this is because bulk cobalt carbide begins to decompose around
300 ºC. Since this catalyst lacked high water gas shift activity, and a low feed gas
ratio of H2/CO = 1 was used, the usage ratio of hydrogen to carbon monoxide was
always greater than the feed ratio, and thus the catalyst was uniformly exposed to a
low H2/CO ratio, which increases the chance for bulk carbide formation.
76
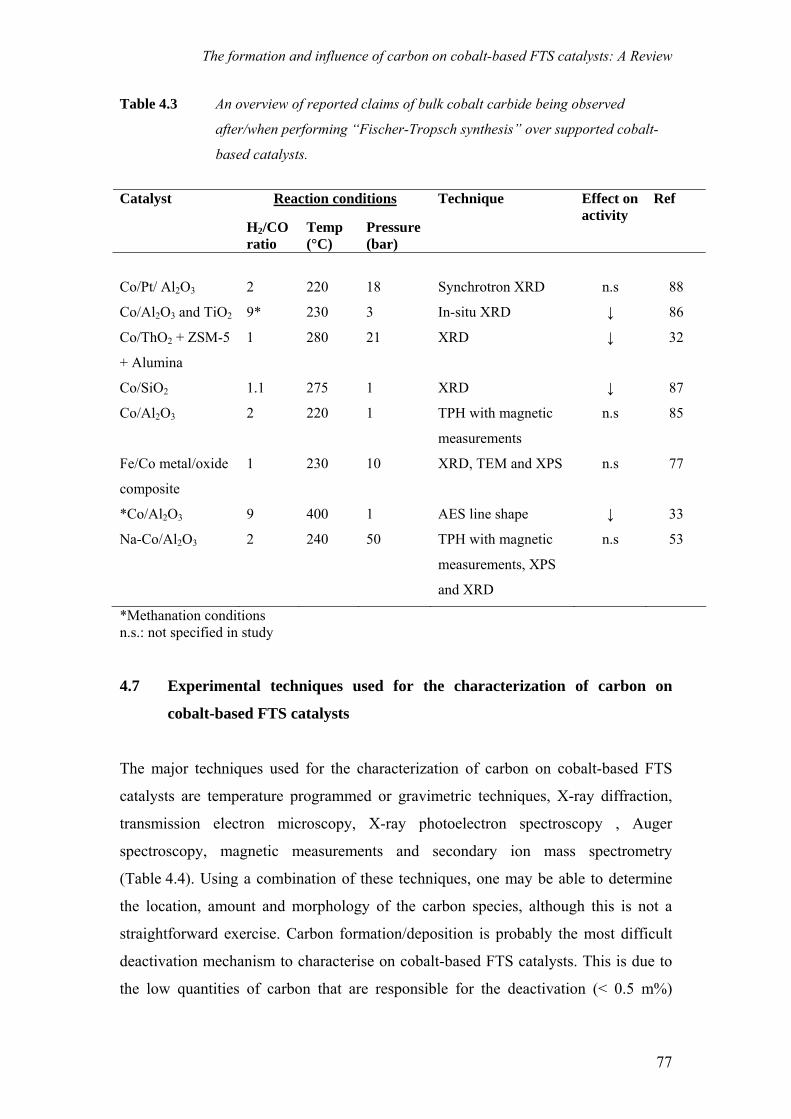
The formation and influence of carbon on cobalt-based FTS catalysts: A Review
Table 4.3 An overview of reported claims of bulk cobalt carbide being observed
after/when performing “Fischer-Tropsch synthesis” over supported cobalt-
based catalysts.
Reaction conditionsCatalyst
H2/CO ratio
Temp (°C)
Pressure (bar)
Technique Effect on activity
Ref
Co/Pt/ Al2O3
2
220
18
Synchrotron XRD
n.s
88
Co/Al2O3 and TiO2 9* 230 3 In-situ XRD ↓ 86
Co/ThO2 + ZSM-5
+ Alumina
1 280 21 XRD ↓ 32
Co/SiO2 1.1 275 1 XRD ↓ 87
Co/Al2O3
2 220 1 TPH with magnetic
measurements
n.s 85
Fe/Co metal/oxide
composite
1 230 10 XRD, TEM and XPS n.s 77
*Co/Al2O3 9 400 1 AES line shape ↓ 33
Na-Co/Al2O3
2 240 50 TPH with magnetic
measurements, XPS
and XRD
n.s 53
*Methanation conditions n.s.: not specified in study
4.7 Experimental techniques used for the characterization of carbon on
cobalt-based FTS catalysts
The major techniques used for the characterization of carbon on cobalt-based FTS
catalysts are temperature programmed or gravimetric techniques, X-ray diffraction,
transmission electron microscopy, X-ray photoelectron spectroscopy , Auger
spectroscopy, magnetic measurements and secondary ion mass spectrometry
(Table 4.4). Using a combination of these techniques, one may be able to determine
the location, amount and morphology of the carbon species, although this is not a
straightforward exercise. Carbon formation/deposition is probably the most difficult
deactivation mechanism to characterise on cobalt-based FTS catalysts. This is due to
the low quantities of carbon that are responsible for the deactivation (< 0.5 m%)
77
Chapter 4
coupled with the presence of wax that is produced during FTS. Furthermore carbon is
only detrimental to the FT performance if it is bound irreversibly to an active site or
interacts electronically with it. Hence, not all carbon detected will be responsible for
deactivation, especially if the carbon is located on the support. In order to circumvent
the complexities that arise in the presence of wax, model conditions are often used.
This section is aimed at discussing the key techniques that are used for characterising
carbon on cobalt-based FTS catalyst along with their strengths and weaknesses.
(a) Temperature programmed (TP) techniques
Probably the most widely used technique of carbon determination on cobalt catalysts
are the temperature programmed (TP) techniques as they are quite simple, relatively
inexpensive and can be used for a wide variety of systems. In a typical TPH
experiment, a sample of catalyst is heated in hydrogen with a linear ramp rate [54].
The carbon is reacted to form methane which is monitored by a mass spectrometer or
GC (Figure 4.7). The reactivity of the carbon deposits towards various gases is
determined and can be used as a criterion to classify them. Table 4.2 shows the
different species of carbon that can be identified with this relatively simple technique.
Quantitative analysis of carbon is also possible. Kinetic data on the reactivity of
carbon deposits to various gases can be obtained which provide useful information in
the design of regeneration processes. Reference compounds may also be useful in
assigning the type of carbon formed. For example, it is known that bulk cobalt carbide
is hydrogenated around 200 °C [80], polymeric carbon on cobalt at 430°C [31], while
graphite on cobalt is hydrogenated around 600 °C [55]. A possible advantage of this
technique it that it can be used for determining amounts of less reactive, deactivating
carbon on wax covered catalysts [34]. A drawback of the technique is that thermal
transformation (e.g. graphitization) may occur from one carbon form to the other [88].
In the case of spent samples taken from realistic FTS runs, there may also be an
overlap of peaks due to pore size effects and the presence of hydrocarbon wax
contamination [54, 85]. This would necessitate peak deconvolution.
78
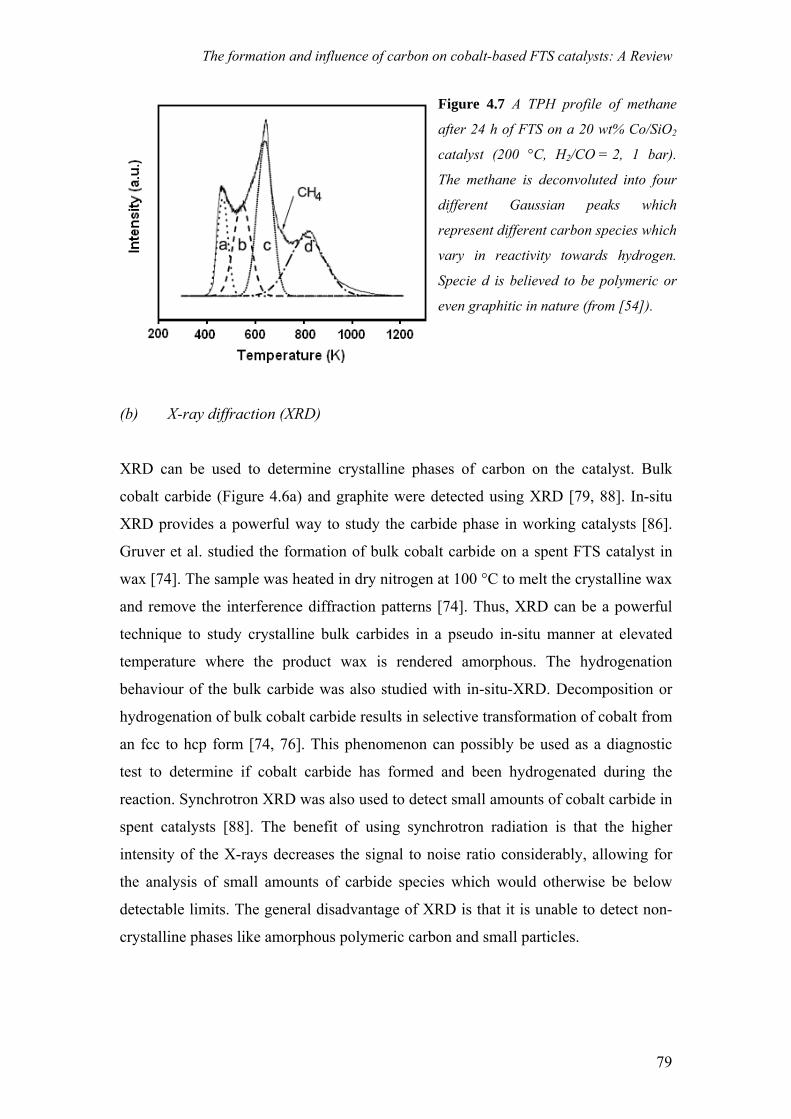
The formation and influence of carbon on cobalt-based FTS catalysts: A Review
Figure 4.7 A TPH profile of methane
after 24 h of FTS on a 20 wt% Co/SiO2
catalyst (200 °C, H2/CO = 2, 1 bar).
The methane is deconvoluted into four
different Gaussian peaks which
represent different carbon species which
vary in reactivity towards hydrogen.
Specie d is believed to be polymeric or
even graphitic in nature (from [54]).
(b) X-ray diffraction (XRD)
XRD can be used to determine crystalline phases of carbon on the catalyst. Bulk
cobalt carbide (Figure 4.6a) and graphite were detected using XRD [79, 88]. In-situ
XRD provides a powerful way to study the carbide phase in working catalysts [86].
Gruver et al. studied the formation of bulk cobalt carbide on a spent FTS catalyst in
wax [74]. The sample was heated in dry nitrogen at 100 °C to melt the crystalline wax
and remove the interference diffraction patterns [74]. Thus, XRD can be a powerful
technique to study crystalline bulk carbides in a pseudo in-situ manner at elevated
temperature where the product wax is rendered amorphous. The hydrogenation
behaviour of the bulk carbide was also studied with in-situ-XRD. Decomposition or
hydrogenation of bulk cobalt carbide results in selective transformation of cobalt from
an fcc to hcp form [74, 76]. This phenomenon can possibly be used as a diagnostic
test to determine if cobalt carbide has formed and been hydrogenated during the
reaction. Synchrotron XRD was also used to detect small amounts of cobalt carbide in
spent catalysts [88]. The benefit of using synchrotron radiation is that the higher
intensity of the X-rays decreases the signal to noise ratio considerably, allowing for
the analysis of small amounts of carbide species which would otherwise be below
detectable limits. The general disadvantage of XRD is that it is unable to detect non-
crystalline phases like amorphous polymeric carbon and small particles.
79
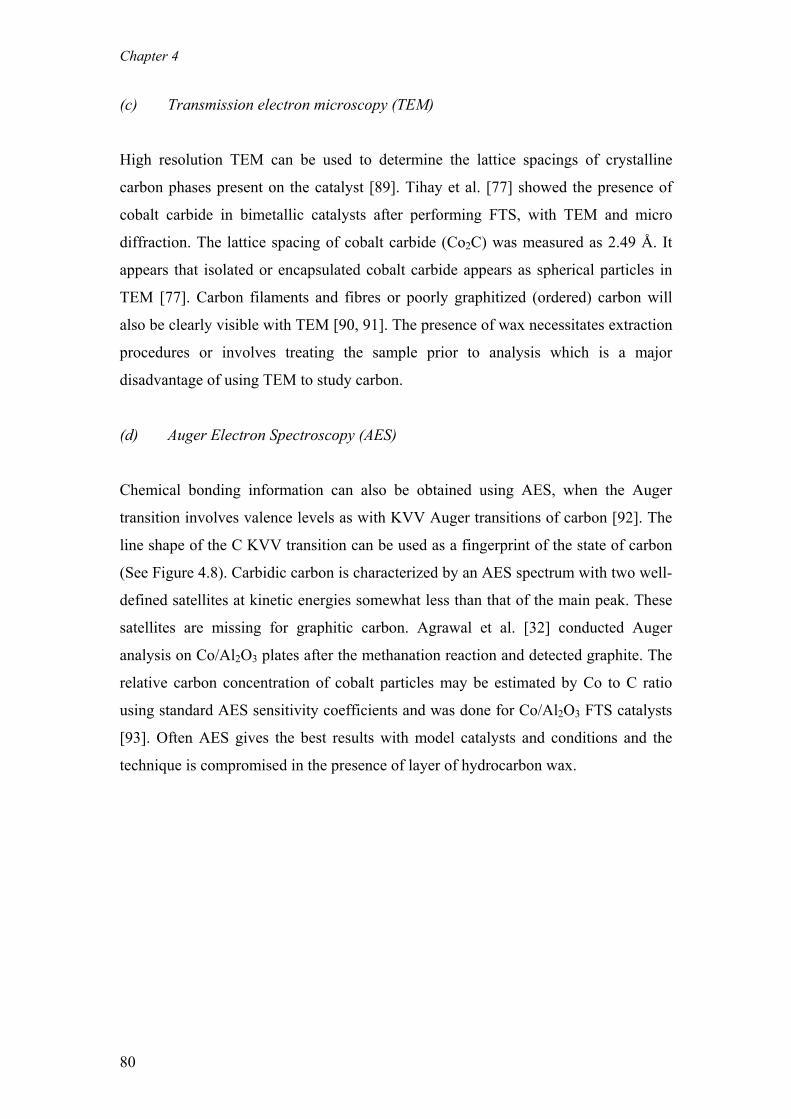
Chapter 4
(c) Transmission electron microscopy (TEM)
High resolution TEM can be used to determine the lattice spacings of crystalline
carbon phases present on the catalyst [89]. Tihay et al. [77] showed the presence of
cobalt carbide in bimetallic catalysts after performing FTS, with TEM and micro
diffraction. The lattice spacing of cobalt carbide (Co2C) was measured as 2.49 Å. It
appears that isolated or encapsulated cobalt carbide appears as spherical particles in
TEM [77]. Carbon filaments and fibres or poorly graphitized (ordered) carbon will
also be clearly visible with TEM [90, 91]. The presence of wax necessitates extraction
procedures or involves treating the sample prior to analysis which is a major
disadvantage of using TEM to study carbon.
(d) Auger Electron Spectroscopy (AES)
Chemical bonding information can also be obtained using AES, when the Auger
transition involves valence levels as with KVV Auger transitions of carbon [92]. The
line shape of the C KVV transition can be used as a fingerprint of the state of carbon
(See Figure 4.8). Carbidic carbon is characterized by an AES spectrum with two well-
defined satellites at kinetic energies somewhat less than that of the main peak. These
satellites are missing for graphitic carbon. Agrawal et al. [32] conducted Auger
analysis on Co/Al2O3 plates after the methanation reaction and detected graphite. The
relative carbon concentration of cobalt particles may be estimated by Co to C ratio
using standard AES sensitivity coefficients and was done for Co/Al2O3 FTS catalysts
[93]. Often AES gives the best results with model catalysts and conditions and the
technique is compromised in the presence of layer of hydrocarbon wax.
80
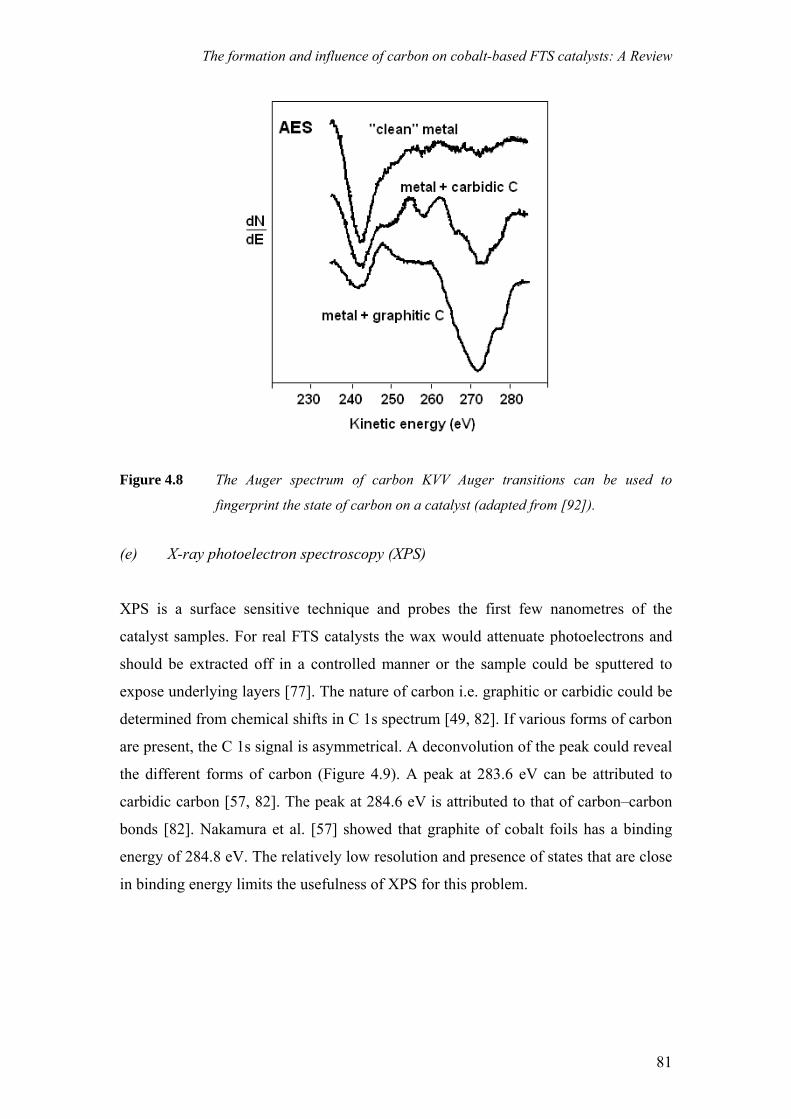
The formation and influence of carbon on cobalt-based FTS catalysts: A Review
Figure 4.8 The Auger spectrum of carbon KVV Auger transitions can be used to
fingerprint the state of carbon on a catalyst (adapted from [92]).
(e) X-ray photoelectron spectroscopy (XPS)
XPS is a surface sensitive technique and probes the first few nanometres of the
catalyst samples. For real FTS catalysts the wax would attenuate photoelectrons and
should be extracted off in a controlled manner or the sample could be sputtered to
expose underlying layers [77]. The nature of carbon i.e. graphitic or carbidic could be
determined from chemical shifts in C 1s spectrum [49, 82]. If various forms of carbon
are present, the C 1s signal is asymmetrical. A deconvolution of the peak could reveal
the different forms of carbon (Figure 4.9). A peak at 283.6 eV can be attributed to
carbidic carbon [57, 82]. The peak at 284.6 eV is attributed to that of carbon–carbon
bonds [82]. Nakamura et al. [57] showed that graphite of cobalt foils has a binding
energy of 284.8 eV. The relatively low resolution and presence of states that are close
in binding energy limits the usefulness of XPS for this problem.
81
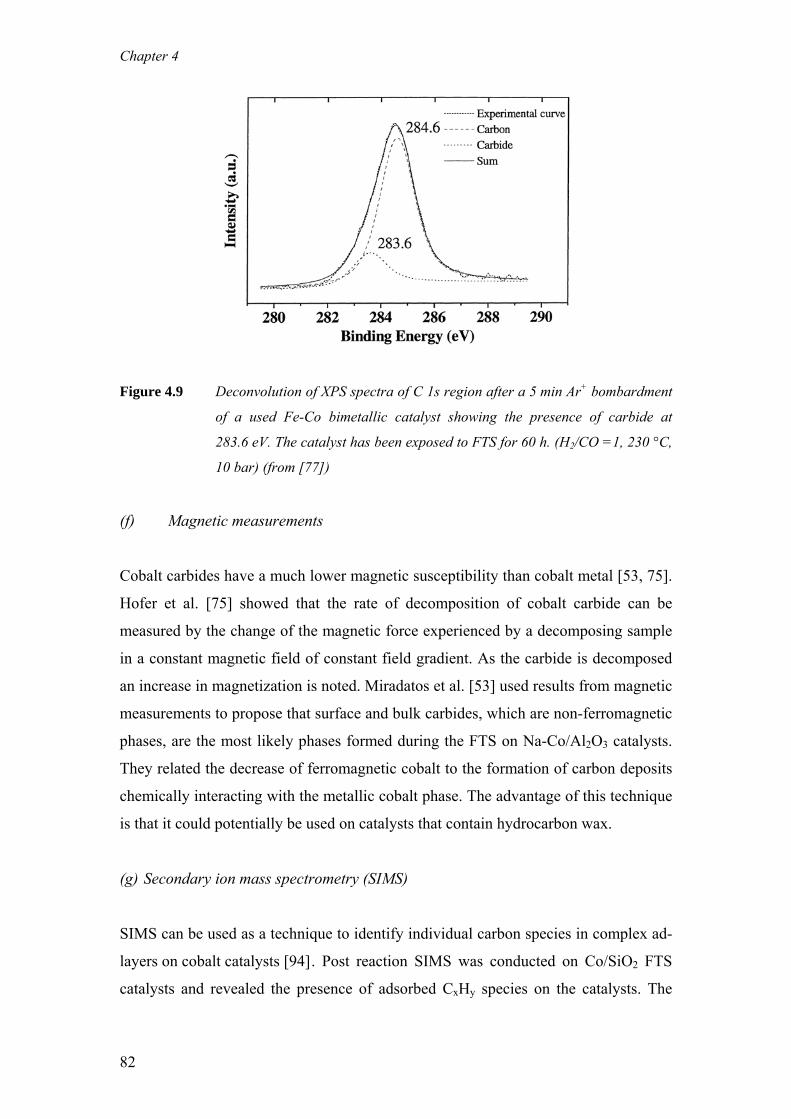
Chapter 4
Figure 4.9 Deconvolution of XPS spectra of C 1s region after a 5 min Ar+ bombardment
of a used Fe-Co bimetallic catalyst showing the presence of carbide at
283.6 eV. The catalyst has been exposed to FTS for 60 h. (H2/CO =1, 230 °C,
10 bar) (from [77])
(f) Magnetic measurements
Cobalt carbides have a much lower magnetic susceptibility than cobalt metal [53, 75].
Hofer et al. [75] showed that the rate of decomposition of cobalt carbide can be
measured by the change of the magnetic force experienced by a decomposing sample
in a constant magnetic field of constant field gradient. As the carbide is decomposed
an increase in magnetization is noted. Miradatos et al. [53] used results from magnetic
measurements to propose that surface and bulk carbides, which are non-ferromagnetic
phases, are the most likely phases formed during the FTS on Na-Co/Al2O3 catalysts.
They related the decrease of ferromagnetic cobalt to the formation of carbon deposits
chemically interacting with the metallic cobalt phase. The advantage of this technique
is that it could potentially be used on catalysts that contain hydrocarbon wax.
(g) Secondary ion mass spectrometry (SIMS)
SIMS can be used as a technique to identify individual carbon species in complex ad-
layers on cobalt catalysts [94] . Post reaction SIMS was conducted on Co/SiO2 FTS
catalysts and revealed the presence of adsorbed CxHy species on the catalysts. The
82
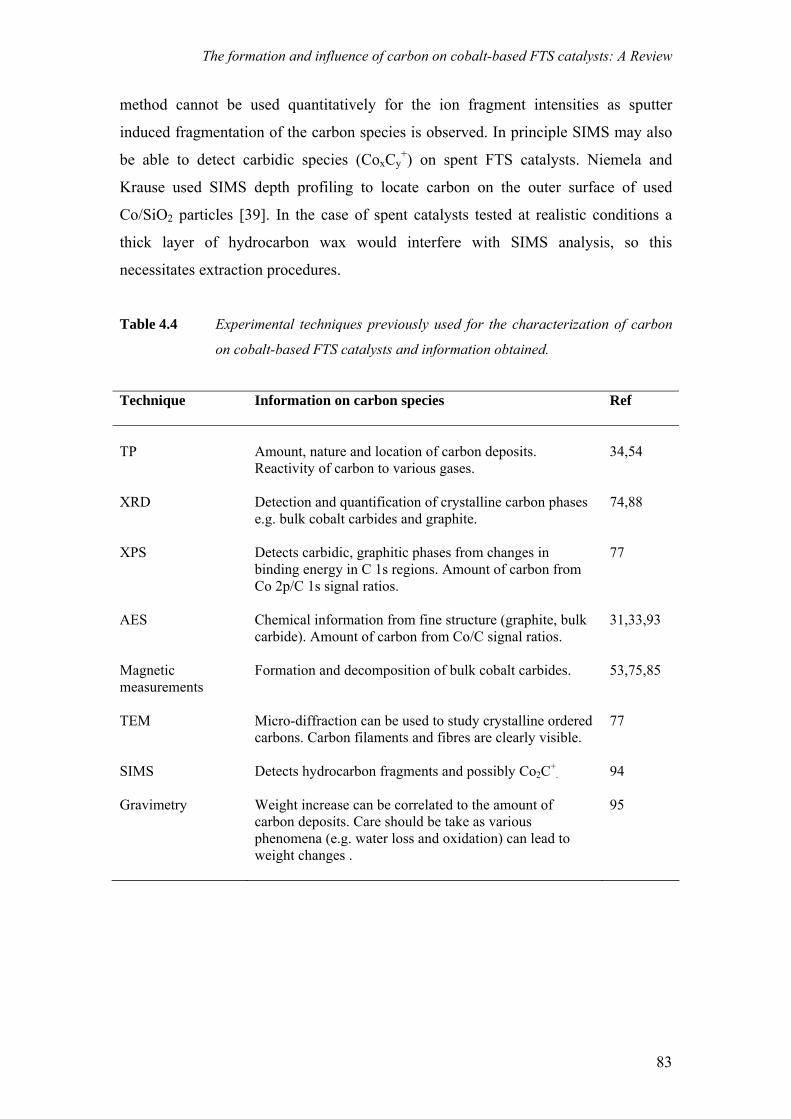
The formation and influence of carbon on cobalt-based FTS catalysts: A Review
method cannot be used quantitatively for the ion fragment intensities as sputter
induced fragmentation of the carbon species is observed. In principle SIMS may also
be able to detect carbidic species (CoxCy+) on spent FTS catalysts. Niemela and
Krause used SIMS depth profiling to locate carbon on the outer surface of used
Co/SiO2 particles [39]. In the case of spent catalysts tested at realistic conditions a
thick layer of hydrocarbon wax would interfere with SIMS analysis, so this
necessitates extraction procedures.
Table 4.4 Experimental techniques previously used for the characterization of carbon
on cobalt-based FTS catalysts and information obtained.
Technique
Information on carbon species Ref
TP
Amount, nature and location of carbon deposits. Reactivity of carbon to various gases.
34,54
XRD
Detection and quantification of crystalline carbon phases e.g. bulk cobalt carbides and graphite.
74,88
XPS
Detects carbidic, graphitic phases from changes in binding energy in C 1s regions. Amount of carbon from Co 2p/C 1s signal ratios.
77
AES
Chemical information from fine structure (graphite, bulk carbide). Amount of carbon from Co/C signal ratios.
31,33,93
Magnetic measurements
Formation and decomposition of bulk cobalt carbides.
53,75,85
TEM
Micro-diffraction can be used to study crystalline ordered carbons. Carbon filaments and fibres are clearly visible.
77
SIMS
Detects hydrocarbon fragments and possibly Co2C+
.
94
Gravimetry
Weight increase can be correlated to the amount of carbon deposits. Care should be take as various phenomena (e.g. water loss and oxidation) can lead to weight changes .
95
83
Chapter 4
4.8 Minimization of carbon deposits on cobalt FTS catalysts by promotion
Additives such as rare earth or noble metals are generally introduced into industrial
cobalt FTS catalysts as structural or reduction promoters [96]. The addition of various
promoters to cobalt catalysts has also been shown to decrease the amount of carbon
produced during the FTS [82, 85, 97, 98]. Furthermore, the addition of promoter
elements may decrease the temperature of regeneration, preventing the possible
sintering of supported cobalt particles during such treatments [96].
In the case of cobalt foils it has been found that 0.1 monolayer of potassium
coverage reduces the formation of graphite at high FTS temperatures (307 ºC) [97]. It
is not exactly clear how the potassium reduced the formation of graphitic carbon
deposits in this study. It is known that alkali ad-atoms on a transition metal surface
exist in a partially ionic state, resulting in a work function decrease [99]. Potassium
promotion results in a weakening of the C-O bond and increase in the CO dissociation
rate, resulting in increased coverage of active surface carbidic carbon [100]. Besides
having an electronic effect, potassium could play a structural role in preventing
graphite formation according to Wesner et al. [101]. They argued that the epitaxial
growth of graphite was favoured on clean hexagonal cobalt and the promotion of the
cobalt with potassium would disrupt the formation of epitaxial graphite islands by site
blocking. However, already at the early stage of FT research it was shown that for
supported cobalt catalyst potassium was a poison [102]. The mobility of potassium
during FTS conditions could also result in it being distributed on the support.
It was shown that manganese added to cobalt on activated carbon catalysts
resulted in a decrease in bulk carbide formation during reduction and a decrease in the
subsequent deactivation rate [82]. Magnesium added to the support in alumina
supported cobalt catalysts showed a lower extent of carburization due to decrease in
Lewis acidity of the alumina surface in the presence of Mg2+ ions [85].
It has been also postulated using molecular modelling and proven
experimentally using temperature programmed techniques that promotion with boron
inhibits detrimental carbon formation [70]. Ab initio calculations indicate that boron
behaves rather similar to carbon and prefers to adsorb in the octahedral sites of the
84
The formation and influence of carbon on cobalt-based FTS catalysts: A Review
first subsurface layer of cobalt. The boron thus forces the carbon to remain on the
surface in an active form. Additionally boron present in the first subsurface layer
reduces the surface carbon binding energy, lowering the carbon coverage and may
prevent the nucleation of graphene islands [70].
It is also known that the common reduction promoters (e.g. Pt and Ru) aid in
carbon gasification. Iglesia et al. [98] showed using XPS that in the case of ruthenium
promoted cobalt on titania catalysts, the promoter inhibits the deposition of carbon
during FTS. Ruthenium may promote hydrogenolysis during the reaction and the
intimate association of ruthenium with cobalt might allow carbon deposits on the
catalyst to be gasified via hydrogenolysis at lower temperatures as opposed to carbon
gasification via combustion with oxygen.
4.9 Regeneration processes to remove carbon deposits
Regeneration of cobalt-based Fischer-Tropsch synthesis (FTS) catalysts is a cost
effective way to increase the life of the cobalt catalyst. In fact, BP reported that the
only way to manage activity decline and ensure a 4-year catalyst life was to
regenerate their catalyst in situ [35]. This is important due to the high cost of cobalt
which can be a considerable proportion of the overall operating cost. In most cases the
regeneration process relies on the effective removal of carbon [36, 37, 38]. The
deleterious carbonaceous deposits can be removed by gasification with O2, H2O and
H2 [15] which makes regeneration feasible. The order of decreasing reaction rate of
carbon is O2 > H2O > H2 ,which can be generalized.
Already in the early stages of the industrial application of cobalt catalysts it
was noted that to secure longer catalyst lifetime, regeneration with hydrogen was
required [103]. Over the next few years new regeneration technologies were
developed and improved for cobalt-based FTS catalysts. The regeneration can be
performed in a few manners: (i) reductive regeneration, (ii) oxidative regeneration,
and (iii) steam/water regeneration. All these regeneration procedures focus on the
removal of deleterious carbon types, i.e. polymeric and graphitic.
85
Chapter 4
Carbon deactivated FTS catalysts can be rejuvenated or regenerated by
treatment in hydrogen [103, 104, and 105]. This can be done in both an in-situ [104]
and ex-situ manner [105]. Non desorbing reaction products (heavy waxes) can be also
be removed from catalysts by treatment with hydrogen, or gases or vapours
containing hydrogen [106]. Often it is necessary to remove wax and hydrocarbons
from a spent catalyst before exposing it to regenerating gas such as oxygen, in order
to limit exotherms that may result in damage to catalyst integrity. Various patents and
publications claim that carbon deactivated catalysts can best be regenerated by
conventional wax removal, oxidation and re-reduction techniques [35, 36, 37, 107,
108]. Steam regeneration can also be used to remove carbon from deactivated
catalysts. Steam reacts with the carbon on the catalyst surface and forms CO and H2,
thus cleaning the surface [38]. The important message is that regeneration efforts
focus largely on the removal of carbon.
4.10 The effect of carbon on FTS selectivities
Along with catalyst activity, product selectivity is a key issue in cobalt-based FTS [1].
For GTL processes the preferred product is long chain waxy hydrocarbons. It is well
known that FT reaction conditions have an important effect on product selectivities.
High temperatures and H2/CO ratios are associated with higher methane selectivity,
lower probability of hydrocarbon chain growth, and lower olefinicity in the
products [109].
The deposition of the different types of inactive carbon species during FTS
may have different influences on the product selectivities. It has been shown with CO
adsorption studies on cobalt and molecular modelling that the presence of carbon will
affect the CO adsorption strength and therefore the CO dissociation rate [41, 71].
Consequently the surface coverage of active carbon may decrease leading to shorter
chained hydrocarbons. Indeed Bertole et al. [110] showed using isotopic transient
experiments that an increase in the amount of surface active carbon (surface carbide)
will result in a higher chain growth probability and thus an increase in desired
selectivity for Co/SiO2 FTS catalysts. Furthermore, it has been shown that presence of
bulk cobalt carbide results in a dramatic increase in methane selectivity during the
FTS [74, 80, 82]. It is also plausible that as the carbon becomes more stable, i.e.
86
The formation and influence of carbon on cobalt-based FTS catalysts: A Review
graphitic, the interaction with the metal would decrease and it would have a lesser
effect on the product distribution.
Co/Al2O3 catalysts that contain higher amounts of less reactive polymeric
carbon not only exhibited enhanced deactivation when tested in FTS when compared
to the fresh catalyst but also showed an increase in selectivity to olefinic products
[31]. The authors postulated that this was probably due to the reduction in
hydrogenation ability of the carbon deposited catalyst to convert primarily formed
olefins into the corresponding paraffins.
Iglesia et al. showed that the pore diameter of the catalyst is an important
parameter for tailoring selectivity [111]. Hence, carbon deposition leading to physical
blocking of the pores could have an influence on the selectivity. Niemela et al. [39]
reported that for a Co/SiO2 catalyst the relative turnover number for the C2+ species
may increase significantly during the initial phase of carbon deactivation due to
preferential blocking of the narrowest catalyst pores. Puskas et al. [73] also showed a
decrease in the hydrocarbon growth rate of Co/Mg/diatomaceous earth catalyst with
increasing time online, which they ascribed to pore blocking.
4.11 Conclusions
It is clear that the FTS over cobalt catalysts occurs in the presence of an active surface
carbidic over layer and in the presence of various hydrocarbon products. The
conversion of this active surface carbidic carbon to other inactive forms (e.g. bulk
carbide, polymeric carbon and graphene) over time can result in deactivation and
selectivity loss of the catalyst. Additionally, it is also evident that non-desorbing,
heavy hydrocarbon wax can lead to pore plugging and deactivation. However, most of
the recent studies on deactivation have dealt with oxidation of cobalt. From the
available literature and regeneration patents, it does seem that deactivation by carbon
deposits is an important deactivation pathway for cobalt-based FTS catalysts under
realistic conditions that warrants further study. There is a lot of a scope for the
development of characterization techniques that are able to pin-point the location and
determine the exact nature of deactivating carbon species.
87
Chapter 4
4.12 References [1] A.P. Steynberg, M.E. Dry (Eds.), Fischer-Tropsch Technology, Studies in Surface Science
and Catalysis, Vol. 152, Elsevier, 2004. [2] J. Eilers, S.A. Posthuma, S.T. Sie, Catal. Lett. 7 (1990) 253. [3] The Catalyst Review Newsletter, Gas-to-Liquids: Peering into the Crystal Ball, 2005, p. 4. [4] V.U.S. Rao, G.J. Stiegel, G.J. Cinquergrane, R.D. Srivastava, Fuel Process. Technol. 30
(1992) 83. [5] P.J. van Berge, S. Barradas, J. van de Loosdrecht, J.L. Visagie, Erdöl Kohle Erdgas P. 117
(2001) 138. [6] P.J. van Berge, J. van de Loosdrecht, S. Barradas, A.M. van der Kraan, Catal. Today 58
(2000) 321. [7] G. Jacobs, T.K. Das, P.M. Patterson, J. Li, L. Sanchez, B.H. Davis, Appl. Catal. A 247 (2003)
335. [8] G. Kiss, C.E. Kliewer, G.J. DeMartin, C.C. Culross, J.E. Baumgartner, J. Catal. 217 (2003)
127. [9] A.M. Hilmen, D. Schanke, K.F. Hanssen, A. Holmen, Appl. Catal. A 186 (1999) 169. [10] J. Li, X. Zhan, Y. Zhang, G. Jacobs, T. Das, B.H. Davis, Appl. Catal. A 228 (2002) 203. [11] A.M. Saib, A. Borgna, J. van de Loosdrecht, P.J. van Berge, J.W. Niemantsverdriet, Appl.
Catal. A 312 (2006) 12. [12] J. van de Loosdrecht, B. Balzhinimaev, J.-A. Dalmon, J.W. Niemantsverdriet, S.V. Tsybulya,
A.M. Saib, P.J. van Berge, J.L. Visagie, Catal. Today 123 (2007) 293. [13] A.M. Saib, A. Borgna, J. van de Loosdrecht, P. van Berge, J.W. Niemantsverdriet, J. Phys.
Chem. B. 110 (2006) 8657. [14] A.M. Saib, A. Borgna, J. van de Loosdrecht, P.J. van Berge, J.W. Geus, J.W.
Niemantsverdriet, J. Catal. 239 (2006) 326. [15] C.H. Bartholomew, Appl. Catal. A 212 (2001) 17. [16] P.J. van Berge, R.C. Everson, Stud. Surf. Sci. Catal. 107 (1997) 207. [17] P.R.F. Baumann, C.W. Degeorge, S.C. Leviness, WO 98/50485 (1997), to Exxon. [18] W.C. Behrmann, S.C. Leviness, WO 98/50486 (1997), to Exxon. [19] S.C. Leviness, W.N. Mitchell, WO 98/50488 (1997), to Exxon. [20] M. Chang, J. Stephen, C.J. Mart, WO 98/50489 (1997), to Exxon. [21] J.R. Rostrup-Nielsen, in: J.R. Anderson, M. Boudart (Eds.), Catalysis Science and
Technology, Springer-Verlag, Berlin, 1984. [22] S.A. Posthuma, J.D. de Graaf,, Great Britain Patent 2 231 581 (1989), to Shell. [23] G.Z. Bian, N. Fujishita, T. Mochizuki, W.S. Ning, M. Yamada, Appl. Catal. A 252 (2003)
251. [24] M.J. Overett, B. Breedt, E. du Plessis, W. Erasmus, J. van de Loosdrecht, Prepr. Pap.-Am.
Chem. Soc., Div. Pet. Chem. 53 (2008) 126. [25] J.A. Moulijn, A.E. van Diepen, F. Kapteijn, Appl. Catal. A 212 (2001) 3. [26] M. Agnelli, H. M. Swaan, C. Marquez-Alvarez, G. A. Martin and C. Mirodatos, J. Catal. 175
(1998) 117. [27] J. Wilson, C. de Groot, J. Phys. Chem. 99 (1995) 7860. [28] I.M. Ciobîcã, R.A. van Santen, P.J. van Berge, J. van de Loosdrecht, Surf. Sci. 602 (2008) 17. [29] G.L. Bezemer, J.H. Bitter, H.P.C.E. Kuipers, H. Oosterbeek, J.E. Holewijn, X. Xu, F.
Kapteijn, A.J. van Dillen, K.P. de Jong, J. Am. Chem. Soc. 128 (2006) 3956. [30] P.G. Menon, J. Mol. Catal. 59 (1990) 207. [31] D.-K. Lee, J.-H. Lee, S.-K. Ihm, Appl. Catal. 36 (1988) 199. [32] H.W. Pennline, R.J. Gormley, R.R. Schehl, Ind. Eng. Chem. Prod. Res. Dev. 23 (1984) 388. [33] P.K. Agrawal, J.R. Katzer, W.H. Manogue, J. Catal. 69 (1981) 312. [34] V. Gruver, R. Young, J. Engman, H.J. Robota, Prepr. Pap.-Am. Chem. Soc., Div. Pet. Chem.
50 (2005) 164. [35] J.J.H.M. Font Freide, T.D. Gamlin, R.J. Hensman, B. Nay, C. Sharp, J. Nat. Gas Chem. 13
(2004) 1. [36] S.L. Soled, E. Iglesia, R. Fiato, G.B. Ansell, United States Patent 5 397 806 (1995), to Exxon. [37] M.J. van der Burgt, J. Ansorge, Great Britain Patent 2 222 531 (1988), to Shell. [38] H.A. Wright, United States Patent 6 486 220 (2002), to Conoco. [39] M.K. Niemela, A.O.I. Krause. Catal. Lett. 42 (1996) 161. [40] H.W. Pennline, S.S. Pollack. Ind. Eng. Chem. Prod. Res. Dev. 25 (1986) 11. [41] M.C. Zonneville, J.J.C. Geerlings, R.A. van Santen, Surf. Sci. 240 (1990) 253.
88
The formation and influence of carbon on cobalt-based FTS catalysts: A Review
[42] L. Borko, Z.E. Horvath, Z. Schay, L. Guczi, Stud. Surf. Sci. Catal. 167 (2007) 231. [43] G. Boskovic, K.J. Smith, Catal. Today 37 (1997) 25. [44] X.-Q. Gong, R. Raval, P. Hu, J. Chem. Phys. 122 (2005) 24711. [45] Q. Ge, M. Neurock, J. Phys. Chem. B 110 (2006) 15368. [46] J.J.C. Geerlings, M.C. Zonneville, C.P M. de Groot, Surf. Sci. 241 (1991) 302. [47] J. Cheng, X-Q Gong, P. Hu, C.M. Lok, P. Ellis, S. French, J. Catal. 254 (2008) 285. [48] P. Winslow, A.T. Bell, J. Catal. 91 (1985) 142. [49] J. Nakamura, K. Tanaka, I. Toyoshima, J. Catal, 108 (1987) 55. [50] P.E. Nolan, D.C. Lynch, A.H. Cutler, J. Phys. Chem. B 102 (1998) 4165.[51] J.J.C. Geerlings, M.C. Zonneville, C.P.M. de Groot, Catal. Lett. 5 (1990) 309. [52] T. Koerts, “The reactivity of surface carbonaceous intermediates”, PhD thesis, Eindhoven
University of Technology, 1992. [53] C. Mirodatos, E. Brum Pereira, A. Gomez Cobo, J.A. Dalmon, G.A. Martin, Top. Catal. 2
(1995) 183. [54] A. Barbier, A. Tuel, I. Arcon, A. Kodre, G. A. Martin, J. Catal. 200 (2001) 106. [55] D. Potoczna-Petru, Carbon 29 (1991) 73. [56] C.H. Bartholomew. Catal. Rev.-Sci. Eng. 24 (1982) 67. [57] J. Nakamura, I. Toyoshima, K.-I. Tanaka, Surf. Sci. 201 (1988) 185. [58] J. R. Rostrup-Nielsen, J. Catal. 27 (1976) 225. [59] A.D. Moeller, C.H. Bartholomew, Ind. Eng. Chem. Proc. Des. Dev. 21 (1982) 390. [60] S. Mukkavilli, C.V. Wittmann, Ind. Eng. Chem. Process Des. Dev. 25 (1986) 487. [61] M. E. Dry, Hydrocarb. Process. 59 (1980) 52. [62] M. P. Hooker, J. T Grant, Surf. Sci., 62 (1977) 21. [63] M.S. Kim, N.M. Rodriguez, R.T.K Baker, J. Catal 143 (1993) 449. [64] D.C. Gardner, C.H. Bartholomew, Ind. Eng. Chem. Prod. Res. Dev. 20 (1981) 80. [65] K.A. Prior, K. Schwaha, R.M. Lambert, Surf. Sci. 77 (1978) 193. [66] B.G. Johnson, C.H. Bartholomew, D.W. Goodman, J. Catal. 128 (1991) 231. [67] J. Lahtinen, T. Anraku, G. A. Samorjai, J. Catal. 142 (1993) 206. [68] J. Lahtinen, T. Anraku, G.A. Somorjai, Catal. Lett. 25 (1994) 241 [69] G.A. Beitel, C.P.M. de Groot, H. Oosterbeek, J.H. Wilson, J. Phys. Chem. B 101 (1997) 4035. [70] J. Xu, K.F. Tan, A. Borgna, M. Saeys, “First Principles Based Promoter Design for
Heterogeneous Catalysis”, Poster 476ae, AIChE Annual meeting, San Francisco, 15 November 2006 (http://aiche.confex.com/aiche/2006/techprogram/S2113.HTM).
[71] J.G. Choi, H.K. Rhee, S.H. Moon, Appl. Catal. 13 (1985) 269. [72] I. Puskas, Catal. Lett. 22(1993) 283. [73] I. Puskas, B.L. Meyers, J.B. Hall, Prepr. Pap.-Am. Chem. Soc., Div. Pet. Chem. 28 (1993)
905. [74] V. Gruver, X. Zhan, J. Engman, H.J. Robota, Prepr. Pap.-Am. Chem. Soc., Div. Pet. Chem. 49
(2004) 192. [75] L.J.E. Hofer, E.M. Cohn, W.C. Peebles, J. Phys. Chem. 53 (1949) 661. [76] S. Weller, L.J.E. Hofer, R.B. Anderson, J. Am. Chem. Soc. 70 (1948) 799. [77] F. Tihay, G. Pourroy, M. Richard-Plouet, A.C. Roger, A. Kiennemann, Appl. Catal. A 206
(2001) 29. [78] J.W. Niemantsverdriet, A.M. van der Kraan, J. Catal. 72 (1981) 385. [79] L.J.E. Hofer, W.C. Peebles, J. Am. Chem. Soc. 69 (1947) 893. [80] United States Bureau of Mines Bulletin 578, “Synthetic liquid fuels from hydrogenation of
carbon monoxide”, Washington, US Government print office, 1948-1959, p 19 (http://www.fischer-tropsch.org).
[81] S.E. Weller, J. Am. Chem. Soc. 69 (1947) 2432. [82] J. Xiong, Y. Ding, T. Wang, L. Yan, W. Chen, H. Zhu, Y Lu, Catal. Lett. 102 (2005) 265. [83] L. Leclercq, A. Almazouari, M. Dufour, G. Leclercq, in: S.T. Oyama (Ed.), The Chemistry of
Transition Metal Carbides and Nitrides, Blackie, Glasgow, 1996, p. 345. [84] O. Kitakami, H. Sato, Y.Shimada, F. Sato, M. Tanaka, Phys. Rev. B 56 (1997) 13849. [85] G.V. Pankina, P.A. Chernavsjii, A.S. Lermontov, V.V. Lunin, Petrol. Chem. 42 (2002) 217. [86] O. Ducreux, J. Lynch, B. Rebours, M. Roy, P. Chaumette, Stud. Surf. Sci. Catal. 119 (1998)
1258. [87] A. Machocki, Appl. Catal. 70 (1991) 237. [88] G. Jacobs, P.M. Patterson, Y. Zhang, T. Das, J. Li, B.H. Davis, Appl. Catal. A 233 (2002)
215. [89] P.G. Harrison, R. Kannengiesser, J. Chem. Soc, Chem. Commun. 20 (1995) 2065.
89
Chapter 4
[90] T. Nemes, A. Chambers, R.T.K. Baker J. Phys. Chem. B 102 (1998) 6323. [91] J. Llorca, N. Homs, J. Sales, J-L.G. Fierro, P. Ramírez de la Piscina, J. Catal. 222 (2004) 470. [92] J.W. Niemantsverdriet, Spectroscopy in Catalysis, Third ed., Wiley-VCH, Weinheim, 2007. [93] S-K. Ihm, D.K. Lee, Stud. Surf. Sci. Catal. 68 (1991) 219. [94] C. Sellmer, S. Decker, N. Kruse, Catal. Lett. 52 (1988) 131. [95] G. R. Fredriksen, E. A. Blekkan, D. Shanke, A. Holmen, Chem. Eng. Technol. 18 (1995) 125. [96] F. Morales, B.M. Weckhuysen, Catalysis 19 (2006) 1. [97] J. Lahtinen, G.A. Samorjai, J. Mol. Catal. A 130 (1998) 255. [98] E. Iglesia, S.L. Soled, R.A. Fiato, G.H. Via, J. Catal. 143 (1993) 345. [99] C.T. Campbell, D.W. Goodman, Surf. Sci. 123 (1982) 413. [100] J.W. Snoek, G.F. Froment, Ind. Eng. Chem. Res. 41 (2002) 3548. [101] D.A. Wesner, G. Linden, H.P. Bonzel, Appl. Surf. Sci. 26 (1986) 335. [102] H. Pichler, Adv. Catal. 4 (1952) 271. [103] K.B. Arcuri, S.C. Leviness, The Regeneration of Hydrocarbon Synthesis Catalyst, A Partial
Review of the Related Art Published during 1930 to 1952, AIChE Spring National Meeting, New Orleans, LA, April 2, 2003 (www.fischer-tropsch.org).
[104] O. Roelen, H. Heckel, F. Hanisch, United States Patent 2 289 731 (1942), to Hydrocarbon Synthesis Corporation.
[105] E. Iglesia, S.L. Soled, R. Fiato, United States Patent 4 738 948 (1988), to Exxon) [106] W. Feisst, O. Roelen. United States Patent 2 369 956 (1945), to Hydrocarbon Synthesis
Corporation. [107] R. Huang, K.L. Agee, B.A. Arcuri, P.F. Schubert, United States Patent 6 812 179 (2002), to
Syntroleum Corporation. [108] X. Zhan, K. Arcuri, R. Huang, K. Agee, J. Engman, H. Robota, Prep. Pap.-Am. Chem. Soc.,
Div. Pet. Chem. 49 (2004) 179. [109] R.L. Espinoza, A.P. Steynberg, B. Jager, A.C. Vosloo, Appl. Catal. A 186 (1999) 13. [110] C.J. Bertole, G. Kiss, C.A. Mims, J. Catal. 223 (2004) 309. [111] E. Iglesia, S.L. Soled, J.E. Baumgartner, S.C. Reyes, J. Catal. 153 (1995) 108.
90
Chapter 5
Carbon deposition as a deactivation mechanism of cobalt-based Fischer-Tropsch synthesis catalysts under realistic conditions Deactivation of cobalt-based Fischer-Tropsch synthesis (FTS) catalysts by
carbonaceous species has been previously postulated. This mechanism, however, is
hard to prove due to the presence of heavy hydrocarbon wax product and the
potential build-up of inert carbon on the catalyst support. Furthermore, the slow
build-up of low quantities of inactive carbon with time on stream necessitates the use
of data from extended FTS runs. In this study, the formation of carbon deposits on
samples of a Co/Pt/Al2O3 catalyst, taken from a 100 bbl/day slurry bubble column
reactor operated over a period of 6 months at commercially relevant FTS conditions
is reported. The spent catalysts were wax extracted in an inert environment and the
amount, nature and location of carbon deposits were then studied using temperature
programmed hydrogenation and oxidation (TPH/TPO), energy-filtered transmission
electron microscopy (EFTEM), high sensitivity low energy ion scattering (HS-LEIS)
and hydrogen chemisorption. TPH/TPO showed that there is an increase in polymeric
carbon with time on stream which may account for a part of the catalyst deactivation.
Carbon maps from EFTEM as well as HS-LEIS data show that the polymeric carbon
is located both on the alumina support and cobalt. The polymeric carbon on the metal
correlates with the catalyst deactivation in cobalt catalyzed FTS.
Chapter 5
5.1 Introduction
The Fischer-Tropsch synthesis (FTS) is at the heart of the gas-to-liquid (GTL)
process, which involves the conversion of synthesis gas derived from natural gas to
clean environmentally friendly diesel [1], i.e. low in sulphur and aromatics. Cobalt-
based catalysts supported on oxidic carriers are preferred to iron for this industrial
process due to their high per pass FT activity, low oxygenate and CO2 selectivity [2].
However, cobalt-based FT catalysts are more expensive compared to iron-based
catalysts and therefore a long catalyst lifetime is needed to ensure that the process is
economically feasible [3]. On a commercial scale, Shell is operating a supported
cobalt catalyst in a fixed bed reactor, as part of their Shell Middle Distillate Synthesis
(SMDS) process in Bintulu, Malaysia. Sasol has a 34 000 bbl/day GTL plant in
operation in Ras Laffan, Qatar, which is based on the Sasol Slurry Phase DistillateTM
(Sasol SPDTM) process, using a supported cobalt catalyst in a slurry bed.
Cobalt-based catalysts tested under realistic conditions (Figure 5.1) exhibit
deactivation with time on stream [4, 5]. In order to maximize the lifetime of a cobalt
catalyst for such processes, an understanding of the deactivation mechanisms at play
is important. A lot of attention has focused on investigating the role of oxidation of
metallic cobalt on catalyst deactivation [4, 6-10]. However, recent work on an
industrial Co/Al2O3 catalyst using XANES, XRD and magnetic measurements has
shown that oxidation is not a deactivation mechanism during realistic FTS [4, 11].
Other postulated deactivation mechanisms include cobalt support compound
formation, poisoning, sintering, cobalt reconstruction and the formation of inert
carbonaceous phases [12].
This study focuses on the role of carbon deposition. Menon [13] has classified
the Fischer–Tropsch synthesis as a carbon insensitive reaction as there is apparently
sufficient hydrogen on the catalyst surface and the strong hydrogenation activity of
the catalyst keeps the surface relatively clean and active even when appreciable
quantities of carbon are already present on the surface. It is also known that cobalt has
a lesser tendency to produce carbon than iron [14]. Even so, a close inspection of the
open and patent literature published especially by companies investing in GTL
technologies suggests that cobalt-based FTS catalysts are negatively influenced by
92
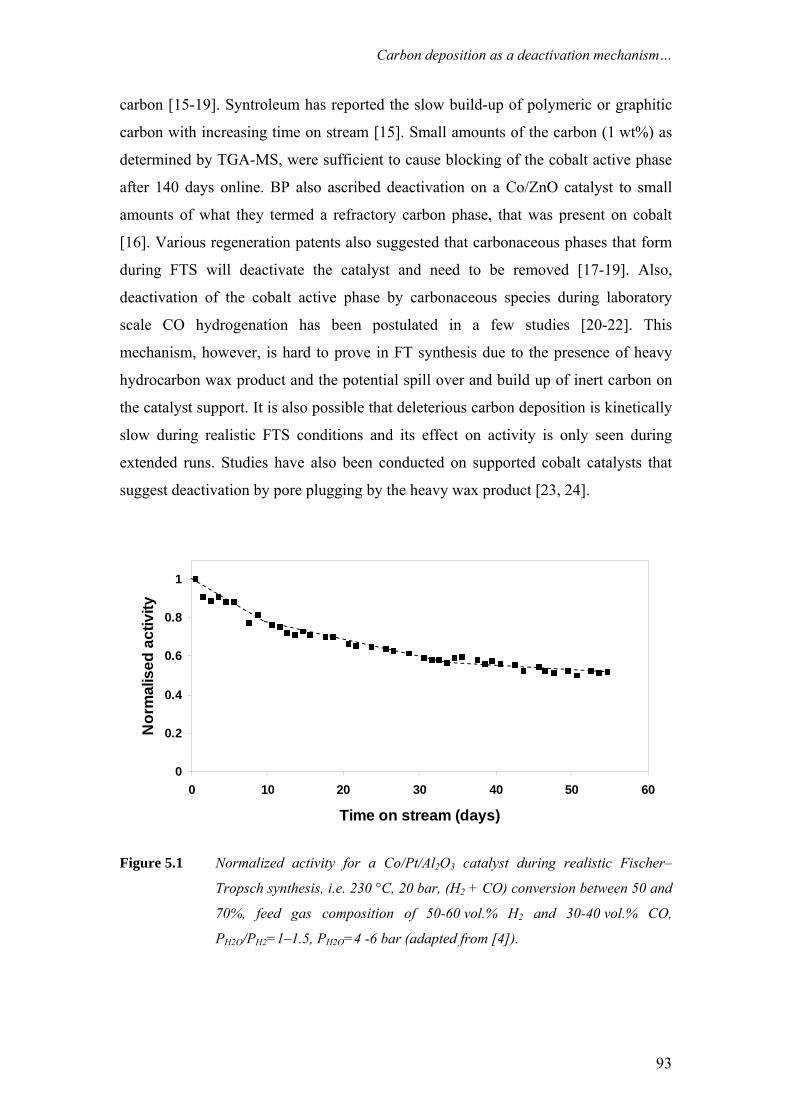
Carbon deposition as a deactivation mechanism…
carbon [15-19]. Syntroleum has reported the slow build-up of polymeric or graphitic
carbon with increasing time on stream [15]. Small amounts of the carbon (1 wt%) as
determined by TGA-MS, were sufficient to cause blocking of the cobalt active phase
after 140 days online. BP also ascribed deactivation on a Co/ZnO catalyst to small
amounts of what they termed a refractory carbon phase, that was present on cobalt
[16]. Various regeneration patents also suggested that carbonaceous phases that form
during FTS will deactivate the catalyst and need to be removed [17-19]. Also,
deactivation of the cobalt active phase by carbonaceous species during laboratory
scale CO hydrogenation has been postulated in a few studies [20-22]. This
mechanism, however, is hard to prove in FT synthesis due to the presence of heavy
hydrocarbon wax product and the potential spill over and build up of inert carbon on
the catalyst support. It is also possible that deleterious carbon deposition is kinetically
slow during realistic FTS conditions and its effect on activity is only seen during
extended runs. Studies have also been conducted on supported cobalt catalysts that
suggest deactivation by pore plugging by the heavy wax product [23, 24].
0
0.2
0.4
0.6
0.8
1
0 10 20 30 40 50 6
Time on stream (days)
Nor
mal
ised
act
ivity
0
Figure 5.1 Normalized activity for a Co/Pt/Al2O3 catalyst during realistic Fischer–
Tropsch synthesis, i.e. 230 °C, 20 bar, (H2 + CO) conversion between 50 and
70%, feed gas composition of 50-60 vol.% H2 and 30-40 vol.% CO,
P /P =1–1.5H2O H2 , P =4 -6 barH2O (adapted from [4]).
93
Chapter 5
There are a number of ways that carbon may interact with a supported cobalt
catalyst to affect its activity. The carbon deposits may block the catalyst pores
resulting in diffusion limitations, poison the metal surface by binding irreversibly or
even encapsulate metal particles [25]. Subsurface carbon may also play a role in
electronic inhibition of activity [26]. It has also been shown that carbon bound to a
metal surface can induce a surface reconstruction which will affect the activity [27].
The diffusion of carbon into cobalt can also result in the formation of bulk cobalt
carbide [28]. Bulk cobalt carbide is not considered FT active and results in both
activity and selectivity loss, presumably through electronic inhibition that affects the
dissociation of CO [29, 30]. It has been shown that bulk carbide can form during
conditions where hydrogen is depleted [31]. It has been reported that bulk carbides are
thermodynamically unstable during the synthesis (200-240 °C) however they have
been previously observed on cobalt FTS catalysts using in situ [32] and synchrotron
XRD [33].
In this study we report on the formation of carbon deposits as a deactivation
mechanism on Co/Pt/Al2O3 catalyst samples taken from a demonstration run
performed at realistic FTS conditions. The spent catalysts were wax extracted in an
inert environment and were then characterized. The accumulation, location and nature
of the carbon deposits was investigated using XPS, temperature programmed
(TPO/TPH) techniques, hydrogen chemisorption, energy-filtered transmission
electron microscopy (EFTEM) and high sensitivity low energy ion scattering (HS-
LEIS).
5.2 Experimental
5.2.1. Catalyst preparation
A 20 wt% Co/Al2O3 catalyst, promoted with 0.05 wt% platinum, was prepared by
slurry impregnation of a γ-alumina support (Puralox 5/150 from Sasol Germany) with
an aqueous cobalt nitrate solution, also containing the platinum precursor (ammonium
platinum nitrate). After impregnation and drying, the catalyst intermediate was
calcined at 250 oC in air and reduced in pure hydrogen at 425 oC. To achieve the
94
Carbon deposition as a deactivation mechanism…
required cobalt loading two impregnation and calcination steps were performed [34-
38].
5.2.2 Extended catalyst testing in demonstration unit run
The Co/Pt/Al2O3 catalyst was tested in a 100 bbl/day slurry bubble column reactor
with a diameter of 0.9 m at commercially relevant FTS conditions, i.e. 230 oC, 20 bar,
H2+CO conversion between 50-70 %, feed gas composition of 50-60 vol. % H2 and
30-40 vol. % CO. The reactor was well-mixed ensuring that representative samples
were taken each time.
5.2.3 Wax extraction procedure
Samples of spent catalyst, protected in a wax layer, were taken from the reactor at
various time intervals under an inert nitrogen environment and allowed to congeal.
Due to the interference of this wax during the follow-up analyses, it was removed by
an exhaustive reflux extraction with dry, deoxygenated tetrahydrofuran (THF, b.p.
66 ºC) under an argon (99.999%) environment for around 3 h, using a P40 glass frit.
After extraction the obtained catalyst particles were dried under vacuum at room
temperature to remove the THF. The catalyst was then transferred under vacuum
using Schlenk glassware into a glove box (4 ppm O2, 1 ppm H2O). The total carbon
level for the catalysts after extraction was on average about 4 wt% as determined by
LECO elemental analysis.
5.2.4 X-ray Photoelectron Spectroscopy (XPS) analysis of wax-extracted samples
The samples were prepared in the glove box by crushing the wax-extracted, FTS
catalyst samples in a pestle and mortar. Afterwards, the powders were pressed into an
indium layer on top of standard stainless steel XPS stubs and transferred via a glove
box into the XPS prechamber. The XPS measurements were carried out using a VG
Escalab 200 MKII spectrometer. An aluminum anode (Kα = 1486.6 eV) was used to
generate the X-ray radiation (240 W (20 mA; 12kV)). Measurements were carried out
with a 0.1 s dwell time and 0.1 eV step for the selected regions. To obtain sufficient
signal-to-noise ratio the Co 2p region was scanned 80 – 120 times (i.e. making the
95
Chapter 5
total measurement approximately 3 hours). During measurement the pressure in the
main chamber remained below 10-8 mbar. Peak deconvolution was carried out with
CasaXPS software.
5.2.5. Temperature Programmed hydrogenation/oxidation (TPH/TPO) coupled with
mass spectroscopic (MS) measurements
In each TP-MS experiment a 100 mg sample of the passivated wax –extracted catalyst
was loaded into a quartz reactor (4 mm internal diameter) followed by purging in
helium for 30 min. In the case of TPH-MS experiments, the reactor was subsequently
heated under a pure H2 flow of 20 ml/min while the temperature was ramped to
600 ºC at 5 ºC/min. The evolution of methane was monitored during the treatment
with a Balzers QMA 400 mass spectrometer (m/z of 15, instead of 16 to avoid
interference from ionized oxygen from water vapour). In coupled TPH/TPO
experiments, the wax-extracted catalysts were first treated in flowing He for 30 min
before ramping the temperature in a 50% He/H2 mixture (20 ml/min) to 350 ºC at
10 ºC/min and holding there for 1 h. The reactor was then cooled to room
temperature, flushed with He for 30 min and then heated to 900 ºC at 10 ºC/min in
10% O2/He flow of 20 ml/min and held there for 1 h. The evolution of CO2 (m/z = 44)
as a gasification product of carbon (C + O2 → CO2) was monitored. The CO2 area
under the TPO curves was integrated using Microcal Origin 7.5 software. Under these
conditions, the formation of significant amounts of CO from incomplete carbon
gasification can be excluded. The mass percentage of carbon on the catalysts was
determined from the area of the CO2 peaks which were calibrated from the
stoichiometric decomposition of NaHCO3 (Analysis grade).
5.2.6. Hydrogen chemisorption experiments
Samples of catalysts were taken from the slurry bubble column reactor at various
intervals and wax-extracted in a similar manner as described above. After passivation
of the catalyst over dry ice, chemisorption analysis was performed using an ASAP
2010 (Micromeritics) instrument. Approximately 0.25 g of sample was activated by
reduction under a flow of hydrogen (UHP). The reduction procedure employed was
2oC/min to 350 oC (or 500 ºC), hold for 240 minutes.
96
Carbon deposition as a deactivation mechanism…
5.2.7 Transmission Electron Microscopy (TEM) and Energy Filtered TEM
Thin samples for TEM were prepared by crushing the passivated catalyst with a
mortar and pestle. Then an appropriate amount of sample was placed onto a holey
carbon microscope grid covered with carbon windows. EFTEM analysis was done on
a JEOL 2010F microscope operated at 200 keV, using a Gatan energy loss
spectroscopy system.
5.2.8 High sensitivity low energy ion scattering (HS-LEIS) experiments
HS-LEIS is a very surface specific technique. It can selectively analyze the outermost
atomic layer of a sample [39]. The HS-LEIS experiments were performed at
Calipso BV and the set-up used for the experiments is described in detail
elsewhere [40]. A sample of wax extracted sample was first subjected to TPH and
held at 350 ºC for 1 hr and then passivated at room temperature in a dilute 0.1 %
O2/He mixture. This sample was placed in a small sample container, mildly
compacted and measured. The samples were analyzed with 3 keV4He+ with typical
ion currents of 0.3 – 2 nA. The ion beam is rastered over a certain area to obtain a
homogeneous ion dose on the sample and to minimize the ion impact induced
damage. Typically about 1 atomic % of the outer atomic layer was removed during
the recording of a spectrum. Thereafter the sample was treated with atomic oxygen in
the preparation chamber and then transferred to the analysis chamber. The oxygen
atoms are generated by oxygen plasma and filtered (removal of energetic particles,
ions and electrons) before they reach the sample. In this way any residual carbon on
the sample is removed by the very reactive O-atoms, without damaging the surface by
bombardment. Typically, the sample is clean after a 10 minute treatment.
5.3. Results
The following methodology was used to characterize the carbon phases on the
Co/Pt/Al2O3 catalyst. Catalyst samples were removed from the 100-barrel/day slurry
bubble column reactor operated over a period of 6 months. The catalyst samples
(~1 cm3) were wax extracted with the THF and transferred into a glove box in a
97
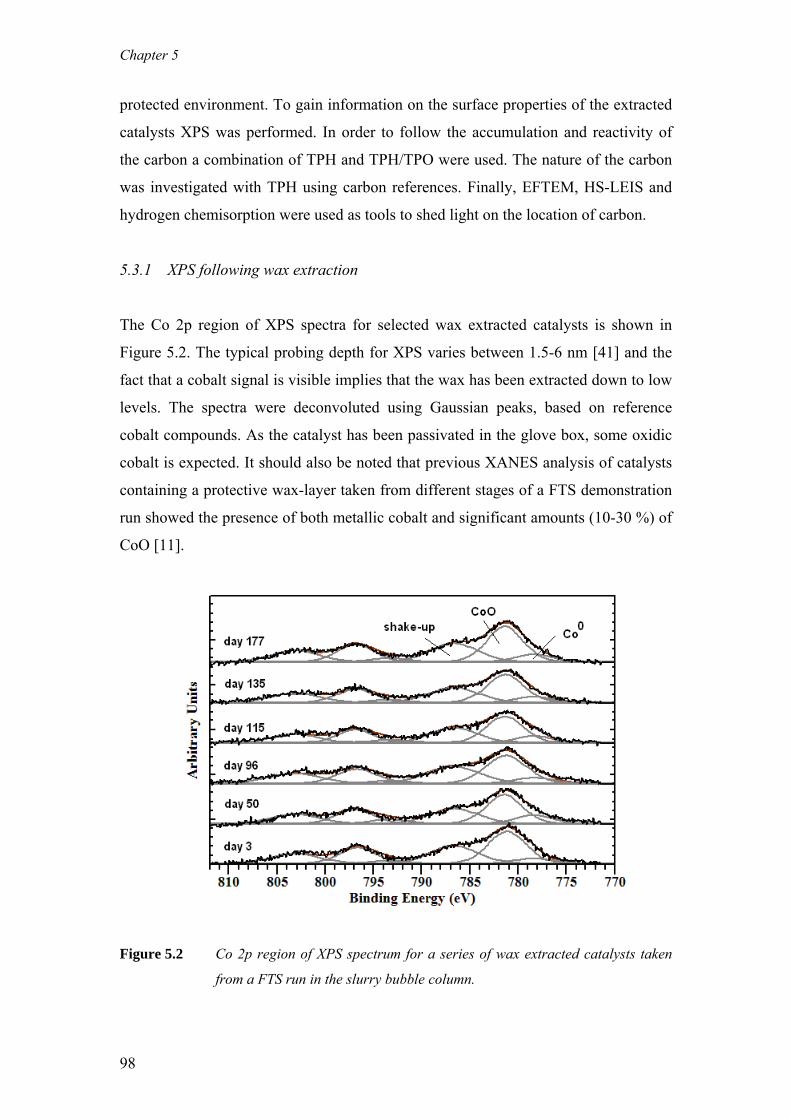
Chapter 5
protected environment. To gain information on the surface properties of the extracted
catalysts XPS was performed. In order to follow the accumulation and reactivity of
the carbon a combination of TPH and TPH/TPO were used. The nature of the carbon
was investigated with TPH using carbon references. Finally, EFTEM, HS-LEIS and
hydrogen chemisorption were used as tools to shed light on the location of carbon.
5.3.1 XPS following wax extraction
The Co 2p region of XPS spectra for selected wax extracted catalysts is shown in
Figure 5.2. The typical probing depth for XPS varies between 1.5-6 nm [41] and the
fact that a cobalt signal is visible implies that the wax has been extracted down to low
levels. The spectra were deconvoluted using Gaussian peaks, based on reference
cobalt compounds. As the catalyst has been passivated in the glove box, some oxidic
cobalt is expected. It should also be noted that previous XANES analysis of catalysts
containing a protective wax-layer taken from different stages of a FTS demonstration
run showed the presence of both metallic cobalt and significant amounts (10-30 %) of
CoO [11].
Figure 5.2 Co 2p region of XPS spectrum for a series of wax extracted catalysts taken
from a FTS run in the slurry bubble column.
98
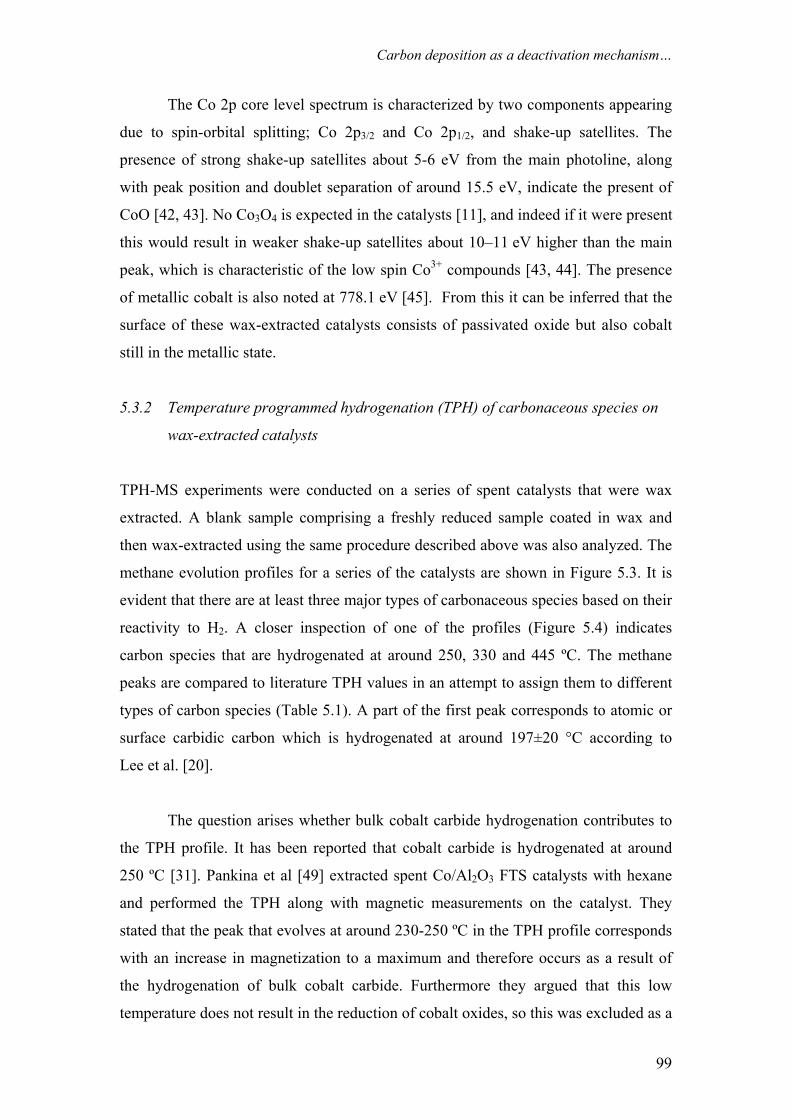
Carbon deposition as a deactivation mechanism…
The Co 2p core level spectrum is characterized by two components appearing
due to spin-orbital splitting; Co 2p3/2 and Co 2p1/2, and shake-up satellites. The
presence of strong shake-up satellites about 5-6 eV from the main photoline, along
with peak position and doublet separation of around 15.5 eV, indicate the present of
CoO [42, 43]. No Co3O4 is expected in the catalysts [11], and indeed if it were present
this would result in weaker shake-up satellites about 10–11 eV higher than the main
peak, which is characteristic of the low spin Co3+ compounds [43, 44]. The presence
of metallic cobalt is also noted at 778.1 eV [45]. From this it can be inferred that the
surface of these wax-extracted catalysts consists of passivated oxide but also cobalt
still in the metallic state.
5.3.2 Temperature programmed hydrogenation (TPH) of carbonaceous species on
wax-extracted catalysts
TPH-MS experiments were conducted on a series of spent catalysts that were wax
extracted. A blank sample comprising a freshly reduced sample coated in wax and
then wax-extracted using the same procedure described above was also analyzed. The
methane evolution profiles for a series of the catalysts are shown in Figure 5.3. It is
evident that there are at least three major types of carbonaceous species based on their
reactivity to H2. A closer inspection of one of the profiles (Figure 5.4) indicates
carbon species that are hydrogenated at around 250, 330 and 445 ºC. The methane
peaks are compared to literature TPH values in an attempt to assign them to different
types of carbon species (Table 5.1). A part of the first peak corresponds to atomic or
surface carbidic carbon which is hydrogenated at around 197±20 °C according to
Lee et al. [20].
The question arises whether bulk cobalt carbide hydrogenation contributes to
the TPH profile. It has been reported that cobalt carbide is hydrogenated at around
250 ºC [31]. Pankina et al [49] extracted spent Co/Al2O3 FTS catalysts with hexane
and performed the TPH along with magnetic measurements on the catalyst. They
stated that the peak that evolves at around 230-250 ºC in the TPH profile corresponds
with an increase in magnetization to a maximum and therefore occurs as a result of
the hydrogenation of bulk cobalt carbide. Furthermore they argued that this low
temperature does not result in the reduction of cobalt oxides, so this was excluded as a
99
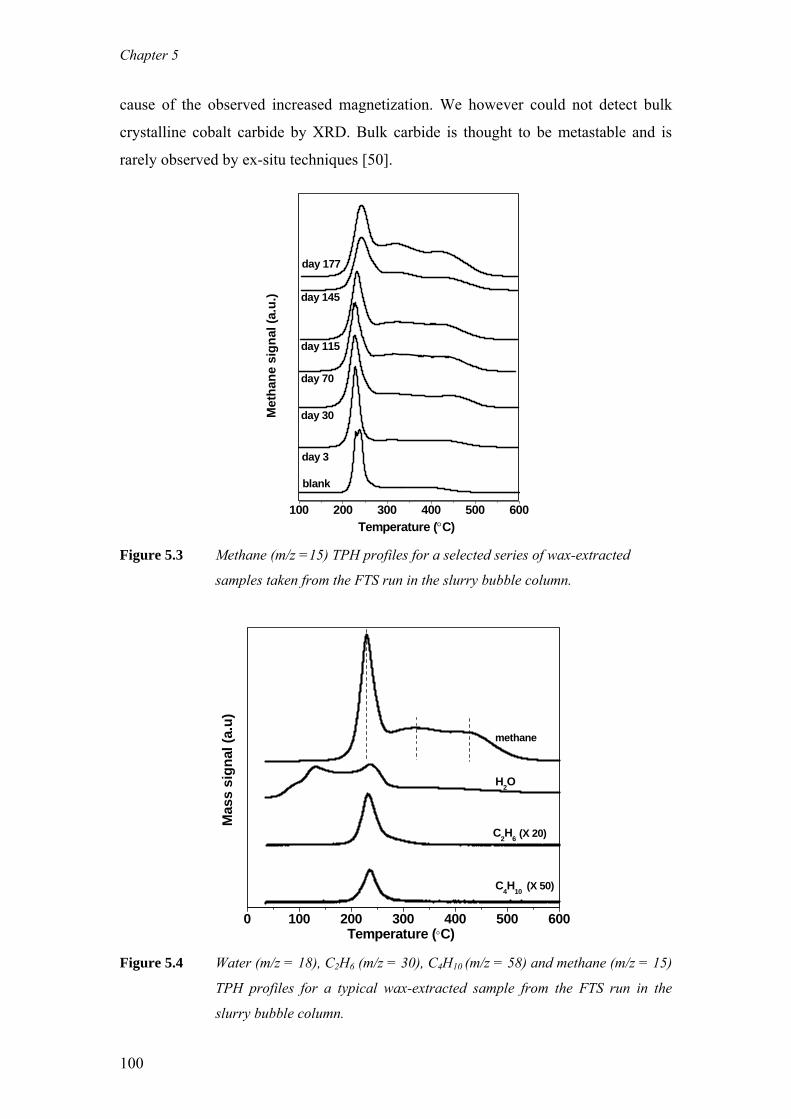
Chapter 5
cause of the observed increased magnetization. We however could not detect bulk
crystalline cobalt carbide by XRD. Bulk carbide is thought to be metastable and is
rarely observed by ex-situ techniques [50].
100 200 300 400 500 600
Met
hane
sig
nal (
a.u.
)
blank
day 3
day 30
day 70
day 115
day 145
day 177
Temperature (°C) Figure 5.3 Methane (m/z =15) TPH profiles for a selected series of wax-extracted
samples taken from the FTS run in the slurry bubble column.
0 100 200 300 400 500 600
(X 50)C4H10
C2H6
H2O
methane
Mas
s si
gnal
(a.u
)
(X 20)
Temperature (°C) Figure 5.4 Water (m/z = 18), C2H6 (m/z = 30), C4H10 (m/z = 58) and methane (m/z = 15)
TPH profiles for a typical wax-extracted sample from the FTS run in the
slurry bubble column.
100
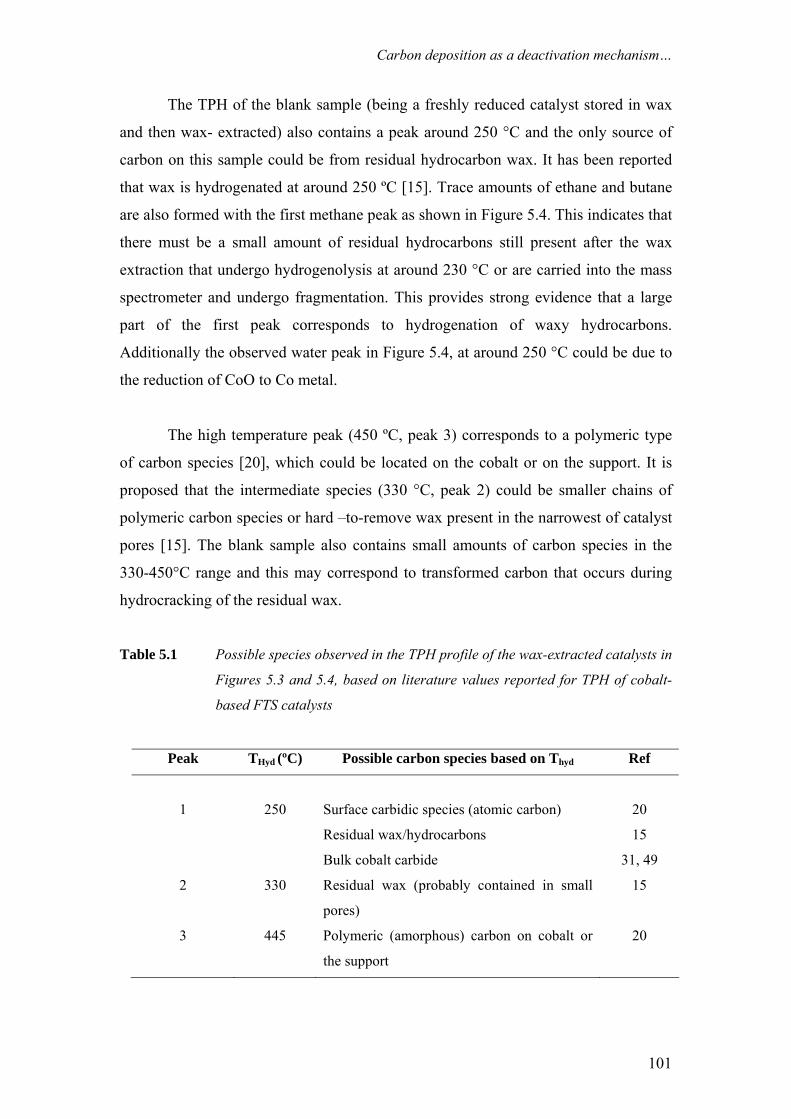
Carbon deposition as a deactivation mechanism…
The TPH of the blank sample (being a freshly reduced catalyst stored in wax
and then wax- extracted) also contains a peak around 250 °C and the only source of
carbon on this sample could be from residual hydrocarbon wax. It has been reported
that wax is hydrogenated at around 250 ºC [15]. Trace amounts of ethane and butane
are also formed with the first methane peak as shown in Figure 5.4. This indicates that
there must be a small amount of residual hydrocarbons still present after the wax
extraction that undergo hydrogenolysis at around 230 °C or are carried into the mass
spectrometer and undergo fragmentation. This provides strong evidence that a large
part of the first peak corresponds to hydrogenation of waxy hydrocarbons.
Additionally the observed water peak in Figure 5.4, at around 250 °C could be due to
the reduction of CoO to Co metal.
The high temperature peak (450 ºC, peak 3) corresponds to a polymeric type
of carbon species [20], which could be located on the cobalt or on the support. It is
proposed that the intermediate species (330 °C, peak 2) could be smaller chains of
polymeric carbon species or hard –to-remove wax present in the narrowest of catalyst
pores [15]. The blank sample also contains small amounts of carbon species in the
330-450°C range and this may correspond to transformed carbon that occurs during
hydrocracking of the residual wax.
Table 5.1 Possible species observed in the TPH profile of the wax-extracted catalysts in
Figures 5.3 and 5.4, based on literature values reported for TPH of cobalt-
based FTS catalysts
Peak THyd (ºC) Possible carbon species based on Thyd Ref
1
250
Surface carbidic species (atomic carbon)
Residual wax/hydrocarbons
Bulk cobalt carbide
20
15
31, 49
2 330 Residual wax (probably contained in small
pores)
15
3 445 Polymeric (amorphous) carbon on cobalt or
the support
20
101
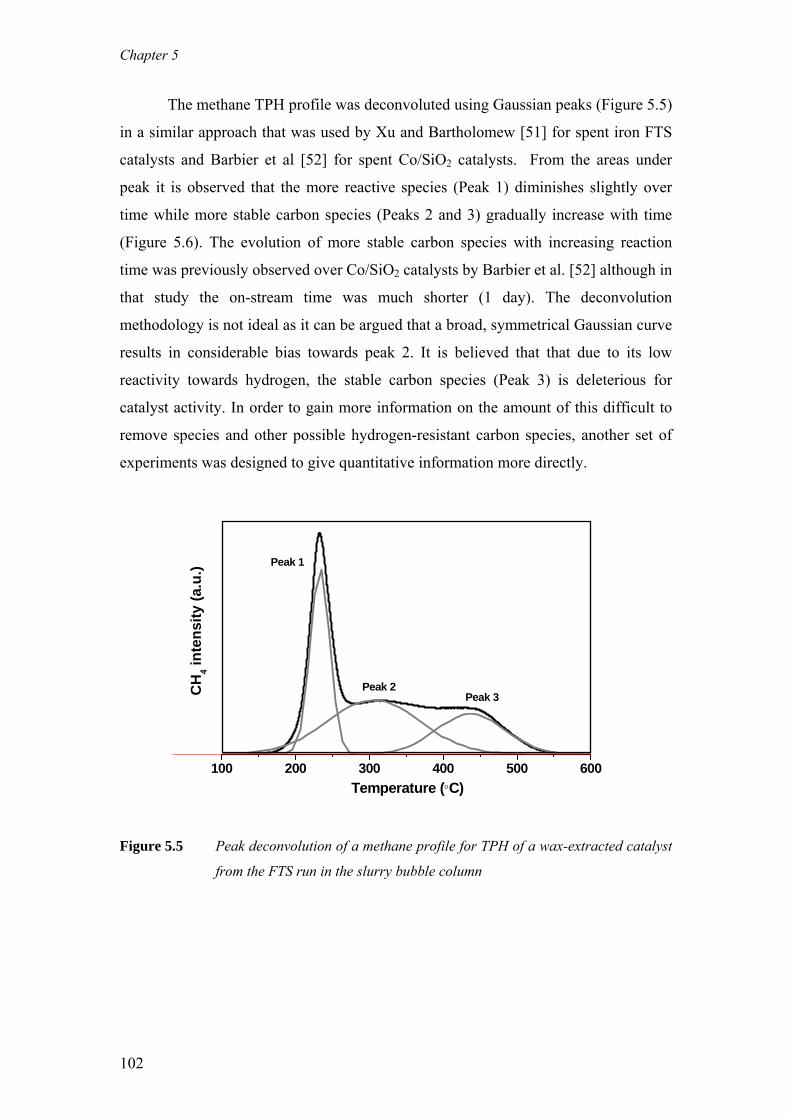
Chapter 5
The methane TPH profile was deconvoluted using Gaussian peaks (Figure 5.5)
in a similar approach that was used by Xu and Bartholomew [51] for spent iron FTS
catalysts and Barbier et al [52] for spent Co/SiO2 catalysts. From the areas under
peak it is observed that the more reactive species (Peak 1) diminishes slightly over
time while more stable carbon species (Peaks 2 and 3) gradually increase with time
(Figure 5.6). The evolution of more stable carbon species with increasing reaction
time was previously observed over Co/SiO2 catalysts by Barbier et al. [52] although in
that study the on-stream time was much shorter (1 day). The deconvolution
methodology is not ideal as it can be argued that a broad, symmetrical Gaussian curve
results in considerable bias towards peak 2. It is believed that that due to its low
reactivity towards hydrogen, the stable carbon species (Peak 3) is deleterious for
catalyst activity. In order to gain more information on the amount of this difficult to
remove species and other possible hydrogen-resistant carbon species, another set of
experiments was designed to give quantitative information more directly.
100 200 300 400 500 600
Peak 3CH
4 int
ensi
ty (a
.u.) Peak 1
Temperature (°C)
Peak 2
Figure 5.5 Peak deconvolution of a methane profile for TPH of a wax-extracted catalyst
from the FTS run in the slurry bubble column
102
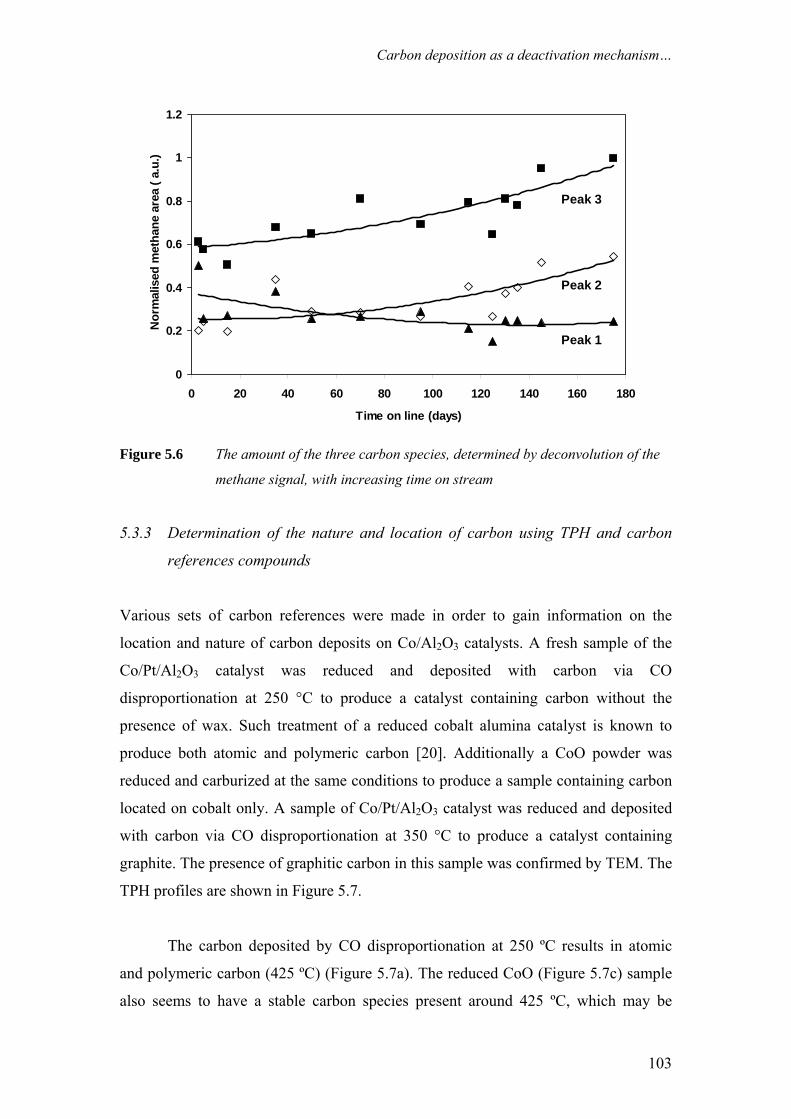
Carbon deposition as a deactivation mechanism…
0
0.2
0.4
0.6
0.8
1
1.2
0 20 40 60 80 100 120 140 160 180
Time on line (days)
Nor
mal
ised
met
hane
are
a ( a
.u.)
Peak 3
Peak 2
Peak 1
Figure 5.6 The amount of the three carbon species, determined by deconvolution of the
methane signal, with increasing time on stream
5.3.3 Determination of the nature and location of carbon using TPH and carbon
references compounds
Various sets of carbon references were made in order to gain information on the
location and nature of carbon deposits on Co/Al2O3 catalysts. A fresh sample of the
Co/Pt/Al2O3 catalyst was reduced and deposited with carbon via CO
disproportionation at 250 °C to produce a catalyst containing carbon without the
presence of wax. Such treatment of a reduced cobalt alumina catalyst is known to
produce both atomic and polymeric carbon [20]. Additionally a CoO powder was
reduced and carburized at the same conditions to produce a sample containing carbon
located on cobalt only. A sample of Co/Pt/Al2O3 catalyst was reduced and deposited
with carbon via CO disproportionation at 350 °C to produce a catalyst containing
graphite. The presence of graphitic carbon in this sample was confirmed by TEM. The
TPH profiles are shown in Figure 5.7.
The carbon deposited by CO disproportionation at 250 ºC results in atomic
and polymeric carbon (425 ºC) (Figure 5.7a). The reduced CoO (Figure 5.7c) sample
also seems to have a stable carbon species present around 425 ºC, which may be
103
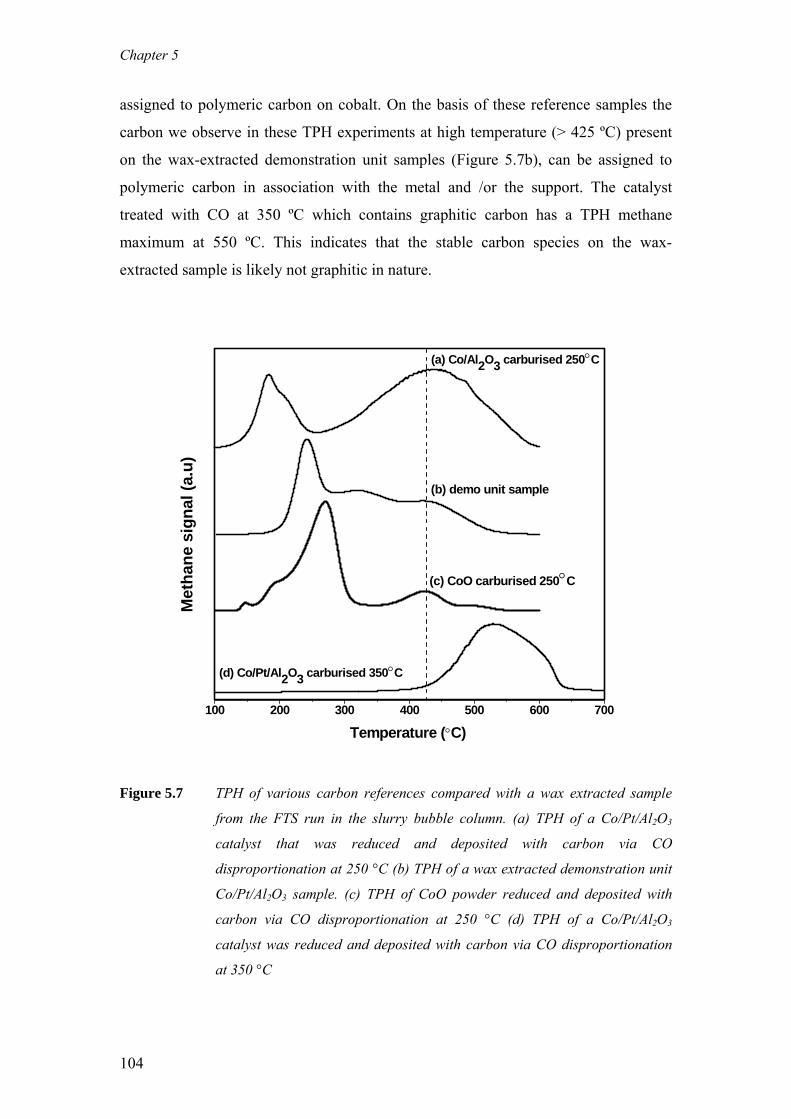
Chapter 5
assigned to polymeric carbon on cobalt. On the basis of these reference samples the
carbon we observe in these TPH experiments at high temperature (> 425 ºC) present
on the wax-extracted demonstration unit samples (Figure 5.7b), can be assigned to
polymeric carbon in association with the metal and /or the support. The catalyst
treated with CO at 350 ºC which contains graphitic carbon has a TPH methane
maximum at 550 ºC. This indicates that the stable carbon species on the wax-
extracted sample is likely not graphitic in nature.
100 200 300 400 500 600 700
(d) Co/Pt/Al2O3 carburised 350°C
Met
hane
sig
nal (
a.u)
(c) CoO carburised 250°C
Temperature (°C)
(b) demo unit sample
(a) Co/Al2O3 carburised 250°C
Figure 5.7 TPH of various carbon references compared with a wax extracted sample
from the FTS run in the slurry bubble column. (a) TPH of a Co/Pt/Al2O3
catalyst that was reduced and deposited with carbon via CO
disproportionation at 250 °C (b) TPH of a wax extracted demonstration unit
Co/Pt/Al2O3 sample. (c) TPH of CoO powder reduced and deposited with
carbon via CO disproportionation at 250 °C (d) TPH of a Co/Pt/Al2O3
catalyst was reduced and deposited with carbon via CO disproportionation
at 350 °C
104
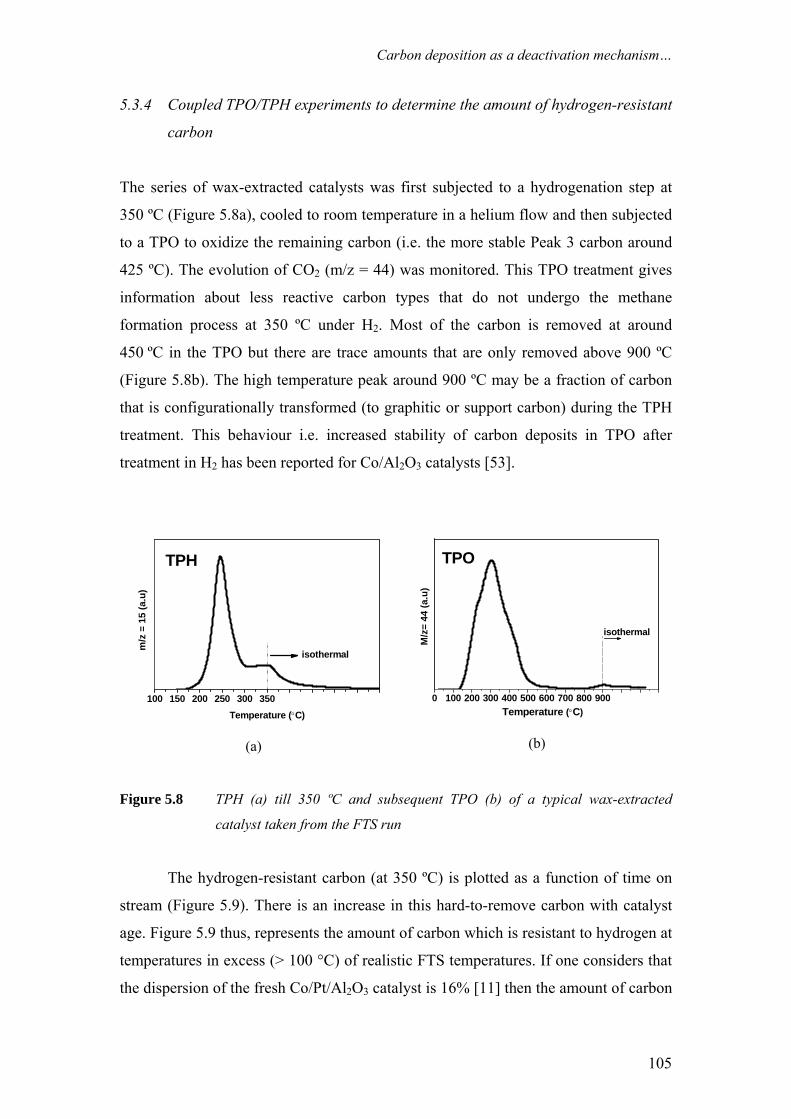
Carbon deposition as a deactivation mechanism…
5.3.4 Coupled TPO/TPH experiments to determine the amount of hydrogen-resistant
carbon
The series of wax-extracted catalysts was first subjected to a hydrogenation step at
350 ºC (Figure 5.8a), cooled to room temperature in a helium flow and then subjected
to a TPO to oxidize the remaining carbon (i.e. the more stable Peak 3 carbon around
425 ºC). The evolution of CO2 (m/z = 44) was monitored. This TPO treatment gives
information about less reactive carbon types that do not undergo the methane
formation process at 350 ºC under H2. Most of the carbon is removed at around
450 ºC in the TPO but there are trace amounts that are only removed above 900 ºC
(Figure 5.8b). The high temperature peak around 900 ºC may be a fraction of carbon
that is configurationally transformed (to graphitic or support carbon) during the TPH
treatment. This behaviour i.e. increased stability of carbon deposits in TPO after
treatment in H2 has been reported for Co/Al2O3 catalysts [53].
100 150 200 250 300 350 400 450 500 550 600Temperature (°C)
m/z
= 1
5 (a
.u)
isothermal
TPH
(a)
0 100 200 300 400 500 600 700 800 900100011001200Temperature (°C)
isothermal
M/z
= 44
(a.u
)
TPO
(b)
Figure 5.8 TPH (a) till 350 ºC and subsequent TPO (b) of a typical wax-extracted
catalyst taken from the FTS run
The hydrogen-resistant carbon (at 350 ºC) is plotted as a function of time on
stream (Figure 5.9). There is an increase in this hard-to-remove carbon with catalyst
age. Figure 5.9 thus, represents the amount of carbon which is resistant to hydrogen at
temperatures in excess (> 100 °C) of realistic FTS temperatures. If one considers that
the dispersion of the fresh Co/Pt/Al2O3 catalyst is 16% [11] then the amount of carbon
105
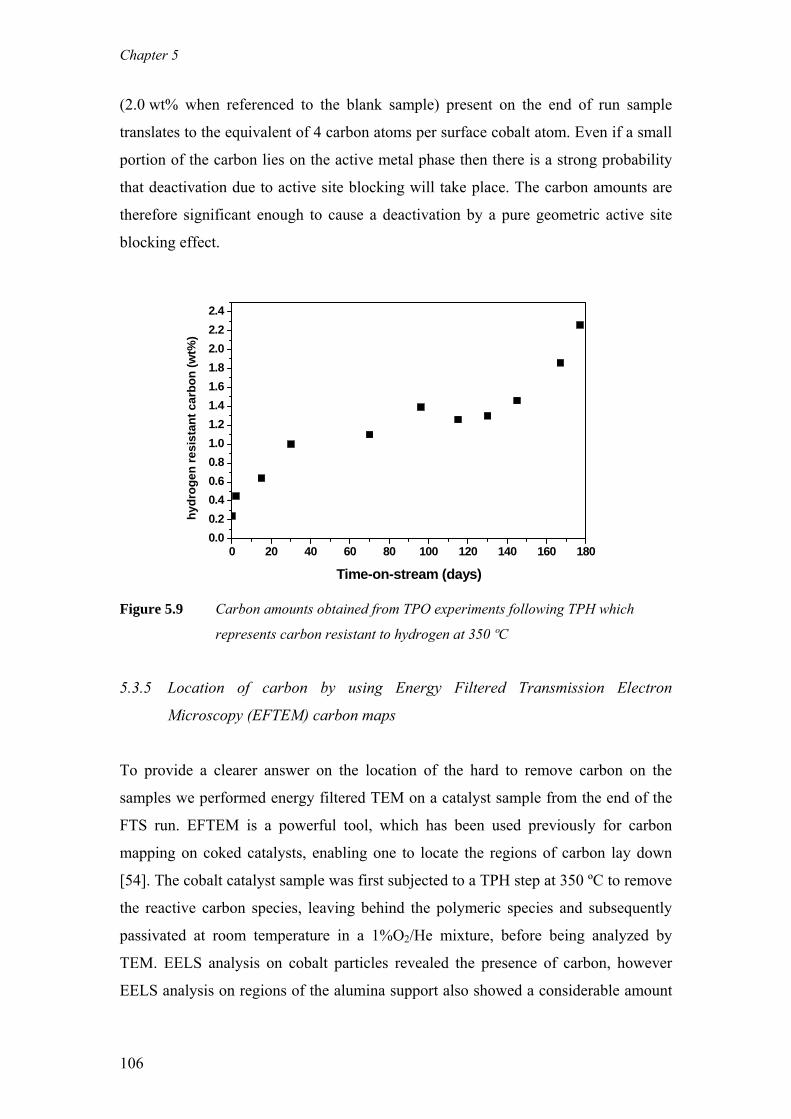
Chapter 5
(2.0 wt% when referenced to the blank sample) present on the end of run sample
translates to the equivalent of 4 carbon atoms per surface cobalt atom. Even if a small
portion of the carbon lies on the active metal phase then there is a strong probability
that deactivation due to active site blocking will take place. The carbon amounts are
therefore significant enough to cause a deactivation by a pure geometric active site
blocking effect.
0 20 40 60 80 100 120 140 160 1800.00.20.40.60.81.01.21.41.61.82.02.22.4
hydr
ogen
resi
stan
t car
bon
(wt%
)
Time-on-stream (days)
Figure 5.9 Carbon amounts obtained from TPO experiments following TPH which
represents carbon resistant to hydrogen at 350 ºC
5.3.5 Location of carbon by using Energy Filtered Transmission Electron
Microscopy (EFTEM) carbon maps
To provide a clearer answer on the location of the hard to remove carbon on the
samples we performed energy filtered TEM on a catalyst sample from the end of the
FTS run. EFTEM is a powerful tool, which has been used previously for carbon
mapping on coked catalysts, enabling one to locate the regions of carbon lay down
[54]. The cobalt catalyst sample was first subjected to a TPH step at 350 ºC to remove
the reactive carbon species, leaving behind the polymeric species and subsequently
passivated at room temperature in a 1%O2/He mixture, before being analyzed by
TEM. EELS analysis on cobalt particles revealed the presence of carbon, however
EELS analysis on regions of the alumina support also showed a considerable amount
106
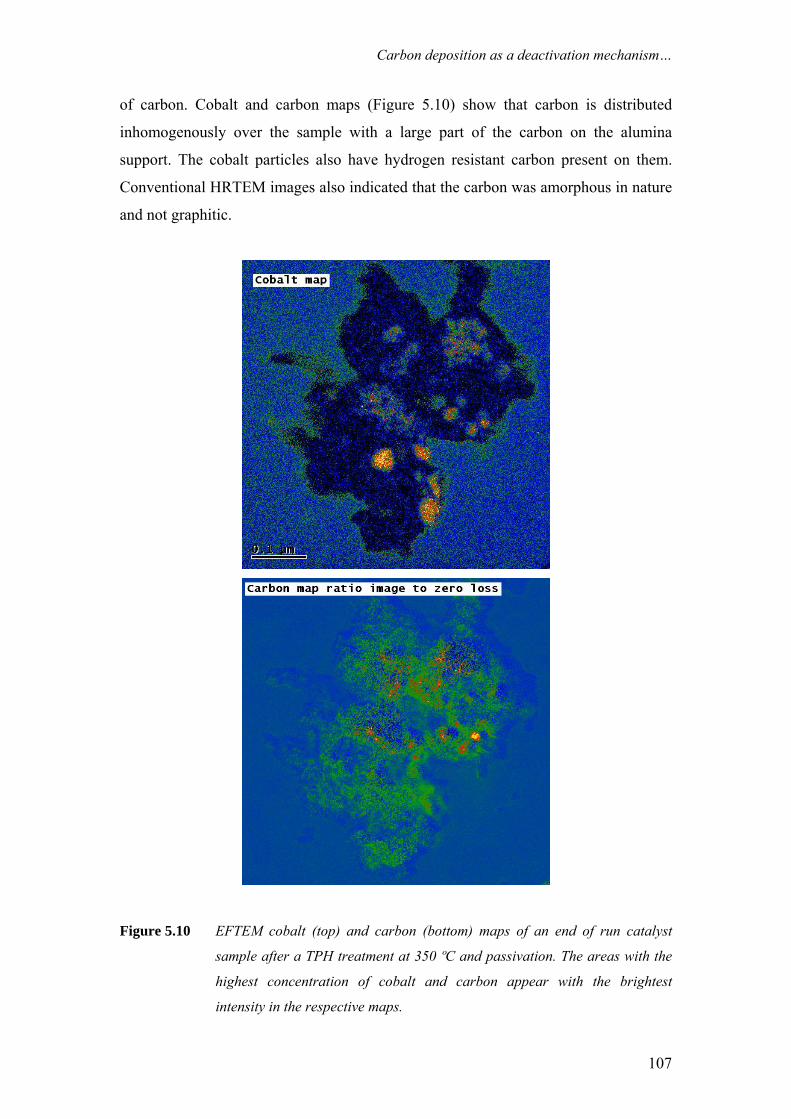
Carbon deposition as a deactivation mechanism…
of carbon. Cobalt and carbon maps (Figure 5.10) show that carbon is distributed
inhomogenously over the sample with a large part of the carbon on the alumina
support. The cobalt particles also have hydrogen resistant carbon present on them.
Conventional HRTEM images also indicated that the carbon was amorphous in nature
and not graphitic.
Figure 5.10 EFTEM cobalt (top) and carbon (bottom) maps of an end of run catalyst
sample after a TPH treatment at 350 ºC and passivation. The areas with the
highest concentration of cobalt and carbon appear with the brightest
intensity in the respective maps.
107
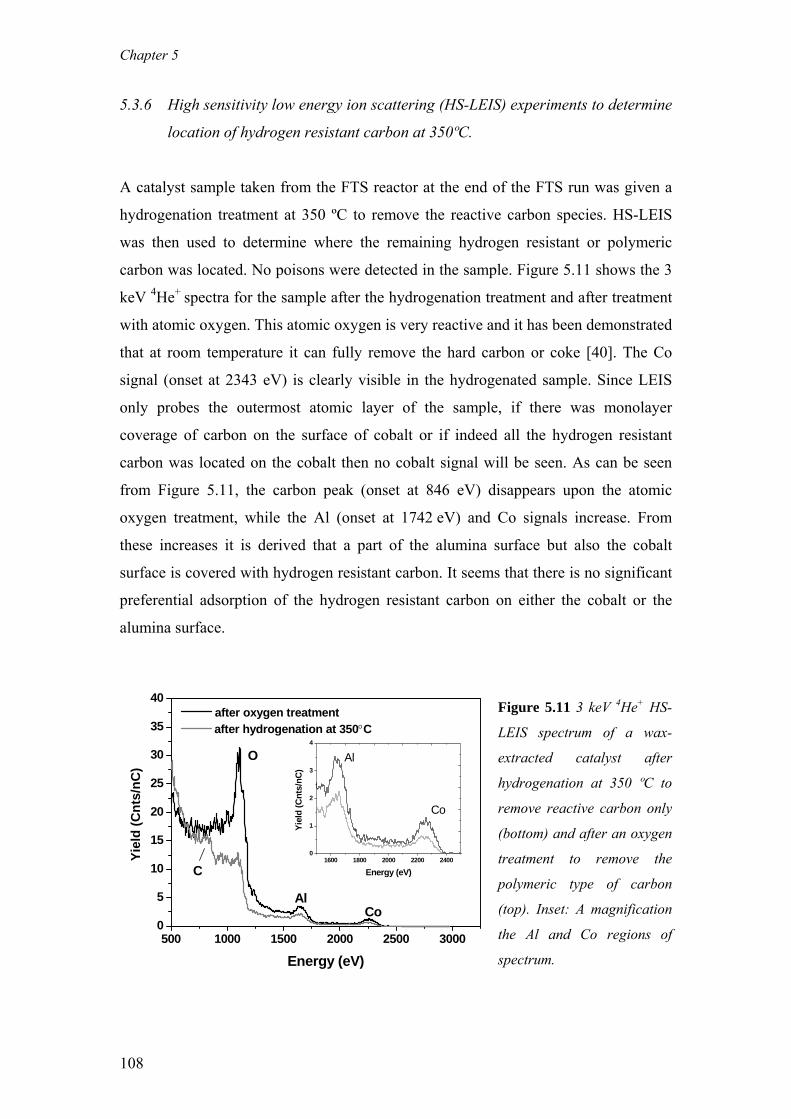
Chapter 5
5.3.6 High sensitivity low energy ion scattering (HS-LEIS) experiments to determine
location of hydrogen resistant carbon at 350ºC.
A catalyst sample taken from the FTS reactor at the end of the FTS run was given a
hydrogenation treatment at 350 ºC to remove the reactive carbon species. HS-LEIS
was then used to determine where the remaining hydrogen resistant or polymeric
carbon was located. No poisons were detected in the sample. Figure 5.11 shows the 3
keV 4He+ spectra for the sample after the hydrogenation treatment and after treatment
with atomic oxygen. This atomic oxygen is very reactive and it has been demonstrated
that at room temperature it can fully remove the hard carbon or coke [40]. The Co
signal (onset at 2343 eV) is clearly visible in the hydrogenated sample. Since LEIS
only probes the outermost atomic layer of the sample, if there was monolayer
coverage of carbon on the surface of cobalt or if indeed all the hydrogen resistant
carbon was located on the cobalt then no cobalt signal will be seen. As can be seen
from Figure 5.11, the carbon peak (onset at 846 eV) disappears upon the atomic
oxygen treatment, while the Al (onset at 1742 eV) and Co signals increase. From
these increases it is derived that a part of the alumina surface but also the cobalt
surface is covered with hydrogen resistant carbon. It seems that there is no significant
preferential adsorption of the hydrogen resistant carbon on either the cobalt or the
alumina surface.
500 1000 1500 2000 2500 30000
5
10
15
20
25
30
35
40
CoAl
1600 1800 2000 2200 24000
1
2
3
4
Co
Yiel
d (C
nts/
nC)
Energy (eV)
Al
after oxygen treatment after hydrogenation at 350°C
Yiel
d (C
nts/
nC)
Energy (eV)
O
C
Figure 5.11 3 keV 4He+ HS-
LEIS spectrum of a wax-
extracted catalyst after
hydrogenation at 350 ºC to
remove reactive carbon only
(bottom) and after an oxygen
treatment to remove the
polymeric type of carbon
(top). Inset: A magnification
the Al and Co regions of
spectrum.
108
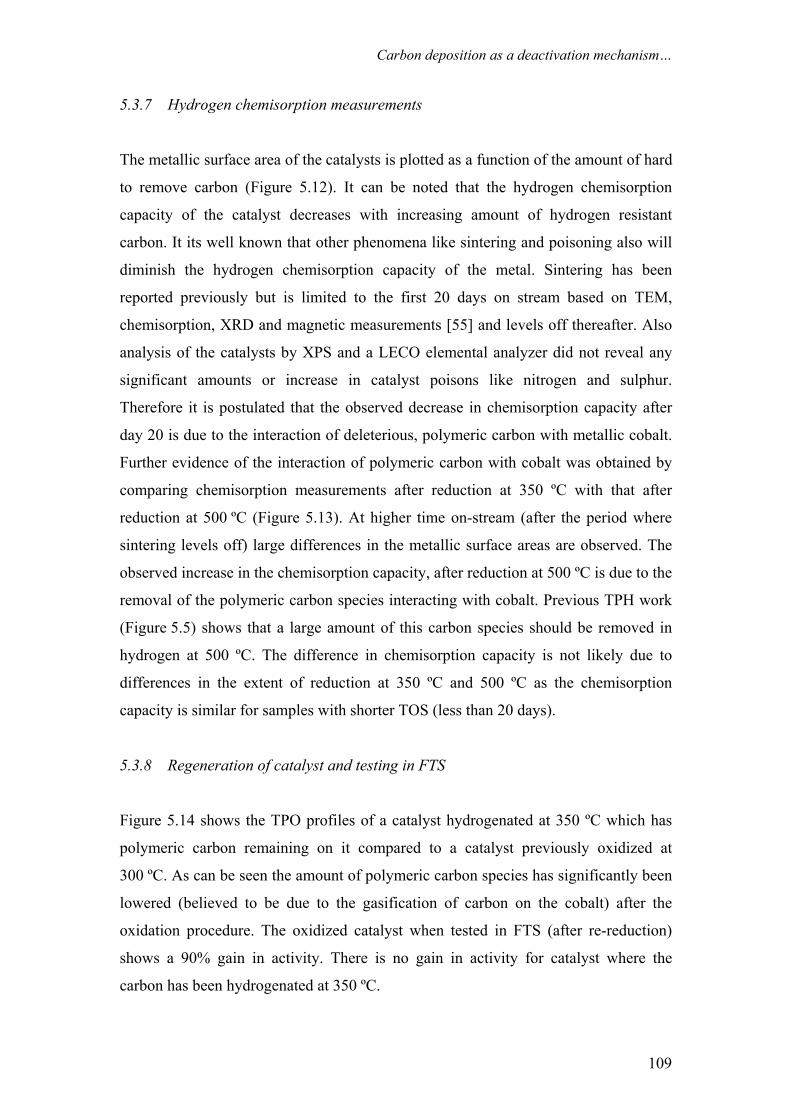
Carbon deposition as a deactivation mechanism…
5.3.7 Hydrogen chemisorption measurements
The metallic surface area of the catalysts is plotted as a function of the amount of hard
to remove carbon (Figure 5.12). It can be noted that the hydrogen chemisorption
capacity of the catalyst decreases with increasing amount of hydrogen resistant
carbon. It its well known that other phenomena like sintering and poisoning also will
diminish the hydrogen chemisorption capacity of the metal. Sintering has been
reported previously but is limited to the first 20 days on stream based on TEM,
chemisorption, XRD and magnetic measurements [55] and levels off thereafter. Also
analysis of the catalysts by XPS and a LECO elemental analyzer did not reveal any
significant amounts or increase in catalyst poisons like nitrogen and sulphur.
Therefore it is postulated that the observed decrease in chemisorption capacity after
day 20 is due to the interaction of deleterious, polymeric carbon with metallic cobalt.
Further evidence of the interaction of polymeric carbon with cobalt was obtained by
comparing chemisorption measurements after reduction at 350 ºC with that after
reduction at 500 ºC (Figure 5.13). At higher time on-stream (after the period where
sintering levels off) large differences in the metallic surface areas are observed. The
observed increase in the chemisorption capacity, after reduction at 500 ºC is due to the
removal of the polymeric carbon species interacting with cobalt. Previous TPH work
(Figure 5.5) shows that a large amount of this carbon species should be removed in
hydrogen at 500 ºC. The difference in chemisorption capacity is not likely due to
differences in the extent of reduction at 350 ºC and 500 ºC as the chemisorption
capacity is similar for samples with shorter TOS (less than 20 days).
5.3.8 Regeneration of catalyst and testing in FTS
Figure 5.14 shows the TPO profiles of a catalyst hydrogenated at 350 ºC which has
polymeric carbon remaining on it compared to a catalyst previously oxidized at
300 ºC. As can be seen the amount of polymeric carbon species has significantly been
lowered (believed to be due to the gasification of carbon on the cobalt) after the
oxidation procedure. The oxidized catalyst when tested in FTS (after re-reduction)
shows a 90% gain in activity. There is no gain in activity for catalyst where the
carbon has been hydrogenated at 350 ºC.
109
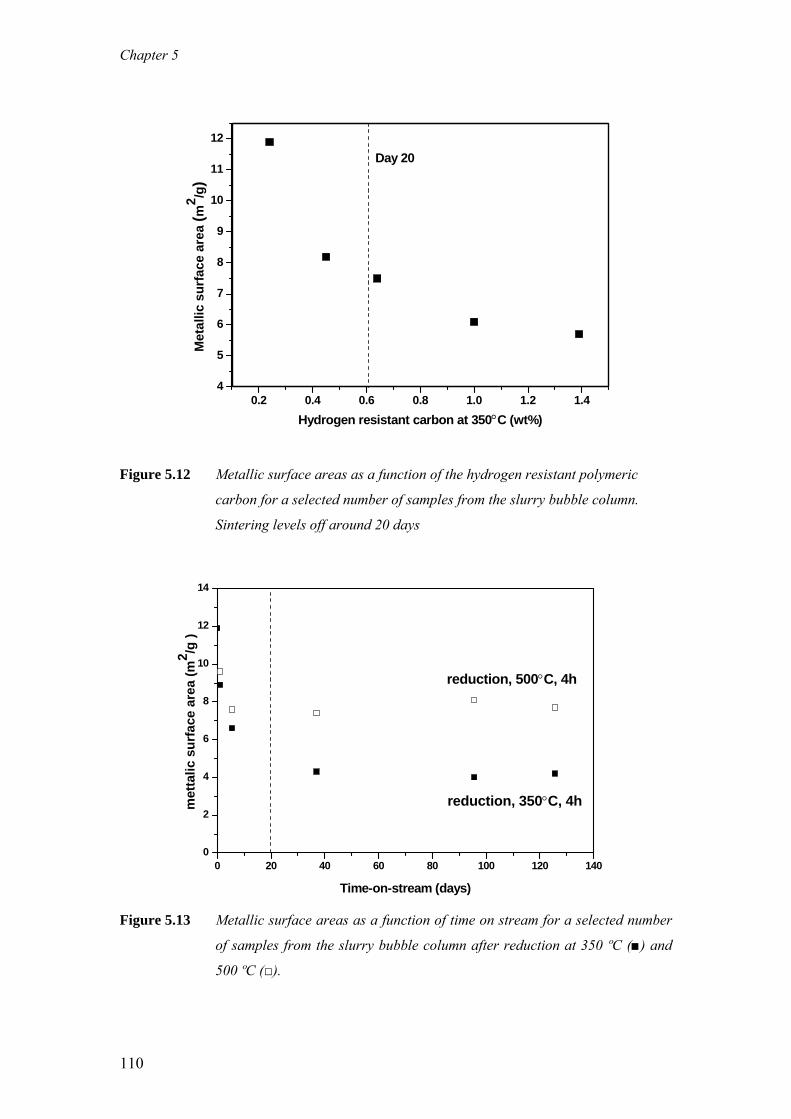
Chapter 5
0.2 0.4 0.6 0.8 1.0 1.2 1.44
5
6
7
8
9
10
11
12
Met
allic
sur
face
are
a (m
2 /g)
Hydrogen resistant carbon at 350°C (wt%)
Day 20
Figure 5.12 Metallic surface areas as a function of the hydrogen resistant polymeric
carbon for a selected number of samples from the slurry bubble column.
Sintering levels off around 20 days
0 20 40 60 80 100 120 1400
2
4
6
8
10
12
14
reduction, 350°C, 4hmet
talic
sur
face
are
a (m
2 /g )
Time-on-stream (days)
reduction, 500°C, 4h
Figure 5.13 Metallic surface areas as a function of time on stream for a selected number
of samples from the slurry bubble column after reduction at 350 ºC (■) and
500 ºC (□).
110
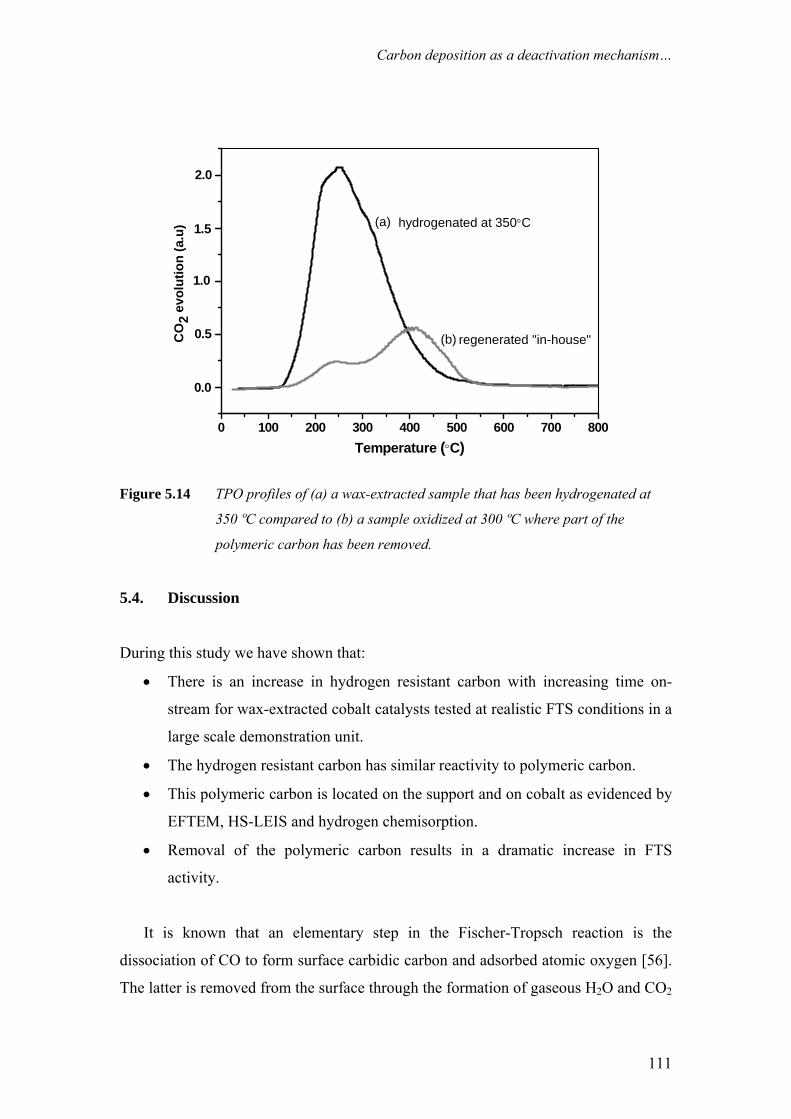
Carbon deposition as a deactivation mechanism…
0 100 200 300 400 500 600 700 800
0.0
0.5
1.0
1.5
CO
2 ev
olut
ion
(a.u
)
Temperature (°C)
(a)
(b)
hydrogenated at 350°C
regenerated "in-house"
2.0
Figure 5.14 TPO profiles of (a) a wax-extracted sample that has been hydrogenated at
350 ºC compared to (b) a sample oxidized at 300 ºC where part of the
polymeric carbon has been removed.
5.4. Discussion
During this study we have shown that:
• There is an increase in hydrogen resistant carbon with increasing time on-
stream for wax-extracted cobalt catalysts tested at realistic FTS conditions in a
large scale demonstration unit.
• The hydrogen resistant carbon has similar reactivity to polymeric carbon.
• This polymeric carbon is located on the support and on cobalt as evidenced by
EFTEM, HS-LEIS and hydrogen chemisorption.
• Removal of the polymeric carbon results in a dramatic increase in FTS
activity.
It is known that an elementary step in the Fischer-Tropsch reaction is the
dissociation of CO to form surface carbidic carbon and adsorbed atomic oxygen [56].
The latter is removed from the surface through the formation of gaseous H2O and CO2
111
Chapter 5
(mostly in the case of Fe catalysts). The surface carbon, if it remains in its carbidic
form on the surface of the metal is a starting block in the FT synthesis and can be
readily hydrogenated to form hydrocarbons. However this surface carbidic carbon
may also be converted to other less reactive forms, i.e. polymeric or graphitic carbon,
which may build up over time and possibly have a negative influence on catalyst
activity [57]. The term polymeric carbon in the case of CO dissociation and
disproportionation generally refers to chains of carbon monomers connected by
covalent bonds. In the case of FTS on ruthenium catalysts polymeric carbon has been
identified as a less reactive carbon that forms from polymerization of CHx and has an
alkyl group structure [58].
The three carbon peaks observed in this study during TPH experiments on spent
cobalt catalyst samples were assigned to surface carbide, wax, and polymeric carbon
(Table 5.2), which is in agreement with most of the literature on this topic.
Table 5.2 Assignment of the carbon species observed in this study with a comparison to
literature.
Peak THyd (ºC) Carbon species This study (Section) Ref
1
250
Surface carbidic species
Residual wax/hydrocarbons
Blank (5.3.2)
20
15
2 330 Residual wax (probably
contained in small pores)
15
3 445 Polymeric carbon on cobalt
Polymeric carbon on support
Reference samples (5.3.3)
H2 chemisorption (5.3.7)
EFTEM (5.3.5)
HS-LEIS (5.3.6)
20
In this study we also showed the very gradual build up of a hydrogen resistant
(at 350 ºC) polymeric type of carbon species with time on stream. The amount of this
polymeric carbon present after the hydrogenation step at 350 ºC exceeds the
monolayer coverage of the exposed metal surface. If we take into account the
112
Carbon deposition as a deactivation mechanism…
sintering that occurs and use a 10% dispersion and a 2M coverage (maximum
coverage of carbon on cobalt surface), then 2 wt% carbon on the catalyst is 2.5 times
the amount which can be deposited maximum. It is thus unlikely that the hard to
remove carbon is located exclusively on the metal as this will result in total
deactivation of the catalyst by blocking, which is not observed. The EFTEM and HS-
LEIS results show that carbon is located both on alumina and on cobalt. We believe
that the carbon is most likely nucleated on cobalt sites and then migrates to the
support. It has been reported previously that spill over of carbon may readily occur on
alumina-supported cobalt catalysts [59].
The hydrogen chemisorption data even when considering other effects like
poisoning and sintering also suggests that this polymeric carbon affects the available
metallic surface area of the cobalt and hence the activity. It is believed that the
accumulation of polymeric carbon on the cobalt surface will play a part in the
deactivation of the catalyst. The link between the polymeric carbon and activity was
then checked by monitoring the behaviour of the catalyst after removal of this carbon.
A catalyst that has been regenerated to remove a large part of the polymeric carbon
species exhibits a marked improvement in activity and an increase in metallic surface
area. This fact along with other supporting characterization data provides strong
evidence that polymeric carbon interacting with the metal plays a part in the catalyst
deactivation.
5.5 Conclusions
A wax-extraction procedure was developed to study Co/Pt/Al2O3 FTS catalysts,
covered in a wax layer, taken from a 100 bbl/day slurry bubble column reactor
operated at commercially relevant FTS conditions. The wax was extracted down to
low levels enabling characterization of the catalyst by both surface (XPS) and bulk
techniques (TEM and TP). The carbon deposits on the wax extracted catalysts were
studied using TP techniques and it was found that there is a slow accumulation of a
polymeric type of carbon species on the catalyst during the extended FTS run. This
carbon is resistant to hydrogen treatments at temperatures well above that used in
realistic FTS. HS-LEIS and EFTEM analysis of samples containing this resistant
polymeric carbon showed that it is dispersed largely over the support as well as on the
113
Chapter 5
cobalt phase. A large part of the activity of the catalyst can be recovered by removal
these polymeric carbon deposits and it is thus postulated that these play a role in
deactivation of cobalt-based FTS catalysts in extended runs.
Acknowledgments
We would like to thank Sanne Wijnans for her work in developing the wax-extraction
procedure and the initial XPS fitting models. Prof. H.H. Brongersma and Niel
Kuijpers (Calipso BV) and Dr. T. Grehl (IONTOF GmbH) are acknowledged for the
HS-LEIS analysis. Sasol Technology’s Materials Characterization group is thanked
for the chemisorption measurements.
5.6 References [1] A.P. Steynberg, M.E. Dry (Eds.), Fischer-Tropsch Technology, Studies in Surface Science
and Catalysis, Vol. 152, Elsevier, 2004. [2] E. Iglesia, Appl. Catal. A 161 (1997) 59. [3] M.E. Dry, Catal. Today 71 (2002) 227. [4] J. van de Loosdrecht, B. Balzhinimaev, J.-A. Dalmon, J.W. Niemantsverdriet, S.V. Tsybulya,
A.M. Saib, P.J. van Berge, J.L. Visagie, Catal. Today 123 (2007) 293. [5] Fischer Tropsch Catalyst Test on Coal-Derived Synthesis Gas, Syntroleum Corporation,
November 2007 accessed on http://www.syntroleum.com. [6] P.J. van Berge, J. van de Loosdrecht, S. Barradas, A.M. van der Kraan, Catal. Today 58
(2000) 321. [7] G. Jacobs, T.K. Das, P.M. Patterson, J. Li, L. Sanchez, B.H. Davis, Appl. Catal. A 247 (2003)
335. [8] G. Kiss, C.E. Kliewer, G.J. DeMartin, C.C. Culross, J.E. Baumgartner, J. Catal. 217 (2003)
127. [9] A.M. Hilmen, D. Schanke, K.F. Hanssen, A. Holmen, Appl. Catal. A 186 (1999) 169. [10] J. Li, X. Zhan, Y. Zhang, G. Jacobs, T. Das, B.H. Davis, Appl. Catal. A 228 (2002) 203. [11] A.M. Saib, A. Borgna, J. van de Loosdrecht, P.J. van Berge, J.W. Niemantsverdriet, Appl.
Catal. A 312 (2006) 12. [12] A.M. Saib “Towards a cobalt FTS catalyst with enhanced stability: a combined approach” Phd
Thesis, Eindhoven University of Technology, 2006. [13] P.G. Menon, J. Mol. Catal. 59 (1990) 207. [14] A.A. Adesina, R.R. Hudgins, P.L. Silveston, Catal. Today 25 (1995) 127. [15] V. Gruver, R. Young, J. Engman, H.J. Robota, Prepr. Pap.-Am. Chem. Soc., Div. Pet. Chem.
50 (2005) 164. [16] J.J.H.M. Font Freide, T.D. Gamlin, R.J. Hensman, B. Nay, C. Sharp, J. Nat. Gas Chem. 13
(2004) 1. [17] S.L. Soled, E. Iglesia, R. Fiato, G.B. Ansell, United States Patent 5 397 806 (1995), to Exxon. [18] M.J. van der Burgt, J. Ansorge, Great Britain Patent 2 222 531 (1988), to Shell. [19] H.A. Wright, United States Patent 6 486 220 B1 (2002), to Conoco. [20] D.-K. Lee, J.-H. Lee, S.-K. Ihm, Appl. Catal. 36 (1988) 199. [21] H.W. Pennline, R.J. Gormley, R.R. Schehl, Ind. Eng. Chem. Prod. Res. Dev. 23 (1984) 388. [22] P.K. Agrawal, J.R. Katzer, W.H. Manogue, J. Catal. 69 (1981) 312. [23] M.K. Niemela, A.O.I. Krause. Catal. Lett. 42 (1996) 161. [24] H.W. Pennline, S.S. Pollack, Ind. Eng. Chem. Prod. Res. Dev. 25 (1986) 11. [25] C.H. Bartholomew, Appl. Catal. A 212 (2001) 17 [26] M.C. Zonneville, J.J.C. Geerlings, R.A. van Santen, Surf. Sci. 240 (1990) 253.
114
Carbon deposition as a deactivation mechanism…
[27] I.M. Ciobica, R.A. van Santen, P.J. van Berge, J. van de Loosdrecht, Surf. Sci. 602 (2008) 17. [28] L.J.E. Hofer, W.C. Peebles, J. Am. Chem. Soc. 69 (1947) 893. [29] S. Weller, L.J.E. Hofer, R.B. Anderson, J. Am. Chem. Soc. 70 (1948) 799. [30] J. Xiong, Y. Ding, T. Wang, L. Yan, W. Chen, H. Zhu, Y Lu, Catal. Lett. 102 (2005) 265. [31] V. Gruver, X. Zhan, J. Engman, H.J. Robota, Prepr. Pap.-Am. Chem. Soc., Div. Pet. Chem. 49
(2004) 192. [32] O. Ducreux, J. Lynch, B. Rebours, M. Roy, P. Chaumette, Stud. Surf. Sci. Catal. 119 (1998)
1258. [33] G. Jacobs, P.M. Patterson, Y. Zhang, T. Das, J. Li, B.H. Davis, Appl. Catal. A 233 (2002)
215. [34] P.J. van Berge, J. van de Loosdrecht, J.L. Visagie, United States Patent 6 806 226 (2004), to
Sasol. [35] P.J. van Berge, J. van de Loosdrecht, E. Caricato, S. Barradas, B.H. Sigwebela, United States
Patent 6 455 462 (2002), to Sasol. [36] P.J. van Berge, J. van de Loosdrecht, E. Caricato, S. Barradas, United States Patent 6 638 889
(2004), to Sasol. [37] R.L. Espinoza, J.L. Visagie, P.J. van Berge, F.H. Bolder, United States Patent 5 733 839
(1998), to Sasol. [38] P.J. van Berge, J. van de Loosdrecht, J.L. Visagie, T.J. van der Walt, H. Veltman, C. Sollie,
European Patent 1 444 040 B1 (2003), to Sasol. [39] H.H. Brongersma, M. Daxler, M. de Ridder, P. Bauer, Surf. Sci. Rep. 62 (2007) 63. [40] J.M.A. Harmsen, W.P.A. Jansen, J.H.B.J. Hoebink, J.C. Schouten, H.H. Brongersma, Catal.
Lett. 74 (2001) 133. [41] J.W. Niemantsverdriet, Spectroscopy in Catalysis, 3rd ed., Wiley-VCH, Weinheim, 2007. [42] G. Fierro, M.L. Jacono, M. Inversi, P. Porta. Top. Catal. 10 (2000) 39. [43] Z. Zsoldos, L. Guczi. J. Phys. Chem. 96 (1992) 9393. [44] B. Ernst, L. Hilaire, A. Kiennemann. Catal. Today 50 (1999) 413. [45] A.M. Saib, A. Borgna, J. van de Loosdrecht, P. van Berge, J.W. Niemantsverdriet, J. Phys.
Chem. B. 110 (2006) 8657. [49] G.V. Pankina, P.A. Chernavsjii, A.S. Lermontov, V.V. Lunin, Petrol. Chem. 42 (2002) 217. [50] F. Tihay, G. Pourroy, M. Richard-Plouet, A.C. Roger, A. Kiennemann, Appl. Catal. A 206
(2001) 29. [51] J. Xu, C.H. Bartholomew, J. Phys. Chem. B 109 (2005) 2392. [52] A. Barbier, A. Tuel, I. Arcon, A. Kodre, G.A. Martin, J. Catal. 200 (2001) 106. [53] J. Goralski, J. Grams, T. Paryjczak, I. Rzeźnicka, Carbon 40 (2002) 2025. [54] D.J. Moodley, C. van Schalkwyk, A. Spamer, J.M. Botha, A.K. Datye, Appl. Catal. A 318
(2007) 155. [55] M.J. Overett, B. Breedt, E. du Plessis, W. Erasmus, J. van de Loosdrecht, Prepr. Pap.-Am.
Chem. Soc., Div. Pet. Chem. 53 (2008) 126. [56] B.H. Davis, Fuel Proc. Tech. 71 (2001) 157. [57] D.W. Goodman, R.D. Kelley, T.E. Madey, J.T. Yates Jr., J. Catal. 63 (1980) 226. [58] P. Winslow, A.T. Bell, J. Catal. 91 (1985) 142. [59] G. Boskovic, K.J. Smith, Catal. Today 37 (1997) 25.
115

Chapter 5
116
Chapter 6 Factors that influence carbon formation on
Co/Al2O3 catalysts Cobalt-based Fischer-Tropsch synthesis (FTS) catalysts are the preferred systems for
use in gas-to-liquids processes. However, the activity of these catalysts typically
declines with time-on-stream due to catalyst deactivation. In Chapter 5, carbon
deposition has been put forward as a plausible deactivation mechanism for cobalt
catalysts under realistic conditions. Understanding the factors that contribute toward
carbon deposition will be an important step in trying to extend the lifespan of cobalt-
based FTS catalysts. In this study, we report on the impact of temperature and H2/CO
ratio on the build-up of carbonaceous species on Co/Pt/Al2O3 catalysts using both
model (1 bar) and realistic (20 bar) FTS tests. The influence of upset conditions on
carbon deposition and its subsequent effect on catalyst structure was also
investigated. Temperature programmed hydrogenation and oxidation (TPH/O), X-ray
diffraction (XRD), X-ray photoelectron spectroscopy (XPS) and transmission electron
microscopy (TEM) were used to characterise the carbonaceous phases. It was found
that both temperature and gas composition play important roles in determining the
amount and reactivity of carbon deposits on Co/Pt/Al2O3 catalysts. Upset conditions,
even if they occur over short periods result in the production of carbon phases that
can be detrimental to catalyst activity.
Chapter 6
6.1 Introduction Fischer–Tropsch synthesis (FTS) is a promising way to convert coal, biomass and
natural gas to clean fuels and chemicals via syngas. Cobalt-based catalysts attract
most of the current attention for the conversion of natural gas-derived syngas in FTS
because of their high activity, high selectivity for long chain paraffins, and low water
gas shift activity [1]. As cobalt is a relatively expensive metal, high stabilised
lifetimes are required for commercial application [2].
One of the factors that may impact on the activity of cobalt catalysts is the
accumulation of carbon deposits. Although cobalt-based FTS is in general viewed as a
carbon-insensitive reaction [3], a few research groups have shown that deleterious
carbon can form on cobalt catalysts [4-8]. Font Freide et al. [4] mentioned that the
extremely low levels of carbonaceous species deposit on the cobalt active sites, which
led to the deactivation of Co/ZnO catalysts during extended runs. Deactivation of a
Co/Al2O3 catalyst due to geometric blocking by polymeric or graphitic carbon was
also reported by Gruver et al. [5]. Furthermore, upset conditions during FTS may
result in temperature excursions or unfavourable gas compositions that result in
accelerated deposition of unwanted carbonaceous species, which may affect catalyst
structure and activity [9, 10].
Reaction temperature and H2/CO ratio are believed to be important parameters
that will influence carbon deposition on FT catalysts. The formation temperature
plays an important role in determining the amount and type of carbon deposit.
Generally, at higher temperatures the amount of carbon will increase as the rate of CO
dissociation will be higher [11]. However, as shown for a Ru/Al2O3 catalyst, carbon
deposition varies as a function of partial pressures of CO and H2 in the gas phase [12].
It was stated that the higher conversion at higher temperatures results in a
corresponding decrease in PCO and PH2, and may therefore lead to smaller amounts of
carbon on the catalyst [12]. Thus the rate of carbon formation and its subsequent
hydrogenation can lead to a complex relationship between the amount of carbon and
the reaction temperature. At high reaction temperatures shorter hydrocarbon chains
will be formed and rapidly desorbed [13]. However, higher temperatures will also aid
118
Factors that influence carbon formation on Co/Al2O3 catalysts
in the transformation of surface carbon species into more stable species that will have
decreased reactivity towards H2 [12, 14].
Lahtinen et al. [15, 16] investigated the effect of varying reaction temperature
on polycrystalline cobalt foil at 1 bar and H2/CO ratio of 1.24. The cobalt surface was
then characterized by Auger electron spectroscopy (AES) after the reaction without
any further sample treatment. They found that the carbon/cobalt ratio was almost
constant as temperature was increased to 252 ºC. No significant deactivation for CO
hydrogenation was observed on the foils at these conditions. Deactivation of the
cobalt surface by graphitic carbon was observed at 276 °C. At 297 ºC the
carbon/cobalt ratio was significantly higher. From the peak shape of the carbon KLL
Auger lines it was deduced that carbon formed at 297 ºC was graphitic.
The literature on the effect of H2/CO ratios on carbon deposition on cobalt-
based FTS catalysts is scarce. A few studies have been conducted on Ni/Al2O3 [17,
18] and Fe/Al2O3 [19, 20]. The general view is that small amounts of H2 enhance
carbon deposition from CO. Bianchi and Bennet [19] reported that the rate of carbon
deposition (compared to deposition with pure CO) was enhanced on Fe/Al2O3 at
H2/CO = 0.1. This was attributed to the hydrogen-assisted dissociation of CO.
Presumably, small amounts of hydrogen remove oxygen from the surface creating
sites for further CO dissociation. The low hydrogen amount is insufficient to
hydrogenate off the carbon formed on the surface. Excess hydrogen, on the other hand
acts to keep the metal surface free from carbonaceous species by reacting them away
to form methane or hydrocarbons. Investigations on Ni/Al2O3 showed that the rate of
carbon deposition is lower at higher H2/CO ratios [17, 18]. Ideally, to prevent
deactivation by carbon there should be higher rate of hydrogenation of the surface
carbon than of its conversion to polymeric carbon and other stable carbon species.
A few studies have been conducted recently on the influence of H2/CO ratio
on activity and product selectivity of cobalt FTS catalysts but these do not report on
the impact on carbon deposition. Tristantini et al. [21] showed with a Co/Al2O3
catalyst that CO conversion increases with increasing H2/CO ratio in the feed. Low
ratios resulted in a slight increase in the water gas shift activity (more CO2) and
increase in C5+ selectivity. Calleja et al. [22] and Schulz [11] also showed that lower
119
Chapter 6
H2/CO ratios favoured longer chain products. It was also claimed that higher H2/CO
ratios caused catalyst deactivation through the formation of silicates on Co/SiO2
catalysts [23].
In this study we report on the impact of temperature and H2/CO on the build-
up of carbonaceous species on Co/Al2O3 using both model (1 bar) and realistic (20
bar) FTS tests. We also focus some attention on the influence of upset conditions on
carbon deposition and its subsequent effect on catalyst structure. Temperature
programmed hydrogenation and oxidation (TPH/O), X-ray diffraction (XRD), X-ray
photoelectron spectroscopy (XPS) and transmission electron microscopy (TEM) were
used to characterise the carbonaceous phases.
6.2 Experimental 6.2.1 Catalyst preparation A 20 wt% Co/Al2O3 catalyst, promoted with 0.05 wt% platinum, was prepared by
slurry impregnation of a γ-alumina support (Puralox 5/150 from Sasol Germany) with
an aqueous cobalt nitrate solution, also containing the platinum promoter. After
impregnation and drying, the catalyst intermediate was calcined at 250 oC in air and
reduced in pure hydrogen at 425 oC. To achieve the required cobalt loading, two
impregnation and calcination steps were applied [24-28]. A 15 wt% Co/Al2O3
catalyst, promoted with 0.04 wt% platinum was also prepared in a similar way with a
single impregnation step of Pural SB alumina (Sasol Germany), which was calcined at
700 ºC for 4h.
6.2.2 Model FTS experiments with varying temperature and H2/CO ratio
To investigate the effect of temperature in the FTS range, in-situ reduction/FTS/TPH
experiments were performed in a TP-MS unit at atmospheric pressure. A 100 mg
sample of 20 wt% Co/Pt/Al2O3 was reduced by ramping under pure H2 (10ml/min) to
450 °C at a rate of 5 °C/min and held at this temperature for 1h. The reduction seems
to be complete at this stage as the evolution of water is complete as observed in a
typical water profile for the TPR. Peaks are observed at 225 ºC corresponding to the
reduction of Co3O4 to CoO and 370 ºC corresponding to the reduction of CoO to
metallic cobalt [29]. Thereafter the reactor was cooled under H2 to the desired
120
Factors that influence carbon formation on Co/Al2O3 catalysts
reaction temperature (200-260 °C) and FTS was performed using a flow of CO (~5
ml/min) and H2 (~ 4 ml/min) in helium (6 ml/min) at a H2/CO ratio of 0.75. The
conversion level in this set of experiments was not kept constant, since the flow rate
of the synthesis gas mixture was kept constant. The reactor was then cooled in helium
to RT and then a TPH was performed by heating to 800 °C (10 °C/min) using a 50%
H2/He flow (20 ml/min).
For experiments with varying H2/CO ratios the same amount of catalyst was
reduced as above. The catalyst is then cooled to 230 ºC in H2, before switching to the
desired H2/CO ratio for a period of 3h. The flow of CO (5 ml/min, PCO = 0.33 bar) as
well as the total flow (15 ml/min, SV = 9000 ml/gcat/h) is kept constant by addition of
He, while the flow of hydrogen is varied between 2.5-10 ml/min (PH2 = 0.17-0.66
bar). This was done to ensure that effects seen are not due to the variation in the
amount of CO exposed or residence time. During this time water, methane and other
hydrocarbons are evolved as the expected products of the FTS. The reactor was then
cooled in helium to RT and then a TPH was performed as described above.
6.2.3 FTS runs in a CSTR at varying temperature
Fischer–Tropsch synthesis tests were performed in a slurry-phase CSTR with a
reactor volume of 670 ml. The catalyst samples (i.e. 10–30 g) were pre-reduced at 380
to 425 °C for 16 h, in pure hydrogen at 1 bar, at a heating rate of 1°C/min, and
suspended, under an argon blanket, in 300 ml molten Fischer–Tropsch hydrogenated
wax (Sasol H1 hard wax) inside the reactor. The FTS conditions employed were 240-
270 ºC, 20 bar, commercial synthesis gas as feed of composition: 50-60 vol% H2, 25-
35 vol% CO and 10 vol% inerts. The synthesis gas flows were regulated by Brooks
mass-flow controllers and was adjusted to keep the conversion levels the same.
Samples of the spent catalysts tested a various temperatures were taken from the
slurry-phase CSTR at the end of the reaction. The catalyst/wax mixture was allowed
to congeal under an inert nitrogen environment. The catalyst was then wax extracted
in an inert argon environment and then subjected to a TPH at 350 °C and held there
for 1h (as in Chapter 5). A TPO was then done to determine the remaining hydrogen-
resistant carbon.
121
Chapter 6
6.2.4 FTS run in a CSTR with interrupted H2 flow.
An FTS run was conducted as described above at 230 °C, 20 bar, commercial
synthesis gas as feed of composition: 50-60 vol% H2, 25-35 vol% CO and 10 vol%
inerts. After 40h the H2 flow was stopped for 2h. Thereafter the H2 flow was
reintroduced and the reaction was run for a total of 134 hours. After completion of the
reaction the catalyst/wax mixture was allowed to congeal under an inert nitrogen
environment. The catalyst was then analysed by XRD.
6.2.5 Boudouard reaction at various temperatures.
To simulate the effect of very high carbon coverages and upset conditions, about 1g
of a 15 wt% Co/Pt/Al2O3 catalyst was first reduced at 450 ºC and then exposed to CO
for 4 h at 250, 350 and 400 ºC in a flow reactor coupled to a mass spectrometer. The
catalyst was then cooled to room temperature and passivated in a dilute 0.1%O2/Ar
mixture. Thereafter TPH, XPS and TEM analysis was performed to characterize the
carbonaceous phases formed on the catalyst.
6.2.6 X-ray photoelectron spectroscopy measurements
The passivated catalyst samples were crushed finely with a pestle and mortar and the
powder was pressed into an indium layer on top of standard stainless steel XPS stubs.
The XPS measurements were carried out using a VG Escalab 200 MKII spectrometer.
An aluminum anode (Kα = 1486.6 eV) was used to generate the X-ray radiation (240
W (20 mA; 12kV)). Measurements were carried out with a 0.1 s dwell time and 0.1
eV step for the selected regions. To obtain sufficient signal-to-noise ratio the Co 2p
region was scanned 50 times. During the measurements the pressure in the main
chamber remained below 10-8 mbar.
6.2.7 X-ray diffraction measurements
The experiments were done using an Anton Paar HTK600 coupled to the Philips
X’Pert Pro multi-purpose diffractometer (XRD-1). The XRD patterns of the catalyst
coated in wax were obtained in a dry nitrogen atmosphere at 120 ºC. At this
122
Factors that influence carbon formation on Co/Al2O3 catalysts
temperature the crystalline wax on the catalyst is melted and its strong diffraction
features can be eliminated allowing detection of other crystalline phases. Use was
made of X-rays generated from a fine focus cobalt tube (wavelength 1.79 Å). The
peaks on the diffractograms were identified using the JCPDS database.
6.2.8 TEM measurements
Thin samples for TEM were prepared by crushing the passivated catalyst with a
mortar and pestle, followed by dispersion in ethanol using an ultrasound bath. Then
an appropriate amount of sample was placed onto a copper microscope grid covered
with carbon windows. Samples were studied using a Fei Tecnai 20F (type Sphera)
microscope with an acceleration voltage of 200 keV.
6.3 Results and Discussion 6.3.1 Effect of FTS temperature on carbon deposition (a) Model conditions The effect of temperature on the amount and type of carbon deposited on a 20 wt%
Co/Pt/Al2O3 catalyst was investigated under model conditions: a relatively low H2/CO
ratio of 0.75, 1 bar total pressure, to enhance the carbon deposition in the short
reaction time of 3 h. The temperature was varied between 200 and 260 °C in steps of
20 °C. After the model FTS reactions a TPH profile was measured. The impact of the
temperature on carbon can be seen in Figure 6.1. It is clear that reaction temperature
during these model FTS conditions has an influence on the amounts and nature of
carbon formed on the catalyst. The first noticeable feature in the TPH profile is the
decrease in the methane peak around 195 °C and increase in amount of methane
produced after 240 °C at higher temperatures. The carbon produced at higher reaction
temperatures becomes more difficult to hydrogenate as indicated by a shift in the
methane evolution to higher temperatures (See inset Figure 6.1). Increasing
temperature results in the transformation of reactive species to less reactive species.
The inset shows the evolution of various carbon species at the higher FTS
temperatures. Polymeric carbon, which according to literature is hydrogenated at
430 ± 10 °C [30, 31] seems to form during FTS at 240 °C and to a greater extent at
260 °C.
123
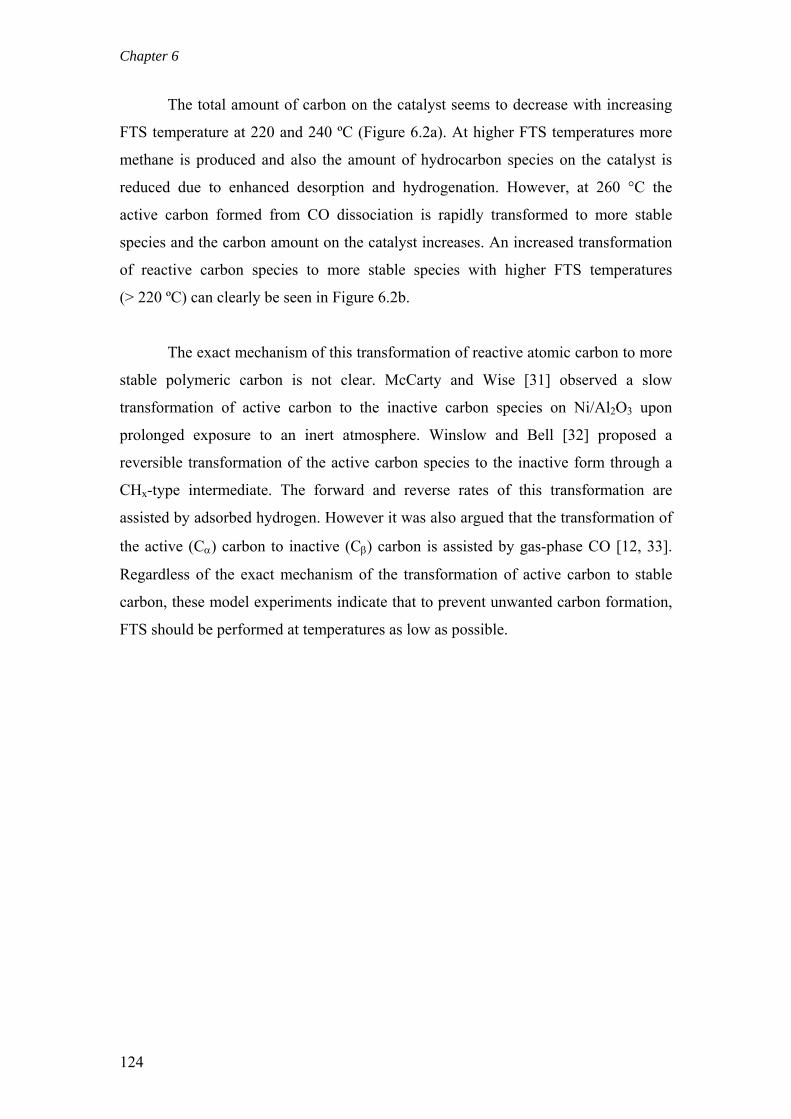
Chapter 6
The total amount of carbon on the catalyst seems to decrease with increasing
FTS temperature at 220 and 240 ºC (Figure 6.2a). At higher FTS temperatures more
methane is produced and also the amount of hydrocarbon species on the catalyst is
reduced due to enhanced desorption and hydrogenation. However, at 260 °C the
active carbon formed from CO dissociation is rapidly transformed to more stable
species and the carbon amount on the catalyst increases. An increased transformation
of reactive carbon species to more stable species with higher FTS temperatures
(> 220 ºC) can clearly be seen in Figure 6.2b.
The exact mechanism of this transformation of reactive atomic carbon to more
stable polymeric carbon is not clear. McCarty and Wise [31] observed a slow
transformation of active carbon to the inactive carbon species on Ni/Al2O3 upon
prolonged exposure to an inert atmosphere. Winslow and Bell [32] proposed a
reversible transformation of the active carbon species to the inactive form through a
CHx-type intermediate. The forward and reverse rates of this transformation are
assisted by adsorbed hydrogen. However it was also argued that the transformation of
the active (Cα) carbon to inactive (Cβ) carbon is assisted by gas-phase CO [12, 33].
Regardless of the exact mechanism of the transformation of active carbon to stable
carbon, these model experiments indicate that to prevent unwanted carbon formation,
FTS should be performed at temperatures as low as possible.
124
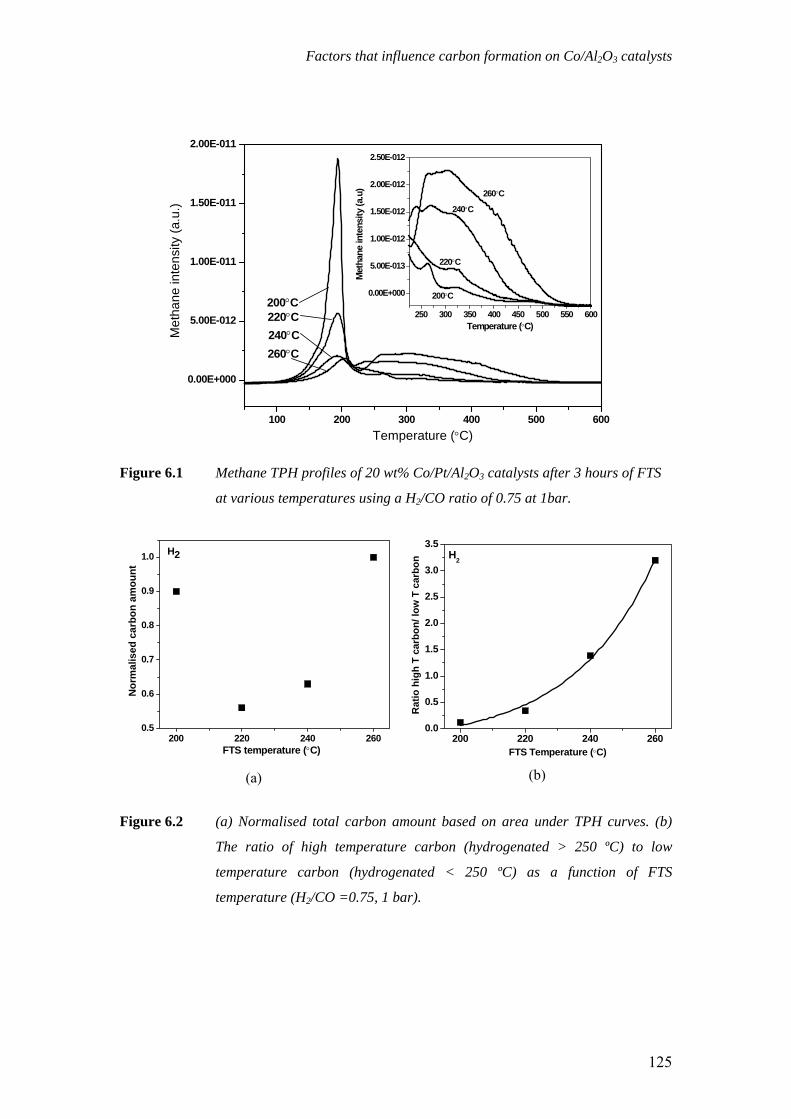
Factors that influence carbon formation on Co/Al2O3 catalysts
100 200 300 400 500 600
0.00E+000
5.00E-012
1.00E-011
1.50E-011
2.00E-011
250 300 350 400 450 500 550 600
0.00E+000
5.00E-013
1.00E-012
1.50E-012
2.00E-012
2.50E-012
200°C
220°C
240°C
Met
hane
inte
nsity
(a.u
)
Temperature (°C)
260°C
200°C220°C
260°C
Met
hane
inte
nsity
(a.u
.)
Temperature (°C)
240°C
Figure 6.1 Methane TPH profiles of 20 wt% Co/Pt/Al2O3 catalysts after 3 hours of FTS
at various temperatures using a H2/CO ratio of 0.75 at 1bar.
200 220 240 2600.5
0.6
0.7
0.8
0.9
1.0
FTS temperature (°C)
Nor
mal
ised
car
bon
amou
nt
H2
(a)
200 220 240 2600.0
0.5
1.0
1.5
2.0
2.5
3.0
3.5
Rat
io h
igh
T ca
rbon
/ low
T c
arbo
n
FTS Temperature (°C)
H2
(b)
Figure 6.2 (a) Normalised total carbon amount based on area under TPH curves. (b)
The ratio of high temperature carbon (hydrogenated > 250 ºC) to low
temperature carbon (hydrogenated < 250 ºC) as a function of FTS
temperature (H2/CO =0.75, 1 bar).
125
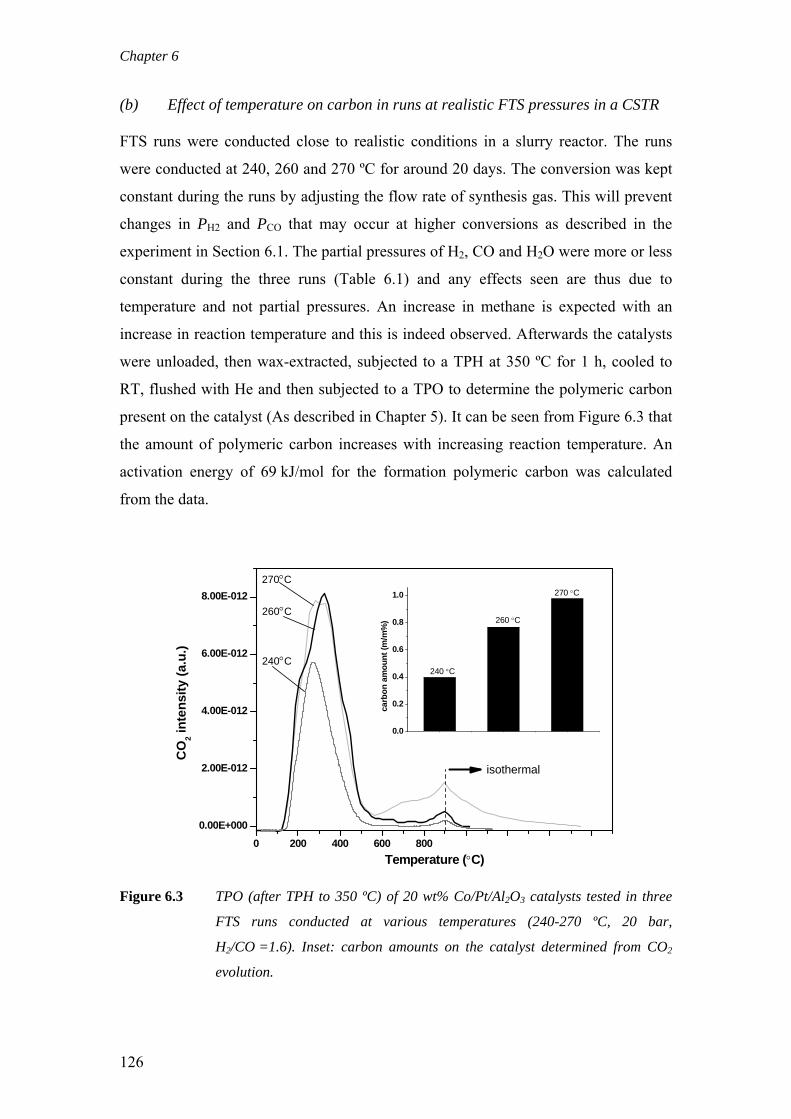
Chapter 6
(b) Effect of temperature on carbon in runs at realistic FTS pressures in a CSTR FTS runs were conducted close to realistic conditions in a slurry reactor. The runs
were conducted at 240, 260 and 270 ºC for around 20 days. The conversion was kept
constant during the runs by adjusting the flow rate of synthesis gas. This will prevent
changes in PH2 and PCO that may occur at higher conversions as described in the
experiment in Section 6.1. The partial pressures of H2, CO and H2O were more or less
constant during the three runs (Table 6.1) and any effects seen are thus due to
temperature and not partial pressures. An increase in methane is expected with an
increase in reaction temperature and this is indeed observed. Afterwards the catalysts
were unloaded, then wax-extracted, subjected to a TPH at 350 ºC for 1 h, cooled to
RT, flushed with He and then subjected to a TPO to determine the polymeric carbon
present on the catalyst (As described in Chapter 5). It can be seen from Figure 6.3 that
the amount of polymeric carbon increases with increasing reaction temperature. An
activation energy of 69 kJ/mol for the formation polymeric carbon was calculated
from the data.
0 200 400 600 800 1000 1200 1400 16000.00E+000
2.00E-012
4.00E-012
6.00E-012
8.00E-012
240°C
260°C
A B 2700.0
0.2
0.4
0.6
0.8
1.0 270 °C
260 °C
carb
on a
mou
nt (m
/m%
)
Run temperature
240 °C
CO
2 inte
nsity
(a.u
.)
Temperature (°C)
270°C
isothermal
Figure 6.3 TPO (after TPH to 350 ºC) of 20 wt% Co/Pt/Al2O3 catalysts tested in three
FTS runs conducted at various temperatures (240-270 ºC, 20 bar,
H2/CO =1.6). Inset: carbon amounts on the catalyst determined from CO2
evolution.
126
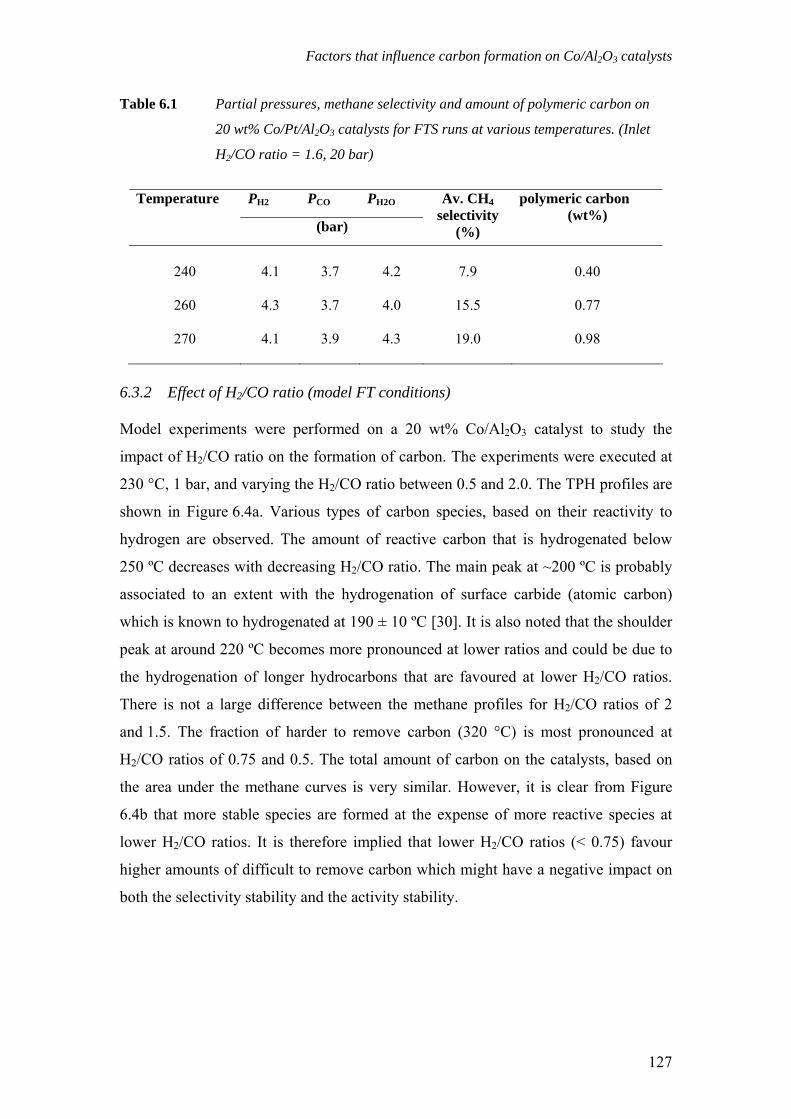
Factors that influence carbon formation on Co/Al2O3 catalysts
Table 6.1 Partial pressures, methane selectivity and amount of polymeric carbon on
20 wt% Co/Pt/Al2O3 catalysts for FTS runs at various temperatures. (Inlet
H2/CO ratio = 1.6, 20 bar)
PH2 PCO PH2OTemperature
(bar)
Av. CH4 selectivity
(%)
polymeric carbon (wt%)
240
4.1
3.7
4.2
7.9
0.40
260 4.3 3.7 4.0 15.5 0.77
270 4.1 3.9 4.3 19.0 0.98
6.3.2 Effect of H2/CO ratio (model FT conditions) Model experiments were performed on a 20 wt% Co/Al2O3 catalyst to study the
impact of H2/CO ratio on the formation of carbon. The experiments were executed at
230 °C, 1 bar, and varying the H2/CO ratio between 0.5 and 2.0. The TPH profiles are
shown in Figure 6.4a. Various types of carbon species, based on their reactivity to
hydrogen are observed. The amount of reactive carbon that is hydrogenated below
250 ºC decreases with decreasing H2/CO ratio. The main peak at ~200 ºC is probably
associated to an extent with the hydrogenation of surface carbide (atomic carbon)
which is known to hydrogenated at 190 ± 10 ºC [30]. It is also noted that the shoulder
peak at around 220 ºC becomes more pronounced at lower ratios and could be due to
the hydrogenation of longer hydrocarbons that are favoured at lower H2/CO ratios.
There is not a large difference between the methane profiles for H2/CO ratios of 2
and 1.5. The fraction of harder to remove carbon (320 °C) is most pronounced at
H2/CO ratios of 0.75 and 0.5. The total amount of carbon on the catalysts, based on
the area under the methane curves is very similar. However, it is clear from Figure
6.4b that more stable species are formed at the expense of more reactive species at
lower H2/CO ratios. It is therefore implied that lower H2/CO ratios (< 0.75) favour
higher amounts of difficult to remove carbon which might have a negative impact on
both the selectivity stability and the activity stability.
127
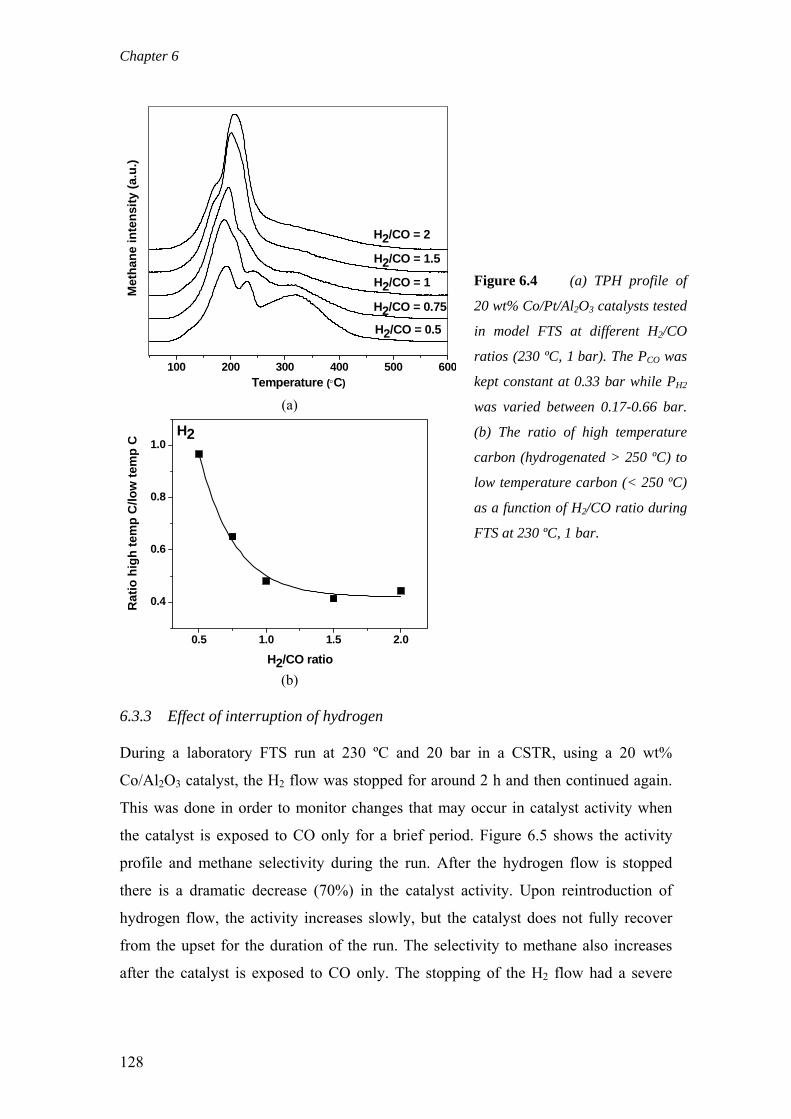
Chapter 6
100 200 300 400 500 600
H2/CO = 0.5
H2/CO = 0.75
H2/CO = 1
H2/CO = 1.5
Temperature (°C)
H2/CO = 2
Met
hane
inte
nsity
(a.u
.)
(a)
0.5 1.0 1.5 2.0
0.4
0.6
0.8
1.0
Rat
io h
igh
tem
p C
/low
tem
p C
H2/CO ratio
H2
(b)
Figure 6.4 (a) TPH profile of
20 wt% Co/Pt/Al2O3 catalysts tested
in model FTS at different H2/CO
ratios (230 ºC, 1 bar). The PCO was
kept constant at 0.33 bar while PH2
was varied between 0.17-0.66 bar.
(b) The ratio of high temperature
carbon (hydrogenated > 250 ºC) to
low temperature carbon (< 250 ºC)
as a function of H2/CO ratio during
FTS at 230 ºC, 1 bar.
6.3.3 Effect of interruption of hydrogen During a laboratory FTS run at 230 ºC and 20 bar in a CSTR, using a 20 wt%
Co/Al2O3 catalyst, the H2 flow was stopped for around 2 h and then continued again.
This was done in order to monitor changes that may occur in catalyst activity when
the catalyst is exposed to CO only for a brief period. Figure 6.5 shows the activity
profile and methane selectivity during the run. After the hydrogen flow is stopped
there is a dramatic decrease (70%) in the catalyst activity. Upon reintroduction of
hydrogen flow, the activity increases slowly, but the catalyst does not fully recover
from the upset for the duration of the run. The selectivity to methane also increases
after the catalyst is exposed to CO only. The stopping of the H2 flow had a severe
128
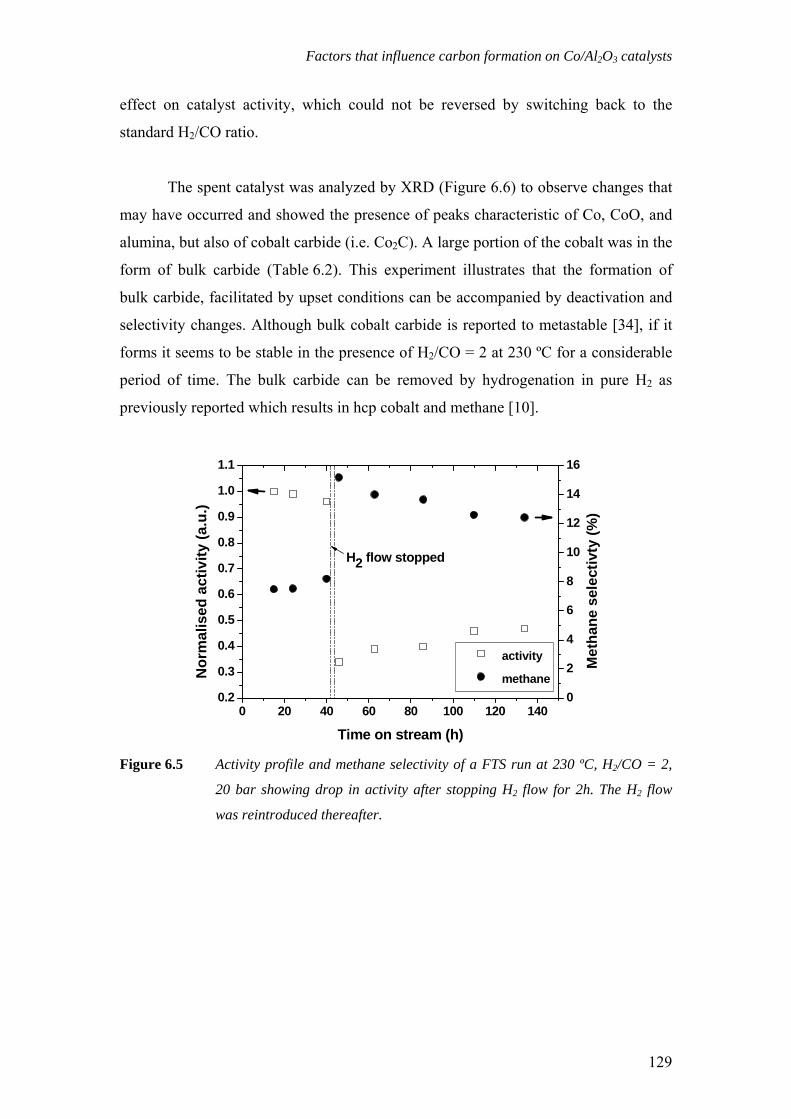
Factors that influence carbon formation on Co/Al2O3 catalysts
effect on catalyst activity, which could not be reversed by switching back to the
standard H2/CO ratio.
The spent catalyst was analyzed by XRD (Figure 6.6) to observe changes that
may have occurred and showed the presence of peaks characteristic of Co, CoO, and
alumina, but also of cobalt carbide (i.e. Co2C). A large portion of the cobalt was in the
form of bulk carbide (Table 6.2). This experiment illustrates that the formation of
bulk carbide, facilitated by upset conditions can be accompanied by deactivation and
selectivity changes. Although bulk cobalt carbide is reported to metastable [34], if it
forms it seems to be stable in the presence of H2/CO = 2 at 230 ºC for a considerable
period of time. The bulk carbide can be removed by hydrogenation in pure H2 as
previously reported which results in hcp cobalt and methane [10].
0 20 40 60 80 100 120 1400.2
0.3
0.4
0.5
0.6
0.7
0.8
0.9
1.0
1.1
activity
methane
Time on stream (h)
Nor
mal
ised
act
ivity
(a.u
.)
0
2
4
6
8
10
12
14
16
Met
hane
sel
ectiv
ty (%
)
H2 flow stopped
Figure 6.5 Activity profile and methane selectivity of a FTS run at 230 ºC, H2/CO = 2,
20 bar showing drop in activity after stopping H2 flow for 2h. The H2 flow
was reintroduced thereafter.
129
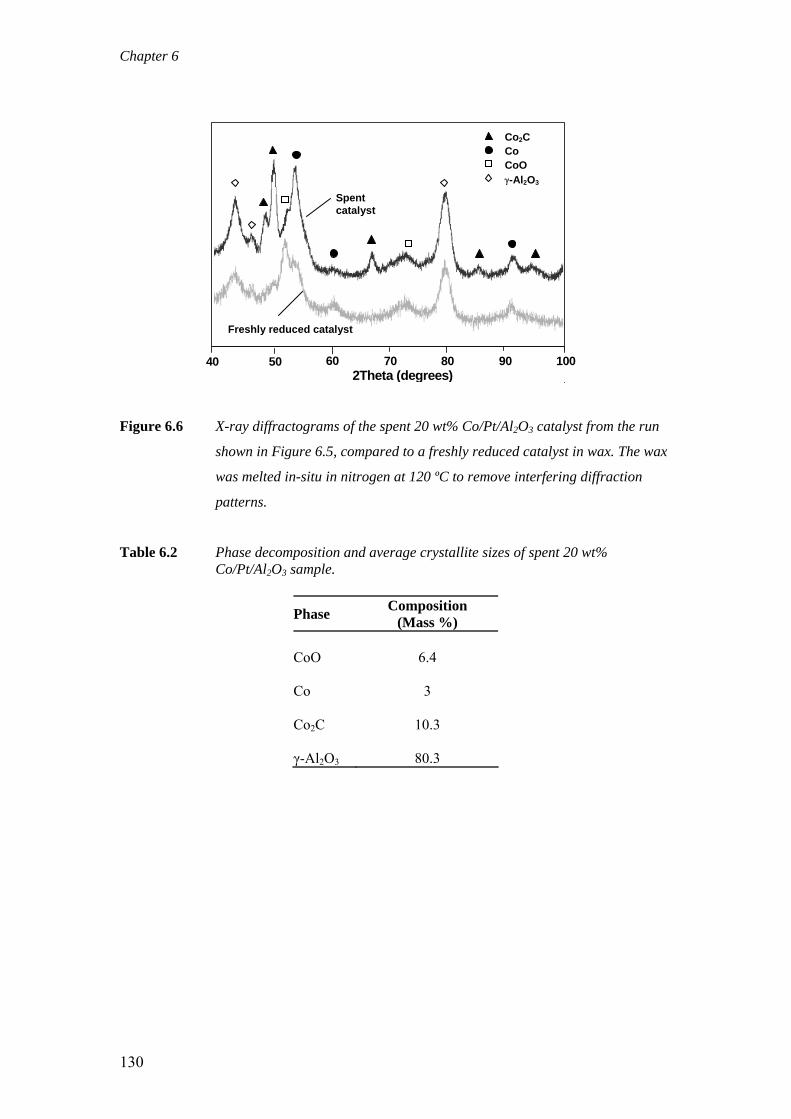
Chapter 6
Figure 6.6 X-ray diffractograms of the spent 20 wt% Co/Pt/Al2O3 catalyst from the run
shown in Figure 6.5, compared to a freshly reduced catalyst in wax. The wax
was melted in-situ in nitrogen at 120 ºC to remove interfering diffraction
patterns.
40 50 60 70 80 90 1002Theta (degrees)
Co2C Co CoO γ-Al2O3
Spent catalyst
Freshly reduced catalyst
Table 6.2 Phase decomposition and average crystallite sizes of spent 20 wt% Co/Pt/Al2O3 sample.
Phase Composition (Mass %)
CoO
6.4
Co
3
Co2C
10.3
γ-Al2O3
80.3
130
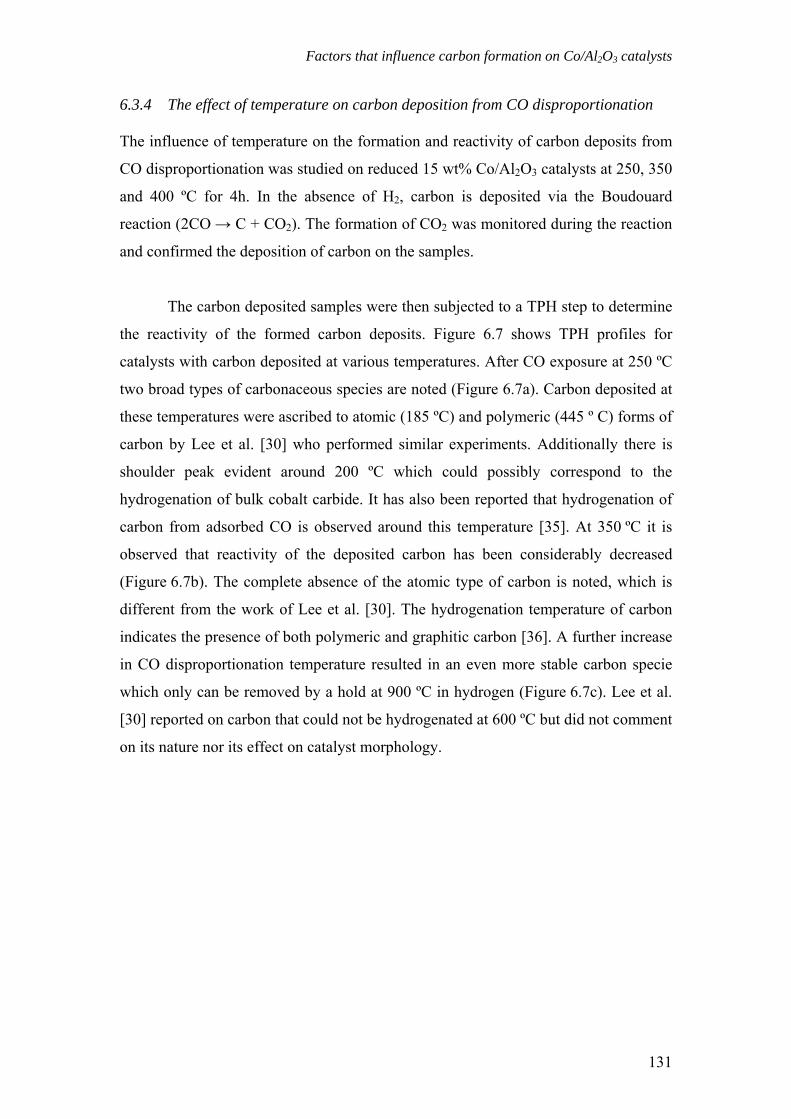
Factors that influence carbon formation on Co/Al2O3 catalysts
6.3.4 The effect of temperature on carbon deposition from CO disproportionation The influence of temperature on the formation and reactivity of carbon deposits from
CO disproportionation was studied on reduced 15 wt% Co/Al2O3 catalysts at 250, 350
and 400 ºC for 4h. In the absence of H2, carbon is deposited via the Boudouard
reaction (2CO → C + CO2). The formation of CO2 was monitored during the reaction
and confirmed the deposition of carbon on the samples.
The carbon deposited samples were then subjected to a TPH step to determine
the reactivity of the formed carbon deposits. Figure 6.7 shows TPH profiles for
catalysts with carbon deposited at various temperatures. After CO exposure at 250 ºC
two broad types of carbonaceous species are noted (Figure 6.7a). Carbon deposited at
these temperatures were ascribed to atomic (185 ºC) and polymeric (445 º C) forms of
carbon by Lee et al. [30] who performed similar experiments. Additionally there is
shoulder peak evident around 200 ºC which could possibly correspond to the
hydrogenation of bulk cobalt carbide. It has also been reported that hydrogenation of
carbon from adsorbed CO is observed around this temperature [35]. At 350 ºC it is
observed that reactivity of the deposited carbon has been considerably decreased
(Figure 6.7b). The complete absence of the atomic type of carbon is noted, which is
different from the work of Lee et al. [30]. The hydrogenation temperature of carbon
indicates the presence of both polymeric and graphitic carbon [36]. A further increase
in CO disproportionation temperature resulted in an even more stable carbon specie
which only can be removed by a hold at 900 ºC in hydrogen (Figure 6.7c). Lee et al.
[30] reported on carbon that could not be hydrogenated at 600 ºC but did not comment
on its nature nor its effect on catalyst morphology.
131
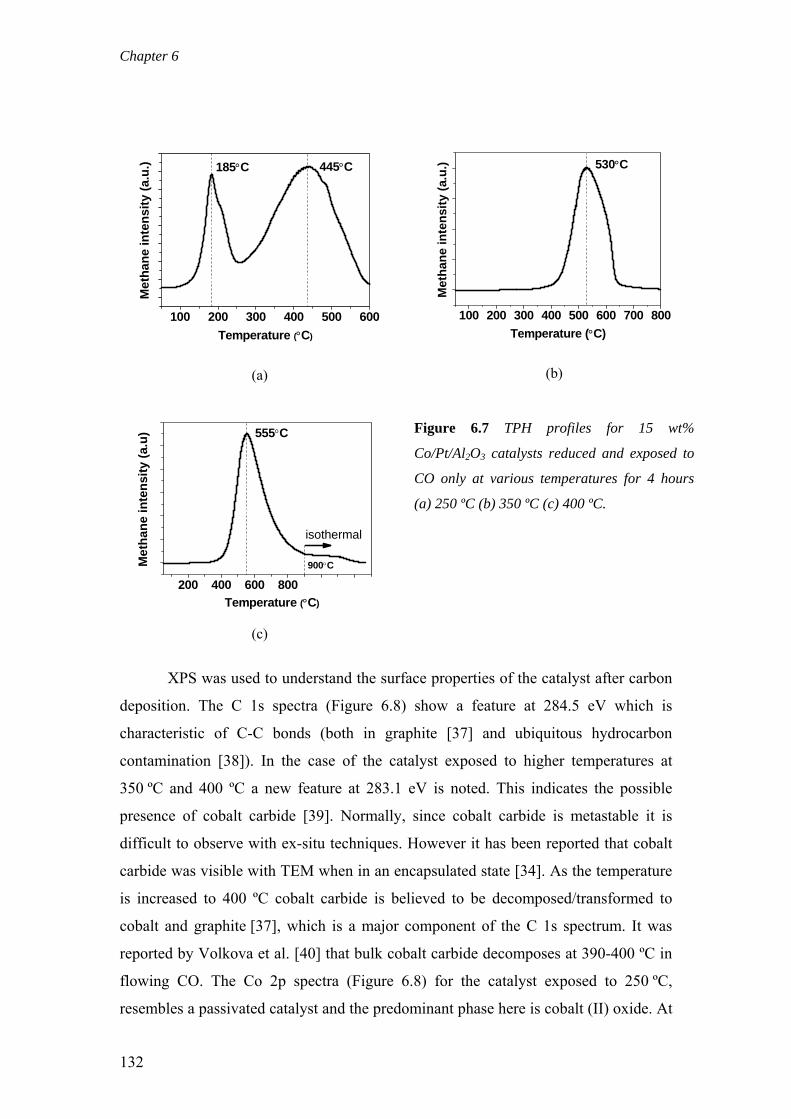
Chapter 6
100 200 300 400 500 600
Met
hane
inte
nsity
(a.u
.)
Temperature (°C)
185°C 445°C
(a)
100 200 300 400 500 600 700 800
Met
hane
inte
nsity
(a.u
.)
Temperature (°C)
530°C
(b)
200 400 600 800 1000 1200
Met
hane
inte
nsity
(a.u
)
Temperature (°C)
isothermal
555°C
900°C
(c)
Figure 6.7 TPH profiles for 15 wt%
Co/Pt/Al2O3 catalysts reduced and exposed to
CO only at various temperatures for 4 hours
(a) 250 ºC (b) 350 ºC (c) 400 ºC.
XPS was used to understand the surface properties of the catalyst after carbon
deposition. The C 1s spectra (Figure 6.8) show a feature at 284.5 eV which is
characteristic of C-C bonds (both in graphite [37] and ubiquitous hydrocarbon
contamination [38]). In the case of the catalyst exposed to higher temperatures at
350 ºC and 400 ºC a new feature at 283.1 eV is noted. This indicates the possible
presence of cobalt carbide [39]. Normally, since cobalt carbide is metastable it is
difficult to observe with ex-situ techniques. However it has been reported that cobalt
carbide was visible with TEM when in an encapsulated state [34]. As the temperature
is increased to 400 ºC cobalt carbide is believed to be decomposed/transformed to
cobalt and graphite [37], which is a major component of the C 1s spectrum. It was
reported by Volkova et al. [40] that bulk cobalt carbide decomposes at 390-400 ºC in
flowing CO. The Co 2p spectra (Figure 6.8) for the catalyst exposed to 250 ºC,
resembles a passivated catalyst and the predominant phase here is cobalt (II) oxide. At
132
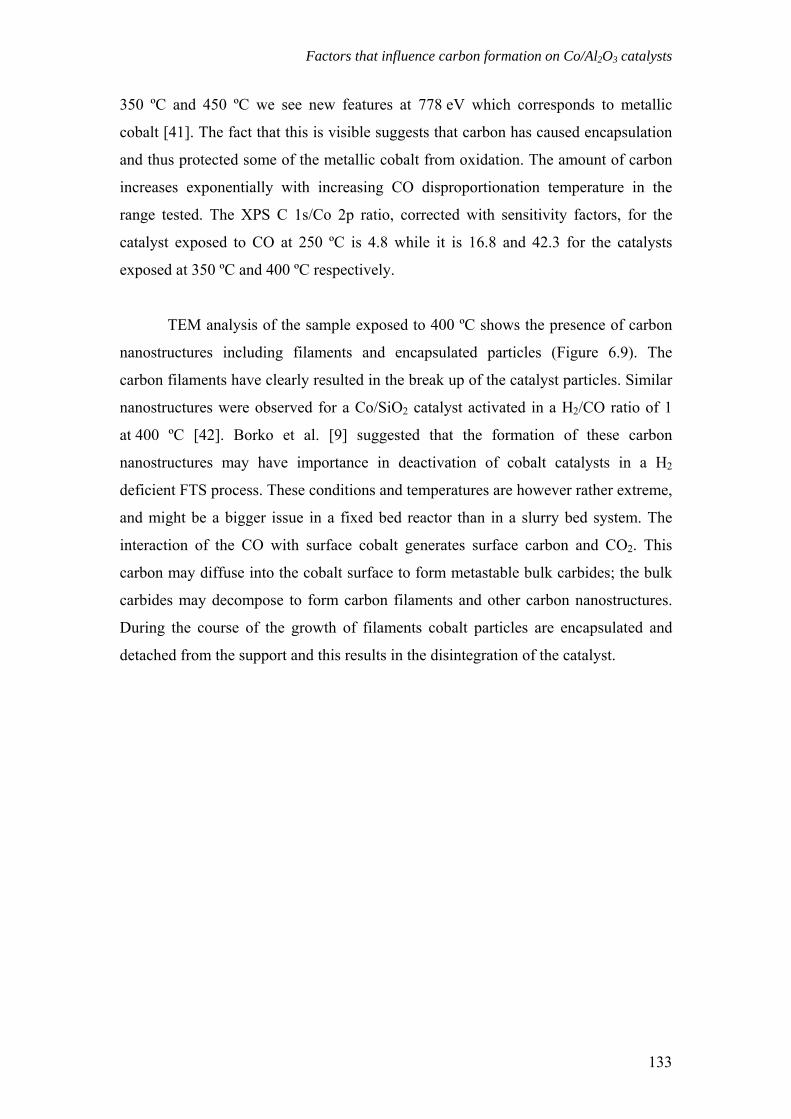
Factors that influence carbon formation on Co/Al2O3 catalysts
350 ºC and 450 ºC we see new features at 778 eV which corresponds to metallic
cobalt [41]. The fact that this is visible suggests that carbon has caused encapsulation
and thus protected some of the metallic cobalt from oxidation. The amount of carbon
increases exponentially with increasing CO disproportionation temperature in the
range tested. The XPS C 1s/Co 2p ratio, corrected with sensitivity factors, for the
catalyst exposed to CO at 250 ºC is 4.8 while it is 16.8 and 42.3 for the catalysts
exposed at 350 ºC and 400 ºC respectively.
TEM analysis of the sample exposed to 400 ºC shows the presence of carbon
nanostructures including filaments and encapsulated particles (Figure 6.9). The
carbon filaments have clearly resulted in the break up of the catalyst particles. Similar
nanostructures were observed for a Co/SiO2 catalyst activated in a H2/CO ratio of 1
at 400 ºC [42]. Borko et al. [9] suggested that the formation of these carbon
nanostructures may have importance in deactivation of cobalt catalysts in a H2
deficient FTS process. These conditions and temperatures are however rather extreme,
and might be a bigger issue in a fixed bed reactor than in a slurry bed system. The
interaction of the CO with surface cobalt generates surface carbon and CO2. This
carbon may diffuse into the cobalt surface to form metastable bulk carbides; the bulk
carbides may decompose to form carbon filaments and other carbon nanostructures.
During the course of the growth of filaments cobalt particles are encapsulated and
detached from the support and this results in the disintegration of the catalyst.
133
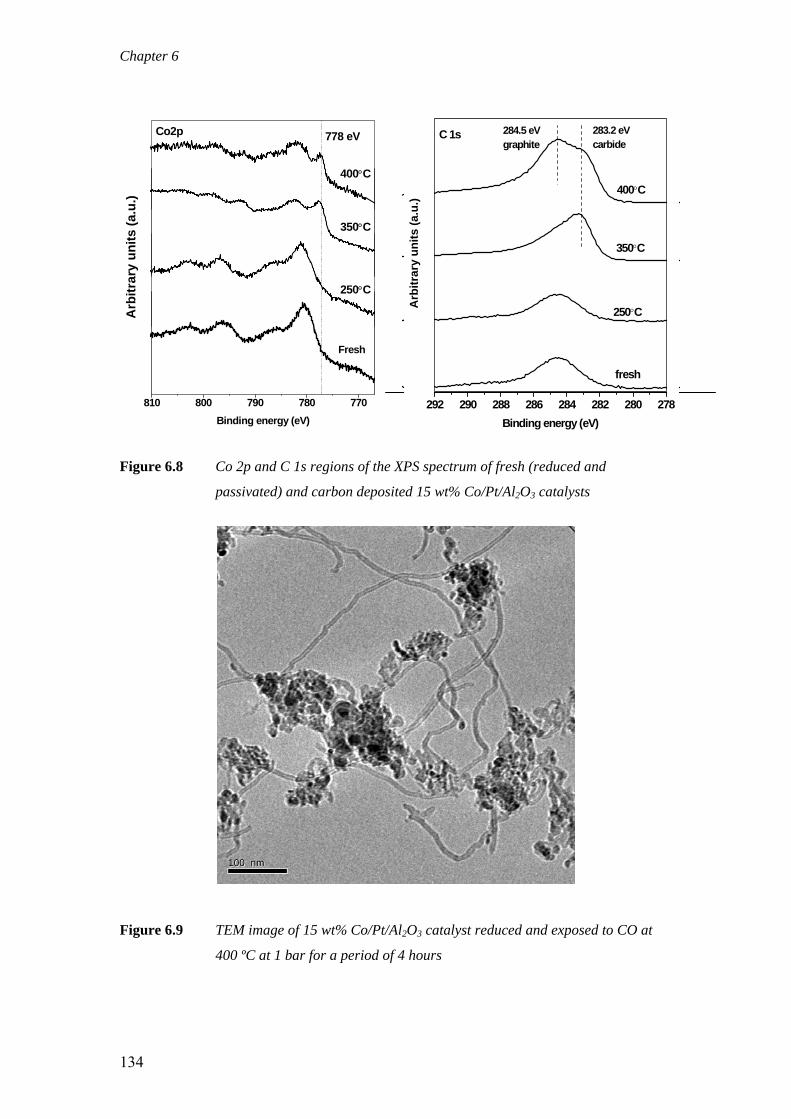
Chapter 6
810 800 790 780 770
Binding energy (eV)
Arb
itrar
y un
its (a
.u.)
Fresh
400°C
350°C
250°C
778 eVCo2p
94 292 290 288 286 284 282 280 278Binding energy (eV)
fresh
250°C
400°C
284.5 eV graphite
283.2 eV carbide
Arb
itrar
y un
its (a
.u.)
C 1s
350°C
Figure 6.8 Co 2p and C 1s regions of the XPS spectrum of fresh (reduced and
passivated) and carbon deposited 15 wt% Co/Pt/Al2O3 catalysts
100 nm100 nm
Figure 6.9 TEM image of 15 wt% Co/Pt/Al2O3 catalyst reduced and exposed to CO at
400 ºC at 1 bar for a period of 4 hours
134
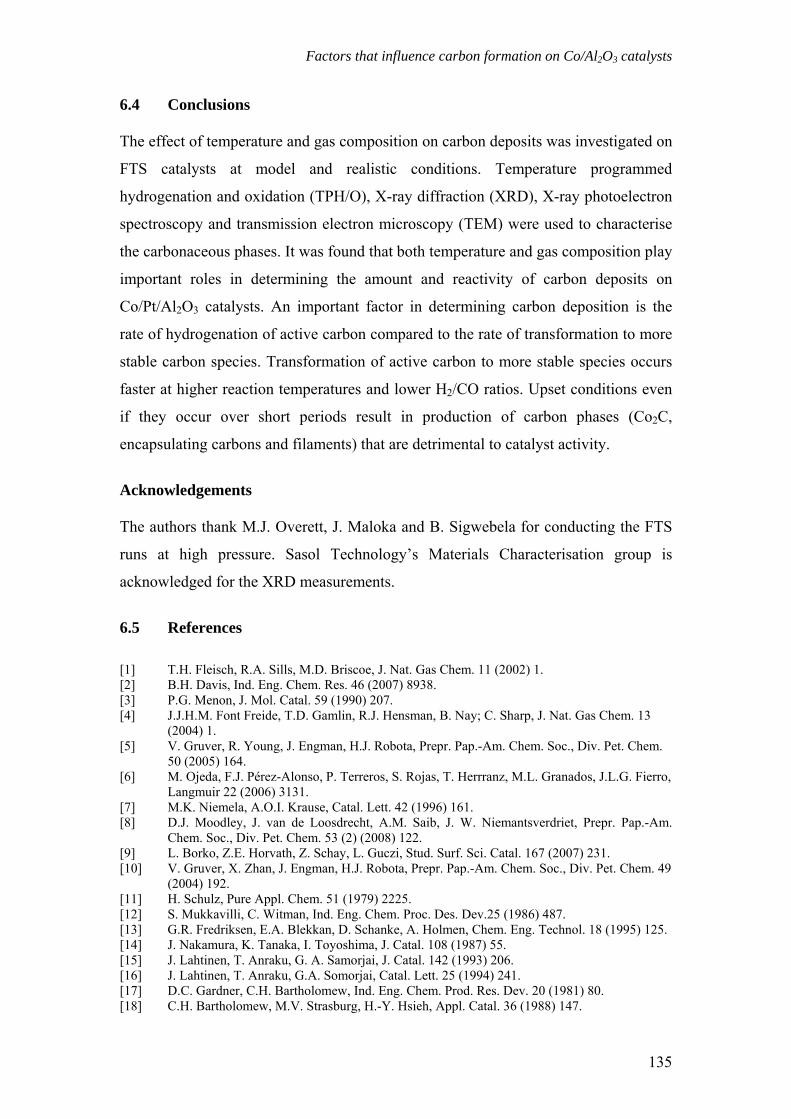
Factors that influence carbon formation on Co/Al2O3 catalysts
6.4 Conclusions The effect of temperature and gas composition on carbon deposits was investigated on
FTS catalysts at model and realistic conditions. Temperature programmed
hydrogenation and oxidation (TPH/O), X-ray diffraction (XRD), X-ray photoelectron
spectroscopy and transmission electron microscopy (TEM) were used to characterise
the carbonaceous phases. It was found that both temperature and gas composition play
important roles in determining the amount and reactivity of carbon deposits on
Co/Pt/Al2O3 catalysts. An important factor in determining carbon deposition is the
rate of hydrogenation of active carbon compared to the rate of transformation to more
stable carbon species. Transformation of active carbon to more stable species occurs
faster at higher reaction temperatures and lower H2/CO ratios. Upset conditions even
if they occur over short periods result in production of carbon phases (Co2C,
encapsulating carbons and filaments) that are detrimental to catalyst activity.
Acknowledgements The authors thank M.J. Overett, J. Maloka and B. Sigwebela for conducting the FTS
runs at high pressure. Sasol Technology’s Materials Characterisation group is
acknowledged for the XRD measurements.
6.5 References [1] T.H. Fleisch, R.A. Sills, M.D. Briscoe, J. Nat. Gas Chem. 11 (2002) 1. [2] B.H. Davis, Ind. Eng. Chem. Res. 46 (2007) 8938. [3] P.G. Menon, J. Mol. Catal. 59 (1990) 207. [4] J.J.H.M. Font Freide, T.D. Gamlin, R.J. Hensman, B. Nay; C. Sharp, J. Nat. Gas Chem. 13
(2004) 1. [5] V. Gruver, R. Young, J. Engman, H.J. Robota, Prepr. Pap.-Am. Chem. Soc., Div. Pet. Chem.
50 (2005) 164. [6] M. Ojeda, F.J. Pérez-Alonso, P. Terreros, S. Rojas, T. Herrranz, M.L. Granados, J.L.G. Fierro,
Langmuir 22 (2006) 3131. [7] M.K. Niemela, A.O.I. Krause, Catal. Lett. 42 (1996) 161. [8] D.J. Moodley, J. van de Loosdrecht, A.M. Saib, J. W. Niemantsverdriet, Prepr. Pap.-Am.
Chem. Soc., Div. Pet. Chem. 53 (2) (2008) 122. [9] L. Borko, Z.E. Horvath, Z. Schay, L. Guczi, Stud. Surf. Sci. Catal. 167 (2007) 231. [10] V. Gruver, X. Zhan, J. Engman, H.J. Robota, Prepr. Pap.-Am. Chem. Soc., Div. Pet. Chem. 49
(2004) 192. [11] H. Schulz, Pure Appl. Chem. 51 (1979) 2225. [12] S. Mukkavilli, C. Witman, Ind. Eng. Chem. Proc. Des. Dev.25 (1986) 487. [13] G.R. Fredriksen, E.A. Blekkan, D. Schanke, A. Holmen, Chem. Eng. Technol. 18 (1995) 125. [14] J. Nakamura, K. Tanaka, I. Toyoshima, J. Catal. 108 (1987) 55. [15] J. Lahtinen, T. Anraku, G. A. Samorjai, J. Catal. 142 (1993) 206. [16] J. Lahtinen, T. Anraku, G.A. Somorjai, Catal. Lett. 25 (1994) 241. [17] D.C. Gardner, C.H. Bartholomew, Ind. Eng. Chem. Prod. Res. Dev. 20 (1981) 80. [18] C.H. Bartholomew, M.V. Strasburg, H.-Y. Hsieh, Appl. Catal. 36 (1988) 147.
135
Chapter 6
[19] D. Bianchi, C.O. Bennet, J. Catal. 86 (1984) 433. [20] H. Ahlafi, D. Bianchi, C.O. Bennett, Appl. Catal. 66 (1990) 99. [21] D. Tristantini, S. Lögdberg, B. Gevert, Ø. Borg, A. Holmen, Fuel Proc. Tech. 88 (2007) 643. [22] G. Calleja, A. de Lucas, R. van Grieken, Fuel 4 (1995) 445. [23] W. Zhou, J.-G. Chen, K.-G. Fang, Y.-H. Sun, Fuel Proc. Tech. 87 (2006) 609. [24] P.J. van Berge, J. van de Loosdrecht, J.L. Visagie, United States Patent 6 806 226 (2004), to
Sasol. [25] P.J. van Berge, J. van de Loosdrecht, E. Caricato, S. Barradas, B.H. Sigwebela, United States
Patent 6 455 462 (2002), to Sasol. [26] P.J. van Berge, J. van de Loosdrecht, E. Caricato, S. Barradas, United States Patent 6 638 889
(2004), to Sasol. [27] R.L. Espinoza, J.L. Visagie, P.J. van Berge, F.H. Bolder, United States Patent 5 733 839
(1998), to Sasol. [28] P.J. van Berge, J. van de Loosdrecht, J.L. Visagie, T.J. van der Walt, H. Veltman, C. Sollie,
European Patent 1 444 040 B1 (2003), to Sasol. [29] J. van de Loosdrecht, S. Barradas, E.A. Caricato, N.G. Ngwenya, P.S. Nkwanyana, M.A.S.
Rawat, B.H. Sigwebela, P.J. van Berge, J.L. Visagie, Top. Catal. 26 (2003) 121. [30] D.-K. Lee, J.-H. Lee, S.-K. Ihm, Appl. Catal. 36 (1988) 199. [31] J.G. McCarty, H. Wise, J. Catal. 57 (1979) 406. [32] P. Winslow, A.T. Bell, J. Catal. 86 (1984) 158. [33] A.D. Moeller, C.H. Bartholomew, Ind. Eng. Chem. Prod. Res. Dev. 21 (1982) 390. [34] F. Tihay, G. Pourroy, M. Richard-Plouet, A. C. Roger, A. Kiennemann, Appl. Catal. A 206
(2001) 29. [35] W.H. Lee, C.H. Bartholomew, J. Catal. 120 (1989) 256. [36] D. Potoczna-Petru, Carbon, 29 (1991) 73. [37] J. Nakamura, I. Toyoshima, K.-I. Tanaka, Surf. Sci. 201 (1988) 185. [38] J.W. Niemantsverdriet, Spectroscopy in Catalysis, Third ed., Wiley-VCH, Weinheim, 2007. [39] J. Xiong, Y. Ding, T. Wang, L Yan, W. Chen, H. Zhu, Y. Lu, Catal. Lett., 102 (2005) 265. [40] G. G. Volkova, T. M. Yurieva, L. M. Plyasova, M. I. Naumova, V. I. Zaikovskii, J. Mol. Cat.
A 158 (2000) 389. [41] R.L. Chin, D.M. Hercules, J. Phys. Chem. 86 (1982) 360. [42] V.A. de la Peña O'Shea, N. Homs, J.L.G. Fierro, P. Ramírez de la Piscina, Catal. Today 114
(2006) 422.
136
Chapter 7
Opportunities to study the behaviour of cobalt nanoparticles by using model FTS
catalysts: Initial results and outlook
The work described in this thesis, thus far, has focused on attempting to understand
the deactivation of complex industrial cobalt-based FTS catalysts that have been
tested under realistic conditions. However, a reductionist approach is necessary to
understand more fundamental issues relating to the behaviour of supported cobalt
nanoparticles in the FTS. This can potentially be achieved by using model supported
cobalt catalysts tested at model FTS conditions. In this chapter we report on two
potential techniques to investigate the behaviour of cobalt nanoparticles by applying
supported cobalt model catalysts. Spherical model cobalt catalysts were prepared by
slurry “impregnation” of Stöber silica spheres. These were then investigated under
different gas environments using in-situ TEM. Secondly, planar model catalysts were
prepared by spincoating of preformed cobalt nanoparticles onto silica TEM grids and
imaged after thermal treatment. Initial results obtained on the two model systems are
discussed. The potential of applying model cobalt catalysts using these two techniques
and possible future applications are outlined.
Chapter 7
7.1 Introduction
In industry, development and optimization of FTS catalysts is based largely on
empirical knowledge [1]. Cobalt catalysts are complex mixtures of different phases
and wide varieties of compounds for example; a modified porous support, chemical
and structural promoters and active cobalt phase [2]. Understanding cobalt catalysts
on a fundamental level creates further opportunities to develop, tune and optimise
catalysts. Deeper fundamental understanding requires the application of advanced
spectroscopic and microscopic techniques on the (active) catalyst, coupled with
catalyst testing. The cobalt catalysts as used in industry, however, are often not
suitable for systematic fundamental studies for a few reasons. Firstly, the active
surface of a catalyst is often hidden in the pore structure of supports and the surface
area exposed for characterization is often too low. Secondly, as already mentioned,
industrial catalyst systems are complex. In the case of cobalt FTS catalysts the entire
cobalt phase (the surface of which contains active sites) typically consists of only 15-
20 wt% of the catalyst and may be difficult to distinguish from inactive phases.
In order to partially overcome these problems, a reductionist approach may be
used by applying simplified model catalysts. A model catalyst is an idealized version
of an existing industrial catalyst system that has been prepared to gain information on
certain aspects of the catalyst that cannot be gained from the conventional system.
The design of a model catalyst is a compromise between achieving a simple well
definable and controllable catalyst and resembling the original industrial catalyst to
maintain relevance [3].
There are various possibilities that exist when it comes to the design of model
cobalt FTS catalysts and two of these are illustrated in Figure 7.1. Spherical model
catalysts have been used previously by Datye and co-workers [4]. The nonporous
support has active particles on their external surface and this facilitates profile views
of supported nanoparticles which are useful for study with HRTEM. Planar model
catalysts can also be applied to bridge the gap between high surface area catalysts and
single crystals. The planar model consists of a conducting substrate, for example
silica, on top of which is deposited an active phase usually by spincoating. Advances
in the preparation of TEM substrates have resulted in production of silica TEM grids
138
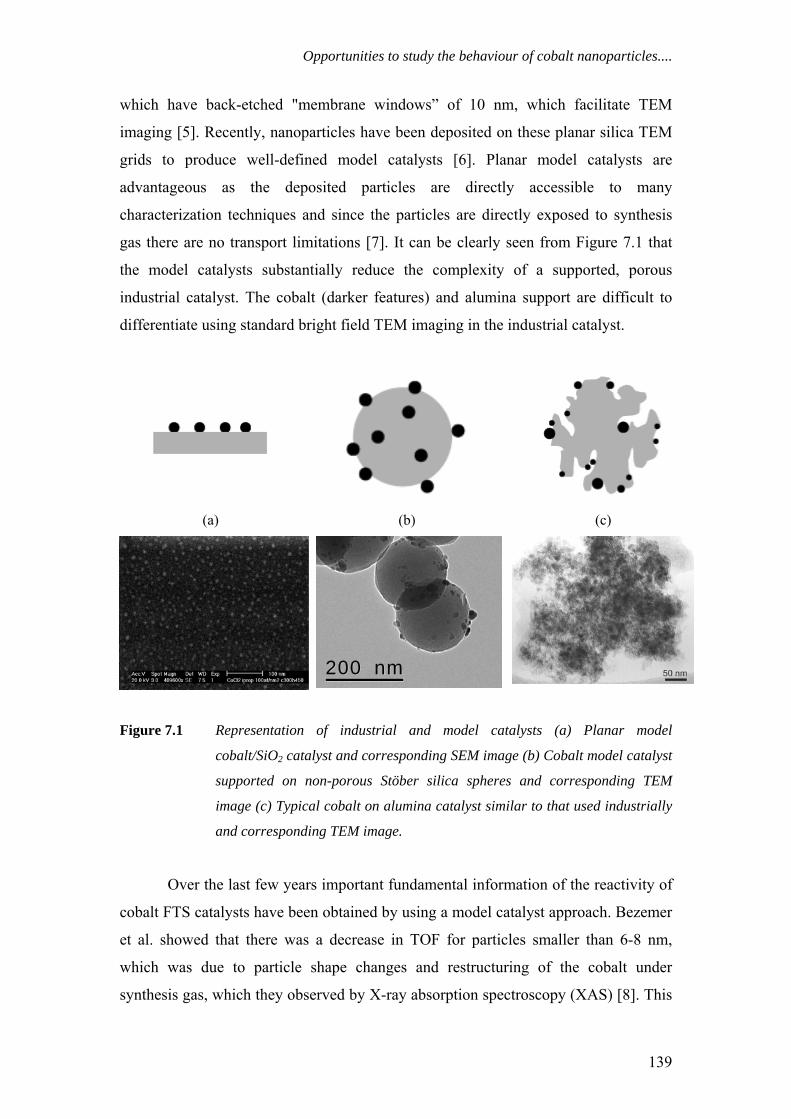
Opportunities to study the behaviour of cobalt nanoparticles....
which have back-etched "membrane windows” of 10 nm, which facilitate TEM
imaging [5]. Recently, nanoparticles have been deposited on these planar silica TEM
grids to produce well-defined model catalysts [6]. Planar model catalysts are
advantageous as the deposited particles are directly accessible to many
characterization techniques and since the particles are directly exposed to synthesis
gas there are no transport limitations [7]. It can be clearly seen from Figure 7.1 that
the model catalysts substantially reduce the complexity of a supported, porous
industrial catalyst. The cobalt (darker features) and alumina support are difficult to
differentiate using standard bright field TEM imaging in the industrial catalyst.
(a) (b) (c)
200 nm200 nm
Figure 7.1 Representation of industrial and model catalysts (a) Planar model
cobalt/SiO2 catalyst and corresponding SEM image (b) Cobalt model catalyst
supported on non-porous Stöber silica spheres and corresponding TEM
image (c) Typical cobalt on alumina catalyst similar to that used industrially
and corresponding TEM image.
Over the last few years important fundamental information of the reactivity of
cobalt FTS catalysts have been obtained by using a model catalyst approach. Bezemer
et al. showed that there was a decrease in TOF for particles smaller than 6-8 nm,
which was due to particle shape changes and restructuring of the cobalt under
synthesis gas, which they observed by X-ray absorption spectroscopy (XAS) [8]. This
139
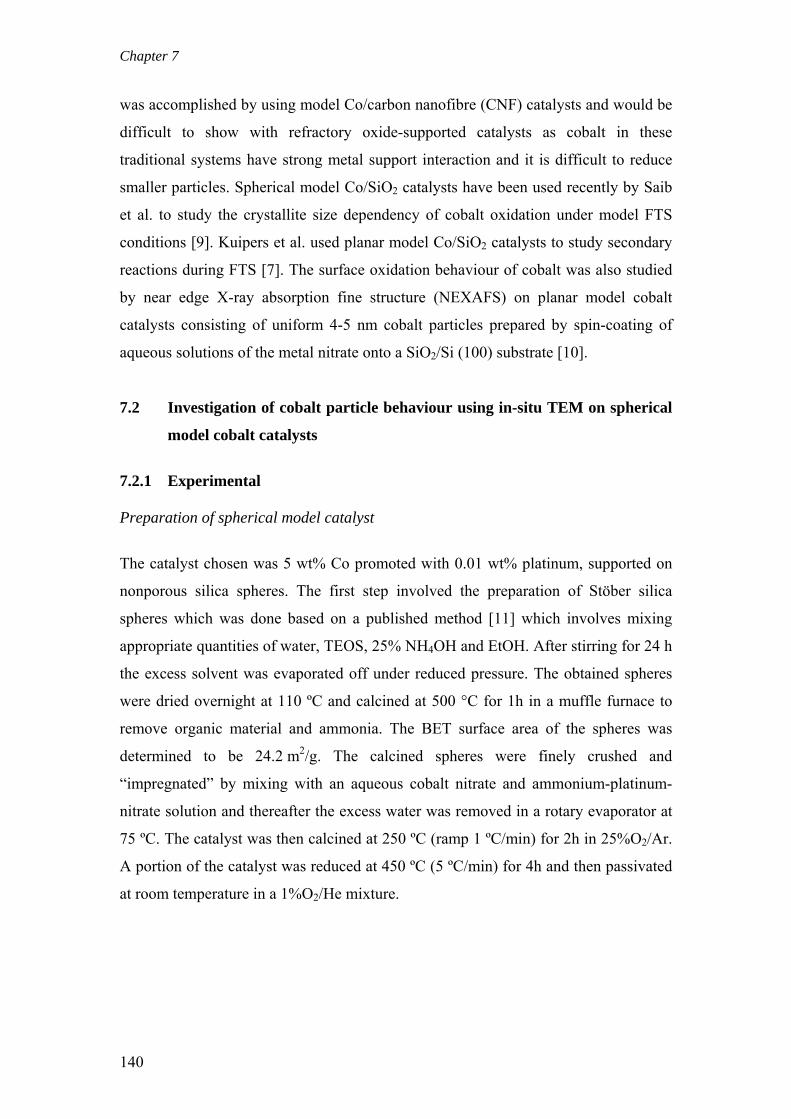
Chapter 7
was accomplished by using model Co/carbon nanofibre (CNF) catalysts and would be
difficult to show with refractory oxide-supported catalysts as cobalt in these
traditional systems have strong metal support interaction and it is difficult to reduce
smaller particles. Spherical model Co/SiO2 catalysts have been used recently by Saib
et al. to study the crystallite size dependency of cobalt oxidation under model FTS
conditions [9]. Kuipers et al. used planar model Co/SiO2 catalysts to study secondary
reactions during FTS [7]. The surface oxidation behaviour of cobalt was also studied
by near edge X-ray absorption fine structure (NEXAFS) on planar model cobalt
catalysts consisting of uniform 4-5 nm cobalt particles prepared by spin-coating of
aqueous solutions of the metal nitrate onto a SiO2/Si (100) substrate [10].
7.2 Investigation of cobalt particle behaviour using in-situ TEM on spherical
model cobalt catalysts
7.2.1 Experimental Preparation of spherical model catalyst
The catalyst chosen was 5 wt% Co promoted with 0.01 wt% platinum, supported on
nonporous silica spheres. The first step involved the preparation of Stöber silica
spheres which was done based on a published method [11] which involves mixing
appropriate quantities of water, TEOS, 25% NH4OH and EtOH. After stirring for 24 h
the excess solvent was evaporated off under reduced pressure. The obtained spheres
were dried overnight at 110 ºC and calcined at 500 °C for 1h in a muffle furnace to
remove organic material and ammonia. The BET surface area of the spheres was
determined to be 24.2 m2/g. The calcined spheres were finely crushed and
“impregnated” by mixing with an aqueous cobalt nitrate and ammonium-platinum-
nitrate solution and thereafter the excess water was removed in a rotary evaporator at
75 ºC. The catalyst was then calcined at 250 ºC (ramp 1 ºC/min) for 2h in 25%O2/Ar.
A portion of the catalyst was reduced at 450 ºC (5 ºC/min) for 4h and then passivated
at room temperature in a 1%O2/He mixture.
140
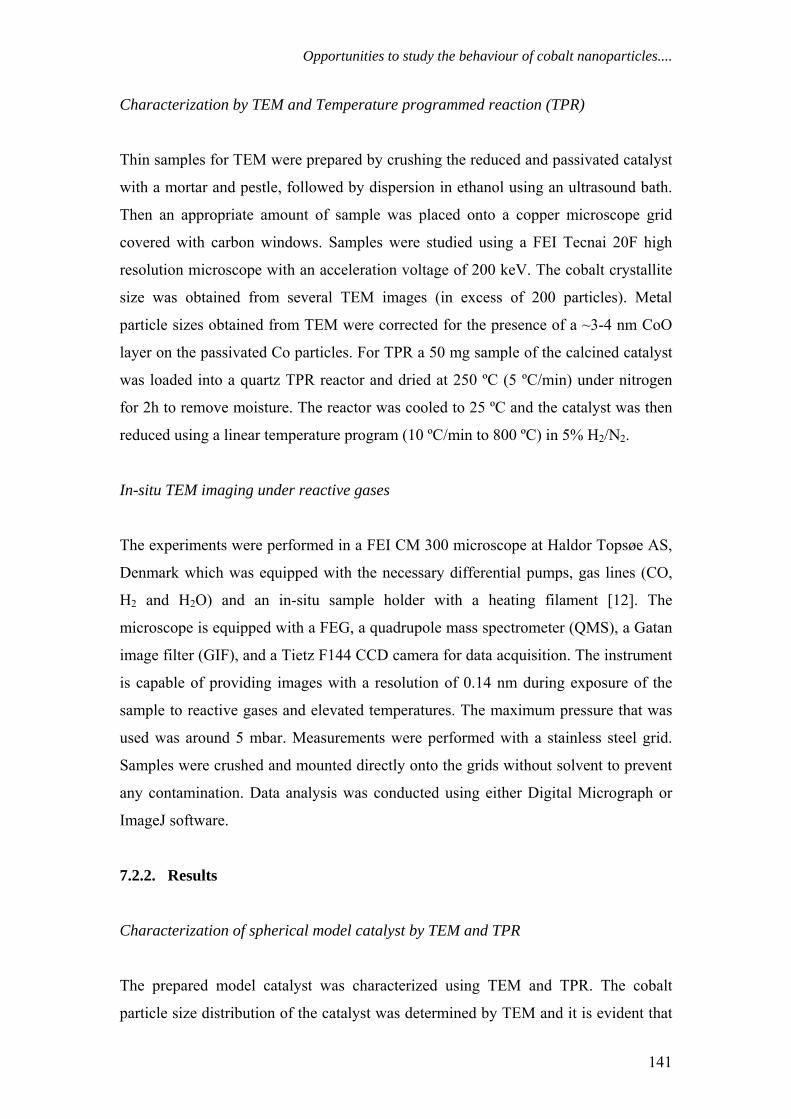
Opportunities to study the behaviour of cobalt nanoparticles....
Characterization by TEM and Temperature programmed reaction (TPR)
Thin samples for TEM were prepared by crushing the reduced and passivated catalyst
with a mortar and pestle, followed by dispersion in ethanol using an ultrasound bath.
Then an appropriate amount of sample was placed onto a copper microscope grid
covered with carbon windows. Samples were studied using a FEI Tecnai 20F high
resolution microscope with an acceleration voltage of 200 keV. The cobalt crystallite
size was obtained from several TEM images (in excess of 200 particles). Metal
particle sizes obtained from TEM were corrected for the presence of a ~3-4 nm CoO
layer on the passivated Co particles. For TPR a 50 mg sample of the calcined catalyst
was loaded into a quartz TPR reactor and dried at 250 ºC (5 ºC/min) under nitrogen
for 2h to remove moisture. The reactor was cooled to 25 ºC and the catalyst was then
reduced using a linear temperature program (10 ºC/min to 800 ºC) in 5% H2/N2.
In-situ TEM imaging under reactive gases
The experiments were performed in a FEI CM 300 microscope at Haldor Topsøe AS,
Denmark which was equipped with the necessary differential pumps, gas lines (CO,
H2 and H2O) and an in-situ sample holder with a heating filament [12]. The
microscope is equipped with a FEG, a quadrupole mass spectrometer (QMS), a Gatan
image filter (GIF), and a Tietz F144 CCD camera for data acquisition. The instrument
is capable of providing images with a resolution of 0.14 nm during exposure of the
sample to reactive gases and elevated temperatures. The maximum pressure that was
used was around 5 mbar. Measurements were performed with a stainless steel grid.
Samples were crushed and mounted directly onto the grids without solvent to prevent
any contamination. Data analysis was conducted using either Digital Micrograph or
ImageJ software.
7.2.2. Results
Characterization of spherical model catalyst by TEM and TPR
The prepared model catalyst was characterized using TEM and TPR. The cobalt
particle size distribution of the catalyst was determined by TEM and it is evident that
141
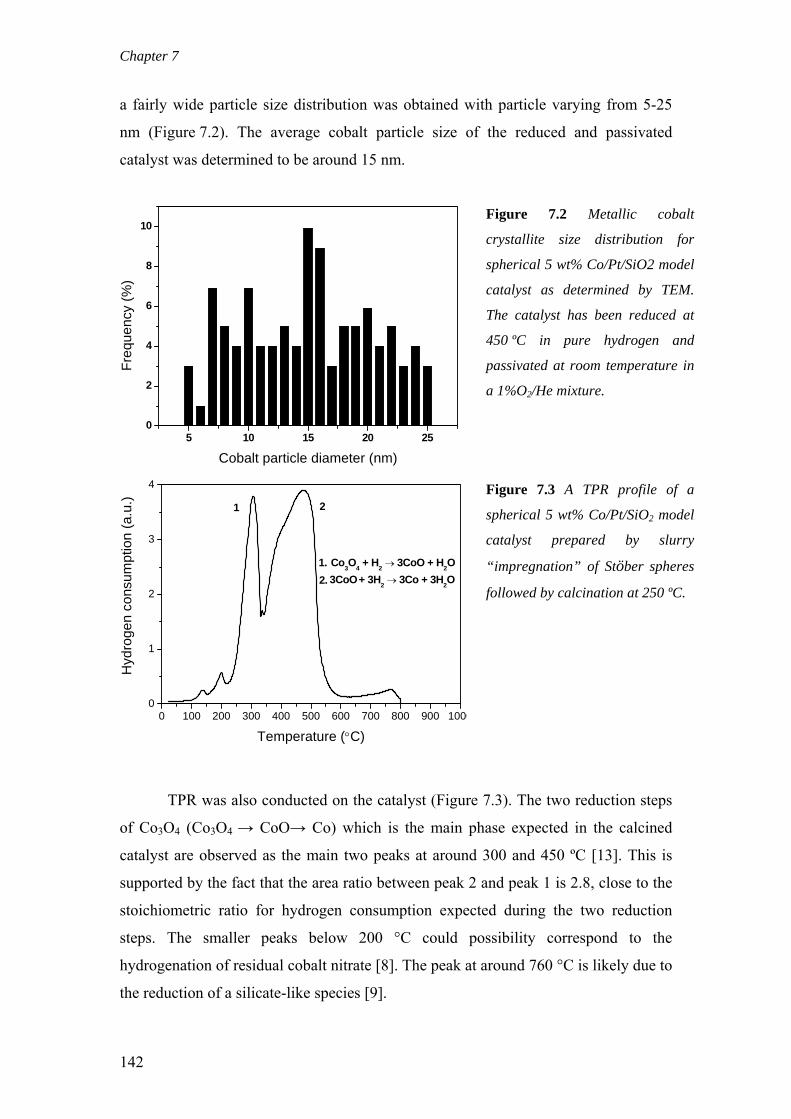
Chapter 7
a fairly wide particle size distribution was obtained with particle varying from 5-25
nm (Figure 7.2). The average cobalt particle size of the reduced and passivated
catalyst was determined to be around 15 nm.
5 10 15 20 250
2
4
6
8
10
Freq
uenc
y (%
)
Cobalt particle diameter (nm)
Figure 7.2 Metallic cobalt
crystallite size distribution for
spherical 5 wt% Co/Pt/SiO2 model
catalyst as determined by TEM.
The catalyst has been reduced at
450 ºC in pure hydrogen and
passivated at room temperature in
a 1%O2/He mixture.
0 100 200 300 400 500 600 700 800 900 10000
1
2
3
4
3CoO + 3H2 → 3Co + 3H2O
Hyd
roge
n co
nsum
ptio
n (a
.u.)
Temperature (°C)
Co3O4 + H2 → 3CoO + H2O2.
1.
1 2
Figure 7.3 A TPR profile of a
spherical 5 wt% Co/Pt/SiO2 model
catalyst prepared by slurry
“impregnation” of Stöber spheres
followed by calcination at 250 ºC.
TPR was also conducted on the catalyst (Figure 7.3). The two reduction steps
of Co3O4 (Co3O4 → CoO→ Co) which is the main phase expected in the calcined
catalyst are observed as the main two peaks at around 300 and 450 ºC [13]. This is
supported by the fact that the area ratio between peak 2 and peak 1 is 2.8, close to the
stoichiometric ratio for hydrogen consumption expected during the two reduction
steps. The smaller peaks below 200 °C could possibility correspond to the
hydrogenation of residual cobalt nitrate [8]. The peak at around 760 °C is likely due to
the reduction of a silicate-like species [9].
142
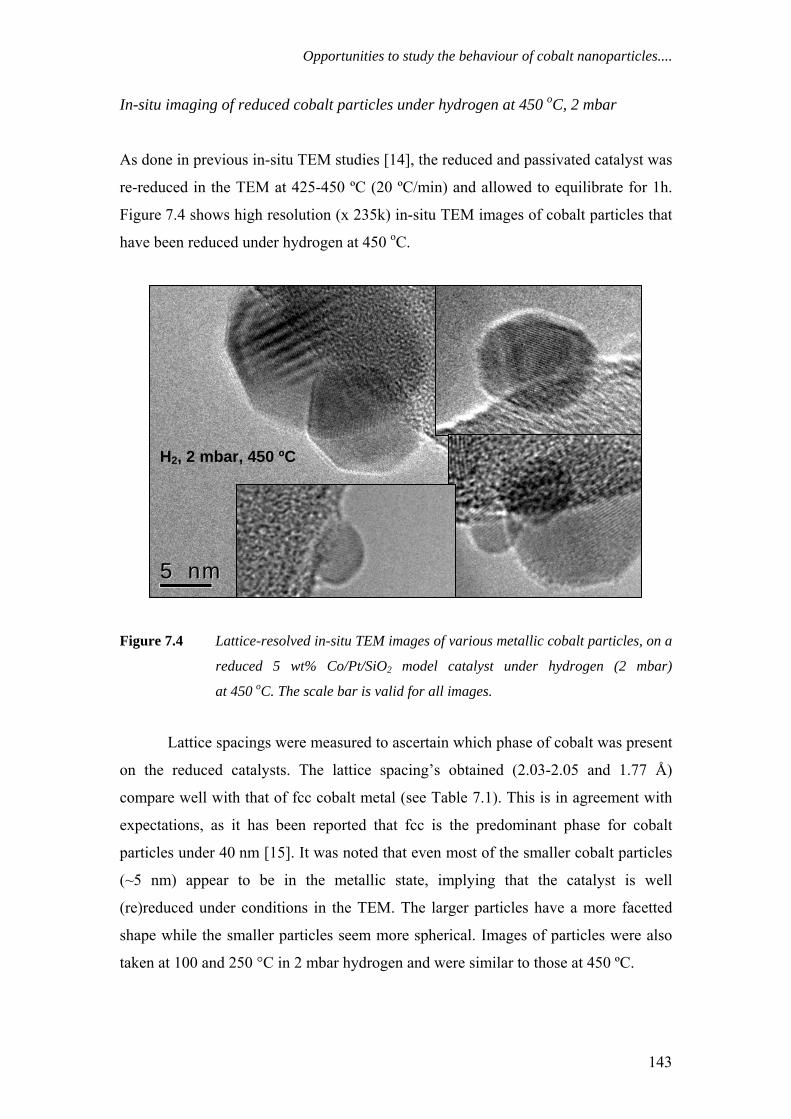
Opportunities to study the behaviour of cobalt nanoparticles....
In-situ imaging of reduced cobalt particles under hydrogen at 450 oC, 2 mbar
As done in previous in-situ TEM studies [14], the reduced and passivated catalyst was
re-reduced in the TEM at 425-450 ºC (20 ºC/min) and allowed to equilibrate for 1h.
Figure 7.4 shows high resolution (x 235k) in-situ TEM images of cobalt particles that
have been reduced under hydrogen at 450 oC.
5 nm5 nm
H2, 2 mbar, 450 ºC
Figure 7.4 Lattice-resolved in-situ TEM images of various metallic cobalt particles, on a
reduced 5 wt% Co/Pt/SiO2 model catalyst under hydrogen (2 mbar)
at 450 oC. The scale bar is valid for all images.
Lattice spacings were measured to ascertain which phase of cobalt was present
on the reduced catalysts. The lattice spacing’s obtained (2.03-2.05 and 1.77 Å)
compare well with that of fcc cobalt metal (see Table 7.1). This is in agreement with
expectations, as it has been reported that fcc is the predominant phase for cobalt
particles under 40 nm [15]. It was noted that even most of the smaller cobalt particles
(~5 nm) appear to be in the metallic state, implying that the catalyst is well
(re)reduced under conditions in the TEM. The larger particles have a more facetted
shape while the smaller particles seem more spherical. Images of particles were also
taken at 100 and 250 °C in 2 mbar hydrogen and were similar to those at 450 ºC.
143
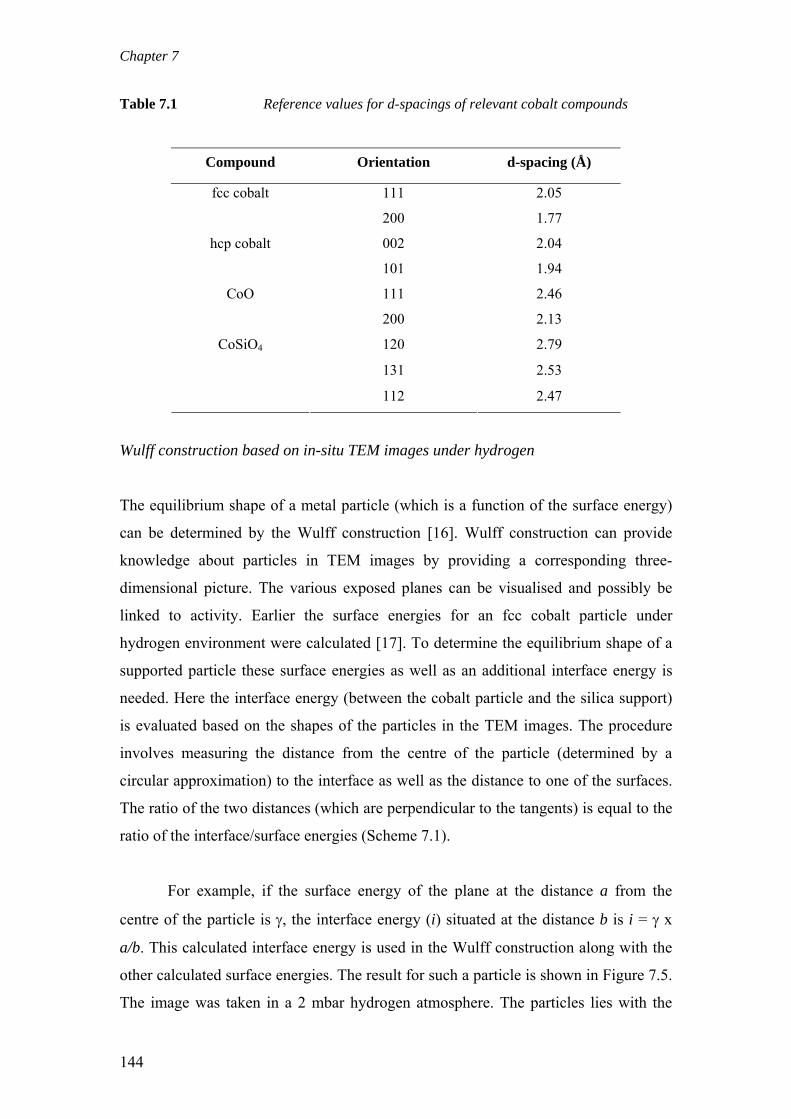
Chapter 7
Table 7.1 Reference values for d-spacings of relevant cobalt compounds
Compound Orientation d-spacing (Å)
111 2.05 fcc cobalt
200 1.77
002 2.04 hcp cobalt
101 1.94
111 2.46 CoO
200 2.13
120 2.79
131 2.53
CoSiO4
112 2.47
Wulff construction based on in-situ TEM images under hydrogen
The equilibrium shape of a metal particle (which is a function of the surface energy)
can be determined by the Wulff construction [16]. Wulff construction can provide
knowledge about particles in TEM images by providing a corresponding three-
dimensional picture. The various exposed planes can be visualised and possibly be
linked to activity. Earlier the surface energies for an fcc cobalt particle under
hydrogen environment were calculated [17]. To determine the equilibrium shape of a
supported particle these surface energies as well as an additional interface energy is
needed. Here the interface energy (between the cobalt particle and the silica support)
is evaluated based on the shapes of the particles in the TEM images. The procedure
involves measuring the distance from the centre of the particle (determined by a
circular approximation) to the interface as well as the distance to one of the surfaces.
The ratio of the two distances (which are perpendicular to the tangents) is equal to the
ratio of the interface/surface energies (Scheme 7.1).
For example, if the surface energy of the plane at the distance a from the
centre of the particle is γ, the interface energy (i) situated at the distance b is i = γ x
a/b. This calculated interface energy is used in the Wulff construction along with the
other calculated surface energies. The result for such a particle is shown in Figure 7.5.
The image was taken in a 2 mbar hydrogen atmosphere. The particles lies with the
144
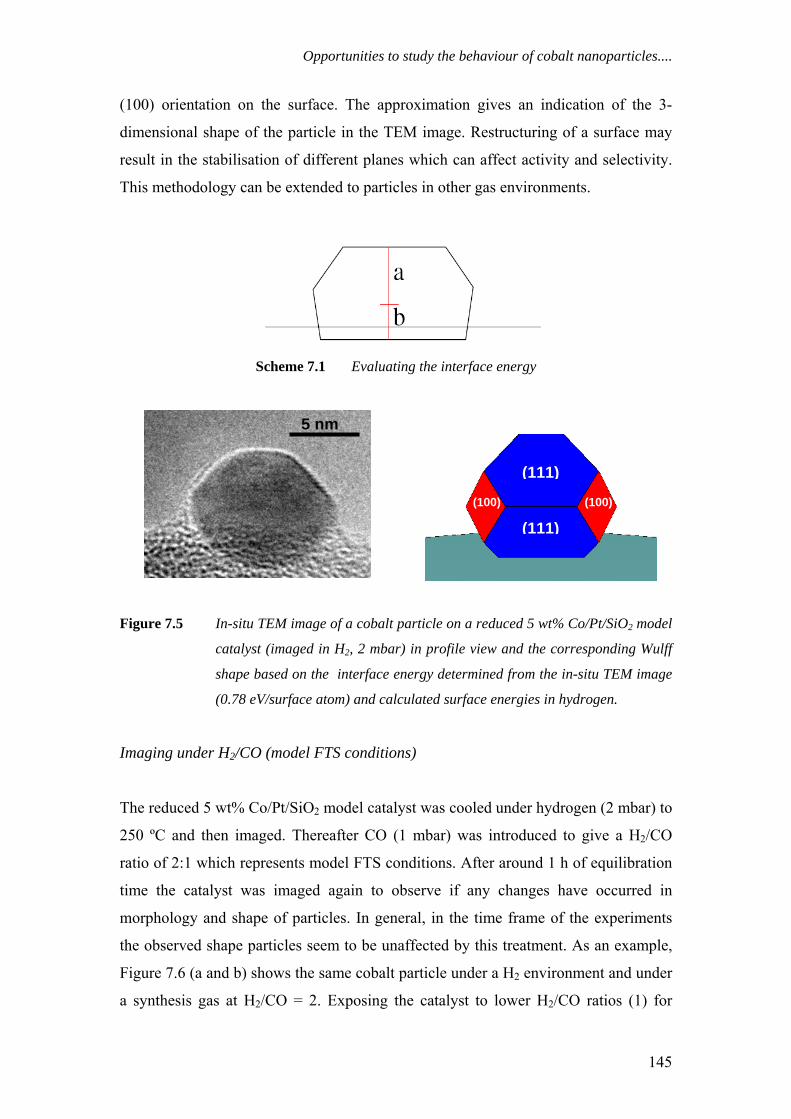
Opportunities to study the behaviour of cobalt nanoparticles....
(100) orientation on the surface. The approximation gives an indication of the 3-
dimensional shape of the particle in the TEM image. Restructuring of a surface may
result in the stabilisation of different planes which can affect activity and selectivity.
This methodology can be extended to particles in other gas environments.
Scheme 7.1 Evaluating the interface energy
5 nm
(111)
(100) (100)
(111)
Figure 7.5 In-situ TEM image of a cobalt particle on a reduced 5 wt% Co/Pt/SiO2 model
catalyst (imaged in H2, 2 mbar) in profile view and the corresponding Wulff
shape based on the interface energy determined from the in-situ TEM image
(0.78 eV/surface atom) and calculated surface energies in hydrogen.
Imaging under H2/CO (model FTS conditions)
The reduced 5 wt% Co/Pt/SiO2 model catalyst was cooled under hydrogen (2 mbar) to
250 ºC and then imaged. Thereafter CO (1 mbar) was introduced to give a H2/CO
ratio of 2:1 which represents model FTS conditions. After around 1 h of equilibration
time the catalyst was imaged again to observe if any changes have occurred in
morphology and shape of particles. In general, in the time frame of the experiments
the observed shape particles seem to be unaffected by this treatment. As an example,
Figure 7.6 (a and b) shows the same cobalt particle under a H2 environment and under
a synthesis gas at H2/CO = 2. Exposing the catalyst to lower H2/CO ratios (1) for
145
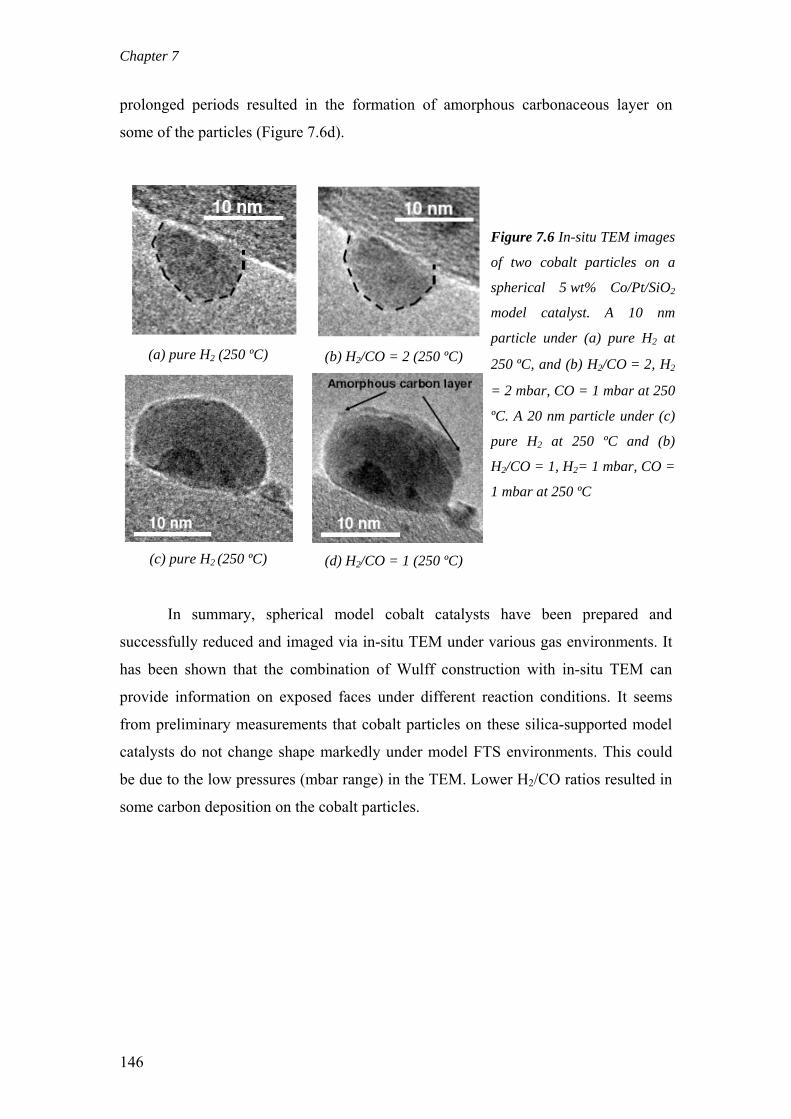
Chapter 7
prolonged periods resulted in the formation of amorphous carbonaceous layer on
some of the particles (Figure 7.6d).
(a) pure H2 (250 ºC) (b) H2/CO = 2 (250 ºC)
(c) pure H2 (250 ºC) (d) H2/CO = 1 (250 ºC)
Figure 7.6 In-situ TEM images
of two cobalt particles on a
spherical 5 wt% Co/Pt/SiO2
model catalyst. A 10 nm
particle under (a) pure H2 at
250 ºC, and (b) H2/CO = 2, H2
= 2 mbar, CO = 1 mbar at 250
ºC. A 20 nm particle under (c)
pure H2 at 250 ºC and (b)
H2/CO = 1, H2= 1 mbar, CO =
1 mbar at 250 ºC
In summary, spherical model cobalt catalysts have been prepared and
successfully reduced and imaged via in-situ TEM under various gas environments. It
has been shown that the combination of Wulff construction with in-situ TEM can
provide information on exposed faces under different reaction conditions. It seems
from preliminary measurements that cobalt particles on these silica-supported model
catalysts do not change shape markedly under model FTS environments. This could
be due to the low pressures (mbar range) in the TEM. Lower H2/CO ratios resulted in
some carbon deposition on the cobalt particles.
146
Opportunities to study the behaviour of cobalt nanoparticles....
7.3 Preparation of model catalysts by supporting pre-formed cobalt
nanoparticles on silica TEM grids.
7.3.1 Experimental
Preparation of planar model catalysts
Silica TEM grids are promising for application as supports for planar model catalysts.
The silica TEM grid consists of a silica window suspended in a silicon framework [5].
Silicon nitride is deposited at the back of a standard silicon 100 wafer. The nitride is
patterned to form an appropriate mask which facilitates anisotropic etching of the
silicon, until the oxide is left suspended in its framework. The silica window allows
for the transmission of the electron beam. There are a few options available for
preparing cobalt catalysts supported on silica TEM grids. The particles can be formed
in-situ by the technique of grafting /spincoating of a solution of cobalt salts as done
earlier by Kuipers et al. [7] and Saib et al. [9]. The catalyst may also be prepared by
grafting preformed metal particles onto the silica TEM grid as been shown
recently [6]. The advantage of the preformed particle route is that it seems that the
particle size, shape and phase can be manipulated more easily as compared to the in-
situ formation route. Preformed particles of cobalt have been previously prepared by
decomposition cobalt carbonyl in the presence of capping surfactants [18]. Many of
the used capping agents contain phosphorous and nitrogen which may act as poisons
for cobalt [18]. If possible it would be advantageous to prepare preformed particles
that contain only carbon, hydrogen and oxygen in the surfactants, which could later be
removed in a calcination step.
(a) Preformed nanoparticles
Oleic acid (3.2 ml, 10 mmol), adamantane carboxylic acid (2.0 g, 10 mmol) and
diphenyl ether (90 ml), were added to a 250 ml round bottom flask under nitrogen and
heated to 170 °C. In a separate flask, the cobalt carbonyl (3.42 g, 10 mmol) was
suspended in octyl ether (40 ml) and was heated to 60 ºC to dissolve the cobalt
carbonyl. This solution was transferred rapidly to the hot mixture and heated at 220 ºC
for 80 min until no further carbon monoxide could be detected. After such time the
147
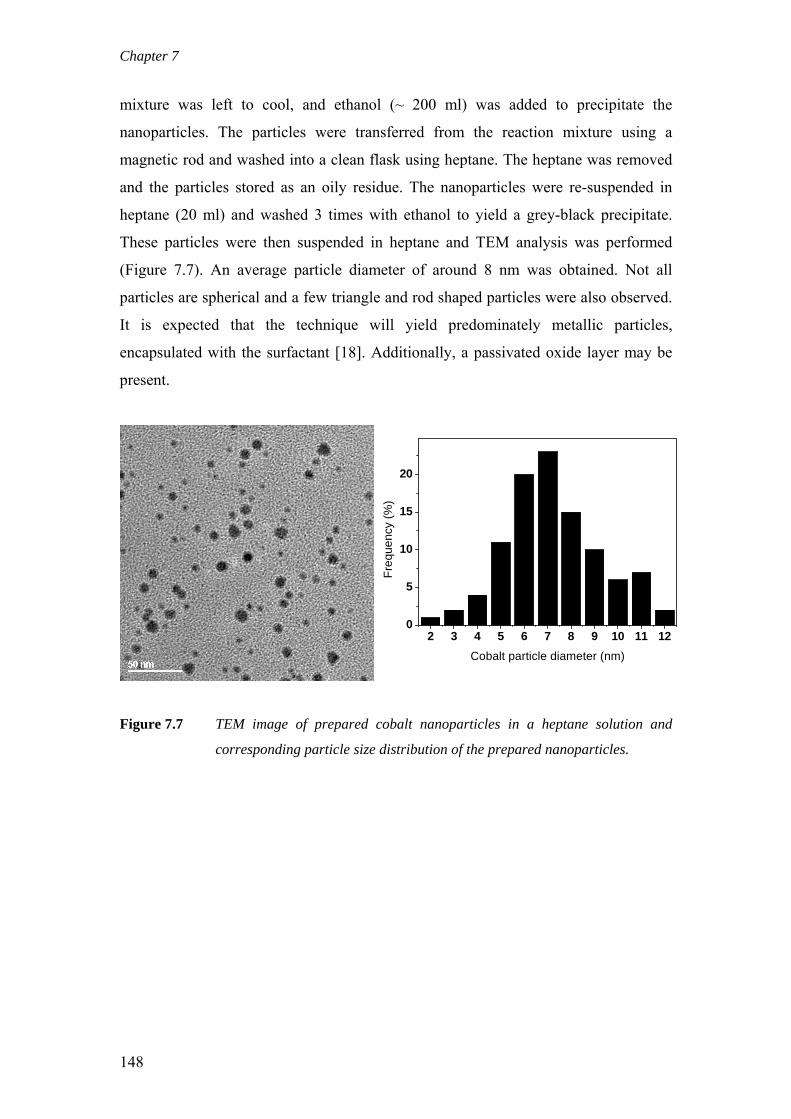
Chapter 7
mixture was left to cool, and ethanol (~ 200 ml) was added to precipitate the
nanoparticles. The particles were transferred from the reaction mixture using a
magnetic rod and washed into a clean flask using heptane. The heptane was removed
and the particles stored as an oily residue. The nanoparticles were re-suspended in
heptane (20 ml) and washed 3 times with ethanol to yield a grey-black precipitate.
These particles were then suspended in heptane and TEM analysis was performed
(Figure 7.7). An average particle diameter of around 8 nm was obtained. Not all
particles are spherical and a few triangle and rod shaped particles were also observed.
It is expected that the technique will yield predominately metallic particles,
encapsulated with the surfactant [18]. Additionally, a passivated oxide layer may be
present.
2 3 4 5 6 7 8 9 10 11 120
5
10
15
20
Freq
uenc
y (%
)
Cobalt particle diameter (nm)
Figure 7.7 TEM image of prepared cobalt nanoparticles in a heptane solution and
corresponding particle size distribution of the prepared nanoparticles.
148
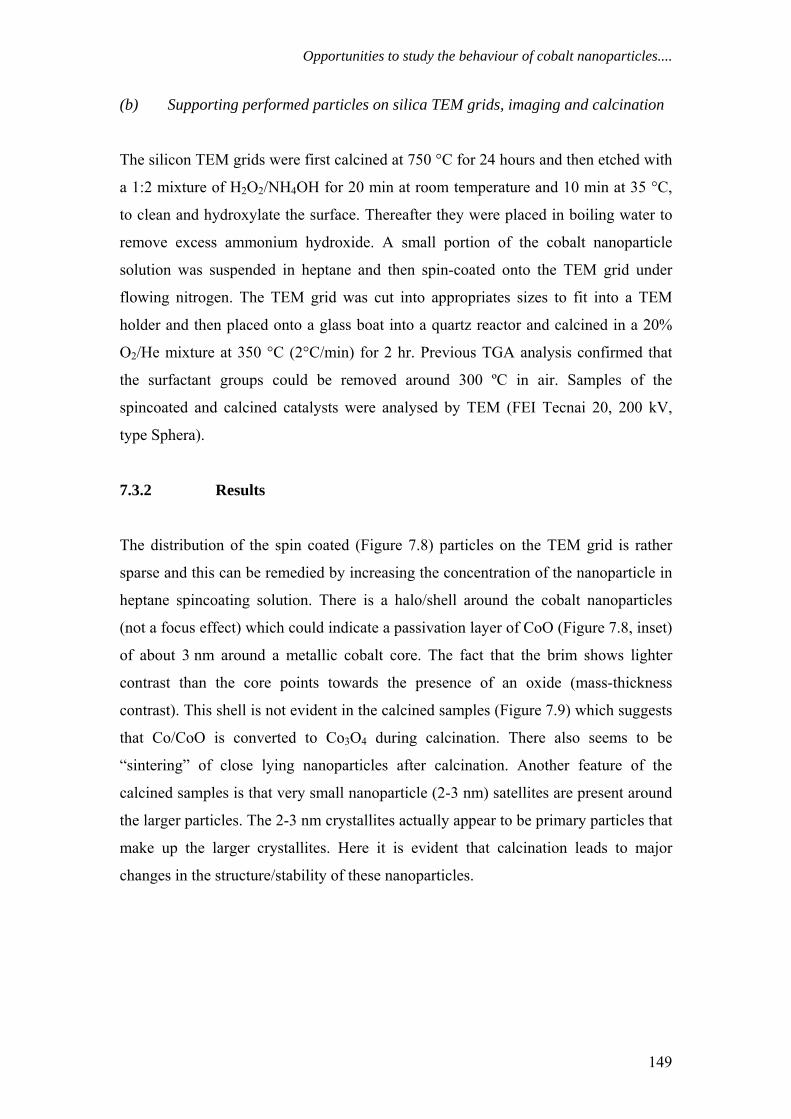
Opportunities to study the behaviour of cobalt nanoparticles....
(b) Supporting performed particles on silica TEM grids, imaging and calcination
The silicon TEM grids were first calcined at 750 °C for 24 hours and then etched with
a 1:2 mixture of H2O2/NH4OH for 20 min at room temperature and 10 min at 35 °C,
to clean and hydroxylate the surface. Thereafter they were placed in boiling water to
remove excess ammonium hydroxide. A small portion of the cobalt nanoparticle
solution was suspended in heptane and then spin-coated onto the TEM grid under
flowing nitrogen. The TEM grid was cut into appropriates sizes to fit into a TEM
holder and then placed onto a glass boat into a quartz reactor and calcined in a 20%
O2/He mixture at 350 °C (2°C/min) for 2 hr. Previous TGA analysis confirmed that
the surfactant groups could be removed around 300 ºC in air. Samples of the
spincoated and calcined catalysts were analysed by TEM (FEI Tecnai 20, 200 kV,
type Sphera).
7.3.2 Results
The distribution of the spin coated (Figure 7.8) particles on the TEM grid is rather
sparse and this can be remedied by increasing the concentration of the nanoparticle in
heptane spincoating solution. There is a halo/shell around the cobalt nanoparticles
(not a focus effect) which could indicate a passivation layer of CoO (Figure 7.8, inset)
of about 3 nm around a metallic cobalt core. The fact that the brim shows lighter
contrast than the core points towards the presence of an oxide (mass-thickness
contrast). This shell is not evident in the calcined samples (Figure 7.9) which suggests
that Co/CoO is converted to Co3O4 during calcination. There also seems to be
“sintering” of close lying nanoparticles after calcination. Another feature of the
calcined samples is that very small nanoparticle (2-3 nm) satellites are present around
the larger particles. The 2-3 nm crystallites actually appear to be primary particles that
make up the larger crystallites. Here it is evident that calcination leads to major
changes in the structure/stability of these nanoparticles.
149
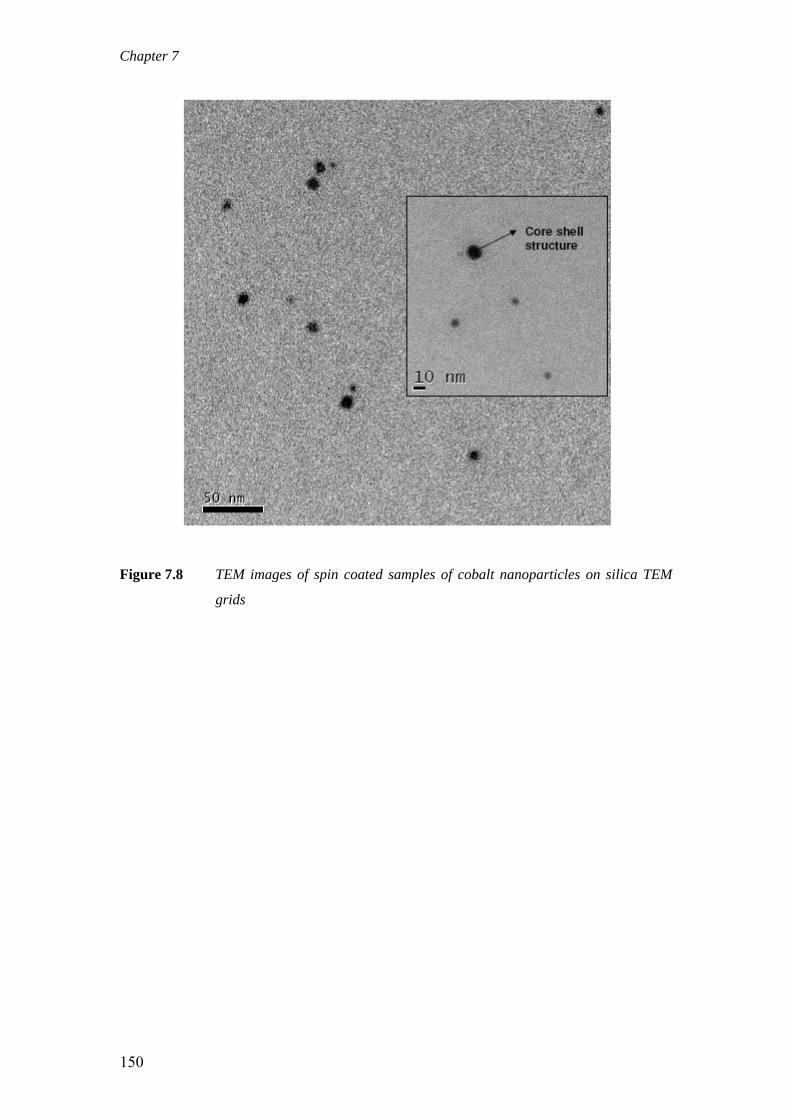
Chapter 7
Figure 7.8 TEM images of spin coated samples of cobalt nanoparticles on silica TEM
grids
150
Opportunities to study the behaviour of cobalt nanoparticles....
Figure 7.9 TEM images of calcined samples (350 °C) of cobalt nanoparticles on silica-
TEM grids
Another powerful application of catalysts supported on silica TEM grids is
that it is possible to revisit the exact same area before and after pre-treatment. This
enables one to image the same particles and thus track changes making data collection
less rigorous in terms of statistics. Figure 7.10 shows images of the same set of cobalt
nanoparticles after spincoating and calcination. The calcined particles appear larger
than particles in the spin coated state, which are expected to consist of cobalt metal
with a small passivated CoO layer (Figure 7.8). This could be due to the increase in
volume that occurs upon oxidation. It is known that the diameter of Co is 0.75 times
the diameter of Co3O4 which coincides with the observed increase in size. High
resolution images of the calcined particles showed d-spacings of 2.45 Å which is
close to that of Co3O4. The redispersion of cobalt into the primary nanoparticles upon
thermal treatment can also be seen.
151
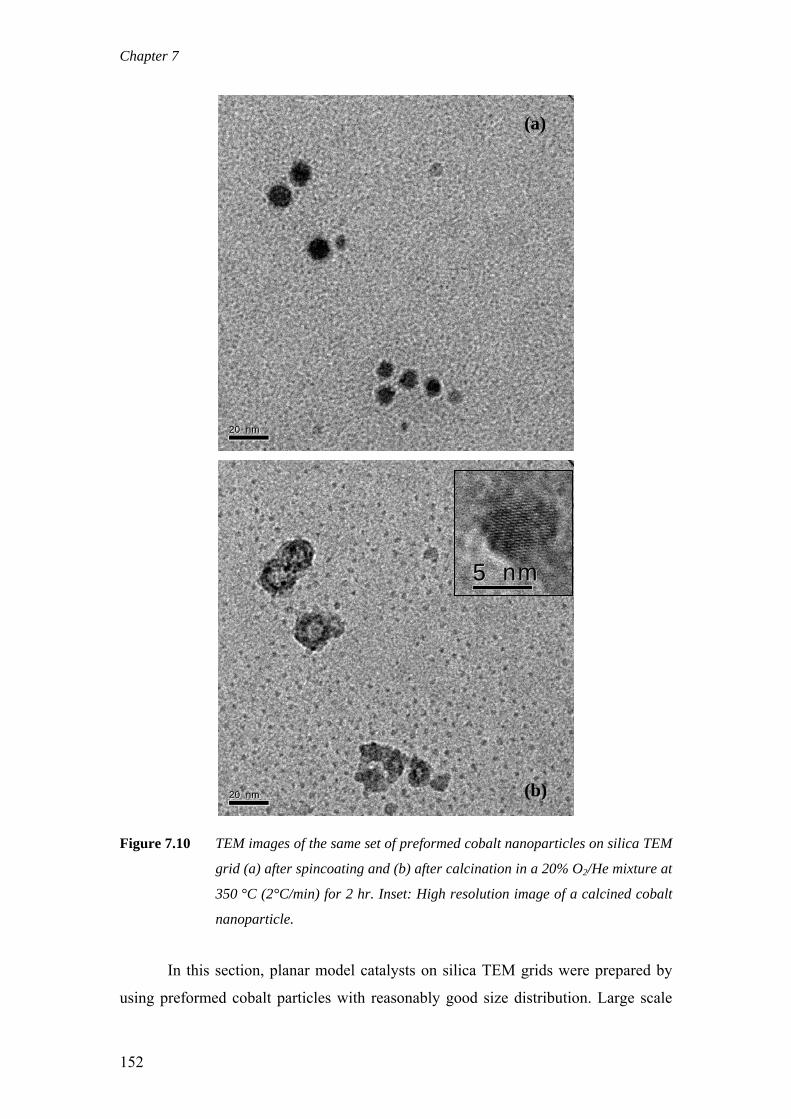
Chapter 7
20 nm20 nm
(a)
20 nm20 nm
5 nm5 nm
(b)
Figure 7.10 TEM images of the same set of preformed cobalt nanoparticles on silica TEM
grid (a) after spincoating and (b) after calcination in a 20% O2/He mixture at
350 °C (2°C/min) for 2 hr. Inset: High resolution image of a calcined cobalt
nanoparticle.
In this section, planar model catalysts on silica TEM grids were prepared by
using preformed cobalt particles with reasonably good size distribution. Large scale
152
Opportunities to study the behaviour of cobalt nanoparticles....
rearrangements seem to occur upon calcination of these preformed catalysts.
Although the preformed cobalt particles described here may not be ideal model
systems, model cobalt catalysts on silica TEM grids are promising in terms of
tracking particle behaviour after treatment at under various gases. An alternative
method of preparing cobalt planar model catalysts samples that can be explored
include spin coating of solutions of cobalt nitrate salts onto the substrate as done by
Saib et al. [10].
7.4 Conclusions and outlook
The purpose of this chapter was to briefly highlight some recent developments that
may be further exploited in future work. In-situ TEM on spherical model catalysts has
high potential to provide information on the reactivity of particles under model FTS
environments. This technique in combination with the Wulff construction can provide
a three dimensional picture of the reactive surface during model FTS conditions.
Furthermore in future, the technique will be able to be used under more relevant
conditions since recent advances have allowed in-situ TEM to be carried out at
1 bar [19].
Cobalt planar model catalysts supported on silica TEM grids provide a way to
study extensively the morphology and structure of cobalt after treatment in model
FTS environments with TEM. An advantage of applying this system is that it is
possible to revisit the same area after treatments. The use of a TEM transfer cell
which enables the transport of the cobalt model catalyst in protected environments is
also possible. It is envisaged that in future, the two techniques will be able to provide
fundamental information on model systems. A few examples of future applications
are given below.
In-situ TEM on model systems:
• Although the effect of promoters on the catalytic FTS activity and reaction
kinetics is easily measured, structural information is not readily obtained. Very
often reduction promoters are present in relatively small amounts and are not
153
Chapter 7
found as crystalline structures, which complicates the structural
characterization. Conventional TEM analysis may not be that useful as it is
often conducted in passivated samples where the promoter may be masked by
an oxidic layer. Furthermore, it may be expected that mobility of promoters
occurs in the reduced state. Insight into the location, state, and function of a
promoter in a reduced state in hydrogen or under model FTS conditions can be
obtained through atomic-resolution in-situ transmission electron microscopy.
Planar model catalysts on silica TEM grids:
• In this thesis it was shown that carbon deposition plays a role in the
deactivation of cobalt-based catalysts. A fundamental understanding of the
interaction of carbon with cobalt nanoparticles can be gained by applying
TEM on planar model catalysts prepared on silica TEM grids that have been
carburised at model FTS conditions.
• Sintering of cobalt has been put forward as a possible deactivation mechanism.
The mobility of particles can be tracked after treatment under relevant gas
atmospheres and temperatures. Particle size distributions obtained in this
manner could be used to elucidate mechanisms of sintering which is extremely
difficult to determine with complex cobalt industrial catalysts. The effect of
reaction conditions on the rate of sintering could also be investigated in this
way.
Acknowledgments
We acknowledge Haldor Topsøe AS (Dr Alfons Molenbroek) for use of their in-situ
TEM facility. Dr Stig Helveg and Dr Fernando Cano are thanked for performing the
in-situ TEM measurements. Dr Grant Forman (Sasol Technology, UK) is
acknowledged for preparing the preformed cobalt nanoparticles. We are grateful to Dr
Peter Thüne and Mrs Prabashini Moodley for the introduction to planar model catalyst
preparation.
154
Opportunities to study the behaviour of cobalt nanoparticles....
7.5 References [1] J. Collings, Mind over matter-The Sasol story: A half-century of technological innovation,
Sasol Ltd, Rosebank, 2002, p. 57. [2] R. Oukaci, A.H. Singleton, J.G. Goodwin Jr., Appl. Catal. A 186 (1999) 129. [3] P.L.J. Gunter, J.W. Niemantsverdriet, F.H. Ribeiro, G.A. Somorjai, Catal. Rev.
39 (1997) 77. [4] A.K. Datye, A.D. Logan, N.J. Long, J. Catal. 109 (1988) 76. [5] F. Enquist, A. Spetz, Thin Solid Films 145 (1986) 99. [6] P. Moodley, J. W. Niemantsverdriet, P.C Thune, Towards the “ideal” iron nanoparticle model
catalyst; in Book of Abstracts, IXth Netherlands' Catalysis & Chemistry Conference, Noordwijkerhout, Netherlands, O71 (2008). p. 135.
[7] E.W. Kuipers, C. Scheper, J.H. Wilson, I.H. Vinkenburg, H. Oosterbeek, J. Catal. 158 (1996) 288.
[8] G.L. Bezemer, J.H. Bitter, H.P.C.E. Kuipers, H. Oosterbeek, J.E. Holewijn, X. Xu, F. Kapteijn, A.J. van Dillen, K.P. de Jong, J. Am. Chem. Soc. 128 (2006) 3956.
[9] A.M. Saib, A. Borgna, J. van de Loosdrecht, P.J. van Berge, J.W. Geus, J.W. Niemantsverdriet, J. Catal. 239 (2006) 326.
[10] A.M. Saib, A. Borgna, J. van de Loosdrecht, P. van Berge, J.W. Niemantsverdriet, J. Phys. Chem. B 110 (2006) 8657.
[11] W. Stöber, A. Fink, E. Bohn, J. Colloid Interface Sci. 26 (1968) 62. [12] S. Helveg, P.L. Hansen, Catal. Today 111 (2006) 68. [13] J. van de Loosdrecht, S. Barradas, E.A. Caricato, N.G. Ngwenya, P.S. Nkwanyana, M.A.S.
Rawat, B.H. Sigwebela, P.J. van Berge, J.L. Visagie, Top. Catal. 26 (2003) 121. [14] T.W. Hansen, J.B. Wagner, P.L. Hansen, S. Dahl, H. Topsøe, C.J.H. Jacobsen, Science 294
(2001) 1508. [15] O. Kitakami, H. Sato, Y. Shimada, F. Sato, M. Tanaka, Phys. Rev. B 56 (1997) 13849. [16] G. Wulff, Z. Kristallogr. 34 (1901) 449. [17] Theoretical calculations by Dr. I. M. Ciobîcã (Sasol Technology). [18] C.B. Murray, S. Sun, W. Gaschler, H. Doyle, T.A. Betley, C.R. Kagan, IBM J. Res. Dev. 45
(2001) 47. [19] J.F. Creemer, S. Helveg, G.H. Hoveling, S. Ullmann, A.M. Molenbroek, P.M. Sarro, H.W.
Zandbergen, Ultramicroscopy 108 (2008) 993.
155

Chapter 7
156
Summary
On the Deactivation of Cobalt-based Fischer-Tropsch Synthesis Catalysts
The catalytic conversion of synthesis gas, derived from natural gas, into liquid
hydrocarbon fuel via the Fischer–Tropsch synthesis (FTS), is currently receiving
much attention due to the demand for environmentally friendly liquid fuel and the
rising costs of crude oil. From an industrial perspective, both cobalt and iron catalysts
have been applied. However, cobalt catalysts are preferred for gas-to-liquid (GTL)
processes as they have high activity for FTS, high selectivity to linear hydrocarbons
and low activity for the water–gas shift (WGS) reaction. As cobalt is relatively
expensive, high catalyst stability is desired. Understanding deactivation is therefore an
important objective in the field of cobalt-based FTS and was the main focus of this
thesis.
In Chapter 3, X-ray adsorption near-edge spectroscopy (XANES) was used to
investigate the role of cobalt aluminate formation on the deactivation of Co/Pt/Al2O3
FTS catalysts. These catalysts, which were protected in a wax layer, were removed at
various intervals from a 100-barrel/day slurry bubble column reactor, operated at
commercially relevant FTS conditions. The amount of cobalt aluminate formed was
small and it appeared that its formation was difficult during realistic FTS conditions.
Using laboratory CSTR runs it was shown that water does seem to enhance aluminate
formation but even at high water partial pressures of 10 bar, ≤10 wt% cobalt
aluminate formed and a reduction was still observed compared to a fresh catalyst. It
was proposed that the cobalt aluminate that formed resulted from existing CoO. The
results obtained led to the conclusion that cobalt aluminate formation does not
significantly influence the deactivation of cobalt-based catalysts during realistic FTS
conditions.
Following this finding, a review (Chapter 4) was undertaken on the topic of
carbon deposition, which was postulated as another potential deactivation mechanism.
Summary
It was clear that the FTS over cobalt-based catalysts occurred in the presence of an
active surface carbidic over layer and in the presence of various hydrocarbon
products. However, the conversion of active surface carbidic carbon to other inactive
forms (for example bulk carbide, polymeric carbon and graphene) over time could
result in deactivation and selectivity loss of the catalyst. Additionally, it is evident that
non-desorbing, heavy hydrocarbon wax could lead to pore plugging and deactivation.
From the available literature and regeneration patents it did seem that deactivation by
carbon deposits is an important deactivation pathway for cobalt-based FTS catalysts
under realistic conditions that warranted further study.
In order to test the hypothesis that carbon deposition was a potential
deactivation mechanism, a study was conducted on Co/Pt/Al2O3 FTS catalysts
covered in a wax layer, taken from a 100-barrel/day slurry bubble column reactor
operated at commercially relevant FTS conditions for an extended period and is
described in Chapter 5. A wax-extraction procedure was developed and applied,
enabling characterization of the catalyst by both surface techniques like X-ray photo-
electron spectroscopy (XPS) as well as bulk techniques such as transmission electron
microscopy (TEM) and temperature programmed (TP) hydrogenation and oxidation.
The carbon deposits on the wax extracted catalysts were studied using TP techniques
and it was found that there was a slow accumulation of a polymeric type of carbon
species on the catalyst during the extended FTS run. This carbon was resistant to
hydrogen treatments at temperatures above that used in realistic FTS. High sensitivity,
low energy ion scattering (HS-LEIS), energy filtered transmission electron
microscopy (EFTEM) and chemisorption analysis of samples containing this resistant
polymeric carbon showed that it was dispersed largely over the support as well as on
the cobalt phase. A large part of the activity of the catalyst could be recovered by
removal of these polymeric carbon deposits and it was thus postulated that these play
a role in deactivation of cobalt-based FTS catalysts in extended runs.
Understanding the factors that contribute toward carbon deposition is an
important step in trying to extend the lifespan of cobalt-based FTS catalysts. In
Chapter 6, the impact of temperature and H2/CO ratio on the build-up of carbonaceous
species on Co/Pt/Al2O3 catalysts was investigated using both model and realistic FTS
tests. The influence of upset conditions on carbon deposition and it subsequent effect
158
Summary
on catalyst structure was also investigated. It was found that both temperature and gas
composition play important roles in determining the amount and reactivity of carbon
deposits on Co/Pt/Al2O3 catalysts. An important factor in determining carbon
deposition was the rate of hydrogenation of active carbon compared to the rate of
transformation to more stable carbon species. The transformation of active carbon to
more stable species occurred faster at higher reaction temperatures and lower H2/CO
ratios. Upset conditions resulted in the production of carbon phases (Co2C,
encapsulating carbons and filaments) that are detrimental to catalyst activity.
Most of the work in the preceding chapters dealt with the study of deactivation
using complex industrial catalysts. Chapter 7 discusses some preliminary results of
new potential techniques that are able to shed light on the reactivity and morphology
of cobalt nanoparticles by using both spherical and planar model catalysts. Spherical
model cobalt catalysts were prepared by supporting cobalt nanoparticles on Stöber
silica spheres. These were then investigated under different gas environments using
in-situ TEM. Secondly, planar model catalysts were prepared by spincoating of
preformed cobalt nanoparticles onto silica TEM grids and imaged after thermal
treatment. Initial results obtained on the two model systems showed that there is a lot
of potential for applying these techniques in future to obtain fundamental information
on the reactivity and structure of cobalt FTS catalysts.
159

Summary
160
Samenvatting
Deaktivering van Kobaltkatalysatoren voor de Fischer-Tropsch Synthese
De katalytische omzetting van synthese gas, gemaakt uit aardgas, in vloeibare
transport brandstoffen door middel van de Fischer-Tropsch Synthese (FTS), krijgt op
dit moment veel aandacht vanwege de vraag naar milieu vriendelijke brandstoffen en
de structureel hoge prijs van ruwe olie. Zowel kobalt als ijzerkatalysatoren worden
industrieel toegepast. Echter, kobalt katalysatoren hebben de voorkeur voor “gas-to-
liquid” (GTL; van gas naar vloeistof) processen vanwege hun hoge aktiviteit hebben
voor FTS, hoge selektiviteit naar lineaire koolwaterstoffen en een lage aktiviteit voor
de water-gas shift (WGS) reaktie. Vanwege de relatief hoge prijs van kobalt is een erg
stabiele katalysator gewenst. Het begrijpen van katalysator deaktivering is daarom een
belangrijk onderwerp voor kobalt katalysatoren voor de FTS en het hoofddoel van dit
proefschrift.
In Hoofdstuk 3 is X-ray adsorption near-edge spectroscopy (XANES)
toegepast om de invloed van de vorming van kobalt aluminaat op de deaktivering van
Co/Pt/Al2O3 FTS katalysatoren te bestuderen. Deze katalysatoren, die door een laagje
was werden bedekt en beschermd, werden gehaald uit een 100 vaten per dag slurrie
fase reaktor, waarin commerciele FTS condities werden toegepast. De hoeveelheid
kobalt aluminaat dat werd gevormd was gering en de vorming van deze fase
gedurende realistische FTS is moeilijk. Er werd ook waargenomen dat extra water,
toegevoegd tijdens laboratorium CSTR tests, de vorming van kobalt aluminaat
versnelt, maar zelfs tijdens tests met 10 bar water werd er minder dan 10 % kobalt
aluminaat gevormd. Vergeleken met de verse katalysator vond er nog steeds reduktie
plaats. Het gevormde kobalt aluminaat kwam waarschijnlijk van het bestaande CoO in
de verse katalysator. De behaalde resultaten hebben geleid tot de conclusie dat de
vorming van kobalt aluminaat geen waarneembare invloed heeft op de deaktivering
van kobalt katalysatoren voor de FTS tijdens realistische condities.
Samenvatting
Hoofdstuk 4 omvat een literatuur overzicht over de invloed van
koolstofvorming op de deaktivering van kobaltkatalysatoren. Het is duidelijk dat
gedurende FTS met kobalt katalysatoren er aktieve koolstof en koolwaterstoffen op
het oppervlak aanwezig moeten zijn om de FTS reaktie uit te voeren. Echter, de
omzetting van aktieve koolstof op het kobalt oppervlak in andere niet-aktieve koolstof
vormen (bijvoorbeeld polymerische koolstof en grafiet) zou tot deaktivering en
selectiviteitveranderingen kunnen leiden. Verder zouden erg lange koolwaterstoffen
kunnen leiden tot het blokkeren van porien en dus deaktivering. Uit de open literatuur
en uit octrooien blijkt dat koolstofvorming een belangrijk deaktiverings mechanisme
zou kunnen zijn voor kobaltkatalysatoren in de FTS, waarnaar meer onderzoek
gedaan zou moeten worden.
Om de hypothese te testen dat koolstof vorming de katalysator deaktiveert
(Hoofdstuk 5), werden gebruikte Co/Pt/Al2O3 FTS katalysatoren bestudeerd die uit
een 100 vaten per dag slurrie fase reaktor gehaald werden. FTS werd in deze reaktor
uitgevoerd onder industrieel relevante condities voor langdurige periodes. Een
extraktie procedure werd ontwikkeld om de overtollige was (“wax”) te verwijderen,
waarna de karakterizering van de katalysator kan worden uitgevoerd met oppervlakte
gevoelige technieken zoals X-ray photo-electron spectroscopy (XPS) en ook met
“bulk” technieken zoals transmission electron microscopy (TEM) en temperatuur
geprogrammeerde (TP) hydrogenering and oxidatie. De gevormde koolstof op de
geextraheerde katalysator werd bestudeerd met de TP technieken en het was duidelijk
dat er een langzame toename was van polymere koolstof op de katalysator tijdens
lange FTS tests. Deze koolstof was stabiel tijdens waterstofbehandelingen bij
temperaturen hoger dan de gebruikelijke temperaturen tijdens FTS. Waterstof
chemisorptie, high sensitivity, low energy ion scattering (HS-LEIS), en energy
filtered transmission electron microscopy (EFTEM) analyses aan deze katalysatoren
met stabiele polymere koolstof laten zien dat de koolstof was verdeeld over zowel de
drager als de aktieve kobalt fase. Een groot gedeelte van de katalysator aktiviteit werd
hersteld door het verwijderen van deze polymerische koolstof. Op grond hiervan is
gepostuleerd dat deze polymerische koolstof een belangrijke rol speelt in de
deaktivering van kobaltkatalysatoren tijdens langdurige FTS tests.
162
Samenvatting
Het begrijpen van de faktoren die een rol spelen tijdens koolstofvorming
(Hoofdstuk 6) is belangrijk met betrekking tot het verlengen van de tijd dat kobalt
katalysatoren gebruikt kunnen worden in de FTS. De invloed van temperatuur en de
H2/CO verhouding op de vorming van koolstof verbindingen op de Co/Pt/Al2O3
katalysatoren werd bestudeerd door middel van model FTS reakties en realistische
FTS tests. De invloed van “upset” condities op de koolstof vorming en de katalysator
struktuur werd ook bestudeerd. Het was duidelijk dat zowel de temperatuur als de
gassamenstelling belangrijk zijn voor de hoeveelheid en het type koolstof dat wordt
gevorm op Co/Pt/Al2O3 katalysatoren. Een belangrijke parameter is de snelheid van
de hydrogenering van aktieve koolstof in verhouding tot de snelheid van de omzetting
van aktieve tot niet-aktieve koolstof. De omzetting van aktieve koolstof in meer
stabiele koolstof gebeurt sneller bij hogere temperaturen en lagere H2/CO
verhoudingen. “Upset” condities zorgen voor de vorming van koolstoffases (Co2C,
koolstof dat de aktieve fase bedekt en filamenten) die de katalysator deaktiveren.
Het werk beschreven in de vorige hoofstukken gaat over complexe, industriële
katalysatoren. In Hoofdstuk 7 worden de eerste resultaten besproken die behaald zijn
met nieuwe technieken gemeten aan zowel spherische als vlakke model katalysatoren.
Deze resultaten kunnen mogelijk duidelijkheid verschaffen over de reaktivitiet en de
morfologie van kobalt nanodeeltjes. Allereerts werden spherische kobalt model
katalysatoren bereidt door het afzetten van kobalt nanodeeltjes op Stöber silica bollen.
Deze katalysatoren werden bestudeerd onder varierende gas samenstellingen door
middel van een in-situ TEM. Vervolgens werden vlakke model katalysatoren bereidt
door middel van spincoating van voorgevormde kobalt nanodeeltjes op silica TEM
grids en bestudeerd na thermische behandelingen. De eerste resultaten op beide model
systemen laten zien dat er veel mogelijkheden zijn om deze technieken in de toekomst
toe te passen om fundamentele informatie te krijgen over de reaktiviteit en struktuur
van kobalt FTS katalysatoren.
163

Samenvatting
164
Acknowledgments The completion of this thesis and the enjoyable stay that I had in Eindhoven over the last three and a half years would not have been possible without the contribution of many people and it is my pleasure to thank them here.
At the outset I would like to thank my employer, Sasol Technology and especially my group leader at the time, Peter van Berge for offering me the opportunity to come to the Netherlands. Thank you, Philip Gibson, my departmental manager, for ensuring that we were well taken care of and for your regular visits. I am indebted to Jan van de Loosdrecht, who fulfilled a dual role as my co-promoter and line manager for most of my stay, for his scientific input, sound leadership and for allowing me the necessary freedom in the project. I extend my sincere gratitude to Hans Niemantsverdriet, my promoter, for his guidance and hospitality during our stay in Eindhoven. Hans, I especially appreciate the time you took when we first arrived, to teach us about some fundamental concepts of catalysis. Your tips on scientific presentations also helped to secure a presentation award at NCCC 2008!
I was fortunate to have many research collaborations during the course of this project. I wish to express my gratitude to Abhaya Datye of the University of New Mexico for the EFTEM work and useful discussions. Alfons Molenbroek and Stig Helveg of Haldor Topsøe AS are thanked for their collaboration on in-situ TEM. Stig, your enthusiasm behind the microscope was certainly an inspiration. I also enjoyed the evenings out in Lyngby. My thanks also go to Hidde Brongersma of Calipso BV for the HS-LEIS measurements and insightful discussions on the application of the technique to real catalysts. Grant Forman (Sasol Technology, UK) is thanked for collaboration on cobalt nanoparticles and chats on cobalt FT catalysis in general. I would also like to thank the members of my group and colleagues in Sasolburg, for all their input.
To my friend and predecessor Abdool Saib, thank you for your assistance during the project handover, especially for introducing me to X-ray absorption spectroscopy and for the good company during work visits to Italy, Denmark and Scotland. Thanks also for your useful comments on most of the chapters in this thesis. Thank you, Thehzeeb for all the favours and also for your hospitality during my visits
Acknowledgments
to Sasolburg. Thanks to Ionel, Sorinela and Ana Ciobîcã for your friendship and for the wonderful Romanian dinners we enjoyed. Ionel, I really appreciate the time you took discussing fundamental aspects of catalysis and helping me with the theoretical work and drawings. Bruce Anderson (Big guy) thanks for your input both while you were at Eindhoven and Sasolburg (facilitating the LEIS work) and for the entertaining evening we had with you and Michelle in Nuenen.
I thank Sanne Wijnans for the wax extraction and XPS work she did in her graduation project and for transferring her knowledge. Thank you, Tiny Verhoeven (de Twaalfde Man) for your expert technical assistance, especially with XPS and TP and the great help you provided during the two visits to Synchrotron Trieste. We also enjoyed some moments of “high tension” in front of the TEM. Peter Thüne is thanked for useful discussions on model catalysts, XPS and for performing TEM measurements. I thank Thérèse-Anne for all her organisational and administrative tasks and for the pleasant conversations. Emiel Hensen and Christian Müller are thanked for the use of their labs.
Dilip, (Mate) you are the most “interesting” Indian guy I ever met. Your love for the Aussie cricket team and heavy metal music really confounded me. Thank you for the many memories (watching the 2007/08 Champions league final stands out) and for introducing me to the TP equipment. Neelesh, I will always remember that you were the first person who made an effort to befriend us. I enjoyed your company. Soon, you’ll be a married man and I hope your wife will be able to convince you to eat spicy food. Thank you to my Albanian colleague, Adelaida Andoni (happy Ad), for your close friendship and also for ensuring that we had some excitement in Turku. Ad, I haven’t met a person who was as perseverant and well-prepared as you. Success with the defence! Han Wei, my Chinese friend, I enjoyed your company at many events like the stick dance, braai and the Asian cook-out. Thanks most of all for cycling back on the tandem–bike with Prabashini from Nederwetten! I thank Davy Nieskens, who was my roommate in STW 3.59 for six months, for the pleasant company and interesting conversations and Emiel van Kimmenade for his friendship and eagerness to help. Vijay (Mr. Ruthenium), it was nice to know you and talk about catalysis to you. I hope that you have a lot of success in your project and of course lots of publications! Akhtar, you were a friendly colleague and I wish you well with your modelling work. Maarten (nearest neighbour, with many questions) and Freek (who always seemed to be in an excited state), you gave us company during our first trip on a night train. Best wishes to you both with the DFT calculations and surface science experiments. Gilbère, thanks for your company and willingness to help,
166

Acknowledgments
especially with the new XPS machine. Best wishes with your project. Ash and Greg, thanks for the lovely dinners, entertaining evenings with Suhina and for the nice chats that made us reminisce about SA. Best wishes to both of you with the writing-up.
I’d like to thank all my friends and colleagues, past and present in SKA for their company or assistance at one time or another. Thanks to Dani, Ben, Michel, Pieter vG, Luis, Robert, Pijus, Ramesh, Srilakshmi, Volkan, Alessandro, Arjan, Wout, Elize, Marianne, Marion, Yejun, Jie, Sami, Farid, Svetlana, Sander, Noor, Dianna, Merijn, Van-Anh, Ton, Evgeny, Ojwang, Sharan, Kaushik, Subu, Brahim, Pieter M., Gabriella, Ramona, Thijs, Jos, Michèle, Gijsbert, Lianne, Laura, Leandra, Bart, Patrick, Jarno, Jarl Ivar, Barry, Paul, Marcel, Bert and Katharina.
I thank all the members of my church family at IBC Eindhoven for their warm fellowship and friendship during our time there. I express my gratitude to Sadesh Sookraj, Holger Friedrich and Abdool Saib who encouraged me to continue with my studies in chemistry. I am grateful to all my family members and my in-laws, Ronnie and Rose for their moral support and assistance. I acknowledge the support of Freddy Narainsamy, Lily Gengan and my grandmother, people dear to me who passed on while we were in Eindhoven. I especially thank my sister, Camy and my parents, Ronnie and Savy for their encouragement and support. Mum and Dad, I would have never got this far without your influence. I dedicate this book to you.
Last, but by no means least, I must reserve thanks for my lovely wife, Prabashini, who had to make sacrifices to go on this adventure with me. I am glad that we could share so many new experiences together. Thank you also, for your love and support which has carried me through all the difficult times. It was exciting to watch your project progress and see how you turned something “small” into something of substance. All the best with wrapping up your thesis!
Eindhoven, Fall 2008
167

Acknowledgments
168
List of Publications D.J. Moodley, C. van Schalkwyk, A. Spamer, J.M. Botha, A.K. Datye, Appl. Catal. A 318 (2007) 157. D.J. Moodley, J. van de Loosdrecht, A.M. Saib, M.J. Overett, A.K. Datye, J. W (Hans) Niemantsverdriet, “Carbon deposition as a deactivation mechanism of cobalt-based Fischer-Tropsch synthesis catalysts under realistic conditions”, Submitted to Appl. Catal A (2008). D.J. Moodley, J. van de Loosdrecht, A.M. Saib, J. W (Hans) Niemantsverdriet, The Formation and influence of carbon of cobalt based Fischer-Tropsch Synthesis catalysts: An integrated review, Prepr. Pap.-Am. Chem. Soc., Div. Pet. Chem. 53 (2) (2008) 122. D.J. Moodley, J. van de Loosdrecht, A.M. Saib, J. W (Hans) Niemantsverdriet, The Formation and influence of carbon of cobalt based Fischer-Tropsch Synthesis catalysts: An integrated review, submitted for publication in B.H. Davis, M.L. Occelli (Eds.), Advances in Fisher Tropsch Synthesis, Catalysts and Catalysis, CRC, 2008. D.J. Moodley, A.M. Saib, J. van de Loosdrecht, J. W (Hans) Niemantsverdriet, The impact of cobalt aluminate formation on the deactivation of cobalt-based Fischer-Tropsch synthesis catalysts, to be submitted to Applied Catal. A (2008).

170
Curriculum Vitae
Denzil James Moodley was born in Port Shepstone, a small town on the east coast of
South Africa on March 12, 1977. After he finished high school in his home town in
1994, he started his tertiary studies at the University of Natal, Durban in the School of
Pure and Applied Chemistry. He was introduced to the field of catalysis during his
BSc (Hons) project which involved the study of alcohol oxidation using supported
ruthenium catalysts.
Upon graduation with a BSc Hons (Chemistry) degree he began working for Sasol
Technology R&D in South Africa, where he was involved in hydrocarbon
transformation research utilizing Fischer-Tropsch derived feed streams. Here, he
worked on projects involving heterogeneous olefin metathesis and alcohol
dehydration. During this time he completed his MSc Chemistry degree (cum laude) at
the Potchefstroom University for Christian Higher Education under the supervision of
Prof. Manie Vosloo with a thesis entitled “The metathesis activity and deactivation of
heterogeneous metal oxide catalytic systems”.
He then moved to the Fischer-Tropsch catalysis group at Sasol Technology R&D in
2004, where he was involved in the study of cobalt-based catalysts. In June 2005, he
was seconded to Eindhoven University of Technology to the group of Prof. Dr. Hans
Niemantsverdriet. His research here mainly involved aspects of deactivation of
cobalt-based Fischer-Tropsch synthesis catalysts. The most important results of the
research are described in this thesis.
171


