

OPTIMIZING YOUR SPRAY SYSTEM
A GUIDE TO MAXIMIZING SPRAY
PERFORMANCE AND REDUCING
OPERATING COSTS

Spray systems are often perceived as pretty simple. After all, what’s so complicated about pumps, piping, liquid and spray nozzles? As long as the nozzles are spraying, the system is working properly, right? Unfortunately, that’s often not true.
Spray nozzles are precision components designed to yield very specific performance under very specific conditions. Just because a nozzle is spraying doesn’t mean that your spray system performance is optimal. Many factors can impact the results of your spraying system.
To achieve long-term, efficient, optimal performance and keep operating costs as low as possible, you need to consider your spray system in its entirety and develop a plan for evaluating, monitoring and maintaining it. If you don’t already have a spray system optimization program in place, you could be wasting significant amounts of chemicals, water, energy and time and risking process and product quality – without even knowing it.
This handbook is a compilation of the knowledge we’ve acquired through more than 75 years of helping users solve spray application problems. Our experience reaches into more than 200 different industries and has resulted in the development of tens of thousands of spray nozzles, automated spray systems and fabricated spray products such as injectors, lances and manifolds. As the global leader in spray technology, we want to provide an educational guide to help you maximize the performance of your spray system. If you need additional information, please contact us.
Visit spray.com for more information or to contact your local sales engineer.
I N T R O D U C T I O N
OPTIMIZING YOUR SPRAY SYSTEM
2 spray.com | 1.800.95.SPRAY | Intl. Tel: 1.630.665.5000

TABLE OF CONTENTS
SECTION I Why Optimize Your Spray System? 4
SECTION II Getting Started With Spray Optimization 7
SECTION III Strategies For Spray System Optimization 8
SECTION IV Spray Control: Does It Make Sense For My Operation? 12
SECTION V Nozzle Maintenance And Replacement 13
SECTION VI When To Consider Spray Performance Testing And Modeling 22
SECTION VII Technical Reference Appendix – Spray System Basics 24
3spray.com | 1.800.95.SPRAY | Intl. Tel: 1.630.665.5000

THERE ARE MANY BENEFITS OF AN OPTIMIZED SPRAY SYSTEM:
• Improved product/process quality
• Trouble-free operation – no unscheduled downtime
• Low, consistent operating costs
• Minimal waste
• Minimal environmental impact
To demonstrate the value of optimizing spray system performance, here are just a few examples that illustrate how costly it can be to assume your spray system is performing as well as it could.
CASE 1: POOR SPRAY SYSTEM PERFORMANCE RESULTED IN MONTHLY REWORK OF 80,000 POUNDS (36,287 KG) OF ALUMINUM STRIP
Inconsistent application of oil on aluminum strip resulted in a high rejection rate of finished coils. Spray system optimization involved adding a spray controller and changing the nozzle type, to ensure that oil is applied uniformly and evenly across the full width of the strip even when line speed varies. Rework has been eliminated and other benefits experienced as well.
• Accurate application reduced oil consumption by 40% – a significant cost savings and beneficial to the environment
• The elimination of excess oil in the production area resulted in shorter maintenance times
• Production time has increased since strip rework is no longer required
• System payback was fast – less than four months
4 spray.com | 1.800.95.SPRAY | Intl. Tel: 1.630.665.5000
SECTION I WHY OPTIMIZE YOUR SPRAY SYSTEM?

CASE 2: USE OF SLIGHTLY WORN SPRAY NOZZLES WASTED 57,000 GALLONS (216 KL) PER HOUR IN MEAT PLANT
Worn nozzles spray over capacity. And, because it is difficult to visually detect nozzle wear, many processors don’t realize how much waste occurs when worn nozzles are used. One meat processor was shocked at the cost of using worn nozzles in its facility.
• An audit of 14 operations in the plant determined an extra 57,000 gallons (216 kl) per hour were used due to worn nozzles
• Cost of wasted water based on US$0.005 (€0.0038) per gallon for water and disposal = US$285 (€214) per hour
• One, eight-hour shift per day = US$2,280 (€1,710) per day
• Five days a week, 50 weeks per year: US$570,000 (€427,500) per year
Spray system optimization involved replacing worn nozzles and establishing a routine nozzle maintenance program. Keep in mind this example only shows the cost of wasted water. The cost of wasted energy and wastewater disposal is not included. When these other factors are included, the waste costs may increase an additional 20% to 30%.
CASE 3: OVER-APPLICATION OF RELEASE AGENT BY SPRAY SYSTEM COSTS CHEMICAL PRODUCER US$50,000 (€37,500) ANNUALLY
An expensive release agent was being applied to a conveyor belt to prevent products from sticking. The inability to control flow based on line speed resulted in a messy and unsafe work environment which required frequent maintenance. Spray system optimization included adding a spray controller and yielded dramatic results.
• Reduced release agent use and elimination of contract cleaning services save the processor US$50,000 (€37,500) annually
• The new spray equipment paid for itself in less than two months
FOR MORE DETAIL ON THESE CASES and to see additional examples, visit spray.com/results.
5spray.com | 1.800.95.SPRAY | Intl. Tel: 1.630.665.5000
WHY OPTIMIZE YOUR SPRAY SYSTEM? SECTION I
THE VALUE OF SPRAY OPTIMIZATION
Every spray application is different and the benefits of spray optimization can range from a few thousand dollars to hundreds of thousands of dollars. It is impossible to predict the exact value of a spray optimization program without analyzing the operation. However, reviewing the list that follows may help you gauge the value of spray optimization in your operation. If you answer “yes” to even a few of these questions, a spray optimization program will likely provide significant gains in your operation.
Does the spray system use significant amounts of water, expensive chemicals and energy?
o YES o NO
Are products rejected due to uneven cooling or coating or inconsistent cleaning?
o YES o NO
Do manufacturing costs increase significantly as a result of quality issues?
o YES o NO
Can throughput be increased or quality improved by maintaining spray performance when process conditions, such as line speed, change?
o YES o NO
Are workers frequently required to monitor, adjust or change the configuration of the spray system between batches?
o YES o NO
Does spray system maintenance cause unscheduled downtime?
o YES o NO
Is maintenance time-consuming due to overspray or misting from the spray system?
o YES o NO
Are health hazards, such as inhaling chemicals or slippery work areas due to misting, a concern?
o YES o NO
Are chemical or wastewater disposal costs high?
o YES o NO
Are fines possible as a result of not meeting environmental regulations?
o YES o NO
As noted earlier, spray optimization can yield many benefits: lower operating costs, improved quality, reduced labor and maintenance, improved worker safety and more. In most cases, the payback on a spray optimization program is significant and swift.
If you have an existing spray system, optimization may be achieved by:
• Improving and/or monitoring maintenance procedures
• Upgrading to more advanced nozzle types or more wear-resistant materials
• Adding a spray controller
If you are specifying a new spray system, optimization is best achieved by working with an experienced spray technology provider with a wide product range. Different types of spray nozzles can deliver similar performance and an expert can guide you to the best option for your operation.
WHY NOT GET STARTED TODAY? The sections that follow can help guide you through the spray system optimization process.
6 spray.com | 1.800.95.SPRAY | Intl. Tel: 1.630.665.5000
SECTION I WHY OPTIMIZE YOUR SPRAY SYSTEM?

THE FIRST STEP TO SPRAY SYSTEM OPTIMIZATION IS TO EVALUATE YOUR CURRENT SPRAY SYSTEM OR SET REQUIREMENTS FOR A NEW SYSTEM
Begin with establishing goals and desired improvements for your spray system. These goals should be as specific as possible. Here are a few examples:
• Reduce water and chemical use
• Reduce scrap due to spray system performance
• Increase throughput by reducing time for batch changes
• Reduce spray system maintenance time
• Extend production runs before spray system maintenance is required
• Automate spray operations so workers can be deployed to other tasks
Keep the performance goals you’ve set for your spray system in mind as you read through the balance of this handbook. You’ll learn about the basic operating principles of spray nozzles and the factors that impact their performance in the sections ahead. Understanding these principles will help you optimize your own spray system to meet your goals.
SPRAY SYSTEM CONSIDERATIONS
Spray pattern required – full cone, hollow cone, flat spray or solid stream
Flow rate/application rate
Spray angle and spray coverage required
Properties of the liquid to be sprayed – specific gravity, viscosity, temperature and surface tension all affect spray quality
Liquid quality/level of contaminants
Pressure drop through spray system
Drop size
Velocity and impact required
Spray system operation – continuous or intermittent
Process conditions – constant or variable
7spray.com | 1.800.95.SPRAY | Intl. Tel: 1.630.665.5000
GETTING STARTED WITH SPRAY OPTIMIZATION SECTION II

SPRAY OPTIMIZATION GUIDELINES
Here are some guidelines to help ensure you are getting the best performance possible from your spray system. For basic guidelines on nozzle selection, see Choosing the Correct Nozzles, page 24 in the Technical Reference Appendix.
CONFIRM THAT YOU ARE USING THE BEST NOZZLES AVAILABLE FOR YOUR OPERATION
If you’ve been using the same nozzles for a few years or more, find out if there are newer versions available. Even if you aren’t experiencing problems, you may find new nozzle designs are available that offer more precision, better efficiency and longer wear life. Precision spray control and anti-bearding nozzle designs are two recent advancements in spray technology that can optimize performance in many applications. See Advanced Spray Technology page 11.
You should also explore the following options:
• Clog-resistant designs to minimize performance problems and unscheduled downtime
• Quick-connect styles to reduce maintenance time
• Alternate nozzle materials to extend wear life
Remember, the nozzle is the heart of your spray operation. Verifying nozzle selection is the best investment you can make in your spray system.
CONSIDER THE VALUE OF SPRAY CONTROL
Automating some or all aspects of your spray system by using a spray controller will add precision to many operations. Spray control options range from very simple systems that provide on/off control and automatic air and liquid control to sophisticated systems that provide real-time monitoring of spray performance and automatic adjustments.
It is important to understand what benefits you may gain from spray control and evaluate the options available. Spray control may sound costly but most users find the added expense is offset very quickly by increased production, reduced scrap rate, decreased operating costs and more.
See Section IV for more information about spray control options and how to determine the value in your operation.
ESTABLISH A ROUTINE NOZZLE MAINTENANCE PROGRAM
Neglecting spray nozzles can cost you thousands of dollars, if not hundreds of thousands, annually. Even worse, most people don’t realize that quality problems and rising operating costs are often due to using worn spray nozzles.
Spray nozzles, like any precision component, will wear with use and performance will decline. Visual detection of nozzle wear is nearly impossible unless the wear is very significant. A quick spot check to see if nozzles are spraying won’t reveal the problem. See Section V for more information about how to identify worn nozzles, the potential cost ramifications of using worn nozzles and guidelines for establishing an ongoing maintenance program.
8 spray.com | 1.800.95.SPRAY | Intl. Tel: 1.630.665.5000
SECTION III STRATEGIES FOR SPRAY SYSTEM OPTIMIZATION

EVALUATE ALL THE COMPONENTS IN YOUR SPRAY SYSTEM
While nozzles are the most critical components in your spray system, other equipment can impact how they perform.
PUMPS
Choosing the correct pump for the system is the first step. The efficiency of the pump will affect pipe and valve size and the downstream equipment required. Remember, pumps provide flow, not pressure. Pressure is the result of restriction of flow.
For high pressure operation:
• Positive displacement style pumps are typically used. Every rotation provides a fixed flow rate regardless of downstream constriction. Pressure increases when flow is restricted
• Over-pressurized conditions can occur when nozzles or strainers are clogged or valves are closed. A safety valve that lowers pressure is required when using positive displacement pumps
For low pressure operation:
• Centrifugal pumps are typically used. Vanes spin the fluid and velocity is increased as the pump casing restricts flow
• System pressure is adjusted by restricting flow
PIPING AND VALVES
Improperly sized piping and valves are common causes of spray nozzle performance problems. Here are key factors to consider when setting up or troubleshooting your system:
• Is the system flow at the nozzle adequate? Typically, system flow should be two to three times the desired nozzle flow rate
• Is pressure at the nozzle adequate? Friction, pipe length, valves, elbows and the distance between the pump and nozzle can all result in pressure loss. Refer to page 30 for more information about pressure drop
• Is fluid velocity in the pipe greater than 12 ft./sec. (3.7 m/sec.)? If so, turbulence, noise, vibration and losses could interfere with nozzle performance
• Be mindful of the specific gravity of the fluid. More pressure will be required for solutions heavier than water to achieve comparable flow rates
FILTRATION
The lack of proper filtration is a very common problem and can wreak havoc with any spray system. Fluid should be filtered prior to pump inlets. It is important to remember that the nozzle orifice will be the smallest restriction in your system so you need to use a strainer sized to prevent nozzle clogging. Filters and strainers, of course, need to be cleaned on a regular basis.
9spray.com | 1.800.95.SPRAY | Intl. Tel: 1.630.665.5000
STRATEGIES FOR SPRAY SYSTEM OPTIMIZATION SECTION III

MONITORING
System monitoring will enable quick detection and resolution of problems. Gauge placement is critical.
• Gauges should be placed as close to the nozzles as possible and no less than 10 inside pipe diameters from elbows, valve outlets, tees or other turbulent areas
• Measurements should be within the middle 2/3 of the gauge for best accuracy
• Use of a gauge snubber to reduce pressure vibrations and steady the needle is recommended
• Flow meter placement guidelines are the same as gauge placement guidelines. Be sure to use a flow meter sized for your system and consider using non-intrusive meters for fluids with debris or solids
USE ADVANCED MODELING AND TESTING IN CRITICAL SPRAY OPERATIONS
In some applications, it is prudent to invest in computer modeling and performance testing because of the critical nature of the spray operation. In applications like spray drying, tablet coating, gas cooling and descaling steel, factors such as drop size, evaporation rate and impact can be the difference between application success and failure.
In some cases, operating conditions can be simulated in a laboratory environment so performance testing can be conducted. In other cases, replicating operating conditions isn’t possible, so computer modeling is required.
More information on spray testing and advanced modeling can be found in Section VI.
ASK YOUR SPRAY EQUIPMENT MANUFACTURER for recommendations on the placement of system components and required accessories.
10 spray.com | 1.800.95.SPRAY | Intl. Tel: 1.630.665.5000
SECTION III STRATEGIES FOR SPRAY SYSTEM OPTIMIZATION
ADVANCED SPRAY TECHNOLOGY
New developments in spray technology occur on a steady basis and are typically driven by manufacturers looking to improve process efficiency and product quality. Two of the more notable advancements are precision spray control and anti-bearding nozzle designs.
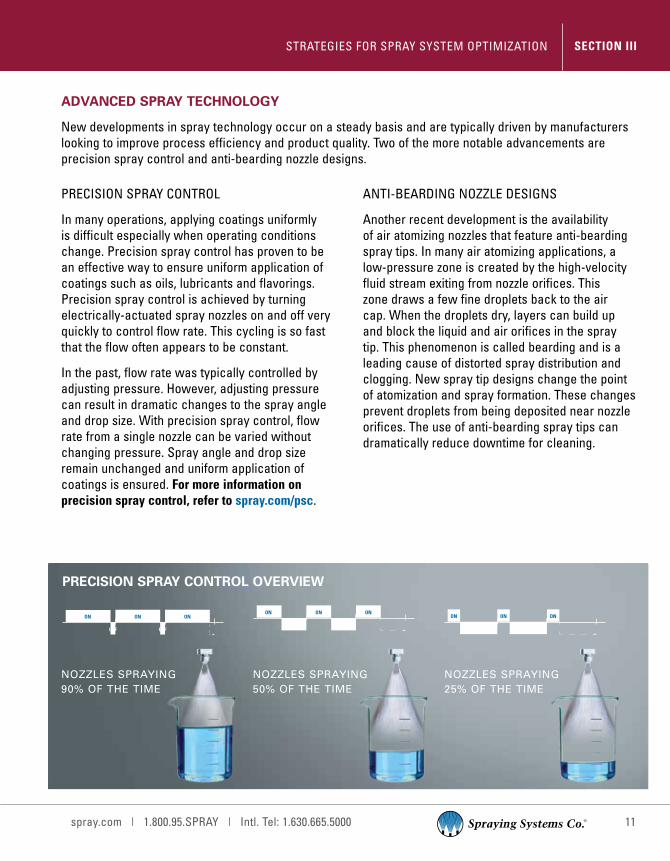
PRECISION SPRAY CONTROL
In many operations, applying coatings uniformly is difficult especially when operating conditions change. Precision spray control has proven to be an effective way to ensure uniform application of coatings such as oils, lubricants and flavorings. Precision spray control is achieved by turning electrically-actuated spray nozzles on and off very quickly to control flow rate. This cycling is so fast that the flow often appears to be constant.
In the past, flow rate was typically controlled by adjusting pressure. However, adjusting pressure can result in dramatic changes to the spray angle and drop size. With precision spray control, flow rate from a single nozzle can be varied without changing pressure. Spray angle and drop size remain unchanged and uniform application of coatings is ensured. For more information on precision spray control, refer to spray.com/psc.
ANTI-BEARDING NOZZLE DESIGNS
Another recent development is the availability of air atomizing nozzles that feature anti-bearding spray tips. In many air atomizing applications, a low-pressure zone is created by the high-velocity fluid stream exiting from nozzle orifices. This zone draws a few fine droplets back to the air cap. When the droplets dry, layers can build up and block the liquid and air orifices in the spray tip. This phenomenon is called bearding and is a leading cause of distorted spray distribution and clogging. New spray tip designs change the point of atomization and spray formation. These changes prevent droplets from being deposited near nozzle orifices. The use of anti-bearding spray tips can dramatically reduce downtime for cleaning.
NOZZLES SPRAYING 90% OF THE TIME
NOZZLES SPRAYING 50% OF THE TIME
NOZZLES SPRAYING 25% OF THE TIME
PRECISION SPRAY CONTROL OVERVIEW
11spray.com | 1.800.95.SPRAY | Intl. Tel: 1.630.665.5000
STRATEGIES FOR SPRAY SYSTEM OPTIMIZATION SECTION III

AUTOMATING YOUR SPRAY SYSTEM CAN RESULT IN PRODUCTIVITY GAINS, QUALITY IMPROVEMENTS AND OPERATING COST REDUCTIONS
In many operations, the payback is quick, ranging from a few weeks up to one year. Spray control isn’t needed in every spray operation. For example, adding spray control to a simple cooling or washing operation may have limited value. In other operations like coating, lubricating, moisturizing and humidifying, spray control can improve product or process quality and help save tens of thousands of dollars annually.
A careful evaluation of your operation can help you determine how much you can benefit from spray control.
If your operation requires any of the following, the value of spray control is likely to be quite high:
• Consistent, uniform coverage of the target
• Precise spray placement on the target
• Intermittent spraying
• The use of costly coatings or chemicals
• Flexibility – the ability to adjust spray performance based on line speed, temperature, humidity or product changes
• Monitoring and supervision to ensure proper spray performance
• Frequent maintenance
REQUEST AN ON-SITE EVALUATION The best way to determine the potential benefits of spray control is to request an on-site evaluation from a spray technology expert. Every spray operation is different and having an expert assess your application and help you estimate the equipment payback is the most expedient and accurate approach. The leading spray technology suppliers typically do not charge for on-site evaluations.
12 spray.com | 1.800.95.SPRAY | Intl. Tel: 1.630.665.5000
SECTION IV SPRAY CONTROL: DOES IT MAKE SENSE FOR MY OPERATION?

THE COSTS ASSOCIATED WITH USING WORN NOZZLES CAN BE STAGGERING
Spray nozzles, like all precision components, will wear over time with use. As the nozzle orifices wear, the flow rate of the nozzle will gradually increase. When a nozzle sprays over its rated capacity, pump performance is affected. In addition, quality problems often occur and water, chemicals and energy are wasted. The costs associated with using worn nozzles can be significant even when just water is sprayed, as shown in Table 3.
Based on a five-day work week, 24 hours per day. The cost of wastewater disposal should also be considered. In addition, excessive wastewater may aggravate water shortage problems. All figures calculated with a conversion factor of 1USD = €0.75.
HERE’S AN EXAMPLE OF HOW WASTE INCREASES WHEN CHEMICALS AND WATER ARE USED.With a system flow of 100 gpm (379 lpm), using nozzles that spray 15% over the rated capacity costs US$182,800 (€137,100).*
* Water cost: US$2.75/1000 gallons (€2.06/3,785 l) | Chemical cost: US$1.00/gallon (€0.75/3.8 l) | Dilution ratio: 10:1 2,080 hours of operation/annually. Increased electricity cost, scrap and downtime due to quality problems not included.
$150,000 (€112,500)
$140,000 (€105,000)
$130,000 (€97,500)
$120,000 (€90,000)
$110,000 (€82,500)
$100,000 (€75,000)
$90,000 (€67,500)
$80,000 (€60,000)
$70,000 (€52,500)
$60,000 (€45,000)
$50,000 (€37,500)
$40,000 (€30,000)
$30,000 (€22,500)
$20,000 (€15,000)
$10,000 (€7,500)
0
TABLE 3 – ANNUAL COST OF WASTED WATER USING NOZZLES SPRAYING 15% OVER CAPACITY
280,000 gal (1,120,000 l)
561,600 gal (2,250,000 l)
2,808,000 gal (11,230,000 l)
28,080,000 gal (112,300,000 l)
5 (20) 10 (40) 50 (200) 100 (400) 500 (2000)
TOTAL SYSTEM FLOW IN GPM (LPM)
5,616,000 gal (22,460,000 l)
13spray.com | 1.800.95.SPRAY | Intl. Tel: 1.630.665.5000
NOZZLE MAINTENANCE AND REPLACEMENT SECTION V

EROSION/WEAR
Gradual removal of the nozzle material causes the nozzle orifice and internal flow passages to enlarge and/or become distorted. As a result, flow is usually increased, pressure may be decreased, pattern becomes irregular and the spray drops become larger.
CORROSION
Nozzle material may break down due to the chemical action of the sprayed material or environment. The effect is similar to that caused by erosion and wear, with possible additional damage to the outside surfaces of the nozzle. In particular, the performance of air atomizing nozzles is highly sensitive to corrosion. Even small amounts of corrosion will negatively impact drop size and uniformity.
HIGH TEMPERATURE
Certain liquids must be sprayed at elevated temperatures or in high temperature environments. The nozzle may soften and break down unless special, high temperature resistant materials are used.
Please note: Photographs of worn or damaged nozzles illustrate extreme conditions of neglect. Nozzle problems should never be allowed to reach this stage.
CAUSES OF POOR SPRAY NOZZLE PERFORMANCE
It is important to understand what causes poor nozzle performance, so you can determine if changes are possible in your application to slow the process. The seven leading causes of nozzle wear and performance problems follow:
New
Worn
New
Corroded
New
Heat Damaged
14 spray.com | 1.800.95.SPRAY | Intl. Tel: 1.630.665.5000
SECTION V NOZZLE MAINTENANCE AND REPLACEMENT

CAKING/BEARDING
Build-up of material on the inside or outer edges of the orifice can occur and is caused by liquid evaporation. A layer of dried solids remains and obstructs the orifice or internal flow passages. Bearding, the build-up of materials near the orifice of the nozzle, is also detrimental to nozzle performance and can have serious consequences in some nozzle types such as air atomizing.
ACCIDENTAL DAMAGE
Damage to an orifice or nozzle can occur by inadvertently scratching when improper cleaning tools are used. Nozzles are also frequently damaged when dropped during installation or operation.
CLOGGING
Unwanted solid particles can block the inside of the orifice. Flow is restricted and spray pattern uniformity disturbed.
IMPROPER ASSEMBLY
Some nozzles require careful reassembly after cleaning so that internal components, such as gaskets, O-rings and internal vanes, are properly aligned. Improper positioning may result in leakage and inefficient spray performance. Over-tightening of nozzle caps onto bodies can cause thread stripping.
New
Caked
New
Damaged
Unclogged Spray
Clogged Spray
Proper Assembly
Improper Assembly
15spray.com | 1.800.95.SPRAY | Intl. Tel: 1.630.665.5000
NOZZLE MAINTENANCE AND REPLACEMENT SECTION V

DETECTING NOZZLE WEAR
In most cases, nozzle wear is difficult to detect because it isn’t visible. The gradual erosion of nozzle orifices can’t be seen when looking at the nozzle or the spray pattern. Here are the best ways to determine if your nozzles are worn.
GOOD SPRAY TIP WORN SPRAY TIP
Nozzle tips show little visible difference. The tip on the left is new. The same size tip shown to the right has worn to the point at which it sprays 30% over capacity. Visual inspection shows little evidence of wear.
GOOD SPRAY TIP WORN SPRAY TIP
Orifice viewed through an optical comparator shows evidence of internal wear. A closer inspection and an analysis of spray collection data shown in the image on the right reveal the difference between the two tips.
Note: All photographs are un-retouched.
FLOW RATE CHANGE
• In all nozzles, the flow rate will increase as the surfaces of the orifice and/or internal vane or core begin to deteriorate
• In applications using positive displacement pumps, which provide the same capacity regardless of pressure, the spraying pressure will decrease as the nozzle orifice enlarges. Lower spray velocities and spray impact will result
• Increased flow rates or lower spraying pressures may also result in larger drop sizes
GOOD SPRAY TIP WORN SPRAY TIP
Spray patterns of both tips show little difference. Spray collection in tubes gives dramatic evidence of 30% increase in capacity.
16 spray.com | 1.800.95.SPRAY | Intl. Tel: 1.630.665.5000
SECTION V NOZZLE MAINTENANCE AND REPLACEMENT

INCREASE IN DROP SIZE
• As nozzle orifices wear, the liquid flow increases or the spraying pressure drops, resulting in larger drop sizes. Larger drops result in less total liquid surface area
Actual Drop Sizes
• 500 µm
• 1200 µm
• 5500 µm
One inch = 25,400 µm One millimeter = 1,000 µm µm = micrometers
DETERIORATION OF SPRAY PATTERN QUALITY
• Hollow cone nozzles: As orifice wear occurs, the spray pattern uniformity is destroyed as streaks develop and the pattern becomes heavy or light in sections of the spray
• Full cone spray nozzles: The spray pattern distribution typically deteriorates as more liquid flows into the center of the pattern
• Flat fan sprays: Streaks and heavier flows in the center of the pattern, accompanied by a decrease in the effective spray angle coverage typify deterioration
LOWERED SPRAY IMPACT
• Spray impact is lowered as worn nozzles operate at lower pressures
• In applications with centrifugal-type pumps, impact may actually increase because of the increased flow through the nozzle
Use the following equation to calculate total theoretical spray impact:
I = K x Q x √P
Where:
I = total theoretical spray impact
K = constant
Q = flow rate
P = liquid pressure
I lbs.(f) kg(f) Newtons Newtons
K .0526 .024 .24 .745
Q gpm lpm lpm lpm
P psikg/cm2 bar MPa
IF YOU SUSPECT YOU HAVE A SPRAY NOZZLE PROBLEM BUT CAN’T PINPOINT IT, CALL FOR HELP.
The leading nozzle manufacturers can conduct specialized testing in their labs, help determine the source of the problem, and offer recommendations for correction and ongoing prevention.
17spray.com | 1.800.95.SPRAY | Intl. Tel: 1.630.665.5000
NOZZLE MAINTENANCE AND REPLACEMENT SECTION V
MAINTAINING SPRAY NOZZLES
A comprehensive nozzle maintenance program will help ensure trouble-free performance of your spray system as long as it is performed properly and routinely. Use the checklist below as a starting point. How many of these factors and how often you will have to check spray performance is dependent on your application.
You should document system performance immediately after nozzles are installed to establish a baseline for later comparisons. Then, monitor your system frequently to detect changes in performance.
MAINTENANCE CHECK LIST
FLOW RATE – EACH NOZZLE
o Centrifugal Pumps Monitor flow meter readings to detect increases. Or, collect and measure the spray from the nozzle for a given period of time at a specific pressure. Then compare these readings to the flow rates listed in the manufacturer’s catalog or compare them to flow rate readings from new, unused nozzles.
o Positive Displacement Pumps Monitor the liquid line pressure for decreases; the flow rate will remain constant.
SPRAY PRESSURE – IN NOZZLE MANIFOLD
o Centrifugal Pumps Monitor for increases in liquid volume sprayed. (Spraying pressure likely to remain the same.)
o Positive Displacement Pumps Monitor pressure gauge for decreases in pressure and reduction in impact on sprayed surfaces. (Liquid volume sprayed likely to remain the same.) Also, monitor for increases in pressure due to clogged nozzles. Visually inspect for changes in spray coverage.
DROP SIZE
o Examine application results for changes. Drop size increases cannot be visually detected in most applications. An increase in flow rate or a decrease in spraying pressure will impact drop size.
18 spray.com | 1.800.95.SPRAY | Intl. Tel: 1.630.665.5000
SECTION V NOZZLE MAINTENANCE AND REPLACEMENT

SPRAY PATTERN
o Each Nozzle Visually inspect for changes in the uniformity of the pattern. Check spray angle with protractor. Measure width of spray pattern on sprayed surface.
Here’s what to look for:
o Flat Spray From an elliptical orifice, the nozzle delivers a flat fan or sheet-type spray with tapered edges, ideal for overlapping adjacent patterns. Inspect visually for a decrease in the included angle of the spray pattern; a heavier liquid concentration in the center of the pattern; and/ or streaks and voids in the pattern.
o Hollow Cone Visually inspect for heavier and/or streaky sections in the circular ring of fluid.
o Full Cone – round, square or oval Visually inspect for heavier liquid concentrations in the center of the pattern; and/or distortion of the spray pattern.
o Air Atomizing Visually inspect for heaviness, streakiness or other distortion of the spray pattern.
Note: If the orifice is wearing gradually, changes may not be detected until the flow rate has increased substantially. If accurate uniformity of spray coverage is critical, special equipment or tests may be required. Contact your nozzle manufacturer.
NOZZLE ALIGNMENT
o Flat Spray Nozzles on Manifold Check uniformity of spray coverage. Patterns should be parallel to each other. Spray tips should be rotated 5° to 10° from the manifold centerline. Quick-connect nozzles providing automatic spray pattern alignment are available.
APPLICATION RESULTS
o Check product for uneven coating, cooling, drying or cleaning.
o Check temperature, dust content, humidity as appropriate.
19spray.com | 1.800.95.SPRAY | Intl. Tel: 1.630.665.5000
NOZZLE MAINTENANCE AND REPLACEMENT SECTION V

EXTENDING SPRAY NOZZLE LIFE
Inspecting and maintaining your nozzles on a regular basis will help identify wear and extend service life. Here are some additional strategies that can be considered to maximize nozzle wear life.
REDUCE PRESSURE
This will slow the liquid velocity through the orifice and may help reduce the wear rate. However, operating at lower pressures may compromise spray coverage and the uniformity of the spray distribution. Drop size may also increase and impact may decrease. These changes in performance may create quality problems that cost more than replacement nozzles.
CHANGE TO A DIFFERENT NOZZLE
If spray performance can be improved, maintenance time can be reduced and/or uptime can be increased due to longer nozzle life, you should make a change. The additional short-term cost is usually quickly recouped.
CHANGE NOZZLE MATERIAL
Materials having harder surfaces generally provide longer wear life. Standard nozzle materials include brass, steel, cast iron, various stainless steels, hardened stainless steels, many plastics and various carbides.
Materials that offer better corrosion resistance are also available. However, the rate of chemical corrosion on specific nozzle materials is dependent on the solution being sprayed. The corrosive properties of the liquid being sprayed, its percent concentration and temperature, as well as the corrosion resistance of the nozzle material to the chemical must all be considered.
Reducing the quantity of abrasive particles or concentration of corrosive chemicals can be explored but are usually not feasible. While these changes may reduce wear, they generally negatively compromise spray performance.
20 spray.com | 1.800.95.SPRAY | Intl. Tel: 1.630.665.5000
SECTION V NOZZLE MAINTENANCE AND REPLACEMENT

ADD LINE STRAINERS OR NOZZLES WITH BUILT-IN STRAINERS
Orifice deterioration and clogging is caused by dirt particles in the sprayed liquid. This is particularly common in systems using continuous spray water recirculation. Using strainers to trap larger particles and prevent debris from entering nozzles is a good way to extend wear life.
CLEAN NOZZLE ORIFICES
As a part of routine spray system maintenance, nozzle orifices should be cleaned regularly. Caution: cleaning probes made of materials much softer than the nozzle orifice surface should be used. It is easy to damage the critical orifice shape or size and end up with distorted spray patterns and/or increased capacity. Check to be sure you are using plastic bristle brushes and/or wooden and plastic probes. Wire brushes, pocketknives or welders’ tip cleaning rasps should be avoided at all costs. For stubborn clogs, soak the orifice in a non-corrosive cleaning chemical to soften or dissolve the clogging substance.
REPLACING WORN NOZZLES
Inspecting and maintaining your nozzles on a regular basis will help identify wear and extend service life. However, wear will occur over time and the only solution is to replace your nozzles.
Here are a few guidelines to help you determine the optimal replacement interval:
• Are worn nozzles affecting product or process quality? If so, replace nozzles as soon as any wear is evident
• Are water conservation and sustainability priorities? If so, replace nozzles as soon as wear is evident
• How much are you spending by continuing to use worn nozzles? How do the additional costs for water, chemicals, electricity and waste water disposal compare with the cost of replacement nozzles?
• Is precise spray performance important to your overall process? If so, you may want to set pre-determined dates for nozzle replacement such as annual or semi-annual maintenance shutdowns
FOR MORE INFORMATION ON NOZZLE MAINTENANCE AND REPLACEMENT, CONTACT YOUR LOCAL SALES ENGINEER.
21spray.com | 1.800.95.SPRAY | Intl. Tel: 1.630.665.5000
NOZZLE MAINTENANCE AND REPLACEMENT SECTION V

OPTIMIZE PERFORMANCE, VALIDATE CONCEPTS AND TROUBLESHOOT PROBLEMS WITH SPRAY PERFORMANCE TESTING
Slight changes to nozzle placement, position, drop size, spray direction and other characteristics can make a big difference in operations where spray performance is critical. Examples include applications involving chemical reactions, gas cooling, complex coating and spray drying and operations where spray performance problems can result in process failure, danger, and significant loss of production time or excessive cost. In operations like these, it isn’t possible to optimize performance using a trial and error approach. Specialized equipment or advanced modeling tools are required to ensure accuracy and expediency.
Spray characterization studies conducted in a laboratory are widely used for concept validation, troubleshooting problems and optimizing performance.
The equipment used most frequently in a laboratory environment includes:
• Spray nozzle patternators to measure liquid distribution
• Laser diffraction equipment for measuring drop size of small capacity air atomizing and fine spray nozzles
• Devices which measure impact variations throughout the spray pattern
• Wind tunnels to test spray evaporation and spray performance in conditions that simulate a gas stream
• Air and liquid flow instrumentation for metering flow and pressure
• Phase Doppler Particle Analyzers for complete drop size evaluation, particularly where spray velocities are required
• Laser imaging analyzers for measuring drop size of large capacity nozzles and dense/opaque sprays
22 spray.com | 1.800.95.SPRAY | Intl. Tel: 1.630.665.5000
SECTION VI WHEN TO CONSIDER SPRAY PERFORMANCE TESTING AND MODELING
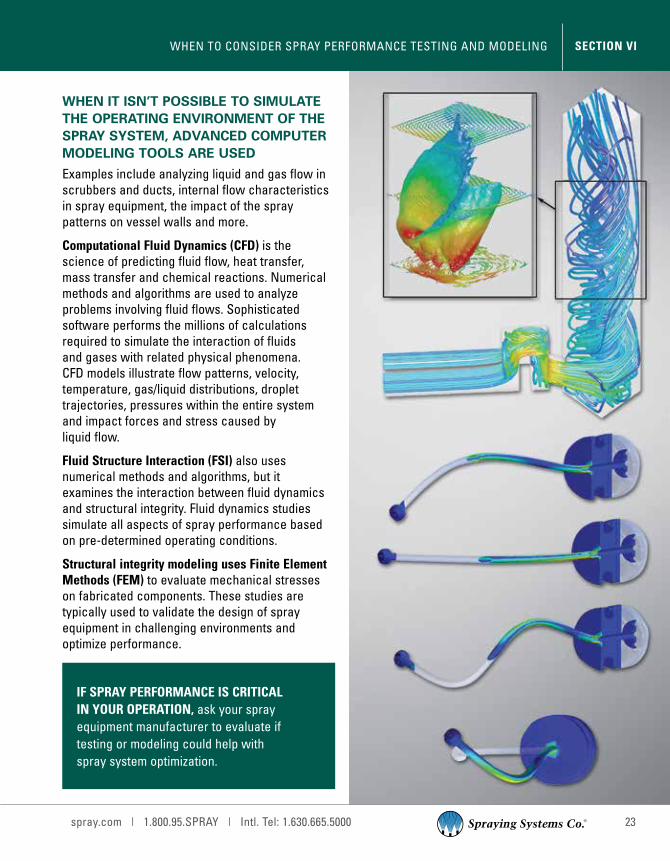
WHEN IT ISN’T POSSIBLE TO SIMULATE THE OPERATING ENVIRONMENT OF THE SPRAY SYSTEM, ADVANCED COMPUTER MODELING TOOLS ARE USED
Examples include analyzing liquid and gas flow in scrubbers and ducts, internal flow characteristics in spray equipment, the impact of the spray patterns on vessel walls and more.
Computational Fluid Dynamics (CFD) is the science of predicting fluid flow, heat transfer, mass transfer and chemical reactions. Numerical methods and algorithms are used to analyze problems involving fluid flows. Sophisticated software performs the millions of calculations required to simulate the interaction of fluids and gases with related physical phenomena. CFD models illustrate flow patterns, velocity, temperature, gas/liquid distributions, droplet trajectories, pressures within the entire system and impact forces and stress caused by liquid flow.
Fluid Structure Interaction (FSI) also uses numerical methods and algorithms, but it examines the interaction between fluid dynamics and structural integrity. Fluid dynamics studies simulate all aspects of spray performance based on pre-determined operating conditions.
Structural integrity modeling uses Finite Element Methods (FEM) to evaluate mechanical stresses on fabricated components. These studies are typically used to validate the design of spray equipment in challenging environments and optimize performance.
IF SPRAY PERFORMANCE IS CRITICAL IN YOUR OPERATION, ask your spray equipment manufacturer to evaluate if testing or modeling could help with spray system optimization.
23spray.com | 1.800.95.SPRAY | Intl. Tel: 1.630.665.5000
WHEN TO CONSIDER SPRAY PERFORMANCE TESTING AND MODELING SECTION VI

CHOOSING THE CORRECT NOZZLES
Spray nozzles are precision-engineered components designed to deliver very specific performance. Choosing the correct nozzles for your operation is critical so it is essential to understand the differences between various types.
FULL CONE NOZZLES
Spray Angle Range: 15° to 125°
• Solid cone-shaped spray pattern
• Medium to large drops
Typical applications:
• Chemical injection• Cooling• Dust suppression• Fire protection• Rinsing• Washing
FULL CONE (SPIRAL-TYPE)
Spray Angle Range: 50° to 170°
• Solid cone-shaped spray pattern • Coarse drops• Coverage not as uniform as conventional
nozzle with an internal vane type
Typical applications:
• Air and gas cooling• Dust suppression• Fire protection• Quenching
FULL CONE (OVAL-TYPE)
Spray Angle Range: 60° to 105°
• Solid cone-shaped spray pattern with oval impact area with a width approximately one-half its length
• Medium to large drops
Typical applications:
• Air and gas cooling• Dust suppression• Fire protection• Quenching
* The spray pattern images were taken in our spray laboratories using laser sheet imaging. A laser beam is passed through the spray pattern in a horizontal sheet to illuminate a cross section of the spray. A high-speed camera photographs the illuminated cross section. The light intensity in the spray is directly proportional to the volume of liquid. Red indicates the highest light intensity, which corresponds to the heaviest volume in the spray. Black is the lowest or no light intensity.
LASER SHEET IMAGE*
SECTION VII TECHNICAL REFERENCE APPENDIX – SPRAY SYSTEM BASICS
24 spray.com | 1.800.95.SPRAY | Intl. Tel: 1.630.665.5000
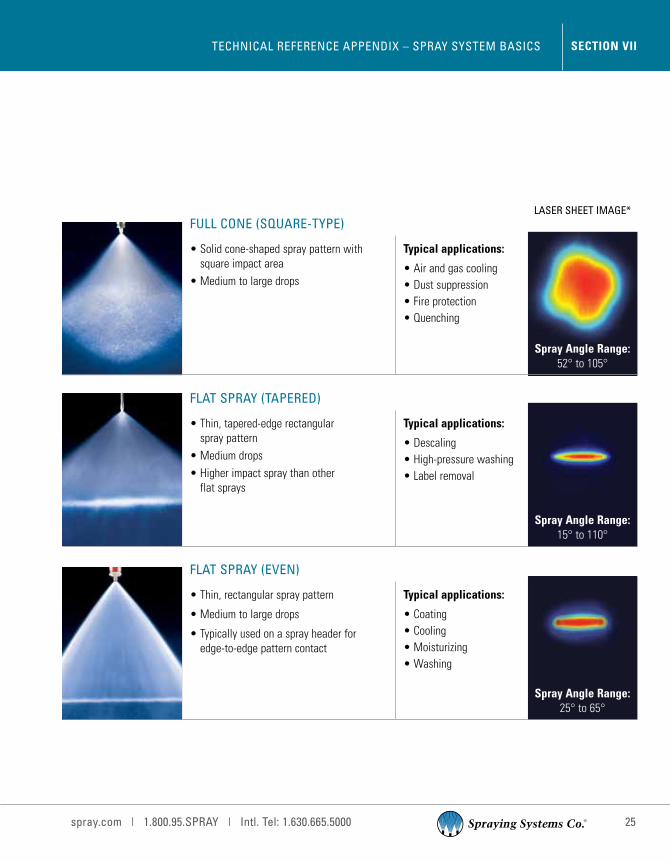
FULL CONE (SQUARE-TYPE)
Spray Angle Range: 52° to 105°
• Solid cone-shaped spray pattern with square impact area
• Medium to large drops
Typical applications:
• Air and gas cooling• Dust suppression• Fire protection• Quenching
FLAT SPRAY (TAPERED)
Spray Angle Range: 15° to 110°
• Thin, tapered-edge rectangular spray pattern
• Medium drops• Higher impact spray than other
flat sprays
Typical applications:
• Descaling• High-pressure washing• Label removal
FLAT SPRAY (EVEN)
Spray Angle Range: 25° to 65°
• Thin, rectangular spray pattern
• Medium to large drops
• Typically used on a spray header for edge-to-edge pattern contact
Typical applications:
• Coating• Cooling• Moisturizing• Washing
LASER SHEET IMAGE*
TECHNICAL REFERENCE APPENDIX – SPRAY SYSTEM BASICS SECTION VII
25spray.com | 1.800.95.SPRAY | Intl. Tel: 1.630.665.5000

LASER SHEET IMAGE*
FLAT SPRAY (DEFLECTED-TYPE)
Spray Angle Range: 15° to 150°
• Thin, even rectangular spray pattern• Small to large drops• Large free passage design
reduces clogging• Narrow spray angles provide higher
impact; wide-angle versions provide lower impact
Typical applications:
• Cleaning• Washing
SOLID STREAM
Spray Angle Range 0°
• Solid stream nozzles provide the highest impact per unit area
• Medium to large drops
Typical applications:
• Cleaning products when complete removal of dirt and debris is required
• Decorative spray ponds
• Laminar flow operations
HOLLOW CONE (WHIRLCHAMBER-TYPE)
Spray Angle Range: 40° to 165°
• Circular spray pattern
• Medium to large drops
• Good interface between air and drop surfaces
Typical applications:
• Cooling air and gas• Cooling products• Dust suppression• Water aeration
HOLLOW CONE (DEFLECTED-TYPE)
Spray Angle Range: 100° to 180°
• Utilizes a deflector cap to form an umbrella-shaped hollow cone pattern
• Medium to large drops• Good interface between air and
drop surfaces
Typical applications:
• Decorative sprays• Dust suppression• Fire protection• Flush cleaning
tube/pipe interiors• Water curtain
SECTION VII TECHNICAL REFERENCE APPENDIX – SPRAY SYSTEM BASICS
26 spray.com | 1.800.95.SPRAY | Intl. Tel: 1.630.665.5000
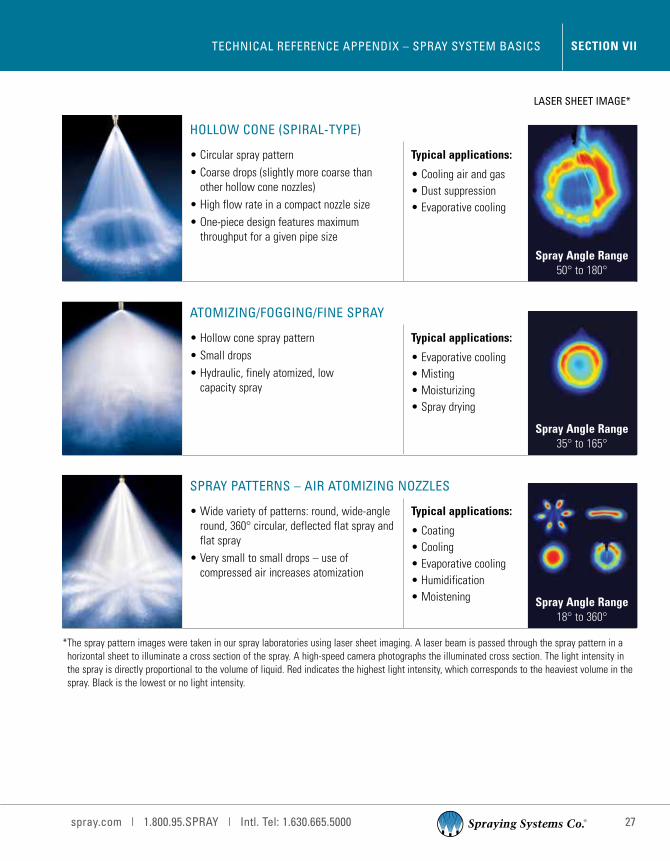
HOLLOW CONE (SPIRAL-TYPE)
Spray Angle Range 50° to 180°
• Circular spray pattern• Coarse drops (slightly more coarse than
other hollow cone nozzles)• High flow rate in a compact nozzle size• One-piece design features maximum
throughput for a given pipe size
Typical applications:
• Cooling air and gas• Dust suppression • Evaporative cooling
ATOMIZING/FOGGING/FINE SPRAY
Spray Angle Range 35° to 165°
• Hollow cone spray pattern• Small drops• Hydraulic, finely atomized, low
capacity spray
Typical applications:
• Evaporative cooling• Misting• Moisturizing• Spray drying
SPRAY PATTERNS – AIR ATOMIZING NOZZLES
Spray Angle Range 18° to 360°
• Wide variety of patterns: round, wide-angle round, 360° circular, deflected flat spray and flat spray
• Very small to small drops – use of compressed air increases atomization
Typical applications:
• Coating• Cooling• Evaporative cooling• Humidification• Moistening
* The spray pattern images were taken in our spray laboratories using laser sheet imaging. A laser beam is passed through the spray pattern in a horizontal sheet to illuminate a cross section of the spray. A high-speed camera photographs the illuminated cross section. The light intensity in the spray is directly proportional to the volume of liquid. Red indicates the highest light intensity, which corresponds to the heaviest volume in the spray. Black is the lowest or no light intensity.
LASER SHEET IMAGE*
TECHNICAL REFERENCE APPENDIX – SPRAY SYSTEM BASICS SECTION VII
27spray.com | 1.800.95.SPRAY | Intl. Tel: 1.630.665.5000

FLOW RATE AND SPECIFIC GRAVITY
Fluid capacity varies with spraying pressure. In addition, the specific gravity of a liquid affects its flow rate. If you are spraying a fluid other than water, please refer to the Technical Reference Section in Industrial Hydraulic Spray Products, Catalog 75, for information on calculating specific gravity.
Q 1 (P1)n
Q 2
~ (P2)n
Q = Flow Rate (in gpm or lpm)
P = Liquid pressure (in psi or bar)
n = Flow exponent
To approximate any unknown flow or pressure, use this formula when the other variables are known. The “n” exponent is used to approximate the ratio of pressure to flow based on the type of spray pattern.
FLOW EXPONENT FOR SPECIFIC NOZZLE TYPES
Nozzle TypeExponent
“n”
Hollow Cone Nozzles – All
Full Cone Nozzles – Vaneless, 15° and 30° Series
Flat Spray Nozzles – All
Solid Stream Nozzles – All
Spiral Nozzles – All
.50
Full Cone Nozzles – Standard, Square, Oval and Large Capacity
.46
Full Cone Nozzles – Wide Spray and Wide Square Spray
.44
Example:
To determine the flow rate of water for a 1/4G-10 standard full cone nozzle at 150 psi (10 bar), consult the performance charts in Industrial Hydraulic Spray Products, Catalog 75, available at spray.com.
You will find that:
• The spray angle is 65°
• Flow (Q1) at 40 psi = 1.9 gpm
• Pressure (P1) = 40 psi
• Pressure (P2) = 150 psi
Solving for Q2 = 3.5 gpm
Q1 (1.9 gpm) Q 2 = (P1)
n = (40).46
(P2)
n (150).46
• The spray angle is 65°
• Flow (Q1) at 3 bar = 7.2 lpm
• Pressure (P1) = 3 bar
• Pressure (P2) = 10 bar
Solving for Q2 = 13.2 lpm
Q1 (7.2 lpm) Q 2 = (P1)
n = (3).46
(P2)
n (10).46
Using an online calculator is an easy way to determine flow at a desired pressure for various nozzles. spray.com/sprayware
SECTION VII TECHNICAL REFERENCE APPENDIX – SPRAY SYSTEM BASICS
28 spray.com | 1.800.95.SPRAY | Intl. Tel: 1.630.665.5000

SPRAY COVERAGE
The effective spray angle of a nozzle varies with spray distance, liquid viscosity, nozzle capacity and operating pressure. However, coverage is usually a theoretical calculation and should be used as a guideline. Also, keep in mind that spray angles listed in catalogs are based on spraying water. If spray coverage is critical in your application, contact the manufacturer of your spray equipment for additional data. If coverage isn’t critical, use of an online calculator can provide the information you need. spray.com/sprayware
Example: A spray nozzle with an angle of 65° spraying 15" (39 cm) from the target provides 19.2" (48.8 cm) of theoretical coverage.
THEORETICAL COVERAGE
SPRAY DISTANCE
SPRAY ANGLE
THEORETICAL SPRAY COVERAGE AT VARIOUS DISTANCES IN INCHES (CM) FROM NOZZLE ORIFICE
Spray Angle
2in.
5cm
4in.
10cm
6in.
15cm
8in.
20cm
10in.
25cm
12in.
30cm
15in.
40cm
18in.
50cm
24in.
60cm
30in.
70cm
36in.
80cm
48in.
100cm
5°10°15°20°25°
.2
.4
.5
.7
.9
.4
.91.31.82.2
.4
.71.11.41.8
.91.82.63.54.4
.51.11.62.12.7
1.32.64.05.36.7
.71.42.12.83.5
1.83.55.37.18.9
.91.82.63.54.4
2.24.46.68.811.1
1.12.13.24.25.3
2.65.37.910.613.3
1.32.63.95.36.6
3.57.010.514.117.7
1.63.14.76.48.0
4.48.813.217.622.2
2.14.26.38.510.6
5.210.515.821.226.6
2.65.27.910.613.3
6.112.318.424.731.0
3.16.39.512.715.9
7.014.021.128.235.5
4.28.412.616.921.2
8.717.526.335.344.3
30°35°40°45°50°
1.11.31.51.71.9
2.73.23.64.14.7
2.12.52.93.33.7
5.46.37.38.39.3
3.23.84.45.05.6
8.09.510.912.414.0
4.35.05.86.67.5
10.712.614.616.618.7
5.46.37.38.39.3
13.415.818.220.723.3
6.47.68.79.911.2
16.118.921.824.928.0
8.19.510.912.414.0
21.425.229.133.137.3
9.711.313.114.916.8
26.831.536.441.446.6
12.815.517.519.922.4
32.237.843.749.756.0
16.118.921.824.828.0
37.544.151.058.065.3
19.322.726.229.833.6
42.950.558.266.374.6
25.730.334.939.744.8
53.663.172.882.893.3
55°60°65°70°75°
2.12.32.52.83.1
5.25.86.47.07.7
4.24.65.15.66.1
10.411.612.714.015.4
6.36.97.68.49.2
15.617.319.121.023.0
8.39.210.211.212.3
20.823.125.528.030.7
10.311.512.714.015.3
26.028.931.935.038.4
12.513.815.316.818.4
31.234.638.242.046.0
15.617.319.221.023.0
41.746.251.056.061.4
18.720.622.925.227.6
52.157.763.770.076.7
25.027.730.533.636.8
62.569.376.584.092.1
31.234.638.242.046.0
72.980.889.298.0107
37.541.645.850.455.2
83.392.4102112123
50.055.461.267.273.6
104115127140153
80°85°90°95°
100°
3.43.74.04.44.8
8.49.210.010.911.9
6.77.38.08.79.5
16.818.320.021.823.8
10.111.012.013.114.3
25.227.530.032.735.8
13.414.716.017.519.1
33.636.740.043.747.7
16.818.320.021.823.8
42.045.850.054.659.6
20.222.024.026.228.6
50.455.060.065.571.5
25.227.530.032.835.8
67.173.380.087.395.3
30.333.036.039.343.0
83.991.6100109119
40.344.048.052.457.2
101110120131143
50.455.060.065.571.6
118128140153167
60.466.072.078.685.9
134147160175191
80.688.096.0105114
168183200218238
110°120°130°140°150°
5.76.98.610.914.9
14.317.321.527.537.3
11.413.917.221.929.8
28.634.642.955.074.6
17.120.825.732.944.7
42.952.064.382.4112
22.827.734.343.859.6
57.169.385.8110149
28.534.642.954.874.5
71.486.6107137187
34.341.651.565.789.5
85.7104129165224
42.852.064.482.2112
114139172220299
51.462.477.398.6
–
143173215275–
68.583.2103––
171208257––
85.6104–––
200243–––
103––––
229––––
–––––
286––––
160°170°
22.745.8
56.7114
45.491.6
113229
68.0–
170–
90.6–
227–
113–
284–
––
––
––
––
––
––
––
––
––
––
––
––
––
––
TECHNICAL REFERENCE APPENDIX – SPRAY SYSTEM BASICS SECTION VII
29spray.com | 1.800.95.SPRAY | Intl. Tel: 1.630.665.5000
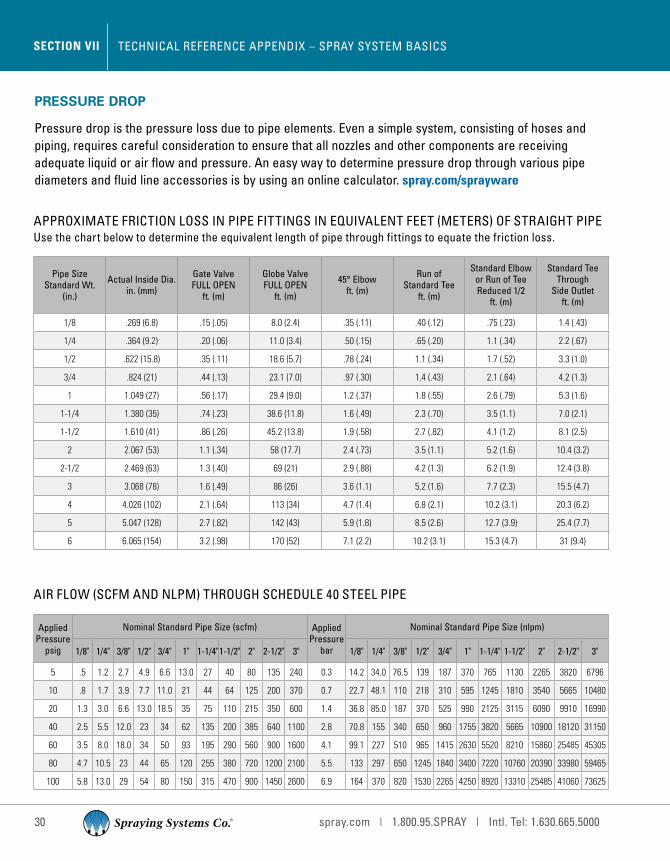
PRESSURE DROP
Pressure drop is the pressure loss due to pipe elements. Even a simple system, consisting of hoses and piping, requires careful consideration to ensure that all nozzles and other components are receiving adequate liquid or air flow and pressure. An easy way to determine pressure drop through various pipe diameters and fluid line accessories is by using an online calculator. spray.com/sprayware
APPROXIMATE FRICTION LOSS IN PIPE FITTINGS IN EQUIVALENT FEET (METERS) OF STRAIGHT PIPE Use the chart below to determine the equivalent length of pipe through fittings to equate the friction loss.
Pipe Size Standard Wt.
(in.)
Actual Inside Dia.in. (mm)
Gate ValveFULL OPEN
ft. (m)
Globe ValveFULL OPEN
ft. (m)
45° Elbowft. (m)
Run of Standard Tee
ft. (m)
Standard Elbow or Run of Tee Reduced 1/2
ft. (m)
Standard Tee Through
Side Outletft. (m)
1/8 .269 (6.8) .15 (.05) 8.0 (2.4) .35 (.11) .40 (.12) .75 (.23) 1.4 (.43)
1/4 .364 (9.2) .20 (.06) 11.0 (3.4) .50 (.15) .65 (.20) 1.1 (.34) 2.2 (.67)
1/2 .622 (15.8) .35 (.11) 18.6 (5.7) .78 (.24) 1.1 (.34) 1.7 (.52) 3.3 (1.0)
3/4 .824 (21) .44 (.13) 23.1 (7.0) .97 (.30) 1.4 (.43) 2.1 (.64) 4.2 (1.3)
1 1.049 (27) .56 (.17) 29.4 (9.0) 1.2 (.37) 1.8 (.55) 2.6 (.79) 5.3 (1.6)
1-1/4 1.380 (35) .74 (.23) 38.6 (11.8) 1.6 (.49) 2.3 (.70) 3.5 (1.1) 7.0 (2.1)
1-1/2 1.610 (41) .86 (.26) 45.2 (13.8) 1.9 (.58) 2.7 (.82) 4.1 (1.2) 8.1 (2.5)
2 2.067 (53) 1.1 (.34) 58 (17.7) 2.4 (.73) 3.5 (1.1) 5.2 (1.6) 10.4 (3.2)
2-1/2 2.469 (63) 1.3 (.40) 69 (21) 2.9 (.88) 4.2 (1.3) 6.2 (1.9) 12.4 (3.8)
3 3.068 (78) 1.6 (.49) 86 (26) 3.6 (1.1) 5.2 (1.6) 7.7 (2.3) 15.5 (4.7)
4 4.026 (102) 2.1 (.64) 113 (34) 4.7 (1.4) 6.8 (2.1) 10.2 (3.1) 20.3 (6.2)
5 5.047 (128) 2.7 (.82) 142 (43) 5.9 (1.8) 8.5 (2.6) 12.7 (3.9) 25.4 (7.7)
6 6.065 (154) 3.2 (.98) 170 (52) 7.1 (2.2) 10.2 (3.1) 15.3 (4.7) 31 (9.4)
AIR FLOW (SCFM AND NLPM) THROUGH SCHEDULE 40 STEEL PIPE
AppliedPressure
psig
Nominal Standard Pipe Size (scfm) AppliedPressure
bar
Nominal Standard Pipe Size (nlpm)
1/8" 1/4" 3/8" 1/2" 3/4" 1" 1-1/4"1-1/2" 2" 2-1/2" 3" 1/8" 1/4" 3/8" 1/2" 3/4" 1" 1-1/4" 1-1/2" 2" 2-1/2" 3"
5 .5 1.2 2.7 4.9 6.6 13.0 27 40 80 135 240 0.3 14.2 34.0 76.5 139 187 370 765 1130 2265 3820 6796
10 .8 1.7 3.9 7.7 11.0 21 44 64 125 200 370 0.7 22.7 48.1 110 218 310 595 1245 1810 3540 5665 10480
20 1.3 3.0 6.6 13.0 18.5 35 75 110 215 350 600 1.4 36.8 85.0 187 370 525 990 2125 3115 6090 9910 16990
40 2.5 5.5 12.0 23 34 62 135 200 385 640 1100 2.8 70.8 155 340 650 960 1755 3820 5665 10900 18120 31150
60 3.5 8.0 18.0 34 50 93 195 290 560 900 1600 4.1 99.1 227 510 965 1415 2630 5520 8210 15860 25485 45305
80 4.7 10.5 23 44 65 120 255 380 720 1200 2100 5.5 133 297 650 1245 1840 3400 7220 10760 20390 33980 59465
100 5.8 13.0 29 54 80 150 315 470 900 1450 2600 6.9 164 370 820 1530 2265 4250 8920 13310 25485 41060 73625
SECTION VII TECHNICAL REFERENCE APPENDIX – SPRAY SYSTEM BASICS
30 spray.com | 1.800.95.SPRAY | Intl. Tel: 1.630.665.5000

FLOW OF WATER THROUGH SCHEDULE 40 STEEL PIPE – PRESSURE DROP
Flow Pressure Drop in psi for Various Pipe Diameters10 ft. Length Pipe Flow Pressure Drop in bar for Various Pipe Diameters
10 m Length Pipe
gpm 1 8" ¼" 3 8" ½" ¾" 1" 1¼" 1½" 2" 2½" 3" 3½" 4" 5" 6" 8" lpm 1 8" ¼" 3 8" ½" ¾" 1" 1¼" 1½" 2" 2½" 3" 3½" 4" 5" 6" 8"
.3 .42 1 .07
.4 .70 .16 1.5 .16 .04
.5 1.1 .24 2 .26 .06
.6 1.5 .33 2.5 .40 .08
.8 2.5 .54 .13 3 .56 .12 .03
1.0 3.7 .83 .19 .06 4 .96 .21 .05 .02
1.5 8.0 1.8 .40 .12 6 2.0 .45 .10 .03
2.0 13.4 3.0 .66 .21 .05 8 3.5 .74 .17 .05 .01
2.5 4.5 1.0 .32 .08 10 1.2 .25 .08 .02
3.0 6.4 1.4 .43 .11 12 1.7 .35 .11 .03
4.0 11.1 2.4 .74 .18 .06 15 2.6 .54 .17 .04 .01
5.0 3.7 1.1 .28 .08 20 .92 .28 .07 .02
6.0 5.2 1.6 .38 .12 25 1.2 .45 .11 .03
8.0 9.1 2.8 .66 .20 .05 30 2.1 .62 .15 .04 .01
10 4.2 1.0 .30 .08 40 1.1 .25 .08 .02
15 2.2 .64 .16 .08 60 .54 .16 .04 .02 .006
20 3.8 1.1 .28 .13 .04 80 .93 .28 .07 .03 .009
25 1.7 .42 .19 .06 100 .43 .12 .05 .01
30 2.4 .59 .27 .08 115 .58 .14 .06 .015
35 3.2 .79 .36 .11 .04 130 .72 .18 .08 .02 .01
40 1.0 .47 .14 .06 150 .23 .10 .03 .012
45 1.3 .59 .17 .07 170 .29 .13 .04 .016
50 1.6 .72 .20 .08 190 .36 .16 .05 .02
60 2.2 1.0 .29 .12 .04 230 .50 .23 .07 .03 .009
70 1.4 .38 .16 .05 260 .32 .09 .04 .01
80 1.8 .50 .20 .07 300 .38 .11 .04 .02 .007
90 2.2 .62 .25 .09 .04 340 .50 .14 .06 .02 .009
100 2.7 .76 .31 .11 .05 380 .61 .18 .07 .03 .01
125 1.2 .47 .16 .08 .04 470 .28 .11 .04 .02 .009
150 1.7 .67 .22 .11 .06 570 .39 .15 .05 .03 .01
200 2.9 1.2 .39 .19 .10 750 .64 .26 .09 .04 .02 .007
250 .59 .28 .15 .05 950 .14 .06 .03 .01
300 .84 .40 .21 .07 1150 .19 .09 .05 .02
400 .70 .37 .12 .05 1500 .16 .08 .03 .01
500 .57 .18 .07 1900 .13 .04 .02
750 .39 .16 .04 2800 .09 .03 .009
1000 .68 .27 .07 3800 .16 .06 .02
2000 1.0 .26 7500 .23 .06
Recommended capacity range for each size is shown in shaded areas. For pipe lengths greater than 10 ft. (3 m), the pressure loss is proportional to the length. For 50 ft. (15 m) of pipe, the pressure drop is approximately 5 times the value in the table.
TECHNICAL REFERENCE APPENDIX – SPRAY SYSTEM BASICS SECTION VII
31spray.com | 1.800.95.SPRAY | Intl. Tel: 1.630.665.5000

VISCOSITY
Absolute (dynamic) viscosity is the property of a liquid which resists change in the shape or arrangement of its elements during flow. Liquid viscosity is a primary factor affecting spray pattern formation and, to a lesser degree, capacity. High viscosity liquids require a higher minimum pressure to begin formation of a spray pattern and provide narrower spray angles as compared to those of water. See Table 1 for the general effects of viscosity other than water.
SURFACE TENSION
The main effects of surface tension are on minimum operating pressure, spray angle and drop size. The property of surface tension is more apparent at low operating pressures. A higher surface tension reduces the spray angle, particularly on hollow cone and flat fan spray nozzles. Low surface tensions can allow a nozzle to be operated at a lower pressure. See Table 1.
TABLE 1 - SUMMARY OF SPRAY PERFORMANCE CONSIDERATIONS
NozzleCharacteristics
Increase inOperating Pressure
Increase inSpecific Gravity
Increase inViscosity
Increase inFluid Temperature
Increase inSurface Tension
Pattern Quality Improves Negligible Deteriorates Improves Negligible
Drop Size Decreases Negligible Increases Decreases Increases
Spray Angle Increases then decreases Negligible Decreases Increases Decreases
Capacity Increases DecreasesFull/hollow cone –
increasesFlat – decreases
Depends on fluid sprayed and nozzle used
No effect
Impact Increases Negligible Decreases Increases Negligible
Velocity Increases Decreases Decreases Increases Negligible
Wear Increases Negligible Decreases Depends on fluid sprayedand nozzle used No effect
SECTION VII TECHNICAL REFERENCE APPENDIX – SPRAY SYSTEM BASICS
32 spray.com | 1.800.95.SPRAY | Intl. Tel: 1.630.665.5000

DROP SIZE
Drop size refers to the size of the individual spray drops that comprise a nozzle’s spray pattern. Each spray provides a range of drop sizes; this range is referred to as drop size distribution. Drop size distribution is dependent on the spray pattern type and varies significantly from one type to another. The smallest drop sizes are achieved by air atomizing nozzles while the largest drops are produced by full cone hydraulic spray nozzles.
Liquid properties, nozzle capacity, spraying pressure and spray angle also affect drop size. Lower spraying pressures produce larger drop sizes and higher pressures produce smaller drops. Small capacity nozzles produce the smallest drops and large capacity nozzles produce the largest drops.
Drop size is an important factor in the effectiveness of many applications such as gas cooling, gas conditioning, fire suppression and spray drying. If drop size is important in your application, contact your spray technology supplier and request drop size data from the specific nozzles of interest. See Table 2 for general information about drop size by spray pattern type.
VOLUME MEDIAN DIAMETER (VMD)
Volume Median Diameter (VMD) is expressed as Dv0.5 and Mass Median Diameter (MMD) are ways of expressing drop size in terms of the volume of liquid sprayed. VMD drop size when measured in terms of volume (or mass) is a value where 50% of the total volume of liquid sprayed is made up of drops with diameters larger than the median value and 50% with smaller diameters.
ACTUAL DROP SIZES
• 500 µm
• 1200 µm
• 5500 µm
One inch = 25,400 µm One millimeter = 1,000 µm µm = micrometers
TABLE 2 - DROP SIZE BY SPRAY PATTERN TYPE AT VARIOUS PRESSURES AND CAPACITIES
Spray Pattern Type
10 psi (0.7 bar) 40 psi (2.8 bar) 100 psi (7 bar)
Capacity VMD Capacity VMD Capacity VMD
gpm lpm microns gpm lpm microns gpm lpm microns
Air Atomizing .005.02
.02
.0820100
.0088
.0330
15200 12 45 400
Fine Spray .22 .83 375 .03.43
.11.6
110330
.05
.69.22.6
110290
Hollow Cone .0512
.1945
3603400
.1024
.3891
3001900
.1638
.61144
2001260
Flat Fan .055
.1918.9
2604300
.1010
.3838
2202500
.1615.8
.6160
1901400
Full Cone .1012
.3845
11404300
.1923
.7287
8502800
.3035
1.1132
5001720
Based on a sampling of nozzles selected to show the wide range of possible drop sizes available.
TECHNICAL REFERENCE APPENDIX – SPRAY SYSTEM BASICS SECTION VII
33spray.com | 1.800.95.SPRAY | Intl. Tel: 1.630.665.5000

IMPACT
Impact, or the impingement of a spray onto the target surface, can be expressed in several different ways. The most useful impact value with regard to spray nozzle performance is the impact per square inch (cm). Basically, this value depends on the spray pattern distribution and spray angle. Impact per square inch (cm) [pounds (kg)-force per square inch (cm)] can be calculated. If impact is important in your application, it is recommended you consult a spray technology expert since many factors such as nozzle type and fluid properties affect impact that are not accounted for in a theoretical example.
I = K x Q x √P
Total theoretical impact = constant (based on units) x flow (at pressure P) x square root of pressure (P)
I = total theoretical spray impact
K = constant
Q = flow rate
P = liquid pressure
I lbs.(f) kg(f) Newtons Newtons
K .0526 .024 .24 .745
Q gpm lpm lpm lpm
P psikg/cm2 bar MPa
The constant (K) is a unit conversion based on the measurement system used. The conversions are listed in the chart above.
Example:
I = .0526 x 3.5 gpm x √150 psi
I = 2.25 lbs.(f) is available for distribution throughout the pattern
SECTION VII TECHNICAL REFERENCE APPENDIX – SPRAY SYSTEM BASICS
34 spray.com | 1.800.95.SPRAY | Intl. Tel: 1.630.665.5000

CAN SPRAY SYSTEM OPTIMIZATION SAVE YOU MONEY? THE ANSWER IS ALMOST ALWAYS “YES.”
HOW MUCH MONEY CAN YOU SAVE? You won’t know until you take a careful look at your spray operations but in most cases, it will be time well spent. In addition to saving money, it’s likely you will improve operating efficiency and product/process quality too.
WHY NOT START TODAY? Begin with an audit of your spray system, plan improvements and develop a preventative maintenance plan. Expert help is available – just look for a manufacturer that specializes in spray technology and has well-trained, dedicated representatives available in your area.

North Avenue and Schmale Road, P.O. Box 7900, Wheaton, IL 60187-7901 USA
Tel: 1.800.95.SPRAY Intl. Tel: 1.630.665.5000 Fax: 1.888.95.SPRAY Intl. Fax: 1.630.260.0842
www.spray.com
TM410B ©Spraying Systems Co. 2013


