

NREL is a national laboratory of the U.S. Department of Energy, Office of Energy Efficiency and Renewable Energy, operated by the Alliance for Sustainable Energy, LLC.
Overview of Analysis Tools
Nate Blair
May 2015

2
NREL Analysis Informs Decisions
Building on a foundation of robust data and innovative models and tools, many of which we developed, NREL prepares credible, objective analyses that inform policy and investment decisions as RE/EE technologies move from innovation through integration.

3
Strategic Energy Analysis
Assess resource availability and characteristics
Resources
Analyze technology and component performance and cost
Technology/Components
Analyze energy scenarios and/or the benefits and impacts of energy plans, programs, portfolios, or policy options
Evaluate implications of markets, financial instruments and economic factors
Economics, Markets and Finance
Overall system performance and technology interfaces in the context of the overall system
Systems
Integrated Assessments
3

4
TOOLS AND DATA
5
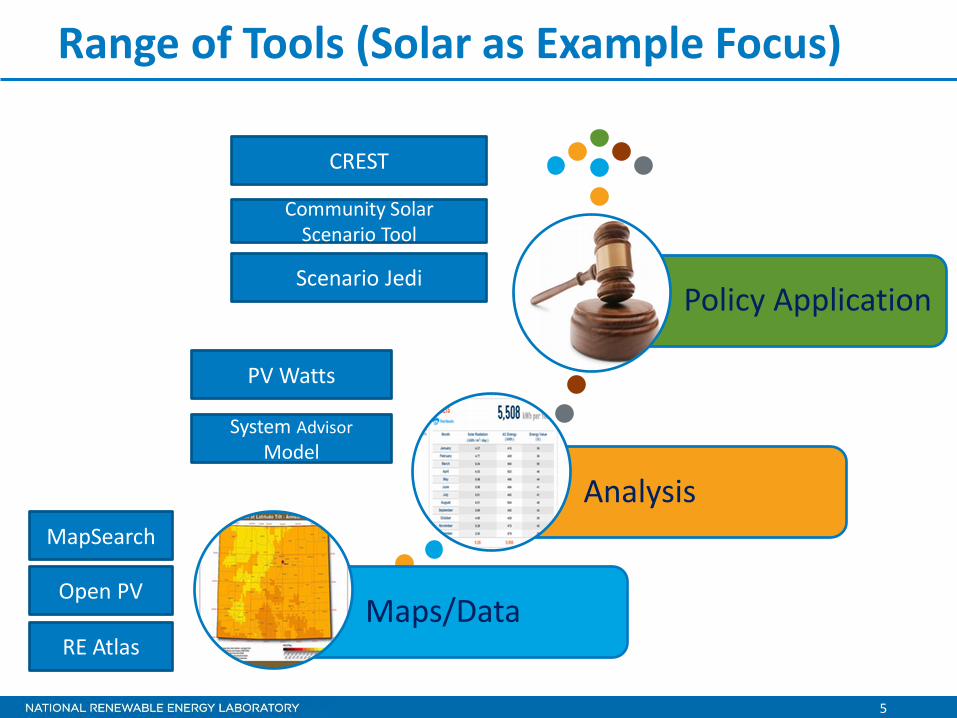
Range of Tools (Solar as Example Focus)
Maps/Data
Analysis
Policy Application
MapSearch
Open PV
PV Watts
System Advisor Model
Scenario Jedi
Community Solar Scenario Tool
RE Atlas
CREST

Analysis Tools

7
Renewable Energy Data Book
U.S. RE Capacity as % of Total Generating Capacity 2011 U.S. Nameplate Elecricity Capacity and Generation
Top States for RE Installed Capacity Top Countries for Installed Renewable Generation

8
Technology Cost Database
OpenEI.org/TCDB
http://en.openei.org/apps/TCDB/

9
PVWatts Calculator
http://pvwatts.nrel.gov/
PURPOSE: calculates the energy produced by grid-connected PV systems as well as basic financial parameters
TYPE: Standalone model with built-in or user-defined assumptions
TAKEAWAY: Basic project-level model Note: updated in September 2014 and will predict increased output
CONTACT: [email protected]

10
System Advisor Model
National Renewable Energy Laboratory Innovation for Our Energy Future
These calculations are done using detailed performance models, a detailed cash flow finance model, and a library of reasonable default values for each technology and target market. Technologies SAM can model: - Photovoltaics (Flat plate, CPV) - Solar Water Heating - Concentrating Solar Power
(Trough, Tower, Linear Fresnel, Dish Stirling)
- Geothermal - Wind (Small + Utility scale) - Biomass Power
The System Advisor Model (SAM) is a free user-friendly computer program that calculates a renewable energy system’s hourly energy output over a single year, and calculates the cost of energy for a renewable energy project over the life of the project.
Weather Data
System Specs
Energy Production Cost Data
Financing Options
Utility Rates &
Incentives
+ » + + + » Annual, Monthly,
and Hourly Output, LCOE, NPV,
Payback, Revenue, Capacity Factor

11
Generate electric output predictions
Example: 100 MW Parabolic trough system with 6 hours of storage
National Renewable Energy Laboratory Innovation for Our Energy Future
11

Policy Application

13
JEDI PV – Jobs and Economic Development
http://www.nrel.gov/analysis/jedi/download.html
PURPOSE: Estimate the economic impacts of constructing and operating photovoltaic power generation at the local and state levels.
TYPE: Spreadsheet-based impact model
TAKEAWAY: Economic impacts for one, or, a portfolio of projects
CONTACT: [email protected]

14
Community Solar Scenario Tool
14
www.nrel.gov/tech_deployment/tools_community_solar.html
• PURPOSE: Evaluate economics of a community solar project from a customer’s perspective as well as the sponsoring utility
• TYPE: Spreadsheet-based model
• TAKEAWAY: “First cut” analysis of different community solar options for utility, state and local advocates.
• CONTACT: [email protected]

15
Demo of PVWatts
15

16
Tools you Likely Won’t use (but we do…)

17
NREL models designed for different timescales
Energy Forecasting & Modeling Strategic Energy Analysis Center

18
Rooftop PV adoption
Temporal Resolution
Global
U.S.
Regional/ Balancing
Area
Generator
Sub-hourly Annual Hourly
SEAC Electricity Modeling at Multiple Scales
National policy, market, technology analysis
Hourly plant output
Automatic generation control (AGC) & dispatch
Regional integrated resource planning
Global energy-economic-climate wind, solar,
demand, generator,
transmission
Security-constrained unit commitment & economic dispatch
Seasonal/Diurnal
Geo
gra
ph
ic S
cop
e
Agent Based Models of Customer Behavior

19
Integration Resources

20
Three recently published major studies Renewable Electricity Futures Study “RE generation…, in combination with a more flexible electricity system, is more than adequate to supply 80% of total U.S. electricity generation in 2050—while meeting electricity demand on an hourly basis in every region of the country.” [www.nrel.gov/analysis/re_futures]
SunShot Vision Study “Achieving the level of price reductions envisioned in the SunShot Initiative [75% price reduction by 2020] could result in solar meeting 14% of U.S. electricity needs by 2030 and 27% by 2050.” [www.eere.energy.gov/solar/sunshot/]
Western Wind and Solar Integration Study (WWSIS) Phase 2 “Cycling fossil-fueled power plants [under scenarios with 33% solar and wind penetration in the Western Interconnection] has little impact on avoided emissions but modestly increases wear-and-tear costs.” [www.nrel.gov/electricity/transmission/western_wind.html]

21
• Demo of REF Scenario Viewer

22
• Additional Materials

23
– Simulates market development and capacity expansion
– Analysis and evaluation of alternate policies
– Identifies high-impact levers as well as bottlenecks to system evolution
– Facilitates focused discussion among policy makers, analysts, and stakeholders
Biomass Scenario Model
Dynamic simulation of the biomass to biofuels industry enabling informed dialogue
SUPPLY CHAIN
Feedstock
Production
Feedstock
Logistics
Biofuels
Production
Biofuels
Distribution
Biofuels End
Use
DYNAMIC MODELS OF SUPPLY INFRASTRUCTURE,
PHYSICAL CONSTRAINTS, MARKETS, AND DECISION MAKING
POLICIES INCENTIVES EXTERNALITIES
Feedstock Supply Module
q 6 Feedstock typesq 10 geographic regionsq 10+ land usesq Farmer decision logicq Land allocation dynamicsq New agriculture practicesq Markets and prices
Feedstock Logistics Module
q Multiple logistics stagesq Cost breakdownsq Transportation distanceq Land eligibility
Conversion Module
q 15 conversion platformsq 4 development stagesq 6 learning attributesq Cascading learning curvesq Project economicsq Industry growth and investment
dynamics
Distribution Logistics Module
q Distribution terminal focusq Differential cost structure, based on
infrastructure (storage and intra/inter-region transport costs)
Dispensing Station Module
q Fueling-station economicsq Tankage and equipment investment
decisionq Distribution-coverage effects
Vehicle Scenario Module
q Cars and Light Trucksq Multiple (9 +scenario) vehicle
technologiesq Fleet vintagingq Vehicle choice scenariosq E10/E20/E85 potential
Fuel Use Module
q Non-, occasional, and frequent users
q Relative price/fuel choice dynamics

24
Construct local scenarios for early market infrastructure clustering and vehicle rollout.
Tune nationwide scenarios to observations and lessons learned in local early market evolution and planning.
Refine methodology for locating and sizing stations within urban areas.
Develop methodology for locating FCEVs at households within urban areas.
Refine methodology for optimizing the choice of hydrogen production and delivery infrastructure.
Compute cash flows and delivered costs for hydrogen.
New FCEVs
Hydrogen Demand
Refueling Stations
FCEV Garagings
Hydrogen Transmission
Cash Flow Components
Scenario Evaluation, Regionalization, and Analysis: Cost of Regional Fueling Infrastructure
• Which pathways will provide least-cost hydrogen for a specified demand?
• What economies can be achieved with production facilities serving multiple demand centers?
• How will technologies compete with one another?

25
Regional Energy Deployment System
(ReEDS) Model
Short, W.; Sullivan, P.; Mai, T.; Mowers, M.; Uriarte, C.; Blair, N.;
Heimiller, D.; Martinez, A. (2011). Regional Energy Deployment
System (ReEDS). 94 pp.; NREL Report No. TP-6A20-46534.
www.nrel.gov/analysis/reeds
Contact: [email protected]
Key Features:
• Produces scenarios of electricity system development from
2010-2050 under a range of policy, technology, and economic
conditions.
• Optimizes sequential 2-year tranches of investment and
operation for least cost.
• Detailed spatial structure resolves patterns of load and
resource distribution, allows representation of transmission
needs.
• Full suite of electricity generating technologies: fossil,
renewable, nuclear, and electricity storage systems.
• Reduced transmission system obeys Kirchoff’s voltage law,
distributes power from generators to loads realistically.
• RETs are supported by detailed resource assessments and
supply curves.
• Statistical calculations describe how RETs contribute to
system adequacy and affect operational reliability, assuring
that ReEDS-developed electricity systems are robust.
Purpose: Regional Energy Deployment System (ReEDS) is a
linear optimization model of U.S. electricity investment and
operation focused on issues of particular importance to
developing renewable energy technologies (RETs).

26
Resource Planning Model (RPM)
Mai, T.; Drury, E.; Eurek, K.; Bodington, N.; Lopez, A.; Perry, A.
(2013). Resource Planning Model: An Integrated Resource
Planning and Dispatch Tool for Regional Electric Systems. 69
pp.; NREL Report No. TP-6A20-56723.
Contact: [email protected]
Key Features:
• Endogenously and dynamically considers grid integration of
renewable resources, including transmission and
interconnection availability and costs, renewable resource
limits and output characteristics, and dispatch options for
conventional generators, in its optimal decision-making.
• RPM is an hourly chronological model with a highly
discretized regional structure, and includes unit commitment
and economic dispatch modeling within its capacity
expansion framework.
• Initial version was developed to model the power system in
Colorado, but the model can be adaptable to other regions.
Current Developments:
• Inclusion of other BAs in the Western Interconnection to
better represent boundary conditions and to enable modeling
of other Western U.S. systems (e.g. Southwest)
• DC optimal power flow modeling
• Unit- and line-specific modeling within the focus study region
• Improved clustering methods developed to more rigorously
aggregate solar, wind, and demand for model representation
Purpose: New capacity expansion model with high spatial and
temporal resolution that can be used for mid- and long-term
scenario planning of regional power systems. Developed with a
flexible platform to model a large number of focus regions.

27
PLEXOS Integrated Energy Model
Recent study:
Lew, D., et al. (2013). The Western Wind and Solar Integration
Study Phase 2, NREL/TP-5500-55588. Golden, CO: National
Renewable Energy Laboratory.
Contact: [email protected]
Key Features:
• Performs unit commitment and economic dispatch at nodal or
zonal resolution at time steps as small as 5 minutes.
• Optimizes usage of enabling technologies, such as demand
response, plug-in vehicle charging, and electricity storage.
• DC optimal power flow modeling
• Ability to model different types of ancillary services, market
horizons, and forecast windows
• Databases available for the eastern and western
interconnections in the U.S.
• Used for major studies including the Western Wind and Solar
Integration Study (Phase 2) and the Eastern Renewable
Generation Integration Study
• Mixed Integer Program
• Ability to model stochastic optimization
Current Developments:
• Integrated gas-electricity sector energy model
• Ability to run on a High Performance Computing cluster
• Refining database for the eastern interconnection
Purpose: Commercial electric power system simulation tool that
can help understand the issues associated with integration of
variable and uncertain generation technologies.


