
Joint Services Data Exchange, May 2002
Performance and Jamming Test Results of a Digital Beamforming GPS Receiver
Alison Brown, NAVSYS Corporation
BIOGRAPHY Alison Brown is the President and CEO of NAVSYS Corporation. She has a PhD in Mechanics, Aerospace, and Nuclear Engineering from UCLA, an MS in Aeronautics and Astronautics from MIT, and an MA in Engineering from Cambridge University. In 1986, she founded NAVSYS Corporation. Currently she is a member of the GPS-III Independent Review Team and Scientific Advisory Board for the USAF and serves on the GPS World editorial advisory board. ABSTRACT NAVSYS High Gain Advanced GPS Receiver (HAGR) uses a digital beamsteering antenna array to track up to twelve GPS satellites on L1 and L2, each with up to 10 dBi of additional antenna gain over a conventional receiver solution. This digital, reprogrammable architecture provides a cost-effective solution for military applications where precision GPS measurements are needed. The additional gain provided on the satellite signals by the HAGR significantly increases the precision of the observed P(Y) code pseudo-ranges and carrier phase. The HAGR digital beamforming receiver maintains the digital beams directed at each satellite using the receiver’s navigation solution, using aiding information from an inertial navigator or attitude reference and the satellite position derived from the ephemeris data. This directivity also improves the Anti-Jamming rejection of the GPS receiver. This paper describes the operation of the HAGR digital beam steering array and presents test results showing the precision navigation capability. Test results from the HAGR at the Electronic Proving Grounds, Fort Huachuca, during jamming tests are also presented that demonstrate the anti-jam performance of a beamsteering receiver.
INTRODUCTION
A key requirement for aircraft precision approach and landing systems is to provide high quality GPS pseudo-range and carrier phase observations in both the ground reference station and the aircraft making the approach. For military applications, such as the Joint Precision Approach and Landing System (JPALS) and the Navy’s Shipboard Relative GPS (SRGPS) carrier landing system, the measurement precision must be maintained in a hostile environment, where GPS jamming may occur, and also using GPS reference stations installed in less than ideal locations, for example on the mast of a ship where significant signal multipath can corrupt the measurement performance. NAVSYS has developed a digital beam-steering GPS receiver which processes the GPS data from a multi-element phased array antenna. This has significant performance advantages over previous GPS reference station architectures which used a single reference antenna. In particular, the digital beam-steering approach has the following benefits in meeting the military JPALS or SRGPS key requirements. 1. Must provide high accuracy pseudo-range
and carrier –phase observations The beam-steering provides gain in the direction of the GPS satellites increasing their effective C/N0Gain from beam-forming The increase in C/N0 on the GPS satellites reduces the pseudo-range and carrier-phase measurement noise improving the navigation solution accuracy.
2. Must be able to maintain precision in the presence of close-in multipath The digital beam-steering optimizes the adaptive antenna pattern for each satellite tracked. This provides gain in the direction of the desired satellite signal and will attenuate signals arriving from other directions, such as close-in multipath. This allows the GPS signal integrity to be maintained even under non-ideal antenna installation scenarios.
3. Must be able to maintain performance in a jamming environment. With conventional

Report Documentation Page Form ApprovedOMB No. 0704-0188
Public reporting burden for the collection of information is estimated to average 1 hour per response, including the time for reviewing instructions, searching existing data sources, gathering andmaintaining the data needed, and completing and reviewing the collection of information. Send comments regarding this burden estimate or any other aspect of this collection of information,including suggestions for reducing this burden, to Washington Headquarters Services, Directorate for Information Operations and Reports, 1215 Jefferson Davis Highway, Suite 1204, ArlingtonVA 22202-4302. Respondents should be aware that notwithstanding any other provision of law, no person shall be subject to a penalty for failing to comply with a collection of information if itdoes not display a currently valid OMB control number.
1. REPORT DATE MAY 2002 2. REPORT TYPE
3. DATES COVERED 00-00-2002 to 00-00-2002
4. TITLE AND SUBTITLE Performance and Jamming Test Results of a Digital Beamforming GPSReceiver
5a. CONTRACT NUMBER
5b. GRANT NUMBER
5c. PROGRAM ELEMENT NUMBER
6. AUTHOR(S) 5d. PROJECT NUMBER
5e. TASK NUMBER
5f. WORK UNIT NUMBER
7. PERFORMING ORGANIZATION NAME(S) AND ADDRESS(ES) NAVSYS Corporation,14960 Woodcarver Road,Colorado Springs,CO,80921
8. PERFORMING ORGANIZATIONREPORT NUMBER
9. SPONSORING/MONITORING AGENCY NAME(S) AND ADDRESS(ES) 10. SPONSOR/MONITOR’S ACRONYM(S)
11. SPONSOR/MONITOR’S REPORT NUMBER(S)
12. DISTRIBUTION/AVAILABILITY STATEMENT Approved for public release; distribution unlimited
13. SUPPLEMENTARY NOTES The original document contains color images.
14. ABSTRACT see report
15. SUBJECT TERMS
16. SECURITY CLASSIFICATION OF: 17. LIMITATION OF ABSTRACT
18. NUMBEROF PAGES
11
19a. NAME OFRESPONSIBLE PERSON
a. REPORT unclassified
b. ABSTRACT unclassified
c. THIS PAGE unclassified
Standard Form 298 (Rev. 8-98) Prescribed by ANSI Std Z39-18
2
analog null-steering electronics, significant segments of the sky are “blanked” out when a jammer (or jammers) are detected and nulled. This will cause the GPS UE to lose lock on multiple satellites whenever jammers are detected, reducing the satellite coverage factor. With the beam-steering approach, the antenna pattern is optimized to increase the satellite gain. This improves the satellite coverage factor increasing the availability of precision approach and landing capability in the presence of jamming
In this paper, the design of a military P(Y) code digital beam-steering GPS receiver is described and test results are included showing the receiver performance in providing high accuracy code and carrier phase observations, reducing the effect of multipath errors, and tracking the GPS satellites in the presence of a GPS jammer.
HIGH GAIN ADVANCED GPS RECEIVER
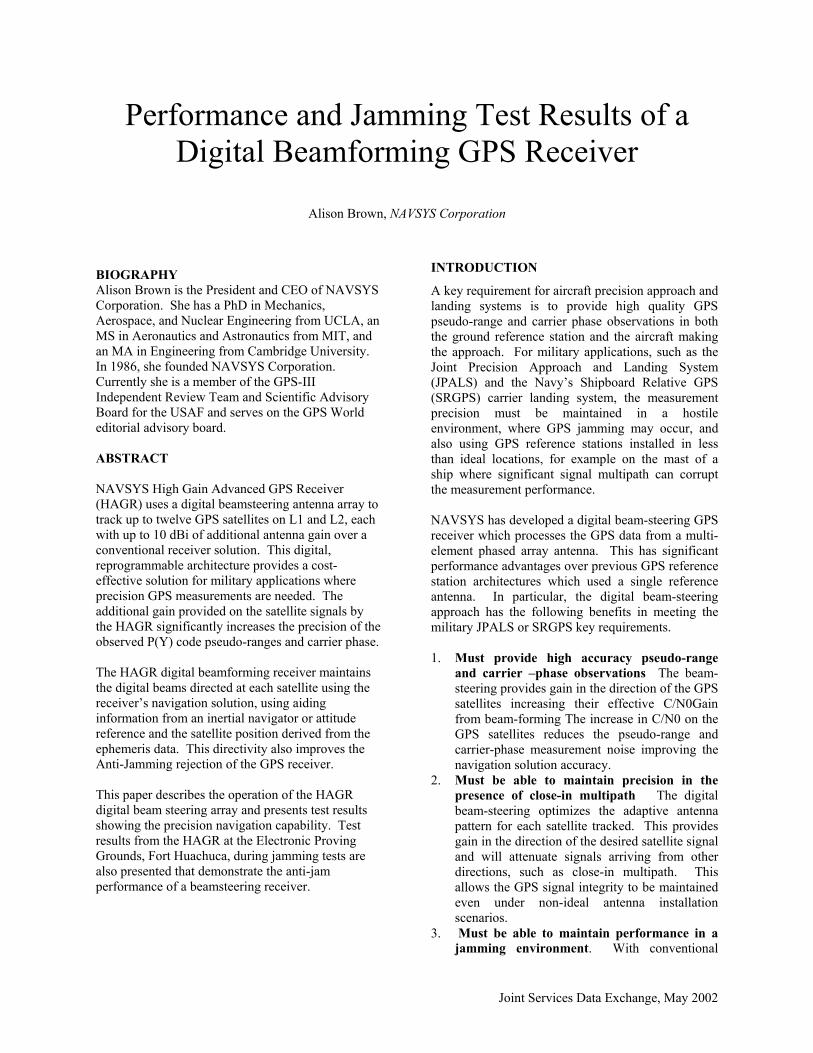
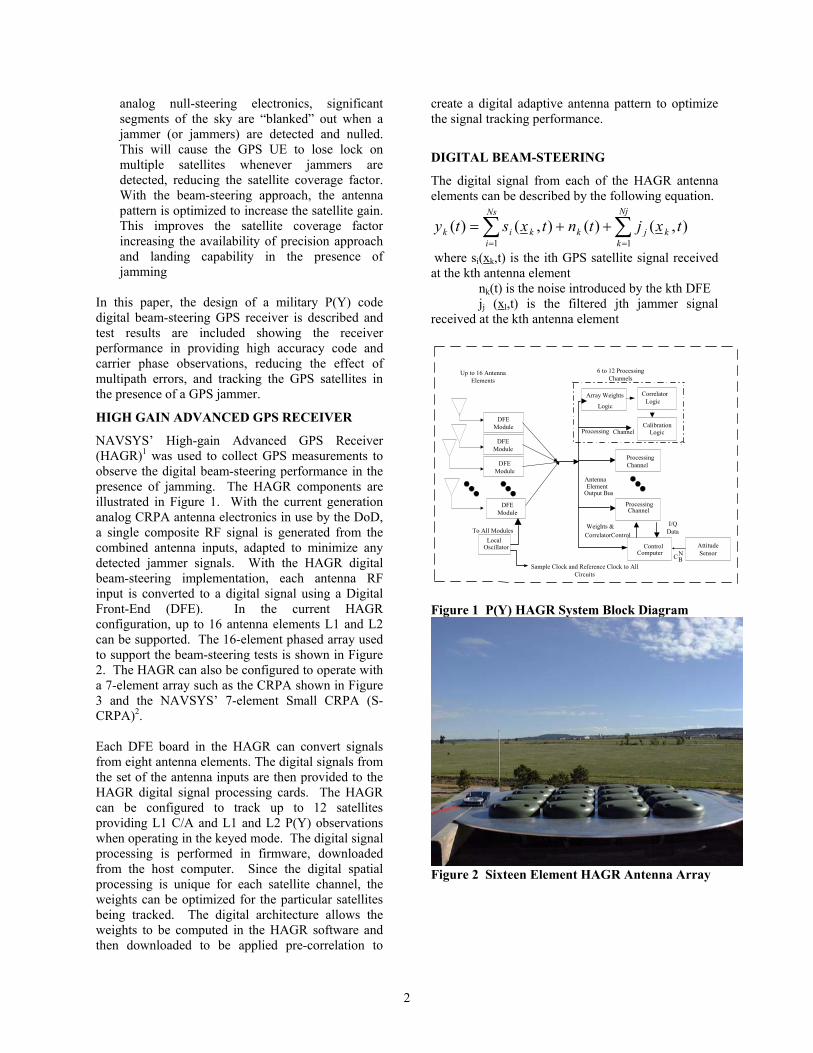
NAVSYS’ High-gain Advanced GPS Receiver (HAGR)1 was used to collect GPS measurements to observe the digital beam-steering performance in the presence of jamming. The HAGR components are illustrated in Figure 1. With the current generation analog CRPA antenna electronics in use by the DoD, a single composite RF signal is generated from the combined antenna inputs, adapted to minimize any detected jammer signals. With the HAGR digital beam-steering implementation, each antenna RF input is converted to a digital signal using a Digital Front-End (DFE). In the current HAGR configuration, up to 16 antenna elements L1 and L2 can be supported. The 16-element phased array used to support the beam-steering tests is shown in Figure 2. The HAGR can also be configured to operate with a 7-element array such as the CRPA shown in Figure 3 and the NAVSYS’ 7-element Small CRPA (S-CRPA)2. Each DFE board in the HAGR can convert signals from eight antenna elements. The digital signals from the set of the antenna inputs are then provided to the HAGR digital signal processing cards. The HAGR can be configured to track up to 12 satellites providing L1 C/A and L1 and L2 P(Y) observations when operating in the keyed mode. The digital signal processing is performed in firmware, downloaded from the host computer. Since the digital spatial processing is unique for each satellite channel, the weights can be optimized for the particular satellites being tracked. The digital architecture allows the weights to be computed in the HAGR software and then downloaded to be applied pre-correlation to
create a digital adaptive antenna pattern to optimize the signal tracking performance.
DIGITAL BEAM-STEERING
The digital signal from each of the HAGR antenna elements can be described by the following equation.
∑ ∑= =
++=Ns
i
Nj
kkjkkik txjtntxsty
1 1),()(),()(
where si(xk,t) is the ith GPS satellite signal received at the kth antenna element nk(t) is the noise introduced by the kth DFE jj (xl,t) is the filtered jth jammer signal received at the kth antenna element
DFEModule
DFEModule
DFEModule
DFEModule
LocalOscillator
To All Modules
Sample Clock and Reference Clock to AllCircuits
Array Weights
Logic
CorrelatorLogic
CalibrationLogic
Processing
ProcessingChannel
Up to 16 AntennaElements
AntennaElement
Output Bus
6 to 12 ProcessingChannels
ControlComputer
I/QData
Weights &CorrelatorControl
AttitudeSensorC
Processing Channel
NB
Channel
Figure 1 P(Y) HAGR System Block Diagram
Figure 2 Sixteen Element HAGR Antenna Array
3
Figure 3 Seven-Element CRPA and Mini-Array The GPS satellite signal at each antenna element (xk) can be calculated from the following equation.
sikikTiiki etsxitstxs ),0()12exp{),0(),( =−=
λπ
where si(0,t) is the satellite signal at the array center and 1i is the line-of-sight to that satellite
esik are the elements of a vector of phase angle offsets for satellite i to each element k
The combined digital array signal, z(t), is generated from summing the weighted individual filtered DFE signals. This can be expressed as the following equation.
++′=′= ∑ ∑
= =
Ns
i
Nj
ljljsii etjtnetswtywtz
1 1)()()()()(
With beam-steering, the optimal weights are selected to maximize the signal/noise ratio to the particular satellite being tracked. These are computed from the satellite phase angle offsets as shown in the following equation.
s
MTi
Ti
BS exi
xi
w =
−
−
=
)12exp{.
)12exp{ 1
λπ
λπ
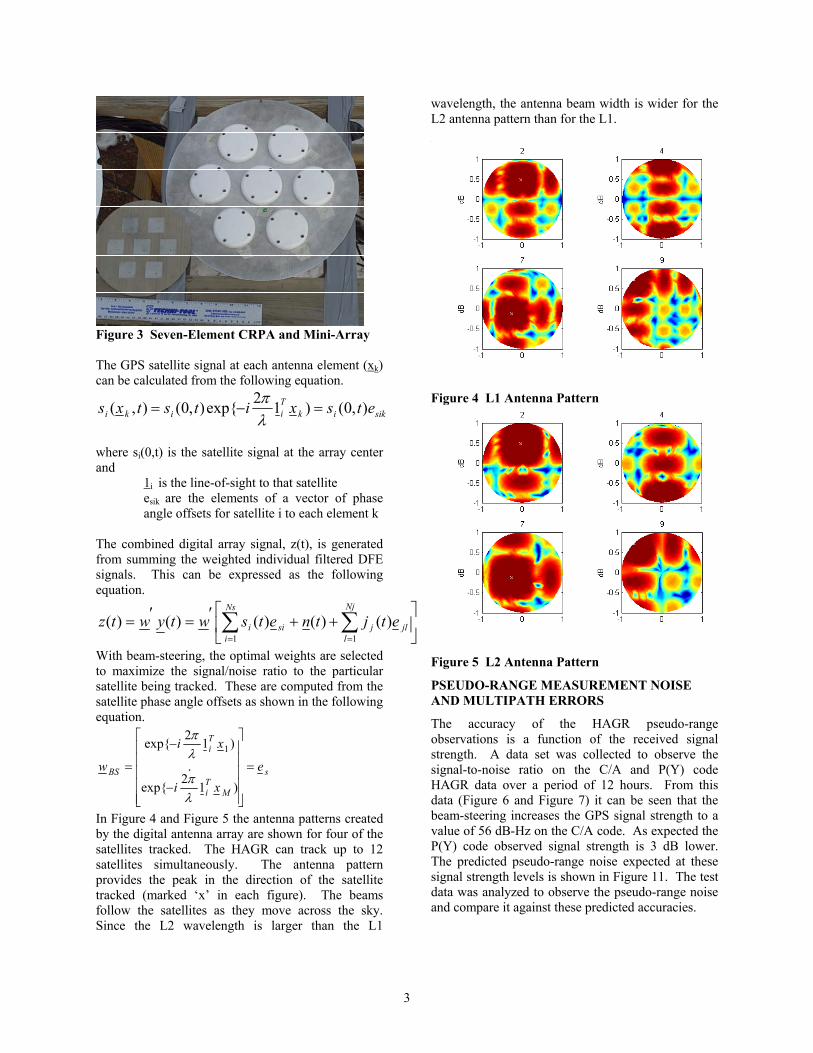
In Figure 4 and Figure 5 the antenna patterns created by the digital antenna array are shown for four of the satellites tracked. The HAGR can track up to 12 satellites simultaneously. The antenna pattern provides the peak in the direction of the satellite tracked (marked ‘x’ in each figure). The beams follow the satellites as they move across the sky. Since the L2 wavelength is larger than the L1
wavelength, the antenna beam width is wider for the L2 antenna pattern than for the L1.
Figure 4 L1 Antenna Pattern
Figure 5 L2 Antenna Pattern
PSEUDO-RANGE MEASUREMENT NOISE AND MULTIPATH ERRORS
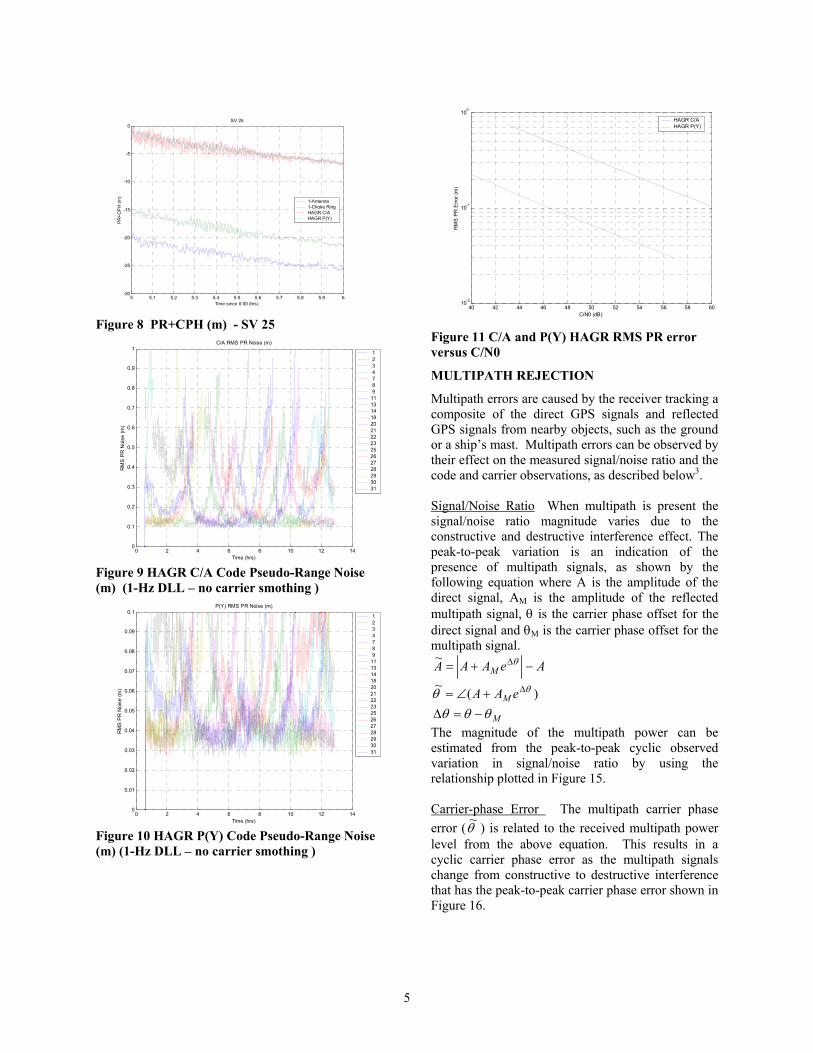
The accuracy of the HAGR pseudo-range observations is a function of the received signal strength. A data set was collected to observe the signal-to-noise ratio on the C/A and P(Y) code HAGR data over a period of 12 hours. From this data (Figure 6 and Figure 7) it can be seen that the beam-steering increases the GPS signal strength to a value of 56 dB-Hz on the C/A code. As expected the P(Y) code observed signal strength is 3 dB lower. The predicted pseudo-range noise expected at these signal strength levels is shown in Figure 11. The test data was analyzed to observe the pseudo-range noise and compare it against these predicted accuracies.

4
The GPS L1 pseudo-range and carrier-phase observations are described by the following equations.
)()()(
11
1111
111
iMTiiui
CPHi
PRiMTiiuii
IbRnNmCPH
nIbRmPR
θλλ
τ
+∆+−+−+=
++∆+++=The
following errors affect the pseudo-range and carrier phase observations. 1. Ionosphere errors– (I) 2. Troposphere errors – these are the same on all of
the observations ( Ti∆ ) 3. Receiver Measurement Noise – these are
different on each of the observations ( 1PRn , 1CPHn )
4. Multipath Noise – these are different on each of the observations ( iM1τ , iM11θλ )
5. Satellite and Station Position error - these affect the ability to correct for the Range to the satellite (Ri)
6. Receiver clock offset (bu) From this equation, the L1 pseudo-range + carrier phase sum cancels out the common errors and the range to the satellite and observes the pseudo-range and multipath errors as well as the change in the ionospheric offset.
11
11111
111111111
2)(2
2)(
PRiMi
iMCPHPRiMi
iMCPHPRiMiii
nICnnIC
nNnImCPHPR
+++≈−++++=−++++=+
τθλτθλλτ
The PR+CPH is plotted in Figure 8 for SV 25 and each of the receiver data sets. The short term (<100 sec) white receiver noise was removed by passing the PR+CPH observation through a linear filter. The drift caused by the ionosphere on each observation was removed using a polynomial estimator. The remaining cyclic error is an estimate of the multipath pseudo-range errors. The RMS white noise on the pseudo-range observations was computed by differencing the PR+CPH measurement. This is shown in Figure 9 and Figure 10 for all of the satellites tracked for the C/A and P(Y) code observations. The observed PR noise shows good correspondence with the predicted values shown in Figure 11. For C/N0 values above 52 dB-Hz, the P(Y) code HAGR provided pseudo-range accuracies of 5 cm (1-sigma) while for C/N0 values above 55 dB-Hz the C/A code observations were accurate to 15 cm. These values are for 1-Hz observations without any carrier smoothing applied. The mean observed RMS accuracies are summarized below in Table 1 with the average peak multipath PR errors observed.
Table 1 Mean PR Noise and M-path Peak Errors (m) SVID C/A
HAGR RMS PR
C/A Mean Mpath PR
P(Y) HAGR RMS PR
P(Y) Mean Mpath PR
1 0.239 0.259 0.054 0.202 3 0.284 0.494 0.056 0.337 8 0.200 0.278 0.045 0.202 11 0.278 0.535 0.059 0.287 13 0.252 0.321 0.059 0.260 14 0.214 0.359 0.049 0.350 20 0.222 0.267 0.050 0.164 21 0.252 0.261 0.058 0.133 22 0.248 0.318 0.047 0.217 25 0.202 0.362 0.044 0.265 27 0.183 0.270 0.044 0.178 28 0.236 0.366 0.055 0.272 29 0.225 0.312 0.050 0.217 30 0.477 0.791 0.089 0.624 31 0.325 0.266 0.055 0.135
0 2 4 6 8 10 12 1442
44
46
48
50
52
54
56
58
60
62
C/N
0 (d
B-H
z)
Time (hrs)
C/A HAGR
1 2 3 4 7 8 9111314182021222325262728293031
Figure 6 C/A HAGR Signal-to-Noise (dB-Hz)
0 2 4 6 8 10 12 1438
40
42
44
46
48
50
52
54
56
58
C/N
0 (d
B-H
z)
Time (hrs)
P(Y) HAGR
1 2 3 4 7 8 9111314182021222325262728293031
Figure 7 P(Y) HAGR Signal-to-Noise (dB-Hz)
5
5 5.1 5.2 5.3 5.4 5.5 5.6 5.7 5.8 5.9 6-30
-25
-20
-15
-10
-5
0P
R+C
PH
(m)
SV 25
Time since 0:00 (hrs)
1-Antenna1-Choke RingHAGR C/AHAGR P(Y)
Figure 8 PR+CPH (m) - SV 25
0 2 4 6 8 10 12 140
0.1
0.2
0.3
0.4
0.5
0.6
0.7
0.8
0.9
1
RM
S P
R N
oise
(m)
Time (hrs)
C/A RMS PR Noise (m)
1 2 3 4 7 8 9111314182021222325262728293031
Figure 9 HAGR C/A Code Pseudo-Range Noise (m) (1-Hz DLL – no carrier smothing )
0 2 4 6 8 10 12 140
0.01
0.02
0.03
0.04
0.05
0.06
0.07
0.08
0.09
0.1
RM
S P
R N
oise
(m)
Time (hrs)
P(Y) RMS PR Noise (m)
1 2 3 4 7 8 9111314182021222325262728293031
Figure 10 HAGR P(Y) Code Pseudo-Range Noise (m) (1-Hz DLL – no carrier smothing )
40 42 44 46 48 50 52 54 56 58 6010-2
10-1
100
C/N0 (dB)
RM
S P
R E
rror (
m)
HAGR C/AHAGR P(Y)
Figure 11 C/A and P(Y) HAGR RMS PR error versus C/N0
MULTIPATH REJECTION
Multipath errors are caused by the receiver tracking a composite of the direct GPS signals and reflected GPS signals from nearby objects, such as the ground or a ship’s mast. Multipath errors can be observed by their effect on the measured signal/noise ratio and the code and carrier observations, as described below3. Signal/Noise Ratio When multipath is present the signal/noise ratio magnitude varies due to the constructive and destructive interference effect. The peak-to-peak variation is an indication of the presence of multipath signals, as shown by the following equation where A is the amplitude of the direct signal, AM is the amplitude of the reflected multipath signal, θ is the carrier phase offset for the direct signal and θM is the carrier phase offset for the multipath signal.
M
M
M
eAA
AeAAA
θθθθ θ
θ
−=∆+∠=
−+=
∆
∆
)(~
~
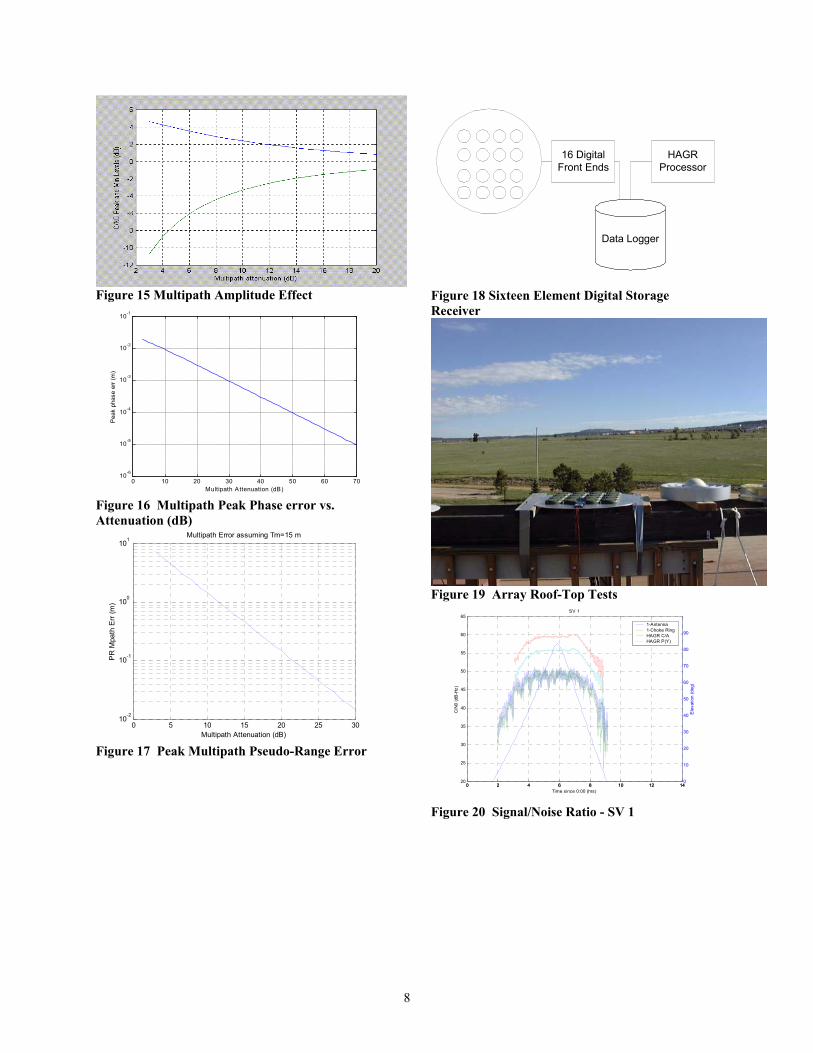
The magnitude of the multipath power can be estimated from the peak-to-peak cyclic observed variation in signal/noise ratio by using the relationship plotted in Figure 15. Carrier-phase Error The multipath carrier phase error (θ~ ) is related to the received multipath power level from the above equation. This results in a cyclic carrier phase error as the multipath signals change from constructive to destructive interference that has the peak-to-peak carrier phase error shown in Figure 16.
6
Pseudo-range Error For close-in multipath, where the additive delay Mτ is small compared with the code chip length, the Delay Locked Loop (DLL) will converge to a value between the correct pseudo-range and the multipath pseudo-range resulting in an error that can be approximated by the following equation.
MM
AA
ττ 2
2~ =
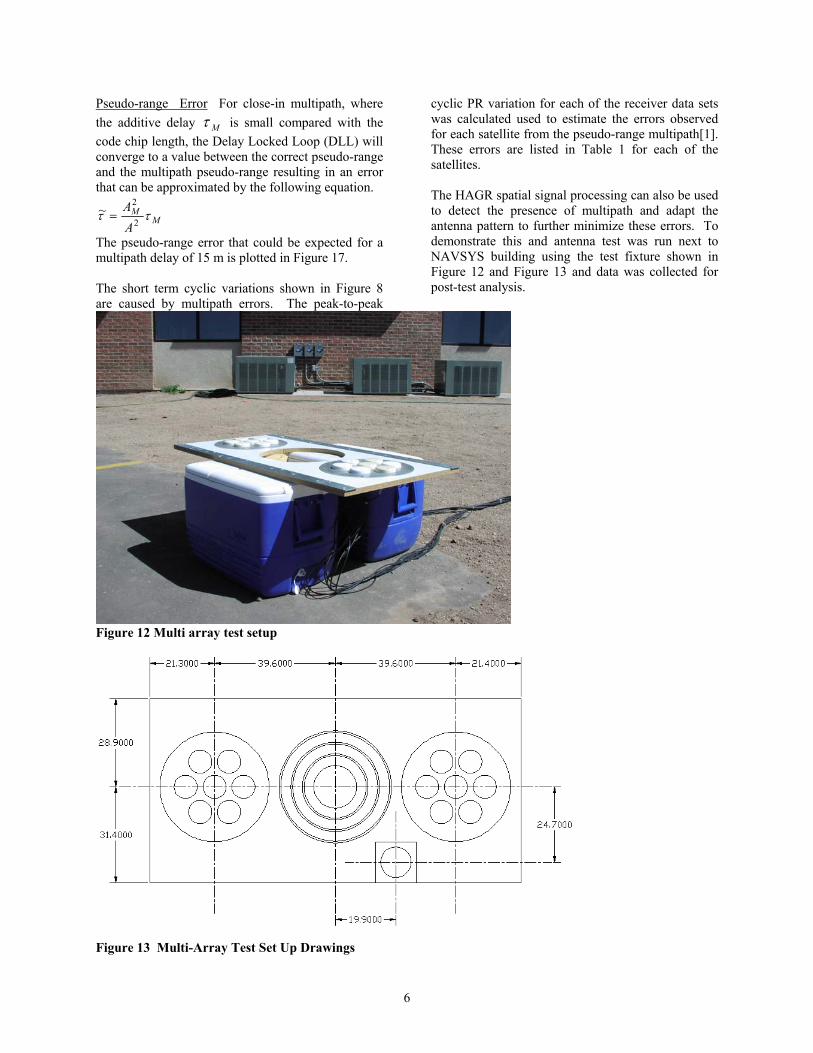
The pseudo-range error that could be expected for a multipath delay of 15 m is plotted in Figure 17. The short term cyclic variations shown in Figure 8 are caused by multipath errors. The peak-to-peak
cyclic PR variation for each of the receiver data sets was calculated used to estimate the errors observed for each satellite from the pseudo-range multipath[1]. These errors are listed in Table 1 for each of the satellites. The HAGR spatial signal processing can also be used to detect the presence of multipath and adapt the antenna pattern to further minimize these errors. To demonstrate this and antenna test was run next to NAVSYS building using the test fixture shown in Figure 12 and Figure 13 and data was collected for post-test analysis.
Figure 12 Multi array test setup
Figure 13 Multi-Array Test Set Up Drawings
7
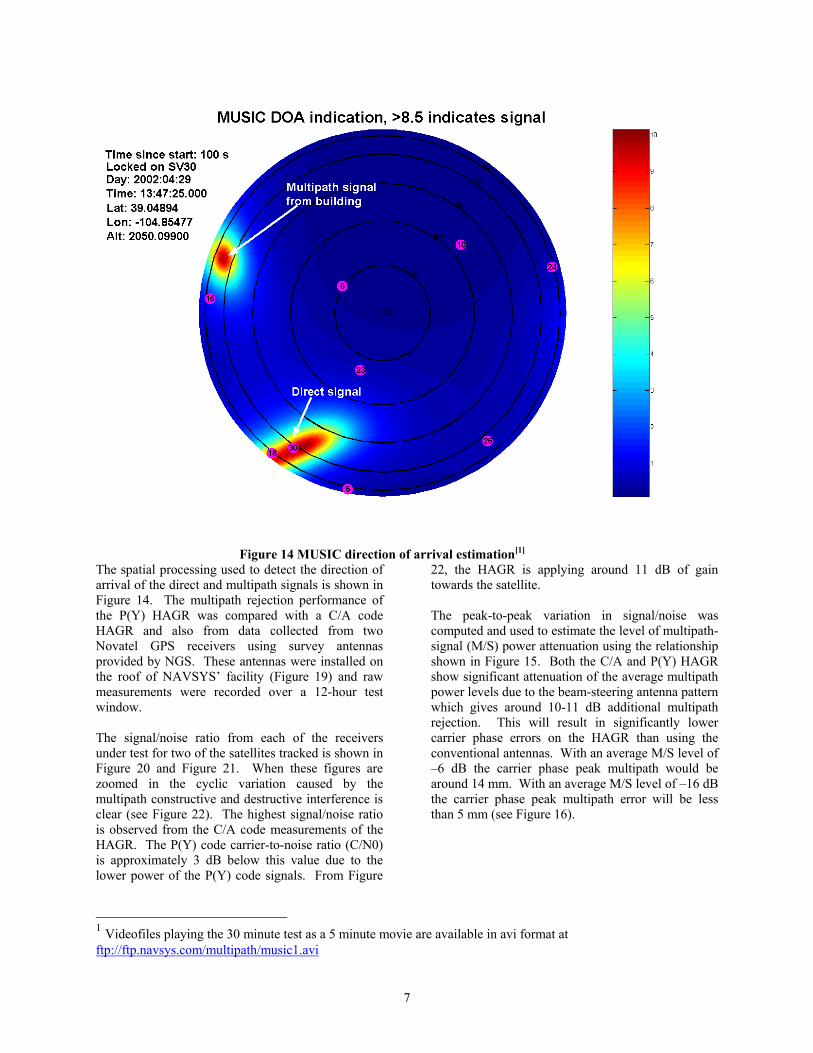
Figure 14 MUSIC direction of arrival estimation[1]
1 Videofiles playing the 30 minute test as a 5 minute movie are available in avi format at ftp://ftp.navsys.com/multipath/music1.avi
The spatial processing used to detect the direction of arrival of the direct and multipath signals is shown in Figure 14. The multipath rejection performance of the P(Y) HAGR was compared with a C/A code HAGR and also from data collected from two Novatel GPS receivers using survey antennas provided by NGS. These antennas were installed on the roof of NAVSYS’ facility (Figure 19) and raw measurements were recorded over a 12-hour test window. The signal/noise ratio from each of the receivers under test for two of the satellites tracked is shown in Figure 20 and Figure 21. When these figures are zoomed in the cyclic variation caused by the multipath constructive and destructive interference is clear (see Figure 22). The highest signal/noise ratio is observed from the C/A code measurements of the HAGR. The P(Y) code carrier-to-noise ratio (C/N0) is approximately 3 dB below this value due to the lower power of the P(Y) code signals. From Figure
22, the HAGR is applying around 11 dB of gain towards the satellite. The peak-to-peak variation in signal/noise was computed and used to estimate the level of multipath-signal (M/S) power attenuation using the relationship shown in Figure 15. Both the C/A and P(Y) HAGR show significant attenuation of the average multipath power levels due to the beam-steering antenna pattern which gives around 10-11 dB additional multipath rejection. This will result in significantly lower carrier phase errors on the HAGR than using the conventional antennas. With an average M/S level of –6 dB the carrier phase peak multipath would be around 14 mm. With an average M/S level of –16 dB the carrier phase peak multipath error will be less than 5 mm (see Figure 16).
8
Figure 15 Multipath Amplitude Effect
0 10 20 30 40 50 60 7010-6
10-5
10-4
10-3
10-2
10-1
Multipath Attenuation (dB)
Pea
k ph
ase
err (
m)
Figure 16 Multipath Peak Phase error vs. Attenuation (dB)
0 5 10 15 20 25 3010-2
10-1
100
101
PR
Mpa
th E
rr (m
)
Multipath Attenuation (dB)
Multipath Error assuming Tm=15 m
Figure 17 Peak Multipath Pseudo-Range Error
Data Logger
16 DigitalFront Ends
HAGRProcessor
Figure 18 Sixteen Element Digital Storage Receiver
Figure 19 Array Roof-Top Tests
0 2 4 6 8 10 12 1420
25
30
35
40
45
50
55
60
65
C/N
0 (d
B-H
z)
SV 1
Time since 0:00 (hrs)
1-Antenna1-Choke RingHAGR C/AHAGR P(Y)
0 2 4 6 8 10 12 140
10
20
30
40
50
60
70
80
90
Ele
vatio
n (d
eg)
Figure 20 Signal/Noise Ratio - SV 1
9
0 2 4 6 8 10 12 1420
25
30
35
40
45
50
55
60
65
C/N
0 (d
B-H
z)
SV 20
Time s ince 0:00 (hrs)
1-Antenna1-Choke RingHAGR C/AHAGR P(Y)
0 2 4 6 8 10 12 140
10
20
30
40
50
60
70
80
90
Ele
vatio
n (d
eg)
Figure 21 Signal/Noise Ratio SV 20
0 50 100 150 200 250 300 350 400 450 50046
48
50
52
54
56
58
60
C/N
0 (d
B-H
z)
S V 1
Tim e (secs )
1-A ntenna1-Choke RingHA G R C/AHA G R P (Y )
Figure 22 Signal/Noise Variation - SV 1
GPS JAMMER TESTS AND DATA COLLECTION
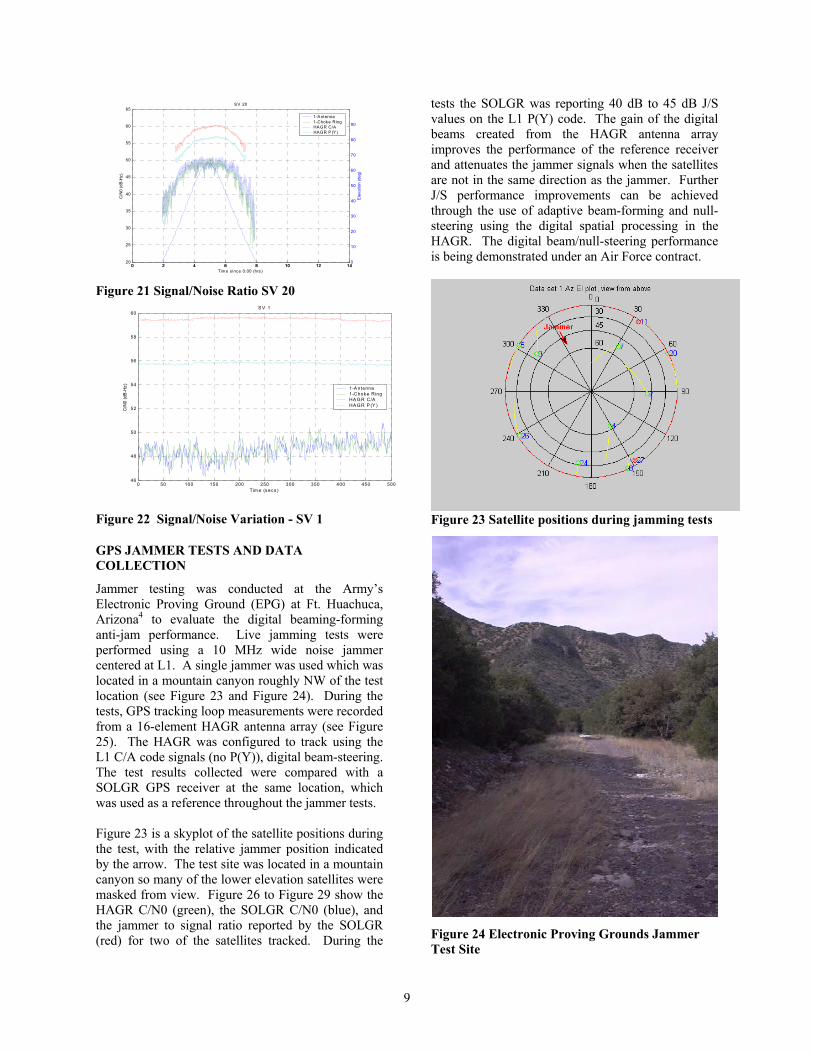
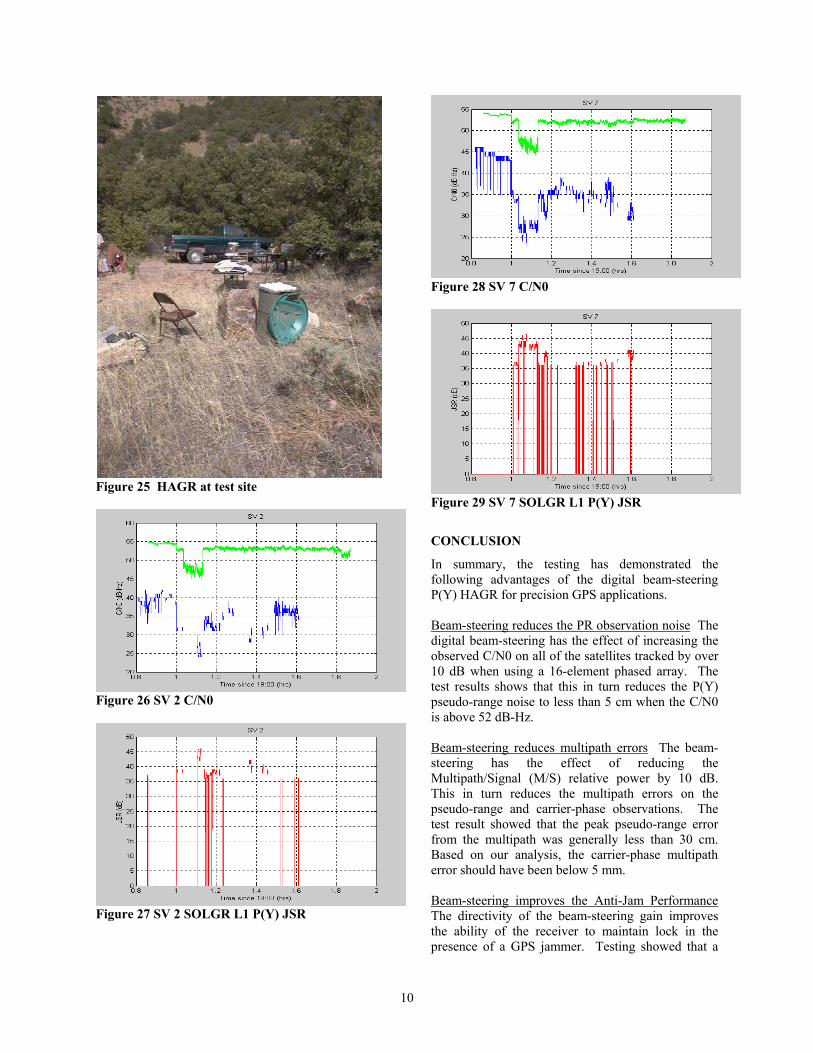
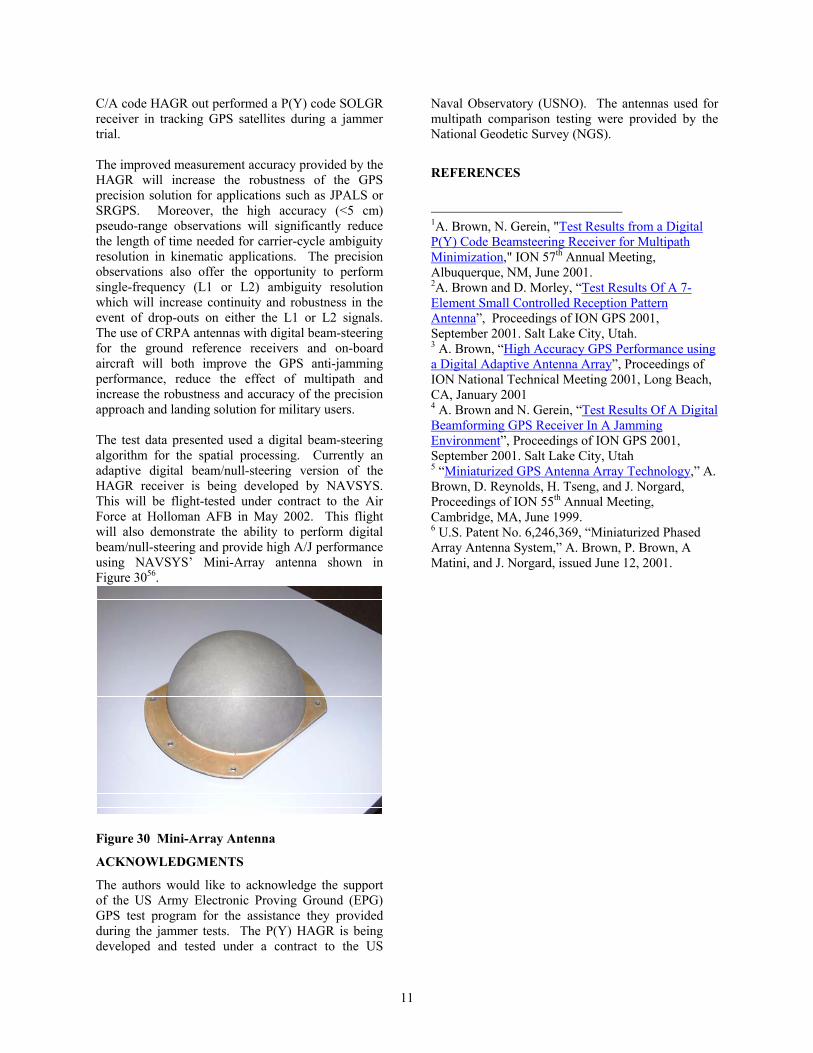
Jammer testing was conducted at the Army’s Electronic Proving Ground (EPG) at Ft. Huachuca, Arizona4 to evaluate the digital beaming-forming anti-jam performance. Live jamming tests were performed using a 10 MHz wide noise jammer centered at L1. A single jammer was used which was located in a mountain canyon roughly NW of the test location (see Figure 23 and Figure 24). During the tests, GPS tracking loop measurements were recorded from a 16-element HAGR antenna array (see Figure 25). The HAGR was configured to track using the L1 C/A code signals (no P(Y)), digital beam-steering. The test results collected were compared with a SOLGR GPS receiver at the same location, which was used as a reference throughout the jammer tests. Figure 23 is a skyplot of the satellite positions during the test, with the relative jammer position indicated by the arrow. The test site was located in a mountain canyon so many of the lower elevation satellites were masked from view. Figure 26 to Figure 29 show the HAGR C/N0 (green), the SOLGR C/N0 (blue), and the jammer to signal ratio reported by the SOLGR (red) for two of the satellites tracked. During the
tests the SOLGR was reporting 40 dB to 45 dB J/S values on the L1 P(Y) code. The gain of the digital beams created from the HAGR antenna array improves the performance of the reference receiver and attenuates the jammer signals when the satellites are not in the same direction as the jammer. Further J/S performance improvements can be achieved through the use of adaptive beam-forming and null-steering using the digital spatial processing in the HAGR. The digital beam/null-steering performance is being demonstrated under an Air Force contract.
Figure 23 Satellite positions during jamming tests
Figure 24 Electronic Proving Grounds Jammer Test Site
10
Figure 25 HAGR at test site
Figure 26 SV 2 C/N0
Figure 27 SV 2 SOLGR L1 P(Y) JSR
Figure 28 SV 7 C/N0
Figure 29 SV 7 SOLGR L1 P(Y) JSR
CONCLUSION
In summary, the testing has demonstrated the following advantages of the digital beam-steering P(Y) HAGR for precision GPS applications. Beam-steering reduces the PR observation noise The digital beam-steering has the effect of increasing the observed C/N0 on all of the satellites tracked by over 10 dB when using a 16-element phased array. The test results shows that this in turn reduces the P(Y) pseudo-range noise to less than 5 cm when the C/N0 is above 52 dB-Hz. Beam-steering reduces multipath errors The beam-steering has the effect of reducing the Multipath/Signal (M/S) relative power by 10 dB. This in turn reduces the multipath errors on the pseudo-range and carrier-phase observations. The test result showed that the peak pseudo-range error from the multipath was generally less than 30 cm. Based on our analysis, the carrier-phase multipath error should have been below 5 mm. Beam-steering improves the Anti-Jam Performance The directivity of the beam-steering gain improves the ability of the receiver to maintain lock in the presence of a GPS jammer. Testing showed that a
11
C/A code HAGR out performed a P(Y) code SOLGR receiver in tracking GPS satellites during a jammer trial. The improved measurement accuracy provided by the HAGR will increase the robustness of the GPS precision solution for applications such as JPALS or SRGPS. Moreover, the high accuracy (<5 cm) pseudo-range observations will significantly reduce the length of time needed for carrier-cycle ambiguity resolution in kinematic applications. The precision observations also offer the opportunity to perform single-frequency (L1 or L2) ambiguity resolution which will increase continuity and robustness in the event of drop-outs on either the L1 or L2 signals. The use of CRPA antennas with digital beam-steering for the ground reference receivers and on-board aircraft will both improve the GPS anti-jamming performance, reduce the effect of multipath and increase the robustness and accuracy of the precision approach and landing solution for military users. The test data presented used a digital beam-steering algorithm for the spatial processing. Currently an adaptive digital beam/null-steering version of the HAGR receiver is being developed by NAVSYS. This will be flight-tested under contract to the Air Force at Holloman AFB in May 2002. This flight will also demonstrate the ability to perform digital beam/null-steering and provide high A/J performance using NAVSYS’ Mini-Array antenna shown in Figure 3056.
Figure 30 Mini-Array Antenna
ACKNOWLEDGMENTS
The authors would like to acknowledge the support of the US Army Electronic Proving Ground (EPG) GPS test program for the assistance they provided during the jammer tests. The P(Y) HAGR is being developed and tested under a contract to the US
Naval Observatory (USNO). The antennas used for multipath comparison testing were provided by the National Geodetic Survey (NGS).
REFERENCES
1A. Brown, N. Gerein, "Test Results from a Digital P(Y) Code Beamsteering Receiver for Multipath Minimization," ION 57th Annual Meeting, Albuquerque, NM, June 2001. 2A. Brown and D. Morley, “Test Results Of A 7-Element Small Controlled Reception Pattern Antenna”, Proceedings of ION GPS 2001, September 2001. Salt Lake City, Utah. 3 A. Brown, “High Accuracy GPS Performance using a Digital Adaptive Antenna Array”, Proceedings of ION National Technical Meeting 2001, Long Beach, CA, January 2001 4 A. Brown and N. Gerein, “Test Results Of A Digital Beamforming GPS Receiver In A Jamming Environment”, Proceedings of ION GPS 2001, September 2001. Salt Lake City, Utah 5 “Miniaturized GPS Antenna Array Technology,” A. Brown, D. Reynolds, H. Tseng, and J. Norgard, Proceedings of ION 55th Annual Meeting, Cambridge, MA, June 1999. 6 U.S. Patent No. 6,246,369, “Miniaturized Phased Array Antenna System,” A. Brown, P. Brown, A Matini, and J. Norgard, issued June 12, 2001.


