

4/17/2015
1
Physical Therapy in a Changing Health Care Market
It’s all about VALUE
“If the rate of change on the outside
exceeds
the rate of change on the inside . . .
the end is in sight.”
Jack Welch
Former CEO, GE
2
2222 BIGBIGBIGBIG ChangesChangesChangesChanges
3
1CONSOLIDATION
BIGBIGBIGBIG is Strong2
VALUEQuality ÷Cost
1111 POWERFULPOWERFULPOWERFULPOWERFULConceptConceptConceptConcept
4
The Triple Aim
Measurable Quality
Measurable Quality
An Exceptional
Patient Experience
An Exceptional
Patient Experience
Lower TOTAL Cost of
Care
Lower TOTAL Cost of
Care
5
1CONNECT
the Dots..
2Volume to..
ValueVolume Value
180°Incentives
3Change
Leadership
Resist
Fail
OK
Good
Great
4GettingBigger
Agenda
Connecting the
Opportunity Dots
6
Section 1
Health Care Reform and Value

4/17/2015
2
”We spent $3Trillion spent on health care in the US
in 2013.”
PwC Health Care Division
7
Health Care Reform and Value
The Message . . . We SPEND a LOT of money on health care in the US
Did YOU KNOW that . . .
”Approximately 50% of the $3Trillion spent on health care
in the US in 2012 was either unnecessary or duplicative.
That’s $1.5 Trillion that added no value to patients”
PwC Health Care Division
8
Health Care Reform and Value
The Message . . . We WASTE a LOT of money in health care delivery
Did YOU KNOW that . . .
“In 2013, the US spent 17% of its health care expenditures on musculoskeletal conditions.”
Optum Health – United Health Care
9
The Message . . .
MUSCULOSKELETAL PAIN is a major
cost driver in health care
Health Care Reform and Value
Did YOU KNOW that . . .
“In 2012, the most costly procedures performed in
US operating rooms were
10
The Message . . .
ORTHOPEDIC SURGERIES are the major
cost drivers in ORs
Health Care Reform and Value
1. Spinal Fusions2. Total Knee Replacements3. Cardiac Angioplasty4. Total Hip Replacements
Optum Health – United Health Group
Did YOU KNOW that . . .
“We must insure more people and reduce the rapidly
rising costs in health care so 100% of Americans can
get better care at a lower cost.”
The Affordable Care Act
11
The Message . . .
The GOVERNMENT DEMANDS
Greater Access Better Quality
Lower Total Costs
Health Care Reform and Value
Did YOU KNOW that . . .
12
The Message . . .
The GOVERNMENT DEMANDS accountability
Providers must measure their value to
reduce costs and improve health
Health Care Reform and Value
“We will hold providers “accountable” through
accountable care organizations, outcomes, and
financial risk sharing.”
The Affordable Care Act
Did YOU KNOW that . . .

4/17/2015
3
“Even if we have a President and Congress who repeal
the ACA – health care reform will continue. Rising
costs are unsustainable for the people who pay for
health care. Providers must deliver value.”
Executives from Minnesota Health Plans
13
The Message . . . The PRIVATE SECTOR demands Value
Health Plans and ACOs will hold provides
accountable
Health Care Reform and Value
Did YOU KNOW that . . .
“We have a shortage of 1° care MDs – we need at
least 300 more 1° care MDs in our small state and at
least that many ‘mid-level’ providers. It’s going to
get worse as more people are insured.”
Medical Director of Large Health Plan in the South
14
The Message . . .
We do not have enough PRIMARY CARE providers
in the US
Health Care Reform and Value
Did YOU KNOW that . . .
“PTs serve as primary care providers for
musculoskeletal pain in the US Military and at Keiser
Permanente. It reduces pressure on primary care
MDs, is more efficient, and more effective.”
US Military and Keiser Permanente
15
The Message . . .
Skilled PTs can serve a PRIMARY CARE ROLE
Health Care Reform and Value
Did YOU KNOW that . . .
“PT is the best treatment for LBP. Same day access
to PT reduces costs dramatically and with measurable
functional gains. VMMC LBP model Results . . .
50% faster RTW, 28% fewer MRIs.
Great results lead to more patients.”
CEO Virginia Mason Health System
16
The Message . . . QUICK ACCESS to SKILLED PTs can result in
lower TCOC and better outcomes
Health Care Reform and Value
Did YOU KNOW that . . .
“TOTAL COSTS associated with over 30,000 people with
LBP revealed that when PT was provided within 2 weeks
of the first 1°Care MD visit, TOTAL COSTS were
reduced. Delayed PT resulted in higher TOTAL COSTS.”
Julie Fritz, PT, PhD Intermountain Health System
Spine Magazine 2012
17
The Message . . .
EARLY ACCESS to PTs results in lower TCOC for
LBP patients in COMMERCIAL HEALTH systems
Health Care Reform and Value
Did YOU KNOW that . . .
“In a study of over 300,000 Medicare patients with
LBP, early access to physical therapists for those
patients resulted in LOWER TOTAL COST of CARE.”
Alfred Gellhorn, MD, University of Washington Med School
Spine Magazine
2012
18
The Message . . .
EARLY ACCESS to PTs results in lower TCOC for LBP
patients in the MEDICARE SYSTEM
Health Care Reform and Value
Did YOU KNOW that . . .

4/17/2015
4
“In a Health Plan – PT Network pilot, PTs using FOTO to
manage their care and focus on achieving high functional
outcomes reduced TCOC for shoulder conditions by 20%.
Reductions in hospital, imaging, ER, Urgent Care, Chiro,
and direct PT costs.”
TPI Value-Based Reimbursement Model
in a NE State
19
The Message . . .
VALUE-FOCUSED PT care can reduce TCOC
Health Care Reform and Value
Did YOU KNOW that . . .
For people with musculoskeletal conditions who received physical therapy, here’s a look at TCOC
Therapy Partners Data from Health Plan
in NE State
20
Upstream Costs 40% PT Costs 30% Downstream 30%
1° Care Visits, Imaging,
Injections, Orthopedic
Visits, Meds
Imaging, injections,
orthopedic visits,
surgery, surgery
center, hospital stays
Health Care Reform and Value
Did YOU KNOW that . . .
For people with musculoskeletal conditions who received physical therapy, here’s a look at TCOC
Therapy Partners data from a health plan
in a Southern state
21
Upstream Costs 50% PT Costs 35% Down
stream 15%
1° Care Visits, Lot of Imaging,
Injections, Very High Specialty
Medical Visits, DME
Follow up
visits Specialty
Med Fewer
Surg
Health Care Reform and Value
Did YOU KNOW that . . .
22
Health Care Reform and Value
What if . . .
Physical Therapy is moved UPSTREAM . . .
Upstream
50%
PT
35%
Downstream
15%
BEFORE AFTER
Upstream Costs
40%
PT Costs
30%
Downstream
30%
BEFORE PT AFTER PT
Upstream
20%
PT
45%
Downstream
35%TCOC
$BEFORE AFTER
TCOC
$$
TCOC
$$$
“A majority of providers are paid based on the volume of
services – FFS. More interventions provided results in higher
costs. Care decisions are often driven not by what is in the
best interest of the patient and our delivery system but by
what provides the highest provider reimbursement.”
The Strategy that Will Fix Health Care
Michael Porter - Strategist, Harvard Business School
23
The Message . . . FFS creates incentives that drive up cost, not quality
Health Care Reform and Value
Incentives Drive Behavior
Majority of providers, payors shift to Value Based Models
Am Health Ins Plan:
90% of payers - 81% of hospitals have mix of VBR and FFS
Expect FFS to decrease from 56% to 32% in 5 years
To Transform from FFS to Value Based Payment . . .
BCBS – Invests $65B http://bit.ly/BCBS65B
UHG – Invests $43B http://bit.ly/UnitedHealthMove
24
Health Care Reform and Value
Transformation to Value
The Message . . . VBR MODELS create incentives that drive up quality, drive
down costs

4/17/2015
5
”Only 7% of people with musculoskeletal conditions
received physical therapy
care in 2013.”
25
The Message . . .
A VERY SMALL PERCENTAGE of people see a
physical therapist to solve their musculoskeletal problem
Health Care Reform and Value
Yet. . . in spite of compelling evidence
26
Health Care Reform and Value
But. . .
We can blame the powerful decision makers at health plans
because they don’t know
Andmost have never viewed PT as a
SOLUTION
We see strong FACTS that PROVE
early PT brings down TOTAL
COSTS, and we are starting to see
effective, early PT elevates
quality/function/health.
Seems like a no-brainer.
Health Care Reform and Value
27
Team Discussion
So WHY do only 7% go to PT
and how can YOU change
that to 17%? Or 27%? . . .
The
Volume to ValueRevolution
Section 2
Health Care Reform and Value
28
Volume Value
180°Incentives
the BIGChange
Is in Provider Incentives
29
Volume Based $$ Incentives
Fee for Service
The More You Do The More You Get Paid
Value Based $$ Incentives
Outcomes Based Models
The Better the OutcomeThe Better the Payments
180°Financial Incentives
Health Care Reform and Value
When Financial Incentives
Change 180°. . .
Provider Behavior Must Change
Accordingly
30
Volume Based
Financial IncentivesValue Based
Financial Incentives
180°Financial Incentives
Health Care Reform and Value
4/17/2015
6
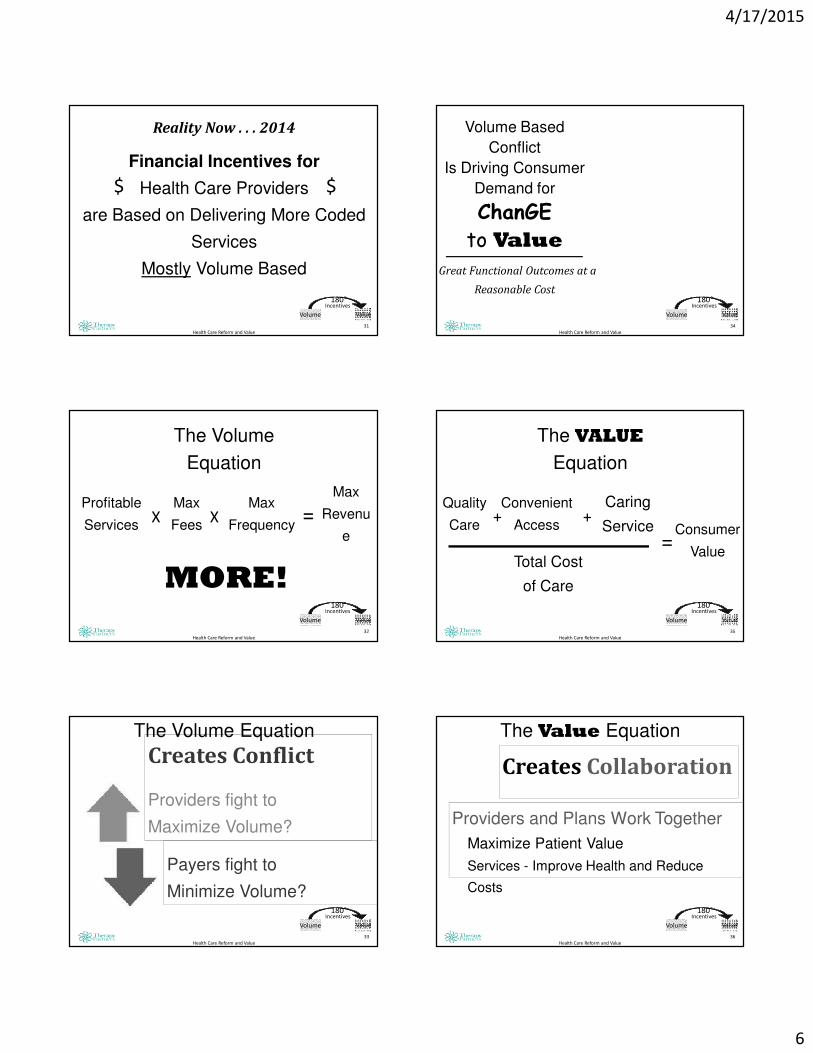
Reality Now . . . 2014
Financial Incentives for
Health Care Providers
are Based on Delivering More Coded
Services
Mostly Volume Based
31
$ $
Health Care Reform and Value
Volume Value
180°Incentives
Profitable
Services
32
The Volume
Equation
Health Care Reform and Value
Max
FeesX
Max
FrequencyX =
Max
Revenu
e
MORE!Volume Value
180°Incentives
33
Creates Conflict
Providers fight to
Maximize Volume?
The Volume Equation
Payers fight to
Minimize Volume?
Health Care Reform and Value
Volume Value
180°Incentives
Volume Based
Conflict
Is Driving Consumer
Demand for
ChanGE
to ValueGreat Functional Outcomes at a
Reasonable Cost
34
Health Care Reform and Value
Volume Value
180°Incentives
Quality
Care
35
The VALUE
Equation
Health Care Reform and Value
Convenient
Access+
Caring
Service+
=Consumer
ValueTotal Cost
of Care
Volume Value
180°Incentives
36
Creates Collaboration
The Value Equation
Health Care Reform and Value
Providers and Plans Work Together
Maximize Patient Value
Services - Improve Health and Reduce
Costs
Volume Value
180°Incentives
4/17/2015
7
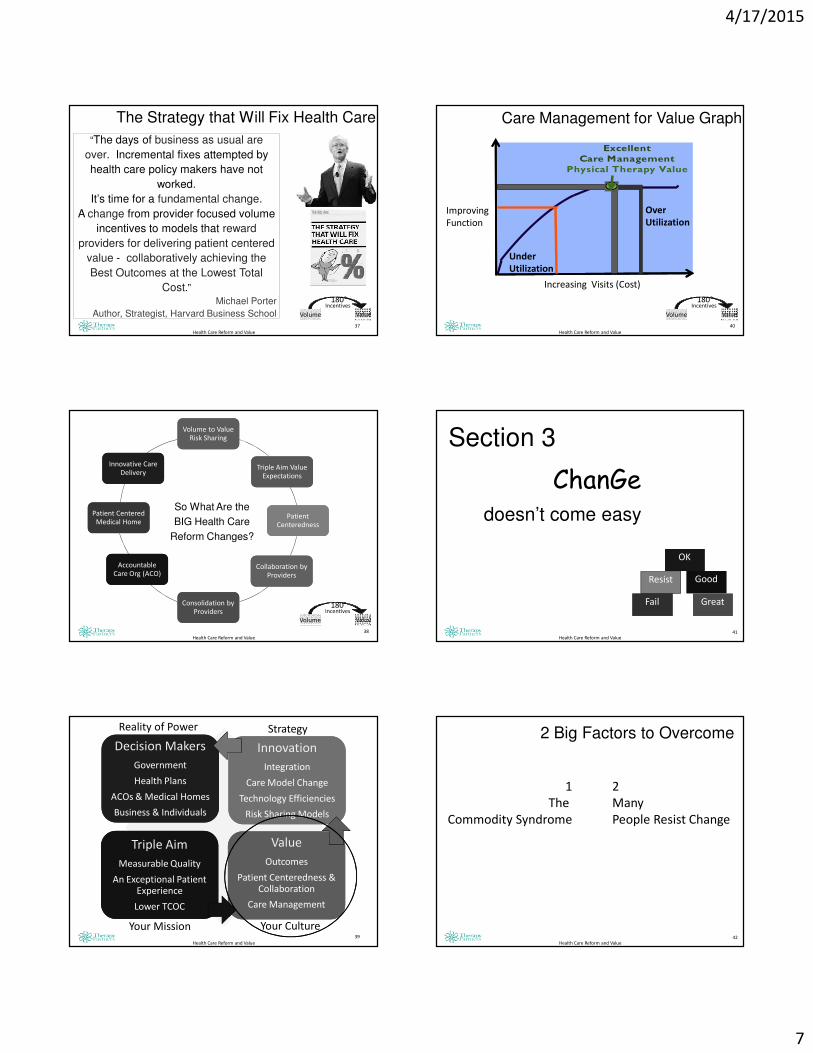
The Strategy that Will Fix Health Care
“The days of business as usual are
over. Incremental fixes attempted by
health care policy makers have not
worked.
It’s time for a fundamental change.
A change from provider focused volume
incentives to models that reward
providers for delivering patient centered
value - collaboratively achieving the
Best Outcomes at the Lowest Total
Cost.”Michael Porter
Author, Strategist, Harvard Business School
Health Care Reform and Value
37
Volume Value
180°Incentives
38
Health Care Reform and Value
So What Are the
BIG Health Care
Reform Changes?
Volume Value
180°Incentives
Volume to Value Risk Sharing
Volume to Value Risk Sharing
Triple Aim Value Expectations
Triple Aim Value Expectations
Patient Centeredness
Patient Centeredness
Collaboration by Providers
Collaboration by Providers
Consolidation by Providers
Consolidation by Providers
Accountable Care Org (ACO)
Accountable Care Org (ACO)
Patient Centered Medical Home
Patient Centered Medical Home
Innovative Care Delivery
Innovative Care Delivery
Health Care Reform and Value
39
Decision Makers
Government
Health Plans
ACOs & Medical Homes
Business & Individuals
Decision Makers
Government
Health Plans
ACOs & Medical Homes
Business & Individuals
Innovation
Integration
Care Model Change
Technology Efficiencies
Risk Sharing Models
Innovation
Integration
Care Model Change
Technology Efficiencies
Risk Sharing Models
Triple Aim
Measurable Quality
An Exceptional Patient Experience
Lower TCOC
Triple Aim
Measurable Quality
An Exceptional Patient Experience
Lower TCOC
Value
Outcomes
Patient Centeredness & Collaboration
Care Management
Value
Outcomes
Patient Centeredness & Collaboration
Care Management
Reality of Power Strategy
Your Mission Your Culture
40
Under
Utilization
Over
Utilization
Health Care Reform and Value
Improving
Function
Increasing Visits (Cost)
Care Management for Value Graph
Volume Value
180°Incentives
Excellent Care Management
Physical Therapy Value
41
ChanGedoesn’t come easy
Health Care Reform and Value
Section 3
Resist
Fail
OKOK
GoodGood
GreatGreat
42Health Care Reform and Value
2 Big Factors to Overcome
1
The
Commodity Syndrome
2
Many
People Resist Change

4/17/2015
8
43
A service or product that is delivered to the
market place and cost is the only factor in
determining its value.
Quality is not considered.
Health Care Reform and Value
The Commodity Syndrome
Health Care Reform and Value
44
Long Standing Combative
Relationship Provider and Payor
Long Standing Combative
Relationship Provider and Payor
High Profile Providers Get the
Focus
High Profile Providers Get the
Focus
Therapists Viewed as Ancillary to MDsTherapists Viewed as Ancillary to MDs
Plans Have a Silo Mentality of Cost
Control
Plans Have a Silo Mentality of Cost
Control
Lack of Significant Innovative Therapy
Solutions
Lack of Significant Innovative Therapy
Solutions
Few PTs Negotiate Contracts with Health Plans
Few PTs Negotiate Contracts with Health Plans
The Commodity Syndrome
So how did we get there??
45Health Care Reform and Value
Overcoming The Commodity Syndrome
46Health Care Reform and Value
Understand their
problem
Understand their
problem
Respect their
INTERESTS
Understand
their NEEDS
Determine Solution
They Don’t Even See
Determine Solution
They Don’t Even See
Exceed Their
Expectations
Exceed Their
Expectations
Overcoming The Commodity Syndrome
With the Powerful Decision Makers
47Health Care Reform and Value
But Change is Hard
IF you
SellVALUEYou must
DeliverVALUE
Resist
Fail
OK
Good
Great
48Health Care Reform and Value
ChanGe
Resist
Fail
OK
Good
Great

4/17/2015
9
49Health Care Reform and Value
Change? Lots of it . . .
Care ModelCollaboration
Manage Care
Decisions
Outcomes
DischargePlanning
Delegation
Communication
Population Healthvs Rehab
Resist
Fail
OK
Good
Great
50
Most People
Struggle with
Change and
Need Leaders
to Guide Them
and Managers
to Help Them
5-10%
Hate It!
Resist It!
Try to Make
It Fail!
15-20%
Hate It!
Resist It!
30-40%
Go with the Flow
But Won’t Try to
Convert Resistors15-20%
Embrace
Change
Convert
Resistors
5-10%
Love it!
I’m Your
Change
Champion
20-30%
Hold You
Back
50-70%
Take Your
Time
20-30%
Will Help
You
Health Care Reform and Value
How People Respond to Change
51Health Care Reform and Value
Resist
Fail
OK
Good
Great
52
Leaders at the Top
Vision
Drive Change - VALUE
Define Culture
Care
Leaders at the Top
Vision
Drive Change - VALUE
Define Culture
Care
Managers
Set Goals
Build Teams – Help through Change
Plan
Accountability
Managers
Set Goals
Build Teams – Help through Change
Plan
Accountability
Learn Grow
Role Model Leaders
Create a Positive Culture
Proactive Followers
Learn Grow
Role Model Leaders
Create a Positive Culture
Proactive Followers
Working Together
High Performing Team
Excellent Outcomes
Clinic Team
Working Together
High Performing Team
Excellent Outcomes
Clinic Team
Success During Times of ChangeSuccess During
Times of Change
Health Care Reform and Value
Resist
Fail
OK
Good
Great
Section 4
CONSOLIDATION
BIG is Strong
Minnesota Health Care Market
BIG is Strong

4/17/2015
10
Consolidation
3 Health PlansDominate
BCBS-
Mn
Health
PartnersMedica
Consolidation
4 ACOsDominateTwin CitiesAllina
Fairview University
HealthPartners
Park Nicollet
Health East
Consolidation
5 Care Systems/ ACOsDominateOutstate MnEssentia
Sanford
Avera
McKennon
Mayo CentraCare
Consolidation
85%
of Primary Care MDsIn Twin Cities
Are Employed by ACOs
Consolidation
Vast Majority
SpecialistsDominateTwin Cities
Gastro
Twin Cities
Ortho
Summit
Ortho
at Fairview
U of M
Phys Heart
at Fairview
Consolidation
WHY??
The Reason they Should Consolidate . . .
Improve Care
The Reason they DO Consolidate . . .
Negotiating Strength with
Health Plans

4/17/2015
11
So how about
The Independent
Physical Therapy
Practices?
Health Care Reform and Value
62
Practice Owners Have 4 Options
Stay
the
Course
Don’t consolidate
Small is better
Depend on Relationship
sCash or Out of Network
1
Grow
My
Own
Open new clinicsGrow
existing clinics
Buy other practices
Merge
2
Time
To
Sell
Consider the Big Guys
Culture Fit?CorporateSell 100%
CombinationSell 51-90%
3
Get Big
Stay
Small
Keep Practice
Collaborate with others
NetworkDetermine Value Add
Differentiate
4
63
Get Bigger Options – Value
Merge
Acquire Sell
Single TIN
Simplicity
Efficiencies
Size
Governance
High Control
Stability
Share risk
High
Accountability
Value ?
MSO
Single TIN
Simplicity
Efficiencies
Size
Governance
Control
Stability
Share risk
Accountability
High Ability to
deliver value
IPA
Multiple TINs
Complexity
No efficiencies
Size
Loose Govern.
Limited Control
Unstable
Share risk
Little Account.
Value delivery a
challenge
Network
Multiple TINs
Complexity
No efficiencies
Size
No Govern.
No Control
Unstable
No risk share
No Account.
No Value
delivery
FEAR
Small practices at risk
REALITY of POWER
Must connect with powerful decision-makers
64
WHY Make this Big Change?
STRENGTH
65
WHY
Health Plan or
ACO
Contracting &
Credentialing
Process Claims
from
Practices
Make
Payments to
Practices
Complexity
Practice
3
Practice
4
Practice
1
Practice
2
Practice
8
Practice
7
Practice
6
Practice
5
66

4/17/2015
12
Practice
7
Practice
5
Practice
3
Practice
1
Practice
8
Practice
6
Practice
4
Practice
2Organize Under a Single Tax
ID Number
One Source Contracting, Risk
Sharing, Credentialing, and
Care Management
Billing DepartmentBilling and
A/R Management
Payment Processing,
Posting and Distribution
to Practices
Health Plan or
ACO
Contracting with
Risk Sharing
Arrangements
Process Claims
from
Big Provider
Group
Make
Payments to
Big Group
Simplicity
67
Health Plan or
ACO
Invests to
Control Cost
UM
for Cost Control
Ave Visits – 12.8
Range – 8.5 to
18.5
Care Management
for Quality
No Consistent
Quality Measures
Practice
3Ave Visits – 10.0
Functional Outcomes - ?
Practice
4Ave Visits – 18.5
Functional Outcomes - ?
Practice
1 Ave Visits – 12.5
Functional Outcomes - ?
Practice
2Ave Visits – 14.1
Functional Outcomes – ?
8 Practice
8 Ave Visits – 8.5 Functional
Outcomes - ?
7 Practice
7 Ave Visits - 17.0
Functional Outcomes - ?
6 Practice
6 Average Visits - 9.8
Functional Outcomes - ?
5 Practice
5 Average Visits – 13.0
Functional Outcomes - ?
Inconsistency
68
Health Plan or
ACO
No Financial
or Human
Resources
Devoted to
Care or
Utilization
Management
Saves $$$$
Big Organization Measures
Outcomes
Efficiency
(Ave Visits or Cost)
Predictable Cost
Effectiveness
(Functional Improvement)
Predictable Functional
Change
Measurable
Value
Practice
1 Ave Visits 8.5
FOTO – 82%Visit &
Function Data
Visit &
Function Data
Visit &
Function Data
Visit &
Function Data
Visit &
Function Data
Visit &
Function Data
Visit &
Function Data
Practice
2 Ave Visits 8.2
FOTO – 77%
Practice
3 Ave Visits 8.0
FOTO – 75%
Practice
4Ave Visits 8.3
FOTO – 84%
Practice
5Ave Visits 8.0
FOTO – 78%
Practice
6Ave Visits 8.2
FOTO – 83%
Practice
7 Ave Visits 8.0
FOTO – 78%
Practice
8 Ave Visits 8.1
FOTO – 80%
Visit
&
Functional
Outcome
Data
Predictability
69
Must . . .
Have Some Size
Deliver Value
Be Willing to Share Financial Risk
Connect with Powerful Decision Makers
Be Able to Lead Change
. . .
PT is a Proven Solution
70
Tie it Together
Health Care Reform and Value
Physical Therapist and Physical Therapist Assistants in a Changing
Health Care Market
VALUE-BASED PAYMENTMODELS
PHYSICAL THERAPY POSITIONING AND BRAND
What Does the Data Show
Health Care Reform and Value
72

4/17/2015
13
Optum Health – CSM and WPTA conferences February, April 2014
data 2010-2012
Positioning of PT Services
Typical Clinical Pathway
Timing and Cost of Total Episode
Health Care Reform and Value
77
TPI Workers Comp Data

4/17/2015
14
Optum Consumer Focus Groups PT Brand
Optum Consumer Focus Groups PT Brand
“. . . And it makes me wonder”
–Led Zeppelin, Stairway to Heaven
Position
• Delayed onset of PT is a very common pathway
• Likewise significant cost in “upstream” portion of total cost
• “Silo” management is ineffective at controlling costs
• Effecting downstream costs is only part of the solution
Brand
• Extension of the doctor
• Start at the doctor first
• Time consuming
• This will take longer to get
results
• Temporary relief
• This is not a final solution
• Is our position a result of or
a cause of our brand?
Changing the Clinical Pathway
Financial Considerations-Risks and Incentives
Clinical Considerations-Outcomes and Value
Health Care Reform and Value
82
Financial Principle - 1
• Physical Therapists and
Physical Therapist
Assistants are revenue
generators
Financial Principle - 2
“One companies revenue,
is another companies line
item expense.”
Perry Hanson-Wipfli HC Consultant
Profit Margin
Return on Investment

4/17/2015
15
Risk and Incentives
Risk
• “It's important to
understand how people
perceive risk, and how that
translates into investment
behavior.”
Andrew Lo, Finance MIT
Incentives
• “The ideal of behaviorism is
to eliminate coercion: to
apply controls by changing
the environment in such a
way as to reinforce the kind
of behavior that benefits
everyone.”
B F Skinner
Health Care Reform and Value
85
Volume Value
180°Incentives
Payer Risk and Incentives
Risk
• More UNITS
• More VISITS
• More CASES
• POOR RESULTS – leading to
utilization of higher cost
services
• Medical loss ratio
• Overpayment on claims
Response (Incentive)
• Utilization Review (UR, UM
Dept.)
• Bill Review (Optum, Verisk)
• Code Bundling-NCCI, MPPR
• Annual visit limit
• Increased Co-pays
• Discount Networks (Align,
Orthonet)
Health Care Reform and Value
86
Volume Value
180°Incentives
Provider Risk and Incentives
Risk
• Decreasing
REIMBURSEMENT
• Increasing ADMINISTRATIVE
BURDEN (PQRS, FLR)
• Increased security and
OVERSIGHT (HIPPPA, PHI
policies)
• Increased CODE BUNDLING
(MPPR, NCCI)
Incentive
• Code higher RVU
• More codes per visit
• More visits per episode
• Higher productivity
standards
• Use of billing modifiers (59
or X, KX)
Health Care Reform and Value
87Volume Value
180°Incentives
Patient/Purchaser Risk
Risk
• Increased COST TO INSURE
• Mandatory ESSENTIAL
HEALTH BENEFIT
• POOR RESULTS – leading to
utilization of higher cost
services
• Shift cost to employee
• Making the wrong purchase
Incentive
• Increased DEDUCTIBLE
AMOUNT
• Increased CO-PAY Amount
• Health Resources vs. Health
Savings Account (HSA)
• Self-Insure, captive (less
regs. control benefits)
• Discount Networks (Align,
Orthonet)
Health Care Reform and Value
88
Volume Value
180°Incentives
Align Incentives
INCENTIVES
• Control UNITS = Per Diem
Payment
• Control UNITS and VISITS =
Episodic or Case Rate
• Control UNITS, VISITS, and
CASES = Capitation. Too
risky for therapy.
• Control EPISODE COST =
Bundling, TCOC
RISK• PROVIDER must control visit
units
• PROVIDER must know cost to deliver a visit
• PROVIDER must know all
costs and ratio of PT to population statistics
• PROVIDER must know
cost to deliver care, able to address upstream costs
Health Care Reform and Value
89
Quality
Care
90
The VALUE
Equation
Health Care Reform and Value
Convenient
Access+
Caring
Service+
=Consumer
ValueTotal Cost
of Care
Volume Value
180°Incentives
Profit Margin
Return on Investment
4/17/2015
16
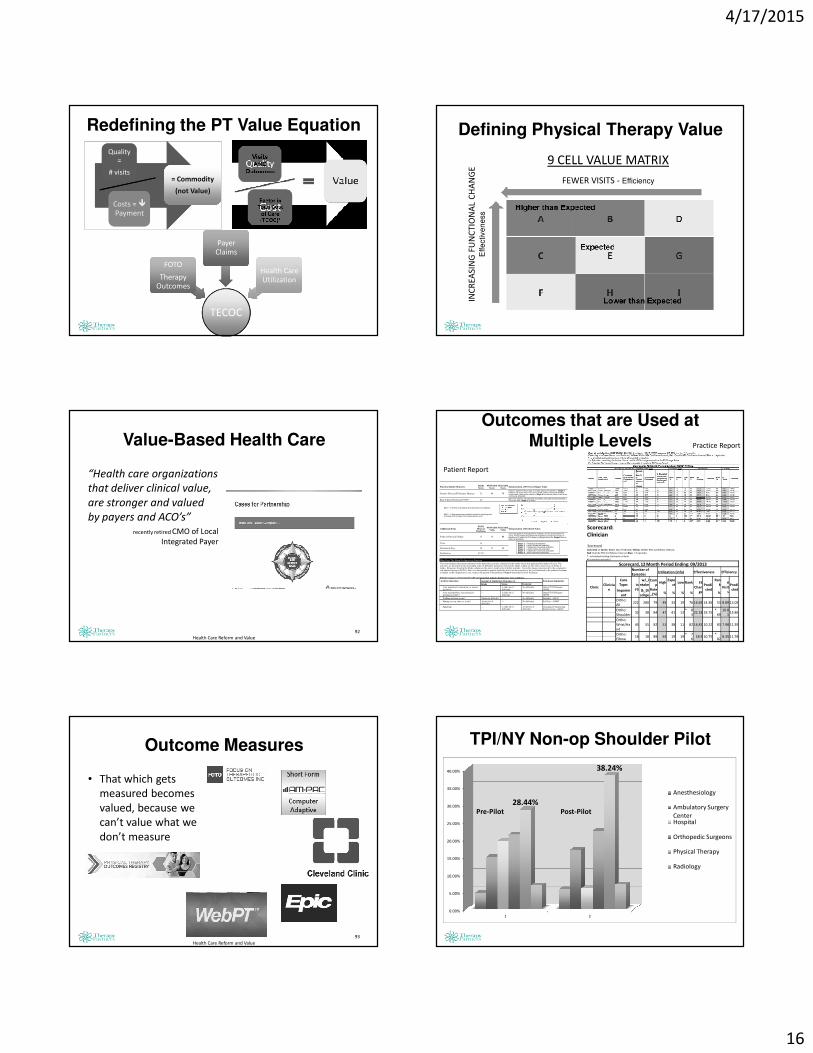
Redefining the PT Value Equation
Quality =
# visits
Quality =
# visits
Costs = �Payment
Costs = �Payment
= Commodity
(not Value)
= Commodity
(not Value)
TECOC
FOTO
Therapy Outcomes
FOTO
Therapy Outcomes
Payer ClaimsPayer
Claims
Health Care Utilization
Health Care Utilization
Value-Based Health Care
“Health care organizations
that deliver clinical value,
are stronger and valued
by payers and ACO’s”
recently retired CMO of Local
Integrated Payer
Health Care Reform and Value
92
Outcome Measures
• That which gets
measured becomes
valued, because we
can’t value what we
don’t measure
Health Care Reform and Value
93
Defining Physical Therapy Value
9 CELL VALUE MATRIX
FEWER VISITS - Efficiency
INC
RE
ASI
NG
FU
NC
TIO
NA
L C
HA
NG
EE
ffe
ctiv
en
ess
Outcomes that are Used at Multiple Levels
Function Status Measures:IntakeScore
05/07/2014Score
05/21/2014Score
Interpretation of FS Scores/Stages Value
Patient's Physical FS Primary Measure 32 48 73
Patient’s Intake FS Score was 32 init ially placing the patient in Stage 4.Patient’s FS score now is 73 out of 100 (41 points of functional changesince intake), placing the patient in Stage 6 and means patient is an activecommunity ambulator.
Risk Adjusted Statistical FOTO* 44Given the patient’s risk-adjustment variables, like-patients nationally had aFS score of 44, Stage 4, at intake.
MCII = 13 (Points of change that is important to the patient)
MDC = 7 (Represents the smallest threshold to identify pointsof change that is greater than measurement error)
Additional ItemsFOTO
Mean atDischarge
05/07/2014Value
05/21/2014Value
Interpretation of Predicted Value
Points of Physical Change 31 16 41
Given this patient’s risk-adjustment variables, and the actual Intake FSscore, FOTO predicts this patient will experience at least an increase infunction of 31 points (to 63 or higher), putting them in the Stage 6 level orhigher at discharge.
Visits 14
Duration in Days 54 35 49
Satisfaction 97.5%
Stage: 1 Physiological ambulatorStage: 2 Limited household ambulatorStage: 3 Independent household ambulatorStage: 4 Limited community ambulatorStage: 5 Independent community ambulatorStage: 6 Active community ambulator
What Does This Mean For Improving Function
This chart displays the patient responses to the functional activities contained in the intake survey that generated the intake FS score. Theactivities are presented in the descending order of difficulty. Responses listed in the Intake column are the survey item levels of ability atintake. Responses listed in the Intake column are the survey item levels of ability at intake. Given the change experienced by the comparativerisk adjusted group in FOTO’s data, it is anticipated the patient should be able to do the activities at the level indicated in the predicted columnor higher at the completion of care, to place the patient in the predicted Stage 6 functional level by discharge.
Patient responses to functional health questions that indicate dysfunction were as follows:
Activity (Question) Amount of Limitation (Response) at:
Intake Status Predicted
Functional Limitation
Your usual work, housework, or schoolactivities?
-- A little bit of
difficultyNo difficulty Other PT/OT Primary -
G8990
Your usual hobbies, recreational orsporting activities?
-- A little bit ofdifficulty
No difficulty Other PT/OT Primary -G8990
Walking between rooms? Moderate difficulty -- No difficulty Mobility - G8978
Putting on your shoes or socks?
A little bit ofdifficulty
-- No difficulty Self Care - G8987
Squatting?
-- A little bit ofdifficulty
A little bit ofdifficulty
Changing & MaintainingBody Position - G8981
Scorecard:
Clinician
Scorecard Color Key => Green: Better than Predicted, Yellow: Within 95% Confidence Interval,
Red: Outside 95% Confidence Interval, Blue: < 5 episodes
* - estimated ranking (minimum criteria
40 complete episodes)
Scorecard, 12 Month Period Ending: 09/2013Number of
EpisodesUtilization (Info) Effectiveness Efficiency
ClinicClinicia
n
Care
Type: In
FS
w/_I
ntake
Com
p
Rate
_(%)
HighExpe
ctLow Rank FS
Chan
ge
Predi
cted
Ran
k#
Visit
s
Predi
ctedImpairm
ent
&_Di
schge% % % % %
Ortho:
All221 280 79 49 33 19 76 16.69 14.36 53 8.89 12.05
Ortho:
Shoulder32 38 84 47 41 13
* 8
322.18 19.75
*
69
10.8
113.86
Ortho:
Wrist/Ha
nd
45 55 82 51 38 11 82 16.81 10.22 83 7.98 11.39
Ortho:
Elbow16 18 89 63 19 19
* 7
618.9 10.75
*
828.35 11.78
Ortho: * 7 *
Patient Report
Practice Report
TPI/NY Non-op Shoulder Pilot
0.00%
5.00%
10.00%
15.00%
20.00%
25.00%
30.00%
35.00%
40.00%
1 2
28.44%
38.24%
Anesthesiology
Ambulatory Surgery
CenterHospital
Orthopedic Surgeons
Physical Therapy
Radiology
Pre-Pilot Post-Pilot

4/17/2015
17
28.44%
71.56%
Hx PT Costs
Other Costs
38.24%61.76%
Pilot PT Costs
Other Costs
TPI/NY Non-op Shoulder Pilot Decreased TECOC
Silo Management
Pre-Pilot
Value-Based Mgmt
Pilot
PT % of cost increased… BUT
Pie is 21.7% SMALLER
Timing of PT Reduces TCOC
Timing and Right PT Reduces TCOC
Majority of care was “Non-Adherent” care
Right Time ------ Right PT
Right Timing and Right PT :
Here th e TECOC sav ings were $ 2 , 7 36 . 2 2 in when you had
Ear ly PT ( <1 4 days ) and th e R igh t PT (Adheren t ) s aved
$1 , 33 7 . 32 . F r i t z , e t a l S p ine 201 3
M e a n
( S D )
A l l
P a t i e n t s
( n = 3 2 , 0 7 0 )
T i m i n g o f P h y s i c a l
T h e r a p y ( n = 2 , 0 7 7 )
C o n t e n t o f P h y s i c a l
T h e r a p y ( n = 1 , 9 1 7 )
E a r l y
< 1 4 d a y s
( n = 1 , 1 0 2 )
D e l a y e d
> 1 4 d a y s
( n = 9 7 5 )
A d h e r e n t
( n = 4 1 3 )
N o n -
A d h e r e n t
( n = 1 5 0 4 )
T o t a l L B P
c o s t s $ 1 8 8 2 . 3 3 $ 3 1 4 8 . 4 9 $ 5 8 8 4 . 7 1 $ 3 6 0 8 . 8 3 $ 4 9 4 6 . 1 8
Timing and Content of PT
Childs, DOD Study 2014
$2,110$2,784
$3,670$4,340
$0
$500
$1,000
$1,500
$2,000
$2,500
$3,000
$3,500
$4,000
$4,500
$5,000
Total LBP
Total Costs Incurred Over 2-
year Follow-up
E/A E/NA L/A L/NA
$8,470 $8,459$10,380 $10,589
$0
$2,000
$4,000
$6,000
$8,000
$10,000
$12,000
Non LBP-related
Total Costs Incurred Over 2-
year Follow-up
E/A E/NA L/A L/NA
Timing and Content of PT
Childs, DOD Study 2014

4/17/2015
18
Address Payer/ACO Concerns
PAYER/ACO PERCEIVED NEEDSAND CONCERNS
• Address the growth of the total orthopedic spend by providing therapy providers that are able to reduce the total episode cost of care.
• The lack of a quality metric standard that identifies the best providers of musculoskeletal care, which includes utilization of care.
• Receive a significant return on investment on total episode cost of care, and share risk with providers.
• Claims processes unable to handle changes in payment methodology, such as per diem, case rates, or total cost of care.
ADDRESS PAYER/ACO CONCERNS
• Entity will actively work to expand and promote pilot to primary care provider networks.
• Entity will manage therapy episodes of care using an outcome tool with patients.
• Provide analysis of both datasets (Outcomes and Claims) that measures the impact on TCOC and correlation of TCOC to outcomes.
• Phase 1 should continue to pay therapy services at a contracted current fee schedule. No change in fee schedule, claims processing.
Health Care Reform and Value
103
Where Do We Go From Here?
• Disruptive change to the clinical pathway
• Collaborate across therapy provider groups
• Correlate outcome and utilization to total cost
of care
• Leverage therapy outcomes data as quality
metric
• Support or carryout health services research
Health Care Reform and Value
104


