

JOINT PROGRAMMING INITIATIVE – A HEALTHY DIET FOR A HEALTHY LIFE EUROPEAN NUTRITION PHENOTYPE ASSESSMENT AND DATA SHARING INITIATIVE
* Security: PU – Public; PP – Restricted to other programme participants (including JPI Services): RE – Restricted to a group specified by the consortium (including JPI Services); CO – Confidential, only for members of the consortium (including JPI Services)
** Type: R – Report; P – Prototype; D – Demonstrator; - O - Other
PROJECT DELIVERABLE REPORT
DELIVERABLE NUMBER D2.3.1
TITLE STUDY VALIDATION CRITERIA
AUTHOR(S) DR. C. LACHAT, MS. C. YANG, DR.
M.PINART
WORK PACKAGE WP 2
TASK TASK 2.3.1
WP LEADER DR. L. O DRAGSTED
BENEFICIARIES CONTRIBUTING TO THE
DELIVERABLE
UGENT, MDC, UCOP, MDC, KU LEUVEN,
UNIBA, UNIBA, CRA-NUT, UNINA, NRC-ISA,
ULG, WIV-ISP, WIV-ISP, VUB, DIFE, CRA-
NUT, TCD, COSBI, TNO, MDC, UNIBA
STATUS – VERSION FINAL - VERSION 1.0
DELIVERY DATE (MONTH) M13
SUBMISSION DATE M13
DISSEMINATION LEVEL – SECURITY* PU
DELIVERABLE TYPE** R
JOINT PROGRAMMING INITIATIVE – A HEALTHY DIET FOR A HEALTHY LIFE EUROPEAN NUTRITION PHENOTYPE ASSESSMENT AND DATA SHARING INITIATIVE
1
CONTENTS
Prepared by ...................................................................................................................... 2
Key messages ................................................................................................................... 1
Background ...................................................................................................................... 3
Methodology for the development of observational study QATs ....................................... 5
Step 1. Scoping study ................................................................................................................ 5
Relevant guidelines .......................................................................................................................... 5
Structure of the ENPADASI tool ....................................................................................................... 8
STEP 2 Systematic literature review .......................................................................................... 9
Methodology ................................................................................................................................... 9
Inclusion and exclusion criteria for study screening ..................................................................... 10
Flow chart of study screening and extraction items ..................................................................... 12
Results of the systematic literature review ................................................................................... 14
STEP 3 Extraction of items ....................................................................................................... 14
Methodology ................................................................................................................................. 14
Use of item extraction table .......................................................................................................... 18
Result ............................................................................................................................................. 18
Methodology for the development of experimental study QAT ....................................... 20
Step 1. Quality Appraisal tool for experimental study design ................................................... 20
Editing the Cochrane Collaboration’s tool ..................................................................................... 21
Next steps ...................................................................................................................... 21
Agreement on the final version of the tool ................................................................................... 21
References ..................................................................................................................... 23
Annexes: An overview of existing quality appraisal items for study design and
measurements for dietary assessment studies ................................................................ 27
Study design: General Quality appraisal items observational studies .......................................... 28
Study design: cohort studies ......................................................................................................... 33
Study design: cross-sectional studies ............................................................................................ 47
Study design: case control ............................................................................................................. 56
STUDY DESIGN: EXPERIMENTAL STUDY ......................................................................................... 65
Measurements: dietary assessment .............................................................................................. 72
Measurements: Anthropometry.................................................................................................... 87
JOINT PROGRAMMING INITIATIVE – A HEALTHY DIET FOR A HEALTHY LIFE EUROPEAN NUTRITION PHENOTYPE ASSESSMENT AND DATA SHARING INITIATIVE
2
PREPARED BY
Carl Lachat (Task leader) and Chen Yang UGent, Belgium (UGent), Mariona Pinart Max-Delbrück-
Centrum für Molekulare Medizin Berlin, Germany (MDC).
In collaboration with other members of the ENPADASI observational study group Lars Ove Dragsted
(WP Leader, UCOP), Katharina Nimptsch (MDC) , Christophe Matthys (KU Leuven), Irina Dobre
(UCOP), Stéphanie Maria Palombi (UCOP), Maria Deangelis (UNIBA), Fabio Minervini (UNIBA),
Raffaella Canali (CRA-NUT), Sofian De Clercq (UGent), Bernard de Baets (UGent), Guy de Tré (UGent),
Antoon Bronselaer (UGent), John Van Camp (UGent) and with input from Angela Rivellese (Unina),
Rosalba Giacco (NRC-ISA), Axelle Hoge (ULG), Jean Taffareau (WIV-ISP), Brocatus Loes (WIV-ISP),
Peter Clarys (VUB), Marta Stelmach (IFE), Giuditta Perozzi (CRA-NUT), Eamon Laird (TCD), Rosario
Lombardo (COSBI), Jildau Bouwman (TNO), Tobias Pischon (MDC), and Marco Gobbetti (UNIBA).
JOINT PROGRAMMING INITIATIVE – A HEALTHY DIET FOR A HEALTHY LIFE EUROPEAN NUTRITION PHENOTYPE ASSESSMENT AND DATA SHARING INITIATIVE
1
KEY MESSAGES
o ENPADASI will deliver open access research infrastructure for data from a wide variety of nutritional
studies. To guide users of the database towards information in the system that best suits their needs,
specific instruments to appraise study quality are needed.
o Various instruments were developed for use in dietary assessment and/or nutritional epidemiology
and provide a useful point of departure for ENPADASI. These tools were mostly developed to grade
studies in a literature review and rely on reporting quality. In this case, researchers that assess quality
of the studies are different from those involved in the reported research. For ENPADASI, quality of
studies is assessed using information provided by the researchers when submitting data to the
system. Doing so, measures of study quality data will be available immediately and help structure the
search and data extraction for those that query the database. To achieve this, (semi)-automation of
information added as study descriptors when submitting data should be considered.
o Various quality appraisal tools propose an overall quality score. Summing scores across different
domains into a numeric score however, may produce ambiguous estimates of study quality.
Researchers extracting data from the ENPADASI database might have specific information needs for
specific domains (e.g. participant recruitment, dietary assessment). An approach that respects the
quality of different domains might be more relevant for ENPADASI.
o To obtain a minimal set of criteria to assess quality, relevant domains of study quality and items were
extracted from existing tools from a systematic review of literature.
o In addition, consensus on the scoring and study quality appraisal tool will be obtained through a
consultative process (e.g. physical meeting and Delphi) in the ENPADASI consortium.
o The quality appraisal tool for the assessment of experimental study was established based on a widely
used tool: the Cochrane collaboration’s tool for assessing risk of bias. Using similar items in the
ENPADASI data system will ensure compliance with current practice and software such as GRADE-pro1
or Revman2 developed by the Cochrane collaboration. The items will be implemented in the DASH-in
database to enable those providing data to tick the correct data quality parameters. The tool adds
1 http://tech.cochrane.org/gradepro 2 http://tech.cochrane.org/revman

JOINT PROGRAMMING INITIATIVE – A HEALTHY DIET FOR A HEALTHY LIFE EUROPEAN NUTRITION PHENOTYPE ASSESSMENT AND DATA SHARING INITIATIVE
2
onto the other quality control parameters of the ENPADASI quality control tool and can be combined
with quality parameters for measurements.
o There were a few minor changes made to the Cochrane risk of Bias tool: 1) the risk of bias tool and its
criteria were combined into one document; 2) the tool was edited to enable the entry by the person
uploading the data. Finally, for the implementation in DASH-IN, the risk of bias tool needs to be
organised as an outcome-specific tool as quality control is specific for each outcome. Using this tool to
assess overall study quality (across different outcomes) may potentially introduce additional bias.
JOINT PROGRAMMING INITIATIVE – A HEALTHY DIET FOR A HEALTHY LIFE EUROPEAN NUTRITION PHENOTYPE ASSESSMENT AND DATA SHARING INITIATIVE
3
BACKGROUND
ENPADASI will deliver an open access research infrastructure that contains data from a variety of nutritional
studies, ranging from mechanistic studies and interventions to epidemiological studies including a multitude of
phenotypic outcomes that will facilitate combined analyses in the future. Data to be integrated in the DASH-in
database is expected to be highly heterogeneous and of varying quality. To guide users of the database
towards data in the system that best suits their needs, specific instruments are needed. An instrument is
particular needed to enable users to select levels of data quality when using the database and extracting
information from it. This document describes an approach to develop an instrument to appraise and score
data to be integrated in the database.
Practically, the tools can be organised as a checklist or flowchart of key information to be supplied by the
researchers as part of the metadata supplied during study integration in the database. Such approach has the
advantage that it relies on the researcher assessment of the actual study characteristics (and not the reported
ones). Study characteristics and a predefined algorithm will enable computing an overall quality appraisal
score.
This work is part of Work Package 2 “Preparing joint data analysis and sharing existing data” and is organised in
4 tasks:
• Task 2.1 Collection of data sets for integration, subdivided into observational datasets (lead: EoI51,
Tobias Pischon) and experimental datasets (lead: EoI41 Giuditta Perozzi) months 1-12.
• Task 2.2 Minimal requirements for study data, subdivided into observational datasets (lead: EoI51, Tobias
Pischon) and experimental datasets (lead: EoI71 Lars Ove Dragsted), months 3-18.
• Task 2.3 Validation of study quality, divided into observational studies (lead: EoI 38 Carl Lachat) and
experimental studies (lead: EoI71, Lars Ove Dragssted), months 1-12.
• Task 2.4 Case studies for existing data (lead: EoI41 Giuditta Perozzi), months 12-24.
Work on study validation criteria will be organised as “D2.3.1 Study validation criteria” and in the form of a
draft scientific paper for an open access scientific publication. The document will contain also information
from Task 2.1 and 2.2; the criteria developed in Task 2.3 per se are posted as a report on the Internet by the
end of the task. This task has 2 main milestones
• MS 2.1 Training material on minimal requirements delivered to WP6 (Month 18) June 2016, and
• MS 2.2 Studies relevant to case studies uploaded (Month 18) June 2016.
This work has close linkages with all other tasks of WP2. Outside WP2, this task is linked with:
• WP3 Design and development (WP leader: Prof. Dr. Corrado Priami / Dr. Rosario Lombardo, COSBI)
o Task 3.3: Functional/technical requirements tools (lead: Prof. Graziano Pesole, Politecnico di Bari /
Dr. Rosario Lombardo, COSBI),
o Task 3.4: User survey for usability of infrastructure (lead: Dr. Rosario Lombardo, COSBI)
• WP4 Integration (WP leader: Duccio Cavalieri)

JOINT PROGRAMMING INITIATIVE – A HEALTHY DIET FOR A HEALTHY LIFE EUROPEAN NUTRITION PHENOTYPE ASSESSMENT AND DATA SHARING INITIATIVE
4
o Task 4.1 Definitions of ontologies and common languages (Task leader: Dolores Corella, CIBER
OBN - Instituto de Salud Carlos III ) and (Task leader: Jose M. Soriano, Health Research Institute
Valencia)
o Task 4.4 Intelligent interrogation of nutritional databases (Task leaders: Carl Lachat, UGent) and
Giorgio Pietro Maggi, Politecnico di Bari)
JOINT PROGRAMMING INITIATIVE – A HEALTHY DIET FOR A HEALTHY LIFE EUROPEAN NUTRITION PHENOTYPE ASSESSMENT AND DATA SHARING INITIATIVE
5
METHODOLOGY FOR THE DEVELOPMENT OF OBSERVATIONAL STUDY QATS
The work for this deliverable was organised in 4 consecutive steps
o First, a scoping review was performed to assess availability and structure of existing instruments;
o Second, we carried out a literature review to identify existing instruments to assess quality of
observational studies in nutritional epidemiology and dietary assessment;
o Thirdly, the available items were extracted and organised according to the different domains that
are relevant to ENPADASI, and
o Lastly, a first proposal for the quality appraisal tool is proposed to the ENPADASI consortium for
consideration.
STEP 1. SCOPING STUDY
We carried out a scoping exercise to identify existing tools and approaches to assess quality of observational
studies.
RELEVANT GUIDELINES
There is an important distinction to be made in instruments to improve reporting and those to assess study
quality, measurement of outcomes or data quality in general. There are various instruments to guide
researchers when describing a study and reporting their findings. These reporting guidelines are centralised by
the EQUATOR network3. The most widely recommended reporting guideline for observational studies is
“STrengthening the Reporting of OBservational studies in Epidemiology” or STROBE statement and is relevant
for reporting findings of cross-sectional, cohort studies and case-control studies (von et al. 2007). To ensure
applicability to various technical areas, extensions of these checklists are developed. For ENPADASI, the
following are relevant:
• STROBE-ME for molecular epidemiology (Gallo et al. 2011)
• STROBE-nut for nutritional epidemiology (under development)4
Important to note here is that these checklists serve as a tool to guide to researchers when reporting study
results. Although they might be useful to identify key domains or issues in study designs, they cannot be used
directly as a tool to assess study quality (da Costa et al. 2011).
In contrast to research reporting guidelines, there is no clear recommendation on which tools are most
appropriate to evaluate quality of observational studies. The ability of tools to assess study quality is still
subject to debate and evaluation. Herbison et al. (2006) previously showed how the application of quality
3 http://www.equator-network.org/ 4 www.strobe-nut.org
JOINT PROGRAMMING INITIATIVE – A HEALTHY DIET FOR A HEALTHY LIFE EUROPEAN NUTRITION PHENOTYPE ASSESSMENT AND DATA SHARING INITIATIVE
6
scores of experimental studies was unable to differentiate low and high quality studies or improve the final
quality of a meta-analysis. Care should be taken when selecting a tool to assess study quality, as the tool itself
can introduce additional bias for analysis that relies on it. Similar to the studies they assess, instruments to
assess studies are of variable quality. Crowe and Sheppard (2011) reviewed the quality of critical appraisal
tools and propose a process to develop appraisal tools. Various reviews have looked specifically at tools to
appraise quality of observational studies.
• Katrak et al. (2004) reviewed critical appraisal tools and identified 19 tools to assess observational
studies. The review identified 74 items to appraise observational studies, of which the majority
covered aspects related to data analysis. Nine tools for observational studies provide a summary
score for study quality. This review however, seems to have included research reporting guidelines as
a quality appraisal tool. In addition, several references provided for instruments to score qualitative
studies actually refer to other types of studies (e.g. qualitative studies) and insufficient details are
provided on the syntax to reconstruct the search.
• Tools for non-randomised intervention studies were also reviewed by Deeks et al. (2003). Amongst
these tools, the Cochrane handbook identified the instrument developed by Downs and Black (1998)
and the Newcastle-Ottawa Scale (Wells et al. 2008) as the most useful ones. Newcastle-Ottawa Scales
are developed for case-control and cohort studies. Lo et al. (2014) however, reported low agreement
between author and reviewers for assessment of quality of cohort studies by Newcastle-Ottawa Scale.
Oremus et al. reported a low inter-rater agreement but high reliability of Newcastle-Ottawa Scale
(Oremus et al. 2012). In addition, SIGN5, the Scottish Intercollegiate Guidelines Network develops
guidelines from a systematic review of the scientific literature. SIGN provides tools to critically
appraise cohort and case-control studies.
• A third review by Sanderson et al. (2007), identified 86 relevant instruments comprising checklists and
scales. Regarding the use of scales, the authors report that weighing of scores was highly variable and
inconsistent and likely to produce different quality scores when applied to the same studies. In order
to develop a generic instrument, the authors suggest using (i) the items reported in the STROBE
statement as a starting point, (ii) a checklist (not a scale) specific enough with limited number of
items, and finally (iii) testing the validity and reliability of this instrument.
Both the Sanderson and Deeks reviews offer a useful point of departure to assess study quality of
observational studies. Both have detailed the search strategy and were of appropriate quality according to an
appraisal using the AMSTAR checklist (Shea et al. 2007). The review of Katrak et al. (2004). is considered of
poor quality to be used as a reference for identification of literature on the topic.
5 http://www.sign.ac.uk/methodology/checklists.html
JOINT PROGRAMMING INITIATIVE – A HEALTHY DIET FOR A HEALTHY LIFE EUROPEAN NUTRITION PHENOTYPE ASSESSMENT AND DATA SHARING INITIATIVE
7
With regard to nutrition, various manuscripts provide relevant tools:
• Nelson et al. (1993) have developed a score to evaluate quality of dietary intake and nutritional
epidemiological studies. This instrument was further developed and presented as a scoring system for
case-control and cohort studies in nutritional epidemiology and reported satisfactory inter-rater
agreement (Margetts et al. 1995). The tool for case-control studies has 3 domains (Dietary
assessment, Recruitment of participants, Analysis) and the cohort tool 4 (Dietary assessment,
Definition of cohort, ascertainment, Analysis and results).
• Friedenreich et al. (1994) developed an instrument to assess quality of case-control studies of
colorectal-cancer and dietary fiber. The instrument assesses both study design and dietary data
collection.
• Scandinavian researchers developed quality grading tools for nutritional observation and intervention
studies to prepare systematic literature studies for the Nordic Nutrition recommendations (Norden
2012). Different items of the instrument were derived from guidance of the FSA Scientific Advisory
Committee on Nutrition (SACN 2008), but it remains unclear how this selection process was done.
Study quality appraisal tools were developed for different types of studies i.e. clinical trials,
prospective cohort studies, nested case-control studies, retrospective case-control studies and cross-
sectional studies. For each of these types of studies, a quality assessment score (A, B, C) was used by
the US Agency for Healthcare Research and Quality (Chung et al. 2009). The validity of the tool has
remained undocumented.
• A review on Vitamin D and Calcium developed an instrument to assess study quality by extracting
items from reporting the STROBE statement (Chung et al. 2009).
• Serra-Majem et al. (2009) developed an instrument to assess quality of dietary intake validation
studies in the context of the European Micronutrients Recommendation Aligned (EURReca) project.
Although valuable as background information, this tool is mainly relevant for use in validation studies
on dietary assessment and the relevance for use in other nutritional epidemiological studies needs
evaluation.
• Yang et al. (2014) developed a tool to assess quality of dietary assessment and reporting in nutritional
epidemiology. The instrument was adapted from the Nelson checklist and EURReca scoring system. As
this tool integrates an assessment of reporting quality of studies, it might be less relevant to
ENPADASI.

JOINT PROGRAMMING INITIATIVE – A HEALTHY DIET FOR A HEALTHY LIFE EUROPEAN NUTRITION PHENOTYPE ASSESSMENT AND DATA SHARING INITIATIVE
8
The Diet@net6 consortium is developing an approach that will guide researchers towards the best suitable
dietary assessment method for a specific purpose, using systematic review of literature and consensus building
approaches. It is key to streamline the quality appraisal of dietary assessment with the outcomes of this work.
Task 2.3 will closely interact with this team to ensure maximal integration of items related to quality of dietary
assessment into an overall instrument for quality assessment of studies in ENPADASI.
STRUCTURE OF THE ENPADASI TOOL
From the available instruments identified during the scoping study, a domain-based evaluation is proposed
(Figure 1).
• Domain 1: “Study design and participant selection” (combines study population representativity,
drop-outs, case/control comparability, sampling, power, definition of cohort, ascertainment,
comparator).
• Domain 2: “Assessment of outcomes” (combines exposure, outcomes, dietary assessment, PA,
Anthropometry, biomarkers, confounding) ask for confounding for energy/ study design /
supplements included or not or give instructions
This "Domain based" approach aligns with that of Cochrane7. Doing so, it is expected that this will aid
integration of the quality assessment tool for observational and intervention studies in ENPADASI. The idea is
to include the items in Domain 1 with respect to the study design (and can further be expanded for
intervention studies), while domain 2 is independent of study design. In this sense, items under Domain 2 can
be also applied to experimental designs.
6 www.nutritools.org 7 see 8.3.3 Quality scales and Cochrane reviews of http://handbook.cochrane.org/

JOINT PROGRAMMING INITIATIVE – A HEALTHY DIET FOR A HEALTHY LIFE EUROPEAN NUTRITION PHENOTYPE ASSESSMENT AND DATA SHARING INITIATIVE
9
Figure 1: Proposed structure of the quality appraisal tool of observational studies in ENPADASI
STEP 2 SYSTEMATIC LITERATURE REVIEW
METHODOLOGY
Two searches were conducted in PubMed. The basic criteria of search is shown in “Table 1: PICO table” and
the search syntax, search date and search database are shown in “Table 2: Development of the search syntax”
below. The first search was conducted on July 1st and the scope of the publication date was set as “2000/01/01
– 2015/12/31”. As various tools were found missing using this search syntax, a refined search was conducted
on July 8th 2015, with updated search terms and the scope of the publication data was extended to
“1990/01/01 – 2015/12/31”. Overall, 8920 English-language studies were retrieved in the two searches.
Table 1: PICO table
P Population/patient Humans, all ages
I Intervention/indicator All the qualified indicator/intervention in the field of nutritional epidemiology assessed by methodological quality appraisal tool(s)
C Comparator/control All the qualified comparator methods in the field of nutritional epidemiology assessed by methodological quality appraisal tool(s)
study qualityappraisal
design and participants
cohort
cross-sectional
case control
Interventionstudies
measurements
dietaryassessment
anthropometry
...

JOINT PROGRAMMING INITIATIVE – A HEALTHY DIET FOR A HEALTHY LIFE EUROPEAN NUTRITION PHENOTYPE ASSESSMENT AND DATA SHARING INITIATIVE
10
O Outcome All the potential outcomes in the field of nutritional epidemiology assessed by methodological quality appraisal tool(s)
Table 2: Development of the search syntax
Search Database Pubmed/Medline Pubmed/Medline
Search date July 1st 2015 (N= 3927) July 8th 2015 (N= 4993)
Search syntax
Search (((((((Tool[Title/Abstract]) OR Score[Title/Abstract]) OR Scale[Title/Abstract]) OR
Instrument[Title/Abstract]) OR Checklist[Title/Abstract]) OR
Item[Title/Abstract])) AND (((Evidence-Based Medicine/methods[MeSH Terms])
OR "Methodological quality"[Title/Abstract]) OR "Critical appraisal"[Title/Abstract]) Schema:
nomesh Filters: Publication date from 2000/01/01 to 2015/12/31; English
Search (((((((Tool[Title/Abstract]) OR Score[Title/Abstract]) OR Scale[Title/Abstract]) OR
Instrument[Title/Abstract]) OR Checklist[Title/Abstract]) OR
Item[Title/Abstract])) AND ((((("quality score"[Title/Abstract]) OR quality
assessment tool*[Title/Abstract]) OR "Critical appraisal"[Title/Abstract]) OR
"Methodological quality"[Title/Abstract]) OR Evidence-Based
Medicine/methods[MeSH Terms]) Sort by: Author Filters: Publication date from
1990/01/01 to 2015/12/31; English
With the updated search syntax, the quality assessment tools missed in Search 1 were retrieved. However,
since Search 2 was not the same as search 1, not all citations from Search 1 could be found in Search 2. As a
result, articles retrieved in either of the two searches were included in the review, while common articles were
only screened in Search 1.
INCLUSION AND EXCLUSION CRITERIA FOR STUDY SCREENING
The only criterion for inclusion was having original data on quality assessment of observational studies. Tools
that only discussed reporting quality assessment of observational studies were excluded.
There was no limitation on population, comparator/control and outcome of retrieved studies. However, since
different quality appraisal tools (i.e. quality appraisal tool for study design, quality appraisal tool for different
measurements, etc.) had specific requirements, further criteria, explained below, were established for
extracting specific items for each quality appraisal tool.
DOMAIN: STUDY DESIGN
JOINT PROGRAMMING INITIATIVE – A HEALTHY DIET FOR A HEALTHY LIFE EUROPEAN NUTRITION PHENOTYPE ASSESSMENT AND DATA SHARING INITIATIVE
11
Four quality appraisal tools were established for study design of observational studies, which included 1) a
general quality appraisal tool for cohort study, case-control study and cross-sectional study; and specific
quality appraisal tools for 2) a cohort studies; 3) case-control studies; and 4) cross-sectional studies. The
inclusion and exclusion criteria for item extraction for these four quality appraisal tools are summarised in
tables 3 and 4. Some other items (e.g. how data were analysed etc.) were not considered.
RE-WRITING / EXCLUSION OF SUBJECTIVE ITEMS
A study quality assessment based on subjective items has a high potential to introduce bias. For objective
items, different assessors can easily make the same judgment, because their judgments refer to the same
objective information stated in the studies assessed (e.g. has the statistical power of the study been assessed a
priori?). However, for subjective items about methodological appropriateness (e.g. is the research method
appropriate for answering the research question?), assessors have to make judgments based on their own
academic experience. They can always provide sufficient evidence to support their own judgments though
their judgements are very different. It is hard to say which evidence is stronger than the other. As a result, the
inter-rater agreement between assessors can be very low due to their very different academic backgrounds.
And if so, such quality assessment will not make sense. Due to this, all the subjective items selected by us were
identified and then re-written as objective items or removed from our quality appraisal tools (both tools for
study design and tools for study measurement).
Table 3: The inclusion and exclusion criteria for item extraction
Exclusion criteria Inclusion criterion
1) Exclude tools/items for clinical research (e.g.
therapeutic treatments, health services, etc.)
2) Exclude items that are not specific for
assessment of cohort/panel studies, case-control
studies and cross-sectional studies/cross-
sectional analysis/transversal study/prevalence
study.
3) Exclude tools/items for measurement e.g.
(dietary) data collection, anthropometry, physical
activity, etc.
4) Exclude tools/items for (statistical)
analysis/assessment of result (e.g. response rate,
sample size/power analysis after research, etc.)
5) Exclude items for reporting quality
1) Include all other items/tools.
JOINT PROGRAMMING INITIATIVE – A HEALTHY DIET FOR A HEALTHY LIFE EUROPEAN NUTRITION PHENOTYPE ASSESSMENT AND DATA SHARING INITIATIVE
12
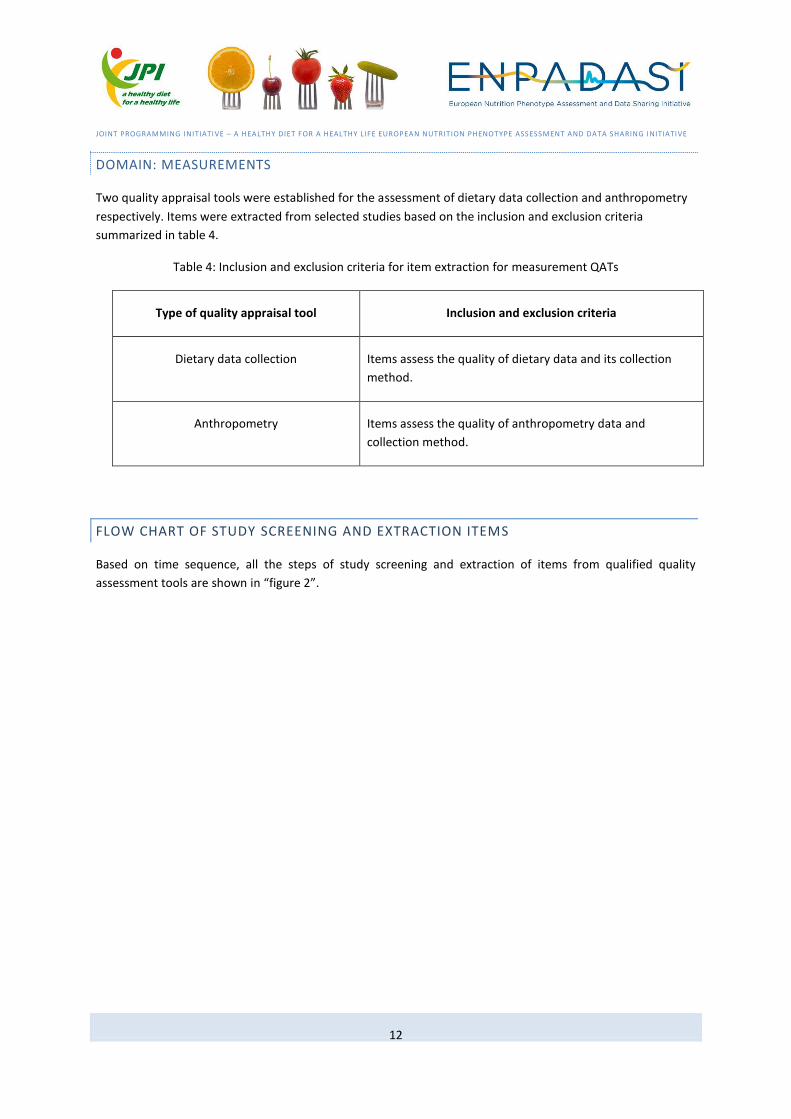
DOMAIN: MEASUREMENTS
Two quality appraisal tools were established for the assessment of dietary data collection and anthropometry
respectively. Items were extracted from selected studies based on the inclusion and exclusion criteria
summarized in table 4.
Table 4: Inclusion and exclusion criteria for item extraction for measurement QATs
Type of quality appraisal tool Inclusion and exclusion criteria
Dietary data collection Items assess the quality of dietary data and its collection
method.
Anthropometry Items assess the quality of anthropometry data and
collection method.
FLOW CHART OF STUDY SCREENING AND EXTRACTION ITEMS
Based on time sequence, all the steps of study screening and extraction of items from qualified quality
assessment tools are shown in “figure 2”.

JOINT PROGRAMMING INITIATIVE – A HEALTHY DIET FOR A HEALTHY LIFE EUROPEAN NUTRITION PHENOTYPE ASSESSMENT AND DATA SHARING INITIATIVE
13
Articles obtained from Pubmed
database
2nd
-1st search (n=1587)
Articles for abstract screening
(n=19)
Articles for full text screening
(n=16)
Articles included
(n=7)
Articles excluded
based on title
(n=1568)
Articles excluded
based on full-text
(n=9)
Articles obtained from Pubmed
database
1st search (n=3297)
Articles excluded
based on title
(n=3253)
Articles for abstract screening
(n=44)
Articles for full text screening
(n=37)
Articles included
(n=19)
Articles excluded
(n=18) after full-text
screening (n=17),
unaccessible (n=1)
Articles excluded
based on abstract
(n=3)
Articles excluded
based on abstract
(n=7)
Final included
studies
(n=26)
Items for design
(n=154)
Items for
measurements
(n=93)
Items for general
checklist
(n=9)
Items for cohort
design
(n=70)
Items for case-
control design
(n=51)
Items for cross-
sectional design
(n=24)
Items for dietary
data collection
(n=88)
Items for
Anthropometry
(n=5)
Identified tools
(n=52) from studies
left (n=22)
Big reviews
containing hundreds
of tools, used later if
needed
(n=4)
JOINT PROGRAMMING INITIATIVE – A HEALTHY DIET FOR A HEALTHY LIFE EUROPEAN NUTRITION PHENOTYPE ASSESSMENT AND DATA SHARING INITIATIVE
14
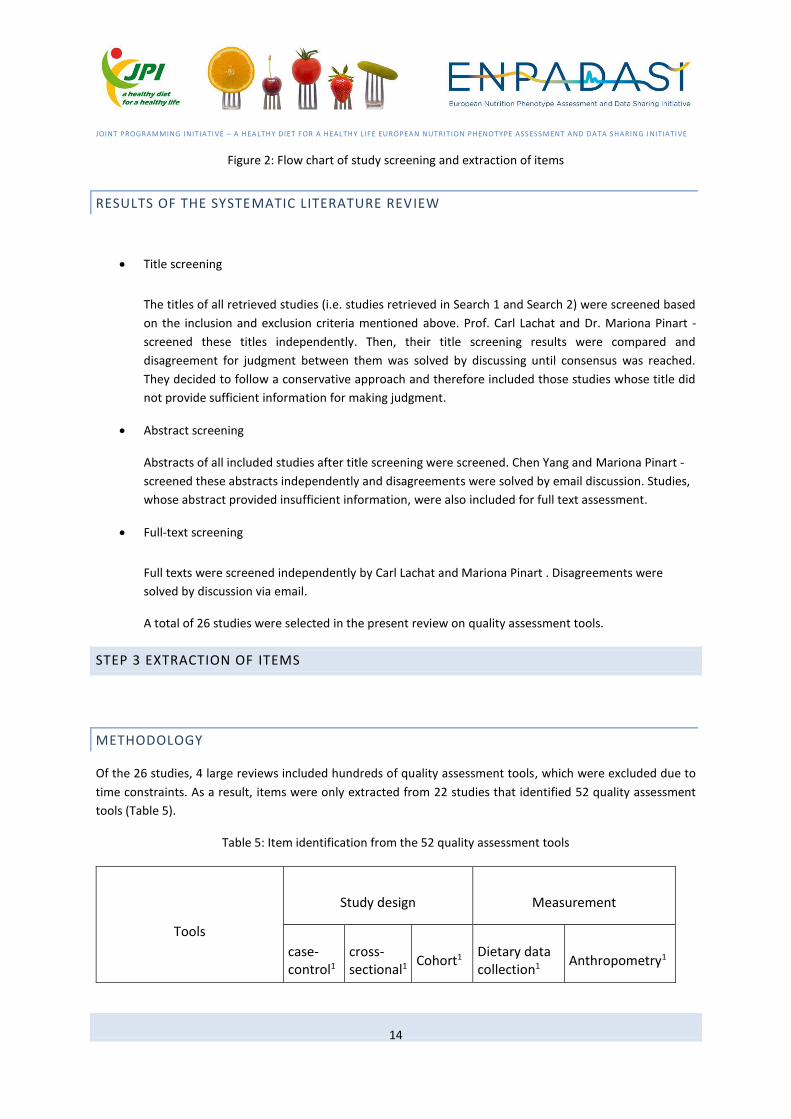
Figure 2: Flow chart of study screening and extraction of items
RESULTS OF THE SYSTEMATIC LITERATURE REVIEW
• Title screening
The titles of all retrieved studies (i.e. studies retrieved in Search 1 and Search 2) were screened based
on the inclusion and exclusion criteria mentioned above. Prof. Carl Lachat and Dr. Mariona Pinart -
screened these titles independently. Then, their title screening results were compared and
disagreement for judgment between them was solved by discussing until consensus was reached.
They decided to follow a conservative approach and therefore included those studies whose title did
not provide sufficient information for making judgment.
• Abstract screening
Abstracts of all included studies after title screening were screened. Chen Yang and Mariona Pinart -
screened these abstracts independently and disagreements were solved by email discussion. Studies,
whose abstract provided insufficient information, were also included for full text assessment.
• Full-text screening
Full texts were screened independently by Carl Lachat and Mariona Pinart . Disagreements were
solved by discussion via email.
A total of 26 studies were selected in the present review on quality assessment tools.
STEP 3 EXTRACTION OF ITEMS
METHODOLOGY
Of the 26 studies, 4 large reviews included hundreds of quality assessment tools, which were excluded due to
time constraints. As a result, items were only extracted from 22 studies that identified 52 quality assessment
tools (Table 5).
Table 5: Item identification from the 52 quality assessment tools
Tools
Study design Measurement
case-control1
cross-sectional1
Cohort1 Dietary data collection1
Anthropometry1
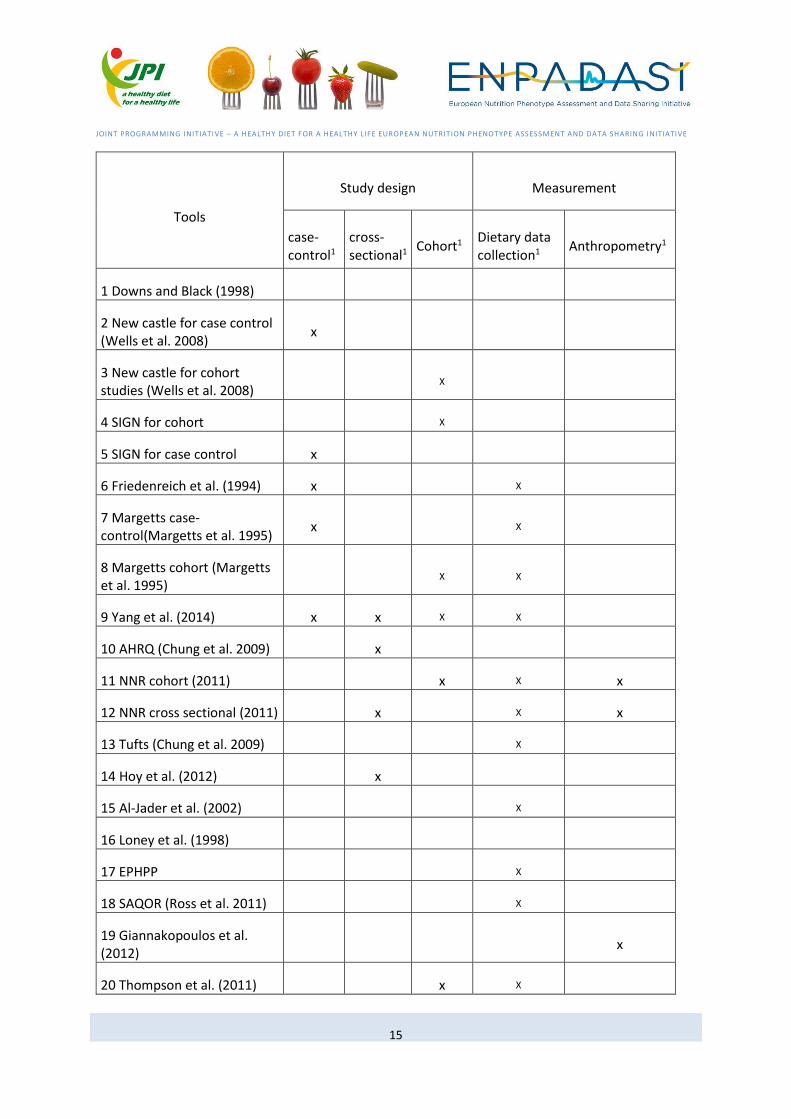
JOINT PROGRAMMING INITIATIVE – A HEALTHY DIET FOR A HEALTHY LIFE EUROPEAN NUTRITION PHENOTYPE ASSESSMENT AND DATA SHARING INITIATIVE
15
Tools
Study design Measurement
case-control1
cross-sectional1
Cohort1 Dietary data collection1
Anthropometry1
1 Downs and Black (1998)
2 New castle for case control (Wells et al. 2008)
x
3 New castle for cohort studies (Wells et al. 2008)
X
4 SIGN for cohort X
5 SIGN for case control x
6 Friedenreich et al. (1994) x X
7 Margetts case-control(Margetts et al. 1995)
x X
8 Margetts cohort (Margetts et al. 1995)
X X
9 Yang et al. (2014) x x X X
10 AHRQ (Chung et al. 2009) x
11 NNR cohort (2011) x X x
12 NNR cross sectional (2011) x X x
13 Tufts (Chung et al. 2009) X
14 Hoy et al. (2012) x
15 Al-Jader et al. (2002) X
16 Loney et al. (1998)
17 EPHPP X
18 SAQOR (Ross et al. 2011) X
19 Giannakopoulos et al. (2012)
x
20 Thompson et al. (2011) x X
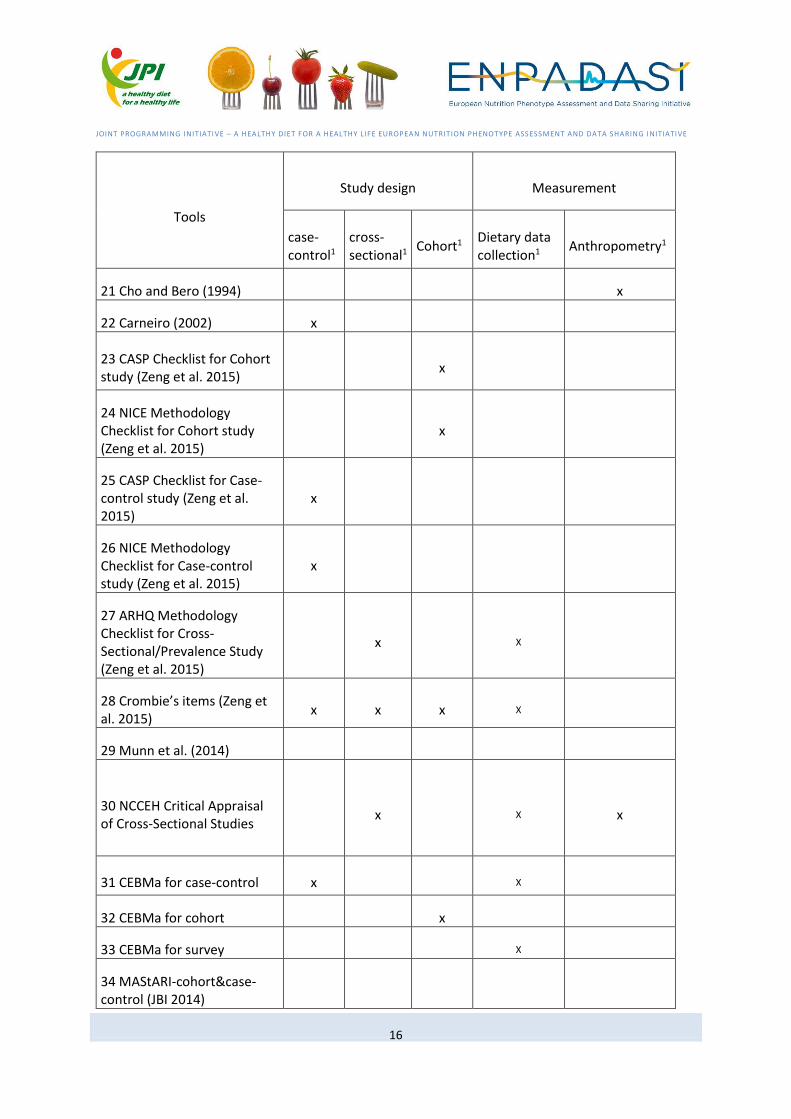
JOINT PROGRAMMING INITIATIVE – A HEALTHY DIET FOR A HEALTHY LIFE EUROPEAN NUTRITION PHENOTYPE ASSESSMENT AND DATA SHARING INITIATIVE
16
Tools
Study design Measurement
case-control1
cross-sectional1
Cohort1 Dietary data collection1
Anthropometry1
21 Cho and Bero (1994) x
22 Carneiro (2002) x
23 CASP Checklist for Cohort study (Zeng et al. 2015)
x
24 NICE Methodology Checklist for Cohort study (Zeng et al. 2015)
x
25 CASP Checklist for Case-control study (Zeng et al. 2015)
x
26 NICE Methodology Checklist for Case-control study (Zeng et al. 2015)
x
27 ARHQ Methodology Checklist for Cross-Sectional/Prevalence Study (Zeng et al. 2015)
x X
28 Crombie’s items (Zeng et al. 2015)
x x x X
29 Munn et al. (2014)
30 NCCEH Critical Appraisal of Cross-Sectional Studies
x X x
31 CEBMa for case-control x X
32 CEBMa for cohort x
33 CEBMa for survey X
34 MAStARI-cohort&case-control (JBI 2014)

JOINT PROGRAMMING INITIATIVE – A HEALTHY DIET FOR A HEALTHY LIFE EUROPEAN NUTRITION PHENOTYPE ASSESSMENT AND DATA SHARING INITIATIVE
17
Tools
Study design Measurement
case-control1
cross-sectional1
Cohort1 Dietary data collection1
Anthropometry1
35 MAStARI-descriptive study (JBI 2014)
36 RTI item bank (Viswanathan et al. 2013)
37 Crowe and Sheppard (2011)
38 QATSO Score (Wong et al. 2008)
39 EAI (Genaidy et al. 2007) x x x X x
40 Levine et al. (1994)
41 NHMRC cohort x
42 NHMRC case-control x
43 Greenhalgh (1997) x x x
44 Greenhalgh and Taylor (1997)
X
45 Heller et al. (2008) x
46 Sirriyeh et al. (2012) X
47 Cust et al. (2007)
48 Hagströmer et al. (2012)
49 Mokkink et al. (2010)
50 Terwee et al. (2012)
51 MERSQI (Cook and Reed 2015)
52 NOS-E (Cook and Reed 2015)
Total 14 9 13 19 6
JOINT PROGRAMMING INITIATIVE – A HEALTHY DIET FOR A HEALTHY LIFE EUROPEAN NUTRITION PHENOTYPE ASSESSMENT AND DATA SHARING INITIATIVE
18
1 Domain focused for the time being;
USE OF ITEM EXTRACTION TABLE
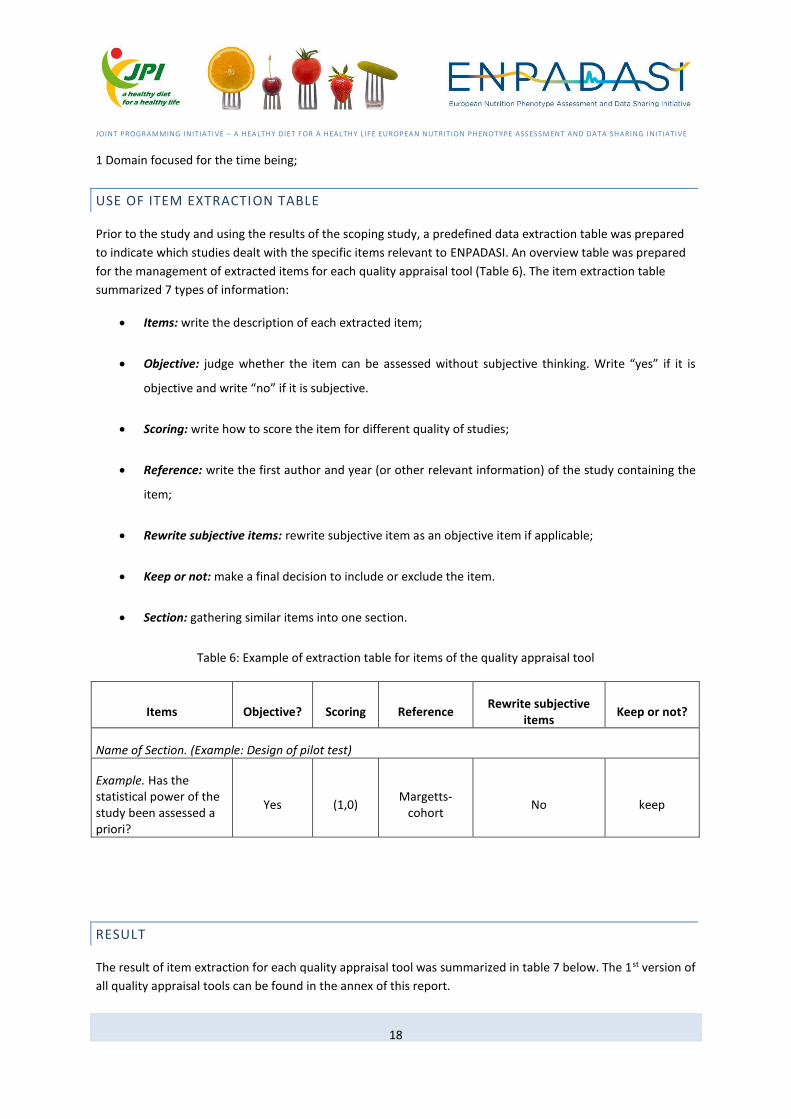
Prior to the study and using the results of the scoping study, a predefined data extraction table was prepared
to indicate which studies dealt with the specific items relevant to ENPADASI. An overview table was prepared
for the management of extracted items for each quality appraisal tool (Table 6). The item extraction table
summarized 7 types of information:
• Items: write the description of each extracted item;
• Objective: judge whether the item can be assessed without subjective thinking. Write “yes” if it is
objective and write “no” if it is subjective.
• Scoring: write how to score the item for different quality of studies;
• Reference: write the first author and year (or other relevant information) of the study containing the
item;
• Rewrite subjective items: rewrite subjective item as an objective item if applicable;
• Keep or not: make a final decision to include or exclude the item.
• Section: gathering similar items into one section.
Table 6: Example of extraction table for items of the quality appraisal tool
Items Objective? Scoring Reference Rewrite subjective
items Keep or not?
Name of Section. (Example: Design of pilot test)
Example. Has the statistical power of the study been assessed a priori?
Yes (1,0) Margetts-
cohort No keep
RESULT
The result of item extraction for each quality appraisal tool was summarized in table 7 below. The 1st version of
all quality appraisal tools can be found in the annex of this report.

JOINT PROGRAMMING INITIATIVE – A HEALTHY DIET FOR A HEALTHY LIFE EUROPEAN NUTRITION PHENOTYPE ASSESSMENT AND DATA SHARING INITIATIVE
19
Table 7: The result of item extraction for each quality appraisal tool
Name of
the tool
General tool
for study
design
Cohort
design
Case-
control
design
Cross-
sectional
design
Dietary data
collection
Anthropometry
Tools
cited
4 13 14 9 19 6
Items
cited
9 70 51 24 88 5
Objective
items
6 32 29 15 73 3
Subjective
items
3 38 22 9 15 2
JOINT PROGRAMMING INITIATIVE – A HEALTHY DIET FOR A HEALTHY LIFE EUROPEAN NUTRITION PHENOTYPE ASSESSMENT AND DATA SHARING INITIATIVE
20
METHODOLOGY FOR THE DEVELOPMENT OF EXPERIMENTAL STUDY QAT
A tool for quality assessment of experimental study design was developed in addition to the existing items
related to observational studies and measurements.
STEP 1. QUALITY APPRAISAL TOOL FOR EXPERIMENTAL STUDY DESIGN
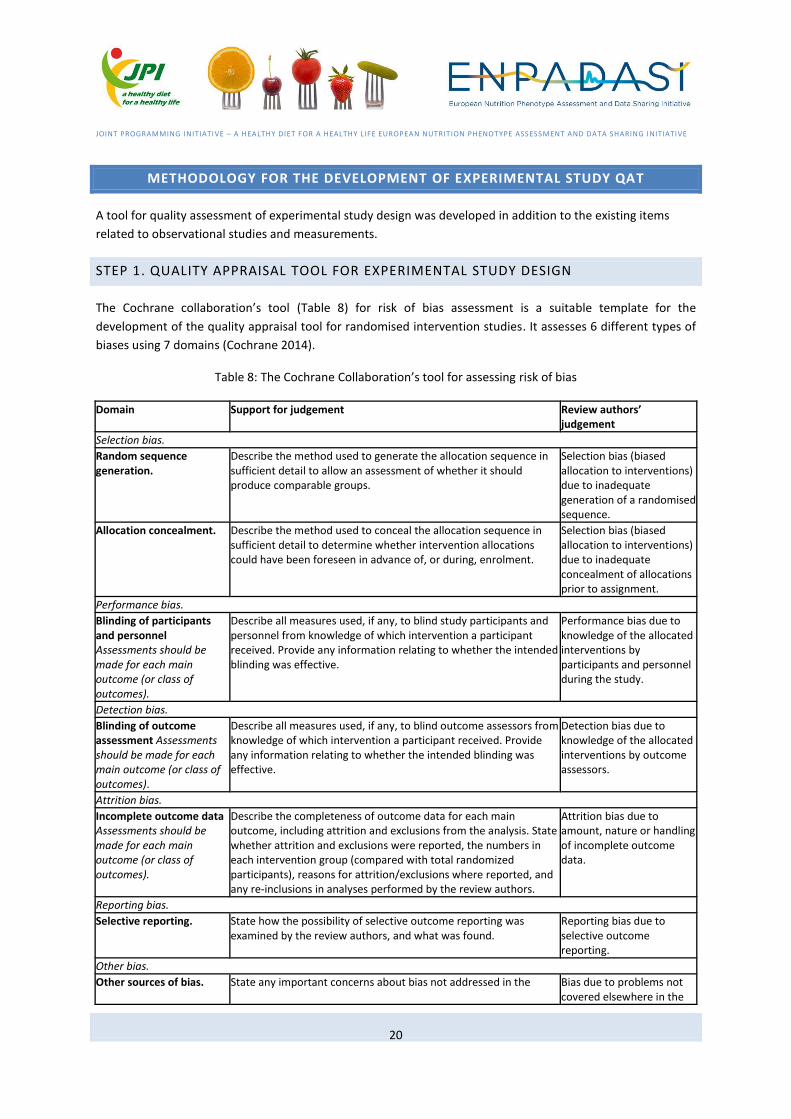
The Cochrane collaboration’s tool (Table 8) for risk of bias assessment is a suitable template for the
development of the quality appraisal tool for randomised intervention studies. It assesses 6 different types of
biases using 7 domains (Cochrane 2014).
Table 8: The Cochrane Collaboration’s tool for assessing risk of bias
Domain Support for judgement Review authors’ judgement
Selection bias.
Random sequence generation.
Describe the method used to generate the allocation sequence in sufficient detail to allow an assessment of whether it should produce comparable groups.
Selection bias (biased allocation to interventions) due to inadequate generation of a randomised sequence.
Allocation concealment. Describe the method used to conceal the allocation sequence in sufficient detail to determine whether intervention allocations could have been foreseen in advance of, or during, enrolment.
Selection bias (biased allocation to interventions) due to inadequate concealment of allocations prior to assignment.
Performance bias.
Blinding of participants and personnel Assessments should be made for each main outcome (or class of outcomes).
Describe all measures used, if any, to blind study participants and personnel from knowledge of which intervention a participant received. Provide any information relating to whether the intended blinding was effective.
Performance bias due to knowledge of the allocated interventions by participants and personnel during the study.
Detection bias.
Blinding of outcome assessment Assessments should be made for each main outcome (or class of outcomes).
Describe all measures used, if any, to blind outcome assessors from knowledge of which intervention a participant received. Provide any information relating to whether the intended blinding was effective.
Detection bias due to knowledge of the allocated interventions by outcome assessors.
Attrition bias.
Incomplete outcome data Assessments should be made for each main outcome (or class of outcomes).
Describe the completeness of outcome data for each main outcome, including attrition and exclusions from the analysis. State whether attrition and exclusions were reported, the numbers in each intervention group (compared with total randomized participants), reasons for attrition/exclusions where reported, and any re-inclusions in analyses performed by the review authors.
Attrition bias due to amount, nature or handling of incomplete outcome data.
Reporting bias.
Selective reporting. State how the possibility of selective outcome reporting was examined by the review authors, and what was found.
Reporting bias due to selective outcome reporting.
Other bias.
Other sources of bias. State any important concerns about bias not addressed in the Bias due to problems not covered elsewhere in the

JOINT PROGRAMMING INITIATIVE – A HEALTHY DIET FOR A HEALTHY LIFE EUROPEAN NUTRITION PHENOTYPE ASSESSMENT AND DATA SHARING INITIATIVE
21
other domains in the tool.
If particular questions/entries were pre-specified in the review’s protocol, responses should be provided for each question/entry.
table.
EDITING THE COCHRANE COLLABORATION’S TOOL
In the original version, risk of bias are based on the reviewer’s judgment after reading the published paper
describing the study. To avoid subjectivity, each domain of the “risk of bias assessment tool” created by the
Cochrane collaboration includes objective explanations. It is recommended that at least two independent
reviewers perform the assessments to reduce subjectivity.
As such, the original risk of bias tool may not be suitable to score datasets and needs some adaptation for the
ENPADASI purposes. Specifically, the domains were modified and formulated as questions for the data
provider and are described in the annex of the deliverable.
OUTCOME-SPECIFIC RISK OF BIAS ASSESSMENT
For different outcomes within one study, the effect of specific sources of bias may be different (Guyatt et al.
2011). As a result, for one trial, there might be some high quality outcomes but also some low quality
outcomes. Any tool assessing the risk of outcome bias needs to be specific for each outcome and implemented
as such in DASH-IN.
SOFTWARE DEVELOPMENT
Relevant quality appraisal items will be implemented in the DASH-in interface and ask those submitting data to
provide the relevant information. The tool can be implemented in addition to the existing items related to
observational studies and measurements. To aid implementing the items in DASH-IN, the template indicates
the type of interface (e.g. radio button) to use.
NEXT STEPS
AGREEMENT ON THE FINAL VERSION OF THE TOOL
• Using an overview of the selected items for each domain, a new tool will be developed, which should
be as short and simple as possible for use in ENPADASI. A meeting will be organised to develop the
new quality appraisal tool after reaching consensus among ENPADASI partners in a stepwise manner
First, a minimal list of items will be discussed and items will be selected. Second, items will be
assigned to scores from existing tools, i.e. STROBE/STROBE-nut. If needed, the tool will be circulated
to reach further consensus and finally be implemented in the database system.
JOINT PROGRAMMING INITIATIVE – A HEALTHY DIET FOR A HEALTHY LIFE EUROPEAN NUTRITION PHENOTYPE ASSESSMENT AND DATA SHARING INITIATIVE
22
• To ensure that the quality appraisal tool responds to the users’ needs, an inventory of information
requirements by those who seek to query the system is needed. A short survey within the ENPADASI
consortium is proposed for this purpose. This information will be complemented with a short
feedback on the user requirements of the dbNP (Nutritional Phenotype Database). Information
obtained from the survey will help to identify critical issues and help prioritise or rationalise items
proposed to assess quality of studies in ENPADASI.

JOINT PROGRAMMING INITIATIVE – A HEALTHY DIET FOR A HEALTHY LIFE EUROPEAN NUTRITION PHENOTYPE ASSESSMENT AND DATA SHARING INITIATIVE
23
REFERENCES
Al-Jader, L. N., Newcombe, R. G., Hayes, S., et al. (2002). Developing a quality scoring system for epidemiological surveys of genetic disorders. Clin Genet 62(3): 230-234.
Carneiro, A. V. (2002). Critical appraisal of prognostic evidence: practical rules. Rev Port Cardiol 21: 891–900.
CEBMa (updated 2014 June 5). Critical appraisal of a case-control study. Retrieved 15 December, 2015, from http://www.cebma.org/wp-content/uploads/Critical-Appraisal-Questions-for-a-Case-Control-Study.pdf.
CEBMa (2014 June 5). Critical appraisal of a Cohort or Panel Study. Retrieved 15 December, 2015, from http://www.cebma.org/wp-content/uploads/Critical-Appraisal-Questions-for-a-Cohort-or-Panel-Study.pdf.
CEBMa (updated 2014 June 5). Critical appraisal of a survey. Retrieved 15 December, 2015, from http://www.cebma.org/wp-content/uploads/Critical-Appraisal-Questions-for-a-Survey.pdf.
Cho, M. K. and Bero, L. A. (1994). Instruments for assessing the quality of drug studies published in the medical literature. JAMA 272(2): 101-104.
Chung, M., Balk, E. M., Brendel, M., et al. (2009). Vitamin D and calcium: a systematic review of health outcomes. Evid Rep Technol Assess (Full Rep)(183): 1-420.
Cochrane (2014). Cochrane Handbook for Systematic Reviews of Interventions: 8.5 The Cochrane Collaboration's tool for assessing risk of bias. Retrieved 9th February, 2016, from http://handbook.cochrane.org/chapter_8/8_5_the_cochrane_collaborations_tool_for_assessing_risk_of_bias.htm.
Cook, D. A. and Reed, D. A. (2015). Appraising the quality of medical education research methods: the Medical Education Research Study Quality Instrument and the Newcastle-Ottawa Scale-Education. Acad Med 90(8): 1067-1076.
Crowe, M. and Sheppard, L. (2011). A general critical appraisal tool: An evaluation of construct validity. International Journal of Nursing Studies 48(12): 1505-1516.
Cust, A. E., Armstrong, B. K., Friedenreich, C. M., et al. (2007). Physical activity and endometrial cancer risk: a review of the current evidence, biologic mechanisms and the quality of physical activity assessment methods. Cancer Causes Control 18(3): 243-258.
da Costa, B. R., Cevallos, M., Altman, D. G., et al. (2011). Uses and misuses of the STROBE statement: bibliographic study. BMJ Open 1(1): e000048.
Deeks, J. J., Dinnes, J., D'Amico, R., et al. (2003). Evaluating non-randomised intervention studies. Health Technol Assess 7(27): iii-x, 1-173.
Downs, S. H. and Black, N. (1998). The feasibility of creating a checklist for the assessment of the methodological quality both of randomised and non-randomised studies of health care interventions. Journal of Epidemiology and Community Health 52(6): 377-384.
EPHPP. Quality Assessment Tool for Quantitative Studies. Retrieved 15 December, 2015, from http://www.city.hamilton.on.ca/PHCS/EPHPP.
Friedenreich, C. M., Brant, R. F. and Riboli, E. (1994). Influence of methodologic factors in a pooled analysis of 13 case-control studies of colorectal cancer and dietary fiber. Epidemiology 5(1): 66-79.

JOINT PROGRAMMING INITIATIVE – A HEALTHY DIET FOR A HEALTHY LIFE EUROPEAN NUTRITION PHENOTYPE ASSESSMENT AND DATA SHARING INITIATIVE
24
Gallo, V., Egger, M., McCormack, V., et al. (2011). STrengthening the Reporting of OBservational studies in Epidemiology--Molecular Epidemiology (STROBE-ME): an extension of the STROBE Statement. PLoS Med. 8(10).
Genaidy, A. M., Lemasters, G. K., Lockey, J., et al. (2007). An epidemiological appraisal instrument - a tool for evaluation of epidemiological studies. Ergonomics 50(6): 920-960.
Giannakopoulos, N. N., Rammelsberg, P., Eberhard, L., et al. (2012). A new instrument for assessing the quality of studies on prevalence. Clin Oral Investig 16(3): 781-788.
Greenhalgh, T. (1997). How to Read a Paper: Assessing the methodological quality of published papers. BMJ 315: 305-308.
Greenhalgh, T. and Taylor, R. (1997). How to read a paper: papers that go beyond numbers (qualitative research). BMJ 315: 740-743.
Guyatt, G. H., Oxman, A. D., Vist, G., et al. (2011). GRADE guidelines: 4. Rating the quality of evidence--study limitations (risk of bias). J Clin Epidemiol 64(4): 407-415.
Hagströmer, M., Ainsworth, B. E., Kwak, L., et al. (2012). A checklist for evaluating the methodological quality of validation studies on self-report instruments for physical activity and sedentary behavior. J Phys Act Health: Suppl 1:S29-36.
Heller, R. F., Verma, A., Gemmell, I., et al. (2008). Critical appraisal for public health: a new checklist. Public Health 122(1): 92-98.
Herbison, P., Hay-Smith, J. and Gillespie, W. J. (2006). Adjustment of meta-analyses on the basis of quality scores should be abandoned. J Clin Epidemiol. 59(12): 1249-1256.
Hoy, D., Brooks, P., Woolf, A., et al. (2012). Assessing risk of bias in prevalence studies: modification of an existing tool and evidence of interrater agreement. J Clin Epidemiol 65(9): 934-939.
JBI (2014). Joanna Briggs Institute Reviewers’ Manual: 2014 edition.
Katrak, P., Bialocerkowski, A. E., Massy-Westropp, N., et al. (2004). A systematic review of the content of critical appraisal tools. BMC Med Res Methodol 4: 22.
Levine, M., Walter, S., Lee, H., et al. (1994). Users' guides to the medical literature. IV. How to use an article about harm. Evidence-Based Medicine Working Group. J Am Med Assoc 271: 1615-1619.
Lo, C. K., Mertz, D. and Loeb, M. (2014). Newcastle-Ottawa Scale: comparing reviewers' to authors' assessments. BMC Med Res Methodol 14: 45.
Loney, P. L., Chambers, L. W., Bennett, K. J., et al. (1998). Critical appraisal of the health research literature: prevalence or incidence of a health problem. Chronic Dis Can 19(4): 170-176.
Margetts, B. M., Thompson, R. L., Key, T., et al. (1995). Development of a scoring system to judge the scientific quality of information from case-control and cohort studies of nutrition and disease. Nutr Cancer 24(3): 231-239.
Mokkink, L. B., Terwee, C. B., Patrick, D. L., et al. (2010). The COSMIN checklist for assessing the methodological quality of studies on measurement properties of health status measurement instruments: an international Delphi study. Qual Life Res 19(4): 539-549.
Munn, Z., Moola, S., Riitano, D., et al. (2014). The development of a critical appraisal tool for use in systematic reviews addressing questions of prevalence. Int J Health Policy Manag 3(3): 123-128.
JOINT PROGRAMMING INITIATIVE – A HEALTHY DIET FOR A HEALTHY LIFE EUROPEAN NUTRITION PHENOTYPE ASSESSMENT AND DATA SHARING INITIATIVE
25
NCCEH (updated 2014 June 5). A Primer for Evaluating the Quality of Studies on Environmental Health Critical Appraisal of Cross-Sectional Studies. Retrieved 15 December, 2015, from http://www.ncceh.ca/sites/default/files/Critical_Appraisal_Cross-Sectional_Studies_Aug_2011.pdf.
Nelson, M., Margetts, B. M. and Black, A. E. (1993). Checklist for the methods section of dietary investigations. Metabolism. 42: 258-259.
NHMRC (2000). How to Use the Evidence: Assessment and Application of Scientific Evidence. Canberra, National Health and Medical Research Council.
NNR, w. g. (2011). A guide for conducting Systematic Literature Reviews for the 5th edition of the Nordic Nutrition Recommendations. Revised ed.
Norden (2012). Integrating nutrition and physical activity Norden 5th Edition
Oremus, M., Oremus, C., Hall, G. B., et al. (2012). Inter-rater and test retest reliability of quality assessments by novice student raters using the Jadad and Newcastle-Ottawa Scales. BMJ Open 2(4).
Ross, L. E., Grigoriadis, S., Mamisashvili, L., et al. (2011). Quality assessment of observational studies in psychiatry: an example from perinatal psychiatric research. Int J Methods Psychiatr Res 20(4): 224-234.
SACN (2008). SACN framework for evaluation of evidence. from https://www.gov.uk/government/uploads/system/uploads/attachment_data/file/338009/SACN_Framework_for_the_Evaluation_of_Evidence_May_2012.pdf.
Sanderson, S., Tatt, I. D. and Higgins, J. P. (2007). Tools for assessing quality and susceptibility to bias in observational studies in epidemiology: a systematic review and annotated bibliography. Int J Epidemiol 36(3): 666-676.
Serra-Majem, L., Frost Andersen, L., Henrique-Sanchez, P., et al. (2009). Evaluating the quality of dietary intake validation studies. Br J Nutr 102 Suppl 1: S3-9.
Shea, B. J., Grimshaw, J. M., Wells, G. A., et al. (2007). Development of AMSTAR: a measurement tool to assess the methodological quality of systematic reviews. BMC Med Res Methodol 7: 10.
SIGN. SIGN: Methodology Checklist 3: Cohort studies. Retrieved 20 Jan, 2016, from http://www.sign.ac.uk/methodology/checklists.html.
SIGN. SIGN: Methodology Checklist 4: Case-control studies. Retrieved 20 Jan, 2016, from http://www.sign.ac.uk/methodology/checklists.html.
Sirriyeh, R., Lawton, R., Gardner, P., et al. (2012). Reviewing studies with diverse designs: the development and evaluation of a new tool. J Eval Clin Pract 18(4): 746-752.
Terwee, C. B., Mokkink, L. B., Knol, D. L., et al. (2012). Rating the methodological quality in systematic reviews of studies on measurement properties: a scoring system for the COSMIN checklist. Qual Life Res 21(4): 651-657.
Thompson, S., Ekelund, U., Jebb, S., et al. (2011). A proposed method of bias adjustment for meta-analyses of published observational studies. Int J Epidemiol 40(3): 765-777.
Viswanathan, M., Berkman, N. D., Dryden, D. M., et al. (2013). Assessing Risk of Bias and Confounding in Observational Studies of Interventions or Exposures: Further Development of the RTI Item Bank, Rockville (MD): Agency for Healthcare Research and Quality (US).
JOINT PROGRAMMING INITIATIVE – A HEALTHY DIET FOR A HEALTHY LIFE EUROPEAN NUTRITION PHENOTYPE ASSESSMENT AND DATA SHARING INITIATIVE
26
von, E. E., Altman, D. G., Egger, M., et al. (2007). The Strengthening the Reporting of Observational Studies in Epidemiology (STROBE)statement: guidelines for reporting observational studies. PLoS Med. 4(10): e296.
Wells, G. A., Shea, B., O'Connell, D., et al. (2008). The Newcastle-Ottawa Scale (NOS) for assessing the quality of nonrandomised studies in meta-analyses. Retrieved March 17, 2015, from http://www.ohri.ca/programs/clinical_epidemiology/oxford.htm.
Wong, W. C., Cheung, C. S. and Hart, G. J. (2008). Development of a quality assessment tool for systematic reviews of observational studies (QATSO) of HIV prevalence in men having sex with men and associated risk behaviours. Emerg Themes Epidemiol 5: 23.
Yang, W. Y., Burrows, T., MacDonald-Wicks, L., et al. (2014). Quality of dietary assessment methodology and reporting in epidemiology studies examining relationship between dietary outcome and childhood obesity in developing Asian countries: A systematic review. Nutrition & Dietetics 71(3): 201-209.
Zeng, X., Zhang, Y., Kwong, J. S., et al. (2015). The methodological quality assessment tools for preclinical and clinical studies, systematic review and meta-analysis, and clinical practice guideline: a systematic review. J Evid Based Med 8(1): 2-10.

JOINT PROGRAMMING INITIATIVE – A HEALTHY DIET FOR A HEALTHY LIFE EUROPEAN NUTRITION PHENOTYPE ASSESSMENT AND DATA SHARING INITIATIVE
27
ANNEXES: AN OVERVIEW OF EXISTING QUALITY APPRAISAL ITEMS FOR STUDY DESIGN
AND MEASUREMENTS FOR DIETARY ASSESSMENT STUDIES
JOINT PROGRAMMING INITIATIVE – A HEALTHY DIET FOR A HEALTHY LIFE EUROPEAN NUTRITION PHENOTYPE ASSESSMENT AND DATA SHARING INITIATIVE
28
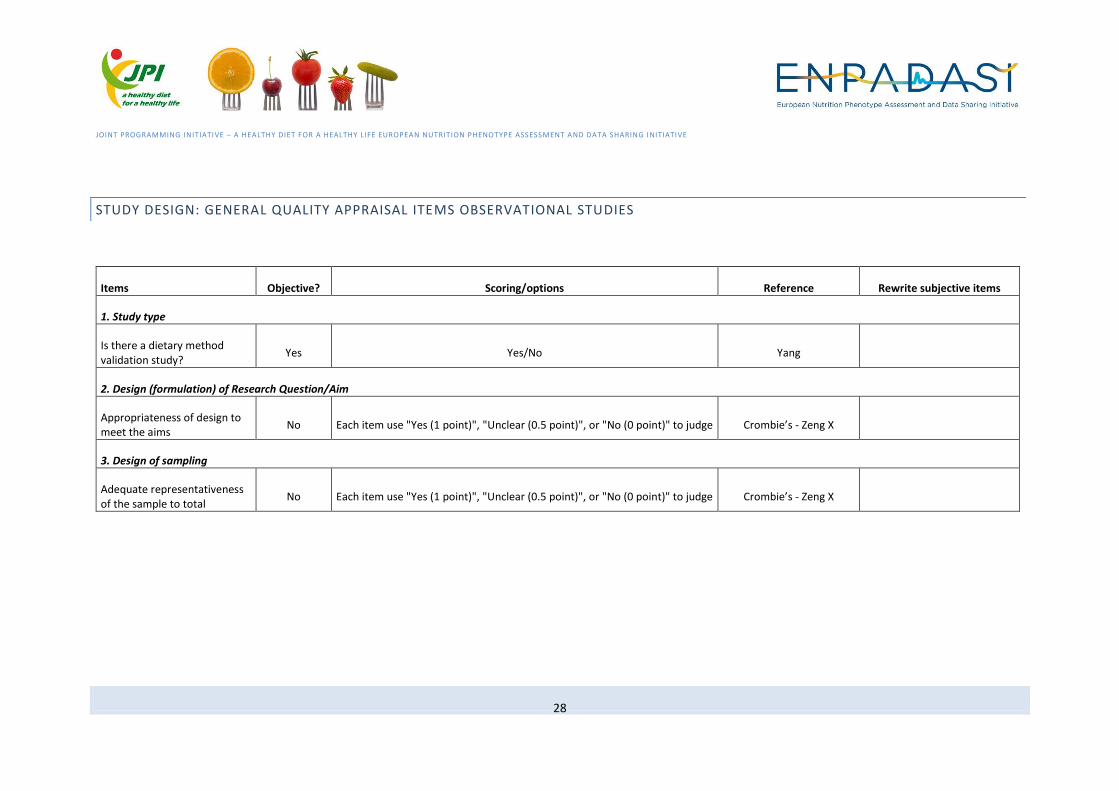
STUDY DESIGN: GENERAL QUALITY APPRAISAL ITEMS OBSERVATIONAL STUDIES
Items Objective? Scoring/options Reference Rewrite subjective items
1. Study type
Is there a dietary method validation study?
Yes Yes/No Yang
2. Design (formulation) of Research Question/Aim
Appropriateness of design to meet the aims
No Each item use "Yes (1 point)", "Unclear (0.5 point)", or "No (0 point)" to judge Crombie’s - Zeng X
3. Design of sampling
Adequate representativeness of the sample to total
No Each item use "Yes (1 point)", "Unclear (0.5 point)", or "No (0 point)" to judge Crombie’s - Zeng X
JOINT PROGRAMMING INITIATIVE – A HEALTHY DIET FOR A HEALTHY LIFE EUROPEAN NUTRITION PHENOTYPE ASSESSMENT AND DATA SHARING INITIATIVE
29
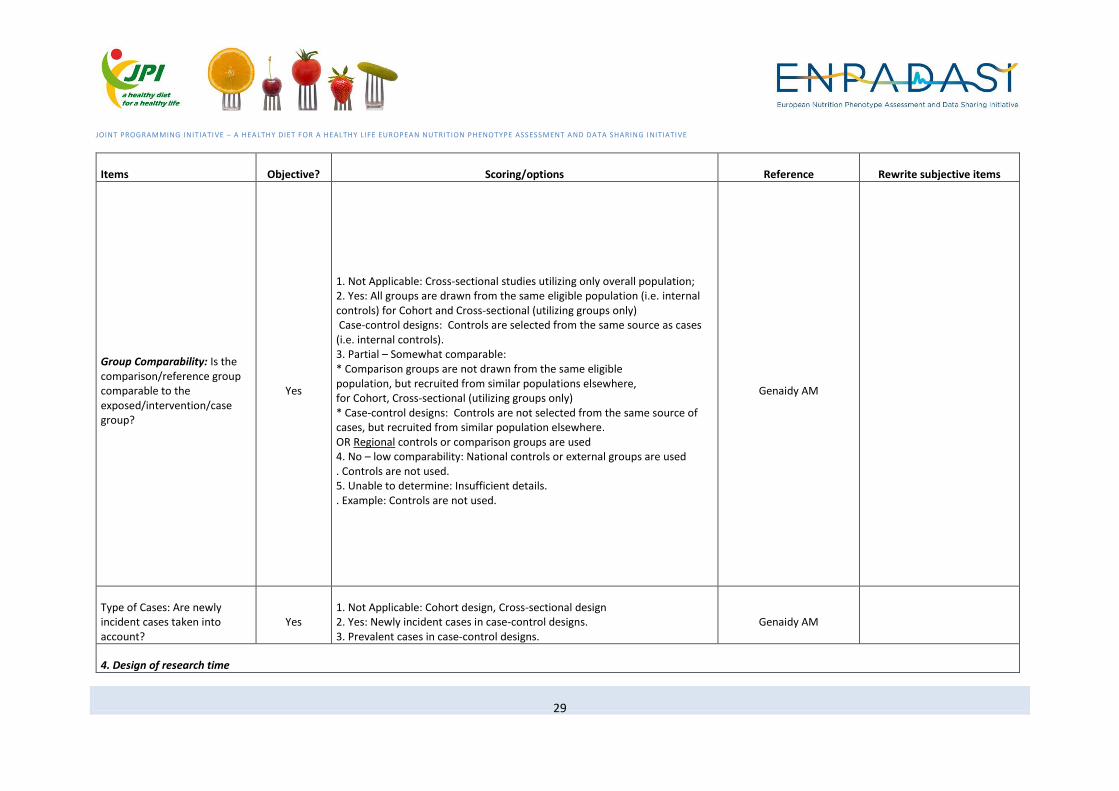
Items Objective? Scoring/options Reference Rewrite subjective items
Group Comparability: Is the comparison/reference group comparable to the exposed/intervention/case group?
Yes
1. Not Applicable: Cross-sectional studies utilizing only overall population; 2. Yes: All groups are drawn from the same eligible population (i.e. internal controls) for Cohort and Cross-sectional (utilizing groups only) Case-control designs: Controls are selected from the same source as cases (i.e. internal controls). 3. Partial – Somewhat comparable: * Comparison groups are not drawn from the same eligible population, but recruited from similar populations elsewhere, for Cohort, Cross-sectional (utilizing groups only) * Case-control designs: Controls are not selected from the same source of cases, but recruited from similar population elsewhere. OR Regional controls or comparison groups are used 4. No – low comparability: National controls or external groups are used . Controls are not used. 5. Unable to determine: Insufficient details. . Example: Controls are not used.
Genaidy AM
Type of Cases: Are newly incident cases taken into account?
Yes 1. Not Applicable: Cohort design, Cross-sectional design 2. Yes: Newly incident cases in case-control designs. 3. Prevalent cases in case-control designs.
Genaidy AM
4. Design of research time
JOINT PROGRAMMING INITIATIVE – A HEALTHY DIET FOR A HEALTHY LIFE EUROPEAN NUTRITION PHENOTYPE ASSESSMENT AND DATA SHARING INITIATIVE
30
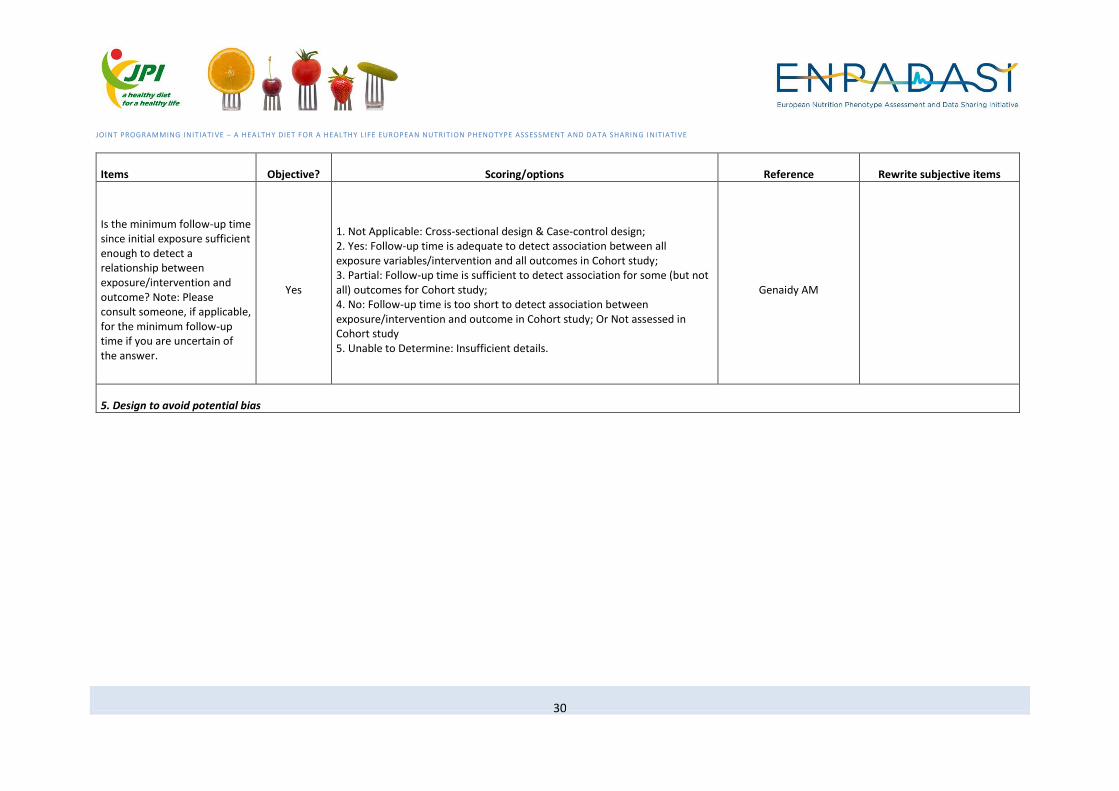
Items Objective? Scoring/options Reference Rewrite subjective items
Is the minimum follow-up time since initial exposure sufficient enough to detect a relationship between exposure/intervention and outcome? Note: Please consult someone, if applicable, for the minimum follow-up time if you are uncertain of the answer.
Yes
1. Not Applicable: Cross-sectional design & Case-control design; 2. Yes: Follow-up time is adequate to detect association between all exposure variables/intervention and all outcomes in Cohort study; 3. Partial: Follow-up time is sufficient to detect association for some (but not all) outcomes for Cohort study; 4. No: Follow-up time is too short to detect association between exposure/intervention and outcome in Cohort study; Or Not assessed in Cohort study 5. Unable to Determine: Insufficient details.
Genaidy AM
5. Design to avoid potential bias
JOINT PROGRAMMING INITIATIVE – A HEALTHY DIET FOR A HEALTHY LIFE EUROPEAN NUTRITION PHENOTYPE ASSESSMENT AND DATA SHARING INITIATIVE
31
Items Objective? Scoring/options Reference Rewrite subjective items
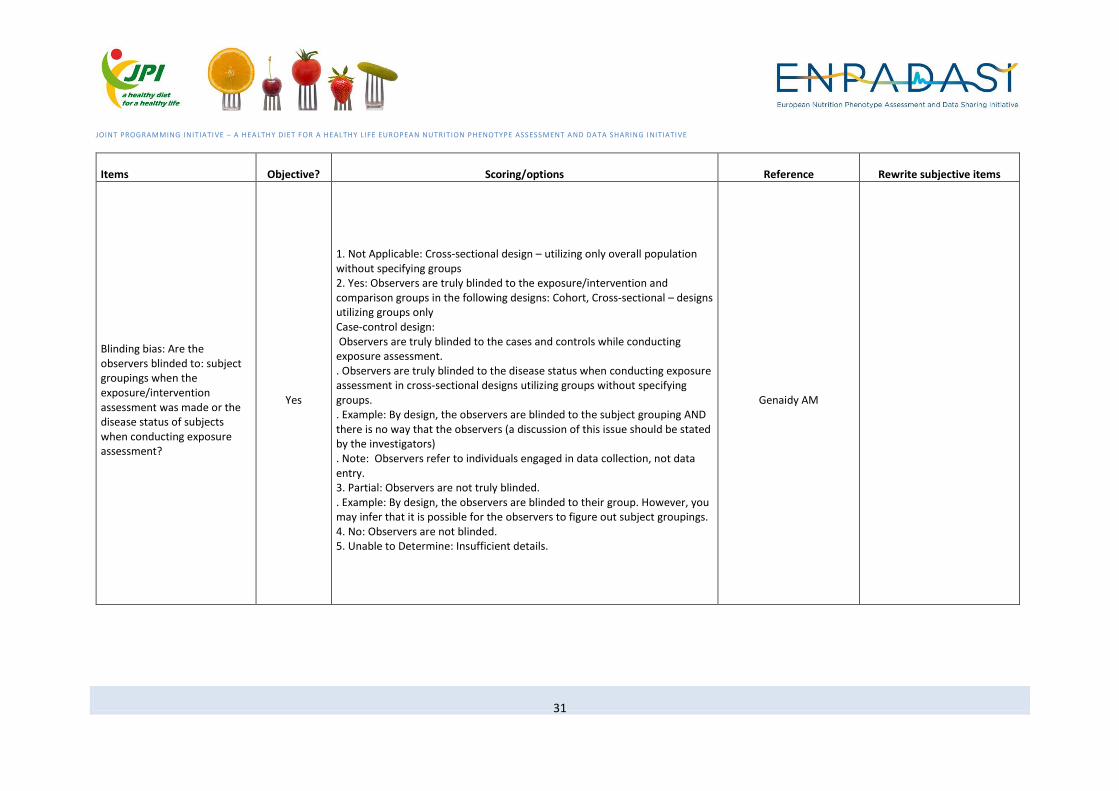
Blinding bias: Are the observers blinded to: subject groupings when the exposure/intervention assessment was made or the disease status of subjects when conducting exposure assessment?
Yes
1. Not Applicable: Cross-sectional design – utilizing only overall population without specifying groups 2. Yes: Observers are truly blinded to the exposure/intervention and comparison groups in the following designs: Cohort, Cross-sectional – designs utilizing groups only Case-control design: Observers are truly blinded to the cases and controls while conducting exposure assessment. . Observers are truly blinded to the disease status when conducting exposure assessment in cross-sectional designs utilizing groups without specifying groups. . Example: By design, the observers are blinded to the subject grouping AND there is no way that the observers (a discussion of this issue should be stated by the investigators) . Note: Observers refer to individuals engaged in data collection, not data entry. 3. Partial: Observers are not truly blinded. . Example: By design, the observers are blinded to their group. However, you may infer that it is possible for the observers to figure out subject groupings. 4. No: Observers are not blinded. 5. Unable to Determine: Insufficient details.
Genaidy AM
JOINT PROGRAMMING INITIATIVE – A HEALTHY DIET FOR A HEALTHY LIFE EUROPEAN NUTRITION PHENOTYPE ASSESSMENT AND DATA SHARING INITIATIVE
32
Items Objective? Scoring/options Reference Rewrite subjective items
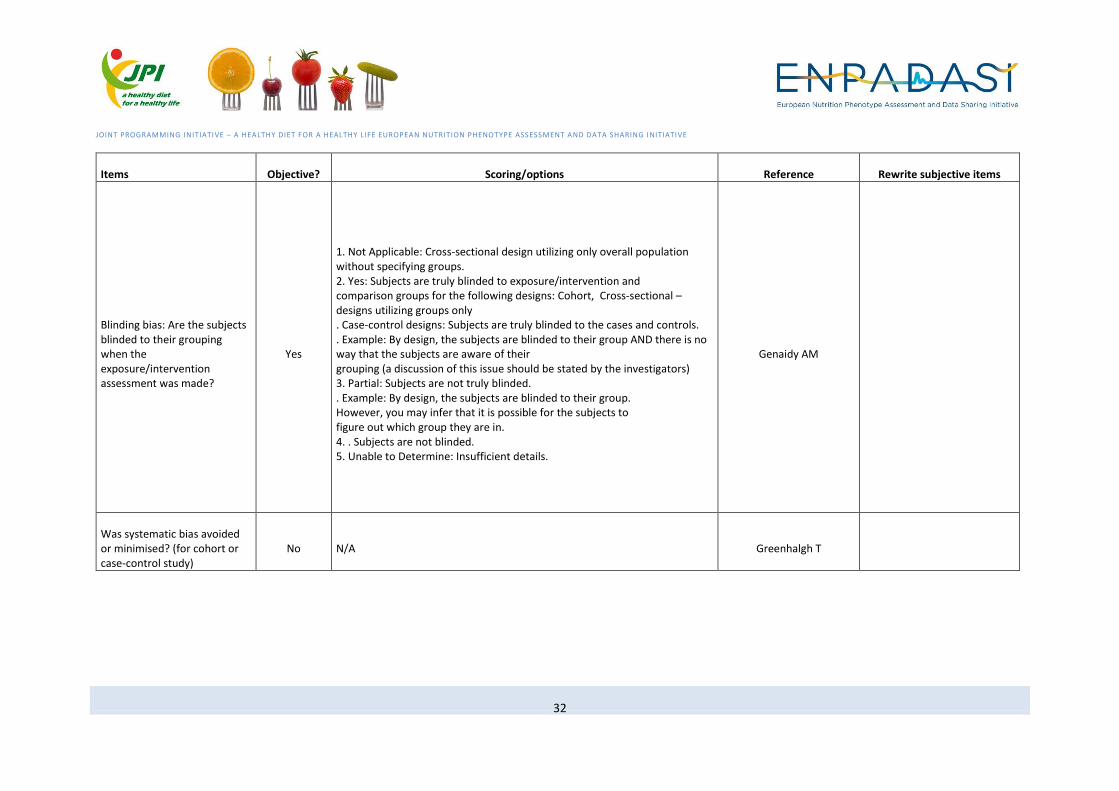
Blinding bias: Are the subjects blinded to their grouping when the exposure/intervention assessment was made?
Yes
1. Not Applicable: Cross-sectional design utilizing only overall population without specifying groups. 2. Yes: Subjects are truly blinded to exposure/intervention and comparison groups for the following designs: Cohort, Cross-sectional – designs utilizing groups only . Case-control designs: Subjects are truly blinded to the cases and controls. . Example: By design, the subjects are blinded to their group AND there is no way that the subjects are aware of their grouping (a discussion of this issue should be stated by the investigators) 3. Partial: Subjects are not truly blinded. . Example: By design, the subjects are blinded to their group. However, you may infer that it is possible for the subjects to figure out which group they are in. 4. . Subjects are not blinded. 5. Unable to Determine: Insufficient details.
Genaidy AM
Was systematic bias avoided or minimised? (for cohort or case-control study)
No N/A Greenhalgh T
JOINT PROGRAMMING INITIATIVE – A HEALTHY DIET FOR A HEALTHY LIFE EUROPEAN NUTRITION PHENOTYPE ASSESSMENT AND DATA SHARING INITIATIVE
33
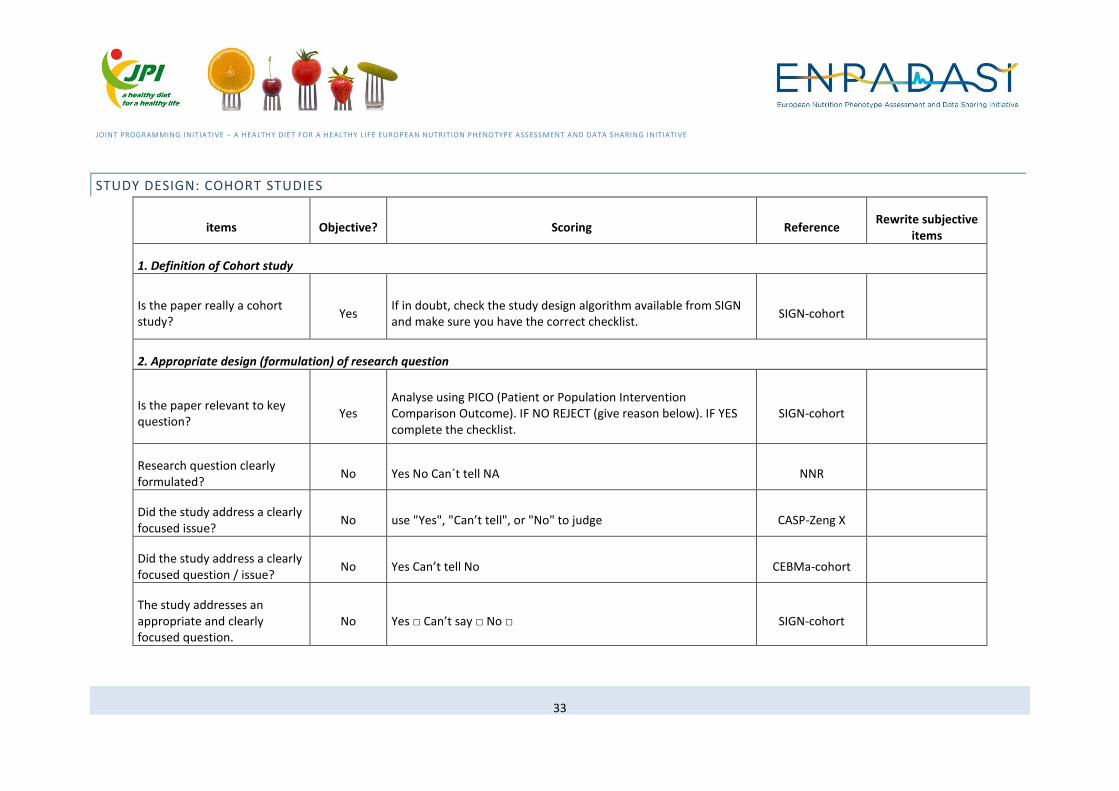
STUDY DESIGN: COHORT STUDIES
items Objective? Scoring Reference Rewrite subjective
items
1. Definition of Cohort study
Is the paper really a cohort study?
Yes If in doubt, check the study design algorithm available from SIGN and make sure you have the correct checklist.
SIGN-cohort
2. Appropriate design (formulation) of research question
Is the paper relevant to key question?
Yes Analyse using PICO (Patient or Population Intervention Comparison Outcome). IF NO REJECT (give reason below). IF YES complete the checklist.
SIGN-cohort
Research question clearly formulated?
No Yes No Can´t tell NA NNR
Did the study address a clearly focused issue?
No use "Yes", "Can’t tell", or "No" to judge CASP-Zeng X
Did the study address a clearly focused question / issue?
No Yes Can’t tell No CEBMa-cohort
The study addresses an appropriate and clearly focused question.
No Yes □ Can’t say □ No □ SIGN-cohort

JOINT PROGRAMMING INITIATIVE – A HEALTHY DIET FOR A HEALTHY LIFE EUROPEAN NUTRITION PHENOTYPE ASSESSMENT AND DATA SHARING INITIATIVE
34
items Objective? Scoring Reference Rewrite subjective
items
Is the research method (study design) appropriate for answering the research question?
No Yes Can’t tell No CEBMa-cohort
3. Design for testing hypothesis
Was the study design suited to test the research hypothesis?
No Yes No Can´t tell NA NNR
4. Design of pilot test
Has the statistical power of the study been assessed a priori?
Yes (1,0) Margetts-cohort
Has diagnosis been confirmed?
Yes
o By histology/cytology/radiology= 3 points; o By reference to clinical notes= 2 points; o From death certificates= 1 point; o Unconfirmed, from subjects only= 0 points
Margetts-cohort
Evidence from other sources is used to demonstrate that the method of outcome assessment is valid and reliable.
Yes Yes □ Can’t say □ No □ Does not apply □ SIGN-cohort
JOINT PROGRAMMING INITIATIVE – A HEALTHY DIET FOR A HEALTHY LIFE EUROPEAN NUTRITION PHENOTYPE ASSESSMENT AND DATA SHARING INITIATIVE
35
items Objective? Scoring Reference Rewrite subjective
items
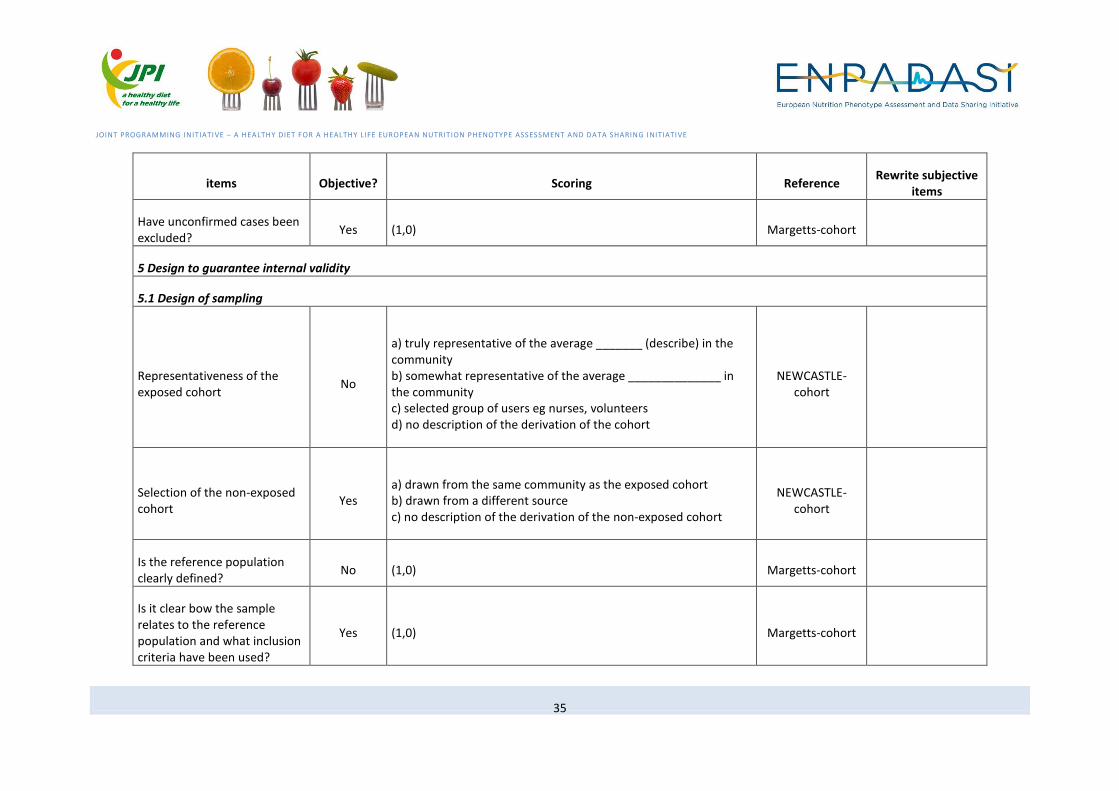
Have unconfirmed cases been excluded?
Yes (1,0) Margetts-cohort
5 Design to guarantee internal validity
5.1 Design of sampling
Representativeness of the exposed cohort
No
a) truly representative of the average _______ (describe) in the community b) somewhat representative of the average ______________ in the community c) selected group of users eg nurses, volunteers d) no description of the derivation of the cohort
NEWCASTLE-cohort
Selection of the non-exposed cohort
Yes a) drawn from the same community as the exposed cohort b) drawn from a different source c) no description of the derivation of the non-exposed cohort
NEWCASTLE-cohort
Is the reference population clearly defined?
No (1,0) Margetts-cohort
Is it clear bow the sample relates to the reference population and what inclusion criteria have been used?
Yes (1,0) Margetts-cohort
JOINT PROGRAMMING INITIATIVE – A HEALTHY DIET FOR A HEALTHY LIFE EUROPEAN NUTRITION PHENOTYPE ASSESSMENT AND DATA SHARING INITIATIVE
36
items Objective? Scoring Reference Rewrite subjective
items
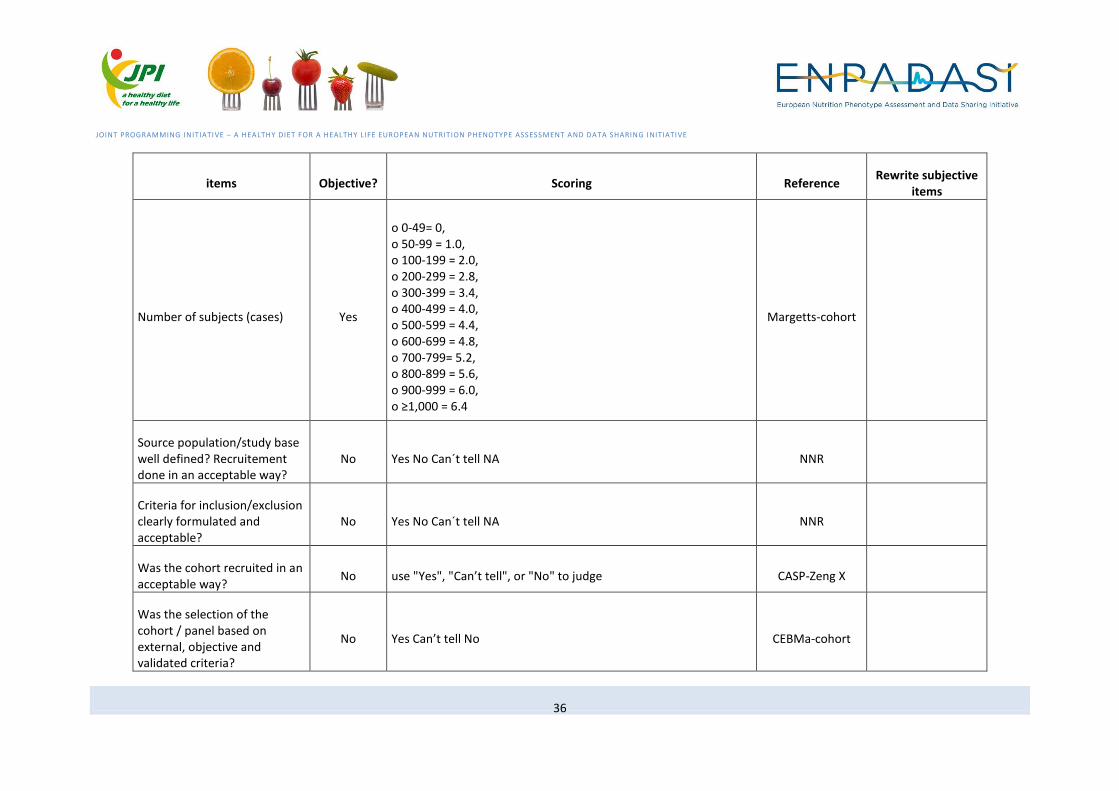
Number of subjects (cases) Yes
o 0-49= 0, o 50-99 = 1.0, o 100-199 = 2.0, o 200-299 = 2.8, o 300-399 = 3.4, o 400-499 = 4.0, o 500-599 = 4.4, o 600-699 = 4.8, o 700-799= 5.2, o 800-899 = 5.6, o 900-999 = 6.0, o ≥1,000 = 6.4
Margetts-cohort
Source population/study base well defined? Recruitement done in an acceptable way?
No Yes No Can´t tell NA NNR
Criteria for inclusion/exclusion clearly formulated and acceptable?
No Yes No Can´t tell NA NNR
Was the cohort recruited in an acceptable way?
No use "Yes", "Can’t tell", or "No" to judge CASP-Zeng X
Was the selection of the cohort / panel based on external, objective and validated criteria?
No Yes Can’t tell No CEBMa-cohort
JOINT PROGRAMMING INITIATIVE – A HEALTHY DIET FOR A HEALTHY LIFE EUROPEAN NUTRITION PHENOTYPE ASSESSMENT AND DATA SHARING INITIATIVE
37
items Objective? Scoring Reference Rewrite subjective
items
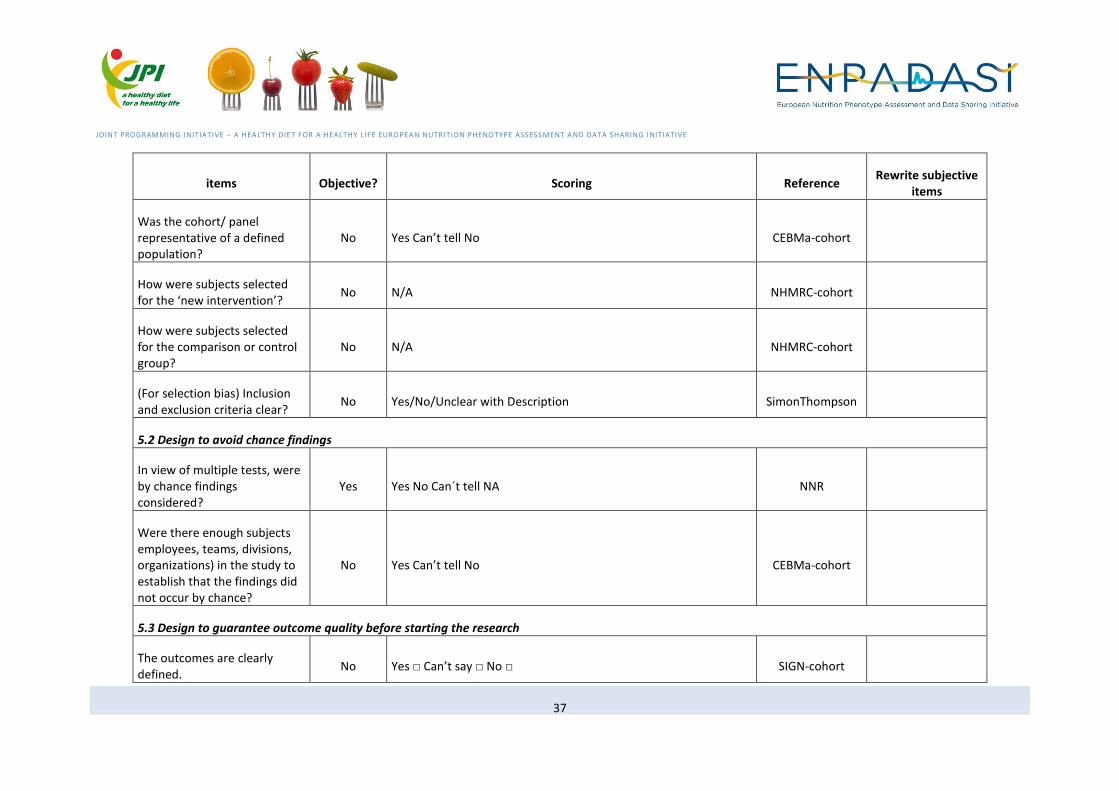
Was the cohort/ panel representative of a defined population?
No Yes Can’t tell No CEBMa-cohort
How were subjects selected for the ‘new intervention’?
No N/A NHMRC-cohort
How were subjects selected for the comparison or control group?
No N/A NHMRC-cohort
(For selection bias) Inclusion and exclusion criteria clear?
No Yes/No/Unclear with Description SimonThompson
5.2 Design to avoid chance findings
In view of multiple tests, were by chance findings considered?
Yes Yes No Can´t tell NA NNR
Were there enough subjects employees, teams, divisions, organizations) in the study to establish that the findings did not occur by chance?
No Yes Can’t tell No CEBMa-cohort
5.3 Design to guarantee outcome quality before starting the research
The outcomes are clearly defined.
No Yes □ Can’t say □ No □ SIGN-cohort
JOINT PROGRAMMING INITIATIVE – A HEALTHY DIET FOR A HEALTHY LIFE EUROPEAN NUTRITION PHENOTYPE ASSESSMENT AND DATA SHARING INITIATIVE
38
items Objective? Scoring Reference Rewrite subjective
items
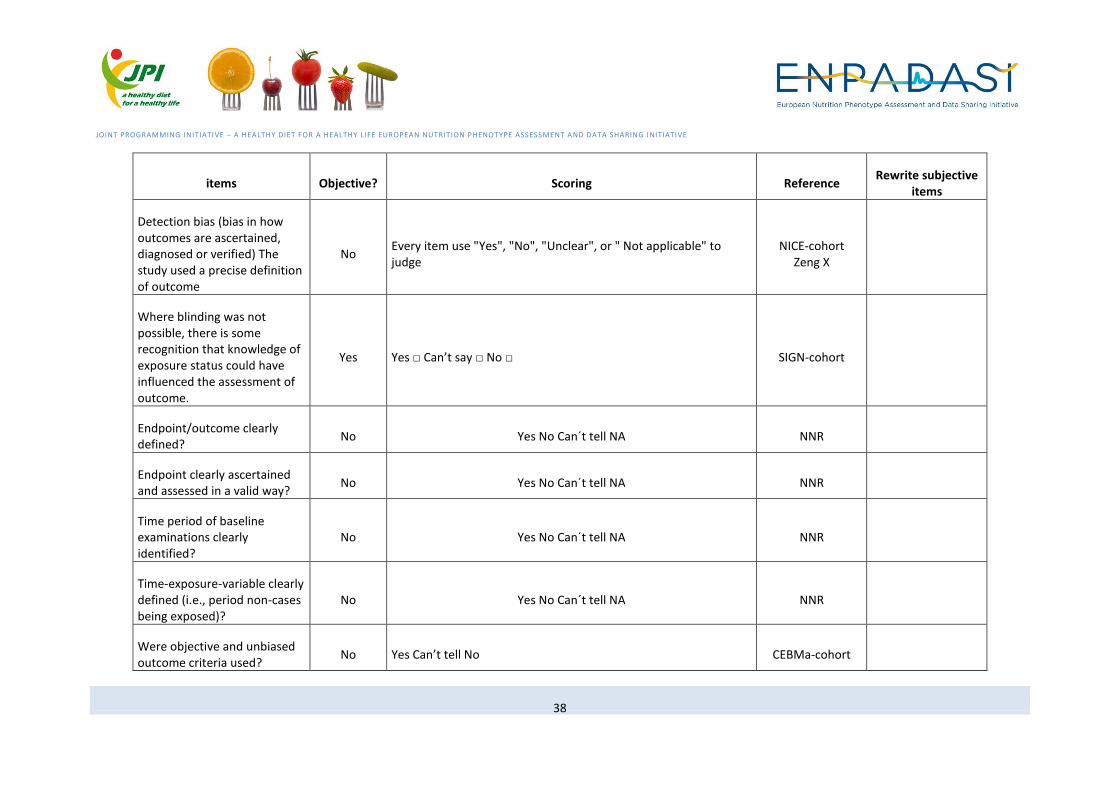
Detection bias (bias in how outcomes are ascertained, diagnosed or verified) The study used a precise definition of outcome
No Every item use "Yes", "No", "Unclear", or " Not applicable" to judge
NICE-cohort Zeng X
Where blinding was not possible, there is some recognition that knowledge of exposure status could have influenced the assessment of outcome.
Yes Yes □ Can’t say □ No □ SIGN-cohort
Endpoint/outcome clearly defined?
No Yes No Can´t tell NA NNR
Endpoint clearly ascertained and assessed in a valid way?
No Yes No Can´t tell NA NNR
Time period of baseline examinations clearly identified?
No Yes No Can´t tell NA NNR
Time-exposure-variable clearly defined (i.e., period non-cases being exposed)?
No Yes No Can´t tell NA NNR
Were objective and unbiased outcome criteria used?
No Yes Can’t tell No CEBMa-cohort
JOINT PROGRAMMING INITIATIVE – A HEALTHY DIET FOR A HEALTHY LIFE EUROPEAN NUTRITION PHENOTYPE ASSESSMENT AND DATA SHARING INITIATIVE
39
items Objective? Scoring Reference Rewrite subjective
items
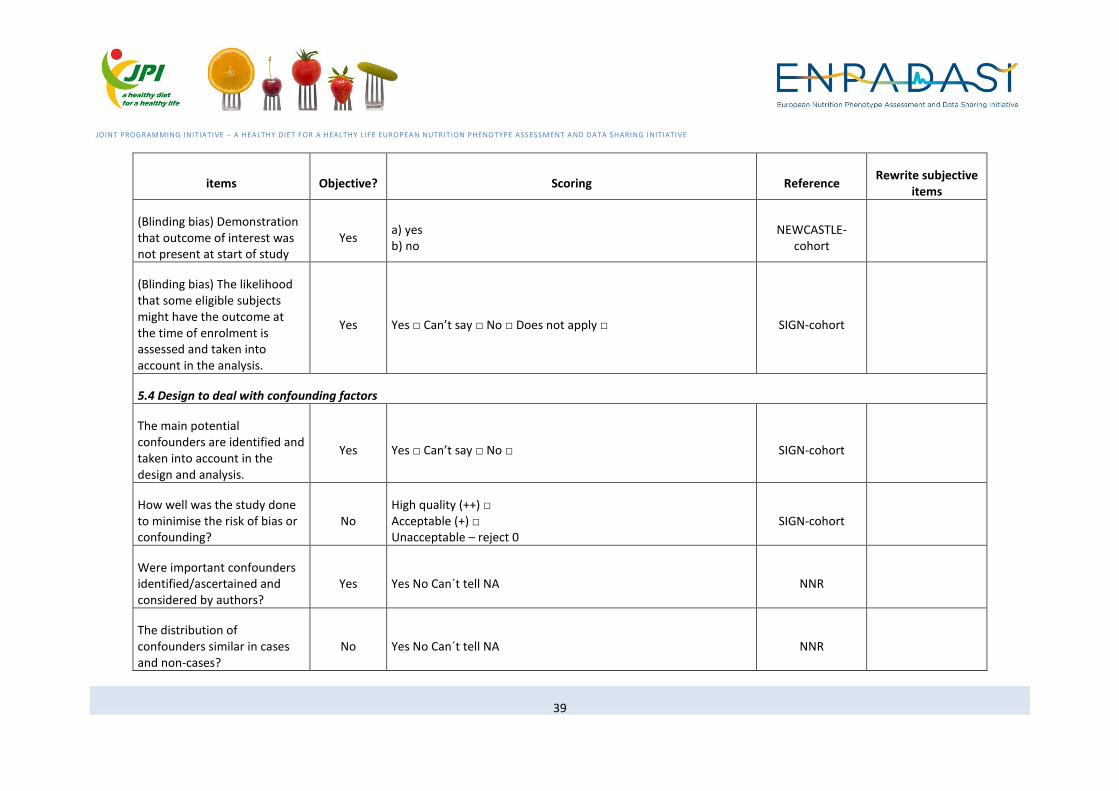
(Blinding bias) Demonstration that outcome of interest was not present at start of study
Yes a) yes b) no
NEWCASTLE-cohort
(Blinding bias) The likelihood that some eligible subjects might have the outcome at the time of enrolment is assessed and taken into account in the analysis.
Yes Yes □ Can’t say □ No □ Does not apply □ SIGN-cohort
5.4 Design to deal with confounding factors
The main potential confounders are identified and taken into account in the design and analysis.
Yes Yes □ Can’t say □ No □ SIGN-cohort
How well was the study done to minimise the risk of bias or confounding?
No High quality (++) □ Acceptable (+) □ Unacceptable – reject 0
SIGN-cohort
Were important confounders identified/ascertained and considered by authors?
Yes Yes No Can´t tell NA NNR
The distribution of confounders similar in cases and non-cases?
No Yes No Can´t tell NA NNR

JOINT PROGRAMMING INITIATIVE – A HEALTHY DIET FOR A HEALTHY LIFE EUROPEAN NUTRITION PHENOTYPE ASSESSMENT AND DATA SHARING INITIATIVE
40
items Objective? Scoring Reference Rewrite subjective
items
(a) Have the authors identified all important confounding factors (b) Have they taken account of the confounding factors in the design and/or analysis
No Use "Yes", "Can’t tell", or "No" to judge CASP-Zeng X
Could there be confounding factors that haven’t been accounted for?
No Yes Can’t tell No CEBMa-cohort
Does the study adequately control for demographic characteristics, clinical features and other potential confounding variables in the design or analysis?
No N/A NHMRC-cohort
For selection bias (systematic differences between the comparison groups) The method of allocation to treatment groups was unrelated to potential confounding factors (that is, the reason for participant allocation to treatment groups is not expected to affect the outcome[s] under study)
Yes Every item use "Yes", "No", "Unclear", or " Not applicable" to judge
NICE-cohort Zeng X

JOINT PROGRAMMING INITIATIVE – A HEALTHY DIET FOR A HEALTHY LIFE EUROPEAN NUTRITION PHENOTYPE ASSESSMENT AND DATA SHARING INITIATIVE
41
items Objective? Scoring Reference Rewrite subjective
items
For selection bias (systematic differences between the comparison groups) Attempts were made within the design or analysis to balance the comparison groups for potential confounders
Yes Every item use "Yes", "No", "Unclear", or " Not applicable" to judge
NICE-cohort Zeng X
(For confounding bias) Appropriate choice of confounders (i.e. based on importance rather than convenience)?
Yes Yes/No/Unclear with Description SimonThompson
(For confounding bias) Adjustment made for all known important confounders? Known important confounders could be listed here
Yes Yes/No/Unclear with Description SimonThompson
(For confounding bias) Objective method of measuring confounders?
Yes Yes/No/Unclear with Description SimonThompson
(for confounding bias) Appropriate timing for measuring
No Yes/No/Unclear with Description SimonThompson
JOINT PROGRAMMING INITIATIVE – A HEALTHY DIET FOR A HEALTHY LIFE EUROPEAN NUTRITION PHENOTYPE ASSESSMENT AND DATA SHARING INITIATIVE
42
items Objective? Scoring Reference Rewrite subjective
items
confounders?
(for attrition bias) Are the results unlikely to be affected by exclusions from analysis (e.g. because of extreme values or missing values of confounders)?
No Yes/No/Unclear with Description SimonThompson
6 Design to guarantee high comparability among groups
Comparability of cohorts on the basis of the design or analysis
Yes
a) Study controls for _____________ (select the most important factor) b) Study controls for any additional factor (This criteria could be modified to indicate specific control for a second important factor.)
NEWCASTLE-cohort
The two groups being studied are selected from source populations that are comparable in all respects other than the factor under investigation.
Yes Yes □ Can’t say □ No □ Does not apply □ SIGN-cohort
JOINT PROGRAMMING INITIATIVE – A HEALTHY DIET FOR A HEALTHY LIFE EUROPEAN NUTRITION PHENOTYPE ASSESSMENT AND DATA SHARING INITIATIVE
43
items Objective? Scoring Reference Rewrite subjective
items
Participants and non-participants comparable with target (e.g. Nordic) population?
No Yes No Can´t tell NA NNR
The groups were comparable for treatment completion (that is, there were no important or systematic differences between groups in terms of those who did not complete treatment)
No Every item use "Yes", "No", "Unclear", or " Not applicable" to judge
NICE-cohort Zeng X
For selection bias (systematic differences between the comparison groups) The groups were comparable at baseline, including all major confounding and prognostic factors
No Every item use "Yes", "No", "Unclear", or " Not applicable" to judge
NICE-cohort Zeng X
7 Design of follow-up duration
Was follow-up long enough for outcomes to occur
Yes a) Yes (select an adequate follow up period for outcome of interest) b) no
NEWCASTLE-cohort
Indicate whether or not subjects were consecutive if
Yes Use "Yes", "Can’t tell", or "No" to judge CASP-Zeng X
JOINT PROGRAMMING INITIATIVE – A HEALTHY DIET FOR A HEALTHY LIFE EUROPEAN NUTRITION PHENOTYPE ASSESSMENT AND DATA SHARING INITIATIVE
44
items Objective? Scoring Reference Rewrite subjective
items
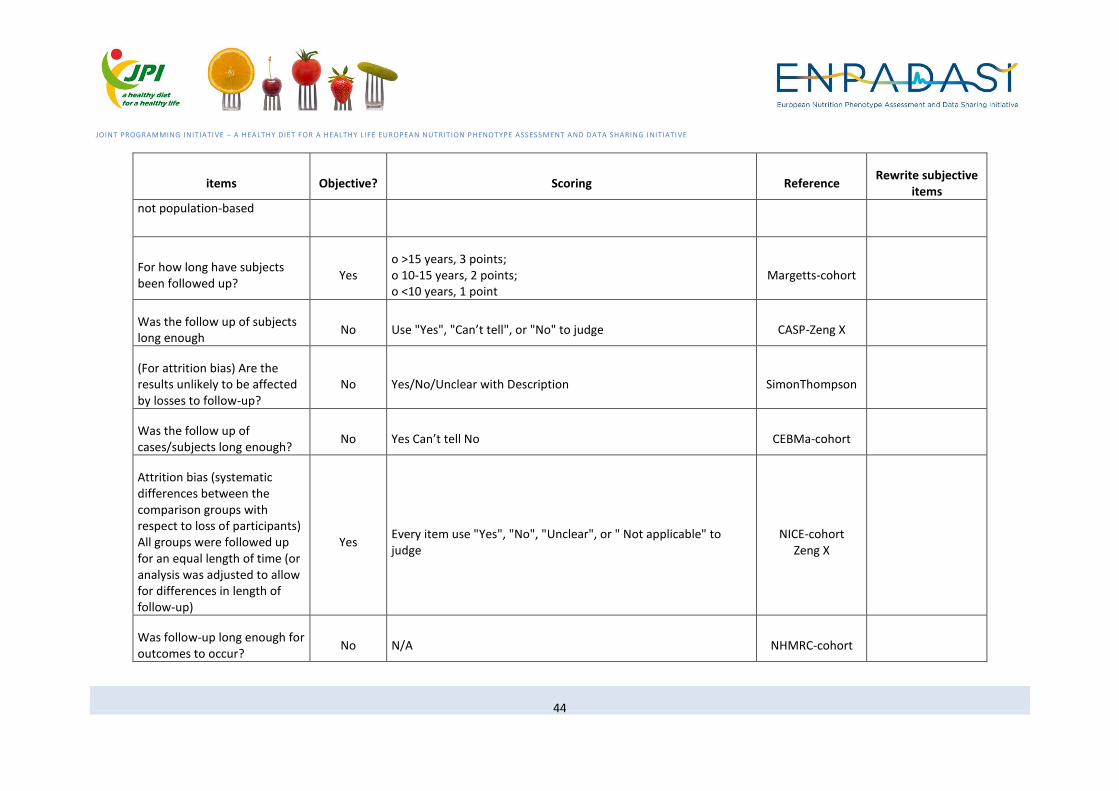
not population-based
For how long have subjects been followed up?
Yes o >15 years, 3 points; o 10-15 years, 2 points; o <10 years, 1 point
Margetts-cohort
Was the follow up of subjects long enough
No Use "Yes", "Can’t tell", or "No" to judge CASP-Zeng X
(For attrition bias) Are the results unlikely to be affected by losses to follow-up?
No Yes/No/Unclear with Description SimonThompson
Was the follow up of cases/subjects long enough?
No Yes Can’t tell No CEBMa-cohort
Attrition bias (systematic differences between the comparison groups with respect to loss of participants) All groups were followed up for an equal length of time (or analysis was adjusted to allow for differences in length of follow-up)
Yes Every item use "Yes", "No", "Unclear", or " Not applicable" to judge
NICE-cohort Zeng X
Was follow-up long enough for outcomes to occur?
No N/A NHMRC-cohort
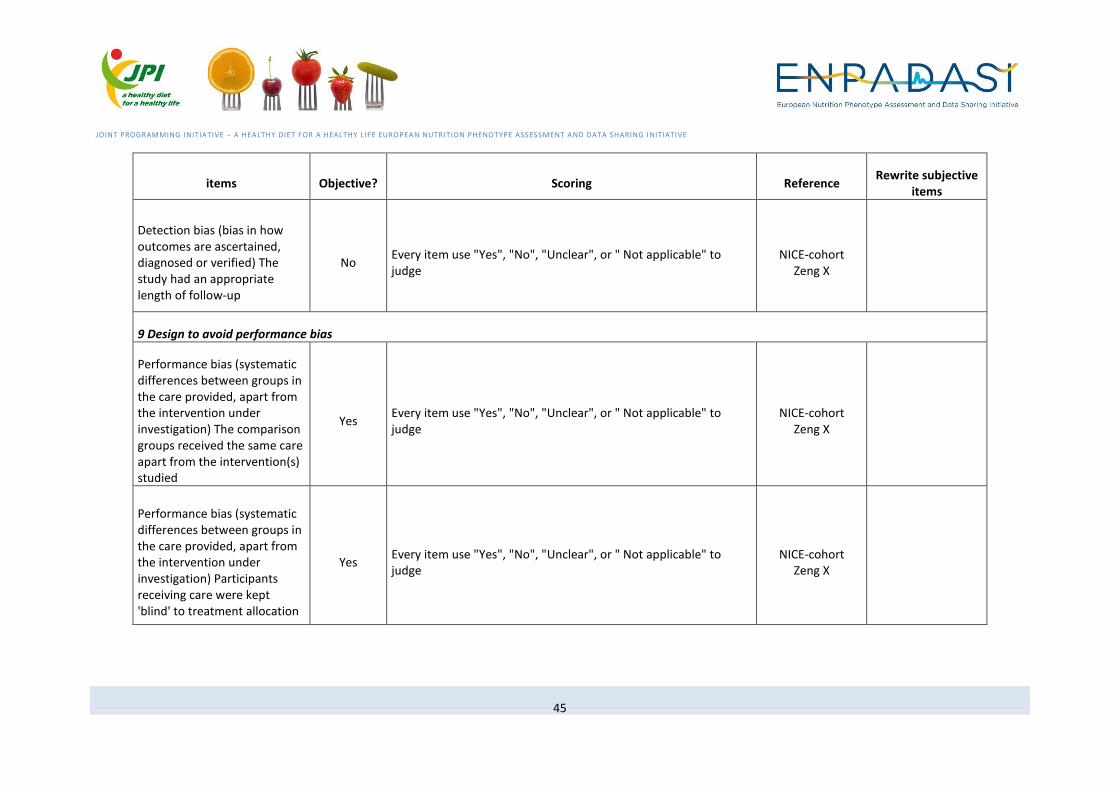
JOINT PROGRAMMING INITIATIVE – A HEALTHY DIET FOR A HEALTHY LIFE EUROPEAN NUTRITION PHENOTYPE ASSESSMENT AND DATA SHARING INITIATIVE
45
items Objective? Scoring Reference Rewrite subjective
items
Detection bias (bias in how outcomes are ascertained, diagnosed or verified) The study had an appropriate length of follow-up
No Every item use "Yes", "No", "Unclear", or " Not applicable" to judge
NICE-cohort Zeng X
9 Design to avoid performance bias
Performance bias (systematic differences between groups in the care provided, apart from the intervention under investigation) The comparison groups received the same care apart from the intervention(s) studied
Yes Every item use "Yes", "No", "Unclear", or " Not applicable" to judge
NICE-cohort Zeng X
Performance bias (systematic differences between groups in the care provided, apart from the intervention under investigation) Participants receiving care were kept 'blind' to treatment allocation
Yes Every item use "Yes", "No", "Unclear", or " Not applicable" to judge
NICE-cohort Zeng X
JOINT PROGRAMMING INITIATIVE – A HEALTHY DIET FOR A HEALTHY LIFE EUROPEAN NUTRITION PHENOTYPE ASSESSMENT AND DATA SHARING INITIATIVE
46
items Objective? Scoring Reference Rewrite subjective
items
Performance bias (systematic differences between groups in the care provided, apart from the intervention under investigation) Individuals administering care were kept 'blind' to treatment allocation
Yes Every item use "Yes", "No", "Unclear", or " Not applicable" to judge
NICE-cohort Zeng X
10 Design to avoid external bias
(Population bias) Study subjects in idealized study drawn from population identical to target population, with respect to age, gender, health status etc.?
Yes Yes/No/Unclear with Description SimonThompson
(External exposure bias) Exposure in idealized study identical to target exposure?
Yes Yes/No/Unclear with Description SimonThompson
(Timescale bias) Follow-up time in idealized study identical to target follow-up time?
Yes Yes/No/Unclear with Description SimonThompson

JOINT PROGRAMMING INITIATIVE – A HEALTHY DIET FOR A HEALTHY LIFE EUROPEAN NUTRITION PHENOTYPE ASSESSMENT AND DATA SHARING INITIATIVE
47
STUDY DESIGN: CROSS-SECTIONAL STUDIES
Items Objective? Scoring Reference Additional notes Rewrite
subjective items
1. Appropriate design (formulation) of research question
Research question clearly formulated?
No Yes No Can´t tell NA NNR
2. Design to guarantee internal validity
2.1 Design of sampling
Source population well defined and recruitment done in an acceptable way?
No Yes No Can´t tell NA NNR
Criteria for inclusion/exclusion clearly formulated and acceptable?
partial Yes No Can´t tell NA NNR
Were the participants with primary outcome adequately identified/diagnosed?
No Yes No Can´t tell NA NNR
List inclusion and exclusion criteria for exposed and unexposed subjects (cases and controls) or refer to previous publications
Yes Use "Yes", "No", or "Unclear" to judge ARHQ - Zeng X
JOINT PROGRAMMING INITIATIVE – A HEALTHY DIET FOR A HEALTHY LIFE EUROPEAN NUTRITION PHENOTYPE ASSESSMENT AND DATA SHARING INITIATIVE
48
Items Objective? Scoring Reference Additional notes Rewrite
subjective items
Was an acceptable case definition used in the study?
Yes
· Yes (LOW RISK): An acceptable case definition was used. · No (HIGH RISK): An acceptable case definition was NOT used.
Hoy D
· For a study on low back pain, the following case definition was used: “Low back pain is defined as activity-limiting pain lasting more than one day in the area on the posterior aspect of the body from the bottom of the 12th rib to the lower gluteal folds.” The answer is: Yes (LOW RISK). · For a study on back pain, there was no description of the specific anatomical location „back‟ referred to. The answer is: No (HIGH RISK). · For a study on osteoarthritis, the following case definition was used: “Symptomatic osteoarthritis of the hip or knee, radiologically confirmed as Kellgren-Lawrence grade 2-4”. The answer is: LOW RISK.

JOINT PROGRAMMING INITIATIVE – A HEALTHY DIET FOR A HEALTHY LIFE EUROPEAN NUTRITION PHENOTYPE ASSESSMENT AND DATA SHARING INITIATIVE
49
Items Objective? Scoring Reference Additional notes Rewrite
subjective items
Is the exposed group representative of the population of exposed individuals in the community?
confused
Good quality (example): A random sample of berry farm households was surveyed, regarding use of malathion on crops. Poor quality (example): A convenience sample of exposed subjects was obtained through a marketing survey of weed ‘n feed.
National Collaborating Centre
for Environmental Health
JOINT PROGRAMMING INITIATIVE – A HEALTHY DIET FOR A HEALTHY LIFE EUROPEAN NUTRITION PHENOTYPE ASSESSMENT AND DATA SHARING INITIATIVE
50
Items Objective? Scoring Reference Additional notes Rewrite
subjective items
Was the study target population a close representation of the national population in relation to relevant variables, e.g. age, sex, occupation?
Yes
· Yes (LOW RISK): The study's target population was a close representation of the national population. · No (HIGH RISK): The study's target population was clearly NOT representative of the national population.
Hoy D
The target population refers to the group of people or entities to which the results of the study will be generalised. Examples: · The study was a national health survey of people 15 years and over and the sample was drawn from a list that included all individuals in the population aged 15 years and over. The answer is: Yes (LOW RISK). · The study was conducted in one province only, and it is not clear if this was representative of the national population. The answer is: No (HIGH RISK). · The study was undertaken in one village only and it is clear this was not representative of the national population. The answer is: No (HIGH RISK).
JOINT PROGRAMMING INITIATIVE – A HEALTHY DIET FOR A HEALTHY LIFE EUROPEAN NUTRITION PHENOTYPE ASSESSMENT AND DATA SHARING INITIATIVE
51
Items Objective? Scoring Reference Additional notes Rewrite
subjective items
Was the sampling frame a true or close representation of the target population?
Yes
· Yes (LOW RISK): The sampling frame was a true or close representation of the target population. · No (HIGH RISK): The sampling frame was NOT a true or close representation of the target population.
Hoy D
The sampling frame is a list of the sampling units in the target population and the study sample is drawn from this list. Examples: · The sampling frame was a list of almost every individual within the target population. The answer is: Yes (LOW RISK). · The cluster sampling method was used and the sample of clusters/villages was drawn from a list of all villages in the target population. The answer is: Yes (LOW RISK). · The sampling frame was a list of just one particular ethnic group within the overall target population, which comprised many groups. The answer is: No (HIGH RISK).
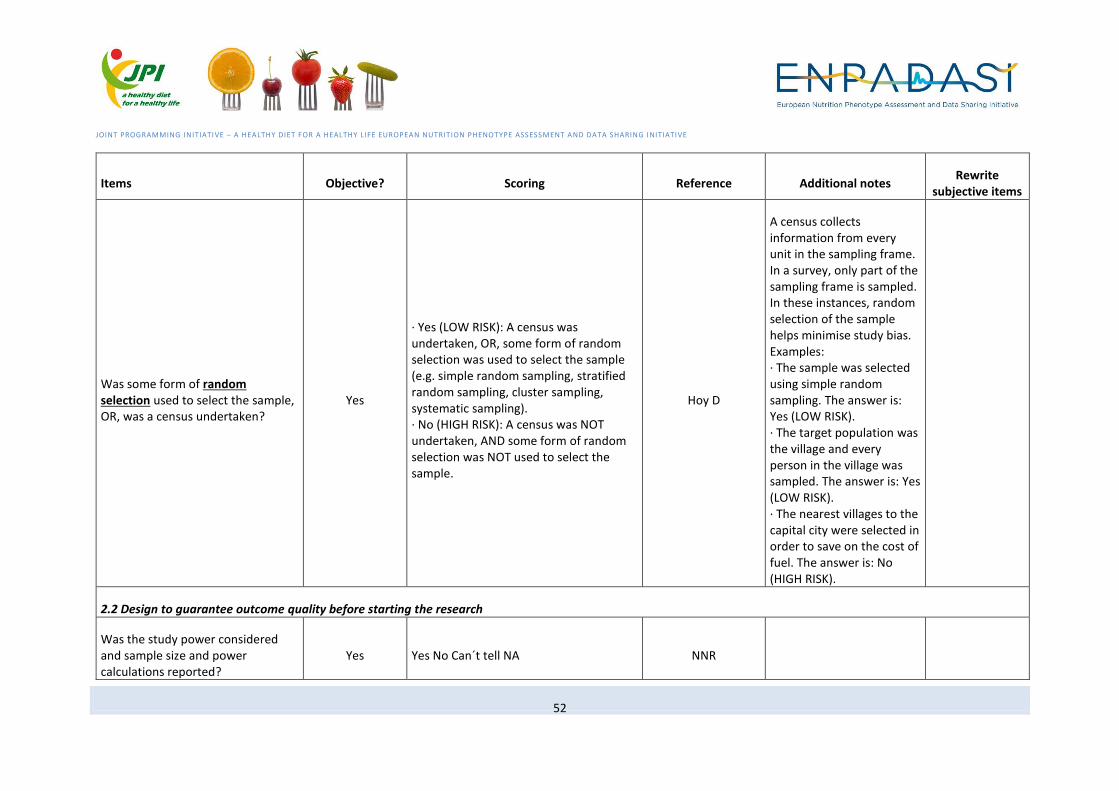
JOINT PROGRAMMING INITIATIVE – A HEALTHY DIET FOR A HEALTHY LIFE EUROPEAN NUTRITION PHENOTYPE ASSESSMENT AND DATA SHARING INITIATIVE
52
Items Objective? Scoring Reference Additional notes Rewrite
subjective items
Was some form of random selection used to select the sample, OR, was a census undertaken?
Yes
· Yes (LOW RISK): A census was undertaken, OR, some form of random selection was used to select the sample (e.g. simple random sampling, stratified random sampling, cluster sampling, systematic sampling). · No (HIGH RISK): A census was NOT undertaken, AND some form of random selection was NOT used to select the sample.
Hoy D
A census collects information from every unit in the sampling frame. In a survey, only part of the sampling frame is sampled. In these instances, random selection of the sample helps minimise study bias. Examples: · The sample was selected using simple random sampling. The answer is: Yes (LOW RISK). · The target population was the village and every person in the village was sampled. The answer is: Yes (LOW RISK). · The nearest villages to the capital city were selected in order to save on the cost of fuel. The answer is: No (HIGH RISK).
2.2 Design to guarantee outcome quality before starting the research
Was the study power considered and sample size and power calculations reported?
Yes Yes No Can´t tell NA NNR
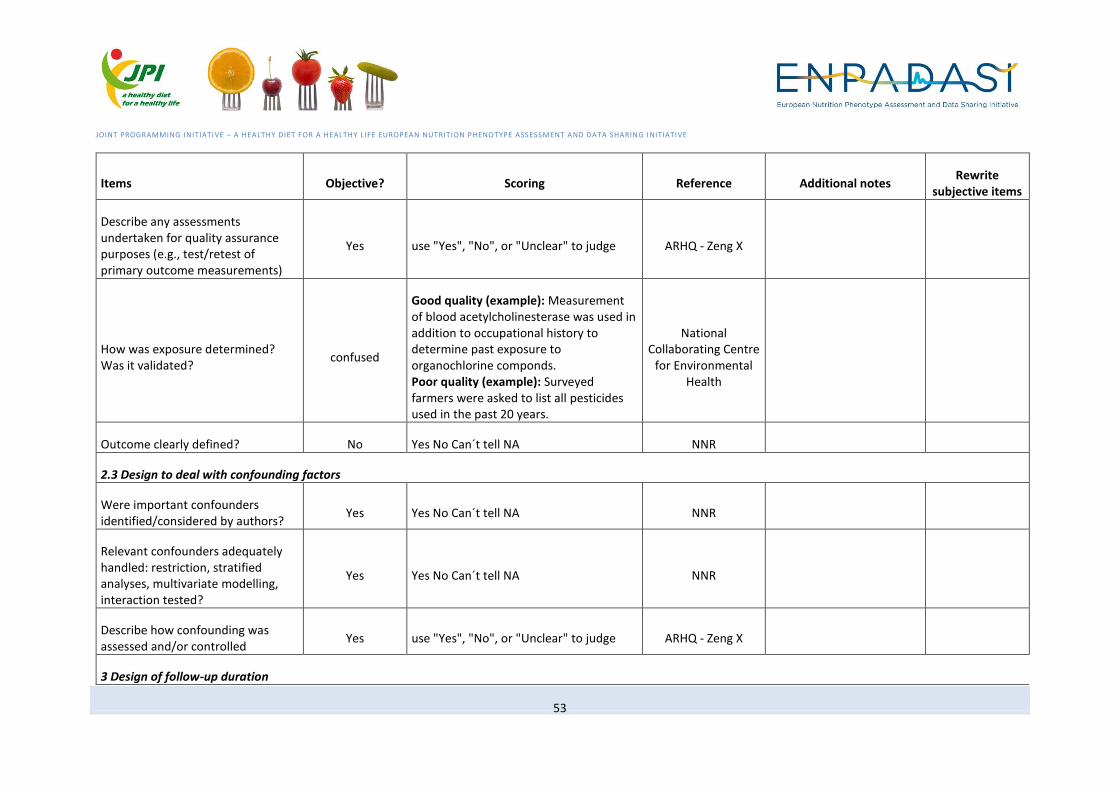
JOINT PROGRAMMING INITIATIVE – A HEALTHY DIET FOR A HEALTHY LIFE EUROPEAN NUTRITION PHENOTYPE ASSESSMENT AND DATA SHARING INITIATIVE
53
Items Objective? Scoring Reference Additional notes Rewrite
subjective items
Describe any assessments undertaken for quality assurance purposes (e.g., test/retest of primary outcome measurements)
Yes use "Yes", "No", or "Unclear" to judge ARHQ - Zeng X
How was exposure determined? Was it validated?
confused
Good quality (example): Measurement of blood acetylcholinesterase was used in addition to occupational history to determine past exposure to organochlorine componds. Poor quality (example): Surveyed farmers were asked to list all pesticides used in the past 20 years.
National Collaborating Centre
for Environmental Health
Outcome clearly defined? No Yes No Can´t tell NA NNR
2.3 Design to deal with confounding factors
Were important confounders identified/considered by authors?
Yes Yes No Can´t tell NA NNR
Relevant confounders adequately handled: restriction, stratified analyses, multivariate modelling, interaction tested?
Yes Yes No Can´t tell NA NNR
Describe how confounding was assessed and/or controlled
Yes use "Yes", "No", or "Unclear" to judge ARHQ - Zeng X
3 Design of follow-up duration
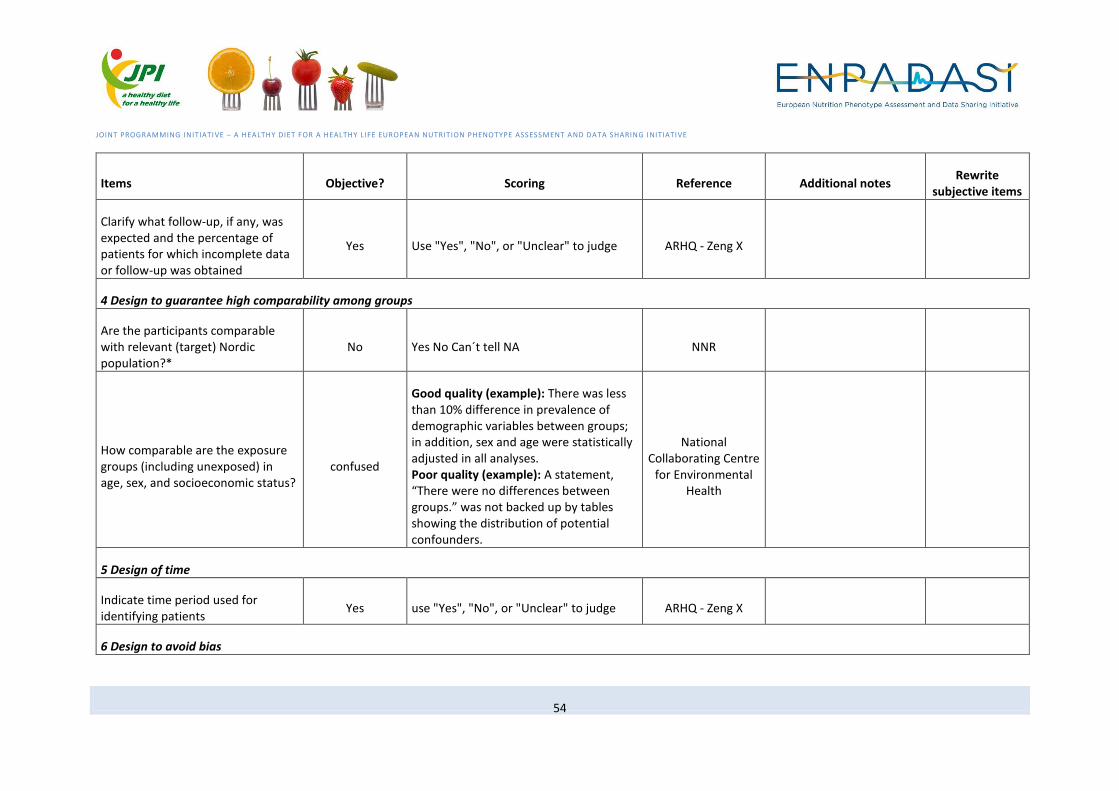
JOINT PROGRAMMING INITIATIVE – A HEALTHY DIET FOR A HEALTHY LIFE EUROPEAN NUTRITION PHENOTYPE ASSESSMENT AND DATA SHARING INITIATIVE
54
Items Objective? Scoring Reference Additional notes Rewrite
subjective items
Clarify what follow-up, if any, was expected and the percentage of patients for which incomplete data or follow-up was obtained
Yes Use "Yes", "No", or "Unclear" to judge ARHQ - Zeng X
4 Design to guarantee high comparability among groups
Are the participants comparable with relevant (target) Nordic population?*
No Yes No Can´t tell NA NNR
How comparable are the exposure groups (including unexposed) in age, sex, and socioeconomic status?
confused
Good quality (example): There was less than 10% difference in prevalence of demographic variables between groups; in addition, sex and age were statistically adjusted in all analyses. Poor quality (example): A statement, “There were no differences between groups.” was not backed up by tables showing the distribution of potential confounders.
National Collaborating Centre
for Environmental Health
5 Design of time
Indicate time period used for identifying patients
Yes use "Yes", "No", or "Unclear" to judge ARHQ - Zeng X
6 Design to avoid bias
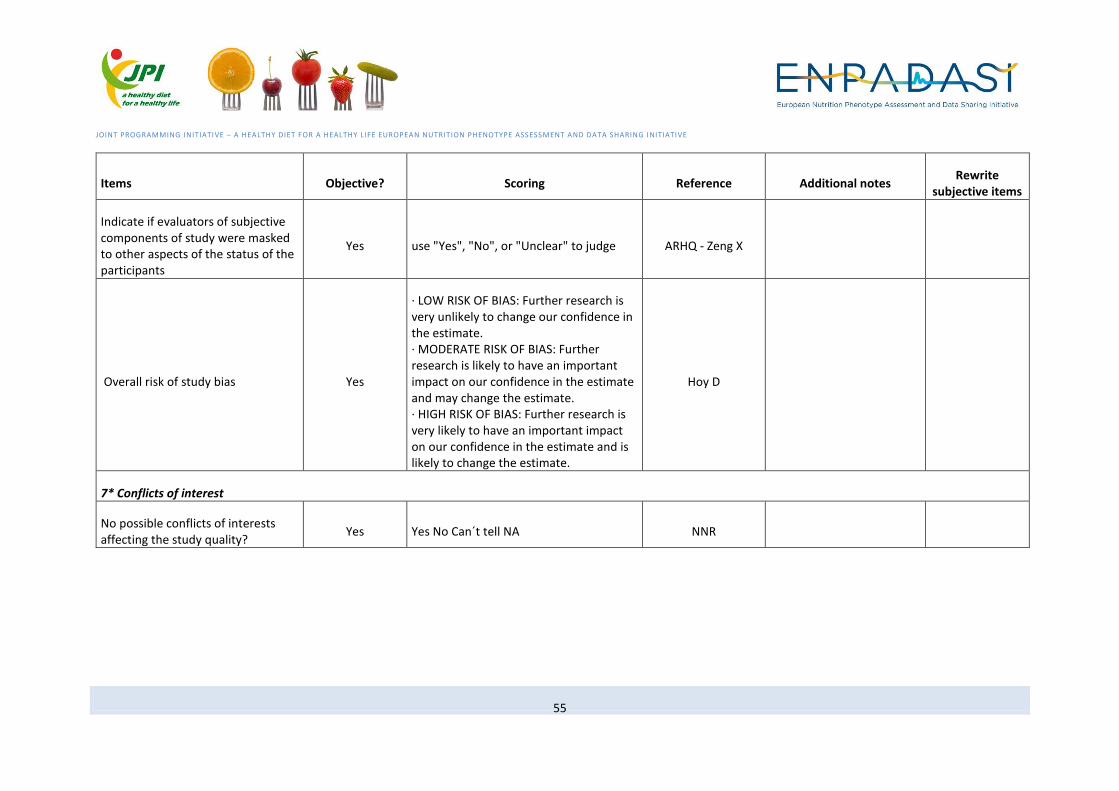
JOINT PROGRAMMING INITIATIVE – A HEALTHY DIET FOR A HEALTHY LIFE EUROPEAN NUTRITION PHENOTYPE ASSESSMENT AND DATA SHARING INITIATIVE
55
Items Objective? Scoring Reference Additional notes Rewrite
subjective items
Indicate if evaluators of subjective components of study were masked to other aspects of the status of the participants
Yes use "Yes", "No", or "Unclear" to judge ARHQ - Zeng X
Overall risk of study bias Yes
· LOW RISK OF BIAS: Further research is very unlikely to change our confidence in the estimate. · MODERATE RISK OF BIAS: Further research is likely to have an important impact on our confidence in the estimate and may change the estimate. · HIGH RISK OF BIAS: Further research is very likely to have an important impact on our confidence in the estimate and is likely to change the estimate.
Hoy D
7* Conflicts of interest
No possible conflicts of interests affecting the study quality?
Yes Yes No Can´t tell NA NNR

JOINT PROGRAMMING INITIATIVE – A HEALTHY DIET FOR A HEALTHY LIFE EUROPEAN NUTRITION PHENOTYPE ASSESSMENT AND DATA SHARING INITIATIVE
56
STUDY DESIGN: CASE CONTROL
Items Objective? Scoring Reference Rewrite subjective items
1. Definition of case-control study
Is the paper really a case-control study?
Yes If in doubt, check the study design algorithm available from SIGN and make sure you have the correct checklist.
SIGN-case control
2. Appropriate design (formulation) of research question
Did the study address a clearly focused issue
No Use "Yes", "Can’t tell", or "No" to judge CASP-Zeng X
The study addresses an appropriate and clearly focused question
No
Choose "Well covered", "Adequately addressed", "Poorly addressed", "Not addressed", "Not reported", "Not applicable" to judge
NICE-Zeng X
Did the study address a clearly focused question / issue?
No Yes Can’t tell No CEBMa-case control
Is the paper relevant to key question?
Yes
Analyse using PICO (Patient or Population Intervention Comparison Outcome). IF NO REJECT (give reason below). IF YES complete the checklist.
SIGN-case control
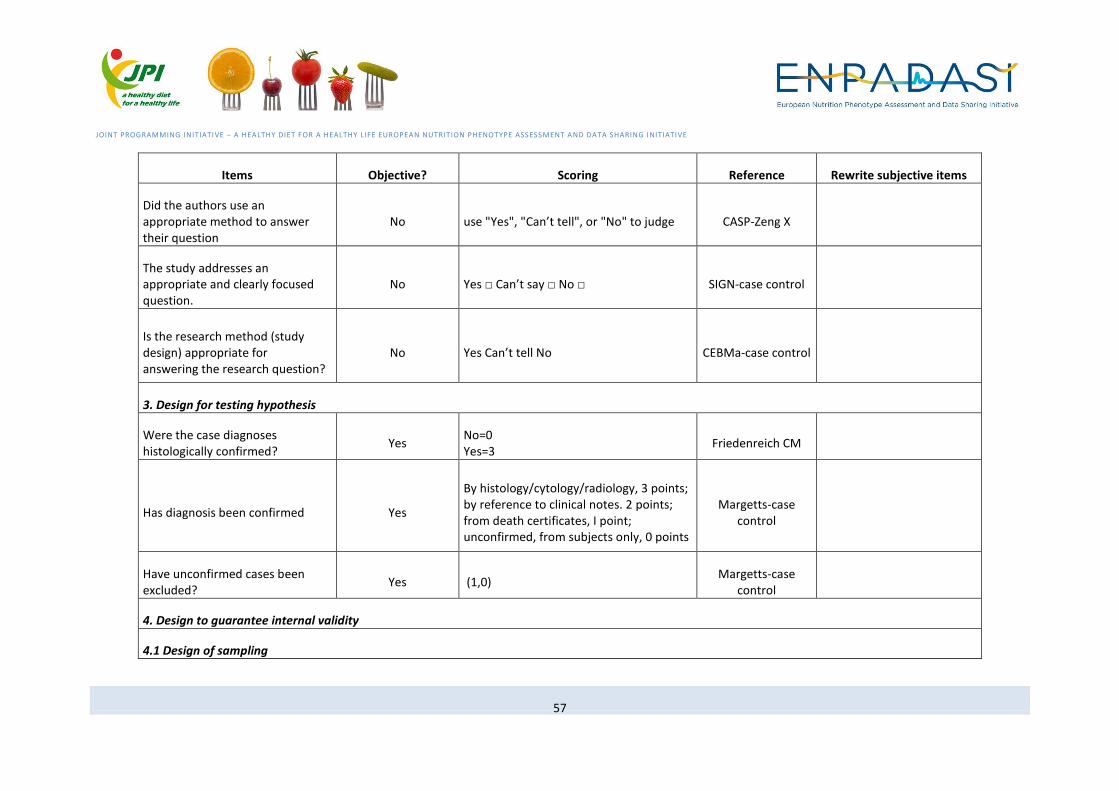
JOINT PROGRAMMING INITIATIVE – A HEALTHY DIET FOR A HEALTHY LIFE EUROPEAN NUTRITION PHENOTYPE ASSESSMENT AND DATA SHARING INITIATIVE
57
Items Objective? Scoring Reference Rewrite subjective items
Did the authors use an appropriate method to answer their question
No use "Yes", "Can’t tell", or "No" to judge CASP-Zeng X
The study addresses an appropriate and clearly focused question.
No Yes □ Can’t say □ No □ SIGN-case control
Is the research method (study design) appropriate for answering the research question?
No Yes Can’t tell No CEBMa-case control
3. Design for testing hypothesis
Were the case diagnoses histologically confirmed?
Yes No=0 Yes=3
Friedenreich CM
Has diagnosis been confirmed Yes
By histology/cytology/radiology, 3 points; by reference to clinical notes. 2 points; from death certificates, I point; unconfirmed, from subjects only, 0 points
Margetts-case control
Have unconfirmed cases been excluded?
Yes (1,0) Margetts-case
control
4. Design to guarantee internal validity
4.1 Design of sampling

JOINT PROGRAMMING INITIATIVE – A HEALTHY DIET FOR A HEALTHY LIFE EUROPEAN NUTRITION PHENOTYPE ASSESSMENT AND DATA SHARING INITIATIVE
58
Items Objective? Scoring Reference Rewrite subjective items
Is the case definition adequate? Yes
a) yes, with independent validation b) yes, eg record linkage or based on self reports c) no description
NEWCASTLE-case control
Representativeness of the cases Yes
a) consecutive or obviously representative series of cases b) potential for selection biases or not stated
NEWCASTLE-case control
Are the patients in the study similar to mine?
No N/A Cameron
Selection of Controls Yes a) community controls b) hospital controls c) no description
NEWCASTLE-case control
Definition of Controls Yes a) no history of disease (endpoint) b) no description of source
NEWCASTLE-case control
Cases are clearly defined and differentiated from controls.
No Yes □ Can’t say □ No □ SIGN-case control
It is clearly established that controls are non-cases.
Yes Yes □ Can’t say □ No □ SIGN-case control
Was the study population and the observation period (i.e. study base) well defined?
No No=0 Yes=1
Friedenreich CM
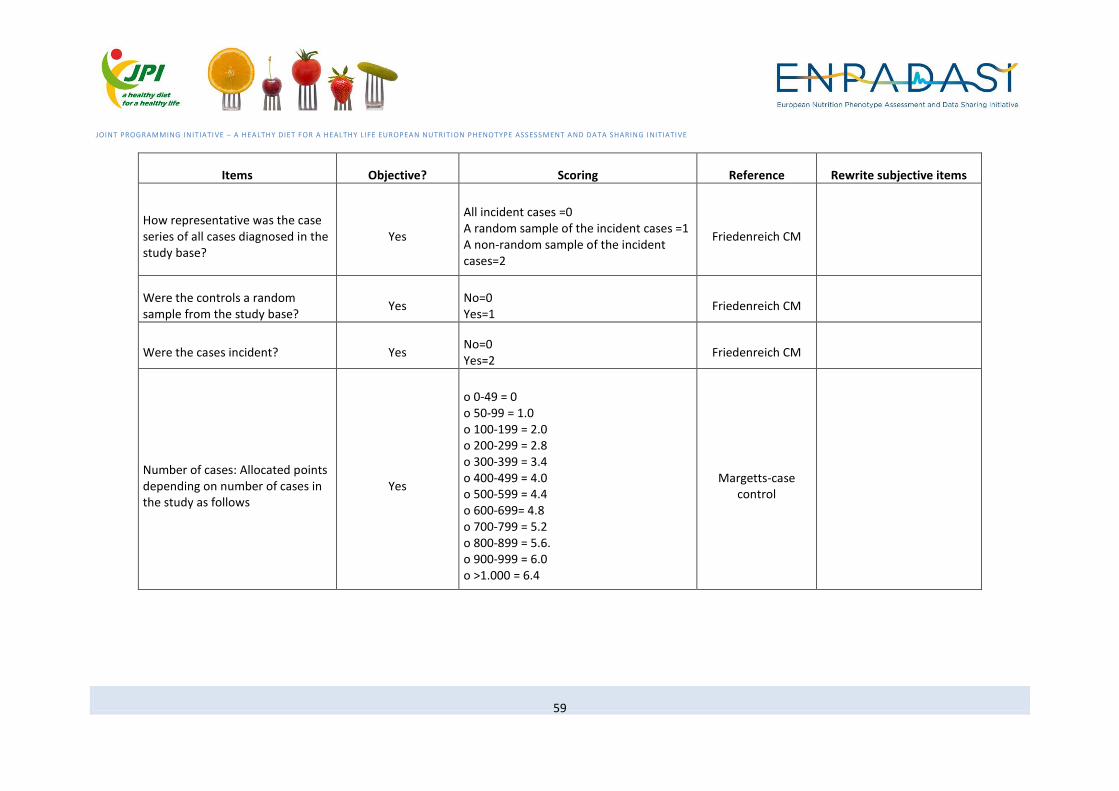
JOINT PROGRAMMING INITIATIVE – A HEALTHY DIET FOR A HEALTHY LIFE EUROPEAN NUTRITION PHENOTYPE ASSESSMENT AND DATA SHARING INITIATIVE
59
Items Objective? Scoring Reference Rewrite subjective items
How representative was the case series of all cases diagnosed in the study base?
Yes
All incident cases =0 A random sample of the incident cases =1 A non-random sample of the incident cases=2
Friedenreich CM
Were the controls a random sample from the study base?
Yes No=0 Yes=1
Friedenreich CM
Were the cases incident? Yes No=0 Yes=2
Friedenreich CM
Number of cases: Allocated points depending on number of cases in the study as follows
Yes
o 0-49 = 0 o 50-99 = 1.0 o 100-199 = 2.0 o 200-299 = 2.8 o 300-399 = 3.4 o 400-499 = 4.0 o 500-599 = 4.4 o 600-699= 4.8 o 700-799 = 5.2 o 800-899 = 5.6. o 900-999 = 6.0 o >1.000 = 6.4
Margetts-case control

JOINT PROGRAMMING INITIATIVE – A HEALTHY DIET FOR A HEALTHY LIFE EUROPEAN NUTRITION PHENOTYPE ASSESSMENT AND DATA SHARING INITIATIVE
60
Items Objective? Scoring Reference Rewrite subjective items
Source of controls Yes
o Community, if random sample= 2 points; o If uncertain= 1 point. o Hospital, if appropriate. 1 point: o If uncertain= 0.5 points. o Hospital and community, if analyzed separately (add points above); o Family controls= 0.5 points
Margetts-case control
Were the cases recruited in an acceptable way
No Use "Yes", "Can’t tell", or "No" to judge CASP-Zeng X
Were the controls selected in an acceptable way
No Use "Yes", "Can’t tell", or "No" to judge CASP-Zeng X
Cases are clearly defined and differentiated from controls
Yes
choose "Well covered", "Adequately addressed", "Poorly addressed", "Not addressed", "Not reported", "Not applicable" to judge
NICE-Zeng X
It is clearly established that controls are not cases
Yes
choose "Well covered", "Adequately addressed", "Poorly addressed", "Not addressed", "Not reported", "Not applicable" to judge
NICE-Zeng X
Was the selection of cases and controls based on external, objective and validated criteria?
No Yes Can’t tell No CEBMa-case control
How were cases defined and No N/A NHMRC - case-
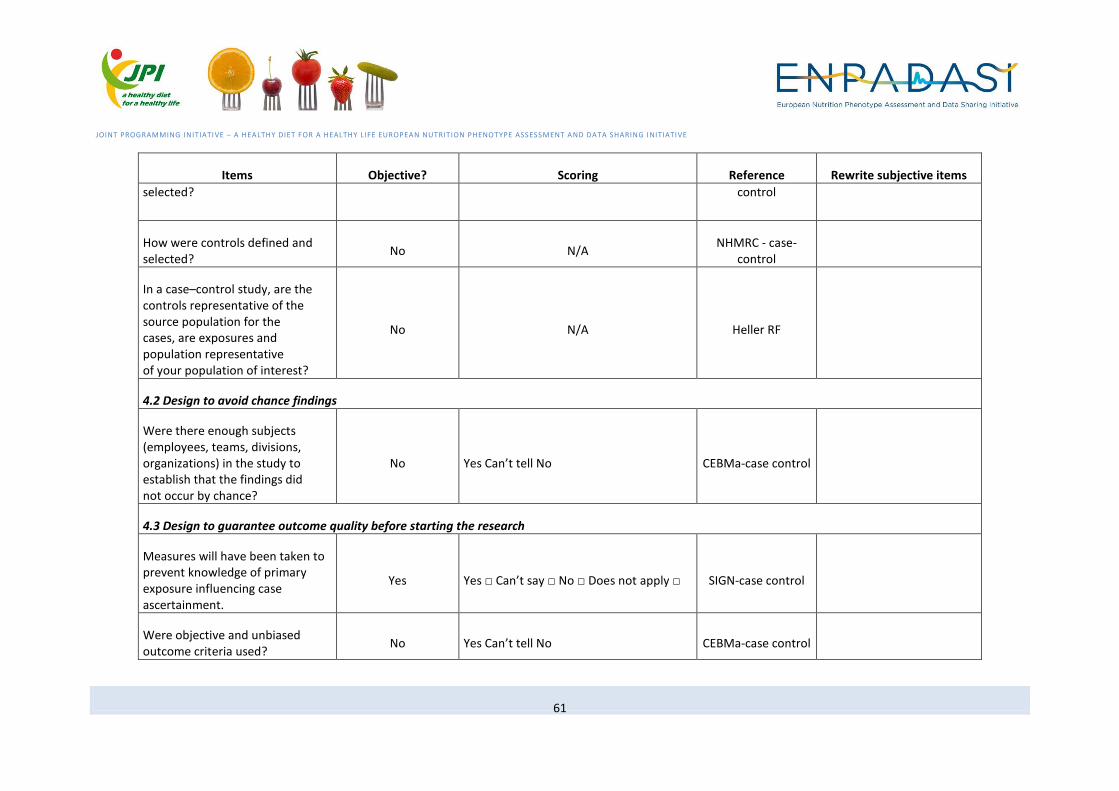
JOINT PROGRAMMING INITIATIVE – A HEALTHY DIET FOR A HEALTHY LIFE EUROPEAN NUTRITION PHENOTYPE ASSESSMENT AND DATA SHARING INITIATIVE
61
Items Objective? Scoring Reference Rewrite subjective items
selected? control
How were controls defined and selected?
No N/A NHMRC - case-
control
In a case–control study, are the controls representative of the source population for the cases, are exposures and population representative of your population of interest?
No N/A Heller RF
4.2 Design to avoid chance findings
Were there enough subjects (employees, teams, divisions, organizations) in the study to establish that the findings did not occur by chance?
No Yes Can’t tell No CEBMa-case control
4.3 Design to guarantee outcome quality before starting the research
Measures will have been taken to prevent knowledge of primary exposure influencing case ascertainment.
Yes Yes □ Can’t say □ No □ Does not apply □ SIGN-case control
Were objective and unbiased outcome criteria used?
No Yes Can’t tell No CEBMa-case control
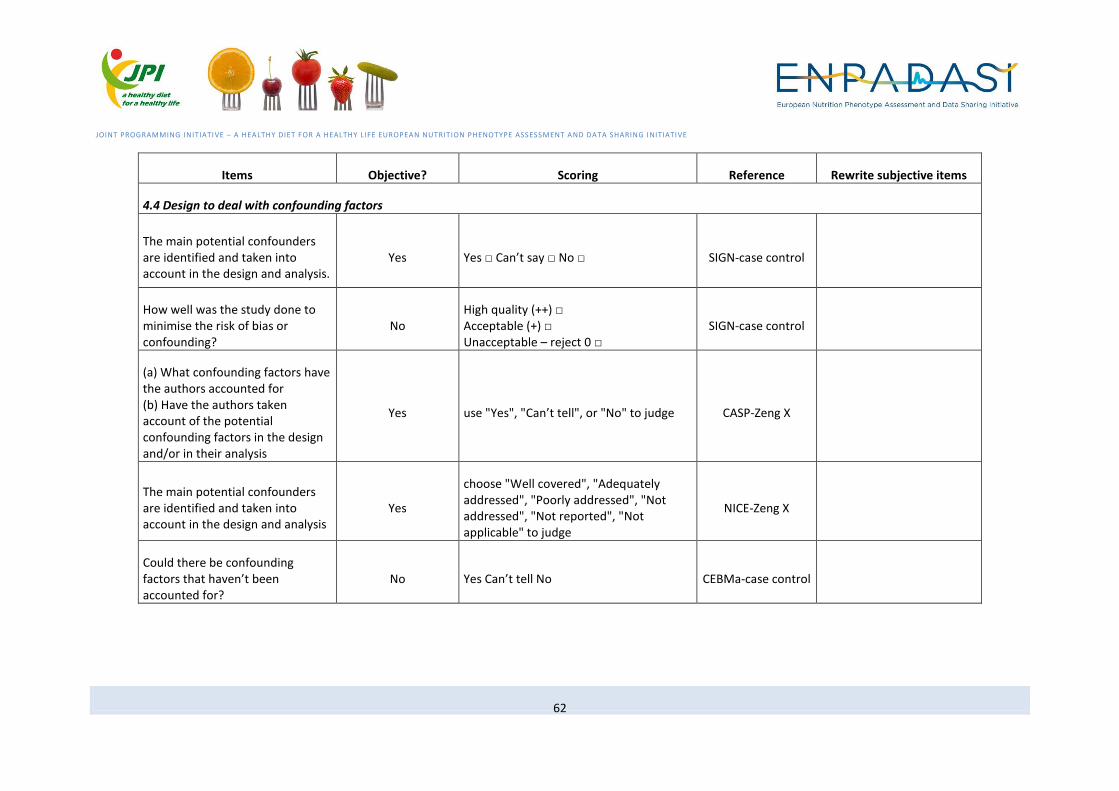
JOINT PROGRAMMING INITIATIVE – A HEALTHY DIET FOR A HEALTHY LIFE EUROPEAN NUTRITION PHENOTYPE ASSESSMENT AND DATA SHARING INITIATIVE
62
Items Objective? Scoring Reference Rewrite subjective items
4.4 Design to deal with confounding factors
The main potential confounders are identified and taken into account in the design and analysis.
Yes Yes □ Can’t say □ No □ SIGN-case control
How well was the study done to minimise the risk of bias or confounding?
No High quality (++) □ Acceptable (+) □ Unacceptable – reject 0 □
SIGN-case control
(a) What confounding factors have the authors accounted for (b) Have the authors taken account of the potential confounding factors in the design and/or in their analysis
Yes use "Yes", "Can’t tell", or "No" to judge CASP-Zeng X
The main potential confounders are identified and taken into account in the design and analysis
Yes
choose "Well covered", "Adequately addressed", "Poorly addressed", "Not addressed", "Not reported", "Not applicable" to judge
NICE-Zeng X
Could there be confounding factors that haven’t been accounted for?
No Yes Can’t tell No CEBMa-case control
JOINT PROGRAMMING INITIATIVE – A HEALTHY DIET FOR A HEALTHY LIFE EUROPEAN NUTRITION PHENOTYPE ASSESSMENT AND DATA SHARING INITIATIVE
63
Items Objective? Scoring Reference Rewrite subjective items
Does the study adequately control for demographic characteristics and important potential confounders in the design or analysis?
No N/A NHMRC - case-
control
5 Design to guarantee high comparability among groups
Comparability of cases and controls on the basis of the design or analysis
Yes
a) study controls for _______________ (Select the most important factor.) b) study controls for any additional factor (This criteria could be modified to indicate specific control for a second important factor.)
NEWCASTLE-case control
Were the same exclusion criteria applied to cases and controls?
Yes No=0 Yes=1
Friedenreich CM
Were both groups comparable at the start of the study?
No Yes Can’t tell No CEBMa-case control
The cases and controls are taken from comparable populations.
Yes Yes □ Can’t say □ No □ SIGN-case control
The same exclusion criteria are used for both cases and controls.
Yes Yes □ Can’t say □ No □ SIGN-case control
JOINT PROGRAMMING INITIATIVE – A HEALTHY DIET FOR A HEALTHY LIFE EUROPEAN NUTRITION PHENOTYPE ASSESSMENT AND DATA SHARING INITIATIVE
64
Items Objective? Scoring Reference Rewrite subjective items
Comparison is made between participants and non-participants to establish their similarities or differences.
Yes Yes □ Can’t say □ No □ SIGN-case control
The cases and controls are taken from comparable populations
No
choose "Well covered", "Adequately addressed", "Poorly addressed", "Not addressed", "Not reported", "Not applicable" to judge
NICE-Zeng X
The same exclusion criteria are used for both cases and controls
Yes
choose "Well covered", "Adequately addressed", "Poorly addressed", "Not addressed", "Not reported", "Not applicable" to judge
NICE-Zeng X
Participants and non-participants are compared to establish their similarities or differences
Yes
choose "Well covered", "Adequately addressed", "Poorly addressed", "Not addressed", "Not reported", "Not applicable" to judge
NICE-Zeng X
Same method of ascertainment for cases and controls
Yes a) yes b) no
NEWCASTLE-case control
JOINT PROGRAMMING INITIATIVE – A HEALTHY DIET FOR A HEALTHY LIFE EUROPEAN NUTRITION PHENOTYPE ASSESSMENT AND DATA SHARING INITIATIVE
65
STUDY DESIGN: EXPERIMENTAL STUDY
User Interface Programmers Interface
Items Type Value Description
1. For the sequence generation, which statement best describes the
study?
Radio Button
A. There is a random component in the sequence generation process such as:
• Referring to a random number table;
• Using a computer random number generator;
• Coin tossing;
• Shuffling cards or envelopes;
• Throwing dice;
• Drawing of lots;
• Minimization (Minimization may be implemented without a random element, and
this is considered to be equivalent to being random).
0 Low risk of bias
B. There is a non-random component in the sequence generation process: some
systematic, non-random approach, for example:
• Sequence generated by odd or even date of birth;
• Sequence generated by some rule based on date (or day) of admission;
1 High risk of bias
JOINT PROGRAMMING INITIATIVE – A HEALTHY DIET FOR A HEALTHY LIFE EUROPEAN NUTRITION PHENOTYPE ASSESSMENT AND DATA SHARING INITIATIVE
66
• Sequence generated by some rule based on hospital or clinic record number.
Or
There is a non-random approach other than the systematic approaches mentioned
above, which usually involve judgement or some method of non-random
categorization of participants, for example:
• Allocation by judgement of the clinician;
• Allocation by preference of the participant;
• Allocation based on the results of a laboratory test or a series of tests;
• Allocation by availability of the intervention.
C. Insufficient information about the sequence generation process. 2 Unclear risk of bias
2. For the allocation concealment, which statement best describes
the study?
Radio Button
A. Participants and investigators enrolling participants could not foresee assignment
because one of the following, or an equivalent method, was used to conceal
allocation:
• Central allocation (including telephone, web-based and pharmacy-controlled
randomization);
• Sequentially numbered drug containers of identical appearance;
• Sequentially numbered, opaque, sealed envelopes.
0 Low risk of bias
1 High risk of bias

JOINT PROGRAMMING INITIATIVE – A HEALTHY DIET FOR A HEALTHY LIFE EUROPEAN NUTRITION PHENOTYPE ASSESSMENT AND DATA SHARING INITIATIVE
67
B. Participants or investigators enrolling participants could possibly foresee
assignments and thus introduce selection bias, such as allocation based on:
• Using an open random allocation schedule (e.g. a list of random numbers);
• Assignment envelopes were used without appropriate safeguards (e.g. if
envelopes were unsealed or no opaque or not sequentially numbered);
• Alternation or rotation;
• Date of birth;
• Case record number;
• Any other explicitly unconcealed procedure.
C. Insufficient information. This is usually the case if the method of concealment is
not described or not described in sufficient detail to allow a definite judgement –
for example if the use of assignment envelopes is described, but it remains
unclear whether envelopes were sequentially numbered, opaque and sealed.
2 Unclear risk of bias
3. For the blinding of participants and personnel, which statement
best describes the study?
Radio Button
A. Any one of the following:
• No blinding or incomplete blinding, but the review authors judge that the
outcome is not likely to be influenced by lack of blinding;
• Blinding of participants and key study personnel ensured, and unlikely that the
blinding could have been broken.
0 Low risk of bias
1 High risk of bias

JOINT PROGRAMMING INITIATIVE – A HEALTHY DIET FOR A HEALTHY LIFE EUROPEAN NUTRITION PHENOTYPE ASSESSMENT AND DATA SHARING INITIATIVE
68
B. Any one of the following:
• No blinding or incomplete blinding, and the outcome is likely to be influenced by
lack of blinding;
• Blinding of key study participants and personnel attempted, but likely that the
blinding could have been broken, and the outcome is likely to be influenced by
lack of blinding.
C. Any one of the following:
• Insufficient information;
• The study did not address this outcome.
2 Unclear risk of bias
4. For the blinding of outcome assessment, which statement best
describes the study?
Radio Button
A. Any one of the following:
• No blinding of outcome assessment, but the review authors judge that the
outcome measurement is not likely to be influenced by lack of blinding;
• Blinding of outcome assessment ensured, and unlikely that the blinding could
have been broken.
0 Low risk of bias
1 High risk of bias
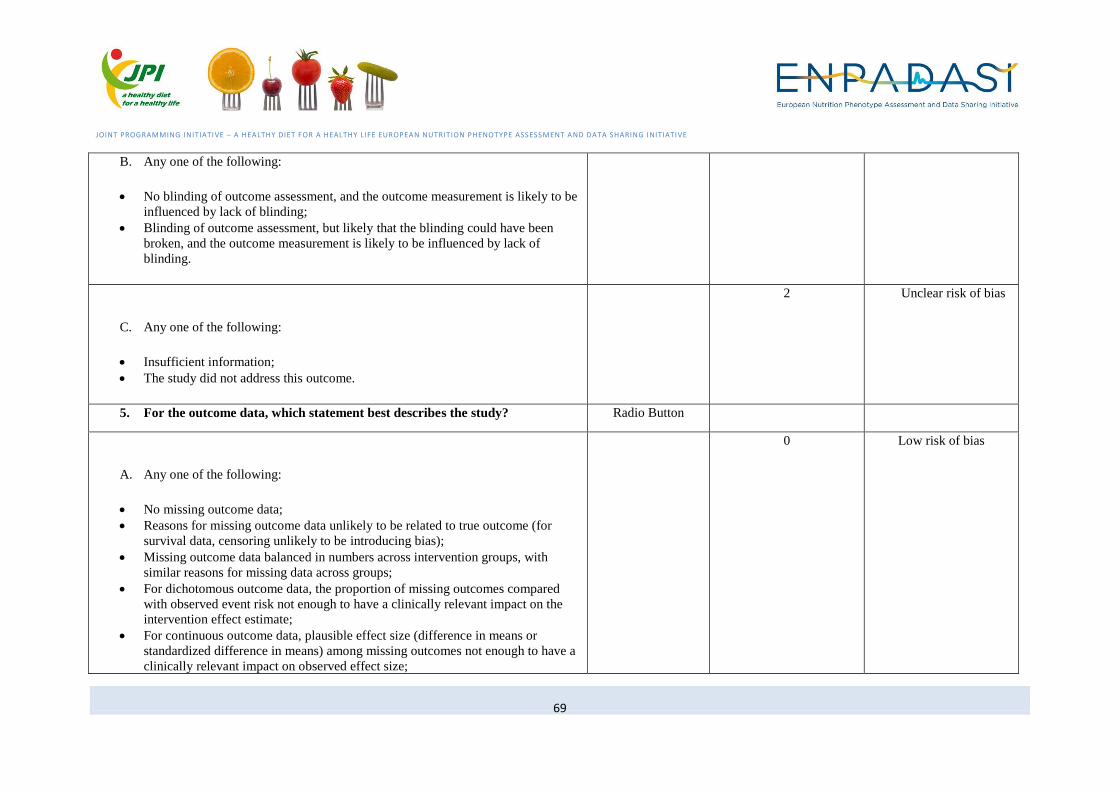
JOINT PROGRAMMING INITIATIVE – A HEALTHY DIET FOR A HEALTHY LIFE EUROPEAN NUTRITION PHENOTYPE ASSESSMENT AND DATA SHARING INITIATIVE
69
B. Any one of the following:
• No blinding of outcome assessment, and the outcome measurement is likely to be
influenced by lack of blinding;
• Blinding of outcome assessment, but likely that the blinding could have been
broken, and the outcome measurement is likely to be influenced by lack of
blinding.
C. Any one of the following:
• Insufficient information;
• The study did not address this outcome.
2 Unclear risk of bias
5. For the outcome data, which statement best describes the study? Radio Button
A. Any one of the following:
• No missing outcome data;
• Reasons for missing outcome data unlikely to be related to true outcome (for
survival data, censoring unlikely to be introducing bias);
• Missing outcome data balanced in numbers across intervention groups, with
similar reasons for missing data across groups;
• For dichotomous outcome data, the proportion of missing outcomes compared
with observed event risk not enough to have a clinically relevant impact on the
intervention effect estimate;
• For continuous outcome data, plausible effect size (difference in means or
standardized difference in means) among missing outcomes not enough to have a
clinically relevant impact on observed effect size;
0 Low risk of bias
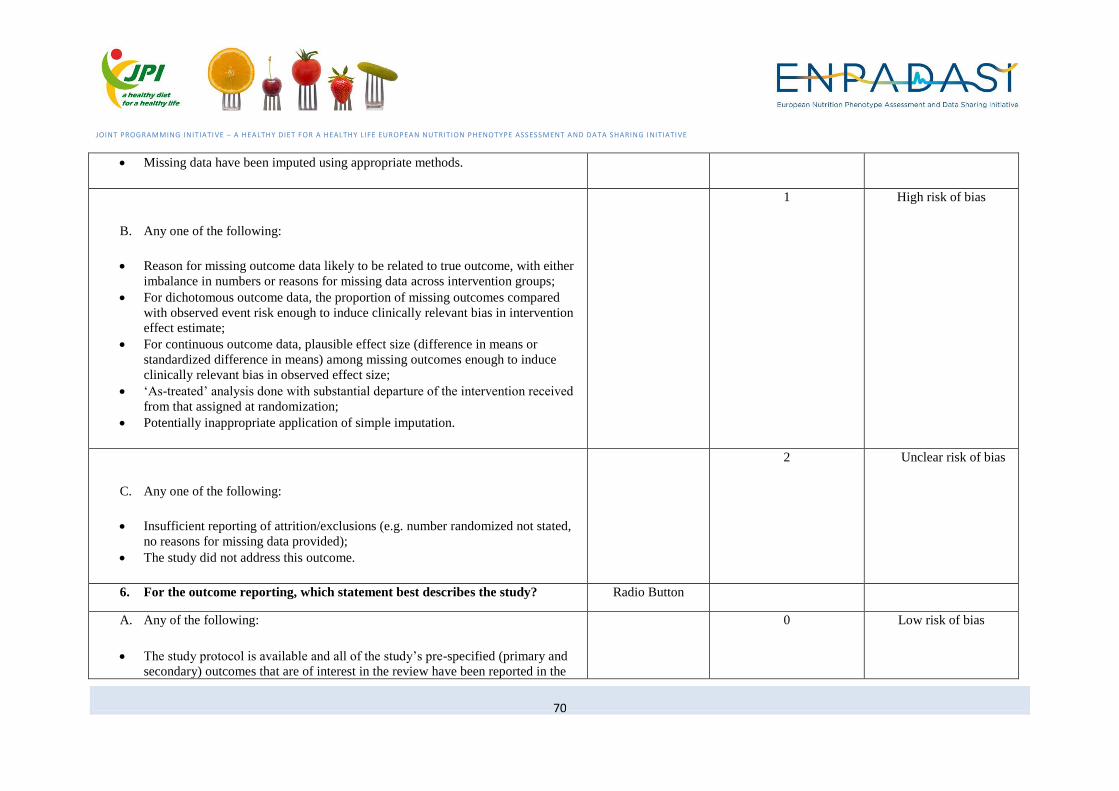
JOINT PROGRAMMING INITIATIVE – A HEALTHY DIET FOR A HEALTHY LIFE EUROPEAN NUTRITION PHENOTYPE ASSESSMENT AND DATA SHARING INITIATIVE
70
• Missing data have been imputed using appropriate methods.
B. Any one of the following:
• Reason for missing outcome data likely to be related to true outcome, with either
imbalance in numbers or reasons for missing data across intervention groups;
• For dichotomous outcome data, the proportion of missing outcomes compared
with observed event risk enough to induce clinically relevant bias in intervention
effect estimate;
• For continuous outcome data, plausible effect size (difference in means or
standardized difference in means) among missing outcomes enough to induce
clinically relevant bias in observed effect size;
• ‘As-treated’ analysis done with substantial departure of the intervention received
from that assigned at randomization;
• Potentially inappropriate application of simple imputation.
1 High risk of bias
C. Any one of the following:
• Insufficient reporting of attrition/exclusions (e.g. number randomized not stated,
no reasons for missing data provided);
• The study did not address this outcome.
2 Unclear risk of bias
6. For the outcome reporting, which statement best describes the study? Radio Button
A. Any of the following:
• The study protocol is available and all of the study’s pre-specified (primary and
secondary) outcomes that are of interest in the review have been reported in the
0 Low risk of bias
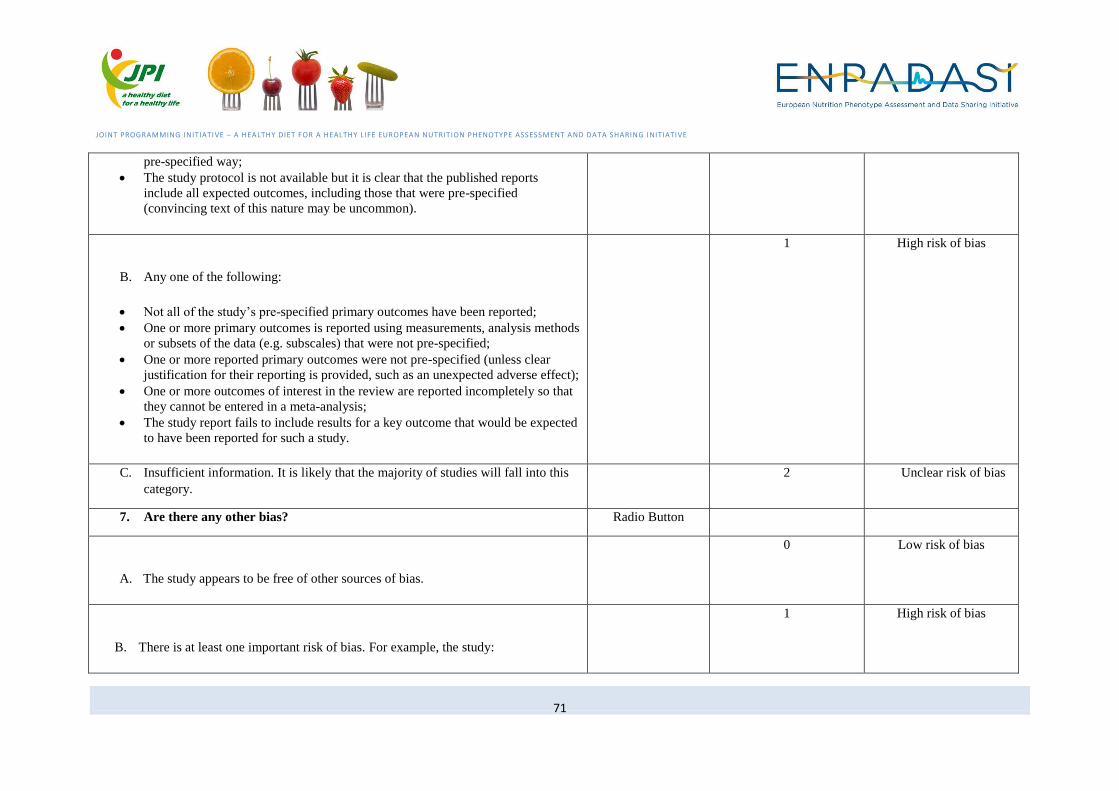
JOINT PROGRAMMING INITIATIVE – A HEALTHY DIET FOR A HEALTHY LIFE EUROPEAN NUTRITION PHENOTYPE ASSESSMENT AND DATA SHARING INITIATIVE
71
pre-specified way;
• The study protocol is not available but it is clear that the published reports
include all expected outcomes, including those that were pre-specified
(convincing text of this nature may be uncommon).
B. Any one of the following:
• Not all of the study’s pre-specified primary outcomes have been reported;
• One or more primary outcomes is reported using measurements, analysis methods
or subsets of the data (e.g. subscales) that were not pre-specified;
• One or more reported primary outcomes were not pre-specified (unless clear
justification for their reporting is provided, such as an unexpected adverse effect);
• One or more outcomes of interest in the review are reported incompletely so that
they cannot be entered in a meta-analysis;
• The study report fails to include results for a key outcome that would be expected
to have been reported for such a study.
1 High risk of bias
C. Insufficient information. It is likely that the majority of studies will fall into this
category. 2 Unclear risk of bias
7. Are there any other bias? Radio Button
A. The study appears to be free of other sources of bias.
0 Low risk of bias
B. There is at least one important risk of bias. For example, the study:
1 High risk of bias
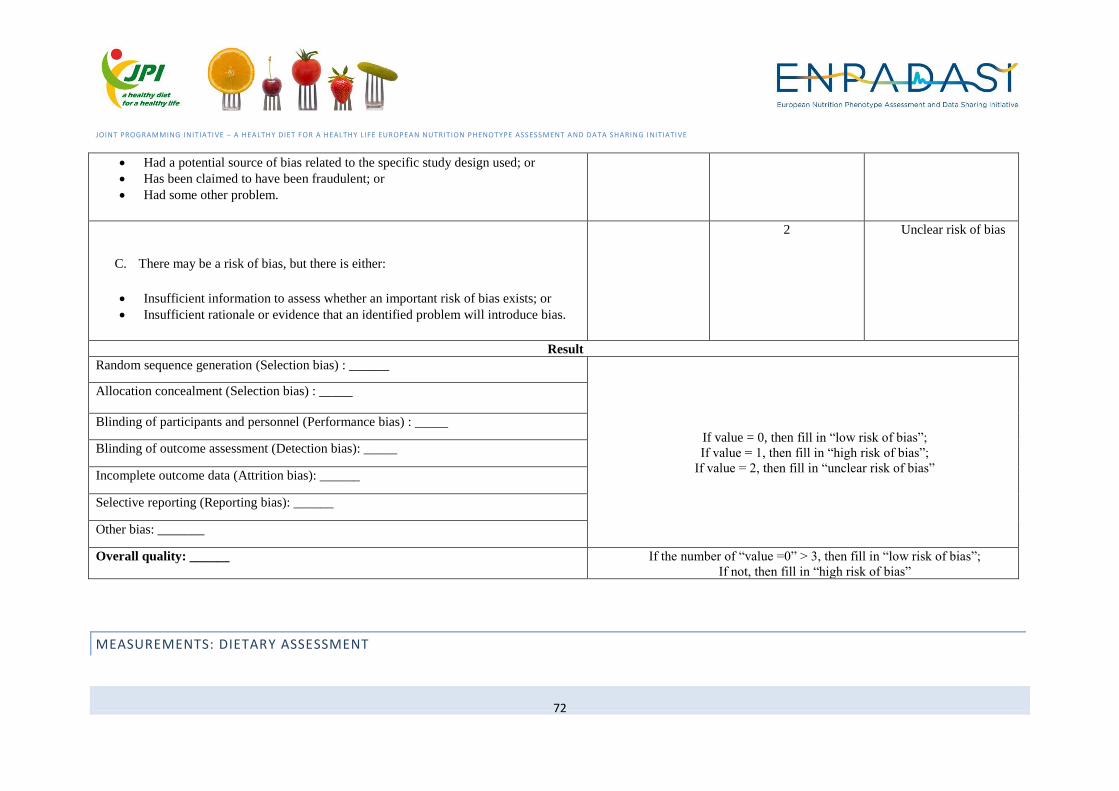
JOINT PROGRAMMING INITIATIVE – A HEALTHY DIET FOR A HEALTHY LIFE EUROPEAN NUTRITION PHENOTYPE ASSESSMENT AND DATA SHARING INITIATIVE
72
• Had a potential source of bias related to the specific study design used; or
• Has been claimed to have been fraudulent; or
• Had some other problem.
C. There may be a risk of bias, but there is either:
• Insufficient information to assess whether an important risk of bias exists; or
• Insufficient rationale or evidence that an identified problem will introduce bias.
2 Unclear risk of bias
Result
Random sequence generation (Selection bias) : ______
If value = 0, then fill in “low risk of bias”;
If value = 1, then fill in “high risk of bias”;
If value = 2, then fill in “unclear risk of bias”
Allocation concealment (Selection bias) : _____
Blinding of participants and personnel (Performance bias) : _____
Blinding of outcome assessment (Detection bias): _____
Incomplete outcome data (Attrition bias): ______
Selective reporting (Reporting bias): ______
Other bias: _______
Overall quality: ______ If the number of “value =0” > 3, then fill in “low risk of bias”;
If not, then fill in “high risk of bias”
MEASUREMENTS: DIETARY ASSESSMENT

JOINT PROGRAMMING INITIATIVE – A HEALTHY DIET FOR A HEALTHY LIFE EUROPEAN NUTRITION PHENOTYPE ASSESSMENT AND DATA SHARING INITIATIVE
73
Items Objective? Scoring Reference Rewrite subjective items
1. Data collection method/tool
1.1 Type of instrument Yes
o 24-hour recalls =0;
o Food frequency questionnaire =1;
o Diet history=2
Friedenreich
1.2 Type of administration of diet
questionnaire Yes
o Self-administered =0;
o Interview-administered=1 Friedenreich
1.3 Source of information Yes
o Interview with subject= 3 points;
o Self-completed by subject, but checked by Interviewer= 2.5 points;
o Self-completed, not checked= 2 points;
o Proxy data-spouse= 1 point:
o Other relative= 0.5 points
Margetts
1.4 Data collection Yes
(max 1 point): 0.5 point if researcher administered (i.e. supervised, face to
face or phone interview); plus 0.5 point if conducted or reviewed/checked
by a trained person
Yang
1.5 Has more than one method been
used? Yes (1,0) Margetts
1.6 Standardised data-collection Yes _0_ not identical _2_ identical Giannakopoulos NN
JOINT PROGRAMMING INITIATIVE – A HEALTHY DIET FOR A HEALTHY LIFE EUROPEAN NUTRITION PHENOTYPE ASSESSMENT AND DATA SHARING INITIATIVE
74
Items Objective? Scoring Reference Rewrite subjective items
methods?
1.7 Description of procedure for data
collection Yes 0 = Not at all 1 = Very slightly 2 = Moderately 3 = complete Sirriyeh
1.8 Rationale for choice of data
collection tool(s) Yes 1 = Not at all 1 = Very slightly 2 = Moderately 3 = complete Sirriyeh
1.9 Is the method appropriate for the
question being asked? No (3,2,1,0) Margetts
1.10 Is the description of the method
sufficient to judge whether the method
is likely to be used correctly?
No (1,0) Margetts
Can the validity of method
be judged by available
description of the method?
1.11 What methods did the researcher
use for collecting data—and are these
described in enough detail?
No no option available Greenhalgh T and
Taylor R
1.12 Particulars of dietary assessment
tool reported in sufficient detail? No Yes No Can´t tell NA NNR

JOINT PROGRAMMING INITIATIVE – A HEALTHY DIET FOR A HEALTHY LIFE EUROPEAN NUTRITION PHENOTYPE ASSESSMENT AND DATA SHARING INITIATIVE
75
Items Objective? Scoring Reference Rewrite subjective items
(not really for dietary intake data
collection but might be useful) Was the
study instrument that measured the
parameter of interest (e.g. prevalence
of low back pain) shown to have
reliability and validity (if necessary)?
Yes
· Yes (LOW RISK): The study instrument had been shown to have reliability
and validity (if this was necessary), e.g. test-retest, piloting, validation in a
previous study, etc.
· No (HIGH RISK): The study instrument had NOT been shown to have
reliability or validity (if this was necessary).
Hoy D
(not really for dietary intake data
collection but might be useful) Was the
same mode of data collection used for
all subjects?
Yes
· Yes (LOW RISK): The same mode of data collection was used for all
subjects.
· No (HIGH RISK): The same mode of data collection was NOT used for all
subjects.
Hoy D
(for FFQ) Instrument development? Yes
- A newly designed FFQ
- A FFQ adapted from a pre-existing instrument (add name)
- A pre-existing FFQ (add name)
Cade JE (not a quality
assessment tool)8
Yang WY (see criteria
entitled “Study Tool”)
8 Cade, J.E., Burley, V.J., Warm, D.L., Thompson, R.L., Margetts, B.M. (2004). Food-frequency questionnaires: a review of their design,
validation and utilization. Nutrition Research Reviews 17:5-22.

JOINT PROGRAMMING INITIATIVE – A HEALTHY DIET FOR A HEALTHY LIFE EUROPEAN NUTRITION PHENOTYPE ASSESSMENT AND DATA SHARING INITIATIVE
76
Items Objective? Scoring Reference Rewrite subjective items
(for FFQ) Pre-testing of the tool? Yes
- Yes=1
- No=0
(meanings of the food names and portion-size descriptors are clear to
subjects, instructions are clear and that the method for recording
responses is unambiguous.)
(Cade JE (not a quality
assessment tool))
(Nelson M)
Dennis LK9
2. Validity and Reproducibility of Data
2.1 Relative validity of questionnaire
tested before its use in study Yes
No =0; Yes, by the original designers of the questionnaire =1; Yes, by the
investigators of the current study=2 Friedenreich
2.2 Has the method been validated? Yes (1,0) Margetts
2.3 Concurrent validity (validation
coefficients) of specific exposures
reported?
Yes Yes No Can´t tell NA NNR
2.4 Reproducibility of questionnaire Yes o No =0;
o Yes, by the original designers of the questionnaire=1;
Friedenreich
9 Dennis, L.K., Snetselaar, L.G., Nothwehr, F.K., Stewart, R.E. (2003). Developing a scoring method for evaluating dietary methodology in
reviews of epidemiologic studies. J Am Diet Assoc 103(4):483-7.
JOINT PROGRAMMING INITIATIVE – A HEALTHY DIET FOR A HEALTHY LIFE EUROPEAN NUTRITION PHENOTYPE ASSESSMENT AND DATA SHARING INITIATIVE
77
Items Objective? Scoring Reference Rewrite subjective items
tested before its use? o Yes, by the investigators of the current study =2
2.5 Clearly stated aims and likelihood
of reliable and valid measurements Yes use "Yes (1 point)", "Unclear (0.5 point)", or "No (0 point)" to judge Crombie’s items
2.6 Were data collection tools shown
to be valid? No Yes/ No/ Can't tell EPHPP
2.7 Were data collection tools shown
to be reliable? No Yes/ No/ Can't tell EPHPP
2.8 Are the measurements
(questionnaires) likely to be valid and
reliable?
No Yes, No, Can't tell CEBMa-survey
2.9 Method used for dietary
assessment adequate and valid? No Yes No Can´t tell NA NNR
2.10 Reliable survey instruments? Yes _0_ noth. referred. _1_ B.4b) =1/RDC _2_ RDC+calibrated Giannakopoulos NN
2.11 Valid survey instruments? Yes _0_ questionnaire _1_ Helkimo etc. _2_ RDC/TMD Giannakopoulos NN
JOINT PROGRAMMING INITIATIVE – A HEALTHY DIET FOR A HEALTHY LIFE EUROPEAN NUTRITION PHENOTYPE ASSESSMENT AND DATA SHARING INITIATIVE
78
Items Objective? Scoring Reference Rewrite subjective items
3. Type of data: Time and Seasonality
3.1 In retrospective assessment, is the
reference (time) period clearly
reported?
Yes Yes No Can´t tell NA NNR
3.2 Time from sample collection to
sample analysis reported? Yes Yes/No Tufts
3.3 Time period used for recall of past
diet Yes
o Current diet or diet close to time of interview =0 subjective?
o Diet at least 1 year before interview or diet at some point in the past =1 Friedenreich
3.4 Same time period for diet recall
used for cases and controls Yes
o No =0;
o Yes =1 Friedenreich
3.5 Seasonality of consumption
measured Yes
o No =0;
o Yes =1 Friedenreich
3.6 number of days recall (food record/
recall method) Yes
(max 1 point): 0.5 point for multiple days of recall; plus 0.5 point if
consideration of all days of the week Yang
3.7 The year(s) of study recorded Yes 10 (full score of this item) out of 100 (total score of the checklist) Al-Jader LN
JOINT PROGRAMMING INITIATIVE – A HEALTHY DIET FOR A HEALTHY LIFE EUROPEAN NUTRITION PHENOTYPE ASSESSMENT AND DATA SHARING INITIATIVE
79
Items Objective? Scoring Reference Rewrite subjective items
3.8 Follow-up time in idealized study
identical
to target follow-up time?
Yes Yes/No Simon Thompson
3.9 Indicate time period used for
identifying patients Yes use "Yes", "No", or "Unclear" to judge
ARHQ for Cross-
Sectional
3.10 Timescale No (max 0.5 point): 0.5 point if timescale appropriate to capture usual intake Yang
Can usual intake be
captured based on the
timescale of research?
3.11 Was follow-up carried out over a
sufficient time period? No Yes, No, unclear, N/A, comments
MAStARI-descriptive
study
3.12 Does the assessment cover an
appropriate time frame? No
(1,0) Margetts
3.13 Time period between biomarker
assessment and diagnosis acceptable? No Yes No Can´t tell NA NNR
4. Type of data: Portion size
4.1 Portion size estimated in diet Yes
o No =0; Friedenreich
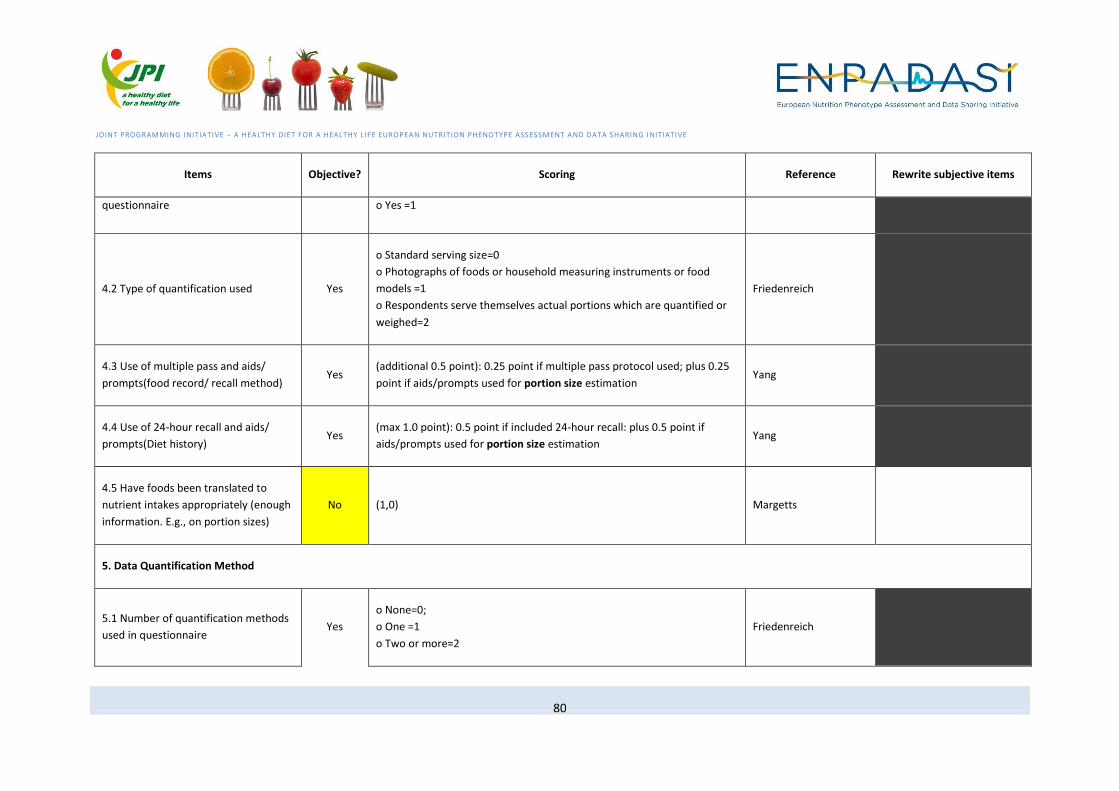
JOINT PROGRAMMING INITIATIVE – A HEALTHY DIET FOR A HEALTHY LIFE EUROPEAN NUTRITION PHENOTYPE ASSESSMENT AND DATA SHARING INITIATIVE
80
Items Objective? Scoring Reference Rewrite subjective items
questionnaire o Yes =1
4.2 Type of quantification used Yes
o Standard serving size=0
o Photographs of foods or household measuring instruments or food
models =1
o Respondents serve themselves actual portions which are quantified or
weighed=2
Friedenreich
4.3 Use of multiple pass and aids/
prompts(food record/ recall method) Yes
(additional 0.5 point): 0.25 point if multiple pass protocol used; plus 0.25
point if aids/prompts used for portion size estimation Yang
4.4 Use of 24-hour recall and aids/
prompts(Diet history) Yes
(max 1.0 point): 0.5 point if included 24-hour recall: plus 0.5 point if
aids/prompts used for portion size estimation Yang
4.5 Have foods been translated to
nutrient intakes appropriately (enough
information. E.g., on portion sizes)
No (1,0) Margetts
5. Data Quantification Method
5.1 Number of quantification methods
used in questionnaire Yes
o None=0;
o One =1
o Two or more=2
Friedenreich

JOINT PROGRAMMING INITIATIVE – A HEALTHY DIET FOR A HEALTHY LIFE EUROPEAN NUTRITION PHENOTYPE ASSESSMENT AND DATA SHARING INITIATIVE
81
Items Objective? Scoring Reference Rewrite subjective items
5.2 Method reported? Yes Yes/No Tufts
5.3 One of the prespecified methods
(HPLC, RIA kits, LC-MS/MS;
EIA/Chemiluminescence) was used?
Yes Yes/No Tufts
6. Refer Nutrition Database or not?
6.1 Scoring method Yes
(max 1 point): 1.0 point for questionnaires—weighting of items or
subscales reported; 1.0 point for nutrient calculations—relevant nutrient
databases reported
Yang
6.2 Food composition database
reported? Yes Yes No Can´t tell NA NNR
6.3 Food composition database or
supply composition reported? Yes Yes/No Tufts
6.4 Type of food tables used Yes
o Foreign tables only=0;
o Local and foreign tables=1;
o Local tables only =2;
o Local tables and other values from industry, recipes, local analyses=3
Friedenreich
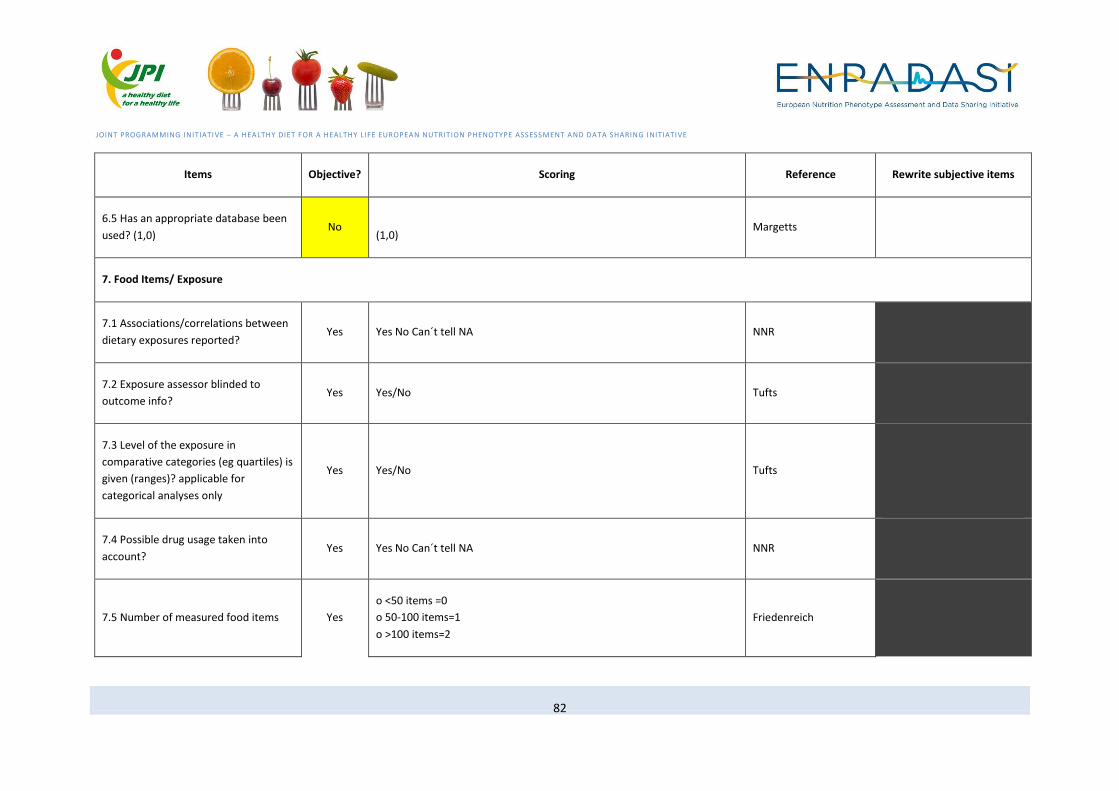
JOINT PROGRAMMING INITIATIVE – A HEALTHY DIET FOR A HEALTHY LIFE EUROPEAN NUTRITION PHENOTYPE ASSESSMENT AND DATA SHARING INITIATIVE
82
Items Objective? Scoring Reference Rewrite subjective items
6.5 Has an appropriate database been
used? (1,0) No
(1,0) Margetts
7. Food Items/ Exposure
7.1 Associations/correlations between
dietary exposures reported? Yes Yes No Can´t tell NA NNR
7.2 Exposure assessor blinded to
outcome info? Yes Yes/No Tufts
7.3 Level of the exposure in
comparative categories (eg quartiles) is
given (ranges)? applicable for
categorical analyses only
Yes Yes/No Tufts
7.4 Possible drug usage taken into
account? Yes Yes No Can´t tell NA NNR
7.5 Number of measured food items Yes
o <50 items =0
o 50-100 items=1
o >100 items=2
Friedenreich

JOINT PROGRAMMING INITIATIVE – A HEALTHY DIET FOR A HEALTHY LIFE EUROPEAN NUTRITION PHENOTYPE ASSESSMENT AND DATA SHARING INITIATIVE
83
Items Objective? Scoring Reference Rewrite subjective items
7.6 Type of food items included in
questionnaire Yes
o Subset of foods eaten=0;
o Main foods eaten=1 Friedenreich
7.7 Does the study include diet and
biologic samples? Yes (1,0) Margetts
7.8 Are outcome data reported by
levels of exposure? Yes N/A, Yes, Partial, No EAI (Genaidy AM)
Are the outcome/exposure data
reported by subgroups of subjects? Yes Yes, Partial, No EAI (Genaidy AM)
7.8Type of exposure (nutrients, food
groups, etc.) reported in sufficient
detail?
No Yes No Can´t tell NA NNR
7.9 Diets/nutrients studied clearly
defined and characterised? No Yes No Can´t tell NA NNR
8. non-food factors
8.1 Qualitative data on cooking and
eating habits collected in questionnaire
Yes o No =0
o Yes, collected but not used in nutrient estimation =1
Friedenreich
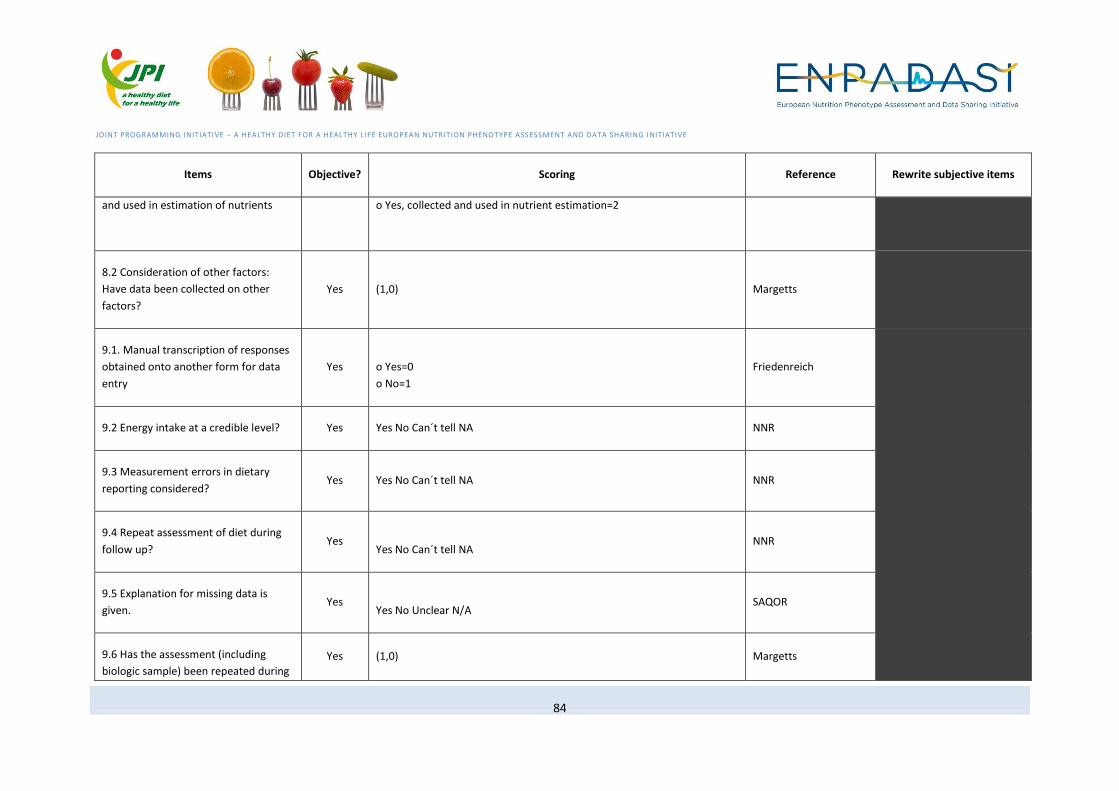
JOINT PROGRAMMING INITIATIVE – A HEALTHY DIET FOR A HEALTHY LIFE EUROPEAN NUTRITION PHENOTYPE ASSESSMENT AND DATA SHARING INITIATIVE
84
Items Objective? Scoring Reference Rewrite subjective items
and used in estimation of nutrients o Yes, collected and used in nutrient estimation=2
8.2 Consideration of other factors:
Have data been collected on other
factors?
Yes (1,0) Margetts
9.1. Manual transcription of responses
obtained onto another form for data
entry
Yes o Yes=0
o No=1
Friedenreich
9.2 Energy intake at a credible level? Yes Yes No Can´t tell NA NNR
9.3 Measurement errors in dietary
reporting considered? Yes Yes No Can´t tell NA NNR
9.4 Repeat assessment of diet during
follow up? Yes
Yes No Can´t tell NA NNR
9.5 Explanation for missing data is
given. Yes
Yes No Unclear N/A SAQOR
9.6 Has the assessment (including
biologic sample) been repeated during
Yes (1,0) Margetts
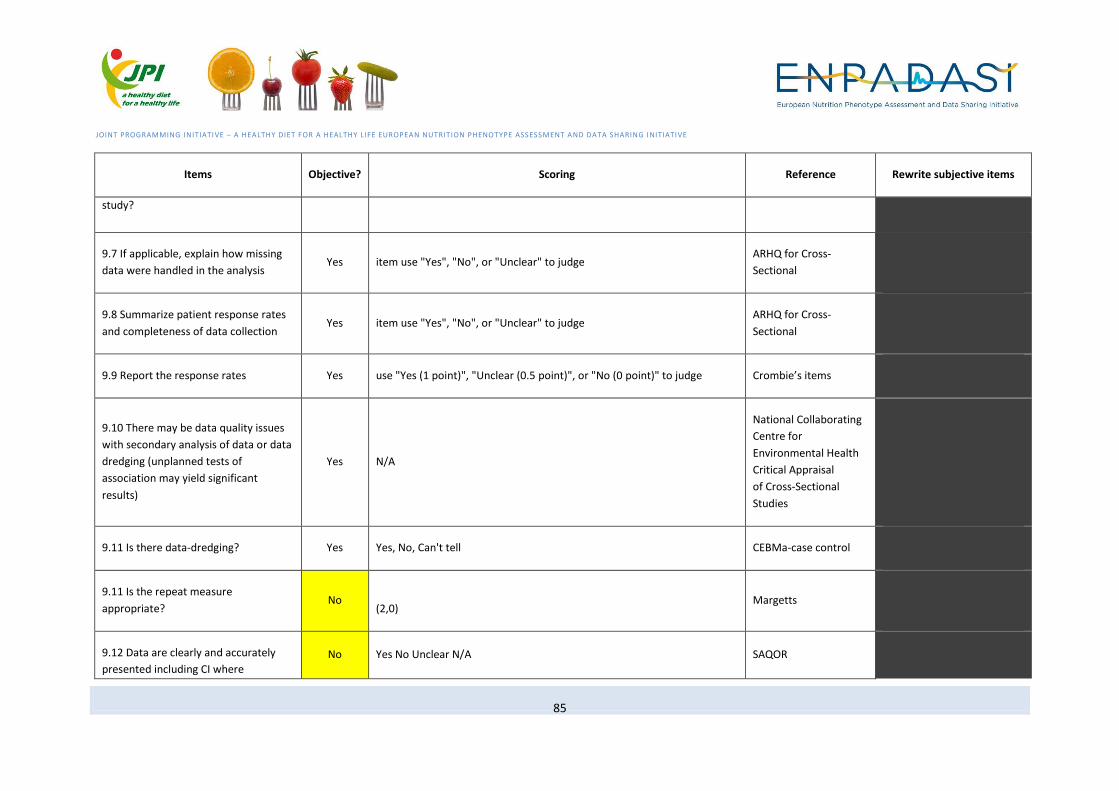
JOINT PROGRAMMING INITIATIVE – A HEALTHY DIET FOR A HEALTHY LIFE EUROPEAN NUTRITION PHENOTYPE ASSESSMENT AND DATA SHARING INITIATIVE
85
Items Objective? Scoring Reference Rewrite subjective items
study?
9.7 If applicable, explain how missing
data were handled in the analysis Yes item use "Yes", "No", or "Unclear" to judge
ARHQ for Cross-
Sectional
9.8 Summarize patient response rates
and completeness of data collection Yes item use "Yes", "No", or "Unclear" to judge
ARHQ for Cross-
Sectional
9.9 Report the response rates Yes use "Yes (1 point)", "Unclear (0.5 point)", or "No (0 point)" to judge Crombie’s items
9.10 There may be data quality issues
with secondary analysis of data or data
dredging (unplanned tests of
association may yield significant
results)
Yes N/A
National Collaborating
Centre for
Environmental Health
Critical Appraisal
of Cross-Sectional
Studies
9.11 Is there data-dredging? Yes Yes, No, Can't tell CEBMa-case control
9.11 Is the repeat measure
appropriate? No
(2,0) Margetts
9.12 Data are clearly and accurately
presented including CI where No Yes No Unclear N/A SAQOR
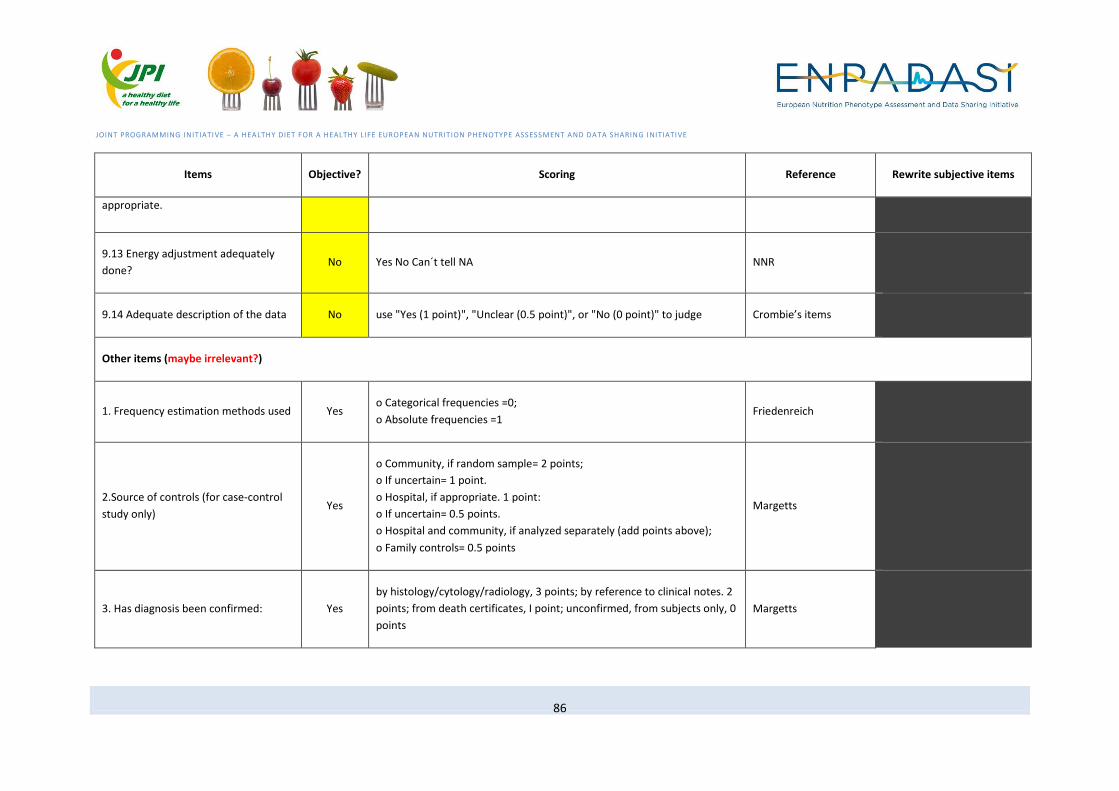
JOINT PROGRAMMING INITIATIVE – A HEALTHY DIET FOR A HEALTHY LIFE EUROPEAN NUTRITION PHENOTYPE ASSESSMENT AND DATA SHARING INITIATIVE
86
Items Objective? Scoring Reference Rewrite subjective items
appropriate.
9.13 Energy adjustment adequately
done? No Yes No Can´t tell NA NNR
9.14 Adequate description of the data No use "Yes (1 point)", "Unclear (0.5 point)", or "No (0 point)" to judge Crombie’s items
Other items (maybe irrelevant?)
1. Frequency estimation methods used Yes o Categorical frequencies =0;
o Absolute frequencies =1 Friedenreich
2.Source of controls (for case-control
study only) Yes
o Community, if random sample= 2 points;
o If uncertain= 1 point.
o Hospital, if appropriate. 1 point:
o If uncertain= 0.5 points.
o Hospital and community, if analyzed separately (add points above);
o Family controls= 0.5 points
Margetts
3. Has diagnosis been confirmed: Yes
by histology/cytology/radiology, 3 points; by reference to clinical notes. 2
points; from death certificates, I point; unconfirmed, from subjects only, 0
points
Margetts
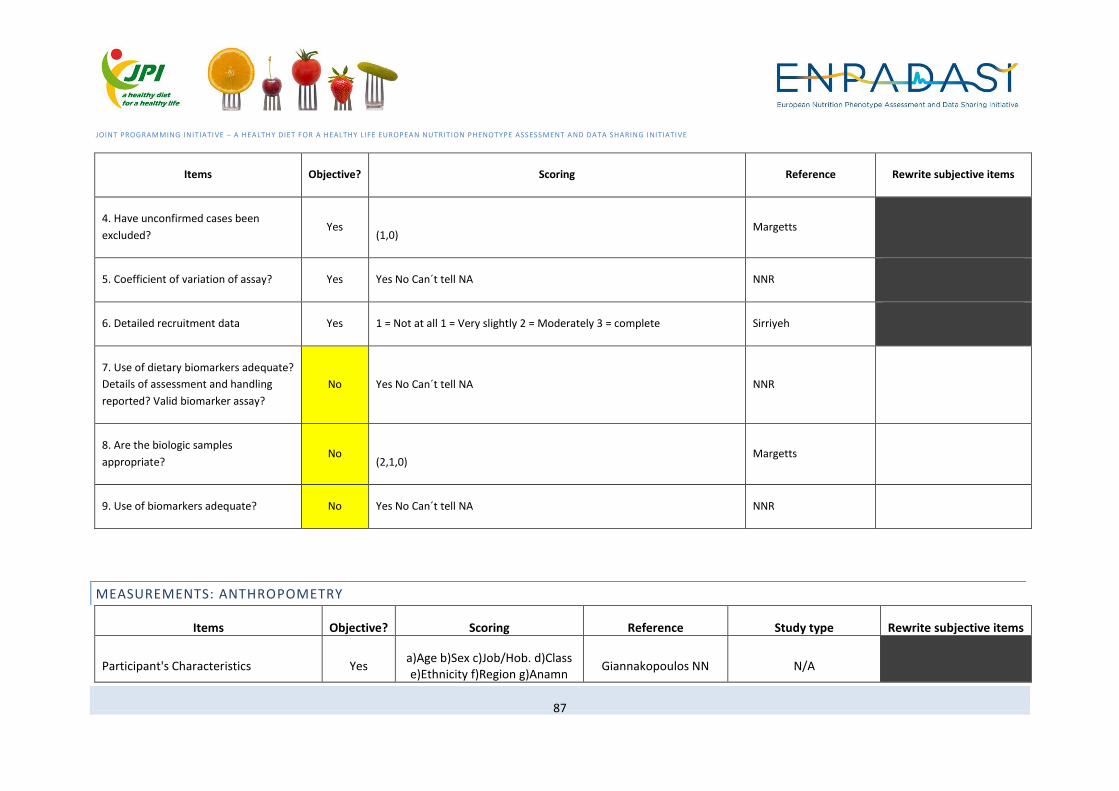
JOINT PROGRAMMING INITIATIVE – A HEALTHY DIET FOR A HEALTHY LIFE EUROPEAN NUTRITION PHENOTYPE ASSESSMENT AND DATA SHARING INITIATIVE
87
Items Objective? Scoring Reference Rewrite subjective items
4. Have unconfirmed cases been
excluded? Yes
(1,0) Margetts
5. Coefficient of variation of assay? Yes Yes No Can´t tell NA NNR
6. Detailed recruitment data Yes 1 = Not at all 1 = Very slightly 2 = Moderately 3 = complete Sirriyeh
7. Use of dietary biomarkers adequate?
Details of assessment and handling
reported? Valid biomarker assay?
No Yes No Can´t tell NA NNR
8. Are the biologic samples
appropriate? No
(2,1,0) Margetts
9. Use of biomarkers adequate? No Yes No Can´t tell NA NNR
MEASUREMENTS: ANTHROPOMETRY
Items Objective? Scoring Reference Study type Rewrite subjective items
Participant's Characteristics Yes a)Age b)Sex c)Job/Hob. d)Class e)Ethnicity f)Region g)Anamn
Giannakopoulos NN N/A
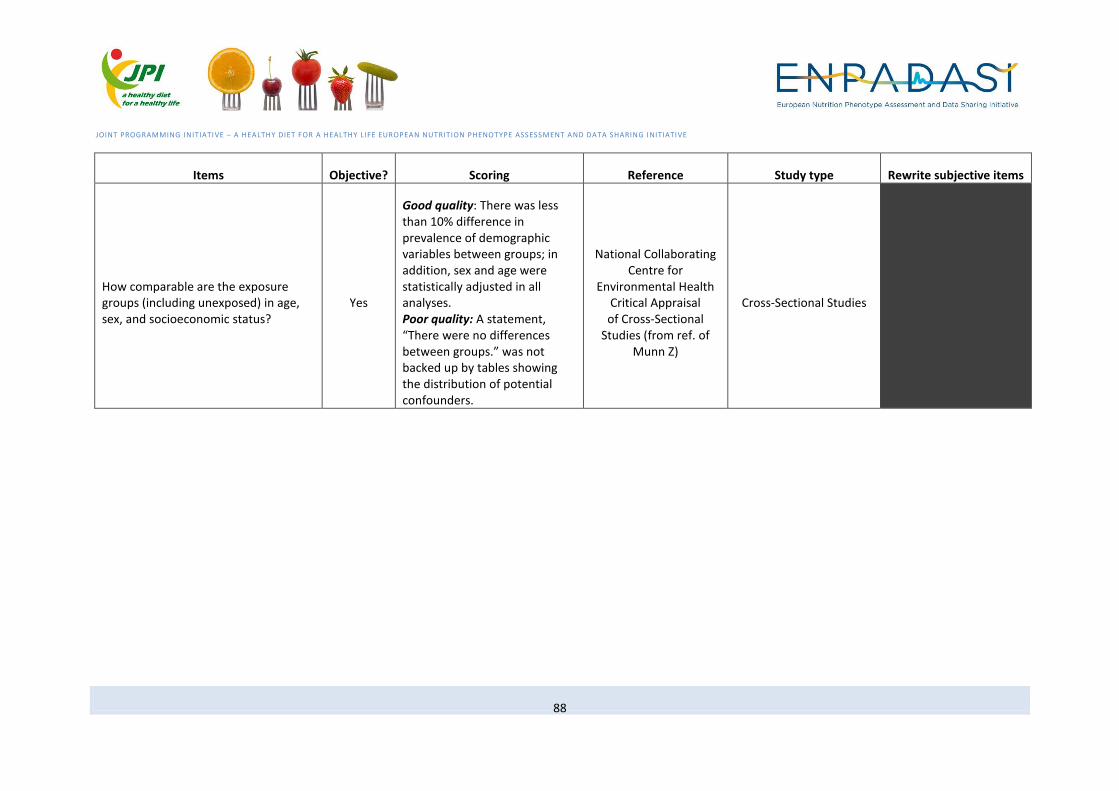
JOINT PROGRAMMING INITIATIVE – A HEALTHY DIET FOR A HEALTHY LIFE EUROPEAN NUTRITION PHENOTYPE ASSESSMENT AND DATA SHARING INITIATIVE
88
Items Objective? Scoring Reference Study type Rewrite subjective items
How comparable are the exposure groups (including unexposed) in age, sex, and socioeconomic status?
Yes
Good quality: There was less than 10% difference in prevalence of demographic variables between groups; in addition, sex and age were statistically adjusted in all analyses. Poor quality: A statement, “There were no differences between groups.” was not backed up by tables showing the distribution of potential confounders.
National Collaborating Centre for
Environmental Health Critical Appraisal of Cross-Sectional
Studies (from ref. of Munn Z)
Cross-Sectional Studies
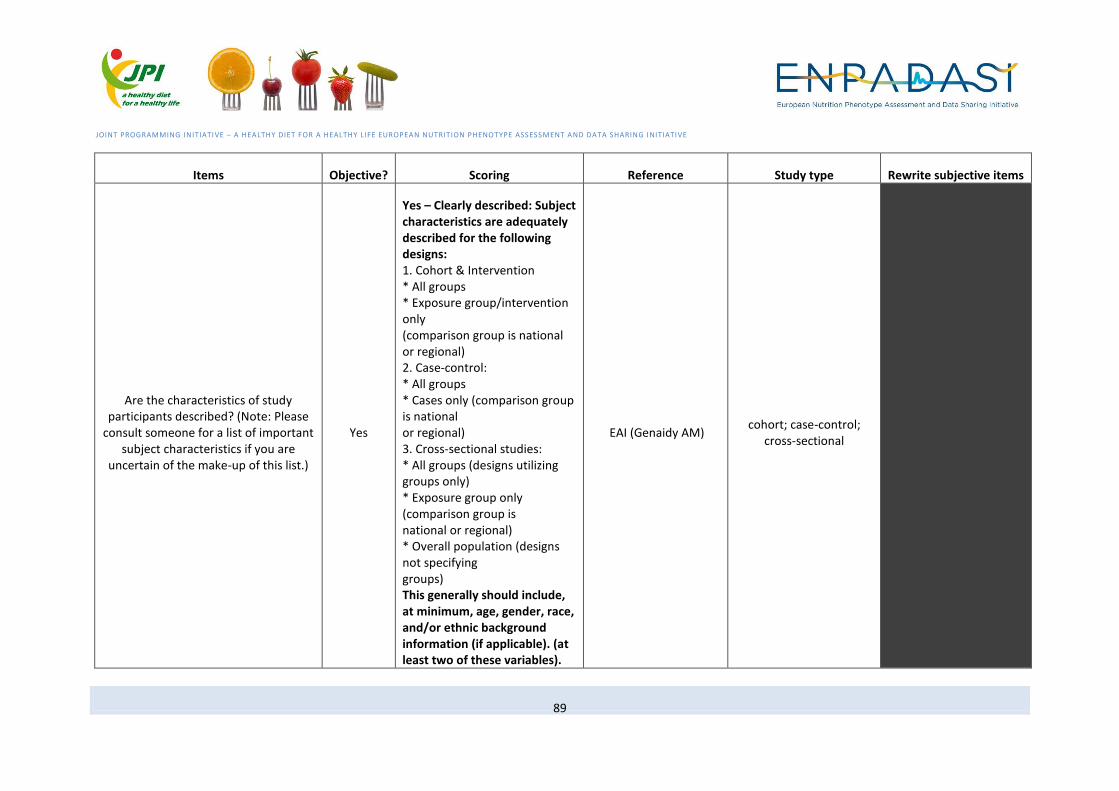
JOINT PROGRAMMING INITIATIVE – A HEALTHY DIET FOR A HEALTHY LIFE EUROPEAN NUTRITION PHENOTYPE ASSESSMENT AND DATA SHARING INITIATIVE
89
Items Objective? Scoring Reference Study type Rewrite subjective items
Are the characteristics of study participants described? (Note: Please
consult someone for a list of important subject characteristics if you are
uncertain of the make-up of this list.)
Yes
Yes – Clearly described: Subject characteristics are adequately described for the following designs: 1. Cohort & Intervention * All groups * Exposure group/intervention only (comparison group is national or regional) 2. Case-control: * All groups * Cases only (comparison group is national or regional) 3. Cross-sectional studies: * All groups (designs utilizing groups only) * Exposure group only (comparison group is national or regional) * Overall population (designs not specifying groups) This generally should include, at minimum, age, gender, race, and/or ethnic background information (if applicable). (at least two of these variables).
EAI (Genaidy AM) cohort; case-control;
cross-sectional
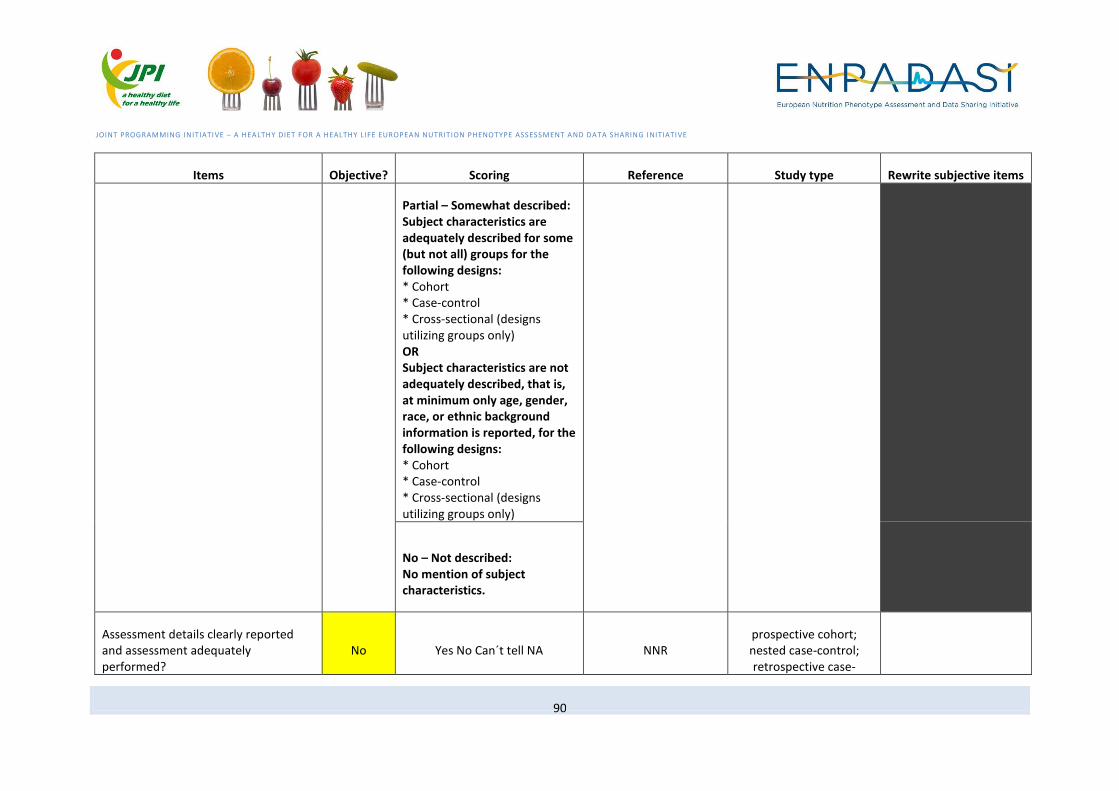
JOINT PROGRAMMING INITIATIVE – A HEALTHY DIET FOR A HEALTHY LIFE EUROPEAN NUTRITION PHENOTYPE ASSESSMENT AND DATA SHARING INITIATIVE
90
Items Objective? Scoring Reference Study type Rewrite subjective items
Partial – Somewhat described: Subject characteristics are adequately described for some (but not all) groups for the following designs: * Cohort * Case-control * Cross-sectional (designs utilizing groups only) OR Subject characteristics are not adequately described, that is, at minimum only age, gender, race, or ethnic background information is reported, for the following designs: * Cohort * Case-control * Cross-sectional (designs utilizing groups only)
No – Not described: No mention of subject characteristics.
Assessment details clearly reported and assessment adequately performed?
No Yes No Can´t tell NA NNR prospective cohort; nested case-control; retrospective case-
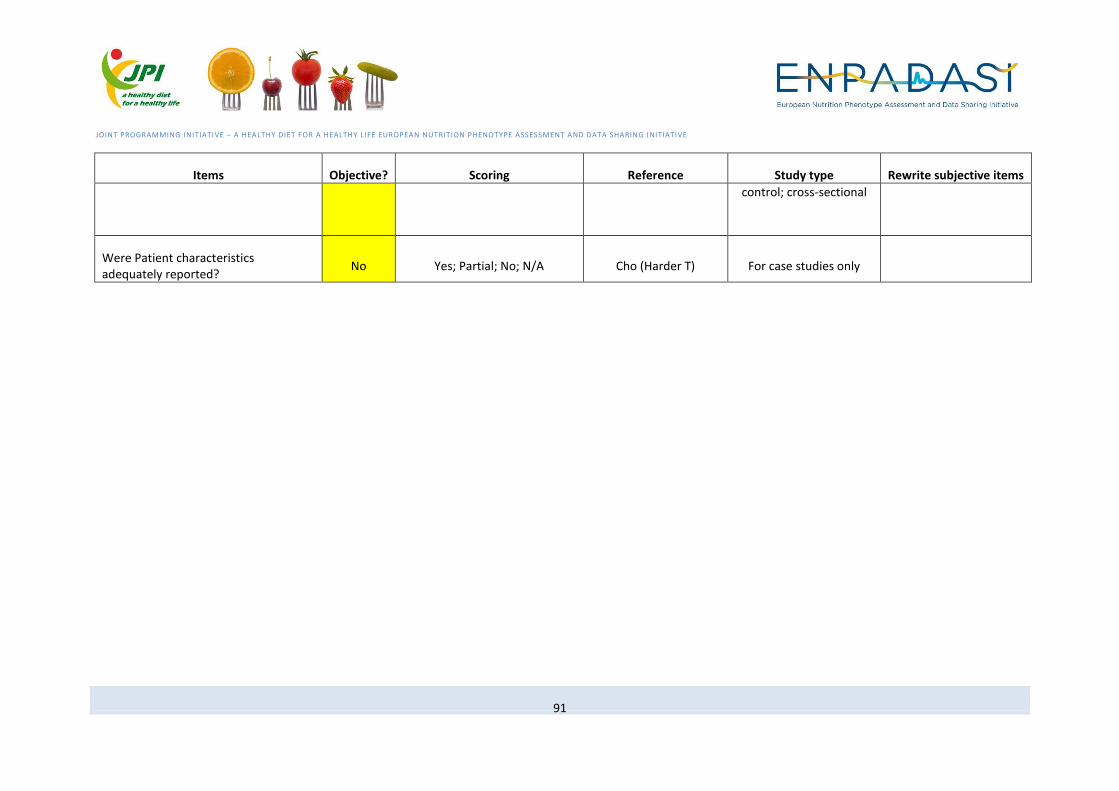
JOINT PROGRAMMING INITIATIVE – A HEALTHY DIET FOR A HEALTHY LIFE EUROPEAN NUTRITION PHENOTYPE ASSESSMENT AND DATA SHARING INITIATIVE
91
Items Objective? Scoring Reference Study type Rewrite subjective items
control; cross-sectional
Were Patient characteristics adequately reported?
No Yes; Partial; No; N/A Cho (Harder T) For case studies only


