
Project Storyboard Template
Visit GoLeanSixSigma.com for more Lean Six Sigma Resources

Executive Summary
Project Wins• Improved <primary metric> from _____ to _____• <Describe project’s impact – client experience,
efficiency, employee, financial>• <Insert 1-2 compelling project insights>
DMAIC Approach• <This section should include how you identified actual
root causes – reference key tools>• <Include description of how you drove change>
Context• <Insert information to explain why we care about this
business problem>
Project Start: Project End:
Insert Charts Here
1. Primary metric before & after2. Root Cause Analysis
For example: Control Chart (split before & after)
or box plot.
Operational Definitions
• Add 5 to 7 operational definitions that are key to understanding your project; put additional definitions in the appendix at the end of this presentation
• List in alphabetical order• Check that your definitions are accurate• If using acronyms, state what the acronym means in
addition to providing the operational definition

Define
Your goal here is to communicate a concise “story” of what you accomplished and learned from the Define phase as you focused your project on key goals.
Likely Topics:• Voice of customer• Baseline data and performance to customer expectations• Project Charter
Likely Tools:• VOC Data Analysis• High level map – SIPOC• Detailed level map – Swimlane or Value Stream
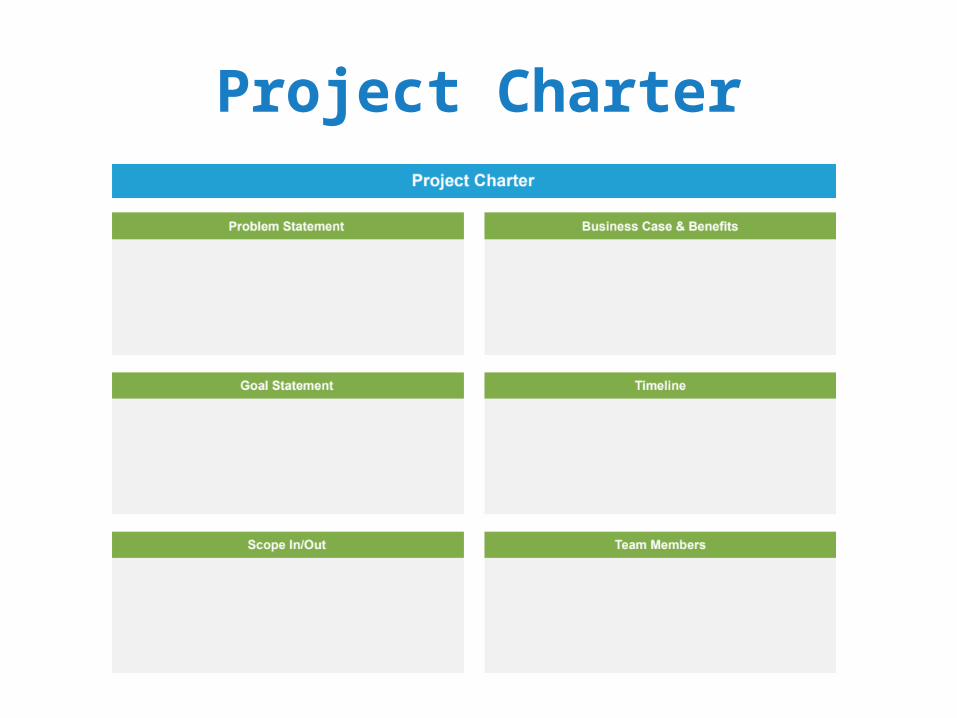
Project Charter
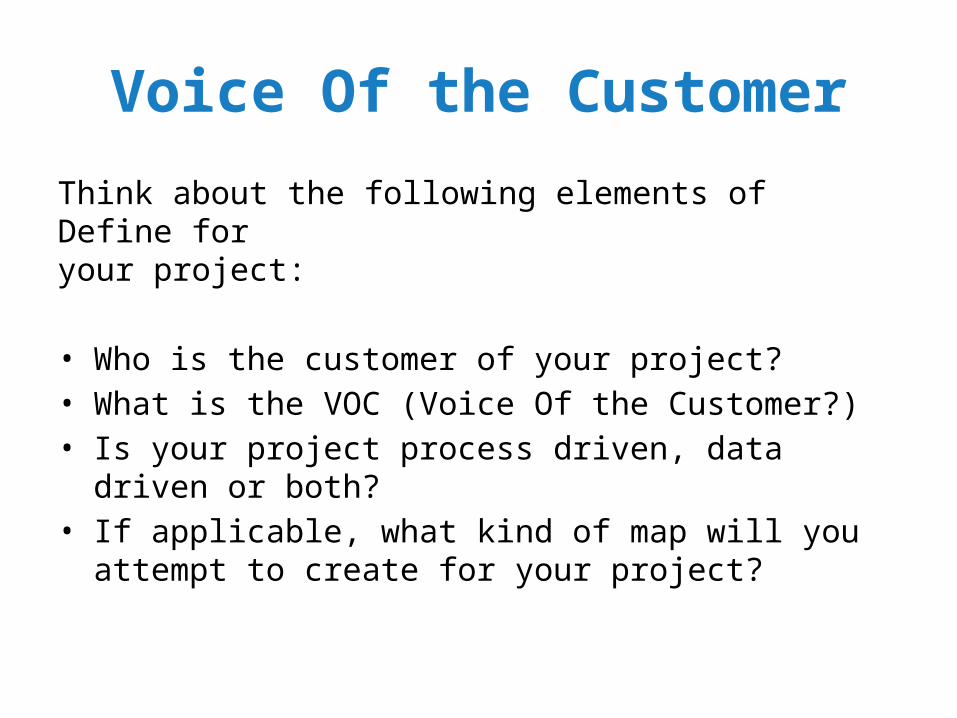
Voice Of the Customer
Think about the following elements of Define for your project:
• Who is the customer of your project?• What is the VOC (Voice Of the Customer?)• Is your project process driven, data driven or both?• If applicable, what kind of map will you attempt to create
for your project?

Process Map
• Select one of the following templates to use for your process map.
• Delete the other maps that are not used from your project storyboard template.

SIPOC

Swimlane Map
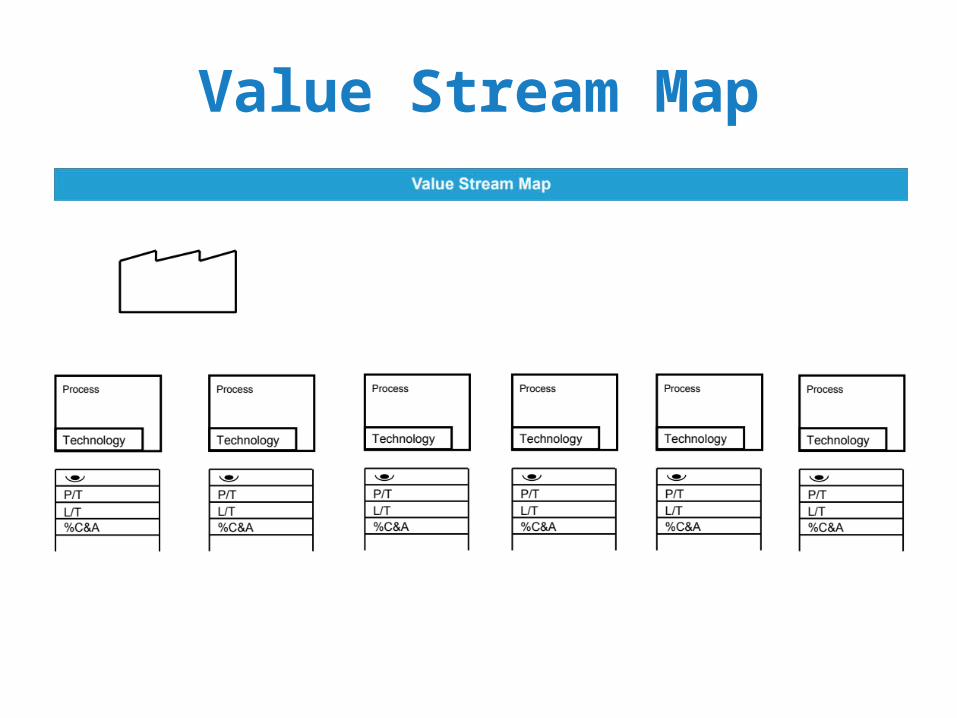
Value Stream Map
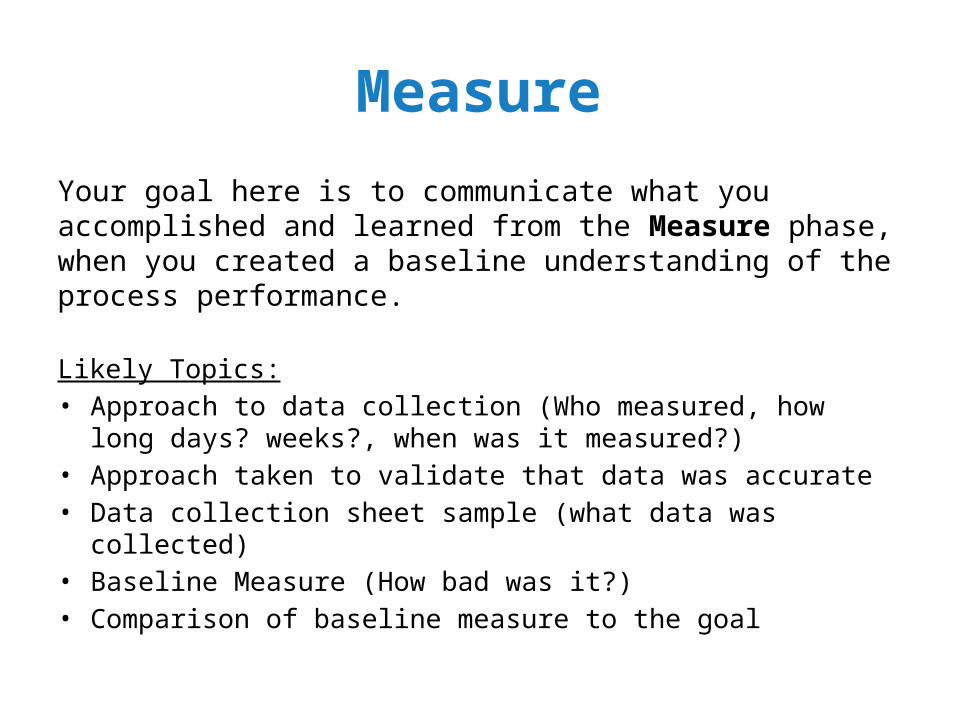
Measure
Your goal here is to communicate what you accomplished and learned from the Measure phase, when you created a baseline understanding of the process performance.
Likely Topics:• Approach to data collection (Who measured, how long days?
weeks?, when was it measured?)• Approach taken to validate that data was accurate• Data collection sheet sample (what data was collected)• Baseline Measure (How bad was it?)• Comparison of baseline measure to the goal

Baseline Data Capture
Questions to ask:
• What is your baseline measure?• Do you have historical data available?• How will you capture the data?

Sample Baseline Measure Chart
2010 2011 20130
10
20
30
40
50
60
Chart Title
Data 1Data 2Data 3Data 4Data 5
State conclusions here.
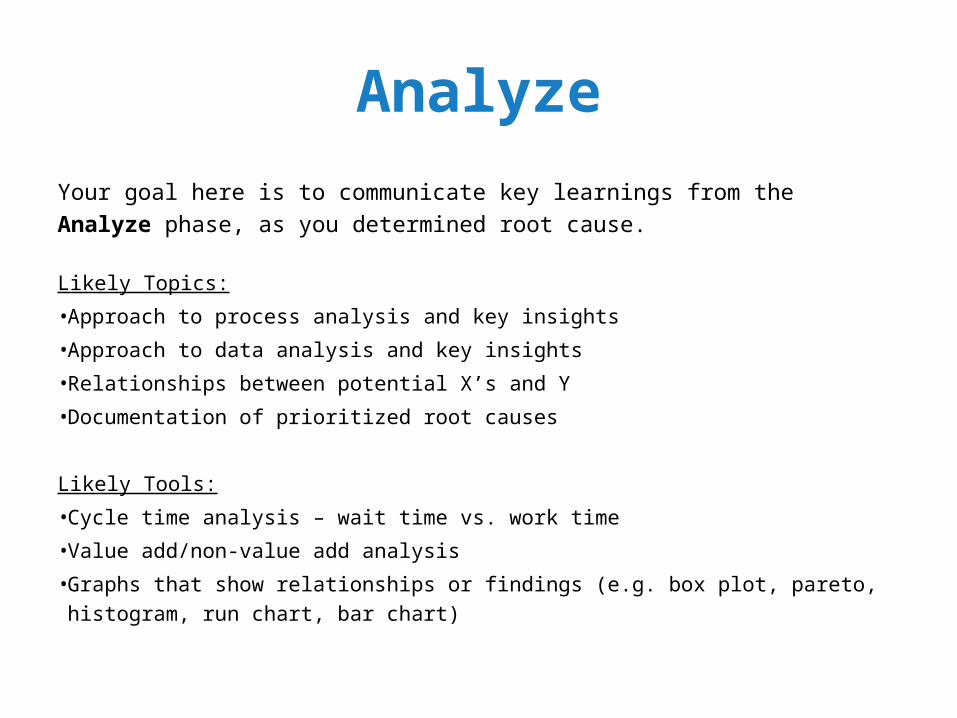
Analyze
Your goal here is to communicate key learnings from the Analyze phase, as you
determined root cause.
Likely Topics:
• Approach to process analysis and key insights
• Approach to data analysis and key insights
• Relationships between potential X’s and Y
• Documentation of prioritized root causes
Likely Tools:
• Cycle time analysis – wait time vs. work time
• Value add/non-value add analysis
• Graphs that show relationships or findings (e.g. box plot, pareto, histogram, run
chart, bar chart)

Fishbone Diagram
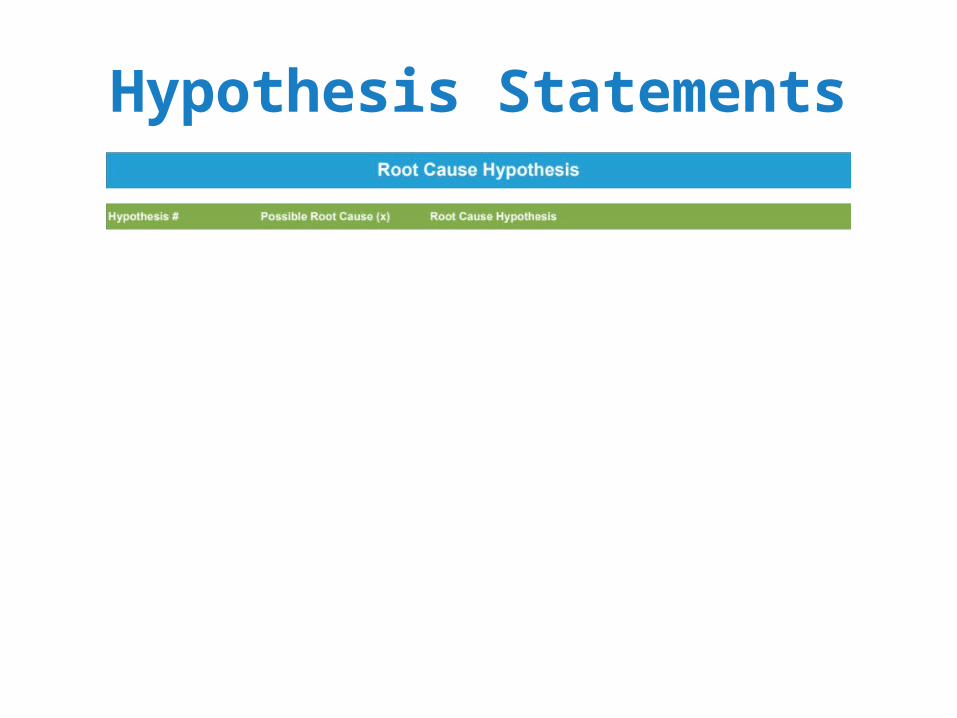
Hypothesis Statements

Hypothesis Statement
Review your list of possible X’s for your Black Belt project. Write at least one hypothesis statement including a null hypothesis and an alternate hypothesis.
NULL:
ALTERNATE:

Analyze Chart Proving Hypothesis
2010 2011 20130
10
20
30
40
50
60
Chart Title
Data 1Data 2Data 3Data 4Data 5
State conclusions here.

Improve
Your goal here is to communicate a concise story of what you accomplished and learned from the Improve phase.
Likely Topics:• Description or illustration of your solutions• Approach to prioritizing and selecting solutions that eliminated root
causes• Implementation plan and results
Likely Topics:• Process Change Summary• Solution and Root Cause matrix• Should-be of Future State process map

Baseline & Improvement Data Comparison
Baseline Data Chart Improvement Data Chart

Control
Your goal here is to communicate what you accomplished and learned from the Control Phase, as you transitioned your solution to the day-to-day business operation.
Likely Topics:• Demonstrate improved process performance over baseline• Demonstrate sustained improvement• Describe the control plan that ensures the gains are maintained
over the long term, including response plans• Documentation and standardization of improved processes
Likely Topics:• Response Plan• Control plan to show ongoing monitoring
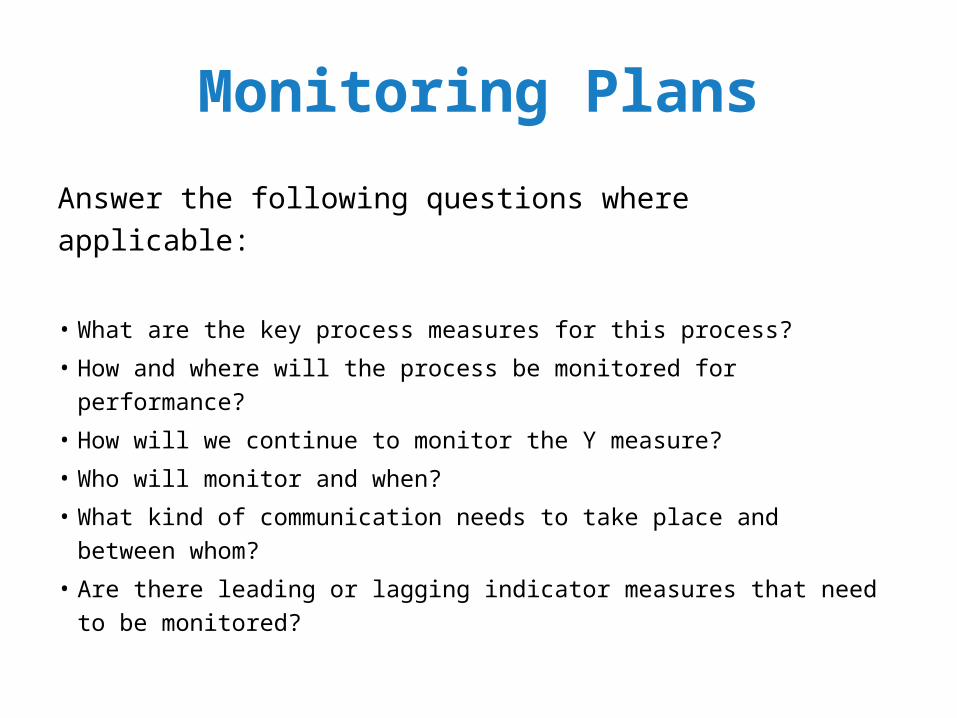
Monitoring Plans
Answer the following questions where applicable:
• What are the key process measures for this process?
• How and where will the process be monitored for performance?
• How will we continue to monitor the Y measure?
• Who will monitor and when?
• What kind of communication needs to take place and
between whom?
• Are there leading or lagging indicator measures that need to be
monitored?
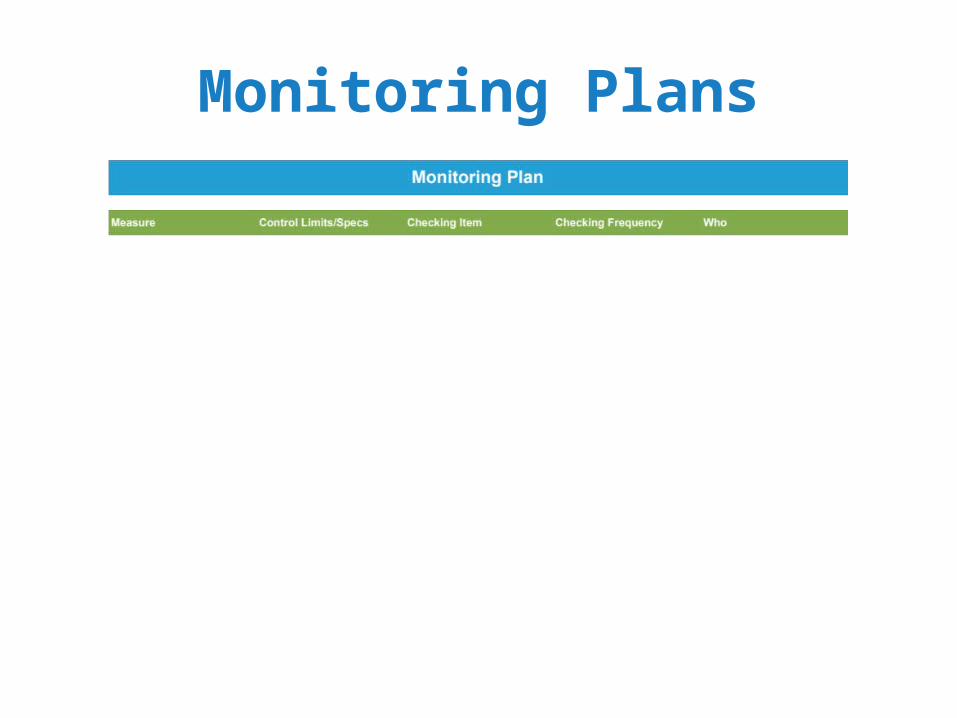
Monitoring Plans
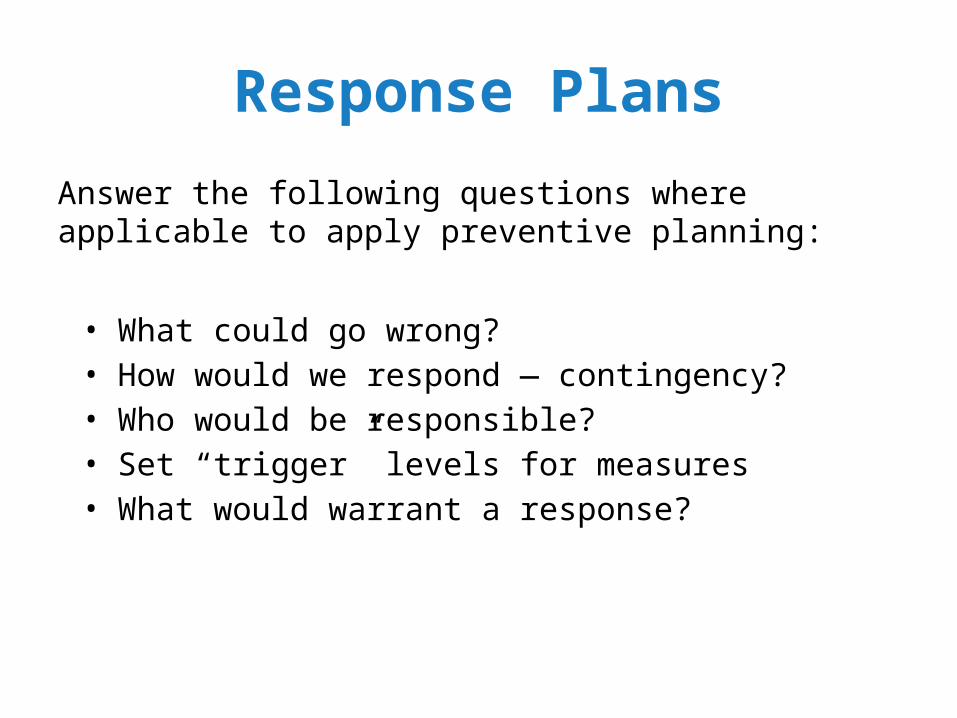
Response Plans
Answer the following questions where applicable to apply preventive planning:
• What could go wrong?• How would we respond — contingency?• Who would be responsible?• Set “trigger” levels for measures• What would warrant a response?
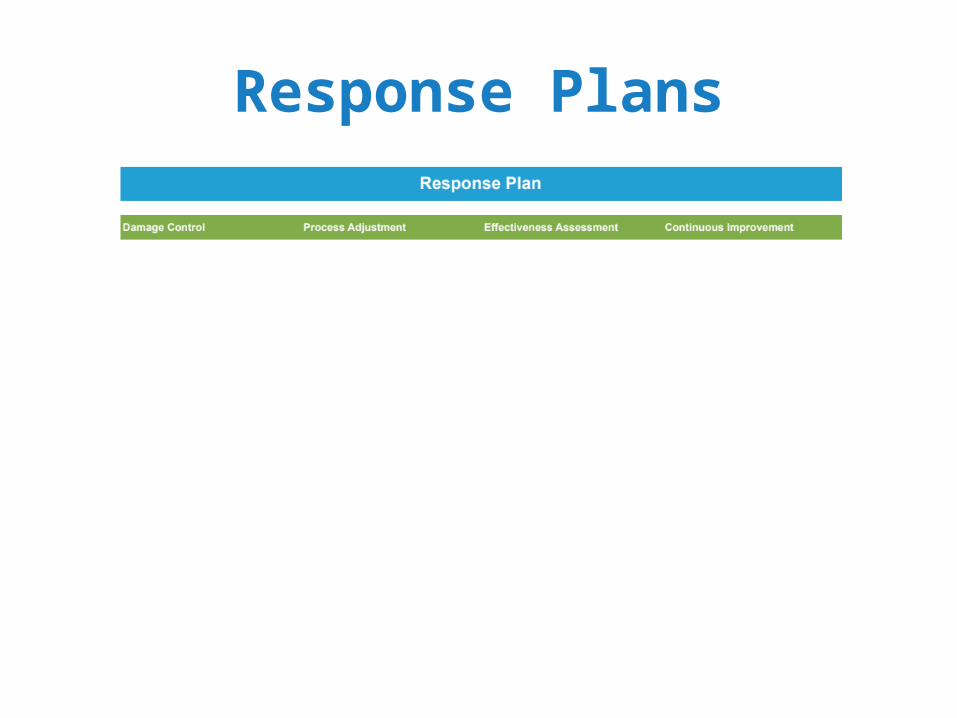
Response Plans

Next Steps
How can the benefits derived from this project be translated to other processes or
groups in the company?

Lessons Learned
Document any lessons learned from your Six Sigma improvement project experience.

Appendix
Include in the appendix any supporting documentation, process maps, data charts that you may use in your panel review to
respond to questions or provide evidence of tool applications.


