PROMOTING EXCELLENCE IN GOVERNMENT
Demographics, Projections, and College Readiness
Matt HauerApplied Demography Program

Themes to Highlight
• 1) Rapid Population Growth
• 2) Changing Racial and Ethnic Composition
• 3) Aging
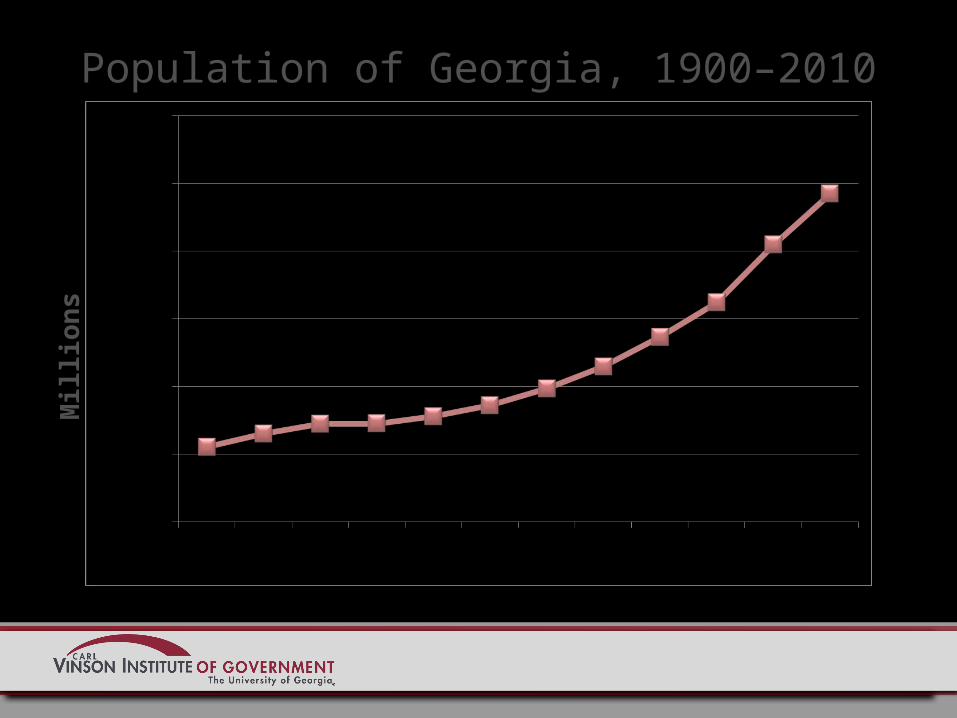
Population of Georgia, 1900–2010M
illio
ns
Source: US Census Bureau

Components of Change, 1940–2009
1,020,304
Source: US Census Bureau
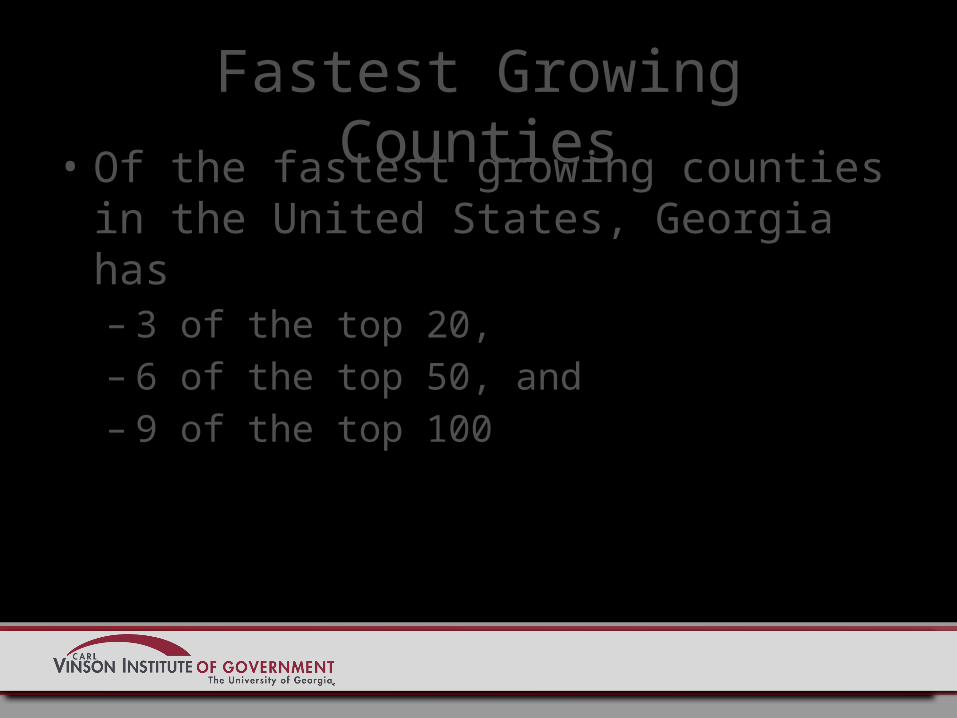
Fastest Growing Counties
• Of the fastest growing counties in the United States, Georgia has– 3 of the top 20,– 6 of the top 50, and– 9 of the top 100
Source: US Census Bureau

Fastest Growing Counties: 9 of 100
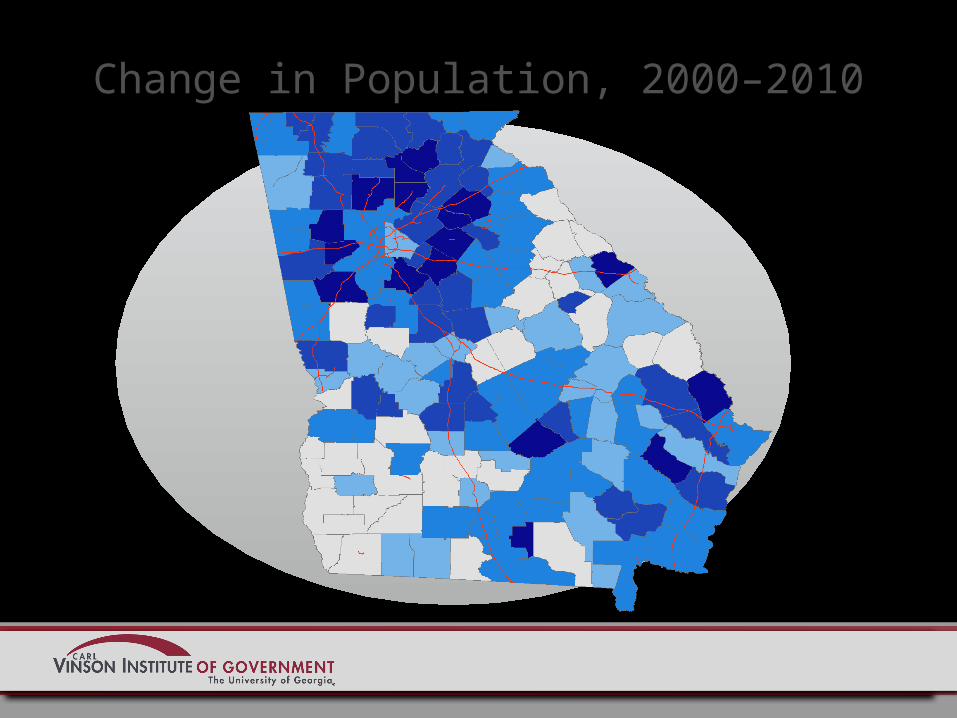
Change in Population, 2000–2010
Source: US Census Bureau

Change in Population, 2010–2013
Source: US Census Bureau
82 Counties have lost population since 2010.
35 Counties have negative natural increase.
93 Counties have negative net migration.
6 counties account for 2/3 of all Pop growth since 2010.

1970-1980 1980-1990 1990-2000 2000-2010 2010-20130%
10%
20%
30%
40%
50%
60%
70%
80%
Figure 1. Net Migration as a Percentage of Population Change for Georgia

1) Rapid Population Growth/Decline

Rapid Growth in Urban Areas…
• Of the 10 most populous Metropolitan Areas in the US…
Non-Southern Cities Southern Cities0.00%
5.00%
10.00%
15.00%
20.00%
25.00%

… Declining or Slow Growth in Rural Areas

Georgia’s Race Distribution, 1980
72%
27%
1% 1%
White Black Hispanic Other
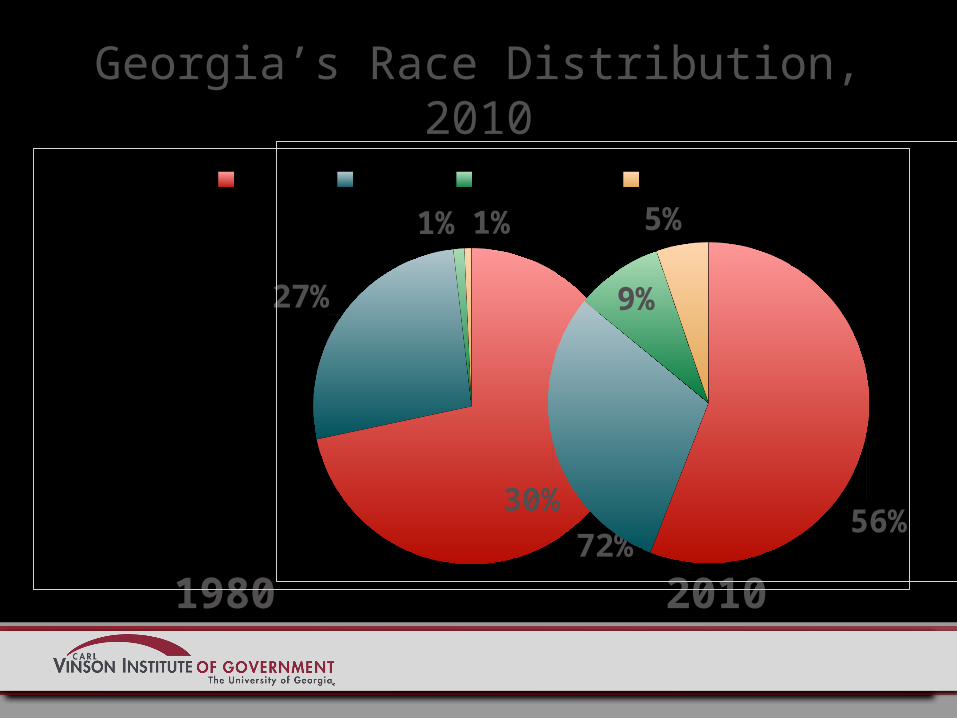
Georgia’s Race Distribution, 2010
1980 201072%
27%
1% 1%
White Black Hispanic Other
56%30%
9%
5%
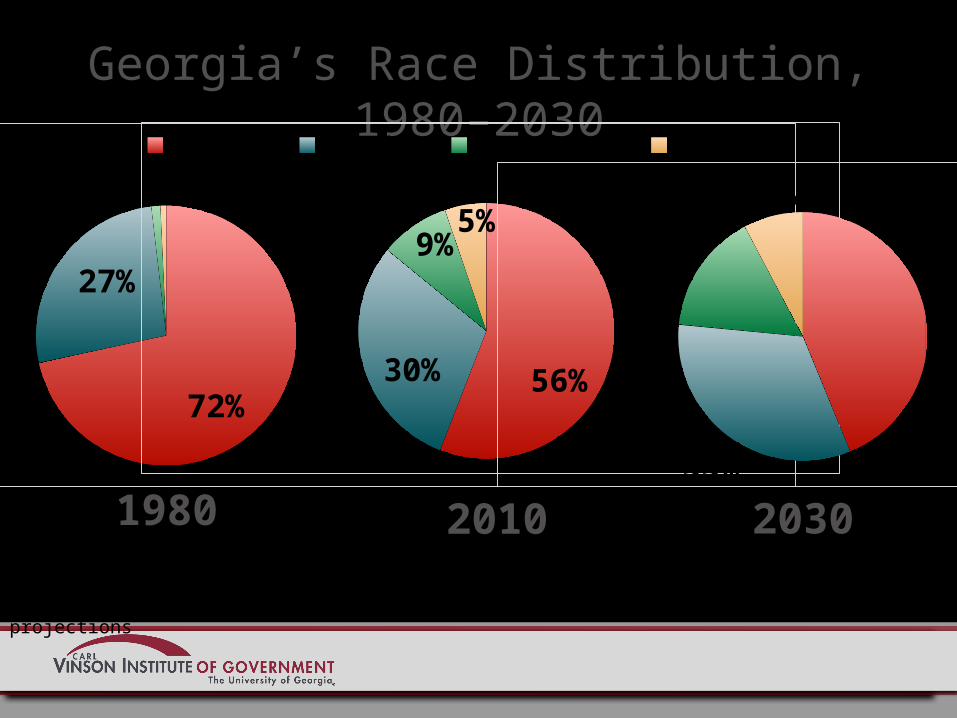
Georgia’s Race Distribution, 1980–2030
72%
27%
1% 1%White Black Hispanic Other
56%30%
9%5%
1980 2010
44%33%
16%8%
2030
Source: US Census Bureau, and internal population projections

Race and Ethnic Population Change, 1980–2010
1980 1990 2000 20100
2,000,000
4,000,000
6,000,000
8,000,000
10,000,000
12,000,000
OtherHispanicBlackWhiteP
op
ula
tio
n
Source: US Census Bureau

Gwinnett County has the largest
New Immigrant
Asian population.
Percent Asian Percent Change
County 1990 2000 2010 1990–2010
Henry 0.6% 1.8% 3.0% 1,753%
Gwinnett 2.9% 7.2% 10.7% 739%
Fulton 1.3% 3.0% 5.6% 519%
Cobb 1.8% 3.1% 4.5% 291%Henry
County is one of the four fastest
growing counties in
the U.S.
Source: US Census Bureau

Growth, 2000–2010
Number Change
White 285,259
Black 579,335
Other 218,144
Hispanic 418,462
Source: US Census Bureau

Growth, 2000–2010
Number Change
Percent Change
White 285,259 5.6%
Black 579,335 24.8%
Other 218,144 74.9%
Hispanic 418,462 96.1%
Source: US Census Bureau

Growth, 2000–2010
Number Change
Percent Change
Annual Growth Rate
White 285,259 5.6% 0.6%
Black 579,335 24.8% 2.5%
Other 218,144 74.9% 6.4%
Hispanic 418,462 96.1% 7.8%
Source: US Census Bureau
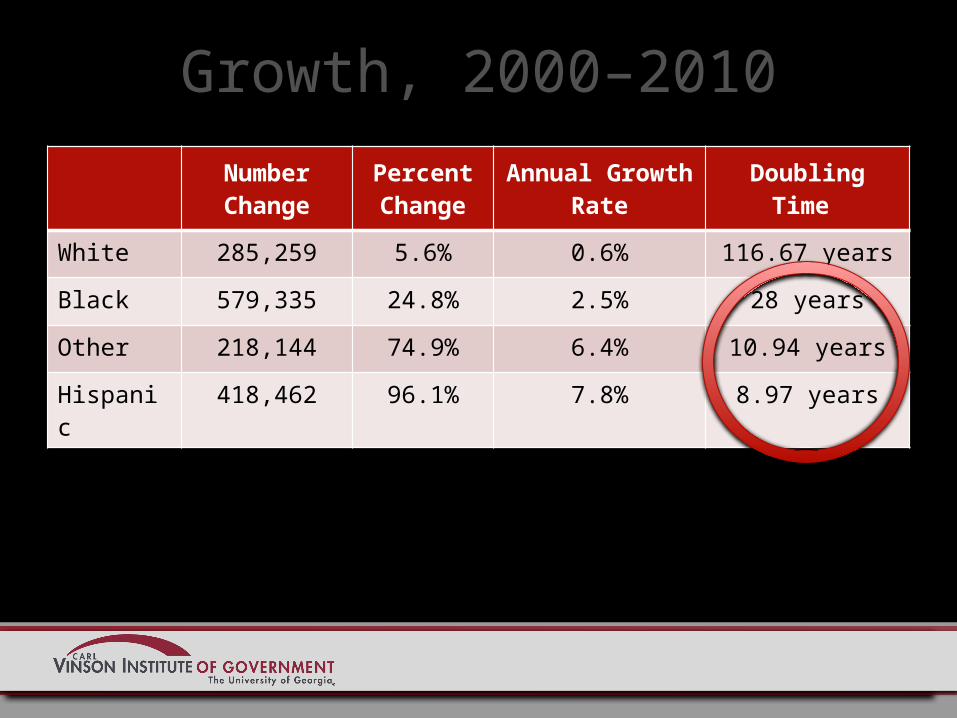
Growth, 2000–2010
Number Change
Percent Change
Annual Growth Rate
Doubling Time
White 285,259 5.6% 0.6% 116.67 years
Black 579,335 24.8% 2.5% 28 years
Other 218,144 74.9% 6.4% 10.94 years
Hispanic 418,462 96.1% 7.8% 8.97 years
Source: US Census Bureau

Change in White Population, 2000–2010
Source: US Census Bureau

Change in Black Population, 2000–2010
Source: US Census Bureau

Change in Hispanic Population, 2000–2010
Source: US Census Bureau

Where Do Babies Come From?Demographic Perspective
Number of Women of Childbearing Age

Total Fertility Rate, 2000
Total Fertility Rate
Statewide 2.13
Source: GA Vital Statistics

Total Fertility Rate, 2000
Total Fertility Rate
Statewide 2.13
White 1.96
Black 2.22
Other 1.44
Hispanic 3.53
Source: GA Vital Statistics

Total Fertility Rates 2000–2009
2000 2001 2002 2003 2004 2005 2006 2007 2008 20091.4
1.5
1.6
1.7
1.8
1.9
2.0
2.1
2.2
2.3
Black
White
Source: Internal Estimates

The “Browning” of the South…A Declining Share of White Population
A Steady/Increasing Black Population
A Rapidly Increasing Latino Population
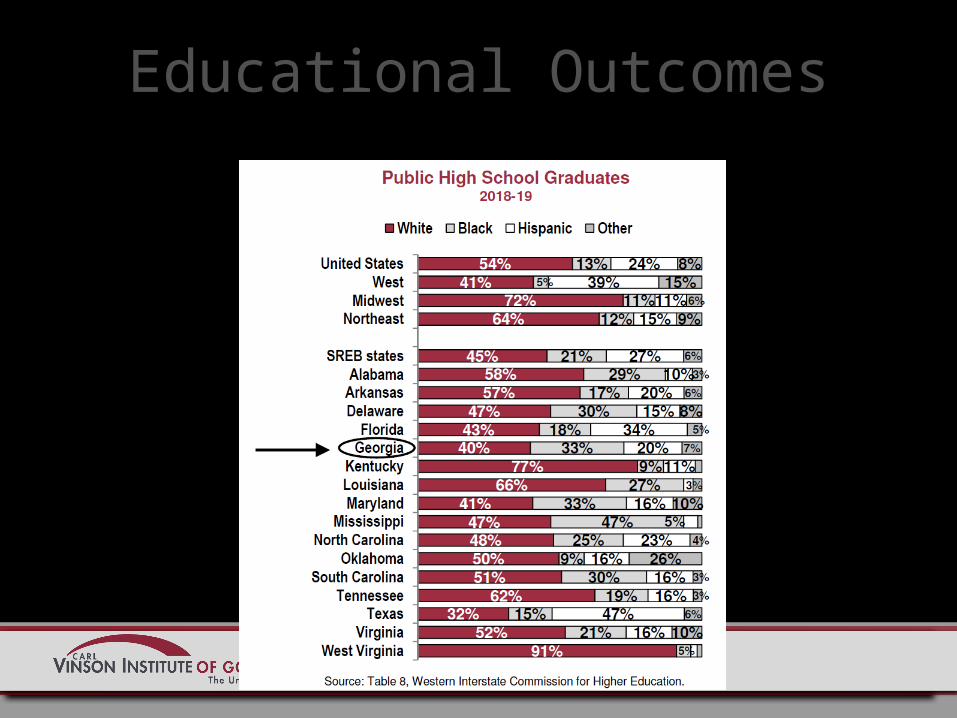
Educational Outcomes

Source: Pew Hispanic Center

Population Change 1990–2010
% Increase 1990-2010
Under 25 51%
25–44 25%
45–64 111%65–80 53%80+ 76%
Source: US Census Bureau

Mock Projection
1990
5–24 2.0
25–44 2.2
45–64 1.2
65–80 0.6

Mock Projection
1990 2010
5–24 2.0 2.7
25–44 2.2 2.7
45–64 1.2 2.4
65–80 0.6 0.9

Mock Projection
1990 2010 2030
5–24 2.0 2.7
25–44 2.2 2.7 2.7
45–64 1.2 2.4 2.7
65–80 0.6 0.9 2.4

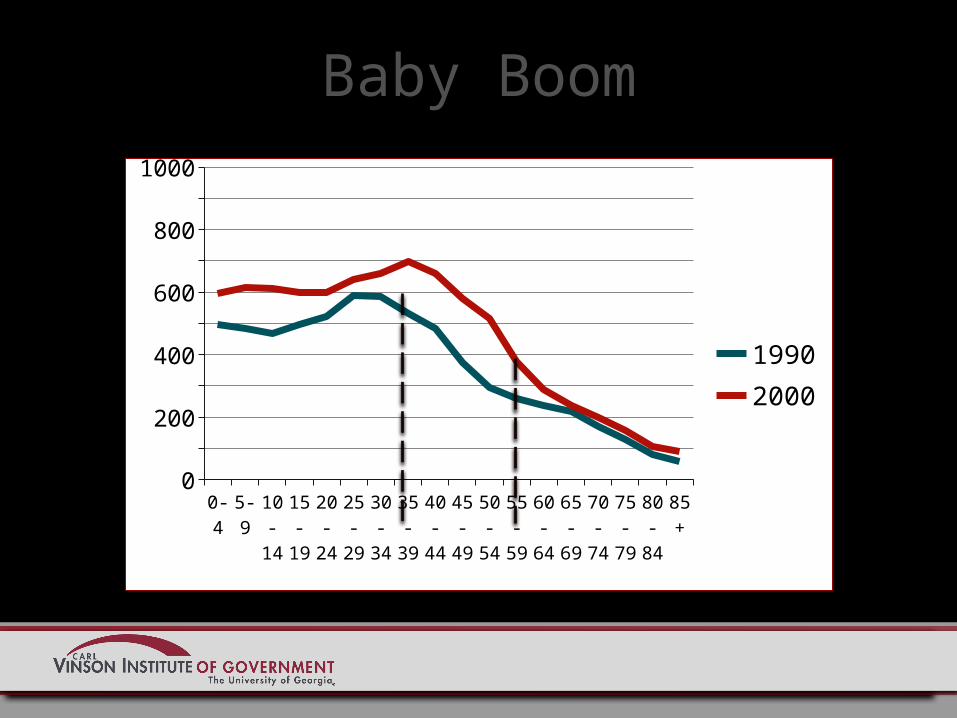
Baby Boom
0-4
5-9
10-
14
15-
19
20-
24
25-
29
30-
34
35-
39
40-
44
45-
49
50-
54
55-
59
60-
64
65-
69
70-
74
75-
79
80-
84
85+
0
100
200
300
400
500
600
700
800
900
1000
1990
Baby Boom
0-4
5-9
10-
14
15-
19
20-
24
25-
29
30-
34
35-
39
40-
44
45-
49
50-
54
55-
59
60-
64
65-
69
70-
74
75-
79
80-
84
85+
0
100
200
300
400
500
600
700
800
900
1000
19902000

Baby Boom
0-4
5-9
10-
14
15-
19
20-
24
25-
29
30-
34
35-
39
40-
44
45-
49
50-
54
55-
59
60-
64
65-
69
70-
74
75-
79
80-
84
85+
0
100
200
300
400
500
600
700
800
900
1000
199020002010

Baby Boom
0-4
5-9
10-
14
15-
19
20-
24
25-
29
30-
34
35-
39
40-
44
45-
49
50-
54
55-
59
60-
64
65-
69
70-
74
75-
79
80-
84
85+
0
100
200
300
400
500
600
700
800
900
1000
1990200020102020

• Population over age 65 is expected to more than double over the next 50 years.

20-County Area around Albany Georgia

Aging
65+ 75+ 85+0%
10%
20%
30%
40%
50%
60%
70%
80%
90%
• 65+ Most Rapidly Growing age group– Only part of the Picture…
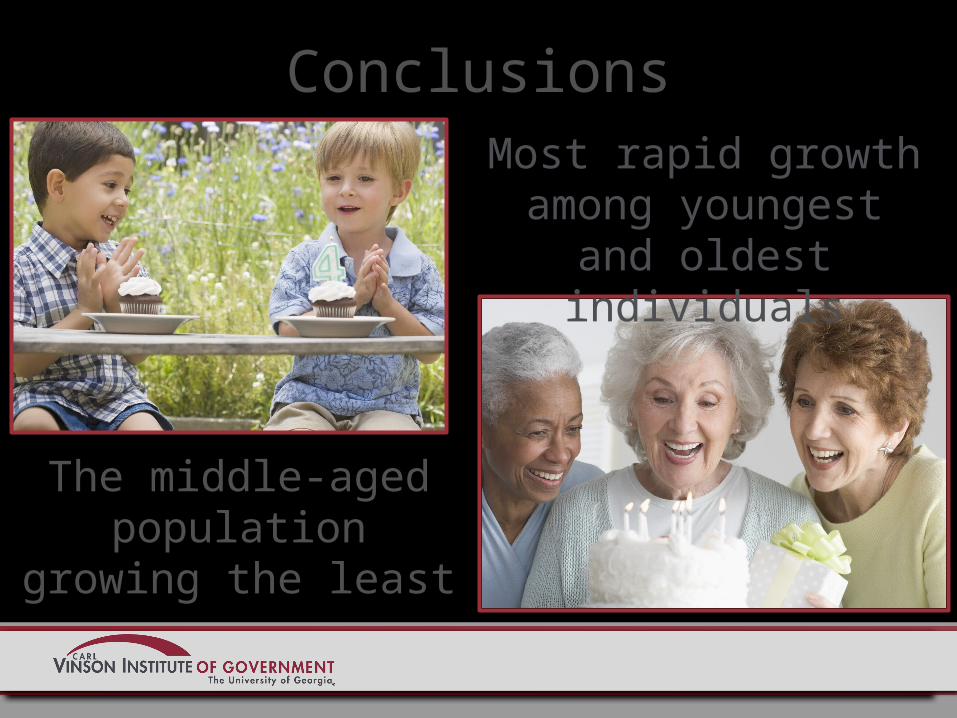
ConclusionsMost rapid growth
among youngest and oldest individuals
The middle-aged population growing the
least

Conclusions
Georgia is no longer a black and white state.

Recap
• 1) Rapid Population Growth• “Rich get richer, Poor get poorer”
• 2) Changing Racial and Ethnic Composition• “Browning of America”
• 3) Aging• “The workforce is aging”

Change in Population 18-64
• Working Age Adult growth will occur.
• Growth will occur in Non-White populations. Millions %
Total Growth 8.3 4.3%
White -14.5 -11.7%Black 2.2 9.1%Hispanic 14.7 45.4%Asian 3.7 35.3%
Source: US Census Bureau, Vintage 2012 Projections

Source: IPEDS


Trend lines
White Black Asian Latino Other66%
68%
70%
72%
74%
76%
78%
80%
82%
84%
Share of each Race Group Attending Public Undergraduate
2006-2008 2008-2010 2010-2012
2006-2008 2008-2010 2010-20120%
10%
20%
30%
40%
50%
60%
70%
80%
90%
100%
58% 51% 50%
34%36% 38%
3% 4% 4%3% 6% 6%2% 3% 3%
Race/Ethnic Shares of Total Public Un-dergraduate Enrollment
White Black Asian Latino Other