

Public hearings on cost to communicate
By Alan Knott-CraigCell C CEO
30 NOVEMBER 2012
2 PUBLIC HEARINGS ON COST TO COMMUNICATE – 30 NOVEMBER 2012
THE CELL C DELEGATION
EXECUTIVE MANAGEMENT
Alan Knott-CraigChief Executive Officer
Graham MackinnonChief Legal Officer
Robert PasleyChief Strategy Officer
Mothibi RamusiExecutive : Regulatory Affairs
Joshua MoelaExecutive : Government Relations
Kevin SchmidtExecutive: Office of CEO
SHAREHOLDER REPRESENTATIVES
General Lehlohonolo Moloi
Mr Yusuf Mahomed

3 PUBLIC HEARINGS ON COST TO COMMUNICATE – 30 NOVEMBER 2012
PRE-1994 TELECOMMUNICATIONS
• Telkom
• Fewer than 4 million fixed line customers- carrying 70% of Africa’s traffic
• C450 mobile network- 15,000 customers
• Cost of mobile phone = R15,000
• Limited metro coverage

4 PUBLIC HEARINGS ON COST TO COMMUNICATE – 30 NOVEMBER 2012
1994 – THE BIRTH OF THE MOBILE INDUSTRY IN SA
• Mandate and objectives:- Penetration
o Subscriber Growth
- Coverage
o Infrastructure investment
- Competition
• Barriers to Entry:- Physical distribution
- Credit vetting (advent of prepaid)
- Handset prices (R2,000+ which is R6,000+ in today’s prices)
- Coverage footprint
5 PUBLIC HEARINGS ON COST TO COMMUNICATE – 30 NOVEMBER 2012
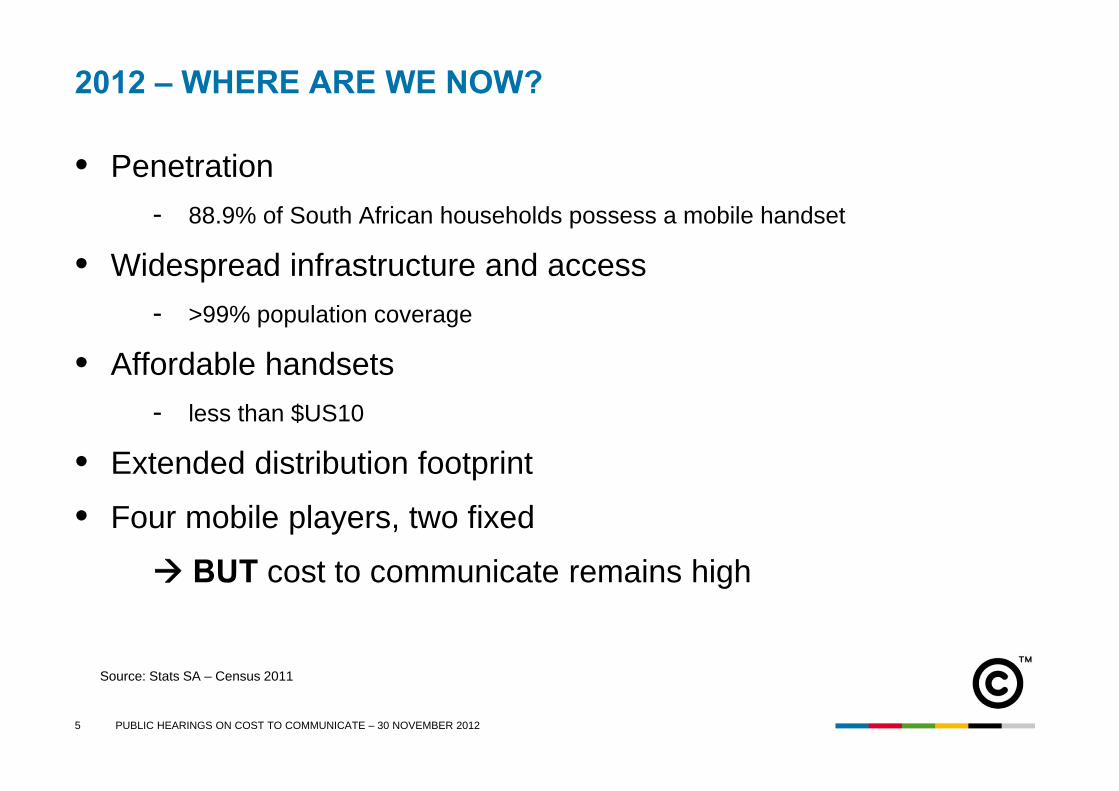
2012 – WHERE ARE WE NOW?
• Penetration- 88.9% of South African households possess a mobile handset
• Widespread infrastructure and access - >99% population coverage
• Affordable handsets- less than $US10
• Extended distribution footprint
• Four mobile players, two fixed
BUT cost to communicate remains high
Source: Stats SA – Census 2011

6 PUBLIC HEARINGS ON COST TO COMMUNICATE – 30 NOVEMBER 2012
THE ROLE OF THE 3RD AND 4TH OPERATORS
• Bring down cost of communications
• Requires sustainable business model
• Requires meaningful market power / market share
• Substantial barriers to competition from incumbents:• Dominant infrastructure base
• Dominant distribution base
• Ability to out spend on branding and marketing
• High MTRs puts effective floor under retail competition
• On-net call pricing routinely offered below MTR

7 PUBLIC HEARINGS ON COST TO COMMUNICATE – 30 NOVEMBER 2012
SA COST TO COMMUNICATE (2012 ITU REPORT)The cause of this has been a lack of real retail price competition- due to lack of pricing power from the smaller operators (+/- 10% revenue market share)
Source: ITU 2012 – Measuring the Information Society (SA 77 out of 82)All countries with GNI > USD5,000 per capita

8 PUBLIC HEARINGS ON COST TO COMMUNICATE – 30 NOVEMBER 2012
TELECOMMUNICATIONS MARKET From launch in 1994 the mobile operators grew rapidly, SIM penetration exceeding 100% by late-2008
1995 1996 1997 1998 1999 2000 2001 2002 2003 2004 2005 2006 2007 2008 2009 2010 2011 2012SA population 39.3 40.2 41.0 41.9 42.7 43.5 44.4 45.1 45.8 46.5 47.2 47.9 48.6 49.3 50.0 50.7 51.4 52.1Mobile SIMs 0.3 0.6 1.0 1.8 3.3 5.2 8.3 10.8 13.8 18.0 22.9 32.2 39.3 44.8 51.4 50.5 55.5 63.2Fixed lines 3.8 3.9 4.3 4.6 5.1 5.5 5.0 4.9 4.8 4.8 4.8 4.7 4.6 4.5 4.5 4.3 4.2 4.0
Mill
ions
SA Telecoms Customer Growth
Mobile SIM penetration exceeding 100% of population
Source: Stats SA, Operator reports

9 PUBLIC HEARINGS ON COST TO COMMUNICATE – 30 NOVEMBER 2012
ASYMMETRY COMPARISONThe asymmetry Cell C and 8.ta have had is relatively insignificant when compared to the asymmetry afforded to the incumbents, Vodacom and MTN
0%
100%
200%
300%
400%
500%
Y1 Y2 Y3 Y4 Y5 Y6 Y7 Y8 Y9 Y10 Y11 Y12 Y13 Y14Years from launch
Asymmetry comparison
Vodacom/MTNCell C8.taAsymmetry against initial main
telecoms competitor
Shown until parity with incumbent
10 PUBLIC HEARINGS ON COST TO COMMUNICATE – 30 NOVEMBER 2012
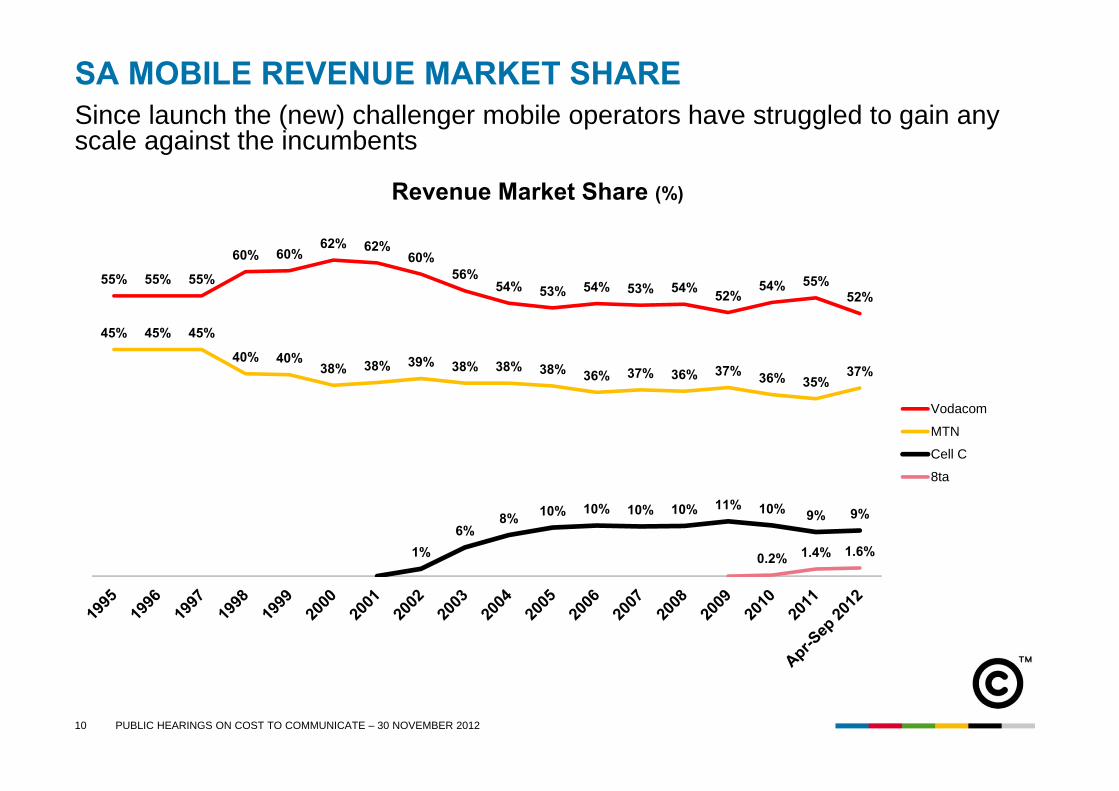
SA MOBILE REVENUE MARKET SHARESince launch the (new) challenger mobile operators have struggled to gain any scale against the incumbents
55% 55% 55%
60% 60%62% 62%
60%56%
54% 53% 54% 53% 54% 52%54% 55%
52%
45% 45% 45%
40% 40%38% 38% 39% 38% 38% 38% 36% 37% 36% 37% 36% 35%
37%
1%6%
8% 10% 10% 10% 10% 11% 10% 9% 9%
0.2% 1.4% 1.6%
Revenue Market Share (%)
Vodacom
MTN
Cell C
8ta

11 PUBLIC HEARINGS ON COST TO COMMUNICATE – 30 NOVEMBER 2012
SA COST TO COMMUNICATECell C, however, has reduced significantly voice and data prices in South Africa
3.50
2.85 2.85 2.85 2.85 2.85
0.99 0.991.25 1.25
0.89 0.890.73 0.73
0.56 0.56
H1 2009 H2 2009 H1 2010 H2 2010 H1 2011 H2 2011 H1 2012 H2 2012
Cell C peak off-net retail rate Peak MTR to Vodacom/MTN
Cell C prepaid peak off-net retail rate vs. peak MTR to Vodacom/MTN(ZAR)
-72%
-55%
• Prepaid• Postpaid• Int’l
Note: Based on the lowest priced per second billing prepaid tariff

12 PUBLIC HEARINGS ON COST TO COMMUNICATE – 30 NOVEMBER 2012
SA COST TO COMMUNICATECell C’s prepaid and postpaid rates have converged
3.50
2.85 2.85
0.99
2.00 2.00 2.00
0.99
2009 2010 2011 2012
Prepaid Postpaid
Cell C prepaid vs. postpaid peak off-net retail rate(ZAR)
Note: Based on the lowest priced per second billing tariffs

13 PUBLIC HEARINGS ON COST TO COMMUNICATE – 30 NOVEMBER 2012
SA COST TO COMMUNICATEVodacom’s and MTN’s prepaid peak rates have remained almost flat, highlighting the lack of market power the challenger networks have had
2.99 2.892.75 2.75
3.00 3.00 3.00 3.00
2009 2010 2011 2012
Vodacom 4U Prepaid MTN Zone
Vodacom and MTN prepaid peak off-net retail rates(ZAR)
Source: Operator price plans with per second billing

14 PUBLIC HEARINGS ON COST TO COMMUNICATE – 30 NOVEMBER 2012
SA COST TO COMMUNICATEVodacom’s and MTN’s postpaid prices have hardly moved at all either
2.60 2.60 2.602.40
2.35 2.35 2.35 2.35
2009 2010 2011 2012
Vodacom Business Call S MTN Anytime 350
Vodacom and MTN postpaid peak off-net retail rates(ZAR)
Source: Operator price plans with per second billing

15
ZONE TARIFFSDo selected, special discounts represent real reductions in cost to communicate?
MTN.co.zaSource:
Base tariff is R3.00 The discounted rate for MTN to MTN is R2.50
The discount you get will depend on your location and the time of the day
Under here you may get a discount but only if the time is right

16 PUBLIC HEARINGS ON COST TO COMMUNICATE – 30 NOVEMBER 2012
IMPACT OF MTR REDUCTIONS ON THE INCUMBENTSBoth Vodacom and MTN EBITDA margins have improved significantly since the MTR reductions
Source: Operator reports:MTN calendar years,Vodacom to March of following year
31.0%
32.0%
33.0%
34.0%
35.0%
36.0%
37.0%
38.0%
2008 2009 2010 2011
EBIT
DA
% Vodacom
MTN

17 PUBLIC HEARINGS ON COST TO COMMUNICATE – 30 NOVEMBER 2012
THE SCOPE FOR FURTHER PRICE REDUCTIONSExample: Peak Off-Net Call
99.0c
56.0c
26.0c
12.2c
4.8c
Retail Tariff VATDistribution
MTR
To Fund:- Network Costs- National Roaming- Admin Costs- FundingEtc… National
Roaming
Cell C’s current pricing is not sustainable unless:1. MTRs are reduced significantly
2. Smaller operators / new entrants get a significant and sustained MTR asymmetry

18 PUBLIC HEARINGS ON COST TO COMMUNICATE – 30 NOVEMBER 2012
RELATIVE SIGNIFICANCE OF OFF-NETThe significance of off-net traffic is disproportionately greater for the smaller operators / new entrants than for the incumbents
Vodacom Cell C
Originating Off Net and On Net traffic by operator
% Off Net % On Net
Cell C incurs significantly higher interconnect costs
39%
61%
80%
20%
Source: Cell C market estimates
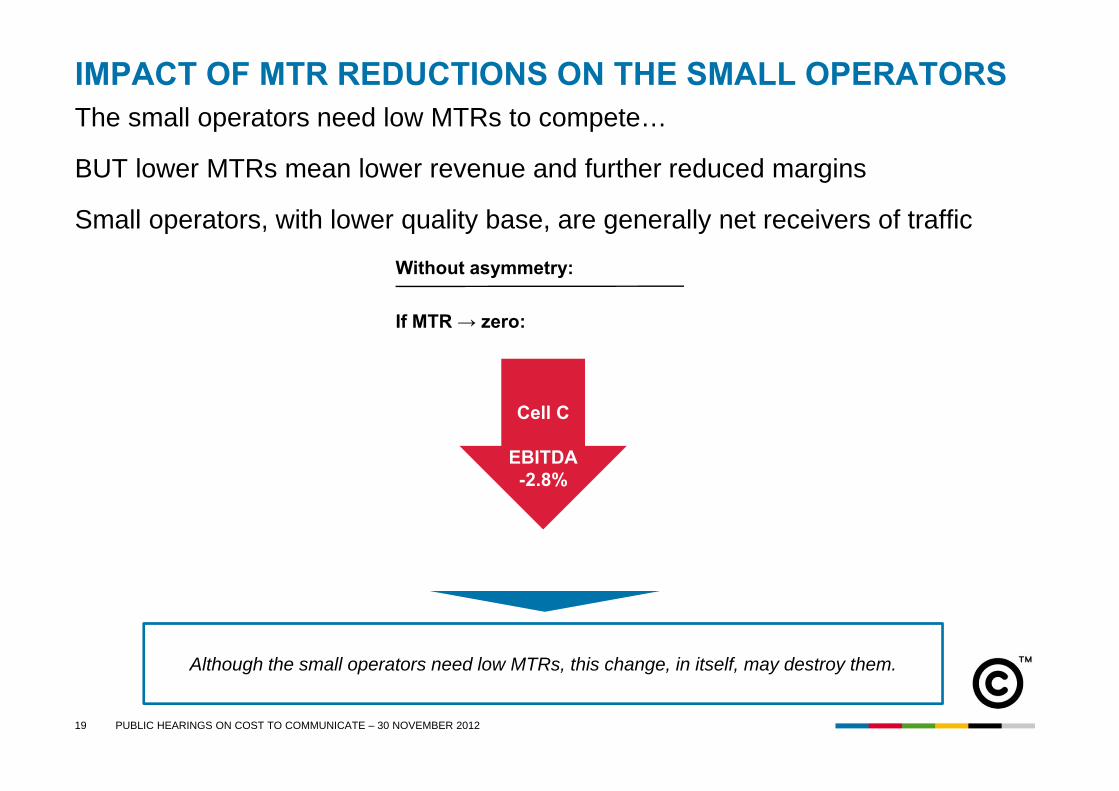
19 PUBLIC HEARINGS ON COST TO COMMUNICATE – 30 NOVEMBER 2012
IMPACT OF MTR REDUCTIONS ON THE SMALL OPERATORSThe small operators need low MTRs to compete…
BUT lower MTRs mean lower revenue and further reduced margins
Small operators, with lower quality base, are generally net receivers of traffic
Although the small operators need low MTRs, this change, in itself, may destroy them.
Cell C
EBITDA-2.8%
Without asymmetry:
If MTR → zero:

20 PUBLIC HEARINGS ON COST TO COMMUNICATE – 30 NOVEMBER 2012
LOCAL VS. INTERNATIONAL TERMINATION RATESIt is often more expensive to terminate a call locally than internationally
South Africa United Kingdom United States China India
International mobile termination rates
56c
24c
4c10c 10c

21 PUBLIC HEARINGS ON COST TO COMMUNICATE – 30 NOVEMBER 2012
IMPACT OF MTR ASYMMETRY ON CELL CWhile asymmetric MTRs have helped Cell C to significantly lower mobile prices, the impact on the incumbent operators has been negligible
There is still plenty of room for a higher and sustained MTR asymmetry.
Impact of 20% asymmetry on operators’ EBITDA margin in 2011
Cell C Vodacom MTN
+3.2%
-0.4% -0.4%

22 PUBLIC HEARINGS ON COST TO COMMUNICATE – 30 NOVEMBER 2012
SA MOBILE SUBSCRIBER MARKET SHARE FORECASTDo market analysts foresee significant change to current market dynamics?
Source: Wireless Intelligence (GSM Media LLC)

23 PUBLIC HEARINGS ON COST TO COMMUNICATE – 30 NOVEMBER 2012
IMPACT OF EARLIER MTR ASYMMETRY ON INCUMBENTS400%+ asymmetry greatly assisted the current incumbents to achieve scale
Similar levels of sustained asymmetry could profoundly change the market
Example: Vodacom for year ended March 2000This was the point at which mobile lines overtook fixed lines – the impact of asymmetry in the 6-years prior to this was EVEN MORE MATERIAL
Vodacom EBITDA%Of Vodacom reported 36.3% EBITDA, 20.8% was due to asymmetry.
Without asymmetry, Vodacom EBITDA would have been 15.5%+20.8%
Source: Telkom SA prospectus

24 PUBLIC HEARINGS ON COST TO COMMUNICATE – 30 NOVEMBER 2012
NEXT-GENERATION BROADBAND NETWORKNation-wide deployment of LTE will not be achievable with infrastructure competition
5c/Gb?
Dat
a pr
icin
gD
ata
Spee
dPl
ayer
s
R22+/Mb R8.4/Mb 5c/Mb
1993 1998 2003 2008 2013 2015
1.2kb/s 384kb/s 7.2mb/s64kb/s 1.2mb/s 42mb/s 1gb/s
• LTE being deployed when 3G coverage is in infancy:- Less than 85%
population- Less than 10%
geographic• LTE Advanced will follow
rapidly• SA needs LTE (and LTE
Advance) but also ubiquitous coverage
• Not achievable with:- Infrastructure
competition- Fragmented spectrum
allocations
25 PUBLIC HEARINGS ON COST TO COMMUNICATE – 30 NOVEMBER 2012
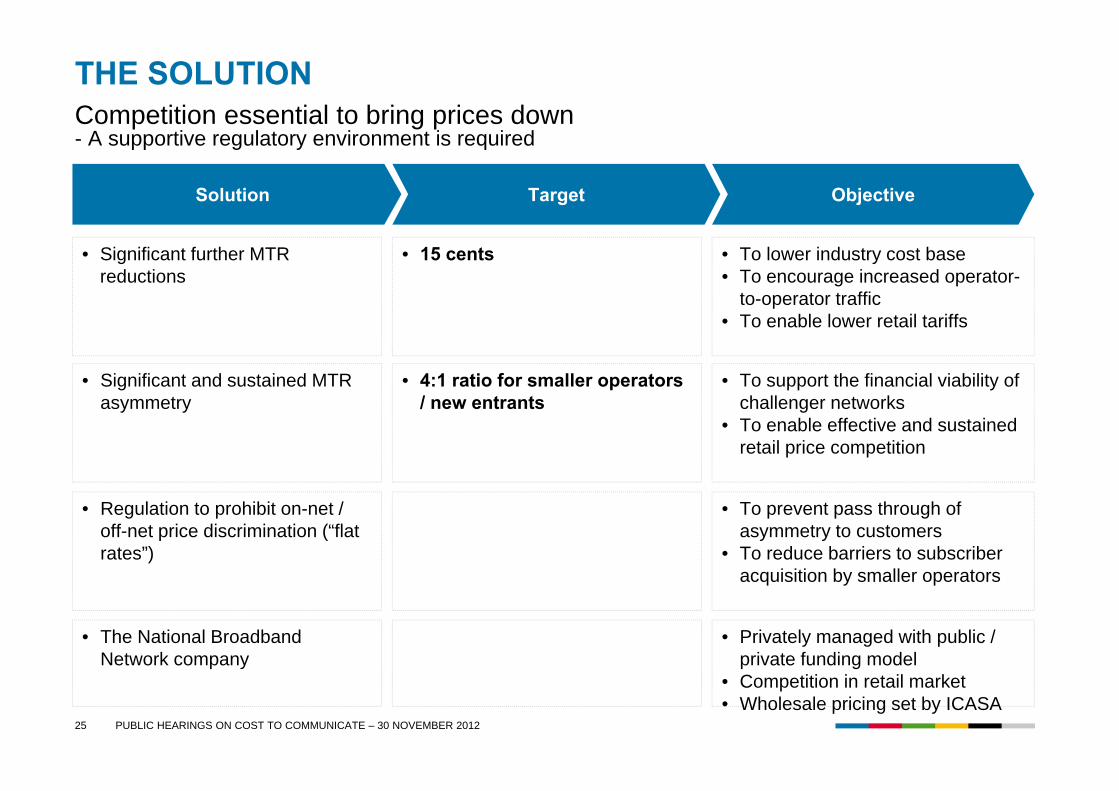
THE SOLUTIONCompetition essential to bring prices down- A supportive regulatory environment is required
• Significant further MTR reductions
Solution Target Objective
• 15 cents • To lower industry cost base• To encourage increased operator-
to-operator traffic• To enable lower retail tariffs
• Significant and sustained MTR asymmetry
• 4:1 ratio for smaller operators / new entrants
• To support the financial viability of challenger networks
• To enable effective and sustained retail price competition
• Regulation to prohibit on-net / off-net price discrimination (“flat rates”)
• To prevent pass through of asymmetry to customers
• To reduce barriers to subscriber acquisition by smaller operators
• The National Broadband Network company
• Privately managed with public / private funding model
• Competition in retail market• Wholesale pricing set by ICASA

26 PUBLIC HEARINGS ON COST TO COMMUNICATE – 30 NOVEMBER 2012
Thank you!


