
Report of the Sub-Committee on Financing Urban Infrastructure
November, 2011 Page 1
High Level Committee on Financing Infrastructure
REPORT OF THE
SUB-COMMITTEE
ON FINANCING
URBAN INFRASTRUCTURE
IN THE 12TH PLAN Ministry of Urban Development Government of India http://urbanindia.nic.in March 2012
Report of the Sub-Committee on Financing Urban Infrastructure
March, 2012 Page 2
INDEX
1. Sub-Committee on Financing Infrastructure ..........................................................................7
2. Introduction ............................................................................................................................7
3. Status of Urban Infrastructure .............................................................................................. 10
3.1 Water supply .................................................................................................................. 10
3.2 Sanitation ........................................................................................................................ 10
3.3 Solid Waste Management ............................................................................................... 10
3.4 Urban Transport.............................................................................................................. 11
4. Shift in GDP towards Urban Centres .................................................................................... 11
5. Status and Issues in Urban Financing ................................................................................... 12
6. Investment for the Core Urban Infrastructure/Municipal Services under the Eleventh Five
Year Plan .................................................................................................................................. 16
6.1 Actual outlay ................................................................................................................... 17
7. Urban Infrastructure Provision – Norms, Gap and Financial requirements ........................ 19
7.1 Service Backlog in Water Supply ................................................................................... 19
7.2 Service Backlog in Sewage Management ...................................................................... 20
7.3 Service Backlog in Solid Waste Management ................................................................ 20
7.4 Backlog in Urban Roads .................................................................................................. 21
7.5 Service Backlog in Urban Transport ............................................................................... 22
7.6 Per Capita Investment Costs .......................................................................................... 22
7.7 Capital Expenditure Estimates by City Size class .......................................................... 23
7.8 Phasing Plan of HPEC Estimates ..................................................................................... 24
7.9 Operation and Maintenance cost estimated for XII Plan Period .................................... 25
7.10 Investment during the 12th Plan Period- Recommendation of the Sub-Committee ...... 28
8. Financing Framework for the Twelfth Plan .......................................................................... 30
8.1 Municipal Actions for Stimulation of Own Sources ......................................................... 35
8.2 Devolution of fiscal powers and funds ............................................................................ 36
8.3 Public Private Partnership (PPP) .................................................................................... 39
8.4 Land based financing ................................................................................................. 45

Report of the Sub-Committee on Financing Urban Infrastructure
March, 2012 Page 3
8.5 Municipal Borrowings ..................................................................................................... 47
8.6 Dedicated Urban Transport Fund at Central Government level .................................... 49
9. Capacity Building for the Local Bodies ................................................................................ 51
10. Issues relating to financing urban infrastructure and related issues which have a bearing
on investment in the sector during the Twelfth Plan ............................................................... 53
Annexure I: OM on Constitution of Sub-Group on financing urban infrastructure in the Twelfth Plan .......................................................................................................................... 56
Annexure II: .......................................................................................................................... 57
Outlay for Urban Sector during Eleventh Plan: 2007-11 ...................................................... 57
Annexure III: Application of Revenue Instruments .............................................................. 58
Report of the Sub-Committee on Financing Urban Infrastructure
March, 2012 Page 4
LIST OF TABLES
Table 1: Shift of Population from Rural to Urban ........................................................................8 Table 2: Current status of municipal finances of all states: 2002-03 to 2007-08 ...................... 12 Table 3: Funds Requirement-Urban Basic Services ................................................................. 16 Table 5: Service backlog in Water Supply .............................................................................. 20 Table 6: Service Backlog in Sewage Management .................................................................. 20 Table 7: Service Backlog in Solid Waste Management ........................................................... 21 Table 8: Service Backlog in Urban Roads ................................................................................ 21 Table 9: Service Backlog in Urban transport ........................................................................... 22 Table 10: Per Capita Investment Cost (PCIC) arrived at by HPEC for Estimation of Investment Requirement .......................................................................................................... 23 Table 11: Capital Expenditure Estimates by City Size Class ................................................... 24 Table 12: Projected Capital Expenditure during 12th Plan by HPEC ...................................... 25 Table 13: Projected Revenue Expenditure during 12th Plan by HPEC ................................... 26 Table 14: Financing Framework by HPEC (12th Plan figures in % of GDP at current prices) . 27 Table 15: Investment over the next plan period as projected by HPEC for next 20 years with backlog covered in 15 years ................................................................................................... 29 Table 16: Action Plan for Fiscal Monitoring and Control Innovations ..................................... 37

Report of the Sub-Committee on Financing Urban Infrastructure
March, 2012 Page 5
LIST OF FIGURES
Figure 1: Projected population in different size class of Cities .................................................9 Figure 2: Current Status of Municipal finance across states, 2007-08 ..................................... 13 Figure 3: Unsustainable cycle of events .................................................................................. 43 Figure 4: Seamless Cycle of Sustainability .............................................................................. 44 Figure 5: Contibution to Urban Transport Fund from the identified sources .......................... 51

Report of the Sub-Committee on Financing Urban Infrastructure
March, 2012 Page 6
LIST OF ABBREVIATIONS ADB Asian Development bank BOOT Built Own Operate Transfer BOT Built Operate Transfer BRTS Bus Rapid Transit System CAG Comptroller and Auditor General of India CAPEX Capital Expenditure CFC Central Finance Commission CPCB Central Pollution Control Board DEA Double Entry Accounting FSI Floor Space Index GDP Gross Domestic Product GIS Geographical Information System HPEC High Powered Expert Committee HUDCO Housing and Urban Development Corporation Limited IIFCL India Infrastructure Finance Company Limited IIPDF India Infrastructure Project Development Fund IL&FS Infrastructure Leasing and Financial Services Ltd. JnNURM/ JNNURM Jawaharlal Nehru National Urban Renewal Mission LBFL Local Bodies Finance List LIC Life Insurance Corporation MRTS Mass Rapid Transit System MT Million Tonnes NDC Committee National Development Council NSS National Sample Survey O&M Operation and Maintenance PCIC Per Capita Investment Cost PHE Public Health Engineering PMDO Public Municipal Debt Obligations PPP Public Private Partnership R&D Research and Development RBI Reserve Bank of India RCUES Regional Centre for Urban and Environmental Studies SFC State Finance Commission SWM Solid Waste management UD Urban Development ULB Urban Local Bodies

Report of the Sub-Committee on Financing Urban Infrastructure
March, 2012 Page 7
1. Sub-Committee on Financing Infrastructure
The High Level Committee on Financing Infrastructure has constituted a sub-
committee on Financing Urban Infrastructure with the following terms of reference:
• Year-wise investments for the twelfth plan;
• Sources of financing (viz. debt, equity, grants etc.,) anticipated in the 11th
Plan and estimated for the twelfth plan;
• Innovative ways of financing in the twelfth plan;
• Practical measures for enhancing capacity/augmenting resources of
Municipalities, and;
• Brief note on issues relating to financing urban infrastructure and related
issues, which have a bearing on investment in the sector during the twelfth
plan.
A copy of the order of constitution and Terms of Reference of the Sub-Committee is
at Annexure I.
2. Introduction
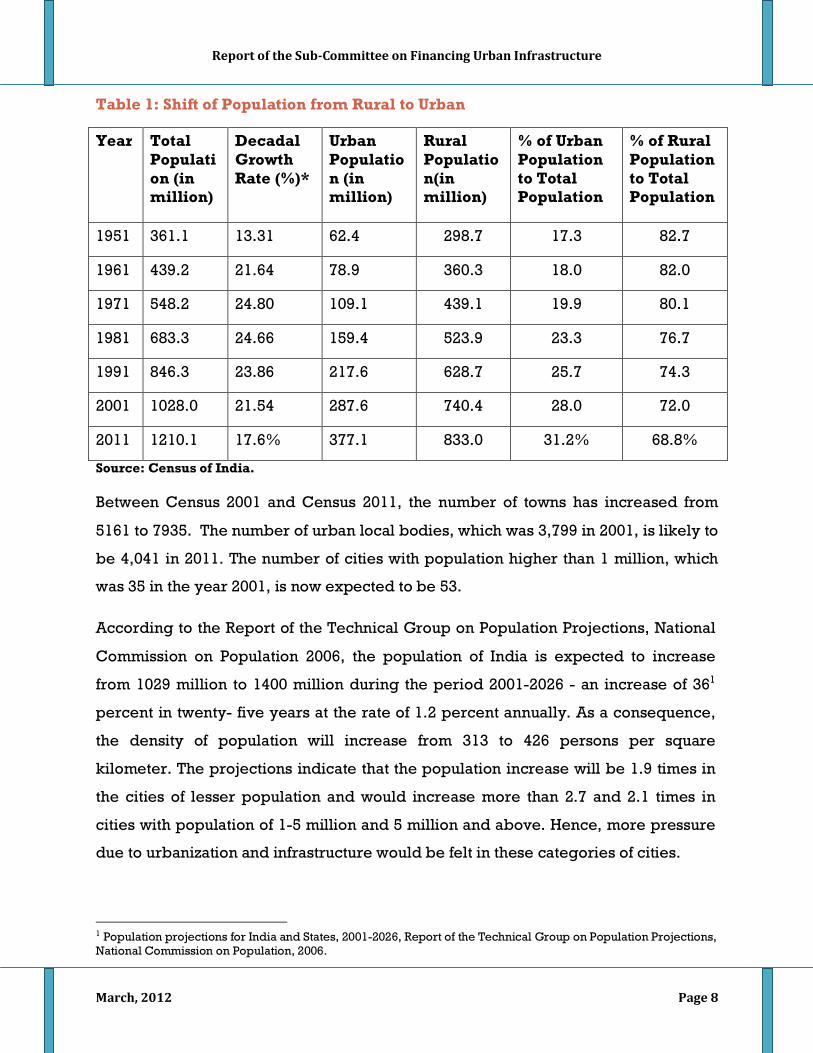
India is undergoing a transition from rural to semi-urban society. A little over 31% of
population is now living in urban areas. Details presented in Table 1 and Figure 1 below
illustrate the growing trend of urbanization. It is evident from the urbanization pattern
that the rate of development is clearly related to the rate of urbanization. States with
higher gross domestic product have higher levels of population living in urban areas.
Gujarat, Maharashtra, Tamil Nadu, Karnataka are significantly more urbanized than Uttar
Pradesh, Bihar and Orissa.
Report of the Sub-Committee on Financing Urban Infrastructure
March, 2012 Page 8
Table 1: Shift of Population from Rural to Urban
Year Total Population (in million)
Decadal Growth Rate (%)*
Urban Population (in million)
Rural Population(in million)
% of Urban Population to Total Population
% of Rural Population to Total Population
1951 361.1 13.31 62.4 298.7 17.3 82.7
1961 439.2 21.64 78.9 360.3 18.0 82.0
1971 548.2 24.80 109.1 439.1 19.9 80.1
1981 683.3 24.66 159.4 523.9 23.3 76.7
1991 846.3 23.86 217.6 628.7 25.7 74.3
2001 1028.0 21.54 287.6 740.4 28.0 72.0
2011 1210.1 17.6% 377.1 833.0 31.2% 68.8%
Source: Census of India.
Between Census 2001 and Census 2011, the number of towns has increased from
5161 to 7935. The number of urban local bodies, which was 3,799 in 2001, is likely to
be 4,041 in 2011. The number of cities with population higher than 1 million, which
was 35 in the year 2001, is now expected to be 53.
According to the Report of the Technical Group on Population Projections, National
Commission on Population 2006, the population of India is expected to increase
from 1029 million to 1400 million during the period 2001-2026 - an increase of 361
percent in twenty- five years at the rate of 1.2 percent annually. As a consequence,
the density of population will increase from 313 to 426 persons per square
kilometer. The projections indicate that the population increase will be 1.9 times in
the cities of lesser population and would increase more than 2.7 and 2.1 times in
cities with population of 1-5 million and 5 million and above. Hence, more pressure
due to urbanization and infrastructure would be felt in these categories of cities.
1 Population projections for India and States, 2001-2026, Report of the Technical Group on Population Projections, National Commission on Population, 2006.

Report of the Sub-Committee on Financing Urban Infrastructure
March, 2012 Page 9
Figure 1: Projected population in different size class of cities
While urbanisation is widely recognized as the carrier of economic growth, public
investment in the urban sector has remained neglected in India. In fact, until the
advent of the JnNURM in December 2005, there had been no significant intervention
from the Central Government in the urban sector. Even after the JnNURM was
introduced, the situation only marginally improved. A comparison of expenditure
patterns clearly highlights government focus towards the rural sector. In the year
2009-10, Government of India invested about Rs. 75,000 crore for the rural sector,
while the central government’s disbursement under JnNURM was about Rs. 8000
crore for the same year. This makes it evident that the urban sector continues to
suffer neglect over the years, with policy and resources directed mainly towards the
rural sector. This neglect has now created a huge infrastructure challenge of having
to cater both for the new population and the backlog of the past. Given the current
level of ULB finances and the traditional low viability of projects relating to the water
Report of the Sub-Committee on Financing Urban Infrastructure
March, 2012 Page 10
supply, sewerage sector and quality public transport, the private sector has stayed
away from investment in the urban infrastructure sector.
3. Status of Urban Infrastructure
3.1 Water supply
As per Census 2011, Drinking Water within the premises is available to 71.2% of the
urban population vis-à-vis 65.4% as per Census 2001. Similarly, 20.7% of the
population has access to Drinking Water near the premises vide Census 2011 vis-à-
vis 25.2% vide Census 2001. None of the cities have 24x7 water supply. Non-
revenue water, which includes leakages of various kinds, is fairly high, being in the
range of 40 to 50 percent.
3.2 Sanitation
The challenge of sanitation in Indian cities is acute. In fact the problem of lack of
systematic sanitation facility is much worse in urban areas than in rural areas. A
Sanitation rating of 423 class-I cities done in 2009-10 by Ministry of Urban
Development, GoI revealed that only 39 cities qualified on 3 basic water quality
parameters of turbidity, residual chlorine and Thermo Tolerant Coliform bacteria.
According to Census 2011, 32.7% of the urban population has access to a piped
sewer system and 12.6% of the urban population still defecates in the open.
Installed sewage treatment capacity is only 30% as per Central Pollution Control
Board Report 2009. The capacity utilisation is around 72.2%, which means that only
about 20% of sewage generated is treated before disposal in most of the cities and
towns.
3.3 Solid Waste Management
The management and disposal of solid waste generated in Indian cities is a major
problem. According to the CPCB Report 2005, about 1,15,000 MT of municipal waste
is generated daily. Collection performance varies from city to city. Staff deployed to
manage SWM is also fairly low as per requirements. In most of the cities, waste is

Report of the Sub-Committee on Financing Urban Infrastructure
March, 2012 Page 11
transported and dumped to land fill sites. Scientific treatment and disposal of solid
waste is practically non-existent.
3.4 Urban Transport
Public transport accounts for only 22 percent of urban transport in India, compared
with 49 percent in lower middle-income countries (e.g. the Philippines, Venezuela,
Egypt) and 40 percent in upper middle-income countries (e.g. South Africa, South
Korea, Brazil). The share of public transport is declining steadily as neither the
quantity is sufficient nor the quality is satisfactory. The overall image of public
transport is still quite low. As such generally only the people with no other
alternative, move by public transport. Out of 423 class I cities, only 65 have a formal
city bus service as of 2012 and that too owing to the intervention of the Central
Government intervention through the programme of funding of buses for city
transport. In 2006, this number was only 20 cities.
4. Shift in GDP towards Urban Centres
With GDP projected to grow by 5 times over the next 20 years, Cities would be the
focus of most economic activity contributing to more than 70% of the GDP as well as
the net employment. With Urban population expected to increase to 600 million by
2031, the number of metropolitan cities with more than a million population is also
projected to increase from 35 in 2001 to 53 in 2011 and 87, by 2031. The expansion
of cities will happen in many cases through a process of peripheral expansion, with
smaller municipalities and large villages surrounding the core city becoming part of
the large metropolitan area. As more and more cities provide economies of
agglomeration, urban centres will become the principal engines for stimulating
national growth.
With nearly 70 per cent of the GDP contribution from the urban areas, and the
recent population projections indicating well over 40 per cent urbanization in the
coming decade, there is a clear need to focus attention towards the urban sector and

Report of the Sub-Committee on Financing Urban Infrastructure
March, 2012 Page 12
to provide adequate financing for urban infrastructure. This would not only be
important to sustain India’s economic growth story, but also be critical for inclusive
growth, given the strong positive effects that a prosperous urban sector has on the
rural hinterland. However, given the multiplicity of institutions involved and the
challenges of capacity availability and governance, it may be difficult to expect
immediate results, unless conscious efforts are made to bring about all round
improvement in urban infrastructure and services, besides in local governance.
5. Status and Issues in Urban Financing
The investment coming into the urban sector has traditionally bypassed the
municipalities. A study conducted by the 13th Finance Commission reveals the poor
state of finances of the municipal bodies of the country. On a per capita basis, the
total revenue of municipal bodies was a meager Rs. 733 in 2002-03 and it went up to
Rs 1430 in 2007-08.The own revenue of Municipalities (0.50 per cent of GDP) are a
little over half of their total revenue (0.94 per cent of GDP).
Table 2: Current status of municipal finances of all states: 2002-03 to 2007-08
2002-03 2007-08 Compounded Annual Growth Rate
Per capita(Rs.) Percent
Total Revenue 733 1430 16.3
Own Tax 311 492 11.6
Own Non -Tax 156 265 13.2
Own Revenue 466 757 12.1
Total Other Revenue 268 673 22.4 Total Expenditure 758 1513 16.8
Revenue Expenditure 550 915 12.6
Capital Expenditure 208 598 25.6
(Per cent of GDP at market rates)
Total Revenue 0.85 0.94
Own Revenue 0.54 0.50
Total Expenditure 0.88 1.00 Source: Thirteenth Central Finance Commission.
Report of the Sub-Committee on Financing Urban Infrastructure
March, 2012 Page 13
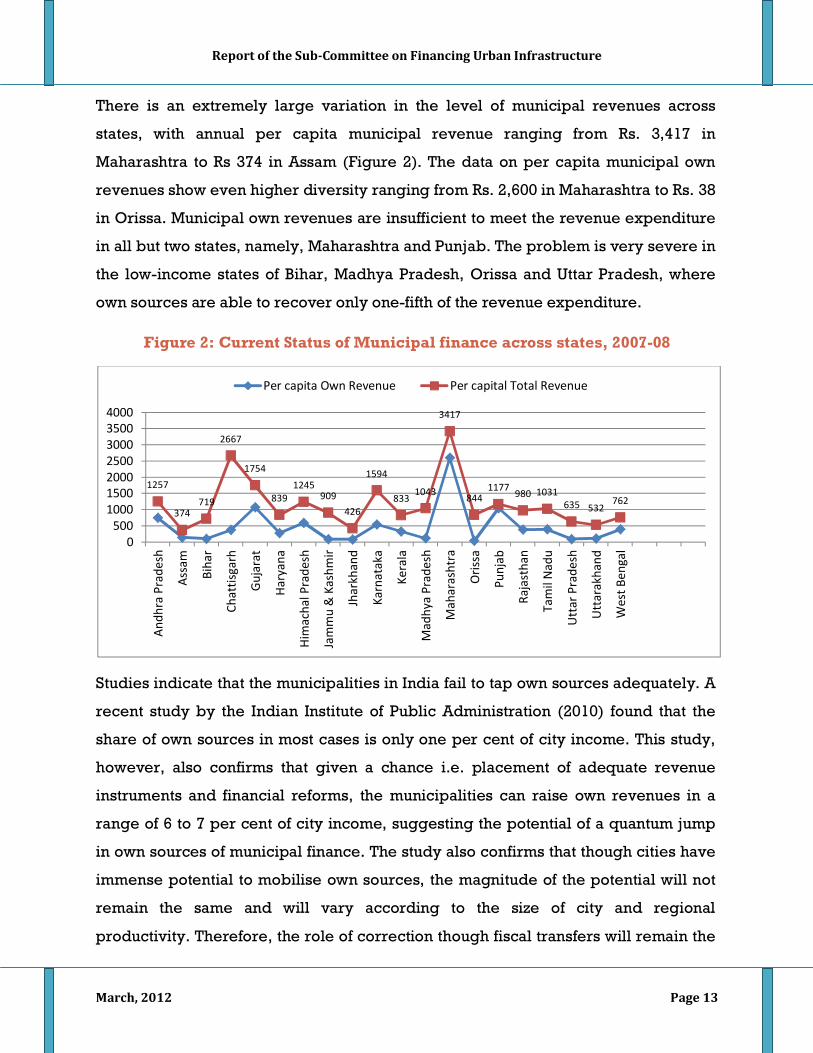
There is an extremely large variation in the level of municipal revenues across
states, with annual per capita municipal revenue ranging from Rs. 3,417 in
Maharashtra to Rs 374 in Assam (Figure 2). The data on per capita municipal own
revenues show even higher diversity ranging from Rs. 2,600 in Maharashtra to Rs. 38
in Orissa. Municipal own revenues are insufficient to meet the revenue expenditure
in all but two states, namely, Maharashtra and Punjab. The problem is very severe in
the low-income states of Bihar, Madhya Pradesh, Orissa and Uttar Pradesh, where
own sources are able to recover only one-fifth of the revenue expenditure.
Figure 2: Current Status of Municipal finance across states, 2007-08
Studies indicate that the municipalities in India fail to tap own sources adequately. A
recent study by the Indian Institute of Public Administration (2010) found that the
share of own sources in most cases is only one per cent of city income. This study,
however, also confirms that given a chance i.e. placement of adequate revenue
instruments and financial reforms, the municipalities can raise own revenues in a
range of 6 to 7 per cent of city income, suggesting the potential of a quantum jump
in own sources of municipal finance. The study also confirms that though cities have
immense potential to mobilise own sources, the magnitude of the potential will not
remain the same and will vary according to the size of city and regional
productivity. Therefore, the role of correction though fiscal transfers will remain the
1257
374719
2667
1754
8391245
909426
1594
8331043
3417
8441177 980 1031
635 532762
0500
1000150020002500300035004000
Andh
ra P
rade
sh
Assa
m
Biha
r
Chat
tisga
rh
Guja
rat
Hary
ana
Him
acha
l Pra
desh
Jam
mu
& K
ashm
ir
Jhar
khan
d
Karn
atak
a
Kera
la
Mad
hya
Prad
esh
Mah
aras
htra
Oris
sa
Punj
ab
Raja
stha
n
Tam
il N
adu
Utt
ar P
rade
sh
Utt
arak
hand
Wes
t Ben
gal
Per capita Own Revenue Per capital Total Revenue

Report of the Sub-Committee on Financing Urban Infrastructure
March, 2012 Page 14
critical and deciding factor for financial sustainability at municipal level. The High
Powered Expert Committee (HPEC) on Urban Infrastructure (January, 201) has also
recognized this situation and has mooted a constitutionally mandated revenue
sharing arrangement whereby the states would transfer to the local bodies a certain
percentage of own tax revenues in a fixed and predictable manner.
The fiscal gap of serious magnitude that the municipalities are facing can be
attributed to a host of internal and external factors. Vertical imbalance in resources
and responsibilities, fiscal dependency, borrowing constraints and inefficiency in
management of municipal services are affecting the financial viability of the local
bodies. While the municipal governments do not have adequate autonomy to fix the
rates and base of fiscal instruments available with them, they also do not have
adequate institutional capacity to raise resources within the given framework.
Instruments such as Geographical Information System (GIS) and asset accounting
etc. are not adequately employed by Local Bodies. At the same time, many areas of
revenue generation such as land and town planning etc. are still not assigned to
municipal governments in most states. Secondly, municipal bodies do not receive
adequate amount of fiscal transfers from higher levels of governments, who have
better command over the resources and relatively low level of expenditure leading
to a mismatch between finances and functions. These factors lead to a horizontal and
vertical fiscal imbalance for the local bodies and continue to cause regular addition
to the strategic fiscal gap.
Local bodies need to be provided their due place on the public finance map of the
country, which is essential to facilitate inclusive economic growth and equitable
development. We may recall that the size of the municipal fiscal sector in India is
very small compared to that in many developed and developing countries and in
relation to the expenditure requirements for public services that the urban local
bodies are mandated to deliver.
There is a mismatch between functions and finances of Municipalities, which
primarily explains the vertical imbalance. Out of 18 functions to be performed by

Report of the Sub-Committee on Financing Urban Infrastructure
March, 2012 Page 15
the municipal bodies in India only a few have a corresponding financing source
which is utilized only marginally. The 12th Schedule in the Constitution introduced
via the 74th Amendment also envisages that functions like ‘safeguarding the interests
of weaker sections of society, including the handicapped and the mentally
retarded’, ‘slum improvement and up gradation’ and ‘urban poverty alleviation’
belong to the legitimate functional domain of urban local bodies. However, there
are no commensurate resources with these institutions to discharge these functions.
Urban local finance registers only a small presence in the overall public finance in
India, which is actually declining. The total municipal revenue in India accounts for
about 0.75 per cent of the country’s GDP as against a figure of 4.5 percent for
Poland, 5 percent for Brazil and 6 percent for South Africa. In terms of both revenue
and expenditure the urban local bodies account for little above 2 per cent of the
combined revenue and expenditure of Central Government, State Governments and
Municipalities2. A study of municipal finances by the RBI in 2007 also revealed that
the total revenue of Municipalities is growing at a lower rate compared to the
growth of combined Central and State Government revenues. This is in contrast to
the situation obtaining in advanced countries, where local bodies normally account
for 20-35 per cent of the total government expenditure and the principle of
‘subsidiarity’ is regarded as a cornerstone of fiscal federalism.
2Report of the Sub-group on Finance, NDC Sub-Committee on Urbanisation.

Report of the Sub-Committee on Financing Urban Infrastructure
March, 2012 Page 16
6. Investment for the Core Urban Infrastructure/Municipal Services under the Eleventh Five Year Plan
The total fund requirement projected in the Eleventh Five Year Plan for the water
supply, sewerage and sanitation, drainage and solid waste management is given in
Table 3.
Table 3: Funds Requirement-Urban Basic Services
Sub-sector Estimated Amount (in Rs. Crore)
Urban Water Supply 53,666 Urban Sewerage and Sewage Treatment 53,168 Urban Drainage 20,173 Solid Waste Management 2,212 MIS 8 R&D and PHE Training 10 Total 129,237
The Plan proposed stepping up of Central outlay from Rs. 50,000 crore to Rs. 70,000
crore under the ongoing JnNURM so that greater thrust could be given to water
supply and sanitation sector in the urban areas. The State sector outlay, which stood
at Rs. 18,749 crore during Tenth Plan, was to be stepped up to around Rs. 35,000
crore. The plan targeted mobilization of funds to the extent of Rs. 10,000 crore
through national financial institutions such as LIC, HUDCO, IL&FS etc. Further,
mobilization of funds from external agencies viz., World Bank, JBIC (now JICA), ADB
and other agencies to the tune of about Rs. 10,000 crore was envisaged. In addition,
foreign direct investment and private sector funds upto Rs. 4,237 crore were
expected to be mobilized to support the sector activities.
In respect to urban transport the total fund requirement envisaged in 11th Five Year
Plan is given in Table 4.

Report of the Sub-Committee on Financing Urban Infrastructure
March, 2012 Page 17
Table 4: Funds Requirements – Urban Transport
Cities (population in lakh)
Total no. of towns
% of towns proposed
for 11th Plan
Average requirement
Rs. in Crore
01 – 05 370 50 40 7,400
05 – 10 39 50 400 7,800
10 – 40 28 100 930 26,040
>40 7 100 3000 21,000
MRTS 8 100 32,000
Modern Buses 38,000
Capacity Building & Transport Planning
350
Total 1,32,590
Source: Eleventh Five Year Plan, Planning Commission
The Plan proposed Central Outlay of Rs. 15, 500 crore under the ongoing Central
Programme of JnNURM, non - JnNURM budgetary support of Rs. 4,400 crore,
viability gap funding of Rs. 6,000 crore, investment by states/Municipalities to the
extent of Rs. 19,500 crore mobilization of funds to the extent of Rs. 61,190 crore
through financial institutions such as LIC, HUDCO, IL&FS etc. In addition, private
sector funds upto Rs. 26,000 crore were expected to be mobilized to support the
sector activities.
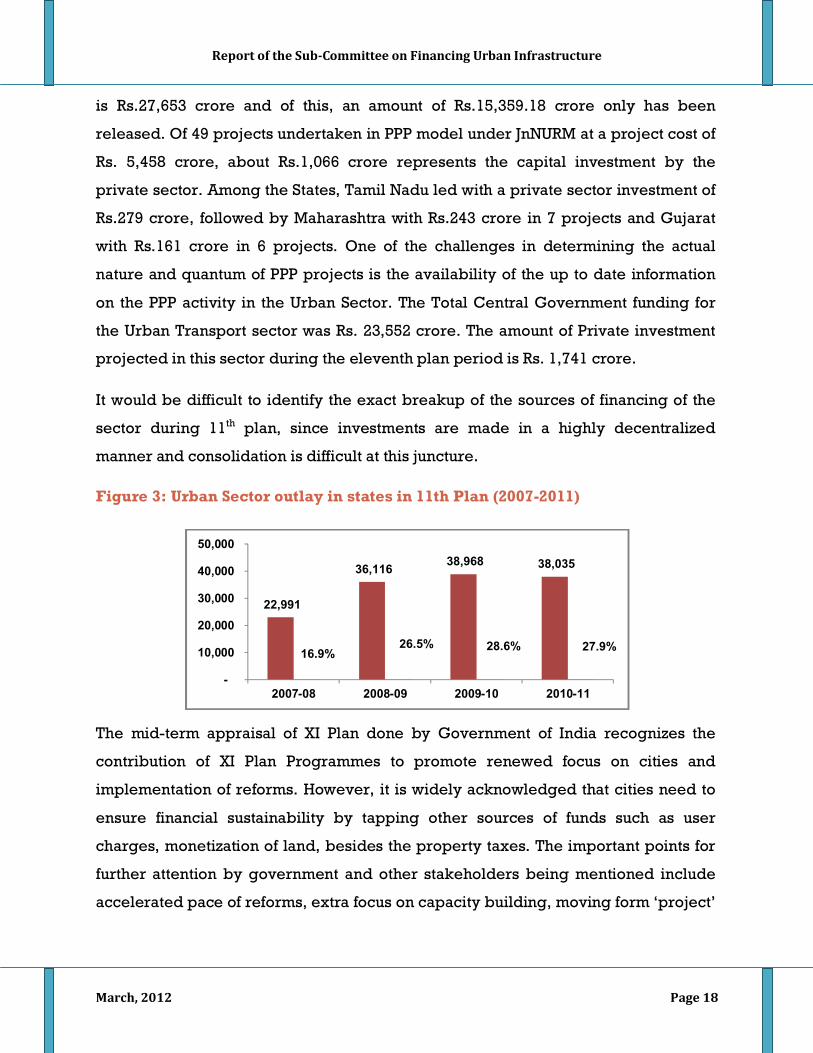
6.1 Actual outlay
The urban sector outlay for the states over the last four years of the plan period has
grown from the initial 16.9 percent in 2007-08 to 28 percent in 2010-11. State-wise
details are at Annexure II. The total Additional Central Assistance committed for 527
projects under the Urban Infrastructure and Governance (UIG) component of
JnNURM, which represents the major component of Central government investment
Report of the Sub-Committee on Financing Urban Infrastructure
March, 2012 Page 18
is Rs.27,653 crore and of this, an amount of Rs.15,359.18 crore only has been
released. Of 49 projects undertaken in PPP model under JnNURM at a project cost of
Rs. 5,458 crore, about Rs.1,066 crore represents the capital investment by the
private sector. Among the States, Tamil Nadu led with a private sector investment of
Rs.279 crore, followed by Maharashtra with Rs.243 crore in 7 projects and Gujarat
with Rs.161 crore in 6 projects. One of the challenges in determining the actual
nature and quantum of PPP projects is the availability of the up to date information
on the PPP activity in the Urban Sector. The Total Central Government funding for
the Urban Transport sector was Rs. 23,552 crore. The amount of Private investment
projected in this sector during the eleventh plan period is Rs. 1,741 crore.
It would be difficult to identify the exact breakup of the sources of financing of the
sector during 11th plan, since investments are made in a highly decentralized
manner and consolidation is difficult at this juncture.
Figure 3: Urban Sector outlay in states in 11th Plan (2007-2011)
The mid-term appraisal of XI Plan done by Government of India recognizes the
contribution of XI Plan Programmes to promote renewed focus on cities and
implementation of reforms. However, it is widely acknowledged that cities need to
ensure financial sustainability by tapping other sources of funds such as user
charges, monetization of land, besides the property taxes. The important points for
further attention by government and other stakeholders being mentioned include
accelerated pace of reforms, extra focus on capacity building, moving form ‘project’
22,991
36,116 38,968 38,035
16.9%26.5% 28.6% 27.9%
-
10,000
20,000
30,000
40,000
50,000
2007-08 2008-09 2009-10 2010-11
Report of the Sub-Committee on Financing Urban Infrastructure
March, 2012 Page 19
to ‘holistic’ city wide approach, identification of next generation reforms on local
government finance, planning, professionalization of service delivery etc.
7. Urban Infrastructure Provision – Norms, Gap and Financial requirements According to the High Powered Expert Committee (HPEC), the estimates for urban
infrastructure in the core 8 services of water supply, sewerage, solid waste
management, storm water drains, urban roads, urban transport, street lighting and
traffic support infrastructure amount to Rs. 31 lakh crore over a 20-year period. In
addition, the HPEC had also estimated capacity building costs of Rs. 1 lakh crore,
renewal and redevelopment costs of Rs. 4.1 lakh crore and other sector expenditure
of Rs 3.1 lakh crore over the 20-year period. The total expenditure on urban
infrastructure is thus estimated to be Rs. 39.2 lakh crore over 20 years. In addition to
investment projections on urban infrastructure, HPEC has also estimated Rs. 19.9
lakh crore towards operation and maintenance over the 20-year period, of which Rs.
18.1 lakh crore is for the 8 core sectors. While arriving at the total investment
requirement needs, the backlog was taken into account in addition to the new
investment to meet the demands of the additional population growth and also the
investment required for operation and maintenance of the assets created, the most
neglected area in urban infrastructure.
7.1 Service Backlog in Water Supply
The service backlog in water supply across various cities was arrived at based on
the assumption that 100% piped water supply would be provided for all households
with 24X7 continuous supply and a per-capita norm of 135 litres per capita per day.
Further, it was estimated that 80% of the current distribution network in the cities
needs to be replaced for delivering continuous water supply. Industrial demand for
water for cities above 500,000 population would be 20% and Non Revenue Water
would be 20%.

Report of the Sub-Committee on Financing Urban Infrastructure
March, 2012 Page 20
Table 5: Service Backlog in Water Supply
City Size Class
Population Size Water Production
Distribution Extension
Distribution Upgradation
IA >5 M 46% 37% 63%
IB 1-5 M 31% 25% 75%
IC 100000 - 1000000 18% 25% 75%
II 50000 - 100000 29% 25% 75%
III 20000 - 50000 56% 39% 61%
IV+ <20000 62% 51% 49%
7.2 Service Backlog in Sewage Management
Underground sewerage network is considered for all city classes and 100%
collection and treatment of wastewater. Sewage generation is assumed to be 80% of
water consumption and 5% from infiltration of groundwater into sewage.
Table 6: Service Backlog in Sewage Management
City Size Class
Population Size Network Treatment
IA >5 M 53% 53%
IB 1-5 M 44% 53%
IC 100000 – 1000000 64% 77%
II 50000 – 100000 84% 88%
III 20000 – 50000 90% 96%
IV+ <20000 100% 100%
7.3 Service Backlog in Solid Waste Management
The main assumption made in estimating the investment requirement is that 100
percent of solid waste generated is collected, transported and treated as per the
Municipal Solid Waste Handling Rules, 2000. The backlog for the cities is calculated
from the data available for the City Development Plan of the Cities under JnNURM.

Report of the Sub-Committee on Financing Urban Infrastructure
March, 2012 Page 21
Average per-capita waste generation for various size/ class of cities was adopted
from the India Infrastructure Report, 2006.
Table 7: Service Backlog in Solid Waste Management
City Size Class
Population Size Collection & Transport
Processing Scientific Disposal
IA >5 M 13% 88% 100%
IB 1-5 M 48% 94% 100%
IC 100000 - 1000000 41% 93% 100%
II 50000 - 100000 41% 93% 100%
III 20000 - 50000 65% 100% 100%
IV+ <20000 75% 100% 100%
7.4 Backlog in Urban Roads
Service backlogs for the assumed road density for different categories of cities,
Class-I at 12.25 km/sq.km and Class –II, III & IV at 7.00 km/sq.km are calculated
using the comprehensive mobility plans of the Cities as sample. For major and
collector roads, a service life of 5 years and 25 percent of the unit cost as
replacement cost and an annual O&M of 2 percent of the PCIC for all the roads was
taken into account for estimation of financing requirement.
Table 8: Service Backlog in Urban Roads
City Size Class
Population Size
Major Roads
Collector Roads Access Road Space
IA >5 M 31% 85% 32%
IB 1-5 M 80% 66% 63%
IC 100000 – 1000000 37% 85% 80%
II 50000 – 100000 0% 92% 35%
III 20000 – 50000 0% 92% 35%
IV+ <20000 0% 92% 35%
Report of the Sub-Committee on Financing Urban Infrastructure
March, 2012 Page 22
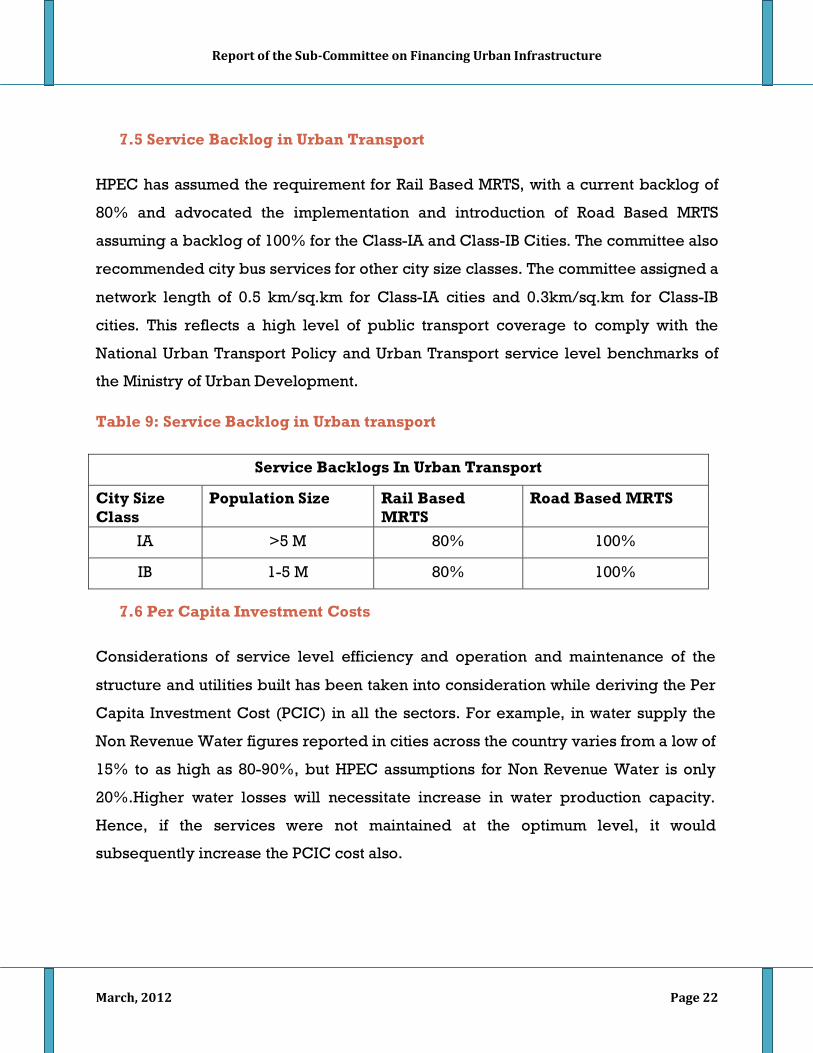
7.5 Service Backlog in Urban Transport
HPEC has assumed the requirement for Rail Based MRTS, with a current backlog of
80% and advocated the implementation and introduction of Road Based MRTS
assuming a backlog of 100% for the Class-IA and Class-IB Cities. The committee also
recommended city bus services for other city size classes. The committee assigned a
network length of 0.5 km/sq.km for Class-IA cities and 0.3km/sq.km for Class-IB
cities. This reflects a high level of public transport coverage to comply with the
National Urban Transport Policy and Urban Transport service level benchmarks of
the Ministry of Urban Development.
Table 9: Service Backlog in Urban transport
Service Backlogs In Urban Transport
City Size Class
Population Size Rail Based MRTS
Road Based MRTS
IA >5 M 80% 100%
IB 1-5 M 80% 100%
7.6 Per Capita Investment Costs
Considerations of service level efficiency and operation and maintenance of the
structure and utilities built has been taken into consideration while deriving the Per
Capita Investment Cost (PCIC) in all the sectors. For example, in water supply the
Non Revenue Water figures reported in cities across the country varies from a low of
15% to as high as 80-90%, but HPEC assumptions for Non Revenue Water is only
20%.Higher water losses will necessitate increase in water production capacity.
Hence, if the services were not maintained at the optimum level, it would
subsequently increase the PCIC cost also.

Report of the Sub-Committee on Financing Urban Infrastructure
March, 2012 Page 23
Table 10: Per Capita Investment Cost (PCIC) arrived at by HPEC for Estimation of Investment Requirement
Urban Sectors Per Capita Investment Cost by Sector (Rs.)
Per Capita O&M Cost by Sector (Rs.)
Water Supply 5,099 501
Sewerage 4,704 286
Solid Waste 391 155
Urban Roads 22,974 397
Urban Transport 5380 371
Traffic Management Systems 945 34
Storm Water Drains 3526 53
Street Lighting 366 8
Total 43,386 1,806
(Average Cost at 2009-10 prices.)
7.7 Capital Expenditure Estimates by City Size class
Metropolitan Cities (Class-IA & Class –IB) account for 43 percent of population and
50 percent of the investment requirement over the 20 years of period whereas the
next order of Cities (Class-IC) with 29% of the population requires 28.5 percent of
investment followed by other class cities of population accounting for 20 percent
population requiring 16 percent of investment.

Report of the Sub-Committee on Financing Urban Infrastructure
March, 2012 Page 24
Table 11: Capital Expenditure Estimates by City Size Class
Class-wise estimates
Total (Rs. crore at 2009-10
prices)
Relative Share
(Per Cent)
Population (2031
projected) In million
Relative Share
(Per Cent)
Class IA (> 5 Million)
860,136 27.8 127
21.2
Class IB ( 1- 5 Million)
690,463 22.3 128
21.4
Class IC (100,000 -1 Million)
883,346 28.5 172
28.8
Class II (50,000 - 100,000)
174,072 5.6 53
8.9
Class III (20,000 - 50,000)
280,541 9.1 67
11.2
Class IV+ (<20,000)
209,583 6.8 51
8.5
Total 3,098,141 100.0 598 100.0
7.8 Phasing Plan of HPEC Estimates
In phasing out the capital investments over the 20-year period, the HPEC has
assumed that all infrastructure will be put in place within 20 years. The assumptions
made for the base year 2011-12 and further are as follows:
• A base GDP at Rs 7,268,038 crore with an initial investment for
Infrastructure based on the current investment level from various sources
like JnNURM, Parastatals and other funding sources amounting to Rs 50,000
crore
• The GDP of the economy was assumed to grow at a constant rate of 8
percent over the 20 year period
• Phasing of Urban Sector investment with a growth rate of 15 percent per
annum over the Twelfth Plan, 12 percent over the Thirteenth Plan and 8
Report of the Sub-Committee on Financing Urban Infrastructure
March, 2012 Page 25
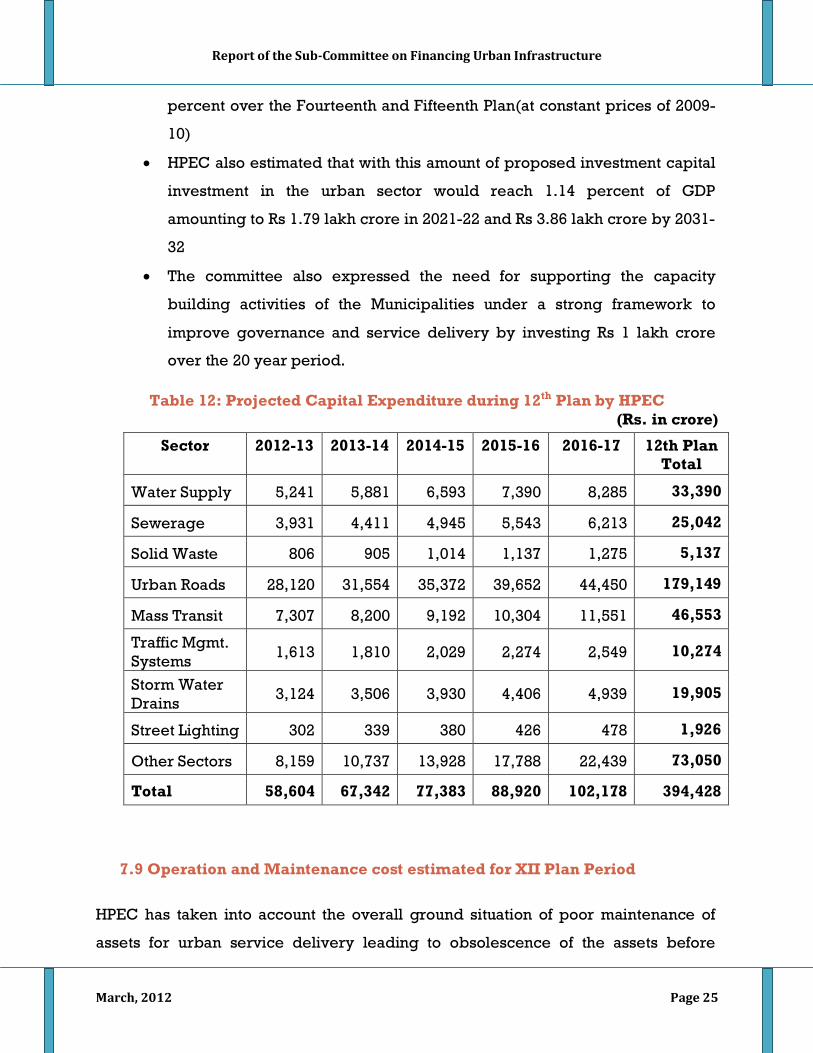
percent over the Fourteenth and Fifteenth Plan(at constant prices of 2009-
10)
• HPEC also estimated that with this amount of proposed investment capital
investment in the urban sector would reach 1.14 percent of GDP
amounting to Rs 1.79 lakh crore in 2021-22 and Rs 3.86 lakh crore by 2031-
32
• The committee also expressed the need for supporting the capacity
building activities of the Municipalities under a strong framework to
improve governance and service delivery by investing Rs 1 lakh crore
over the 20 year period.
Table 12: Projected Capital Expenditure during 12th Plan by HPEC (Rs. in crore)
7.9 Operation and Maintenance cost estimated for XII Plan Period
HPEC has taken into account the overall ground situation of poor maintenance of
assets for urban service delivery leading to obsolescence of the assets before
Sector
2012-13 2013-14 2014-15 2015-16 2016-17 12th Plan Total
Water Supply 5,241 5,881 6,593 7,390 8,285 33,390
Sewerage 3,931 4,411 4,945 5,543 6,213 25,042
Solid Waste 806 905 1,014 1,137 1,275 5,137
Urban Roads 28,120 31,554 35,372 39,652 44,450 179,149
Mass Transit 7,307 8,200 9,192 10,304 11,551 46,553
Traffic Mgmt. Systems 1,613 1,810 2,029 2,274 2,549 10,274
Storm Water Drains
3,124 3,506 3,930 4,406 4,939 19,905
Street Lighting 302 339 380 426 478 1,926
Other Sectors 8,159 10,737 13,928 17,788 22,439 73,050
Total 58,604 67,342 77,383 88,920 102,178 394,428
Report of the Sub-Committee on Financing Urban Infrastructure
March, 2012 Page 26
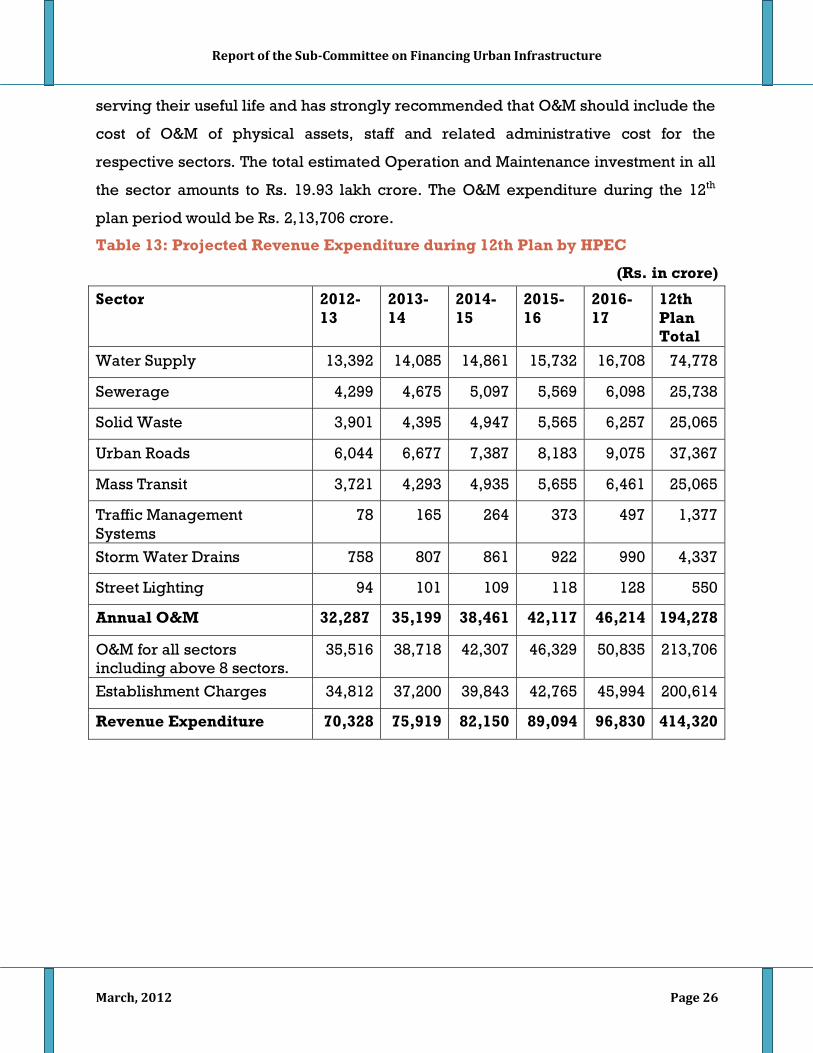
serving their useful life and has strongly recommended that O&M should include the
cost of O&M of physical assets, staff and related administrative cost for the
respective sectors. The total estimated Operation and Maintenance investment in all
the sector amounts to Rs. 19.93 lakh crore. The O&M expenditure during the 12th
plan period would be Rs. 2,13,706 crore.
Table 13: Projected Revenue Expenditure during 12th Plan by HPEC
(Rs. in crore)
Sector 2012-13
2013-14
2014-15
2015-16
2016-17
12th Plan Total
Water Supply 13,392 14,085 14,861 15,732 16,708 74,778
Sewerage 4,299 4,675 5,097 5,569 6,098 25,738
Solid Waste 3,901 4,395 4,947 5,565 6,257 25,065
Urban Roads 6,044 6,677 7,387 8,183 9,075 37,367
Mass Transit 3,721 4,293 4,935 5,655 6,461 25,065
Traffic Management Systems
78 165 264 373 497 1,377
Storm Water Drains 758 807 861 922 990 4,337
Street Lighting 94 101 109 118 128 550
Annual O&M 32,287 35,199 38,461 42,117 46,214 194,278
O&M for all sectors including above 8 sectors.
35,516 38,718 42,307 46,329 50,835 213,706
Establishment Charges 34,812 37,200 39,843 42,765 45,994 200,614
Revenue Expenditure 70,328 75,919 82,150 89,094 96,830 414,320
Report of the Sub-Committee on Financing Urban Infrastructure
March, 2012 Page 27
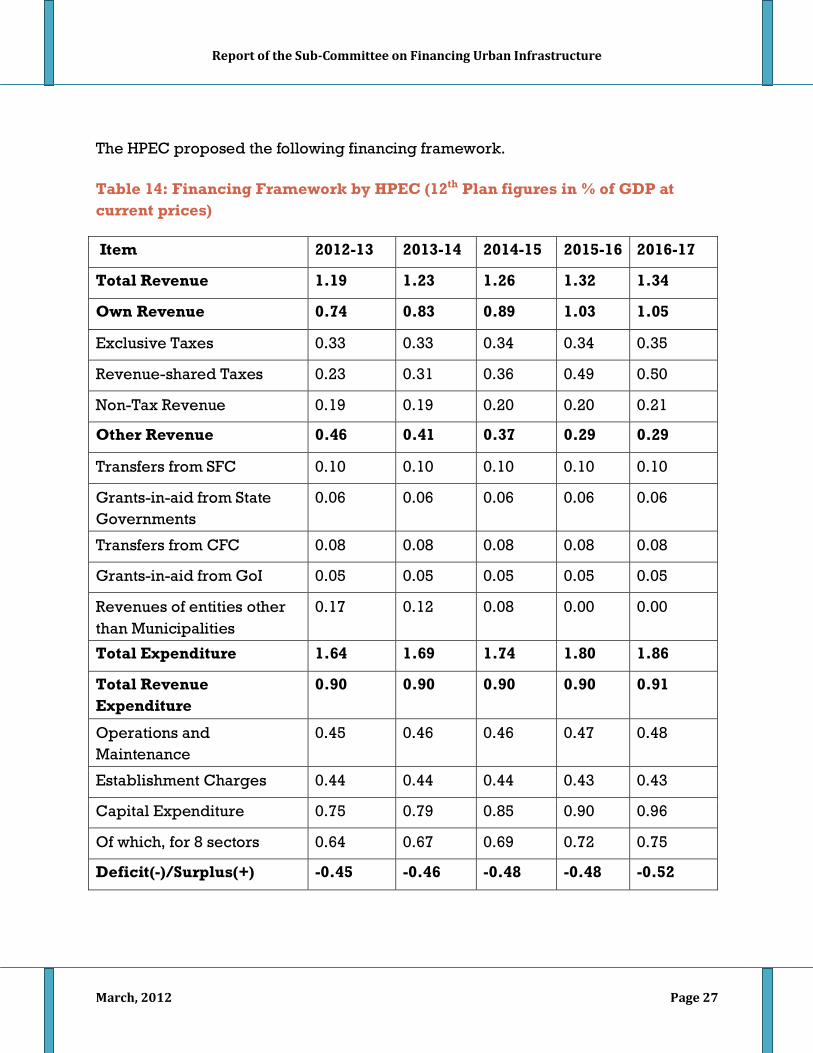
The HPEC proposed the following financing framework.
Table 14: Financing Framework by HPEC (12th Plan figures in % of GDP at current prices)
Item 2012-13 2013-14 2014-15 2015-16 2016-17
Total Revenue 1.19 1.23 1.26 1.32 1.34
Own Revenue 0.74 0.83 0.89 1.03 1.05
Exclusive Taxes 0.33 0.33 0.34 0.34 0.35
Revenue-shared Taxes 0.23 0.31 0.36 0.49 0.50
Non-Tax Revenue 0.19 0.19 0.20 0.20 0.21
Other Revenue 0.46 0.41 0.37 0.29 0.29
Transfers from SFC 0.10 0.10 0.10 0.10 0.10
Grants-in-aid from State Governments
0.06 0.06 0.06 0.06 0.06
Transfers from CFC 0.08 0.08 0.08 0.08 0.08
Grants-in-aid from GoI 0.05 0.05 0.05 0.05 0.05
Revenues of entities other than Municipalities
0.17 0.12 0.08 0.00 0.00
Total Expenditure 1.64 1.69 1.74 1.80 1.86
Total Revenue Expenditure
0.90 0.90 0.90 0.90 0.91
Operations and Maintenance
0.45 0.46 0.46 0.47 0.48
Establishment Charges 0.44 0.44 0.44 0.43 0.43
Capital Expenditure 0.75 0.79 0.85 0.90 0.96
Of which, for 8 sectors 0.64 0.67 0.69 0.72 0.75
Deficit(-)/Surplus(+) -0.45 -0.46 -0.48 -0.48 -0.52

Report of the Sub-Committee on Financing Urban Infrastructure
March, 2012 Page 28
7.10 Investment during the 12th Plan Period- Recommendation of the Sub-Committee
HPEC has recommended a capital investment of Rs.3.95 lakh crore over the next
Plan Period, with a proposed funding of 0.25% of GDP under the JnNURM. The report
of the Working Group on Urban Finance set up by the Planning Commission has
recommended a total capital investment of Rs.4.6 lakh crore over the next plan
period considering coverage of service backlog in 15 years and the total investment
targets covered in 20-years. The amount to be invested under the JnNURM-2 has
been identified as Rs.1.62 lakh crore for the next Plan Period, i.e. an average of Rs.
32,408 crore per annum for the next 5 years. Table 15 below presents a modified
phasing plan to that of the HPEC. This projection has been accepted by the Steering
committee on Urbanisation set up by the Planning Commission.

Report of the Sub-Committee on Financing Urban Infrastructure
March, 2012 Page 29
Table 15: Investment over the next plan period as projected by HPEC for next 20 years with backlog covered in 15 years
Item 2012-13 2013-14 2014-15 2015-16 2016-17 Total Revenue 1.19 1.23 1.26 1.32 1.34 Own Revenue 0.74 0.83 0.89 1.03 1.05 Exclusive Taxes 0.33 0.33 0.34 0.34 0.35 Revenue-shared Taxes 0.23 0.31 0.36 0.49 0.50 Non-Tax Revenue 0.19 0.19 0.20 0.20 0.21 Other Revenue 0.46 0.41 0.37 0.29 0.29 Transfers from SFC 0.10 0.10 0.10 0.10 0.10 Grants-in-aid from State Governments
0.06 0.06 0.06 0.06 0.06
Transfers from CFC 0.08 0.08 0.08 0.08 0.08 Grants-in-aid from GoI 0.05 0.05 0.05 0.05 0.05 Revenues of entities other than Municipalities
0.17 0.12 0.08 0.00 0.00
Total Revenue Expenditure 0.90 0.90 0.91 0.93 0.96 Annuity Payments 0.00 0.00 0.01 0.02 0.04 Debt Repayment 0.01 0.01 0.02 0.02 0.03 Reduction in Revenues on the account of PPP
0.00 0.00 0.00 0.00 0.01
Investible surplus of Municipalities
0.29 0.32 0.32 0.34 0.31
Capital Expenditure 0.78 0.87 0.97 1.08 1.21 Deficit(-)/Surplus(+) -0.50 -0.55 -0.66 -0.75 -0.90 PPP 0.02 0.03 0.05 0.07 0.09 Annuity 0.04 0.08 0.12 0.17 0.23 Borrowing 0.03 0.03 0.03 0.03 0.03 Land based Instruments 0.07 0.07 0.12 0.16 0.17 Unfunded Deficit(-) -0.35 -0.35 -0.34 -0.33 -0.38

Report of the Sub-Committee on Financing Urban Infrastructure
March, 2012 Page 30
8. Financing Framework for the Twelfth Plan The requirement of investment in urban infrastructure has been estimated by
various sources, including the HPEC, as being of the order of Rs. 40 to 50 thousand
crore. While HPEC has recommended this amount to be made available over a 20-
year period, in reality, the period needs to made much shorter, because citizens
would not like to, and should not be expected to, wait for as many years to get their
basic needs met in respect of core sectors such as urban transport, city roads, water
supply and sanitation etc.
Meeting the requirements of funds for XII Plan has to be attempted through a multi
pronged strategy covering the following:
I. Stimulations of municipal own sources covering (a) efficient application of
revenue instruments and (b) use of fiscal monitoring and control innovations: Both
the HPEC and the Working Group on Financing Urbanisation have emphasised the
need for the Municipalities to increase their own sources of revenue.
While JNNURM-1 had insisted on 100% recovery of O&M costs by way of user charge
collections, and only few municipalities could reach that level even at the end of the
6th year of the 7-year Mission period, i.e., by 31.3.2011, some municipalities in Tamil
Nadu have proved that cost recovery could be as high as 300 to 400%, leading to
recovery of the capital expenditure too, besides the O&M charges. Such local bodies
include a small municipality of Porur (Town Panchayat), an intermediate size
municipality- Tambaram and a large-size one, Madurai. The user charges in these
cases range from Rs. 90 to 150 per month for residential users and higher for the
commercial and industrial users.
Similar examples are available in respect of solid waste management sector too,
wherein the waste is converted into manure and energy (electricity) and in waste
water recycling. Such examples needs to be analysed further and communicated to
Report of the Sub-Committee on Financing Urban Infrastructure
March, 2012 Page 31
the rest of the States and the local bodies, to give everyone the confidence that the
user charges could indeed contribute to meeting the capital investment too, at least
in part.
Taking Citizens into Confidence: It is also necessary to take the citizens into
confidence in the matter of determination of levels of user charges. The cost of the
project, be it for water supply or SWM etc., spread over the project period, coupled
with the O&M charges and the benefits to the people should be logically juxtaposed
with the user charges, to convince the people about the scale of the user charges.
Property taxes: The example of Bangalore City Corporation, which has enhanced
the revenue collections from property taxes from the level of Rs. 400 core in 2007-08
to over Rs. 1,200 crore in 2011-12, needs to be emulated by other cities. In fact many
other cities are already on the go, such as Ahmadabad and Hyderabad. More need
to follow. There is also a case for increasing property tax in the influence zone or the
catchment area of MRTS corridors. The property taxes increase has to be higher for
properties given on rent as compared to self occupied properties so as to tap the
increased rental value on account of the Govt investment in the MRTS corridor.
Land Monetisation: The example of Delhi Airport Redevelopment Project
mentioned above presents a model for land monetisation for development of urban
infrastructure in PPP Mode. But there are umpteen variants possible, to prove that
urban development can pay for itself, of course, with a proper structure. A water
supply project can also include development of appurtenant land, to generate
money, to be ploughed into the capex of the water supply project. A project for
development of ring road around a city by, say, NHAI, can have partnership of the
Local Development Authority, which could acquire lands on either side of the ROW
and convert into commercial (and social) projects, which would part fund the ring
road itself. If that is not pursued, sundry real estate developers would encash on the
enhancement in the value of the properties around the Ring Road, leaving the
Government to pay for the development of the road. The revenue sharing model for
Report of the Sub-Committee on Financing Urban Infrastructure
March, 2012 Page 32
such land monetisation would take care of any possibility of windfall gains only to
the private party.
Additional FAR and FAR/ Development Charges: Any mass transit project, be it
BRTS, Metro rail or any similar project, improves connectivity, leading to
enhancement in the possibility of more intense use of land for commercial and
residential activities. This would then allow for higher FAR, which would enhance the
level of economic activities, besides yielding higher revenue collection from FAR
charges. The local body could also enhance the rates of FAR in the influence zone
and levy development charges, to mop up part of the steep financial and economic
benefits that becomes available to the owners and users of the properties in the
influence zone of such transit corridors. A suitable mechanism also needs to be
evolved for capturing, at the time of sale, the increased property value in the
influence zone of MRTS corridor occurring on account of govt investment for the
MRTS project.
The framework presented in previous sections indicates that a serious effort is
needed from the Municipalities to increase their own tax and non-tax revenue. A real
growth rate of 9 per cent per annum in exclusive taxes and 10 per cent per annum in
non-tax revenue of Municipalities would demand systemic changes in the way in
which the Municipalities presently operate and function. Failure to achieve will risk
the ability of other financing instruments like PPPs or borrowings in financing urban
infrastructure. A weak revenue scenario like this, with borrowing or PPPs getting
ruled out, will put further strain on the Government of India to support the State
Governments and Municipalities in urban infrastructure financing. It is, therefore,
recommended that the design of the various policies be such that it would create an
environment for Municipalities to increase revenues through better service delivery,
which will push up user charges and other revenue streams.
II. Devolution of Fiscal Powers and Funds;A significant share of the revenues
for the Municipalities would come from a constitutionally mandated revenue sharing
arrangement as recommended by the HPEC and adopted by the Working Group on

Report of the Sub-Committee on Financing Urban Infrastructure
March, 2012 Page 33
Financing. Such a predictable and timely fiscal transfer will strengthen the revenue
base of the Municipalities and increase accountability in the delivery of functions as
envisaged in the 74th Constitutional Amendment. It will also serve as an important
lever for Municipalities to tap other sources of financing. It is also recommended that
Government of India put in place a systematic mechanism to ensure this devolution –
by providing incentives to the states and cities through JnNURM-2.
III. Scaling up PPP:
Some interesting examples have come in respect of the sources financing the
investment needs for urban infrastructure. One such instance is the re-development
of airports. While the Kolkata and Lucknow Airport re-development projects have
been undertaken by the Airports Authority of India (AAI), at a cost of the order of Rs.
2,000 crore each, similar project for Delhi has been taken with not only at no cost to
the Government, but the project even gives sustained revenue returns to the
Government in the revenue-sharing arrangement built in the model. The
concessionaire in case of Delhi (M/s DIAL) has been given the authority to make use
of the excess lands in the airport area for development of hotels, exhibition centre,
convention centre, warehousing etc. In case of Kolkata and Lucknow, the
development of such remunerative facilities in the area surrounding the airport has
been left to individual developers, who would at best give some property taxes and
FAR charges to the local authorities, of which only a small fraction would come, if at
all, for the airport project. Had the Lucknow and Kolkata Airport projects followed
the Delhi Airport Project model, Government could have saved those few thousand
crore rupees.
The Working Group on Financing Urbanisation estimated that about 20 per cent of
the total investment requirement over the 12th Plan period can potentially come
through PPPs including annuity models. This would roughly translate to about 250-
300 PPP projects in the urban sector each year. For this to happen, a pipeline of
about 600-800 PPP projects must be in place. The Working Group suggests that even
though the target of increasing PPP contribution by 10 times is aggressive, this must
Report of the Sub-Committee on Financing Urban Infrastructure
March, 2012 Page 34
be pursued. This would require a number of initiatives to be put in place across all
tiers of government. The Working Group recommended that a sequenced approach
in the use of various types of PPP option could help mainstream PPPs in the urban
sector, given that PPPs constitute only a small part of the urban infrastructure
investment. The hierarchy of preferences for the various PPP implementation options
could be specified as a guide for state governments and Municipalities under
JnNURM-2. A model set of output standards for different types of projects across the
various urban sub-sectors and for different classes of cities and towns would help
state governments and Municipalities in configuring projects and bring in a level of
standardization in service levels across Municipalities. This would also help in
benchmarking performance across cities over the longer term.
Annuity Model: The infrastructure projects in urban sub-sectors to be implemented
in PPP should be encouraged for annuity models too3. This is necessary because
some such projects, particularly in smaller cities, may not be financially viable by
themselves and would need yearly financial payments from the sponsoring
municipality. The Working Group on Financing Urbanisation has rightly
recommended that the financial assistance from JnNURM-2 should also be available
for the purpose of annuity models, which might need policy changes since such
payments may straddle 2-3 Plan periods (or even more) depending on the period of
the contract. A transition plan – identifying areas of quick wins from the various PPP
types- would need to be prepared as part of JnNURM-2. Incentives in the form of
higher levels of VGF or central government funding for PPP projects in Class II and
below cities may be needed in the initial years to kick start the process.
IV. Land Monetisation: The Working Group on Financing Urbanisation indicates
that the value of a plot of land can appreciate by about 10 times by its inclusion in the
Master Plan area. It then appreciates only by about 2.5 times after the provision of
requisite infrastructure, suggesting the need and value for streamlining the
3like in the case of national highways and major ports where PPPs would be the default mode of implementation and conventional construction pursued only if PPP options cannot be pursued for inherent structural reasons or lack of willing investors for the project
Report of the Sub-Committee on Financing Urban Infrastructure
March, 2012 Page 35
transition process of land development. Some of the initiatives that need to be taken
up to facilitate the process of land monetisation, are as follows:
a. Preparation of Master Plan in a standardized manner on a regular basis.
b. Ensuring land patterns as per approved Master Plans.
c. Sequencing of the land development process to generate resources for
infrastructure creation.
d. Delineate the roles and responsibilities of Urban Development Authorities
(UDA) and Municipalities in the land management process.
e. Land inventory in Municipalities and UDA areas.
The examples of land monetisation described in the preceding paragraphs give
ample confidence about the potential strength of land monetisation for augmenting
resources for development of urban infrastructure, particularly if these are taken up
in PPP Mode.
8.1 Municipal Actions for Stimulation of Own Sources
There is a strong realization regarding the constraints faced by the municipal bodies
in the levy and collection of own sources of revenue. However, realizing these
weaknesses and their potential to generate more revenue, the Municipalities have
to initiate specific actions under various instruments. Individual actions which can
be taken up to mobilize own sources from include (i) appropriate placement of
revenue instruments and (ii) efficiency in fiscal monitoring and control. Annexure –
III, elaborates upon the specific action that can be taken in respect of the former.
A basic minimum standard of performance for the Urban Local Bodies should be to
ensure full cost recovery of O&M through user charges and atleast partial recovery
of capital expenditure.
Another set of actions in the form of fiscal monitoring and control innovations in the
overall financial management system need to be taken up by Municipalities to
utilize revenue instruments more effectively.
Report of the Sub-Committee on Financing Urban Infrastructure
March, 2012 Page 36
i. States have to push accounting sector reforms through necessary
provisions/approvals to apply Double Entry Accounting (DEA) at the ULB
level so as to build transparency and borrowing capacity among
Municipalities.
ii. Budgeting needs to be rationalized for normative performance oriented,
participatory budget, which is implemented throughout the year in a fixed
manner.
iii. Carry out innovative asset management, which includes listing,
classification, valuation and finally assessment of each asset for optimum
utilization of its revenue potential.
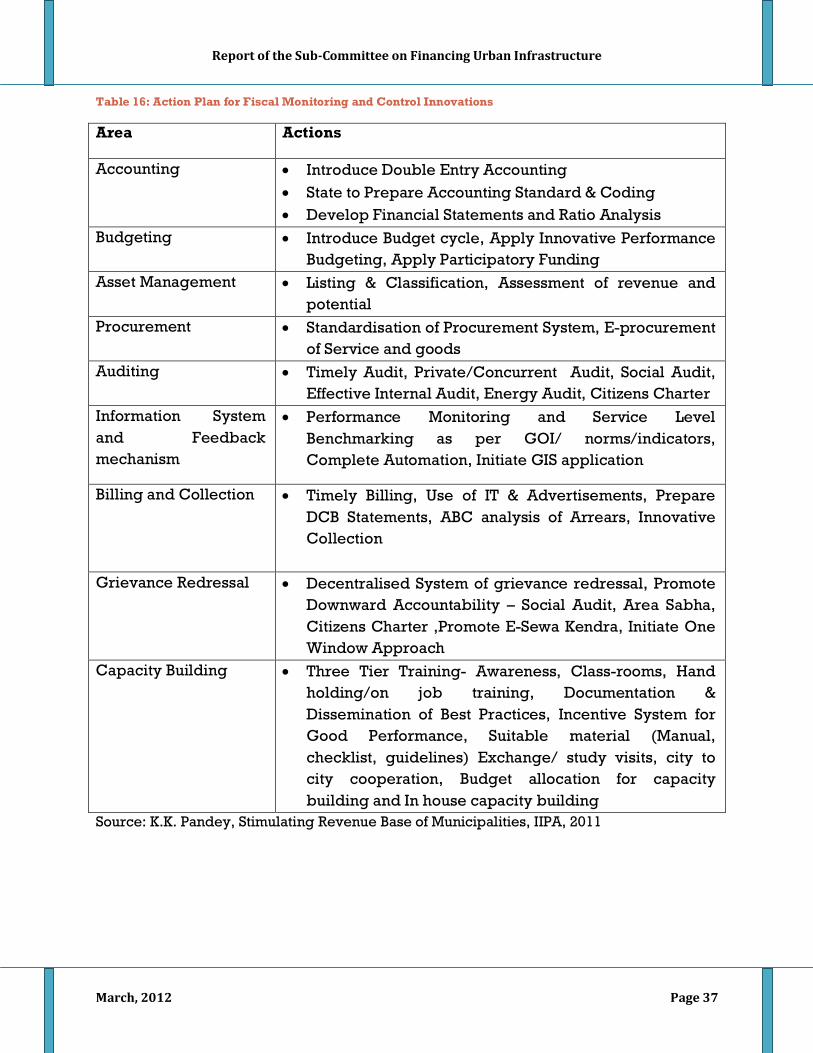
Table 16, elaborates upon the specific action that can be taken
8.2 Devolution of fiscal powers and funds
There is a critical need for a substantial and meaningful devolution of fiscal powers
to the Urban Local Bodies. Some of the suggestions of the HPEC include the
following:
• Insert a ‛Local Bodies Finance List’ (LBFL) along the lines of the Union and State
Lists
• Empower Municipalities to exclusively levy property tax, urban infra cess along
with property tax, profession tax, entertainment tax, and advertisement tax and
retain the whole of their proceeds (hereinafter referred to as ‛exclusive taxes’).
• Constitutionally ensure sharing of a pre-specified percentage of revenues from
all taxes on goods and services which are levied by states to enable
Municipalities to meet their functional responsibilities assigned to them by the
74th Amendment (hereinafter collectively referred to as ‛revenue-shared taxes’);
Report of the Sub-Committee on Financing Urban Infrastructure
March, 2012 Page 37
Table 16: Action Plan for Fiscal Monitoring and Control Innovations
Area Actions
Accounting • Introduce Double Entry Accounting • State to Prepare Accounting Standard & Coding • Develop Financial Statements and Ratio Analysis
Budgeting • Introduce Budget cycle, Apply Innovative Performance Budgeting, Apply Participatory Funding
Asset Management • Listing & Classification, Assessment of revenue and potential
Procurement • Standardisation of Procurement System, E-procurement of Service and goods
Auditing • Timely Audit, Private/Concurrent Audit, Social Audit, Effective Internal Audit, Energy Audit, Citizens Charter
Information System and Feedback mechanism
• Performance Monitoring and Service Level Benchmarking as per GOI/ norms/indicators, Complete Automation, Initiate GIS application
Billing and Collection • Timely Billing, Use of IT & Advertisements, Prepare DCB Statements, ABC analysis of Arrears, Innovative Collection
Grievance Redressal • Decentralised System of grievance redressal, Promote Downward Accountability – Social Audit, Area Sabha, Citizens Charter ,Promote E-Sewa Kendra, Initiate One Window Approach
Capacity Building • Three Tier Training- Awareness, Class-rooms, Hand holding/on job training, Documentation & Dissemination of Best Practices, Incentive System for Good Performance, Suitable material (Manual, checklist, guidelines) Exchange/ study visits, city to city cooperation, Budget allocation for capacity building and In house capacity building
Source: K.K. Pandey, Stimulating Revenue Base of Municipalities, IIPA, 2011

Report of the Sub-Committee on Financing Urban Infrastructure
March, 2012 Page 38
• Provide for formula-based sharing of the divisible pool with the municipalities
and also grants-in-aid to Municipalities from the divisible pool.
• The Urban Local Body finance list would include exclusive taxes, revenue shared
taxes, non tax revenue as given in Box-1
The Thirteenth Finance Commission has, for the first time, linked devolution of funds
to local bodies to a dedicated share of the divisible pool of central revenue. It has
suggested a quantum jump in the revenue allocation, which would be 4 to 5 times
higher than the allocation of Rs. 5 crore per annum as per norms laid by the 12thCFC.
The revised allocation would be available from the financial year i.e. 2010-11. A part
of the allocation referred to as performance grant has been linked to the
implementation of certain reforms such as Implementation of Double Entry Accrual
based systems by the local bodies, assignment of technical guidance and
supervision of audit to the CAG of India, appointment of Independent Local Body
Ombudsman, electronic transfer of grants by the states to the local bodies to ensure
transparency and timely disbursement, removal of exceptions in the levy of
property tax, notification of current as well as expected levels of improvements in
service standards etc. 12 states are likely to qualify for this performance grant
during the year 2011-12.
An Indicative Municipal Finance List • Exclusive taxes
– Property tax, including vacant land tax – Profession tax – Entertainment tax* – Advertisement tax*
• Revenue-shared taxes – All taxes on goods and services levied by the state government**
• Non-tax revenue – User charges – Trade licensing fee – FSI charge/Betterment charge/Impact fee/Development charge
* if not subsumed under the GST. ** including value added tax (VAT)/sales tax, stamp duty, motor vehicle tax, electricity, purchase tax, luxury tax, taxes on lottery, betting and gambling, entry taxes in lieu of octroi, etc. Note: FSI stands for floor space index.
Source: HPEC (2011)
Report of the Sub-Committee on Financing Urban Infrastructure
March, 2012 Page 39
8.3 Public Private Partnership (PPP)
The PPP approach is suitable for the infrastructure sector since it supplements scarce
resources, creates a more competitive environment and helps improve efficiencies
and reduce costs. In the road sector, PPPs have demonstrated their efficiency.
However, attracting private sector through PPP is neither easy nor automatic. A key
prerequisite is to lay down a policy framework that assumes a fair return for
investors provided they attain reasonable levels of efficiency. But the policy must
protect the interests of users, especially the poor.PPPs are useful only if they assume
quality supply at reasonable cost. There are certain categories of infrastructure
projects where externalities caused by projects can't be captured by project
revenues alone. Such projects which are marginally viable or unviable can be made
financially attractive through a grant. Urban sector projects fall in this category. As
urban sector infrastructure has a significant impact on people's lives, private sector
investment needs to be carefully considered to ensure adequate regulation and
monitoring, participation of civil society, and realistic expectations from the private
sector. International experience shows the need for building good public-private
partnerships (PPPs),which allow optimum sharing of risks, roles and responsibilities,
based on the suitability and ability of the public and private partners involved.
Today quite a few water supply and sewerage projects are being implemented
through PPP mode. Water sector PPP projects are increasingly focusing on
distribution improvements and the emphasis is as much on service improvement as
on capital infusion from the private sector. In some of the projects which are in Latur,
Chandrapur, Nagpur, Mysore, Madurai, Hubli-Dharwad, Gulbarga and Belgaum,
Sonia Vihar and Navi Mumbai the focus is on upgradation and O&M. The operator
does not bear any investment risks. Other projects such as the ones at Haldia and
Tirupur are on BOOT/BOT basis. Several Municipal bodies have successfully
implemented private sector participation in SWM e.g. Alandur, Haldia, Chennai,
Coimbatore, Madurai and Faridabad etc. In urban transport, areas where PPP model
has been followed or is intended are Metro Projects, running of modern city bus
service in Indore, Bhopal, Jabalpur, Kota, Jodhpur, Jalandhar, Patiala etc.,
Report of the Sub-Committee on Financing Urban Infrastructure
March, 2012 Page 40
development of bus terminal and parking lots, Foot-over-bridges and road signage,
modernization of Bus Terminals, BRTS (Bus Rapid Transit System) where
infrastructure is being provided by the Government and rolling stock operation and
maintenance is through PPP participation. Urban Road Projects being developed on
PPP basis are Mumbai Trans Harbour Sea Link Project, IT corridor project in
Chennai, Chennai outer ring road, Trivandrum city road improvement, Hyderabad
outer ring road, Delhi-Noida Toll Bridge, Delhi-Gurgaon Expressway etc. To date, 49
projects are being implemented on PPP basis under JnNURM.
The Government of India-Ministry of Finance has created a viability gap funding
arrangement. The India Infrastructure Finance Company (IIFCL) is providing long-
term debt to project companies setting up infrastructure projects. Under the India
Infrastructure Project Development Fund (IIPDF), funds are provided for Project
Development. 53 projects of the urban sector have been provided assistance. In a
federal country like ours, building world-class infrastructure is critically dependent
on the cooperation and support of State governments on many aspects such as law
and order, land acquisition, rehabilitation, shifting of utilities and resettlement and
forest and environment clearances. The Finance Ministry and the Planning
Commission are actively engaged with State governments to help them in managing
the PPP process.
There are barriers for private sector investments in urban infrastructure in India,
more so in the critical water supply and sewerage sub-sectors. A quick review of the
relevant literature indicates a number of reasons for reluctance on the part of the
private sector to assume commercial risks in majority of the urban subsectors.
• Most of the urban sector investments involve third tier of governments, which
increase the perceived risks for private sector investments.
• Historically, water supply and sanitation services have been seen as “public
goods” that need to be provided at affordable prices (meaning nominal low
costs).

Report of the Sub-Committee on Financing Urban Infrastructure
March, 2012 Page 41
• The low water and sewerage tariffs make water supply and sewerage projects
non-bankable which require general revenue support even for operations and
maintenance (O&M). An exception, however, is industry which has a long history
of paying rational tariffs.
• Except for a minority of municipalities, the general financial status of most
municipalities is precarious.
In the past, the financing of urban infrastructure projects at these levels has been
largely through government budgets, which also supported O&M expenditure of
assets that were developed. Direct user charges or tariffs are largely unable to meet
100% of O&M costs. Hence, the financing of the urban sector projects also have to
address both the “real” cost of operations of urban infrastructure services, as well as
the development of financial models that can provide some bankability assurance to
prospective financiers of such projects. This makes proper structuring of a project
important where the commercial and political risks are appropriately allocated to
parties which can bear the identified risks most efficiently.
With the launch of the reform-driven and part-grant financed JnNURM, both the
macro-environment as well as project-level micro environment has become more
and more congenial for public-private partnerships (PPPs) in the urban sector. Many
of the JnNURM-supported reforms are expected to create favorable governance and
institutional framework for private sector to feel more confident to venture into the
urban sector. A combination of part-grant financing by the JnNURM is likely to create
demand for private capital as well as greater interest from private sector in the
urban sector. However, to encourage PPPs, it is important to develop ‘bankable’ or
financially-sustainable models at a project level.
The unbundling of services and technological innovations in the urban sector,
particularly in the areas of sanitation and water supply and SWM has opened up
these areas to the private sector. Also, global trends show that the private sector has
been able to mobilize funds necessary to finance infrastructure projects and that it is

Report of the Sub-Committee on Financing Urban Infrastructure
March, 2012 Page 42
willing to accept risks provided the institutional environment meets certain
minimum standards and the projects are properly structured.
There is scope for expanding PPP in urban sector especially in water, sanitation and
waste to energy. While there are established Models and a sizable number of
projects in certain sectors, the number of PPP projects in urban social infrastructure
(water supply, sanitation and SWM) are limited. PPP Projects in water sector for loss
reduction, introducing 24x7, 100% metering and billing are to be encouraged in the
form of Management contracts in the States. A few states have taken the initiative,
which needs to be replicated in the country.
Some of the key issues and challenges faced by Bankers/Lenders while appraising
urban infrastructure projects under PPP include the following:
1. Structuring of the PPP projects in urban infrastructure is not up to the expectation
of the various stake holders on account of the following reasons :
a. The project documents (bid, concession agreement, etc.) are not standardized at
the state and central level unlike in the case of Road or Power sector leading to lot
of scope for negotiation between Concessioning Authorities and bidders during
development, execution and operations. This leads to delay in project
development and execution having residual risks
b. Lender’s interests are to be adequately and appropriately protected in the
Concession Agreements like in the model concession agreement of transportation
or power sector.
c. Urban Infrastructure sector is today at the same stage where the road sector was
about 15 years back – the route adopted and learning’s in the privatization
process of the road sector should be put to use to an optimum level for successful
privatization of urban infra projects.
d. The “User pay” principle is not yet established for urban infra services – leaving
the private sector to manage the show on behalf of the government w.r.t. user
charges collection

Report of the Sub-Committee on Financing Urban Infrastructure
March, 2012 Page 43
i. The Urban Infra sector needs to be handled with soft gloves, like in
case of the transportation sector where after the initial debacle of the
toll road projects; the concept of annuity was brought in successfully.
Similarly for the Urban Infra sector projects policy should graduate
slowly from Government run to Private with the initial route of annuity
before switching over completely to user pay principle basis
ii. For the payment of annuity appropriate escrow account would have to
be created as the Urban Local Bodies (Municipalities) lack financial
credibility on account of their weak finances.
2. Proper Quality of Service and upkeep of the existing urban infra assets is not
being done, leading to poor service quality which does not enthuse the end user
to pay service charges for the urban facilities being used and leading to the user
pay principle not being established.
The Un-sustainable cycle depicted above needs to be broken and converted into a
seamless cycle of sustainability as depicted below.
Figure 3: Unsustainable cycle of events
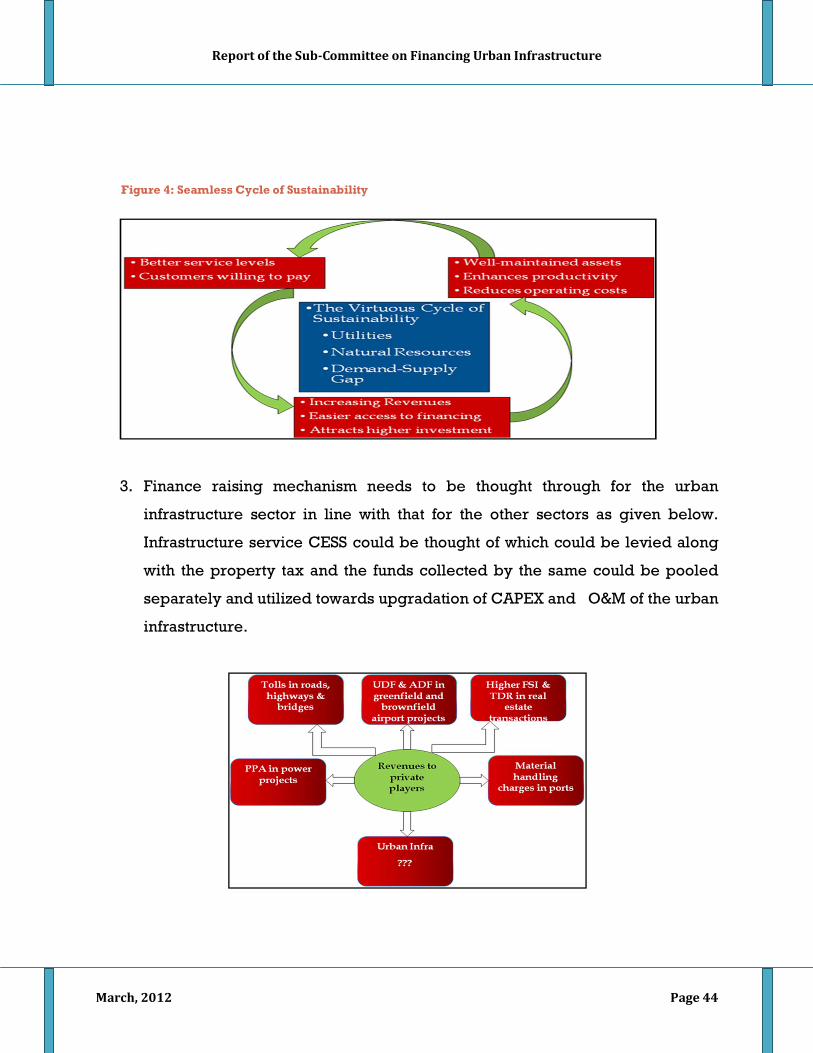
Report of the Sub-Committee on Financing Urban Infrastructure
March, 2012 Page 44
3. Finance raising mechanism needs to be thought through for the urban
infrastructure sector in line with that for the other sectors as given below.
Infrastructure service CESS could be thought of which could be levied along
with the property tax and the funds collected by the same could be pooled
separately and utilized towards upgradation of CAPEX and O&M of the urban
infrastructure.
Figure 4: Seamless Cycle of Sustainability

Report of the Sub-Committee on Financing Urban Infrastructure
March, 2012 Page 45
4. Various models of PPP in the urban infrastructure may be encouraged in a
gradual sequence below across the country with a better coordination
between Centre and State Government so that the Developers and Users at
large can slowly graduate to the concept of user pay principle rather than
attempting the same overnight.
5. The Municipalities urban and rural street lighting CAPEX and O&M costs can
be minimized if the LED lighting based PPP based projects are undertaken in
consultation with the Ministry of IT& Communications and the Bureau of
Energy Efficiency (BEE). The new technology of street lighting saves lot of
resources in terms of revenue expenses to the Municipalities
6. The Public Municipal Debt Obligations (PMDO) scheme managed by IL&FS in
coordination with IIFCL, IDBI and other banks may enhance the corpus fund
from the present Rs. 5000 Cr to Rs. 10,000 Cr to fund more Urban Infra
projects
7. Solid Waste Management may be linked effectively to the Renewable Power
Generation by Municipalities with a good PPP model and utilize the Tons of
Organic Solid Waste can be used to meet the street lighting and other
Municipalities services power requirements and balance can be sold
commercially
8.4 Land based financing
Evidence suggests that land especially in and around urban areas can be tapped for
generating resources for supporting urbanization. Sales from MMRDA land auctions
in just one complex (Bandra-Kurla complex) in January 2006 was a staggering
Rs.23.0 billion, which was two times more than the total infrastructure investment

Report of the Sub-Committee on Financing Urban Infrastructure
March, 2012 Page 46
made by the Mumbai Municipal Corporation, during 2004-05 (which was only
Rs.10.4 billion) and four times more than MMRDA’s own infrastructure investment in
2004-05 which was a mere Rs.5.4 billion. The information on the activities of
Development Authorities who are primarily responsible for raising revenue through
land based instruments has been limited and very few studies have covered the
subject of land monetization. The Report on Monetizing Land done for the 13th
Finance Commission by Kala Seetharam Sridhar (Land as a Municipal Financing
Option: A Pilot Study from India) has presented a case for financing urbanization
using land based instruments. As per the study, about 15 per cent of ULB revenues
have in the 10 years (1998-99 to 2007-08) come from the sale / lease of land by
Development Authorities in the cities of Kolkata, Bangalore and Ahmedabad.
The Working group for the Planning Commission has worked out the contribution
from land based instruments on a normative basis ascribing a value to fresh
serviced land which is added to the urban land pool every year. If a charge of Rs. 10
per sft of built up land is charged over and above the recovery of basic
infrastructure costs, it would contribute Rs. 4403 Cr p.a. which is 0.07% of GDP. This
works out to be 10% of total ULB expenditure. Accordingly, the revenues from land
based instruments are assumed to be 5 per cent of total expenditure in first two
years of 12th Plan period and 8 per cent in 3rd year of 12th Plan; and subsequently 10
per cent. This value is determined by the interplay of a number of factors, the timing
and sequence of each of which produces widely different value realizations. It is
important to put in place a model process for aggregating land for urbanization.
Some features of such a model process could include:
§ Preparation of Master Plan in a standardized manner on a regular basis
§ Ensuring land patterns as per approved Master Plans
§ Sequencing of the land development process to generate resources for
infrastructure creation
§ Delineate the roles and responsibilities of Urban Development Authorities and
Municipalities in the land management process
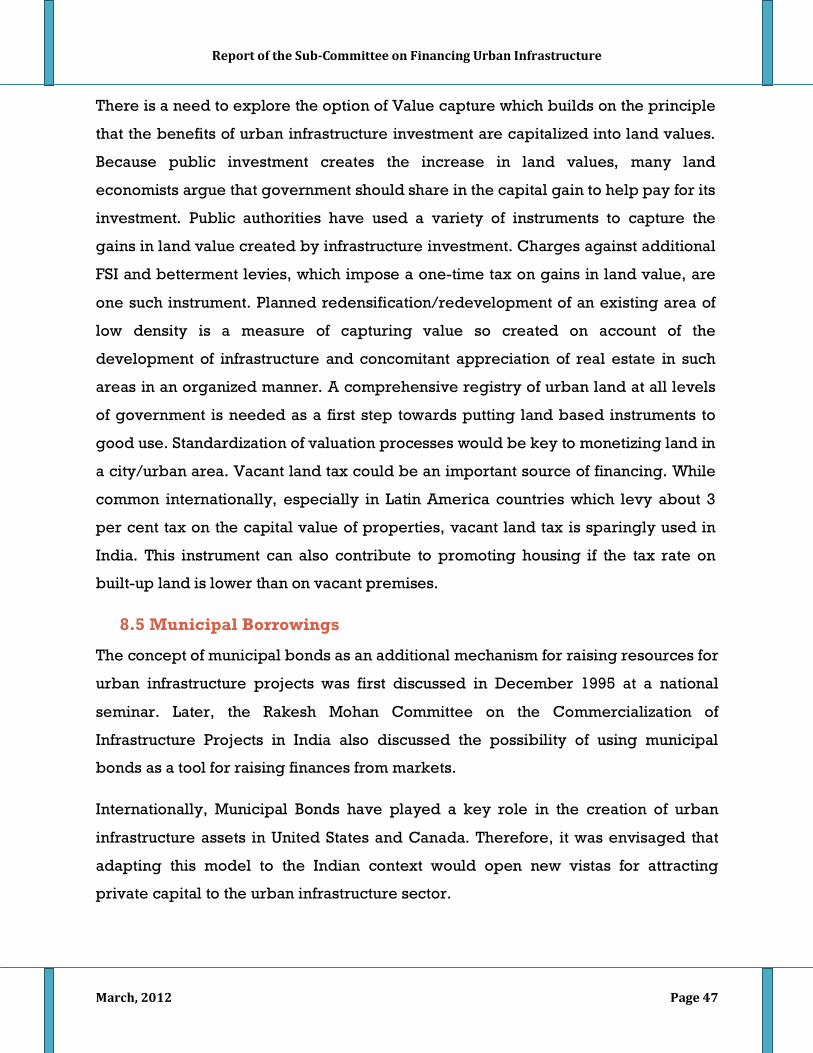
Report of the Sub-Committee on Financing Urban Infrastructure
March, 2012 Page 47
There is a need to explore the option of Value capture which builds on the principle
that the benefits of urban infrastructure investment are capitalized into land values.
Because public investment creates the increase in land values, many land
economists argue that government should share in the capital gain to help pay for its
investment. Public authorities have used a variety of instruments to capture the
gains in land value created by infrastructure investment. Charges against additional
FSI and betterment levies, which impose a one-time tax on gains in land value, are
one such instrument. Planned redensification/redevelopment of an existing area of
low density is a measure of capturing value so created on account of the
development of infrastructure and concomitant appreciation of real estate in such
areas in an organized manner. A comprehensive registry of urban land at all levels
of government is needed as a first step towards putting land based instruments to
good use. Standardization of valuation processes would be key to monetizing land in
a city/urban area. Vacant land tax could be an important source of financing. While
common internationally, especially in Latin America countries which levy about 3
per cent tax on the capital value of properties, vacant land tax is sparingly used in
India. This instrument can also contribute to promoting housing if the tax rate on
built-up land is lower than on vacant premises.
8.5 Municipal Borrowings
The concept of municipal bonds as an additional mechanism for raising resources for
urban infrastructure projects was first discussed in December 1995 at a national
seminar. Later, the Rakesh Mohan Committee on the Commercialization of
Infrastructure Projects in India also discussed the possibility of using municipal
bonds as a tool for raising finances from markets.
Internationally, Municipal Bonds have played a key role in the creation of urban
infrastructure assets in United States and Canada. Therefore, it was envisaged that
adapting this model to the Indian context would open new vistas for attracting
private capital to the urban infrastructure sector.

Report of the Sub-Committee on Financing Urban Infrastructure
March, 2012 Page 48
Since 1994, the Indo-US Financial Institution Reform and Expansion-Debt (FIRE-D)
project has worked with national, state and local governments in India to develop a
market-based bond market.
The debt market in India for municipal securities has grown considerably since the
issuance of Ahmedabad bonds. Since 1998, other cities that have accessed the
capital markets through municipal bonds without state government guarantee
include Nashik, Nagpur, Ludhiana, and Madurai. In most cases, bond proceeds have
been used to fund water and sewerage schemes or road projects. India’s city
governments have thus mobilised about Rs.4,450 million from the domestic capital
market through taxable municipal bonds.
It is significant to note that most of the municipal bonds issued so far have been
without a government guarantee. The success of these issues demonstrated that
local governments can access the capital market to finance the efficient delivery of
civic services.
Municipal Bonds form nearly 10% of the debt market in the US. By contrast, in India,
just 1% of the total ULB contribution is funded by municipal bonds. Hence, municipal
bonds have played a limited role as a source of finance for funding ULB contribution
for urban infrastructure projects. Number of regulatory, supply and demand side
constraints exist which need to be tackled in order to promote municipal borrowing
as a significant source of funding local bodies.
However, it is relevant to note that development of Municipal Bond Markets have
taken a long time in most countries. It took USA about 100 years to develop a bond
market.
Repayment tenure: The tenure of the term loans for urban infrastructure too needs
to be reviewed. As most such projects have life of 20 to 30 years, and the user
charges would be able to generate only small surplus, if at all, after paying up the
O&M expenses, it would be necessary to extend the loan repayment period for the
term loans availed by the developer/ concessionaire of such projects.

Report of the Sub-Committee on Financing Urban Infrastructure
March, 2012 Page 49
8.6 Dedicated Urban Transport Fund at Central Government level In urban transport sector, there are huge investments required to be made, to the
tune of Rs. 87,000 cr. in the 12thFive year Plan as per the report of the Working
Group on Urban Transport. As such huge investment needs cannot possibly be met
from traditional budgetary sources alone, the working group has recommended
tapping of innovative financing mechanisms so as to not only catch up with the
backlog but also provide for future. Learning from the global examples, a dedicated
(non lapsable and non fungible) Urban Transport Fund has been recommended at
the National level as envisaged in NUTP-2006. The National Urban Transport Fund
(NUTF), apart from meeting capital needs, will have to cater for possible support to
certain systems during the operations stage too.
The three principles followed to arrive at the sources of which the accruals will be
used for setting up the NUTF are:
a) High Impact- in terms of actual annual contribution to the NUTF
b) Uses “Polluters pay Principle” and
c) Reduce the use of personal vehicles.
After much deliberation, the three sources which qualify on the above mentioned
principles have been identified. The proposals for the same are as below:
a) A Green Surcharge of Rs. 2 on petrol sold across the country: Knowing the
fact that petrol (or motor spirit) is exclusively consumed by the personalized
vehicles and its other uses are limited, a Green Surcharge on Diesel (or high
speed diesel) is not recommended. Diesel in India has its multiple uses and it
is difficult to segregate diesel sold to personalized vehicles. Based on the
estimates, this green surcharge on sale of petrol in the country will generate
about Rs. 3,100 crore in the base year and about Rs. 14,000 crore over the
period of first four years.
b) A Green Cess on existing personalized vehicles: All vehicles in India are
required to be insured every year. There are several public and private
Report of the Sub-Committee on Financing Urban Infrastructure
March, 2012 Page 50
sector enterprises in India which provides insurance to the vehicles at the rate
of 3 percent of the annual insured value both for car and two wheelers. It is
proposed that an additional 4 percent of the vehicle’s insured value shall be
collected as Green Cess. It is estimated that during first year the total
collection from this source in urban areas would be of about Rs. 18,000 Crore
and the amount over first four years will total to about Rs. 83, 200 Crore.
c) Urban Transport Tax on Purchase of New Cars and Two Wheelers: As
Urban Transport Tax on purchase of new personalized vehicle, a 7.5%
additional tax on petrol vehicles and additional 20% in case personalized
diesel vehicles is proposed. This will be help in collecting about Rs. 18,800
crore in the first year and about Rs. 88,800 crore over first four years. In case
of diesel cars, the urban transport tax has been recommended at 20% in order
take care of the fact that diesel is available at substantially subsidized price
and will continue to be so in near future. For arriving at the estimates, diesel
cars have been assumed to be about 30% of the total cars as against 35%
indicated by the present annual sales figures.
The above levies will not only help in generating dedicated pool of resources for
taking up urban transport projects but would also serve as a great disincentive for
use of personalized vehicles. This will serve the twin purpose of providing quality
public transport infrastructure and services at affordable cost and also reducing
congestion and curtailing travel demand on account of use of personalized vehicles.
All the above sources have high impact and high feasibility in terms of actual annual
accrual to the national urban transport fund.
At a time when the exchequer faces the dilemma of meeting ever growing demand
from various sectors amidst constrained government sources of finances and in an
environment where PPP can only very partially meet the financing needs of urban
transport, the proposed National Urban Transport Fund presents itself as an effective
means for funding the urban transport need. In fact the actual potential of this source
is much higher than what even the calculations project. The total annual yield from
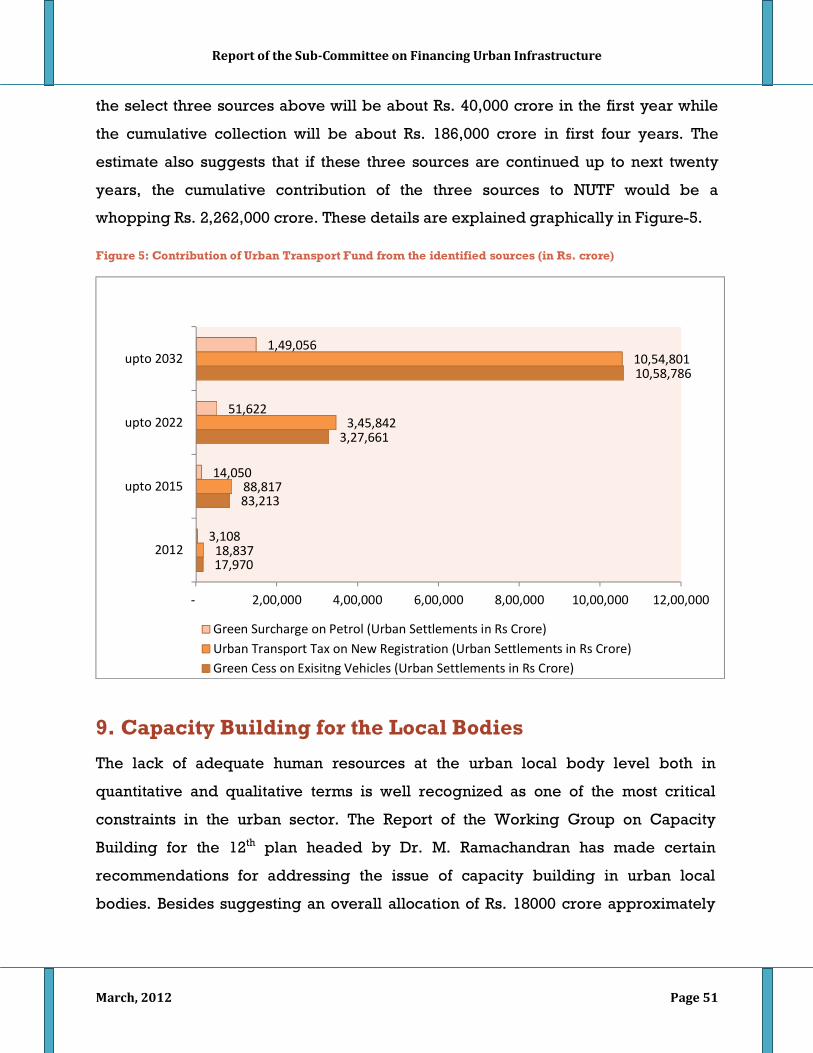
Report of the Sub-Committee on Financing Urban Infrastructure
March, 2012 Page 51
the select three sources above will be about Rs. 40,000 crore in the first year while
the cumulative collection will be about Rs. 186,000 crore in first four years. The
estimate also suggests that if these three sources are continued up to next twenty
years, the cumulative contribution of the three sources to NUTF would be a
whopping Rs. 2,262,000 crore. These details are explained graphically in Figure-5.
Figure 5: Contribution of Urban Transport Fund from the identified sources (in Rs. crore)
9. Capacity Building for the Local Bodies
The lack of adequate human resources at the urban local body level both in
quantitative and qualitative terms is well recognized as one of the most critical
constraints in the urban sector. The Report of the Working Group on Capacity
Building for the 12th plan headed by Dr. M. Ramachandran has made certain
recommendations for addressing the issue of capacity building in urban local
bodies. Besides suggesting an overall allocation of Rs. 18000 crore approximately
17,970
83,213
3,27,661
10,58,786
18,837
88,817
3,45,842
10,54,801
3,108
14,050
51,622
1,49,056
- 2,00,000 4,00,000 6,00,000 8,00,000 10,00,000 12,00,000
2012
upto 2015
upto 2022
upto 2032
Green Surcharge on Petrol (Urban Settlements in Rs Crore)Urban Transport Tax on New Registration (Urban Settlements in Rs Crore)Green Cess on Exisitng Vehicles (Urban Settlements in Rs Crore)

Report of the Sub-Committee on Financing Urban Infrastructure
March, 2012 Page 52
for capacity building during the 12th plan, the working group has suggested the
following steps:
• Short term measures such as assessment of training and capacity needs,
development of Capacity Building framework, formulation of Capacity
Development Plan, provision of consultants and lateral hiring of experts,
development of templates, support by Centres of Excellence, a web-enabled
framework covering all Capacity Building related initiatives, sensitization of
political executives and augmenting of man power in the Ministry of Urban
Development.
• Medium term measures such as development of a road map for city’s Capacity
Building need and drawing baseline, setting targets towards achievement of
National Capacity Building Benchmarks, strengthening of the schemes of Centres
of Excellence by broad basing their activities towards action oriented research,
encouragement of exposure trips and experiential learning, development of
standardized modules, reorienting of the RCUES and National Institute of Urban
Affairs, ramping up the E-Governance Program, evolving of PPP arrangements for
Capacity Building, establishment of a dedicated unit for urban management
including Capacity Building at the state level, induction and training of ULB
personnel, etc.
• Long term measures such as creation of Municipal Cadre, monitoring of
performance of Capacity Building Development Plan, taking mid-course
correction, evaluation and assessment of effectiveness of the Capacity
development Plan.
Most of these suggestions have been endorsed by the Steering Committee on
Urbanisation and accepted by this Group too.

Report of the Sub-Committee on Financing Urban Infrastructure
March, 2012 Page 53
10. Issues relating to financing urban infrastructure and related issues which have a bearing on investment in the sector during the Twelfth Plan
The huge backlog in the urban infrastructure assets for delivering essential services
would necessitate all tiers of governments to accelerate the creation of physical
assets so that the perception of Cities as an attractive investment avenue and its
competitiveness for economic activity is enhanced. Hence, creation of effective
climate for provision of efficient delivery of urban services also requires policy and
process reforms, which in turn will also affect the cities capabilities to attract private
investors to invest in the city’s urban infrastructure too.
Fundamental to the framework, is the need for Municipalities to increase their own
sources of revenue. Failure to do so will put at risk the ability to use other financing
instruments like PPPs or borrowings. A weak revenue scenario, with borrowing or
PPPs getting ruled out, will put further strain on the Government of India to support
the state governments and Municipalities in urban infrastructure financing.
Accordingly, the design of the New and Improved JnNURM should be such that it
creates an environment for Municipalities to increase revenues through better
service delivery, which will push up user charges and other revenue streams. The
Government of India through its contribution under New and Improved JnNURM and
the state governments through revenue sharing arrangements and an enabling
environment for use of PPPs, land based instruments should address the deficit.
Exploring options for alternative sources of resource mobilization, like revenue
shared taxes, increasing the quantum of investment in urban sector under PPPs and
monetization of urban land for use of land as an instrument of financing all requires
Constitutional, legal and administrative actions to be able to use them in an effective
and efficient manner during the 12th Plan. The urgency to deploy more investment
through these sources is necessitated because of the precarious position of the
resources generation (own revenue) capacity of our cities. The need to utilize the
avenues of funding through these sources has to be explored in the 12th plan. Any

Report of the Sub-Committee on Financing Urban Infrastructure
March, 2012 Page 54
lag or slippage on these regard would put lot of stress on the ability of cities to
deliver services effectively and reduce economic activity also.
The urban sector has a bearing on other infrastructure sectors like Transport,
Railways, Oil, Telecommunication, Ports, and Airports. It is thus not evident as to
why it should be treated as a residual sector. This view needs to be revisited
because urban areas will increasingly accommodate a greater portion of the total
population of the country. Financing for Urban Infrastructure needs to be stepped
up to the level of 1.5 percent of GDP in the next plan and it should increase to 2.0
percent by 2021-22 and 2.2 percent by 2031-32.

Report of the Sub-Committee on Financing Urban Infrastructure
March, 2012 Page 55
References
1. Finance Commission of India. (2010). Report of the Thirteenth Finance Commission. Government of India.
2. High Powered Expert Committee (2011), Report on Indian Urban Infrastructure and Services. Government of India.
3. Pandey, K.K.(2011), Stimulating Revenue Base of Municipalities, Indian Institute of Public Administration, New Delhi.
4. Planning Commission, Five Year Plan Documents, India.
5. Planning Commission (2011), Report of the Working Group on Financing Urbanisation, Planning Commission, India.
6. Planning Commission (2011), Report of the Working Group on Capacity Building, Planning Commission, India.
7. Sridhar (2009), Land as a Municipal Financing Option: A Pilot Study from India, A Study carried out for 13th Finance Commission, Public Affairs Centre, Bangalore.
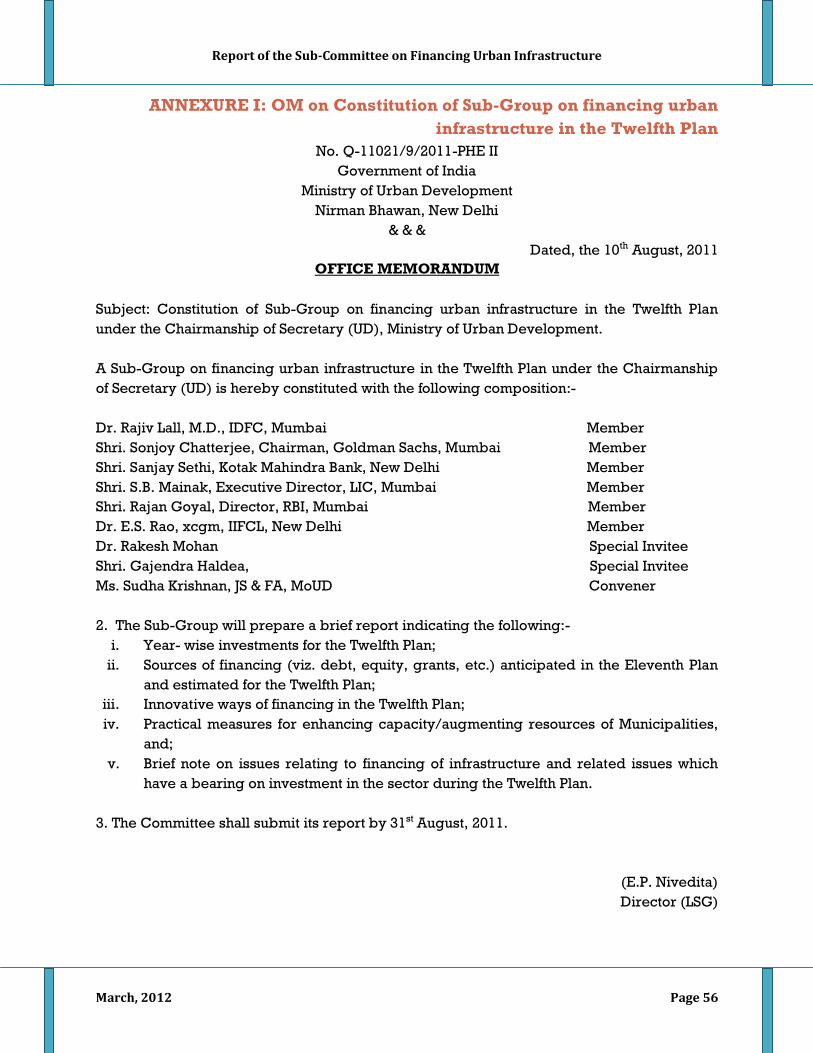
Report of the Sub-Committee on Financing Urban Infrastructure
March, 2012 Page 56
ANNEXURE I: OM on Constitution of Sub-Group on financing urban infrastructure in the Twelfth Plan
No. Q-11021/9/2011-PHE II Government of India
Ministry of Urban Development Nirman Bhawan, New Delhi
……… Dated, the 10th August, 2011
OFFICE MEMORANDUM
Subject: Constitution of Sub-Group on financing urban infrastructure in the Twelfth Plan under the Chairmanship of Secretary (UD), Ministry of Urban Development. A Sub-Group on financing urban infrastructure in the Twelfth Plan under the Chairmanship of Secretary (UD) is hereby constituted with the following composition:- Dr. Rajiv Lall, M.D., IDFC, Mumbai Member Shri. Sonjoy Chatterjee, Chairman, Goldman Sachs, Mumbai Member Shri. Sanjay Sethi, Kotak Mahindra Bank, New Delhi Member Shri. S.B. Mainak, Executive Director, LIC, Mumbai Member Shri. Rajan Goyal, Director, RBI, Mumbai Member Dr. E.S. Rao, xcgm, IIFCL, New Delhi Member Dr. Rakesh Mohan Special Invitee Shri. Gajendra Haldea, Special Invitee Ms. Sudha Krishnan, JS & FA, MoUD Convener 2. The Sub-Group will prepare a brief report indicating the following:-
i. Year- wise investments for the Twelfth Plan; ii. Sources of financing (viz. debt, equity, grants, etc.) anticipated in the Eleventh Plan
and estimated for the Twelfth Plan; iii. Innovative ways of financing in the Twelfth Plan; iv. Practical measures for enhancing capacity/augmenting resources of Municipalities,
and; v. Brief note on issues relating to financing of infrastructure and related issues which
have a bearing on investment in the sector during the Twelfth Plan. 3. The Committee shall submit its report by 31st August, 2011.
(E.P. Nivedita) Director (LSG)
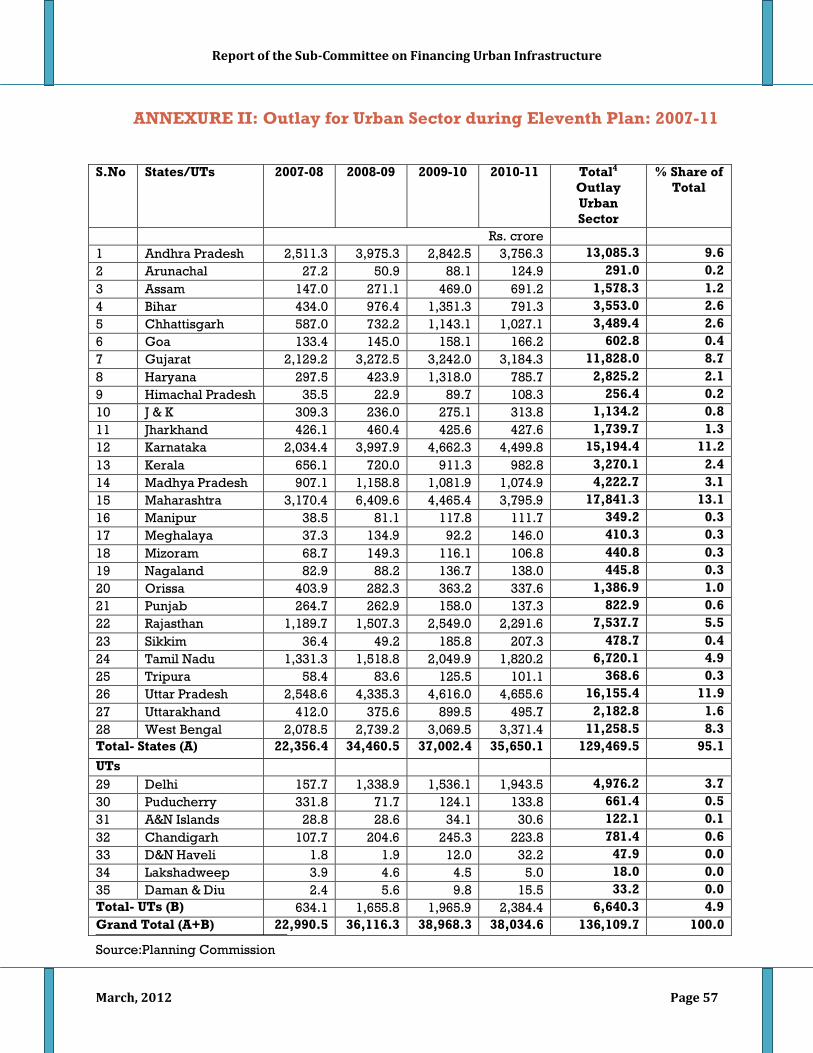
Report of the Sub-Committee on Financing Urban Infrastructure
March, 2012 Page 57
ANNEXURE II: Outlay for Urban Sector during Eleventh Plan: 2007-11
Source:Planning Commission
S.No States/UTs 2007-08 2008-09 2009-10 2010-11 Total4 Outlay Urban Sector
% Share of Total
Rs. crore 1 Andhra Pradesh 2,511.3 3,975.3 2,842.5 3,756.3 13,085.3 9.6 2 Arunachal 27.2 50.9 88.1 124.9 291.0 0.2 3 Assam 147.0 271.1 469.0 691.2 1,578.3 1.2 4 Bihar 434.0 976.4 1,351.3 791.3 3,553.0 2.6 5 Chhattisgarh 587.0 732.2 1,143.1 1,027.1 3,489.4 2.6 6 Goa 133.4 145.0 158.1 166.2 602.8 0.4 7 Gujarat 2,129.2 3,272.5 3,242.0 3,184.3 11,828.0 8.7 8 Haryana 297.5 423.9 1,318.0 785.7 2,825.2 2.1 9 Himachal Pradesh 35.5 22.9 89.7 108.3 256.4 0.2 10 J & K 309.3 236.0 275.1 313.8 1,134.2 0.8 11 Jharkhand 426.1 460.4 425.6 427.6 1,739.7 1.3 12 Karnataka 2,034.4 3,997.9 4,662.3 4,499.8 15,194.4 11.2 13 Kerala 656.1 720.0 911.3 982.8 3,270.1 2.4 14 Madhya Pradesh 907.1 1,158.8 1,081.9 1,074.9 4,222.7 3.1 15 Maharashtra 3,170.4 6,409.6 4,465.4 3,795.9 17,841.3 13.1 16 Manipur 38.5 81.1 117.8 111.7 349.2 0.3 17 Meghalaya 37.3 134.9 92.2 146.0 410.3 0.3 18 Mizoram 68.7 149.3 116.1 106.8 440.8 0.3 19 Nagaland 82.9 88.2 136.7 138.0 445.8 0.3 20 Orissa 403.9 282.3 363.2 337.6 1,386.9 1.0 21 Punjab 264.7 262.9 158.0 137.3 822.9 0.6 22 Rajasthan 1,189.7 1,507.3 2,549.0 2,291.6 7,537.7 5.5 23 Sikkim 36.4 49.2 185.8 207.3 478.7 0.4 24 Tamil Nadu 1,331.3 1,518.8 2,049.9 1,820.2 6,720.1 4.9 25 Tripura 58.4 83.6 125.5 101.1 368.6 0.3 26 Uttar Pradesh 2,548.6 4,335.3 4,616.0 4,655.6 16,155.4 11.9 27 Uttarakhand 412.0 375.6 899.5 495.7 2,182.8 1.6 28 West Bengal 2,078.5 2,739.2 3,069.5 3,371.4 11,258.5 8.3 Total- States (A) 22,356.4 34,460.5 37,002.4 35,650.1 129,469.5 95.1 UTs 29 Delhi 157.7 1,338.9 1,536.1 1,943.5 4,976.2 3.7 30 Puducherry 331.8 71.7 124.1 133.8 661.4 0.5 31 A&N Islands 28.8 28.6 34.1 30.6 122.1 0.1 32 Chandigarh 107.7 204.6 245.3 223.8 781.4 0.6 33 D&N Haveli 1.8 1.9 12.0 32.2 47.9 0.0 34 Lakshadweep 3.9 4.6 4.5 5.0 18.0 0.0 35 Daman & Diu 2.4 5.6 9.8 15.5 33.2 0.0 Total- UTs (B) 634.1 1,655.8 1,965.9 2,384.4 6,640.3 4.9 Grand Total (A+B) 22,990.5 36,116.3 38,968.3 38,034.6 136,109.7 100.0
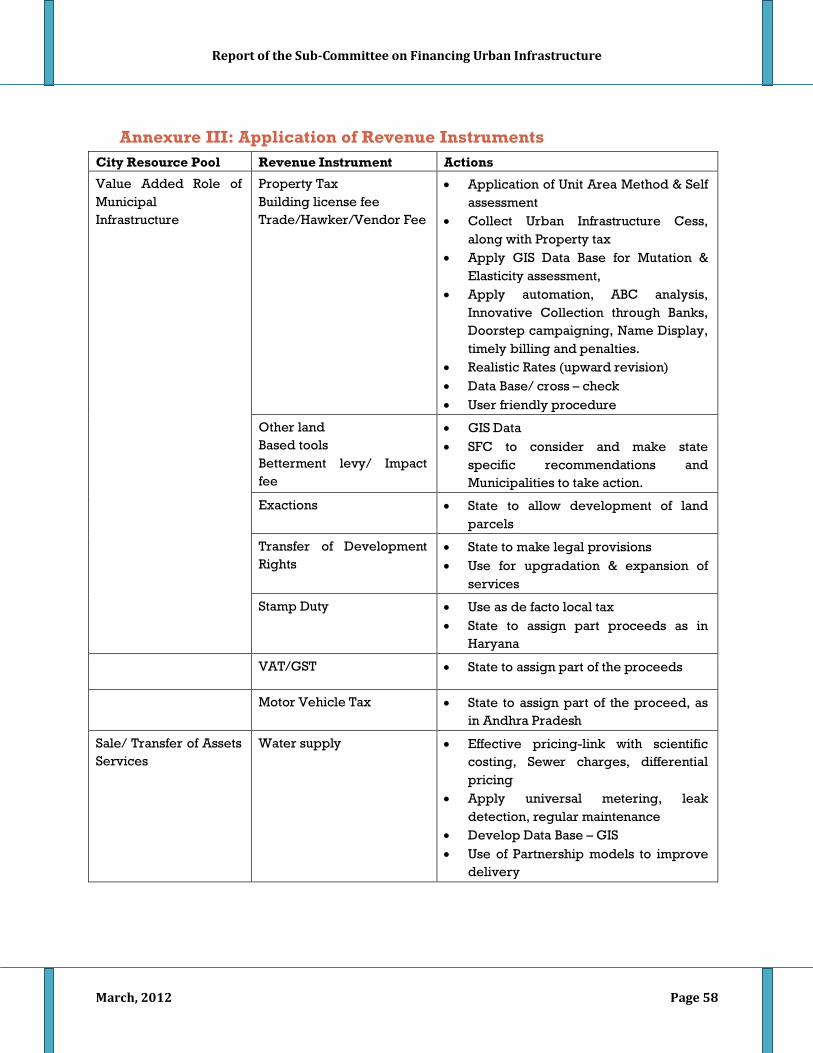
Report of the Sub-Committee on Financing Urban Infrastructure
March, 2012 Page 58
Annexure III: Application of Revenue Instruments City Resource Pool Revenue Instrument Actions
Value Added Role of Municipal Infrastructure
Property Tax Building license fee Trade/Hawker/Vendor Fee
• Application of Unit Area Method & Self assessment
• Collect Urban Infrastructure Cess, along with Property tax
• Apply GIS Data Base for Mutation & Elasticity assessment,
• Apply automation, ABC analysis, Innovative Collection through Banks, Doorstep campaigning, Name Display, timely billing and penalties.
• Realistic Rates (upward revision) • Data Base/ cross – check • User friendly procedure
Other land Based tools Betterment levy/ Impact fee
• GIS Data • SFC to consider and make state
specific recommendations and Municipalities to take action.
Exactions • State to allow development of land parcels
Transfer of Development Rights
• State to make legal provisions • Use for upgradation & expansion of
services
Stamp Duty • Use as de facto local tax • State to assign part proceeds as in
Haryana
VAT/GST • State to assign part of the proceeds
Motor Vehicle Tax • State to assign part of the proceed, as
in Andhra Pradesh
Sale/ Transfer of Assets Services
Water supply • Effective pricing-link with scientific costing, Sewer charges, differential pricing
• Apply universal metering, leak detection, regular maintenance
• Develop Data Base – GIS • Use of Partnership models to improve
delivery

Report of the Sub-Committee on Financing Urban Infrastructure
March, 2012 Page 59
Roads & Related Services • Cess on Petrol /Diesel in cities • Identification of Advertisement
potential/parking fee locations • Apply road cutting charges • Leasing space for communications
towers • Leasing of space for Internet
Equipment/cables • Use tax on Vehicle, animal, cart etc. • Use to TDR for expansion • Identify typology for partial support
(local elasticity) • Street lighting through PPP • Use of annuity models
SWM, Street lighting, Public Conveniences etc.
• Develop PPP & Out Sourcing potential • Develop norms-standards • Application for collection, for
collection, transportation & dumping/treatment
Source: K.K. Pandey, Stimulating Revenue Base of Municipalities, IIPA, 2011.


