

Results Presentation for the First Nine Months
of the Fiscal Year Ending March 31, 2016
January 29, 2016

1. Results Highlights, etc.
Key Financial Data, Segment Results
Operational Performance
Share Repurchase
2. Enrichment of new billing plan

2 2
Steady recovery toward medium-term targets with YOY increase in operating revenues/income
Financial Data
Operational Data
U.S. GAAP
Operating revenues:
Operating income: ¥3,383.5 billion
¥ 685.5 billion
(Up 1.7% year-on-year) (Up 16.8% year-on-year)
(Up 1.4-fold year-on-year)
(Up 2.0-fold from Dec. 31, 2014)
Net additions:
New billing plan subs*:
“docomo Hikari” subs*:
3.01 million
26.52 million
1.09 million
◆ Consolidated financial statements in this document are unaudited * No. of subscriptions as of December 31, 2015
FY2015/1-3Q (Cumulative) Results Summary

3 3
FY2014/1-3Q cumulative
(1)
FY2015/1-3Q cumulative
(2)
Changes (2) – (1)
Operating revenues 3,326.8 3,383.5 +56.7
Operating expenses 2,739.6 2,698.0 -41.7
Operating income 587.1 685.5 +98.4
Net income attributable to NTT DOCOMO, INC. 381.9 492.4 +110.6
EBITDA margin (%) *1 33.2 34.3 +1.1
Capital expenditures
439.3 362.5 -76.8
Adjusted free cash flow *1*2 169.5 388.3 +218.8
U.S. GAAP Selected Financial Data
(Billions of yen)
*1: For an explanation of the calculation processes of these numbers, please see the IR page of our website, www.nttdocomo.co.jp
*2: Adjusted free cash flow excludes the effects of changes in investment derived from purchases, redemption at maturity and disposals of financial instruments held for cash management purposes with original maturities of longer than three months.

4 4
U.S. GAAP
Telecommunications business
Smart life business
Other businesses
FY2014/1-3Q Cumulative
(1)
FY2015/1-3Q Cumulative
(2)
Changes (2) –(1)
2,794.9 2,762.8 -32.1
561.6 616.3 +54.7
324.2 373.8 +49.6
21.8 49.0 +27.2
226.9 265.6 +38.8
3.7 20.2 +16.4
Results by Segment
Operating revenues
Operating income
Operating revenues
Operating income
Operating revenues
(Billions of yen)
◆ As we realigned our operating segments, former “Mobile Communications business” was changed to “Telecommunications business” beginning with the full-year results presentation for FY2014. Accordingly, certain telecommunication service items that had previously been included in “Other businesses” were reclassified into “Telecommunications business”.
◆ In association with the change of organizational structure that took effect on July 1, 2015, certain types of Machine-to-Machine (M2M) communication services that had previously been included in “Other businesses” were reclassified into “Smart life business” beginning with the results presentation for the first six months of the fiscal year ending March 31, 2016.
<Ref.>Smart life business and Other businesses
Operating revenues 551.1 639.4 +88.3
Operating income 25.5 69.2 +43.6
Operating income

5 5 *1: Excluding impact of “Monthly Support” discounts. *2: Sum of cost of equipment sold and commissions to agent resellers
U.S. GAAP Key Factors Behind YOY Changes in
Operating Income (FY14/1-3Q → FY15/1-3Q)
FY14/1-3Q(cumulative)
FY15/1-3Q(cumulative)
Operating revenues: Up 56.7 billion
Operating expenses: Down ¥41.7 billion
¥587.1 billion
Increase in telecommunications services revenues*1: Up ¥96.8 billion ¥685.5 billion
Equipment sales P/L: Down ¥59.2 billion
Impact of “Monthly Support” discounts: Down ¥65.9 billion
Increase in other operating revenues: Up ¥99.1 billion
Decrease in equipment sales revenues: Down ¥73.4 billion
Decrease in equipment sales expenses*2: Down ¥14.2 billion
Decrease in network-related expenses: Down ¥17.1 billion
Decrease in other operating expenses: Down ¥10.5 billion

6 6
FY14/1-3Q(cumulative)
FY15/1-3Q(cumulative)
列1
2.17
FY14/1-3Q(cumulative)
FY15/1-3Q(cumulative)
FY14/1-3Q(cumulative)
FY15/1-3Q(cumulative)
-0.23
0.57%
3.01
-0.03
0.59%
Operational Performance (1)
Trend of improvement continues
Net adds MNP Churn rate (Million subs) (Million subs)
◆ The churn rate calculation method was changed from FY2015/1Q. For the definition of churn rate used in this page, please see the slide “Churn Rate” in the results presentation material for the first three months of the fiscal year ending March 31, 2016.
7 7
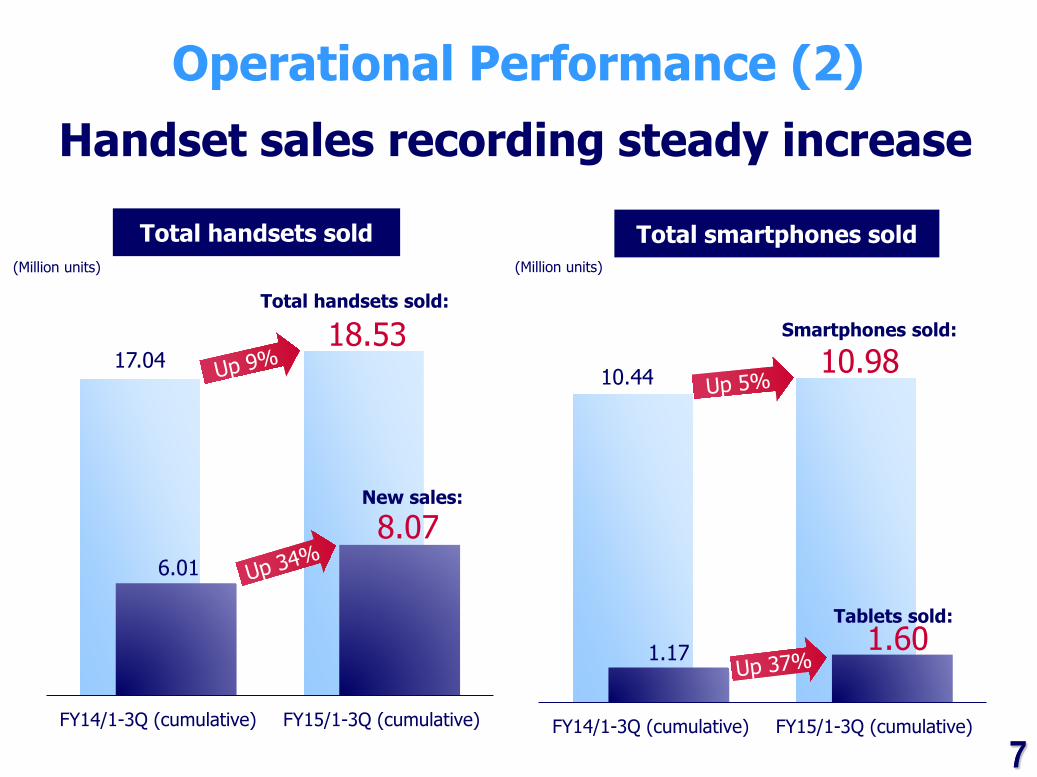
17.04
6.01
FY14/1-3Q (cumulative) FY15/1-3Q (cumulative)
10.44
1.17
FY14/1-3Q (cumulative) FY15/1-3Q (cumulative)
18.53 10.98
1.60
8.07
Handset sales recording steady increase
Operational Performance (2)
Total handsets sold Total smartphones sold (Million units) (Million units)
Total handsets sold: Smartphones sold:
New sales:
Tablets sold:
8 8
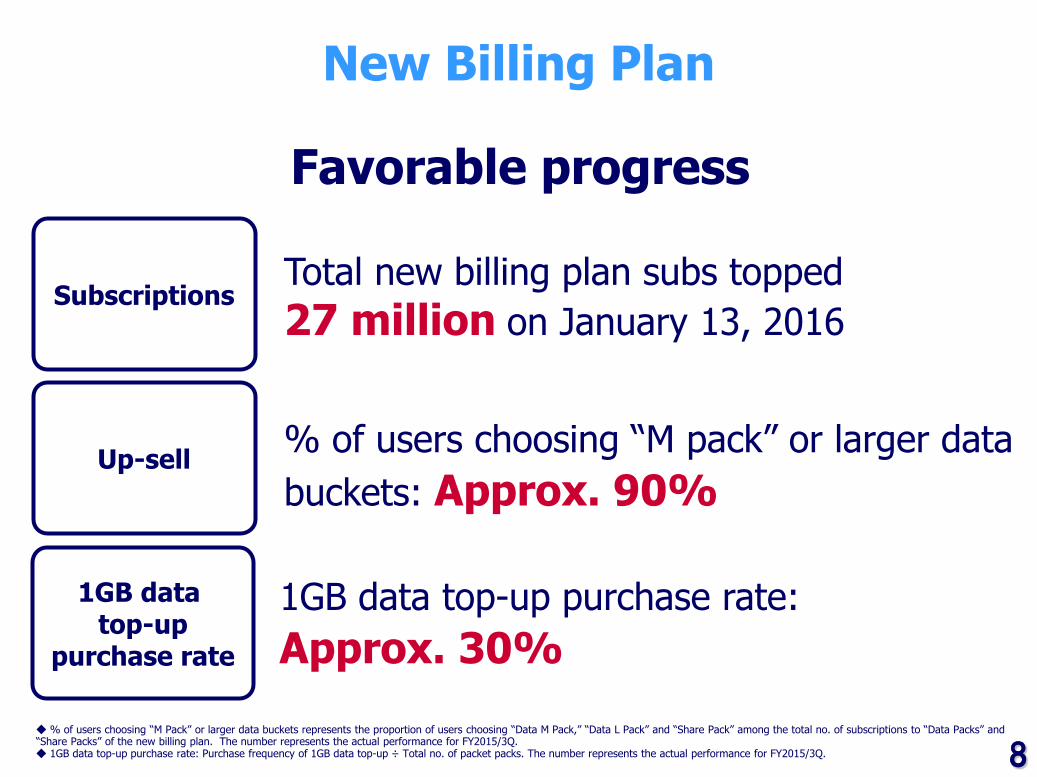
Favorable progress
Subscriptions
1GB data top-up
purchase rate
Up-sell
Total new billing plan subs topped 27 million on January 13, 2016
1GB data top-up purchase rate: Approx. 30%
% of users choosing “M pack” or larger data buckets: Approx. 90%
◆ % of users choosing “M Pack” or larger data buckets represents the proportion of users choosing “Data M Pack,” “Data L Pack” and “Share Pack” among the total no. of subscriptions to “Data Packs” and “Share Packs” of the new billing plan. The number represents the actual performance for FY2015/3Q. ◆ 1GB data top-up purchase rate: Purchase frequency of 1GB data top-up ÷ Total no. of packet packs. The number represents the actual performance for FY2015/3Q.
New Billing Plan

9 9
FY14/4Q FY15/1Q 2Q 3Q
(Million applications)
(From Feb 16, 2015)
0.23
0.42
0.28
0.33
Up-sell
Over 20% of “docomo Hikari” subs have switched to larger data buckets
Promotion of family use
Over 50% of “docomo Hikari” subs have opted to join “Share Pack”
“docomo Hikari” Cumulative subscription applications:
1.25 million
◆ The up-sell rate, new mobile subscription acquisition rate, and “Share Pack” selection rate represent the actual data for FY2015/3Q. The cumulative no. of subscription applications represents the cumulative data from the launch of service through December 31, 2015. The figures in the graph indicate the number of subscription applications for each quarter.
New mobile sub acquisition
Over 50% of “docomo Hikari” Subs are new subscribers to our mobile service

10 10
111 121 128 126 129 136 134
Newly defined ARPU and MOU Trend of improvement continues
(Yen)
New MOU (minutes)
◆ For an explanation on newly defined ARPU and MOU, please see the slide “Definition and calculation methods of ARPU and MOU” in this document.
1,340 1,290 1,260 1,210 1,120 1,240 1,240
2,870 2,820 2,780 2,820 2,870 2,910 2,930
20 40 60
4,210 4,110 4,040 4,030 4,010 4,190 4,230
FY14/1Q 2Q 3Q 4Q FY15/1Q 2Q2 3Q2
Voice ARPU Packet ARPU docomo Hikari ARPU
2Q 3Q

11 11
FY14/1-3Q (Cumulative) FY15/1-3Q (Cumulative)
25.5
69.2
Smart Life Business & Other Businesses: Operating Income
(Billions of yen)
Trending favorably: primary driver behind income growth
Content services (“dmarket”, etc.)
Finance/payment services (credit, etc.)
Group companies
(OAK LAWN MARKETING, INC., etc.)
Other businesses
(Mobile Device Protection Service)
Principal services, etc:

12 12
FY14/3Q 4Q FY15/1Q 2Q 3Q
9.66
14.26
Growth continues
“dmarket” Subscriptions
(Million subs)
◆ No. of “dmarket” subscriptions in this page accounts for only monthly subscriptions, and one-time transactions are not included. The numbers in the graph above represent the subscriber count at the end of each quarter.
No. of subs (As of Dec. 31, 2015)
“dTV” “danime store”
“dhits”
“dkids” “dmagazine”
“dgourmet”
4.8 million subs 2 million subs
3.45 million subs 740,000 subs
510,000 subs 2.76 million subs

13 13
FY14/3Q 4Q FY15/1Q 2Q 3Q
1,350
1,040
“dmarket” Usage Per Subscriber
Growing steadily (Yen)
◆ The quarterly “dmarket” usage per subscriber is calculated by dividing the total amount of “dmarket” transactions for the quarter by the sum of unique users for each month in the quarter. The amounts are exclusive of tax.
Up approx. 30%

14 14
“dCARD” & ”dPOINT” Uptake expanding favorably
after December 2015 dCARD dPOINT
No. of “dPOINT CARDs” registered:
1.16 million
No. of net additions (FY15/3Q):
190,000 (Approx. 4-fold year-on-year)
◆ Effective November 20, 2015, “DCMX” was rebranded into “dCARD.” The cumulative number of “dCARD” subscriptions represents the sum of “dCARD” and “dCARD mini” subscriptions.
No. of “dPOINT Club” members:
Approx. 54 million Total subs (as of Dec. 31, 2015) :
16.11 million

15 15
New “+d” Partner Entered into Alliance with
major department store Takashimaya
More benefits More fun More convenience
◆ During the period from April 1 through July 31, 2016, “dPOINTs” worth 3% of purchase amount will be granted for payments made with “dCARD.” From August 2016 onward, “dPOINTs” worth 2% will be granted for payments made with “dCARD,” and 1% for the presentation of “dPOINT CARD” (including “dCARD”), allowing cardholders to accumulate points worth a total of 3% of purchase amount. ◆ From Aug. 1, 2016 onward, cardholders will be allowed to earn “dPOINTs” worth 1% of purchase amount only by presenting the dPOINT CARD” (including “dCARD”).
Starting April 1, 2016,
Users paying with “dCARD” will be able to earn “dPOINTs” worth 3% of the purchase amount (Handling of “dPOINT CARD” to start from Aug. 2016)
16
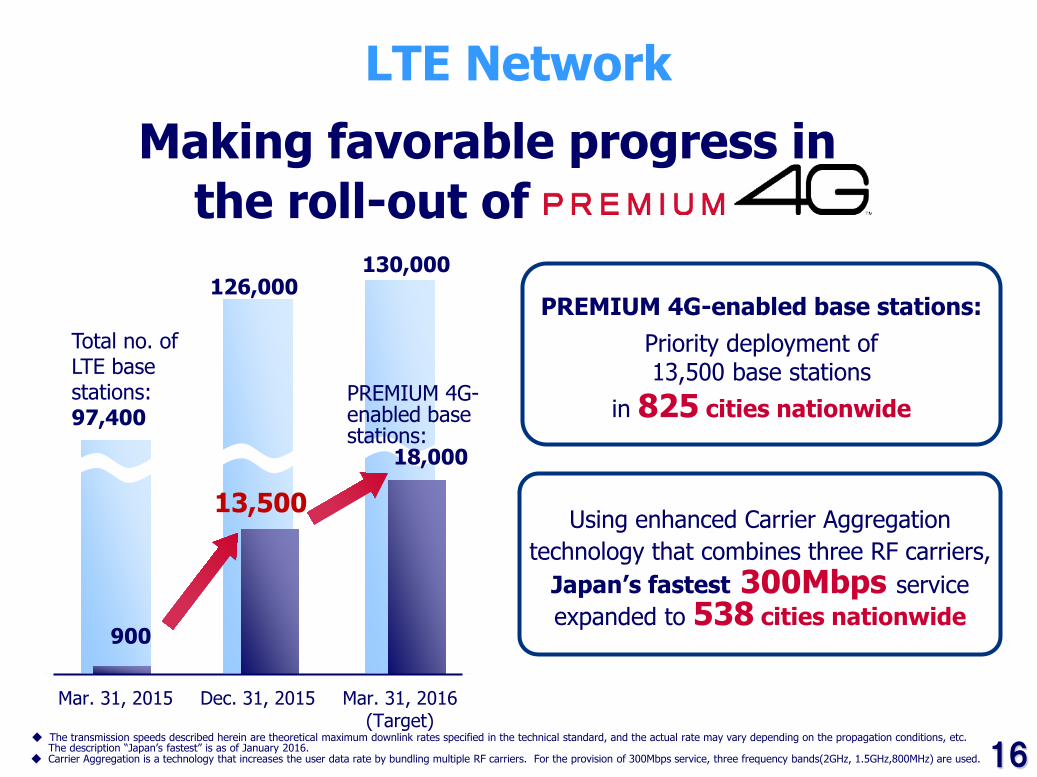
Mar. 31, 2015 Dec. 31, 2015 Mar. 31, 2016(Target)
Making favorable progress in the roll-out of
Using enhanced Carrier Aggregation technology that combines three RF carriers,
Japan’s fastest 300Mbps service expanded to 538 cities nationwide
PREMIUM 4G-enabled base stations: Priority deployment of 13,500 base stations
in 825 cities nationwide
LTE Network
130,000 126,000
Total no. of LTE base stations: 97,400
13,500
900
PREMIUM 4G-enabled base stations: 18,000
◆ The transmission speeds described herein are theoretical maximum downlink rates specified in the technical standard, and the actual rate may vary depending on the propagation conditions, etc. The description “Japan’s fastest” is as of January 2016. ◆ Carrier Aggregation is a technology that increases the user data rate by bundling multiple RF carriers. For the provision of 300Mbps service, three frequency bands(2GHz, 1.5GHz,800MHz) are used.

17
Effective Speed Measurement Results
DOCOMO au Soft bank
Download
High data rates delivered for both download and upload
Upload
DOCOMO au Soft bank
Maximum value
Minimum value
Upper quartile
Median value
Lower quartile
【Legend】
◆ Measurement was performed in accordance with the “Guidelines for the Effective Speed Measurement Method of Internet Connection Services Provided by Mobile Telecommunications Carriers” set forth by the Ministry of Internal Affairs and Communications of Japan. The values of other companies were derived from data published on their respective home pages (as of December 2015). The values in the graph represent the combined measurement results of Android and iOS devices. ◆ For details concerning the measurement methodology including the cities where the measurements were performed, please refer to the materials published by each company.
200
100
0
Median value 71
Max. value
228
21
40
71 58
6
22
0
40
20
(Mbps)
Median value
Max. value

18 18
FY15/1-3Q
(Cumulative)
FY15 full-year
(Target)
-195
Focus Areas: 【Network】 Capital expenditures, maintenance outsourcing cost, etc.
【Marketing】 Sales tools, phone bill preparation/ delivery expenses, etc.
【Other】 R&D, Information system, etc.
-220
Achieving favorable progress
Cost Efficiency Improvement
(Billions of yen)
1H actual: -130
3Q actual: -65

19 19
Share Repurchase
【Details】 • Class of shares to be repurchased:
Common stock • Aggregate number of shares to be repurchased:
Up to 220 million shares • Aggregate price of shares to be repurchased:
Up to ¥500 billion • Period for share repurchase:
From February 1 to December 31, 2016
Reinforce shareholder returns and improve capital efficiency

FY2015/1-3Q Results Snapshot
Recorded an increase in both operating revenues and income over the same period of prior year, making a good recovery toward the delivery of medium-term targets.
Net additions and other operational indicators continued to show improvement.
Telecommunications services revenues achieved a rebound due to the positive effects of the new billing plan and “docomo Hikari” optical-fiber broadband service.
Operating income from Smart life business and Other businesses continued to trend favorably, serving as the main driver behind the Company’s overall income growth. Successfully increased the number of “+d” value co-creation partners at a steady pace.
Steadfast progress in cost efficiency improvement efforts.
Aggressively expanded PREMIUM 4G service in priority areas, and achieved favorable results in effective speed measurements.
Authorized share repurchase up to prescribed maximum limit of ¥500 billion.
20
1. Results Highlights, etc.
Key Financial Data, Segment Results
Operational Performance
Share Repurchase
2. Enrichment of new billing plan

Enrichment of New Billing Plan
Newly add “Share Pack 5”
Expand the applicability of “Kake-hodai Light” plan
NEW
A billing structure that allows customers to use services with peace of mind
for a long period of time by selecting a plans appropriate for the different stages in life
New plan for low-usage customers
NEW
22

For customers with limited data usage!
“Share Pack 30”
“Share Pack 20”
“Share Pack 15”
“Share Pack 10”
“Share Pack 30”
“Share Pack 20”
“Share Pack 15”
“Share Pack 10”
“Share Pack 5”
Addition of “Share Pack 5”
23
NEW
Previous scheme Renewed scheme
(¥22,500)
(¥16,000)
(¥12,500)
(¥9,500)
(¥6,500)

NEW
“Kake-hodai”
“Kake-hodai
Light”
Voice Data (Application of “Kake-hodai Light”)
Expand Applicability of “Kake-hodai Light”
“Share Pack 30”: ○
“Share Pack 20”: ○
“Share Pack 15”: ○
“Share Pack 10”: ×→○
“Share Pack 5” : ○
Users can freely choose a combination of voice and data plans based on their actual usage
24

Basic plan ¥1,700
ISP ¥300
¥1,700
¥300
¥1,700
¥300
¥8,500 ¥2,500 ¥2,500
合計 ¥12,700 (¥4,233/person)
“Share Pack 5” Packet Pack ¥6,500 ¥500 ¥500
“Kake-hodai Light” “Kake-hodai Light”
Primary sub
“Kake-hodai Light”
1GB Data use: 1GB 4GB
U25
+1GB “U25 Ouen Discount”
¥13,500 (¥4,500/person) Total
Further, when combined with “Zutto DOCOMO” discount (In case of user with continued subscription of 15 years or more: Discount ¥800)
“Kake-hodai Light” “Share Pack 5”
Total
In case of a 3-member family
25

Planned for launch in March 2016
26
27 27
The new of today, the norm of tomorrow

28 28
Appendices

29
Telecommunications business
Smart life business
Other businesses
等
等
・ Xi services (LTE) ・ FOMA services (3G)
Mobile communications services
・ International services ・ Sales of handset/equipment for each service
・Optical-fiber broadband service Optical-fiber broadband service and other telecommunications service
・ Satellite communications services etc. ・ Overseas cable TV service
Services, etc., Included in Each Reportable Segment
・Video distribution service ・Music distribution service ・Electronic book service etc.
Media/Content services (“dmarket”, etc) ・Credit service
・Proxy bill collection etc.
Finance/Payment services
・Home shopping service ・Music software sales ・Food delivery etc.
・Cooking studio ・Health management ・Medical database etc.
life-Related services
Shopping services (Commerce)
・Mobile device insurance services ・System development/sales/maintenance services etc.

30 30
FY14/1-3Q FY15/1-3Q FY15 full-yearforecast
Telecommunications Services 2,068.7 2,099.6 2,786.0Equipment sales 731.2 657.8 856.0Other operating revenues 526.9 626.0 848.0
U.S. GAAP Operating Revenues
(Billions of yen)
◆ “International services revenues” are included in “Telecommunications services revenues” ◆ Beginning with the full-year results presentation for FY2014, “Telecommunications services revenues” included in conventional “Other operating revenues” in the financial statements for the six months ended September 30, 2014 have been retrospectively reclassified into “Optical-fiber broadband service and other telecommunications services revenues.”
4,490.0
3,326.8 3,383.5
31 31
FY14/1-3Q FY15/1-3Q FY15 full-yearforecast
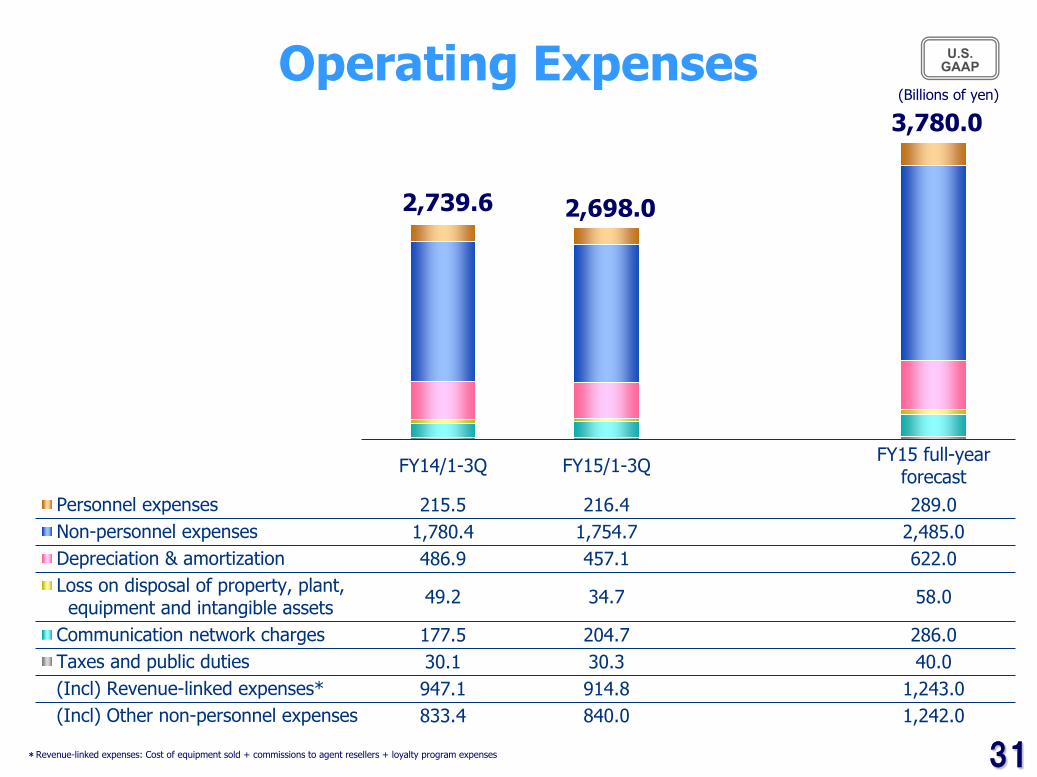
Personnel expenses 215.5 216.4 289.0Non-personnel expenses 1,780.4 1,754.7 2,485.0Depreciation & amortization 486.9 457.1 622.0Loss on disposal of property, plant,equipment and intangible assets 49.2 34.7 58.0
Communication network charges 177.5 204.7 286.0Taxes and public duties 30.1 30.3 40.0(Incl) Revenue-linked expenses* 947.1 914.8 1,243.0(Incl) Other non-personnel expenses 833.4 840.0 1,242.0
U.S. GAAP Operating Expenses
(Billions of yen)
*Revenue-linked expenses: Cost of equipment sold + commissions to agent resellers + loyalty program expenses
3,780.0
2,739.6 2,698.0

32 32
FY14/1-3Q FY15/1-3Q FY15 full-yearforecast
Telecommunications business (LTE (Xi)) 271.6 231.0 353.0Telecommunications business (FOMA) 1.3 0.2 0.0Telecommunications business (Other) 151.2 116.8 219.0Smart life business 9.2 9.0 18.0Others 5.9 5.4 10.0
U.S. GAAP Capital Expenditures
(Billions of yen)
◆ Former “Mobile Communications business” was changed to “Telecommunications business” beginning with the full-year results presentation for FY2014.
600.0
439.3
362.5

Principal Operational Data and Key Indicators
◆ Numbers of subscriptions are as of the end of each period. ◆ ROE is calculated using the average end-of-period shareholders’ equity for the current and previous fiscal periods. ◆ The FY2015 full-year forecasts of Key Indicators are not based on the assumption that DOCOMO will repurchase up to 220 million shares for an amount in total not to exceed ¥500,000 million, as resolved
at the board of directors’ meeting held on January 29, 2016.
FY2014/1-3Q FY2015/1-3Q Changes FY2015(1) (2) (2) - (1) full-year forecast
No. of subscriptions (thousands) 65,274 69,602 +4,328 70,400
28,298 36,293 +7,995 37,800
36,976 33,309 -3,667 32,600
3,834 4,633 +799 -
26,746 31,126 +4,380 32,000
23,396 19,862 -3,534 19,300
Net additional subscriptions (thousands) 2,169 3,006 +837 3,800
17,038 18,526 +1,488 25,700
12,219 14,626 +2,407 -
4,819 3,900 -918 -
Smartphones sold (thousands) 10,436 10,980 +543 14,900
Smartphones users (thousands) 27,330 31,629 +4,299 -
6.9 9.0 +2.1 8.9
75.6 76.8 +1.2 76.4
0.060 0.040 -0.020 0.040
93.58 126.87 +33.29 126.24
LTE (Xi)
FOMA
Handsets sold (thousands) (Including handsets sold without involving sales by DOCOMO)
Cellular phonei-mode(thousands)
sp-mode(thousands)
Communication module service
LTE (Xi)
FOMA
Key Indicators
ROE (%) *Net income attributable to NTT DOCOMO, INC/shareholders’ equity
Shareholders‘ equity ratio (%) *Shareholders’ equity/ Total assets
Debt ratio *Interest bearing liabilities/shareholders’ equity
EPS (yen) *Net income attributable to NTT DOCOMO, INC per share
33

34 34
(*): No. of subscriptions after subtracting communication
module and MVNO subscriptions, etc.
Voice revenues
Philosophy behind New ARPU Definition
* Standalone data plan subscriptions (with no accompanying voice subscription) are not excluded. ◆ Revenues from communication modules, MVNO service subs., etc., are excluded from the revenues accounted for in ARPU (numerator). For an explanation of newly defined ARPU, please see the
slide “Definition and Calculation Methods of ARPU and MOU” in this document.
Changes reflected in new ARPU
Launch of “docomo Hikari”
Start of segment result disclosure, etc.
Increase in no. of users subscribing to multiple mobile devices, e.g., tablets, etc.
Added optical-fiber broadband service revenues to the numerator of ARPU formula Excluded the revenues accounted for in Smart ARPU from the numerator of ARPU formula Removed data plan subs* from the denominator of ARPU formula
Conventional ARPU
(*): No. of subscriptions after subtracting the number of
Data Plan subscriptions from the denominator of conventional ARPU
New ARPU
Packet revenues
Revenues accounted for in Smart ARPU
No. of subscriptions(*)
+ “docomo Hikari” revenues + Voice
revenues Packet
revenues + +
No. of users(*)
Revenues accounted for in Data ARPU:

35 35
1,340 1,290 1,260 1,210 1,120 1,240 1,240
2,870 2,820 2,780 2,820 2,870 2,910 2,930
20 40 60
4,210 4,110 4,040 4,030 4,010 4,190 4,230
FY14/1Q 2Q 3Q 4Q FY15/1Q 2Q 3Q
Voice ARPU Packet ARPU docomo Hikari ARPU
111 121 128 126 129 134
(Yen)
Newly defined ARPU/MOU
New MOU (minutes)
◆ ARPU and MOU calculation methods were changed beginning with the results presentation for the first three months of the fiscal year ending March 31, 2016. Accordingly, the ARPU and MOU data for the first quarter of the fiscal year ending March 31, 2015 (April-June 2014) and subsequent periods were also adjusted to align with the new calculation methods.
◆ For an explanation on the newly defined ARPU and MOU, please see the slide “Definition and calculation method of ARPU and MOU” in this document.
2Q
136

36 36
1,850 1,840 1,850 1,860 1,830 1,990 2,000
3,270 3,200 3,140 3,160 3,210 3,250 3,260
20 40 70
5,120 5,040 4,990 5,020 5,060
5,280 5,330
FY14/1Q 2Q 3Q 4Q FY15/1Q 2Q 3Q
Voice ARPU Packet ARPU docomo Hikari ARPU
(910) (930) (950) (990) (1,050) (1,090) (1,100)
Newly defined ARPU (Exclusive of impacts of discounts)
(Yen)
*: Numbers in parentheses indicate impact of discounts. ◆ ARPU and MOU calculation methods were changed beginning with the results presentation for the first three months of the fiscal year ending March 31, 2016. Accordingly, the ARPU and MOU
data for the first quarter of the fiscal year ending March 31, 2015 (April-June 2014) and subsequent periods were also adjusted to align with the new calculation methods. ◆ For an explanation on the newly defined ARPU and MOU, please see the slide “Definition and calculation method of ARPU and MOU” in this document.
2Q

37 37
1,250 1,190 1,160 1,120 1,020 1,130 1,120
2,670 2,620 2,560 2,580 2,610 2,630 2,630
530 560 620 640 660 690 740
4,450 4,370 4,340 4,340 4,290 4,450 4,490
FY14/1Q 2Q 3Q 4Q FY15/1Q 2Q 3Q
Voice ARPU Packet ARPU Smart ARPU
103 112 118 115 117 121
ARPU/MOU
(Yen)
◆ For the definition of the ARPU contained in this page, please see the slide “Definition and calculation methods of ARPU and MOU” in the presentation material for the full-year results for FY2014
MOU (Minutes)
2Q
122

38 38
1,730 1,700 1,710 1,710 1,670 1,800 1,800
3,040 2,970 2,890 2,890 2,920 2,940 2,930
530 560 620 640 660 690 740
5,300 5,230 5,220 5,240 5,250 5,430 5,470
FY14/1Q 2Q 3Q 4Q FY15/1Q 2Q 3Q
Voice ARPU Packet ARPU Smart ARPU
(850) (860) (880) (900) (960) (980) (980)
ARPU (Exclusive of impacts of discounts)
(Yen)
*: Numbers in parentheses indicate impact of discounts. ◆ Smart ARPU is not impacted by the discount programs. ◆ For the definition of the ARPU contained in this page, please see the slide “Definition and calculation methods of ARPU and MOU” in the presentation material for the full-year results for FY2014.
2Q
39 39
The new of today, the norm of tomorrow

40 40
Definition and Calculation Methods of ARPU and MOU
i. Definition of ARPU and MOU a. ARPU (Average monthly Revenue Per Unit): Average monthly revenue per unit, or ARPU, is used to measure average monthly operating revenues attributable to designated
services on a per user basis. ARPU is calculated by dividing telecommunications services revenues (excluding certain revenues) by the number of active users of our wireless services in the relevant periods, as shown below “ARPU Calculation Method.” We believe that our ARPU figures provide useful information to analyze the average usage per user and the impacts of changes in our billing arrangements. The revenue items included in the numerators of our ARPU figures are based on our U.S. GAAP results of operations.
b. MOU (Minutes of Use): Average monthly communication time per user.
ii. ARPU Calculation Methods Aggregate ARPU = Voice ARPU + Packet ARPU + “docomo Hikari” ARPU - Voice ARPU : Voice ARPU Related Revenues (basic monthly charges, voice communication charges)
/ No. of active users - Packet ARPU : Packet ARPU Related Revenues (basic monthly charges, packet communication charges) / No. of active users - “docomo Hikari” ARPU : A part of other operating revenues (basic monthly charges, voice communication charges)
/ No. of active users - In addition, the sum of Packet ARPU and “docomo Hikari” ARPU is referred to as Data ARPU. iii. Active Users Calculation Method Sum of No. of active users for each month ((No. of users at the end of previous month + No. of users at the end of current month) / 2)
during the relevant period Note:
1. The number of “users” used to calculated ARPU and MOU is the total number of subscriptions, excluding the subscriptions listed below: a. Subscriptions of communication modules services, “Phone Number Storage,” “Mail Address Storage,” “docomo business
Transceiver” and wholesale telecommunications services and interconnecting telecommunications facilities that are provided to Mobile Virtual Network Operators (MVNOs); and
b. Data Plan subscriptions in the case where the customer contracting for such subscription in his/her name also has a subscription for “Xi” or “FOMA” services in his/her name.
2. Revenues from communication module services, “Phone Number Storage,” “Mail Address Storage,” “docomo business Transceiver” and wholesale telecommunications services and interconnecting telecommunications facilities that are provided to Mobile Virtual Network Operators (MVNOs) are not included in the ARPU calculation.

41 41
Special Note Regarding Forward-Looking Statements This presentation contains forward-looking statements such as forecasts of results of operations, management strategies, objectives and plans, forecasts of operational data such as the expected number of subscriptions, and the expected dividend payments. All forward-looking statements that are not historical facts are based on management’s current plans, expectations, assumptions and estimates based on the information currently available. Some of the projected numbers in this presentation were derived using certain assumptions that were indispensable for making such projections in addition to historical facts. These forward-looking statements are subject to various known and unknown risks, uncertainties and other factors that could cause our actual results to differ materially from those contained in or suggested by any forward-looking statement. Potential risks and uncertainties include, without limitation, the following: (1) Changes in the market environment in the telecommunications industry, such as intensifying competition from other businesses or other technologies caused
by Mobile Number Portability, development of appealing new handsets, new market entrants, mergers among other service providers and other factors, or the expansion of the areas of competition could limit the acquisition of new subscriptions and retention of existing subscriptions by our corporate group, or it may lead to ARPU diminishing at a greater than expected rate, an increase in our costs, or an inability to optimize costs as expected.
(2) If current and new services, usage patterns, and sales schemes proposed and introduced by our corporate group cannot be developed as planned, or if unanticipated expenses arise the financial condition of our corporate group could be affected and our growth could be limited.
(3) The introduction or change of various laws or regulations inside and outside of Japan, or the application of such laws and regulations to our corporate group, could restrict our business operations, which may adversely affect our financial condition and results of operations.
(4) Limitations in the amount of frequency spectrum or facilities made available to us could negatively affect our ability to maintain and improve our service quality and level of customer satisfaction and could increase our costs.
(5) Other mobile service providers in the world may not adopt the technologies and the frequency bands that are compatible with those used by our corporate group’s mobile communications system on a continuing basis, which could affect our ability to sufficiently offer international services.
(6) Our domestic and international investments, alliances and collaborations, as well as investments in new business fields, may not produce the returns or provide the opportunities we expect.
(7) Malfunctions, defects or imperfections in our products and services or those of other parties may give rise to problems. (8) Social problems that could be caused by misuse or misunderstanding of our products and services may adversely affect our credibility or corporate image. (9) Inadequate handling of confidential business information including personal information by our corporate group, contractors and others may adversely affect
our credibility or corporate image. (10) Owners of intellectual property rights that are essential for our business execution may not grant us a license or other use of such intellectual property rights,
which may result in our inability to offer certain technologies, products and/or services, and our corporate group may also be held liable for damage compensation if we infringe the intellectual property rights of others. In addition, the illicit use by a third party of the intellectual property rights owned by our corporate group could reduce our license revenues actually obtained and may inhibit our competitive superiority.
(11) Events and incidents caused by natural disasters, social infrastructure paralysis such as power shortages, the proliferation of harmful substances, terror or other destructive acts, the malfunctioning of equipment, software bugs, deliberate incidents induced by computer viruses, cyber-attacks, equipment misconfiguration, hacking, unauthorized access and other problems could cause failure in our networks, distribution channels, and/or other factors necessary for the provision of service, disrupting our ability to offer services to our subscribers and such incidents may adversely affect our credibility or corporate image, or lead to a reduction of revenues and/or increase of costs.
(12) Concerns about adverse health effects arising from wireless telecommunications may spread and consequently adversely affect our financial condition and results of operations.
(13) Our parent company, NIPPON TELEGRAPH AND TELEPHONE CORPORATION (NTT), could exercise influence that may not be in the interests of our other shareholders.
Names of companies, products, etc., contained in this presentation are the trademarks or registered trademarks of their respective organizations.


