

0
Second Quarter of Fiscal Year Ending March 2016
Briefing on Financial Results
October 22, 2015
Ricoh Leasing Company, Ltd.
1
1. Performance Overview (Second Quarter of Fiscal Year
Ending March 2016)
Performance Overview
2
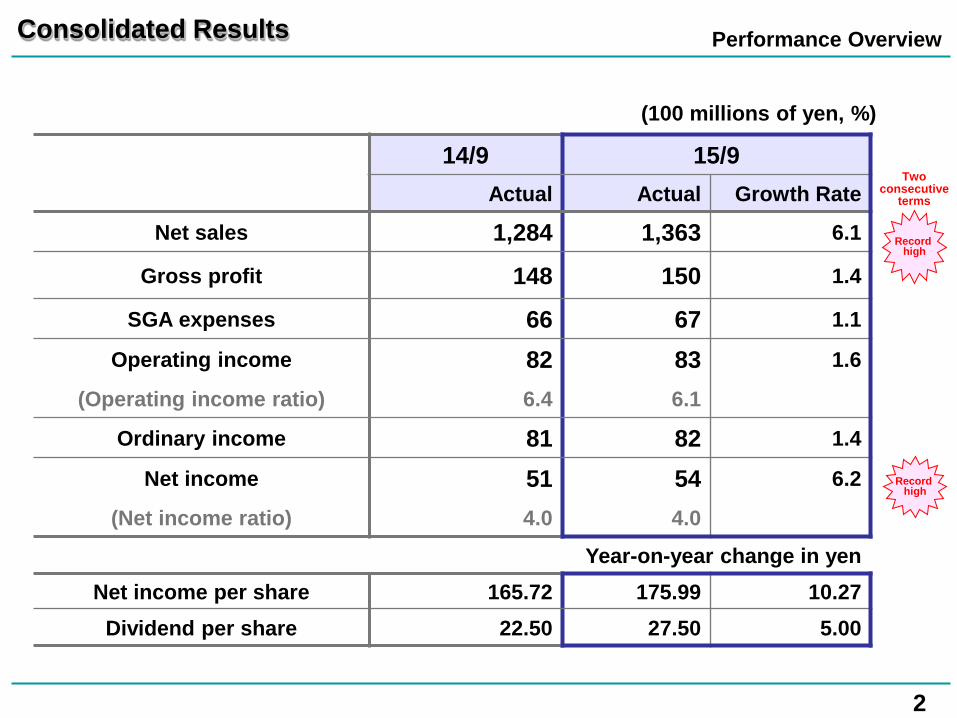
14/9 15/9 Actual Actual Growth Rate
Net sales 1,284 1,363 6.1
Gross profit 148 150 1.4
SGA expenses 66 67 1.1
Operating income 82 83 1.6
(Operating income ratio) 6.4 6.1
Ordinary income 81 82 1.4
Net income 51 54 6.2
(Net income ratio) 4.0 4.0
Year-on-year change in yen Net income per share 165.72 175.99 10.27
Dividend per share 22.50 27.50 5.00
Consolidated Results
(100 millions of yen, %)
Record high
Record high
Two consecutive
terms
Performance Overview
3
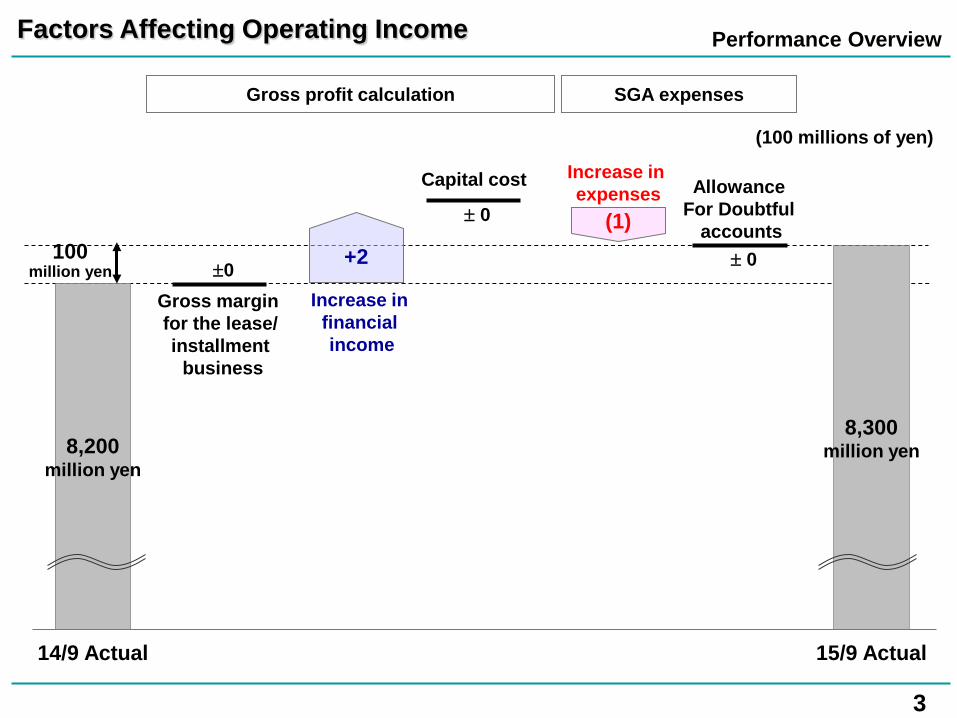
Factors Affecting Operating Income
(100 millions of yen)
8,200 million yen
15/9 Actual
8,300 million yen
14/9 Actual
100 million yen
Gross profit calculation SGA expenses
+2
Increase in financial income
Increase in expenses
(1)
Capital cost
± 0
Gross margin for the lease/ installment business
±0
Allowance For Doubtful
accounts ± 0
Performance Overview
4
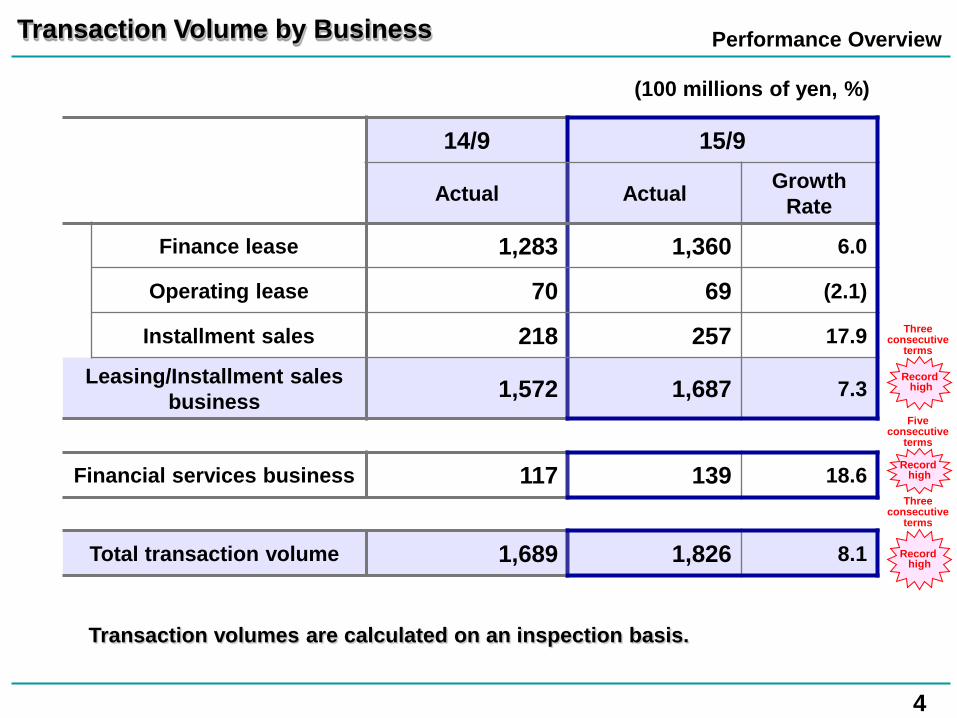
Transaction Volume by Business
(100 millions of yen, %)
Transaction volumes are calculated on an inspection basis.
14/9 15/9
Actual Actual Growth Rate
Finance lease 1,283 1,360 6.0
Operating lease 70 69 (2.1)
Installment sales 218 257 17.9
Leasing/Installment sales business 1,572 1,687 7.3
Financial services business 117 139 18.6
Total transaction volume 1,689 1,826 8.1
Record high
Record high
Record high
Three consecutive
terms
Five consecutive
terms
Three consecutive
terms
Performance Overview
5
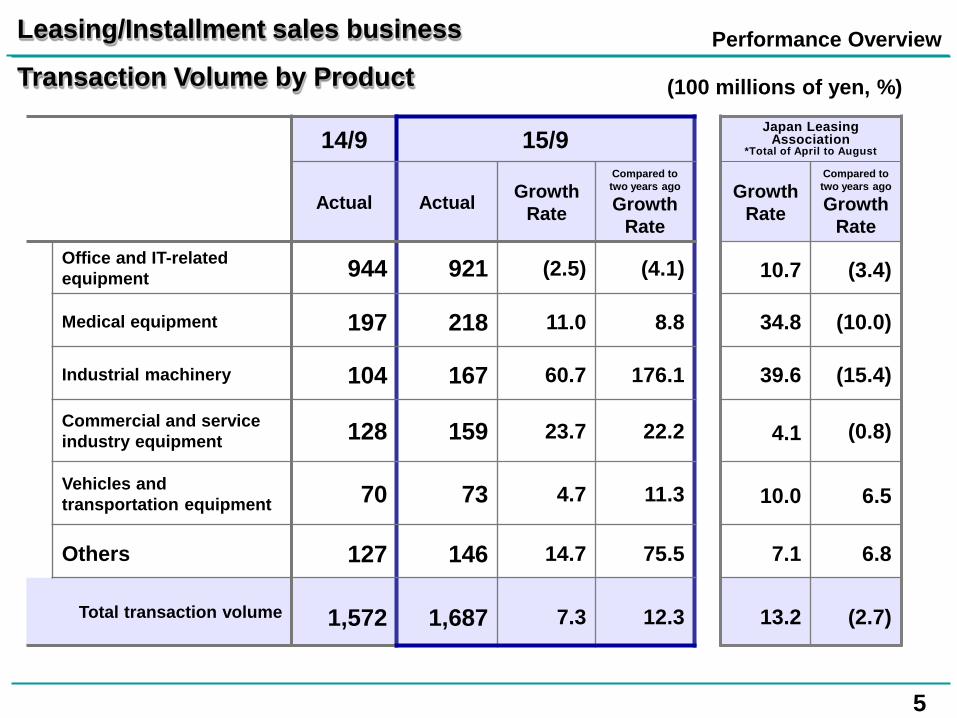
(100 millions of yen, %)
Leasing/Installment sales business
Transaction Volume by Product
14/9 15/9 Japan Leasing
Association *Total of April to August
Actual Actual Growth Rate
Compared to two years ago
Growth Rate
Growth Rate
Compared to two years ago
Growth Rate
Office and IT-related equipment 944 921 (2.5) (4.1) 10.7 (3.4)
Medical equipment 197 218 11.0 8.8 34.8 (10.0)
Industrial machinery 104 167 60.7 176.1 39.6 (15.4)
Commercial and service industry equipment 128 159 23.7 22.2 4.1 (0.8)
Vehicles and transportation equipment 70 73 4.7 11.3 10.0 6.5
Others 127 146 14.7 75.5 7.1 6.8
Total transaction volume 1,572 1,687 7.3 12.3 13.2 (2.7)
Performance Overview
6
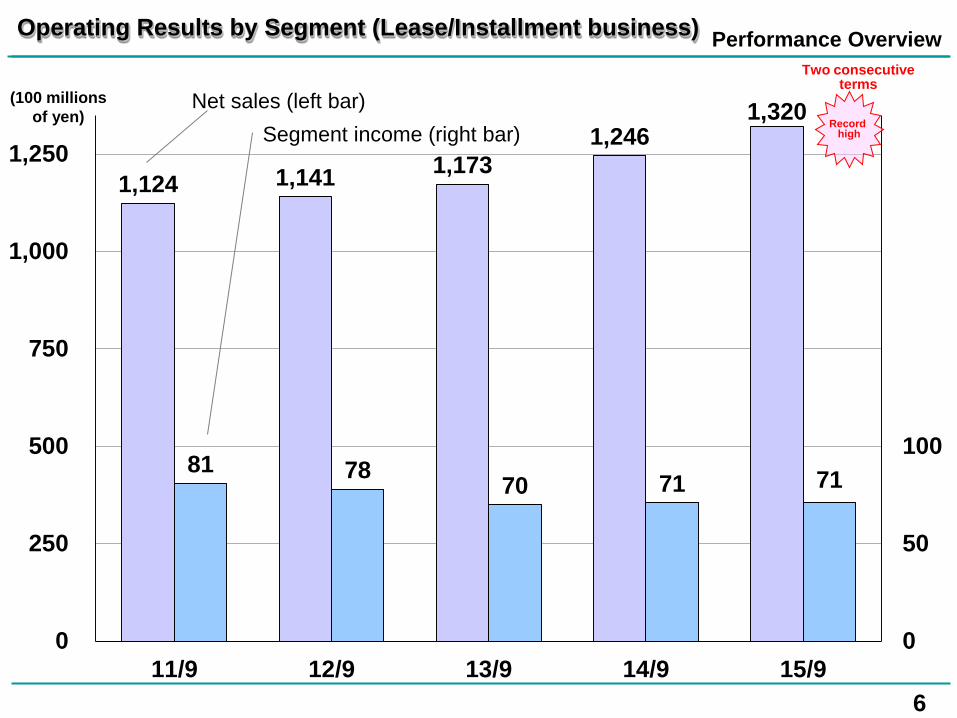
1,124 1,141 1,173 1,246
1,320
81 78 70 71 71
0
50
100
150
200
250
0
250
500
750
1,000
1,250
11/9 12/9 13/9 14/9 15/9
Operating Results by Segment (Lease/Installment business)
(100 millions of yen)
Net sales (left bar) Segment income (right bar)
Record high
Two consecutive terms
Performance Overview
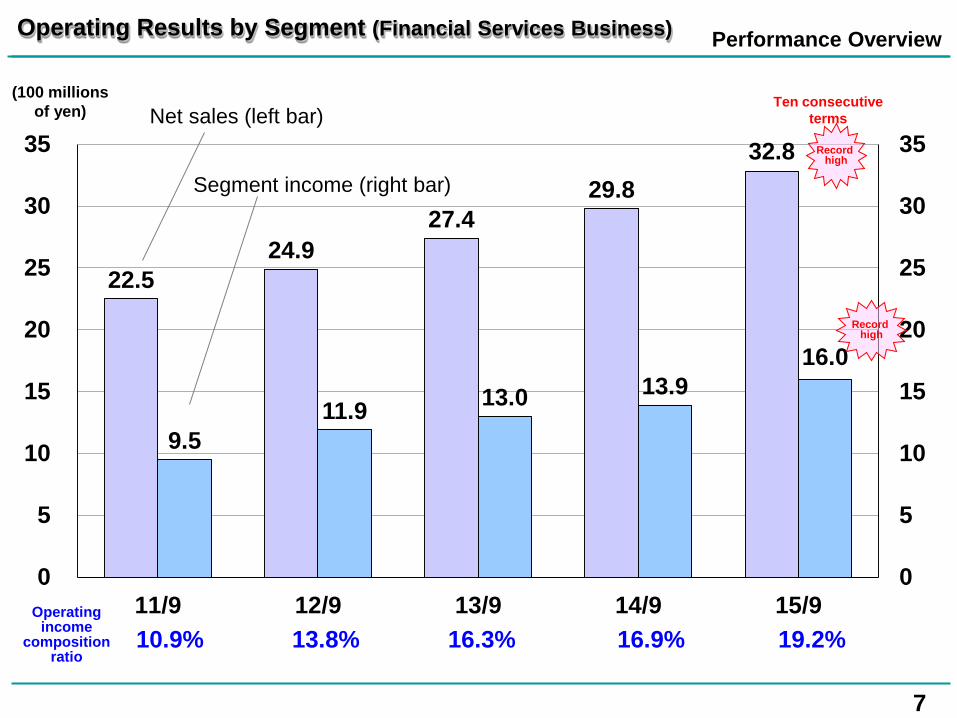
22.5 24.9
27.4 29.8
32.8
9.5 11.9 13.0 13.9
16.0
0
5
10
15
20
25
30
35
0
5
10
15
20
25
30
35
11/9 12/9 13/9 14/9 15/9
7
Operating Results by Segment (Financial Services Business)
Net sales (left bar) (100 millions
of yen)
Operating income
composition ratio
10.9% 13.8% 16.3% 16.9% 19.2%
Record high
Segment income (right bar)
Record high
Ten consecutive terms
Performance Overview
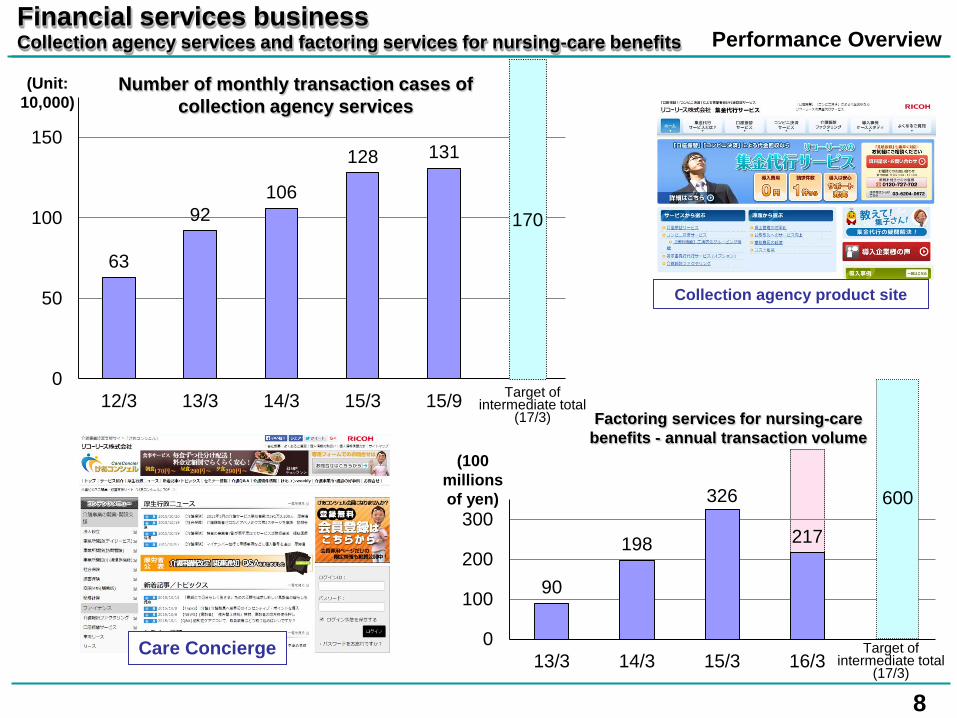
63
92 106
128 131
0
50
100
150
12/3 13/3 14/3 15/3 15/9
8
Financial services business Collection agency services and factoring services for nursing-care benefits
Number of monthly transaction cases of collection agency services
Factoring services for nursing-care benefits - annual transaction volume
Collection agency product site
(Unit: 10,000)
Target of intermediate total
(17/3)
90
198
326
217
0
100
200
300
13/3 14/3 15/3 16/3
600
170
(100 millions of yen)
Care Concierge Target of intermediate total
(17/3)
Performance Overview
9
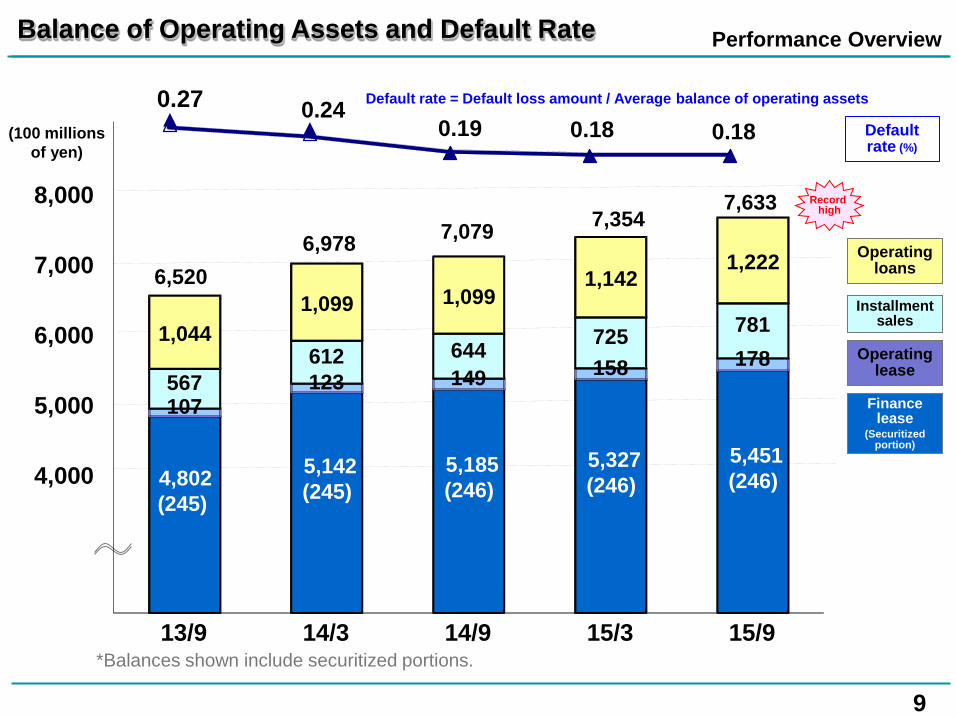
Balance of Operating Assets and Default Rate
Finance lease
(Securitized portion)
Operating loans
Installment sales
Operating lease
*Balances shown include securitized portions.
7,079 7,354
6,520
Default rate = Default loss amount / Average balance of operating assets
Default rate (%)
6,978
7,633
(100 millions of yen)
Record high
4,802 (245)
5,142 (245)
5,185 (246)
5,327 (246)
5,451 (246)
107 123 149 158 178
567 612 644 725 781 1,044
1,099 1,099 1,142
1,222
4,000
5,000
6,000
7,000
8,000
13/9 14/3 14/9 15/3 15/9
0.27 0.24 0.19 0.18 0.18
Performance Overview
10
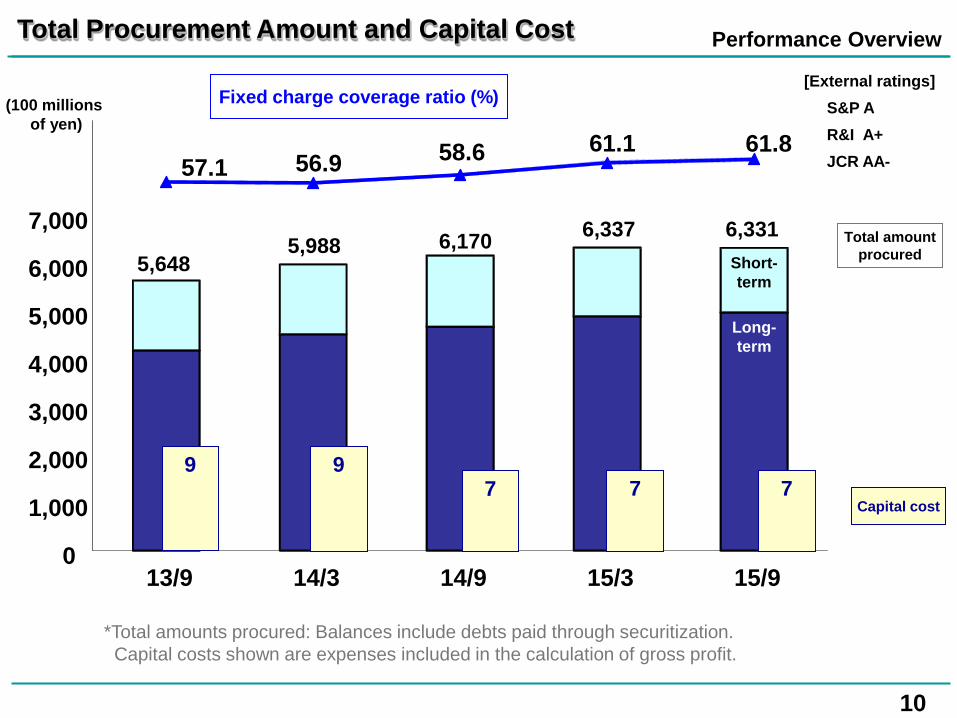
Total Procurement Amount and Capital Cost
[External ratings] S&P A R&I A+ JCR AA-
Fixed charge coverage ratio (%)
Capital cost
Total amount procured
*Total amounts procured: Balances include debts paid through securitization. Capital costs shown are expenses included in the calculation of gross profit.
Long-term
Short-term
57.1 56.9 58.6 61.1 61.8
0
1,000
2,000
3,000
4,000
5,000
6,000
7,000
13/9 14/3 14/9 15/3 15/9
9 7
9 7 7
5,648 5,988 6,170 6,337 6,331
(100 millions of yen)
Performance Overview
11
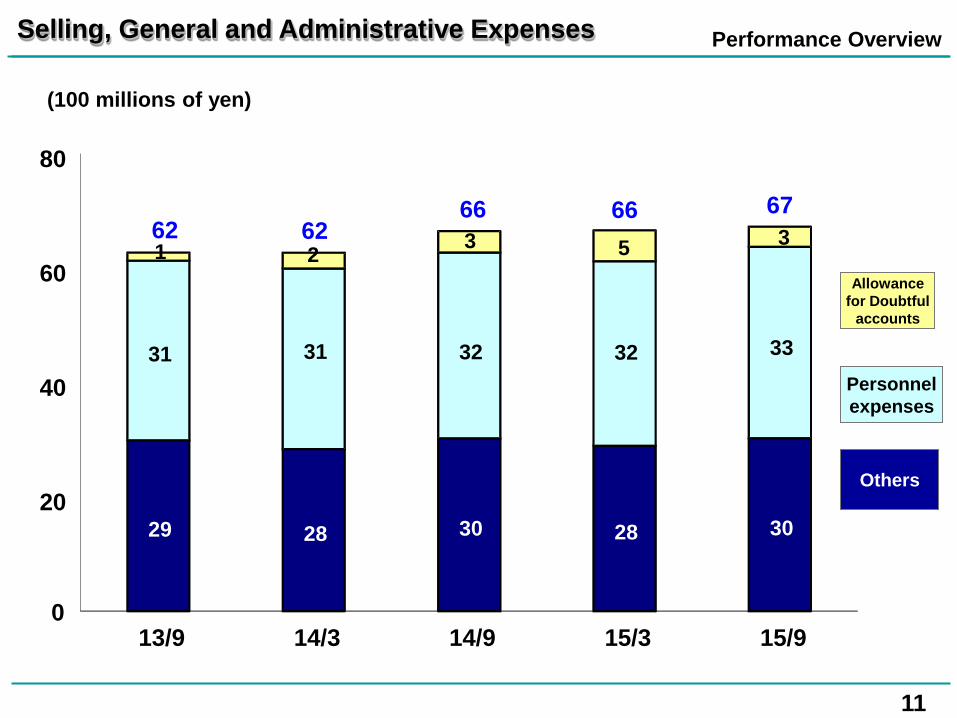
Selling, General and Administrative Expenses
Allowance for Doubtful
accounts
Personnel expenses
Others
(100 millions of yen)
66 66 62 62
67
29 28 30 28 30
31 31 32 32 33
1 2 3 5 3
20
40
60
80
13/9 14/3 14/9 15/3 15/9 0

12
2. Financial Forecast (Fiscal Year Ending March 2016)
Financial Forecast
13
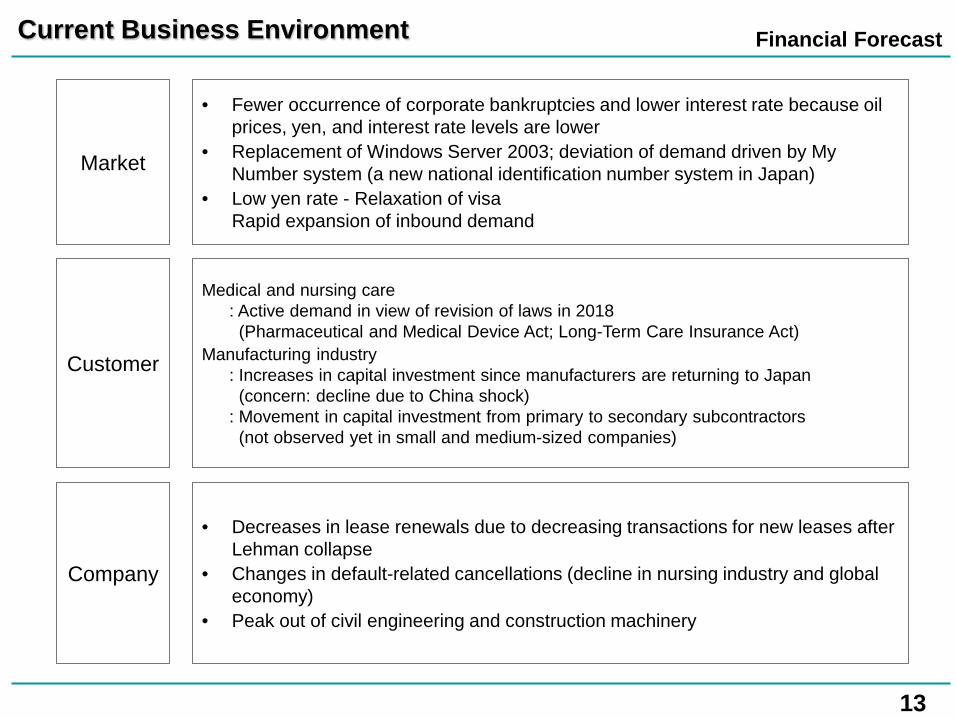
Current Business Environment
• Fewer occurrence of corporate bankruptcies and lower interest rate because oil prices, yen, and interest rate levels are lower
• Replacement of Windows Server 2003; deviation of demand driven by My Number system (a new national identification number system in Japan)
• Low yen rate - Relaxation of visa Rapid expansion of inbound demand
Market
• Decreases in lease renewals due to decreasing transactions for new leases after Lehman collapse
• Changes in default-related cancellations (decline in nursing industry and global economy)
• Peak out of civil engineering and construction machinery
Company
Medical and nursing care : Active demand in view of revision of laws in 2018 (Pharmaceutical and Medical Device Act; Long-Term Care Insurance Act)
Manufacturing industry : Increases in capital investment since manufacturers are returning to Japan (concern: decline due to China shock) : Movement in capital investment from primary to secondary subcontractors (not observed yet in small and medium-sized companies)
Customer
Financial Forecast
14
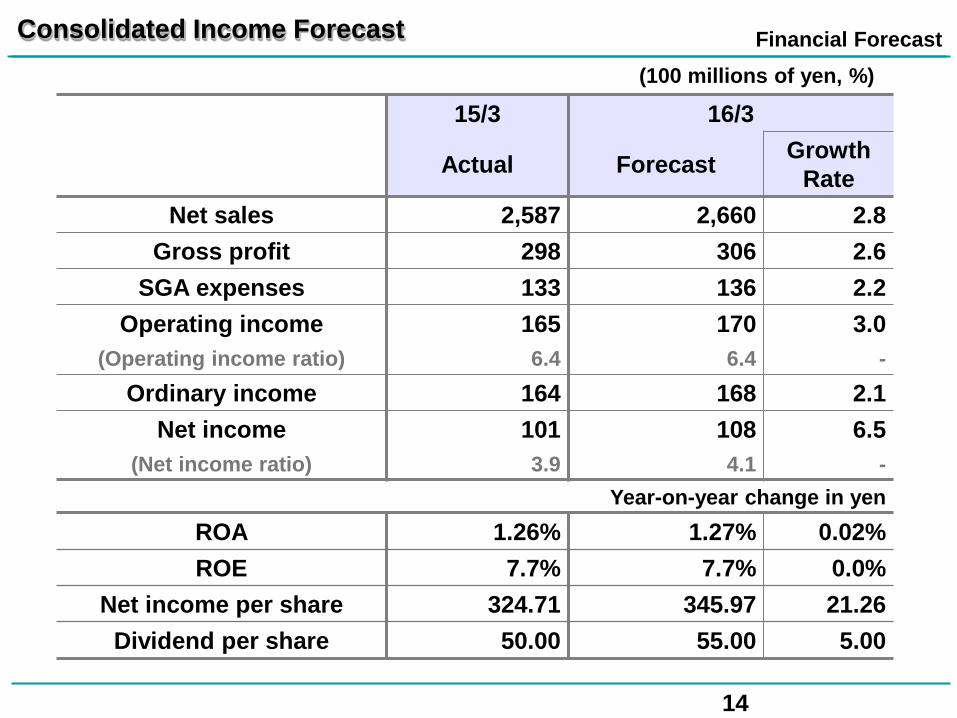
Consolidated Income Forecast (100 millions of yen, %)
15/3 16/3
Actual Forecast Growth Rate
Net sales 2,587 2,660 2.8 Gross profit 298 306 2.6
SGA expenses 133 136 2.2 Operating income 165 170 3.0
(Operating income ratio) 6.4 6.4 - Ordinary income 164 168 2.1
Net income 101 108 6.5 (Net income ratio) 3.9 4.1 -
Year-on-year change in yen ROA 1.26% 1.27% 0.02% ROE 7.7% 7.7% 0.0%
Net income per share 324.71 345.97 21.26 Dividend per share 50.00 55.00 5.00
Financial Forecast
15
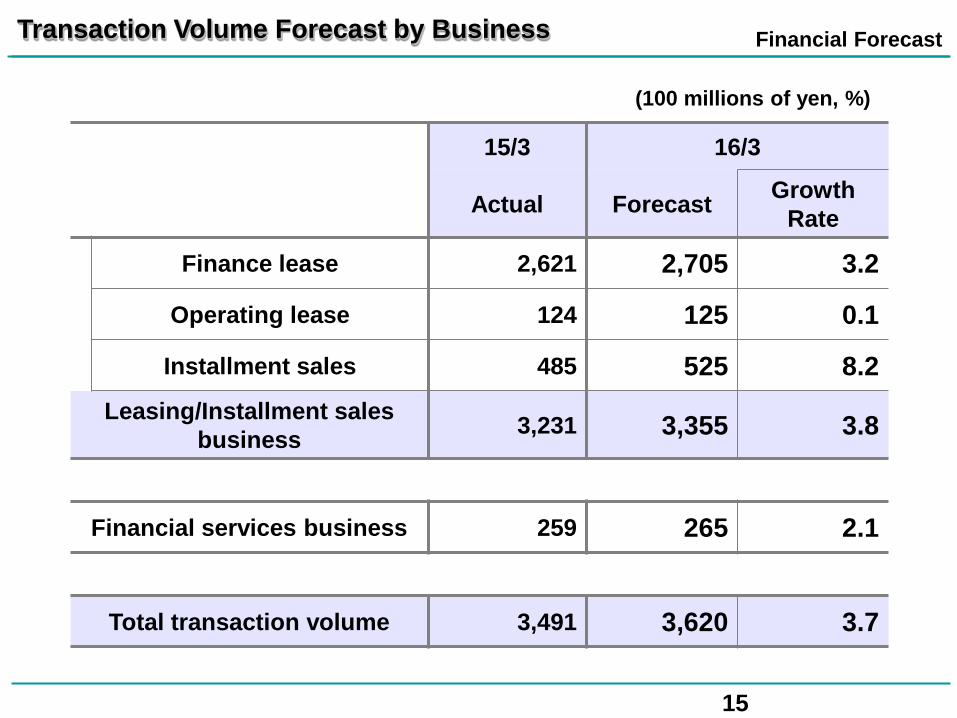
Transaction Volume Forecast by Business
(100 millions of yen, %)
15/3 16/3
Actual Forecast Growth Rate
Finance lease 2,621 2,705 3.2
Operating lease 124 125 0.1
Installment sales 485 525 8.2 Leasing/Installment sales
business 3,231 3,355 3.8
Financial services business 259 265 2.1
Total transaction volume 3,491 3,620 3.7
Financial Forecast
16
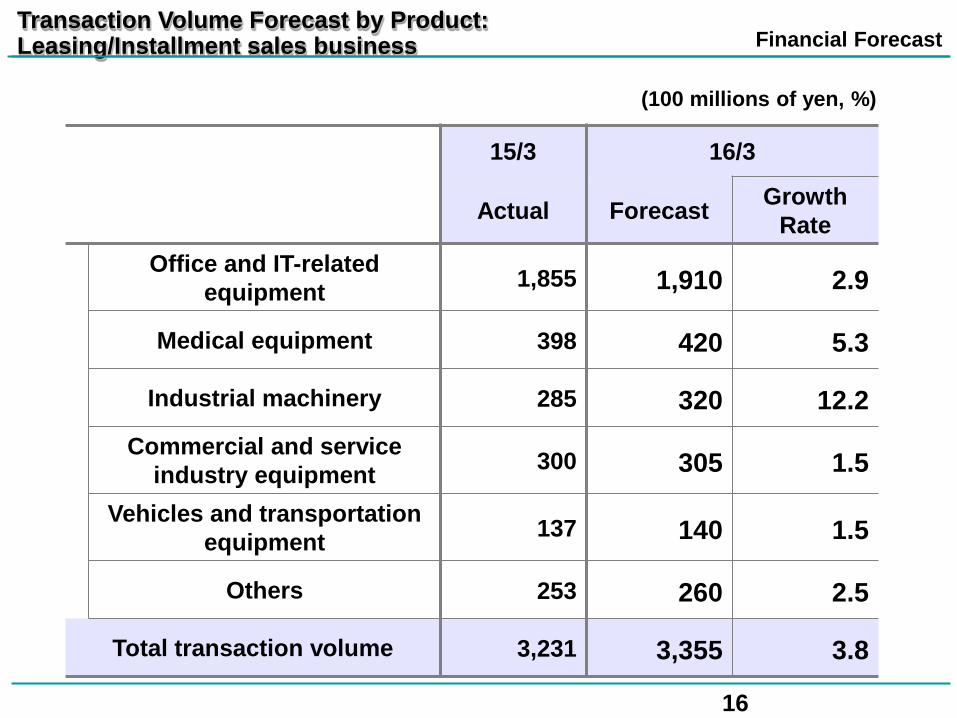
Transaction Volume Forecast by Product: Leasing/Installment sales business
(100 millions of yen, %)
15/3 16/3
Actual Forecast Growth Rate
Office and IT-related equipment 1,855 1,910 2.9
Medical equipment 398 420 5.3
Industrial machinery 285 320 12.2 Commercial and service
industry equipment 300 305 1.5
Vehicles and transportation equipment 137 140 1.5
Others 253 260 2.5
Total transaction volume 3,231 3,355 3.8
Financial Forecast
17
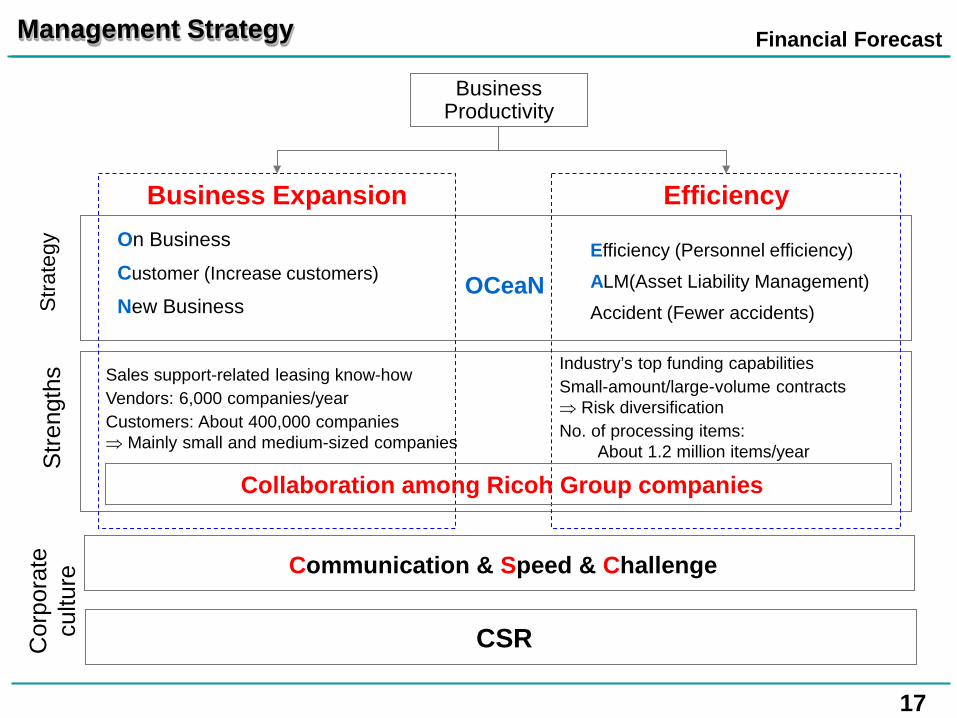
Management Strategy
Business Expansion Efficiency
Business Productivity
On Business
Customer (Increase customers)
New Business
Efficiency (Personnel efficiency)
ALM(Asset Liability Management)
Accident (Fewer accidents)
Sales support-related leasing know-how Vendors: 6,000 companies/year Customers: About 400,000 companies ⇒ Mainly small and medium-sized companies
Industry’s top funding capabilities Small-amount/large-volume contracts ⇒ Risk diversification No. of processing items:
About 1.2 million items/year
OCeaN
Stra
tegy
S
treng
ths
Collaboration among Ricoh Group companies
Communication & Speed & Challenge
CSR Cor
pora
te
cultu
re
Financial Forecast
18
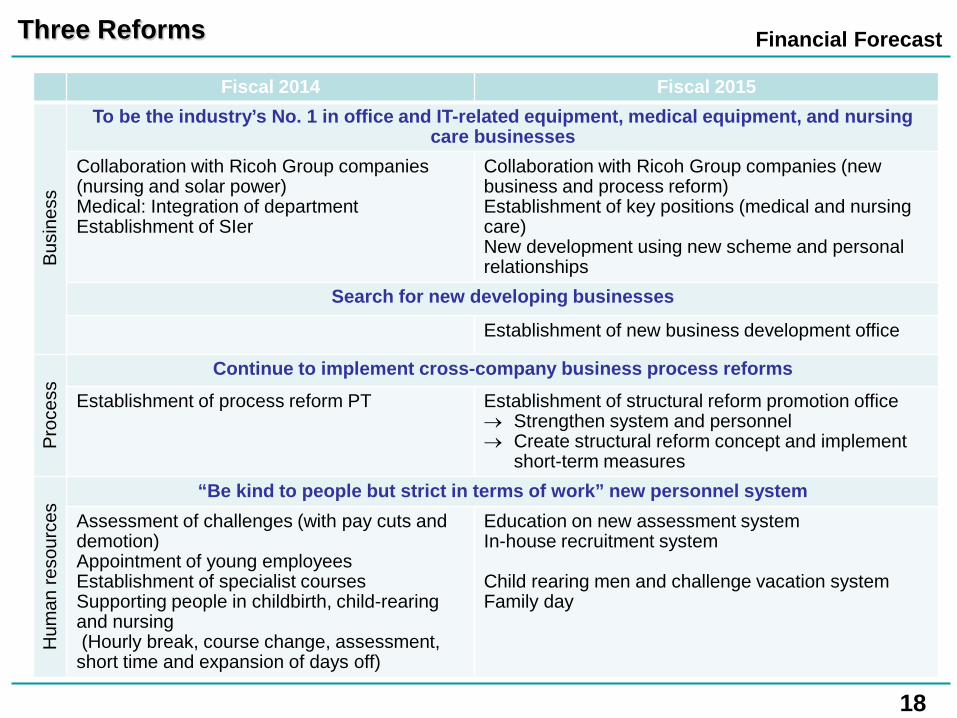
Fiscal 2014 Fiscal 2015
Bus
ines
s
To be the industry’s No. 1 in office and IT-related equipment, medical equipment, and nursing care businesses
Collaboration with Ricoh Group companies (nursing and solar power) Medical: Integration of department Establishment of SIer
Collaboration with Ricoh Group companies (new business and process reform) Establishment of key positions (medical and nursing care) New development using new scheme and personal relationships
Search for new developing businesses
Establishment of new business development office
Pro
cess
Continue to implement cross-company business process reforms Establishment of process reform PT Establishment of structural reform promotion office
→ Strengthen system and personnel → Create structural reform concept and implement
short-term measures
Hum
an re
sour
ces
“Be kind to people but strict in terms of work” new personnel system Assessment of challenges (with pay cuts and demotion) Appointment of young employees Establishment of specialist courses Supporting people in childbirth, child-rearing and nursing (Hourly break, course change, assessment, short time and expansion of days off)
Education on new assessment system In-house recruitment system Child rearing men and challenge vacation system Family day
Three Reforms
Financial Forecast
19
Final Summary
OCeaN Strategy
New
20
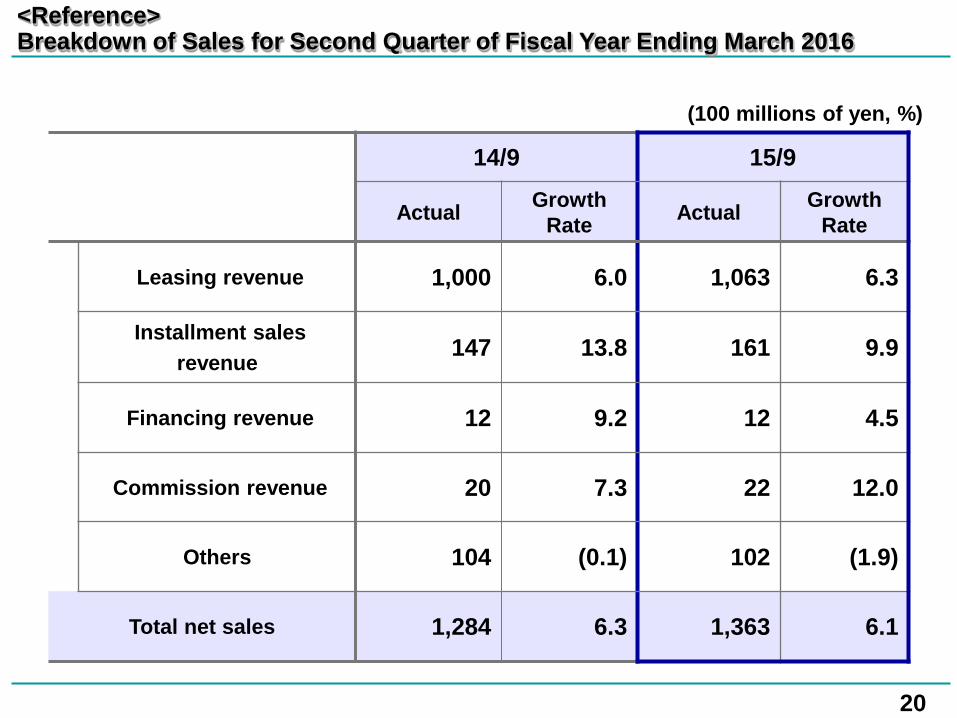
(100 millions of yen, %)
14/9 15/9
Actual Growth Rate Actual Growth
Rate
Leasing revenue 1,000 6.0 1,063 6.3
Installment sales revenue 147 13.8 161 9.9
Financing revenue 12 9.2 12 4.5
Commission revenue 20 7.3 22 12.0
Others 104 (0.1) 102 (1.9)
Total net sales 1,284 6.3 1,363 6.1
<Reference> Breakdown of Sales for Second Quarter of Fiscal Year Ending March 2016
21
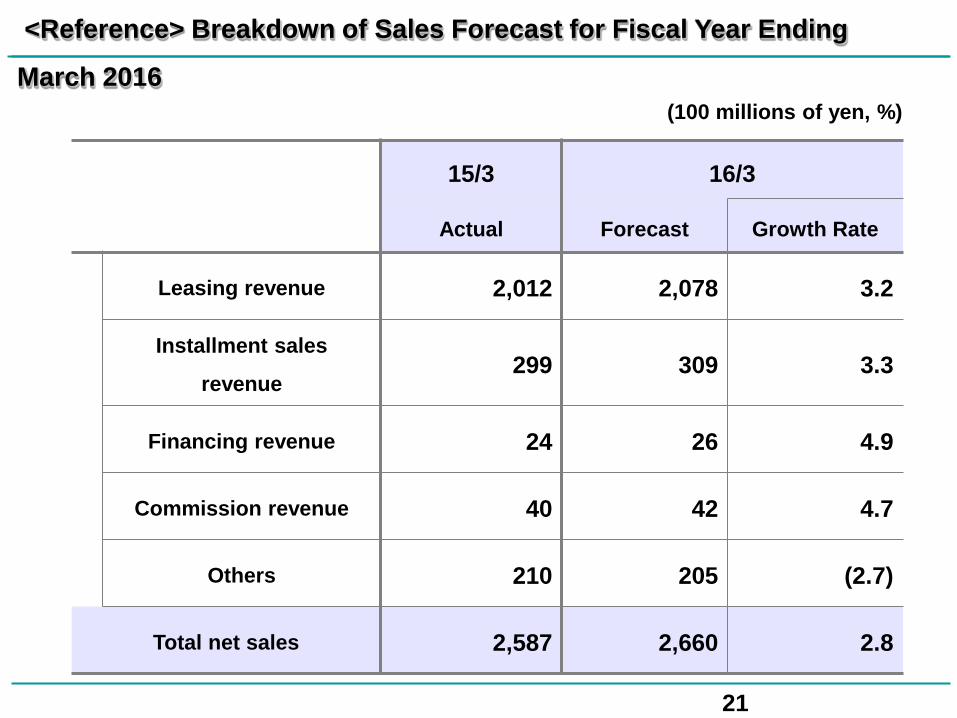
<Reference> Breakdown of Sales Forecast for Fiscal Year Ending
March 2016 (100 millions of yen, %)
15/3 16/3
Actual Forecast Growth Rate
Leasing revenue 2,012 2,078 3.2
Installment sales
revenue 299 309 3.3
Financing revenue 24 26 4.9
Commission revenue 40 42 4.7
Others 210 205 (2.7)
Total net sales 2,587 2,660 2.8
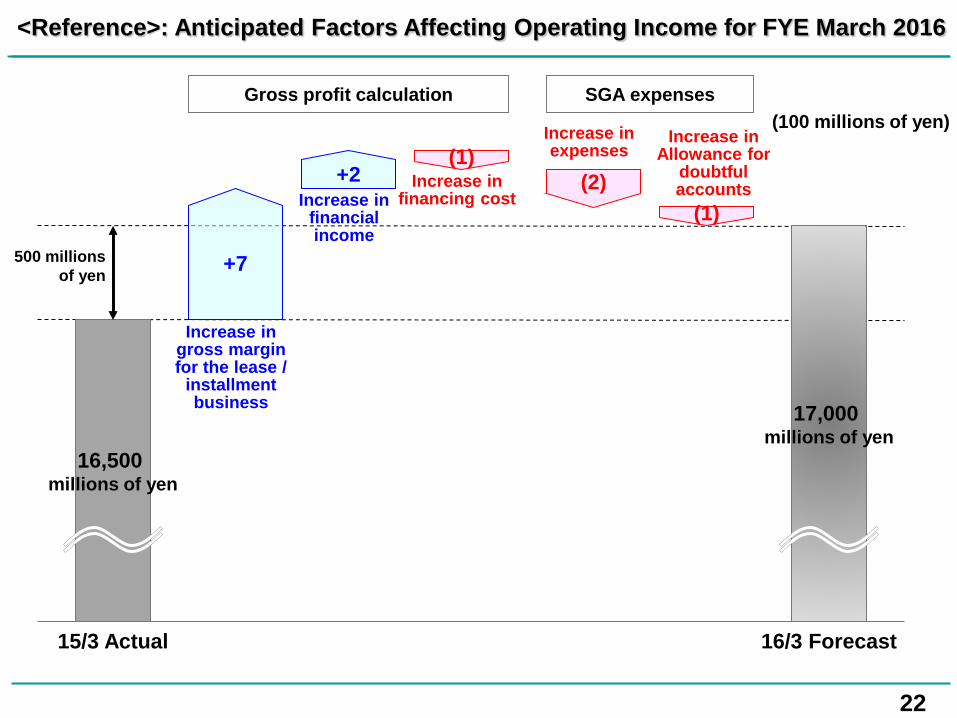
22
<Reference>: Anticipated Factors Affecting Operating Income for FYE March 2016
(100 millions of yen)
17,000 millions of yen
16/3 Forecast
16,500 millions of yen
500 millions of yen
Gross profit calculation SGA expenses
Increase in Allowance for
doubtful accounts
15/3 Actual
(1)
+2 Increase in
financial income
Increase in gross margin for the lease /
installment business
Increase in financing cost
Increase in expenses
(2)
+7
(1)

Performance Overview
23
Forward-looking statements including earnings forecasts contained in this document are based on certain assumptions deemed to be rational in light of the information available to the Company at the time of preparing the document, and are not intended to be guarantees of future performance. Actual results may differ significantly from plans and forecasts due to a variety of factors.
Reliability for
the Future Ricoh Leasing Company, Ltd.
Ricoh Leasing Company, Ltd.


