
DI
SC
US
SI
ON
P
AP
ER
S
ER
IE
S
Forschungsinstitut zur Zukunft der ArbeitInstitute for the Study of Labor
Setting the Minimum Wage
IZA DP No. 4335
July 2009
Tito Boeri
Setting the Minimum Wage
Tito Boeri Università Bocconi,
Fondazione RDB and IZA
Discussion Paper No. 4335 July 2009
IZA
P.O. Box 7240 53072 Bonn
Germany
Phone: +49-228-3894-0 Fax: +49-228-3894-180
E-mail: [email protected]
Any opinions expressed here are those of the author(s) and not those of IZA. Research published in this series may include views on policy, but the institute itself takes no institutional policy positions. The Institute for the Study of Labor (IZA) in Bonn is a local and virtual international research center and a place of communication between science, politics and business. IZA is an independent nonprofit organization supported by Deutsche Post Foundation. The center is associated with the University of Bonn and offers a stimulating research environment through its international network, workshops and conferences, data service, project support, research visits and doctoral program. IZA engages in (i) original and internationally competitive research in all fields of labor economics, (ii) development of policy concepts, and (iii) dissemination of research results and concepts to the interested public. IZA Discussion Papers often represent preliminary work and are circulated to encourage discussion. Citation of such a paper should account for its provisional character. A revised version may be available directly from the author.
IZA Discussion Paper No. 4335 July 2009
ABSTRACT
Setting the Minimum Wage*
The process leading to the setting of the minimum wage so far has been fairly overlooked by economists. This paper suggests that this is a serious limitation as the setting regime contributes to explain cross-country variation in the fine-tuning of the minimum wage, hence in the way in which the trade-off between reducing poverty among working people and shutting down low productivity jobs is addressed. There are two common ways of setting national minimum wages: they are either government legislated or are the outcome of collective bargaining agreements, which are extended erga omnes to all workers. We develop a simple model relating the level of the minimum wage to the setting regime. Next, we exploit a new data set on minimum wages in 66 countries that had already or introduced a minimum wage in the period 1981-2005 to test the implications of the model. We find that a Government legislated minimum wage is lower than a wage floor set within collective agreements. This effect survives to several robustness checks and hints at a causal relation between the setting regime and the level of the minimum wage. JEL Classification: J31, J41, J42 Keywords: minimum wages, collective bargaining, statutory minimum Corresponding author: Tito Boeri IGIER Università Bocconi Via Roentgen, 1 20136 Milano Italy E-mail: [email protected]
* I would like to thank Pierre Cahuc, David Neumark and Michele Pellizzari for comments on an initial draft. Unflagging research assistance by Matteo Duiella is gratefully acknowledged.
1 Introduction
“... on the central issue of the level of the minimum wage, the Com-
mission negotiated increases sensitive to the shifting power relations
in the product and labour markets... The consensus did not emerge
simply from discussion or sweet reasons, but shifting power rela-
tions... The stated goal was initially to "help as many as possible
low-paid workers without adverse effects on the economy".” Brown,
W. (2007) The Process of Fixing the British National Minimum
Wage, 1997-2007, British Journal of Industrial Relations, vol. 47, n.
2, 429-443.
There is a large body of theoretical and empirical research on the effects of
minimum wages on labor market outcomes.
Theory offers clearcut predictions as to the effects of minimum wages only
for a competitive labor market. In this case a binding minimum wage reduces
employment and increases unemployment unambiguously. However, this case
is of limited empirical relevance. As Christopher Flinn (2007) kindly puts it,
"recent studies indicate that the "textbook" competitive model of the labor
market ... may have serious deficiencies in accounting for minimum wage effects
on labor market outcomes". Empirical results, recently surveyed by Neumark
and Wascher (2007), indeed point to both, positive and negative, effects of the
minimum wage on employment. In particular, only two thirds of the studies
reviewed by the two authors found negative employment effects of minimum
wages and not always these effects were statistically significant. This empirical
ambiguity is consistent with the presence of labor market imperfections. In
particular, labor markets where monopsonistic firms face upward sloping labour
supply curves yield a non-monotonic relationship between employment and the
minimum wage.
Due to this non-monotonicity, the crucial issue from a normative standpoint
is the fine-tuning of the minimum wage to the elasticity of labor demand and
supply and the presence of other labor market institutions. The way in which
the minimum wage is set is very important in this respect, as the fixing regime
may affect both the level and the responsiveness of the minimum wages to
changes in the key parameters. This is because the setting of the minimum
wage involves a trade-off between reducing poverty among working people and
shutting down low productivity jobs. Depending on how these two conflicting
interests are represented in the process leading to the setting of the minimum
wage, we should expect to have higher or lower levels of the minimum wage.
Interactions with other institutions setting floors to incomes and earnings are
also important, hence varying degrees of involvement of the Government in the
setting of the minimum wage may also discriminate among different degree of
coordination in the setting of the minimum wages and other relevant policy
parameters, e.g., the level of unemployment benefits.
There is a wide cross-country variation in minimum wage setting regimes.
They range from conditions where a statutory minimum wage is unilaterally set
2
by the government and regimes where it is the outcome of negotiations between
workers and firm representatives and the Government has only the passive role
of providing a legal status to these agreements, extending their coverage also
to workers non-unionised. Among these two extreme scenarios, there is a wide
array of intermediate cases depending on the role attributed to the state or to
collective bargaining in the setting of the minimum wage.
Surprisingly enough, economic theory and applied work have devoted to
date little, if any attention, to the process leading to the determination of the
minimum wage. There is a political economics literature, originated mainly in
the US and Canada, on votes concerning the introduction of the minimum wage
behaviour (Silbermann and Durden, 1976; Uri and Mixon, 1980; Blais et al.,
1989; Rodrick, 1999) or, more recently, on cultural determinants of preferences
for minimum wages (Algan and Cahuc, 2007). There is also some empirical
literature on the time-series variation of minimum wages (e.g., Williams, 2009).
However, to my knowledge there has not been to date any attempt to either
relate preferences on the level of the minimum wage to the fixing regimes and
use the heterogeneity in fixing regimes in explaining the cross-country (and
potentially also time-series) variation in minimum wage levels.
In this paper I develop a simple model yielding implications as to the re-
lation between the level of the minimum wage and the fixing regime. Under
a rather broad set of assumptions, the model implies that a Government leg-
islated minimum wage is lower than a minimum wage set in the context of
collective bargaining. The model has a number of predictions as to the rela-
tionship between minimum wages, unemployment benefits and the elasticity of
labour demand. Next, I exploit a new data set on minimum wages in 66 coun-
tries having some type of national minimum wage in the period 1981-2005 to
explain the cross-country variation in minimum wage levels, using the above
theory as guidance in defining the empirical framework. In particular, I look at
the effect of differences in the fixing of the minimum wage on the ratio of the
minimum wage to the average wage. I also investigate the way in which different
types of minimum wages react to changes in the external environment (e.g, in
the elasticity of labour demand) and in the generosity of unemployment bene-
fits. I find that a Government legislated minimum wage is lower than a wage
floor set within collective agreements. This effect survives to several robustness
checks and hints at a causal relation between the setting regime and the level
of the minimum wage.
The plan of the paper is as follows. Section 2 presents a simple model
comparing different minimum wage fixing regimes. Section 3 illustrates the
dataset and provides descriptive statistics. Section 4 details the econometric
approach and presents our main results. Finally, Section 5 provides directions
for further research.
3

2 Interactions between fixing regime and mag-
nitude: some theory
The purpose of this section is to develop a simple model allowing to assess the
effects of alternative methods of determination of the minimum wage. Unlike the
above mentioned political economy literature which typically considers unions in
a otherwise perfect labor market, I will take as benchmark an imperfect labour
market, where firms have some degree of monopsony power, so that there can be
not only equity, but also efficiency arguments in favor of a minimum wage. This
is consistent with the non-monotonicity of the minimum wage effects found by
the empirical literature. It is also fairer with respect to the institution minimum
wage, which is not necessarily distortionary in this context.
I will initially consider a pure monopsony case with no minimum wage and
then a context in which collective bargaining sets a minimum wage. Next, I
shall characterise the Pareto optimal level of the minimum wage and the level
that would be set by a Government under alternative characterisations of its
objective function.
2.1 Equilibrium without the minimum wage
Our baseline is a labor market where firms have monopsony power. To simplify
algebra I shall consider a pure monopsony case. Extensions to n-firms with some
monopsony power do not alter significantly the results (Manning, 2003).
Labor demand is therefore originated by just one employer facing the ag-
gregate labor supply. This pure monopsonist (superscript ) chooses the em-
ployment level maximizing her profits . Along with Bertola and Boeri (2002),
assume that the marginal value of a job (labor demand), , is a decreasing (at a
constant-elasticity) function of the employment rate , e.g., = −, where indexes labour productivity, and the index of the (inverse) labor demand
elasticity, , takes values between zero (flat labour demand at ) and infinity
(vertical labor demand at 1). By replacing the marginal value of a job with
the market wage, , and solving for , we can then write the labor demand
schedule as follows
=
µ
¶ 1
(1)
The supply side of the labor market is given by the cumulative distribution
function, (), of the reservation wages. The latter is, by construction, increas-
ing in . To keep things simple we shall assume that also this schedule has a
constant-elasticity functional form so that:
() = 1 (2)
where the elasticity parameter may range between = 0 (in which case the
labor supply is flat and normalized to unity) and plus infinity. Larger values
of denote increasingly inelastic labour supply schedules, and as tends to
infinity labour supply becomes perfectly vertical. Integrating labour demand
4
over and neglecting irrelevant constants of integration, we can write the profit
maximisation of the pure monopsonist as follows:
max =1−
1− −
subject to the aggregate labour supply curve = 1 . Deriving the first-order-
condition for employment and solving for wages one obtains
=
∙
1 +
¸ +
(3)
2.2 A Pareto Optimal Minimum Wage
From this equilibrium, a properly set minimum wage removes the deadweight
loss associated with the presence of monopsony power, maximising the total
surplus. Obtain first the surplus of the workers, by integrating the density
function of the distribution of reservation wages over the relevant range and
neglecting constants of integration
−Z
= − +1
+ 1
Maximization of the joint surplus (the sum of firm’s profits and of the workers’
surplus from employment) involves then solving
max
1−
1− −−
+
−− 1
+ 1+1
= max
1−
1− − 1
+ 1+1
(4)
where the first term is the surplus of employers (profits) and the second the
surplus of workers (the difference between the wage bill and reservation wages).
In this setup the fallback option of employers is indeed zero (no production,
hence no profits), whilst the fallback option of workers is the reservation wage
represented by the constant elasticity labor supply. The wage maximizing the
total surplus of production over the opportunity cost of employment, or the size
of the economic “pie” generated by the labor market is given by
−∗ =
+
which is clearly greater than (3) to the extent that 0 , that is, labour
supply is not infinitely elastic (in which case there will be no monopsony power).
This level of the minimum wage equates at the margin the value of a job for the
employer and workers’ reservation wages, therefore maximising total employ-
ment. Indeed, the corresponding Pareto optimal employment level will exceed
the employment level attained under monopsony
∗ = 1
+ =
∙
1 +
¸ 1+
5
Notice that there is a range of values of the minimum wage where the latter
unambiguously increases employment relative to the pure monopsony case. This
range is given by:
=
∙
1 +
¸ +
−
+ =
−∗
Any minimum wage set above −∗would reduce employment with respect to the
Pareto optimal allocation. Thus, we have the usual theoretical ambiguity as to
the effects of minimum wages on employment.
2.3 A collectively bargained minimum wage
Consider now a minimum wage resulting from collective bargaining over wages
and allowing employers to choose the profit maximizing employment level, e.g.
in a right-to-manage environment. The latter involves the maximization of the
product of the surplus of employers and workers, that is, the Nash-bargaining
rule
− is argmax
Ã∙1−
1− − −
¸ ∙−− +1
+ 1
¸1−!(5)
The two surpluses are "weighted" by the parameter measuring the relative
bargaining power of employers and (1−) the bargaining power of unions. Con-sistently with a right-to-manage structure of bargaining (the only structure that
is conceivable at a centralized, economy-wide, level), we impose that employ-
ment is on the labour demand schedule. Hence, maximizing (5) with respect to
−under the constraint that =
µ−
¶− 1
, we obtain
− = ()
+ ()
+ (6)
where ≡³1− +
1+
´1
1− is the optimal mark-up factor of wages over the
opportunity cost of working. As (6) makes it clear, the minimum wage will be
increasing in the bargaining power of unions. In particular, in the case of a
monopoly union unilaterally setting wages, i.e., when = 0, the minimum wage
reduces to
−( = 0) =
µ1
1−
¶ +
()
+ (7)
Notice that the monopoly union minimum wage (7) converges from the above
to the Pareto optimal wage floor (∗) when labor demand becomes infinitelyelastic (as tends to 0). In the more general case, the monopoly union minimum
wage will exceed the Pareto efficient level.Conversely when all bargaining power
is on employers, the minimum wage will be lower than the Pareto efficient level
and, when labor demand is infinitely elastic, it will coincide with the monopsony
wage
6
−( = 1; = 0) =
µ
1 +
¶= ( = 0) (8)
and hence be lower than the Pareto optimal wage floor. Thus the minimum
wage resulting from collective bargaining can be either higher or lower than
the Pareto optimal, employment maximising, minimum wage, depending on
the bargaining power of employers and workers. Notice, however, that when
∗ is higher than
−there will be no unemployment at the equilibrium with
the minimum wage as (−) =
µ−
¶ 1
(−) =
− 1
. Conversely,
when ∗
−, hence (
−) (
−) there is an excess supply of labour.
Thus, the presence of unemployment under the collective agreement outcome
discriminates between the two different regions in which the minimum wage is
located.
2.4 A Minimum Wage set by a Government
Let us now consider a minimum wage set by a Government. As it is not obvious
what drives its decision rule, we shall consider three alternative characterisations
of the objective function (and of the controls) of a Government. The first case
is one in which the Government represents solely the interests of the "outsiders"
otherwise neglected at the bargaining table, that is, non-employed individuals.
The second case is one of a Government representing insiders and employers.
The third case is one of a Government setting a non-employment benefit together
with the minimum wage, hence having two policy instruments at its disposal.
2.4.1 A Government representing the Outsiders
A Government representing non-employed workers would choose the minimum
wage that maximizes total employment. We already know from (4) that this
implies choosing the wage level corresponding to the Pareto optimal allocation,
that is
−is argmax = ∗
As discussed above, in presence of unemployment, this Government legislated
minimum wage will be lower than the minimum wage resulting from collective
agreements. It is only when unemployment is zero and the Government seeks to
minimize inactivity that a Government legislated minimum wage could exceed
the collectively bargained wage floor.
2.4.2 A Government representing Employers and Insiders
Consider now a Government maximizing the surplus of employers and that of
workers over leisure, just as in a right-to-manage model, but offering a different
7
representation of the two parties than at the bargaining table. There can be
both a positive and a normative interpretation of the criterion followed in fixing
the minimum wage.
According to a probabilistic voting model, the minimum wage would maxi-
mize a social welfare function that weights the indirect utility function of em-
ployers and workers. To ease comparisons with the collective bargaining out-
come, the social welfare function can be conveniently expressed as a Bernoulli-
Nash
−is argmax
Ã∙1−
1− −
−
¸ ∙
−− 1
+ 1+1
¸1−!(9)
where can be interpreted as a measure of the electoral power of employers and
profit earners (Coughlin, 1992). This electoral power will reflect the size of the
two groups as well as the relative presence of swing voters in their ranks.
An alternative interpretation of (9) is in the objective function of a social
planner caring for income distribution. In this case the parameter repre-
sents the distributional weight of employers, that is, the relative importance
attributed by the Government to redistribution in favour of profit-earners.
The solution of (9) will coincide with (6) except that now is replaced
by . It follows that when the electoral power (or distributional weight) of
profit-earners is larger than their bargaining power, a minimum wage set by
a Government will be lower than a wage floor established within collective
bargaining.
Notice also that the solution of (9) coincides with the Pareto optimum when
=
+ (1− ) 1− =
+ (1 + ) (10)
as in this case the solution is
− =
+ = ∗ (11)
Simple rearrangement of (10) yields
1−
=
1−
1 +
(12)
This condition is similar to the Hosios (1990) condition for efficiency when in-
dividual workers and jobs meet randomly according to a given matching tech-
nology, under constant returns1. There is no reason to expect a priori that this
condition is fulfilled. However, it is relevant in assessing dis-employment effects
of minimum wages as any deviation from this condition involves employment
losses.
1 It should be stressed that in that framework unemployment is present in equilibrium but,
if the Hosios condition is satisfied, unemployment efficiently coordinates the search decisions
of workers and firms in a frictional labor market.
8
In a probabilistic voting setting, is not exogenous in the long-run. It reacts
to changes in the relevant elasticities, and , as the electoral power of the two
groups ultimately depends on the employment effects of a minimum wage. In
particular, is bound to increase as declines reducing the electoral power of
workers when the labor demand elasticity is larger. A similar argument applies
to in the collectively bargained outcome. Collective bargaining institutions
may adjust wage claims to the new environment requiring that the size of the
labour market, hence the pie to be shared between workers and firms, is not "too
small". Unions engaged in nation-wide wage bargaining internalize the fact
that unemployment would increase unless pay concessions are made. Small,
decentralized unions may instead resist changes in their members’ take-home
pay: if every union follows the same policy, the outcome would be too high
wages at the macroeconomic level, to imply a bigger employment cost than with
a nationwide union. This is consistent with the arguments originally developed
by Calmfors and Driffill (1988) as to the labor-market effects of macroeconomic
shocks under different bargaining structures.
Overall, we expect both and to be lower in presence of a higher
elasticity of labor demand although the responsiveness of the two minimum
wages to the elasticity of demand may vary depending also on the frequency of
collective agreements with respect to Government legislated adjustments of the
minimum wages.
2.4.3 A Government with two policy instruments
There are clearly intermediate cases in which a Government can represent at
varying degrees employers, insiders as well as outsiders. The above results
suggest that the inclusion of outsiders will move the minimum wage towards
to the Pareto optimal level unless when the condition (12) is fulfilled.
A perhaps more interesting case occurs when the Government can also set
a non-employment benefit, . A key difference between a Government legis-
lated and a collectively bargained minimum wage is indeed that a Government
could also activate other redistributive policy instruments targeting persons not
working. Insofar as these transfers are set by the same entity establishing the
minimum wage, the two levels can be coordinated. Indeed, in several countries
the levels of such transfers are legally established as fractions of the minimum
wage (when the latter is strictly a control variable for the Government). Al-
though minimum wages and non-employment benefits target different groups
(ex-post) of the population, they are both anti-poverty devices. An important
difference though is that while the minimum wage is paid by employers, the
non-employment benefit is at least partly paid by the workers.
Assume then that the benefit is provided by the state to non-employed in-
dividuals and is at least partly financed via a payroll tax on wages, , i.e.:
( − ) = (13)
where is the population in working age (the potential labor force) and
9
the fraction of the costs of non-employment benefits funded via a payroll tax on
employees. Labor supply in presence of a social minimum reads
() = ( − )1 (14)
that is, the wage must strictly exceed to induce participation in the labour
market. Consider now the collective bargaining outcome (5) after substituting
(14) for labor supply over the minimum wage taking (and ) as given. This
obtains the gross minimum wage:
− = + ()
+ ()
+
that is, the minimum wage is shifted out by the non-employment benefit, as
the latter increases the outside option of workers. This is the standard Nash-
bargaining wage rule with employees (or non-encompassing unions) that do not
internalise the Government budget constraint.
Consider now the problem faced by a Government that jointly sets the min-
imum wage and the social minimum, internalizing the Government budget con-
straint (13). Assuming that = , so that, without non-employment benefits
the collective agreed and the Government legislated minimum wages would co-
incide, we now have that
− = (1− ) + ()
+ ()
+
that is, ceteris paribus, the minimum wage set by a Government will be lower
than a collectively agreed minimum wage when a non-employment benefit sys-
tem is in place. The intuition is that a Government has two instruments at its
disposal and hence can better fine-tune the level of the minimum wage with that
of the non-employment benefit, internalizing the fiscal costs of unemployment.
2.5 Non-degenerate wage distributions
The above discussion has been carried out neglecting wage setting above the
minimum. In models allowing for non-degenerate wage distributions, collective
bargaining over the minimum wage would differ from Government legislated
wage floors in that unions (and employers associations) negotiate also over wages
above the minimum. Insofar as unions are concerned about membership and
pursue egalitarian pay policies, they may impose a higher minimum wage than
the one unilaterally set by the Government in order to benefit the mass of
workers located in the middle of the skill distribution. This result is obtained
by Boeri and Burda (2009) showing that collective bargaining over wages un-
der endogenous union membership generates a wage floor which is above the
statutory minimum.
Overall, under a rather broad set of circumstances, theory predicts that
a Government legislated minimum wage should be lower than a collectively
bargained wage floor. It also points to relevant effects of environmental (e.g.,
the elasticity of labor demand) and institutional (e.g., non-employment benefits)
10
variables on the setting of the minimum wage. The purpose of the next section is
to contribute to explain the cross-country and time-series variation in minimum
wage levels based on these theoretical predictions.
3 The data
In this paper I exploit a new database on minimum wages around the world
built by the fondazione Rodolfo Debenedetti (fRDB) in co-operation with the
Imf2. The fRDB minimum wage database contains information on the levels of
minimum, average, and median wages in national currencies for 91 countries for
the period 1980-2005. Unfortunately information on some countries is available
only for a subperiod, providing us with an unbalanced panel.
Minimum wages are calculated on a monthly basis (standardizing to 8 hours
of work per day, 40 hours per week, 22 days per month, 52 weeks per year). For
each country, national data sources were explored first, including National Sta-
tistics Offices, Ministries of Labor and Finance, Central Banks, Trade Unions as
well as datasets of national legislations. International data sources were subse-
quently explored, including OECD, Eurostat, World Bank, IMF, ILO (Geneva
and regional offices, archives and online databases), UN, African, Asian and
Inter-American Development Banks and the reports from the US Department on
Human Rights Practices. Researchers, policy-makers, representatives of trade
unions and employers organizations were also contacted and a search through
press and business reports was carried out.
Data on the level of the minimum wage were then integrated with qualitative
information on the methods followed in each country in the setting of the min-
imum wage. The latter was obtained primarily from the ILO Minimum Wage
Database (http://www.ilo.org/travaildatabase/servlet/minimumwages) and the
ILO Natlex database. Information provided by local Ministries of Labour was
also used in this context.
The sample used in this paper involves 66 countries for which information
on both minimum wage levels and determination was available. Tables 1.A, 1.B
and 1.C provide country groupings based on the methods followed in fixing the
minimum wage as well as descriptive statistics on minimum to average wage
ratios. As shown by the table, out of 66 countries, 24 have a minimum wage
set by "social partners" and then simply ratified by the Government or deter-
mined by a tripartite body (a commission, a council or an independent agency)
where representatives of the government, unions and employers’ organisations
are represented on a equal stance (the Government typically acts as go in be-
tween); 26 countries set the minimum wage after formal consultations between
the Government and representatives of employers and workers; 16 countries had
the minimum wage set by the Government without any formal consultation with
the "social partners".
2See www.frdb.org for a detailed description of the dataset.
11
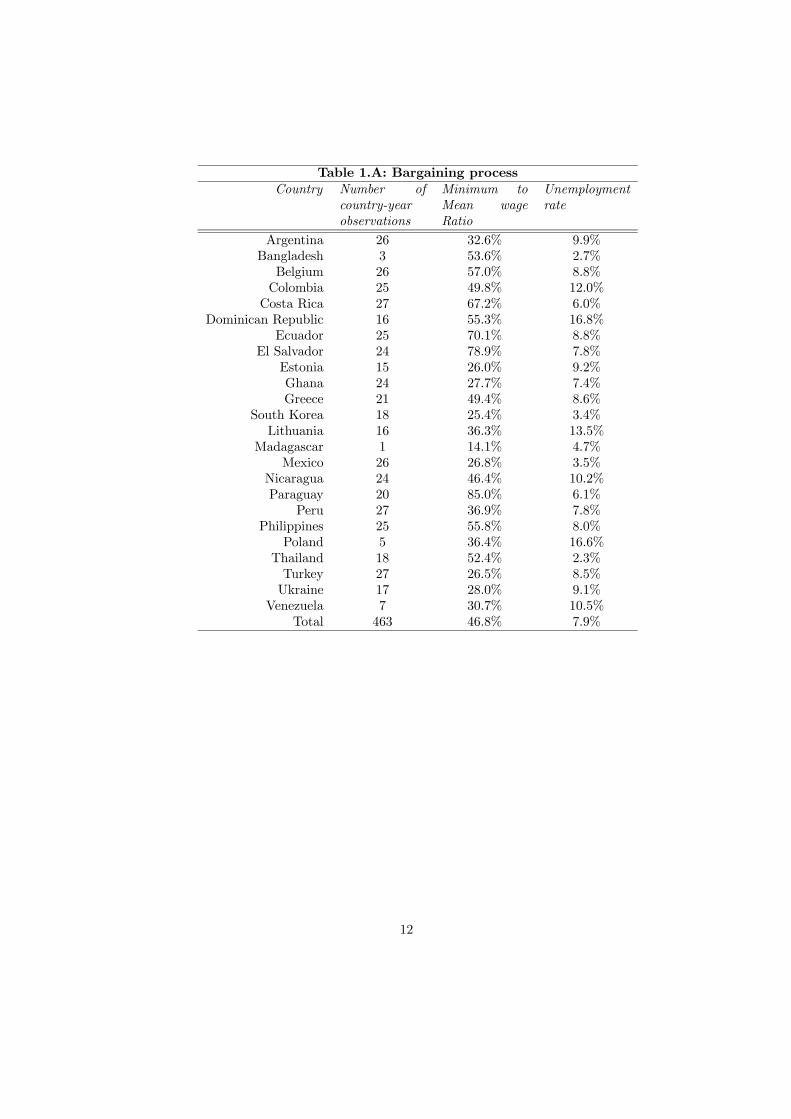
Table 1.A: Bargaining process
Country Number of
country-year
observations
Minimum to
Mean wage
Ratio
Unemployment
rate
Argentina 26 32.6% 9.9%
Bangladesh 3 53.6% 2.7%
Belgium 26 57.0% 8.8%
Colombia 25 49.8% 12.0%
Costa Rica 27 67.2% 6.0%
Dominican Republic 16 55.3% 16.8%
Ecuador 25 70.1% 8.8%
El Salvador 24 78.9% 7.8%
Estonia 15 26.0% 9.2%
Ghana 24 27.7% 7.4%
Greece 21 49.4% 8.6%
South Korea 18 25.4% 3.4%
Lithuania 16 36.3% 13.5%
Madagascar 1 14.1% 4.7%
Mexico 26 26.8% 3.5%
Nicaragua 24 46.4% 10.2%
Paraguay 20 85.0% 6.1%
Peru 27 36.9% 7.8%
Philippines 25 55.8% 8.0%
Poland 5 36.4% 16.6%
Thailand 18 52.4% 2.3%
Turkey 27 26.5% 8.5%
Ukraine 17 28.0% 9.1%
Venezuela 7 30.7% 10.5%
Total 463 46.8% 7.9%
12
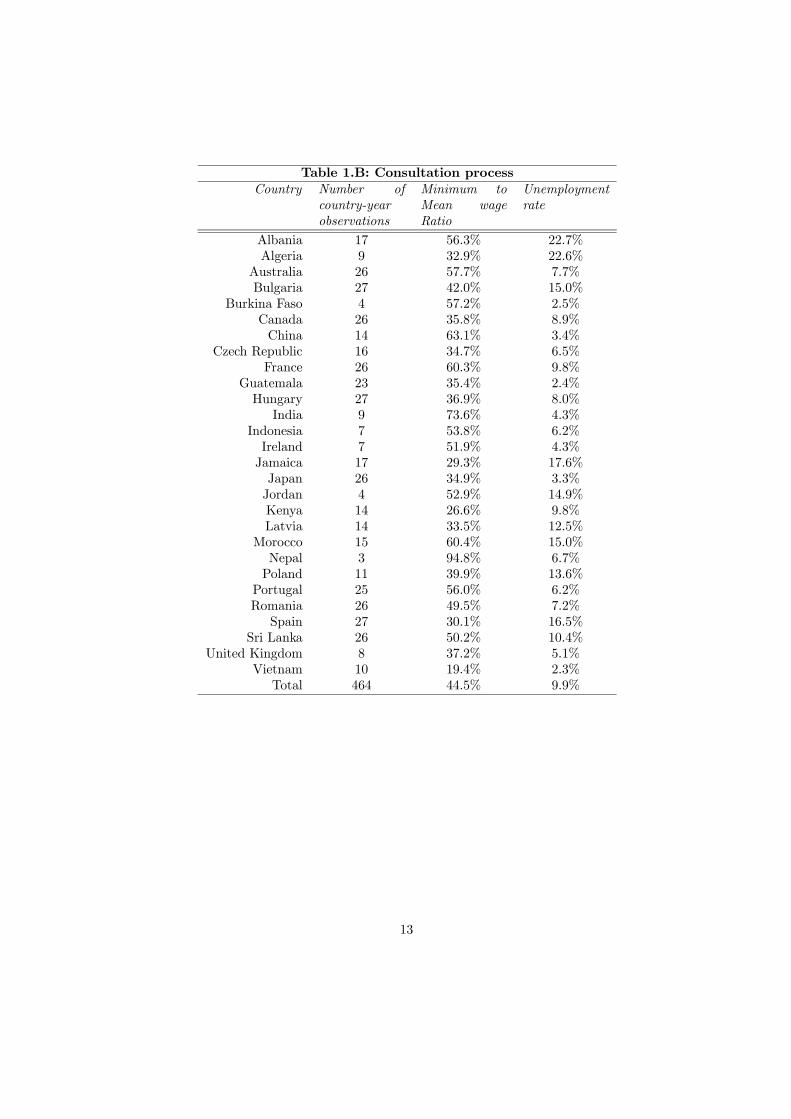
Table 1.B: Consultation process
Country Number of
country-year
observations
Minimum to
Mean wage
Ratio
Unemployment
rate
Albania 17 56.3% 22.7%
Algeria 9 32.9% 22.6%
Australia 26 57.7% 7.7%
Bulgaria 27 42.0% 15.0%
Burkina Faso 4 57.2% 2.5%
Canada 26 35.8% 8.9%
China 14 63.1% 3.4%
Czech Republic 16 34.7% 6.5%
France 26 60.3% 9.8%
Guatemala 23 35.4% 2.4%
Hungary 27 36.9% 8.0%
India 9 73.6% 4.3%
Indonesia 7 53.8% 6.2%
Ireland 7 51.9% 4.3%
Jamaica 17 29.3% 17.6%
Japan 26 34.9% 3.3%
Jordan 4 52.9% 14.9%
Kenya 14 26.6% 9.8%
Latvia 14 33.5% 12.5%
Morocco 15 60.4% 15.0%
Nepal 3 94.8% 6.7%
Poland 11 39.9% 13.6%
Portugal 25 56.0% 6.2%
Romania 26 49.5% 7.2%
Spain 27 30.1% 16.5%
Sri Lanka 26 50.2% 10.4%
United Kingdom 8 37.2% 5.1%
Vietnam 10 19.4% 2.3%
Total 464 44.5% 9.9%
13
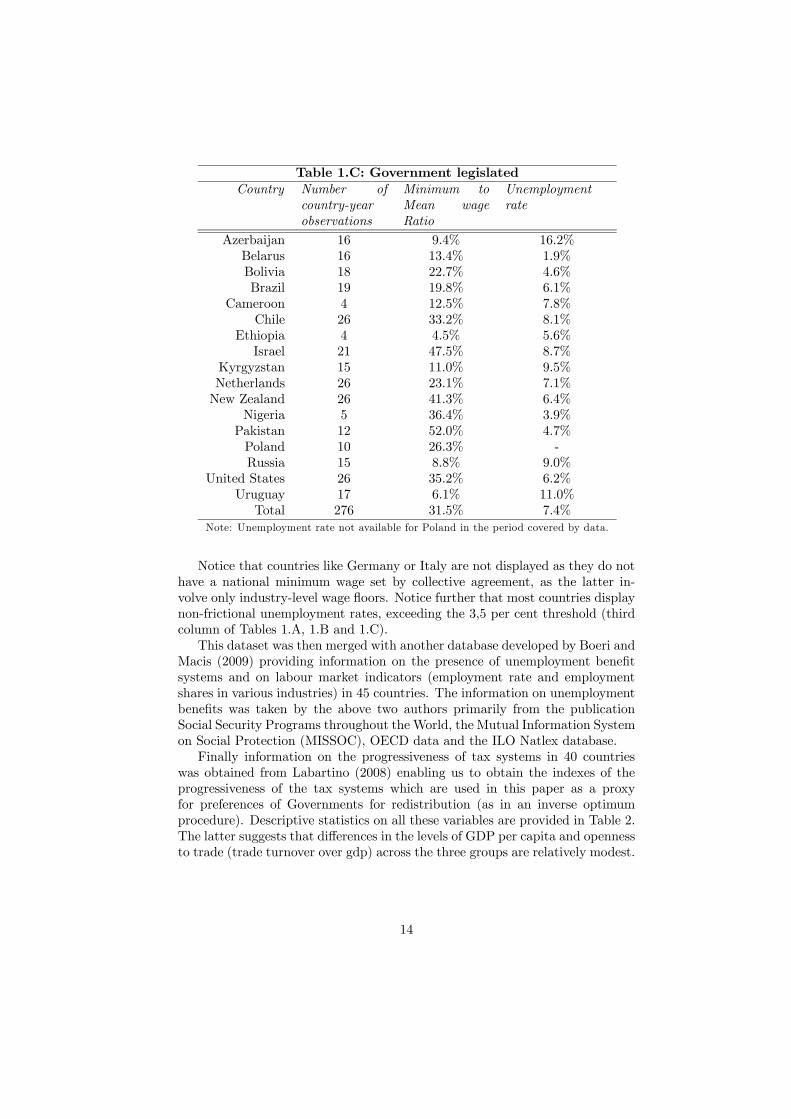
Table 1.C: Government legislated
Country Number of
country-year
observations
Minimum to
Mean wage
Ratio
Unemployment
rate
Azerbaijan 16 9.4% 16.2%
Belarus 16 13.4% 1.9%
Bolivia 18 22.7% 4.6%
Brazil 19 19.8% 6.1%
Cameroon 4 12.5% 7.8%
Chile 26 33.2% 8.1%
Ethiopia 4 4.5% 5.6%
Israel 21 47.5% 8.7%
Kyrgyzstan 15 11.0% 9.5%
Netherlands 26 23.1% 7.1%
New Zealand 26 41.3% 6.4%
Nigeria 5 36.4% 3.9%
Pakistan 12 52.0% 4.7%
Poland 10 26.3% -
Russia 15 8.8% 9.0%
United States 26 35.2% 6.2%
Uruguay 17 6.1% 11.0%
Total 276 31.5% 7.4%
Note: Unemployment rate not available for Poland in the period covered by data.
Notice that countries like Germany or Italy are not displayed as they do not
have a national minimum wage set by collective agreement, as the latter in-
volve only industry-level wage floors. Notice further that most countries display
non-frictional unemployment rates, exceeding the 3,5 per cent threshold (third
column of Tables 1.A, 1.B and 1.C).
This dataset was then merged with another database developed by Boeri and
Macis (2009) providing information on the presence of unemployment benefit
systems and on labour market indicators (employment rate and employment
shares in various industries) in 45 countries. The information on unemployment
benefits was taken by the above two authors primarily from the publication
Social Security Programs throughout the World, the Mutual Information System
on Social Protection (MISSOC), OECD data and the ILO Natlex database.
Finally information on the progressiveness of tax systems in 40 countries
was obtained from Labartino (2008) enabling us to obtain the indexes of the
progressiveness of the tax systems which are used in this paper as a proxy
for preferences of Governments for redistribution (as in an inverse optimum
procedure). Descriptive statistics on all these variables are provided in Table 2.
The latter suggests that differences in the levels of GDP per capita and openness
to trade (trade turnover over gdp) across the three groups are relatively modest.
14
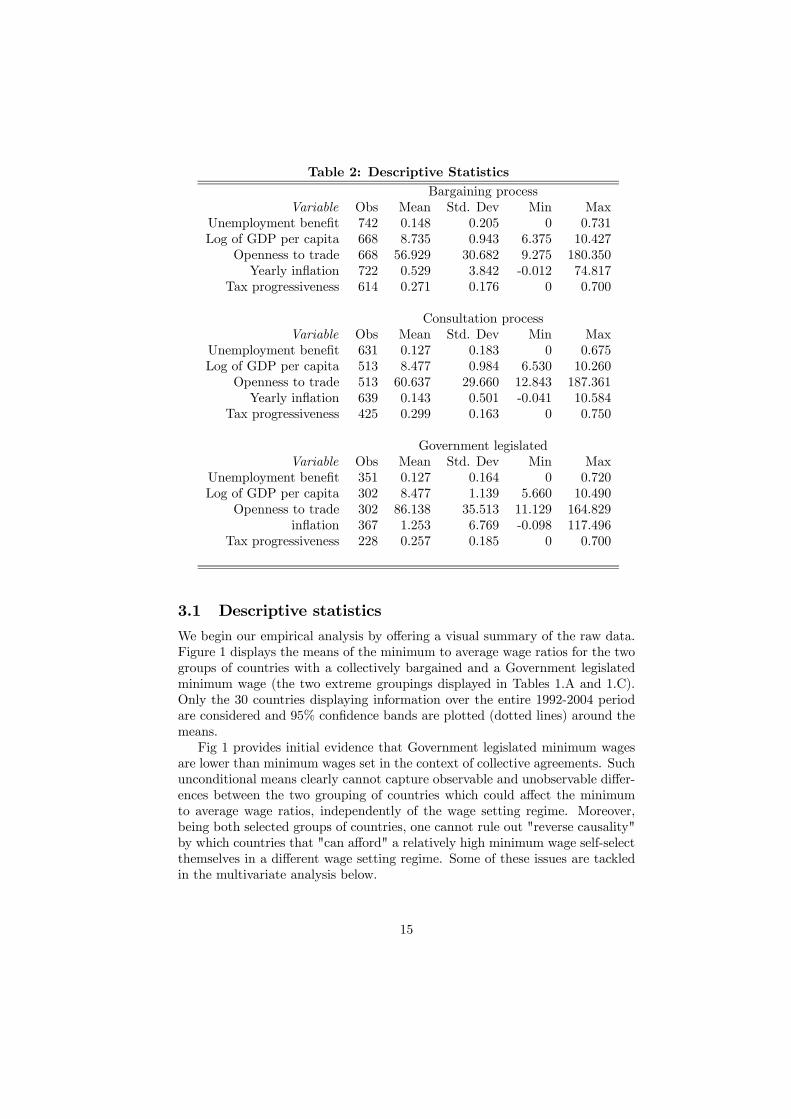
Table 2: Descriptive Statistics
Bargaining process
Variable Obs Mean Std. Dev Min Max
Unemployment benefit 742 0.148 0.205 0 0.731
Log of GDP per capita 668 8.735 0.943 6.375 10.427
Openness to trade 668 56.929 30.682 9.275 180.350
Yearly inflation 722 0.529 3.842 -0.012 74.817
Tax progressiveness 614 0.271 0.176 0 0.700
Consultation process
Variable Obs Mean Std. Dev Min Max
Unemployment benefit 631 0.127 0.183 0 0.675
Log of GDP per capita 513 8.477 0.984 6.530 10.260
Openness to trade 513 60.637 29.660 12.843 187.361
Yearly inflation 639 0.143 0.501 -0.041 10.584
Tax progressiveness 425 0.299 0.163 0 0.750
Government legislated
Variable Obs Mean Std. Dev Min Max
Unemployment benefit 351 0.127 0.164 0 0.720
Log of GDP per capita 302 8.477 1.139 5.660 10.490
Openness to trade 302 86.138 35.513 11.129 164.829
inflation 367 1.253 6.769 -0.098 117.496
Tax progressiveness 228 0.257 0.185 0 0.700
3.1 Descriptive statistics
We begin our empirical analysis by offering a visual summary of the raw data.
Figure 1 displays the means of the minimum to average wage ratios for the two
groups of countries with a collectively bargained and a Government legislated
minimum wage (the two extreme groupings displayed in Tables 1.A and 1.C).
Only the 30 countries displaying information over the entire 1992-2004 period
are considered and 95% confidence bands are plotted (dotted lines) around the
means.
Fig 1 provides initial evidence that Government legislated minimum wages
are lower than minimum wages set in the context of collective agreements. Such
unconditional means clearly cannot capture observable and unobservable differ-
ences between the two grouping of countries which could affect the minimum
to average wage ratios, independently of the wage setting regime. Moreover,
being both selected groups of countries, one cannot rule out "reverse causality"
by which countries that "can afford" a relatively high minimum wage self-select
themselves in a different wage setting regime. Some of these issues are tackled
in the multivariate analysis below.
15
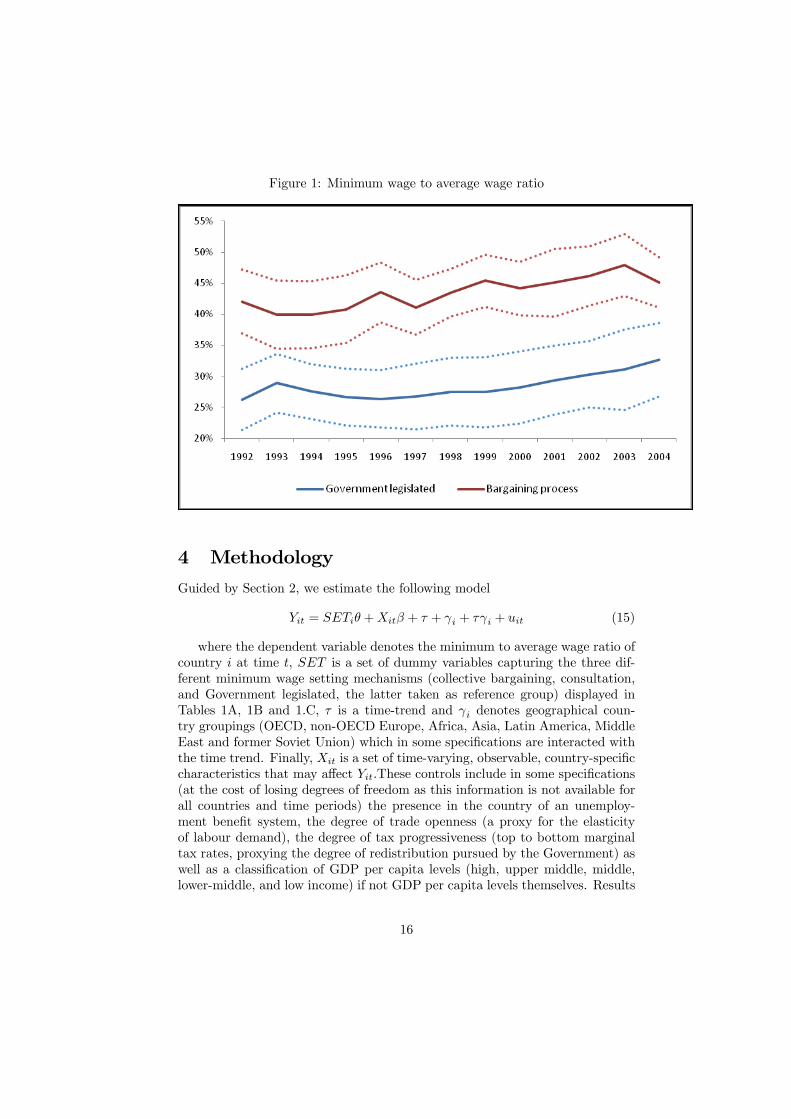
Figure 1: Minimum wage to average wage ratio
4 Methodology
Guided by Section 2, we estimate the following model
= + + + + + (15)
where the dependent variable denotes the minimum to average wage ratio of
country at time , is a set of dummy variables capturing the three dif-
ferent minimum wage setting mechanisms (collective bargaining, consultation,
and Government legislated, the latter taken as reference group) displayed in
Tables 1A, 1B and 1.C, is a time-trend and denotes geographical coun-
try groupings (OECD, non-OECD Europe, Africa, Asia, Latin America, Middle
East and former Soviet Union) which in some specifications are interacted with
the time trend. Finally, is a set of time-varying, observable, country-specific
characteristics that may affect These controls include in some specifications
(at the cost of losing degrees of freedom as this information is not available for
all countries and time periods) the presence in the country of an unemploy-
ment benefit system, the degree of trade openness (a proxy for the elasticity
of labour demand), the degree of tax progressiveness (top to bottom marginal
tax rates, proxying the degree of redistribution pursued by the Government) as
well as a classification of GDP per capita levels (high, upper middle, middle,
lower-middle, and low income) if not GDP per capita levels themselves. Results
16
controlling for the sectoral composition of the workforce (the share of employ-
ment in services and agriculture) are also reported in Table A2 in the Appendix
as this information is available only for a restricted set of countries.
4.1 Results
Table 3 reports random effects estimates of equation (15). By exploiting both
cross-country and time-series variation we can indeed make better use of avail-
able data as some countries have a very short, if any, time-series. The standard
errors reported in parentheses are robust to arbitrary forms of heteroschedas-
ticity and autocorrelation (clustered by country).
Our estimates suggest that a minimum wage setting regime based on col-
lective bargaining is correlated in all specifications with a significantly higher
minimum to average wage ratio. The coefficients in specifications (1) and (2)
(before introducing interaction dummies) suggest that collective bargaining in-
volves, ceteris paribus, a 12-13 percentage points higher ratio of the minimum
wage to the average wage. A higher unemployment benefit system increases the
minimum wage consistently with the predictions of the model in Section 2. This
effect survives when I measure unemployment benefits with a dummy capturing
the presence of an unemployment benefit system (some countries in the panel
did not have one, at least limited to a subperiod) avoiding the spurious corre-
lation induced by using measures having the average wage as denominator (see
Table A1 in the Appendix). Contrary to the theoretical predictions of Section
2, trade openness, proxying the elasticity of labor demand, is not statistically
significant.
17
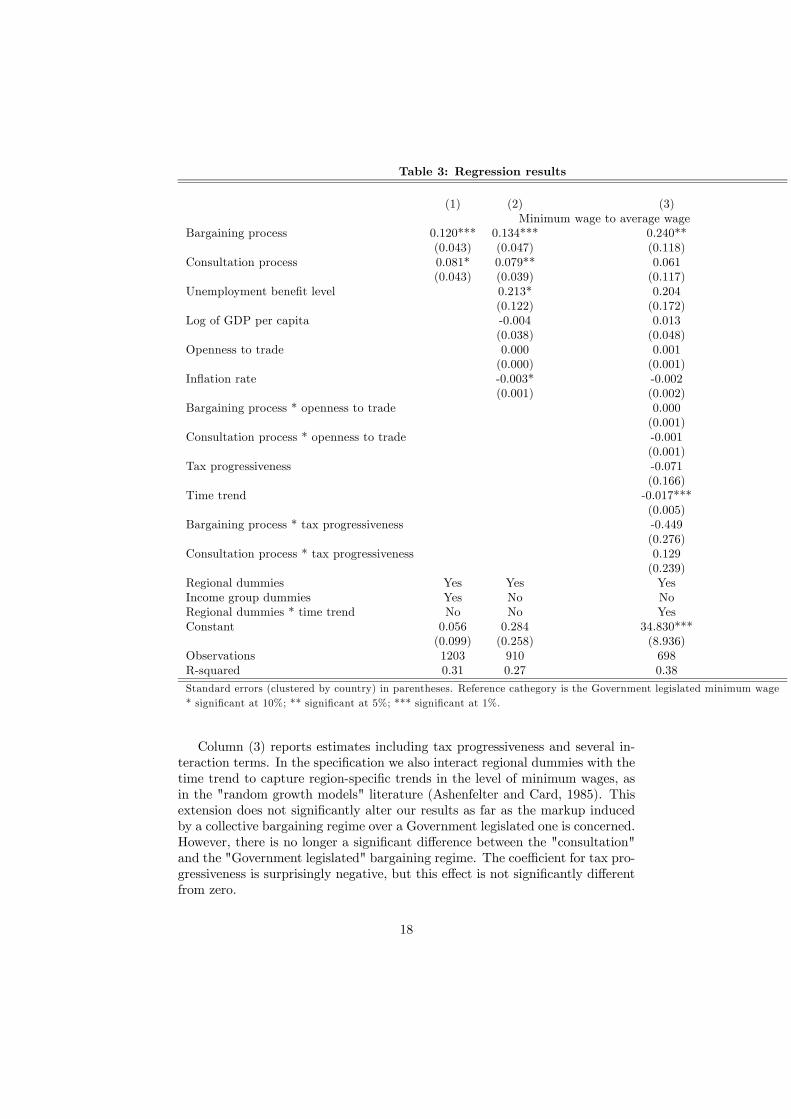
Table 3: Regression results
(1) (2) (3)
Minimum wage to average wage
Bargaining process 0.120*** 0.134*** 0.240**
(0.043) (0.047) (0.118)
Consultation process 0.081* 0.079** 0.061
(0.043) (0.039) (0.117)
Unemployment benefit level 0.213* 0.204
(0.122) (0.172)
Log of GDP per capita -0.004 0.013
(0.038) (0.048)
Openness to trade 0.000 0.001
(0.000) (0.001)
Inflation rate -0.003* -0.002
(0.001) (0.002)
Bargaining process * openness to trade 0.000
(0.001)
Consultation process * openness to trade -0.001
(0.001)
Tax progressiveness -0.071
(0.166)
Time trend -0.017***
(0.005)
Bargaining process * tax progressiveness -0.449
(0.276)
Consultation process * tax progressiveness 0.129
(0.239)
Regional dummies Yes Yes Yes
Income group dummies Yes No No
Regional dummies * time trend No No Yes
Constant 0.056 0.284 34.830***
(0.099) (0.258) (8.936)
Observations 1203 910 698
R-squared 0.31 0.27 0.38
Standard errors (clustered by country) in parentheses. Reference cathegory is the Government legislated minimum wage
* significant at 10%; ** significant at 5%; *** significant at 1%.
Column (3) reports estimates including tax progressiveness and several in-
teraction terms. In the specification we also interact regional dummies with the
time trend to capture region-specific trends in the level of minimum wages, as
in the "random growth models" literature (Ashenfelter and Card, 1985). This
extension does not significantly alter our results as far as the markup induced
by a collective bargaining regime over a Government legislated one is concerned.
However, there is no longer a significant difference between the "consultation"
and the "Government legislated" bargaining regime. The coefficient for tax pro-
gressiveness is surprisingly negative, but this effect is not significantly different
from zero.
18
4.2 Robustness checks
In table 4 we perform the same regressions as above, confining this time our
attention to OECD countries (results for developing nations are reported in Ta-
ble A3 in the Appendix). This is useful to address some of the econometric
issues discussed at the outset. These countries indeed constitute a more homo-
geneous set of nations and have well established wage setting mechanisms, so
that there is less of a risk of self-selection into a particular regime depending
on the evolution of the wage structure. Moreover, measurement issues are less
serious in this context. Limited to OECD countries we also have information on
sub-minimum wages, that is, exemptions granted to specific categories of work-
ers, e.g., youngsters or workers in some industries, regions or occupations. In
particular, we use an enforcement index developed by Algan and Cahuc (2007)
which is increasing in the number and size of the exemptions legally allowed to
statutory minimum wages3.
We still find a positive, sizeable and highly significant effect of a collectively
bargained regime over a Government legislated regime. The significance and
sign of the unemployment benefits variable is in line with the above theoretical
predictions. Tax progressiveness, which is better measured in OECD countries
than in developing nations, is now significant and positive as theory would
predict, and negative when interacted with a bargaining regime. Finally, the
enforcement variable is not statistically significant.
3The index is the average of two indexes: an index of dispersion (one divided by the simple
number of sectoral, regional, occupational or age deviations) and an index capturing the size
of these derogations (taking value 0 if there is no derogation, 0.5 if limited and 1 if large).
See Algan and Cahuc (2007) for details.
19
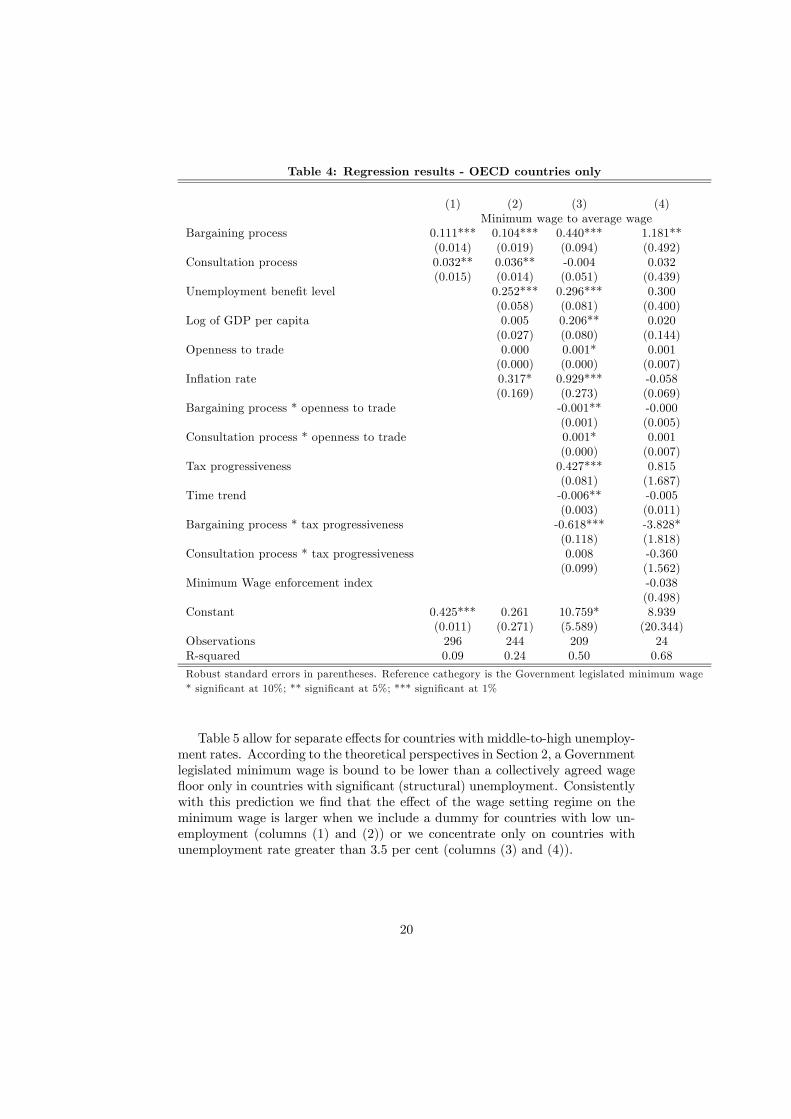
Table 4: Regression results - OECD countries only
(1) (2) (3) (4)
Minimum wage to average wage
Bargaining process 0.111*** 0.104*** 0.440*** 1.181**
(0.014) (0.019) (0.094) (0.492)
Consultation process 0.032** 0.036** -0.004 0.032
(0.015) (0.014) (0.051) (0.439)
Unemployment benefit level 0.252*** 0.296*** 0.300
(0.058) (0.081) (0.400)
Log of GDP per capita 0.005 0.206** 0.020
(0.027) (0.080) (0.144)
Openness to trade 0.000 0.001* 0.001
(0.000) (0.000) (0.007)
Inflation rate 0.317* 0.929*** -0.058
(0.169) (0.273) (0.069)
Bargaining process * openness to trade -0.001** -0.000
(0.001) (0.005)
Consultation process * openness to trade 0.001* 0.001
(0.000) (0.007)
Tax progressiveness 0.427*** 0.815
(0.081) (1.687)
Time trend -0.006** -0.005
(0.003) (0.011)
Bargaining process * tax progressiveness -0.618*** -3.828*
(0.118) (1.818)
Consultation process * tax progressiveness 0.008 -0.360
(0.099) (1.562)
Minimum Wage enforcement index -0.038
(0.498)
Constant 0.425*** 0.261 10.759* 8.939
(0.011) (0.271) (5.589) (20.344)
Observations 296 244 209 24
R-squared 0.09 0.24 0.50 0.68
Robust standard errors in parentheses. Reference cathegory is the Government legislated minimum wage
* significant at 10%; ** significant at 5%; *** significant at 1%
Table 5 allow for separate effects for countries with middle-to-high unemploy-
ment rates. According to the theoretical perspectives in Section 2, a Government
legislated minimum wage is bound to be lower than a collectively agreed wage
floor only in countries with significant (structural) unemployment. Consistently
with this prediction we find that the effect of the wage setting regime on the
minimum wage is larger when we include a dummy for countries with low un-
employment (columns (1) and (2)) or we concentrate only on countries with
unemployment rate greater than 3.5 per cent (columns (3) and (4)).
20
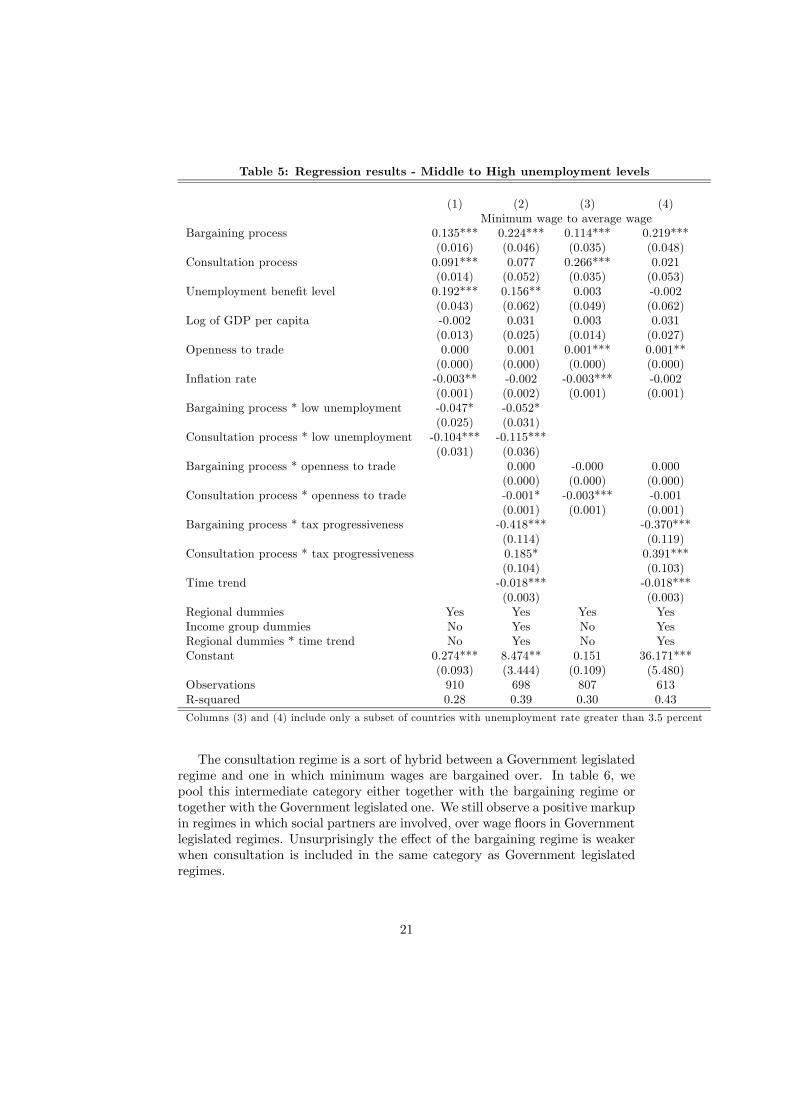
Table 5: Regression results - Middle to High unemployment levels
(1) (2) (3) (4)
Minimum wage to average wage
Bargaining process 0.135*** 0.224*** 0.114*** 0.219***
(0.016) (0.046) (0.035) (0.048)
Consultation process 0.091*** 0.077 0.266*** 0.021
(0.014) (0.052) (0.035) (0.053)
Unemployment benefit level 0.192*** 0.156** 0.003 -0.002
(0.043) (0.062) (0.049) (0.062)
Log of GDP per capita -0.002 0.031 0.003 0.031
(0.013) (0.025) (0.014) (0.027)
Openness to trade 0.000 0.001 0.001*** 0.001**
(0.000) (0.000) (0.000) (0.000)
Inflation rate -0.003** -0.002 -0.003*** -0.002
(0.001) (0.002) (0.001) (0.001)
Bargaining process * low unemployment -0.047* -0.052*
(0.025) (0.031)
Consultation process * low unemployment -0.104*** -0.115***
(0.031) (0.036)
Bargaining process * openness to trade 0.000 -0.000 0.000
(0.000) (0.000) (0.000)
Consultation process * openness to trade -0.001* -0.003*** -0.001
(0.001) (0.001) (0.001)
Bargaining process * tax progressiveness -0.418*** -0.370***
(0.114) (0.119)
Consultation process * tax progressiveness 0.185* 0.391***
(0.104) (0.103)
Time trend -0.018*** -0.018***
(0.003) (0.003)
Regional dummies Yes Yes Yes Yes
Income group dummies No Yes No Yes
Regional dummies * time trend No Yes No Yes
Constant 0.274*** 8.474** 0.151 36.171***
(0.093) (3.444) (0.109) (5.480)
Observations 910 698 807 613
R-squared 0.28 0.39 0.30 0.43
Columns (3) and (4) include only a subset of countries with unemployment rate greater than 3.5 percent
The consultation regime is a sort of hybrid between a Government legislated
regime and one in which minimum wages are bargained over. In table 6, we
pool this intermediate category either together with the bargaining regime or
together with the Government legislated one. We still observe a positive markup
in regimes in which social partners are involved, over wage floors in Government
legislated regimes. Unsurprisingly the effect of the bargaining regime is weaker
when consultation is included in the same category as Government legislated
regimes.
21
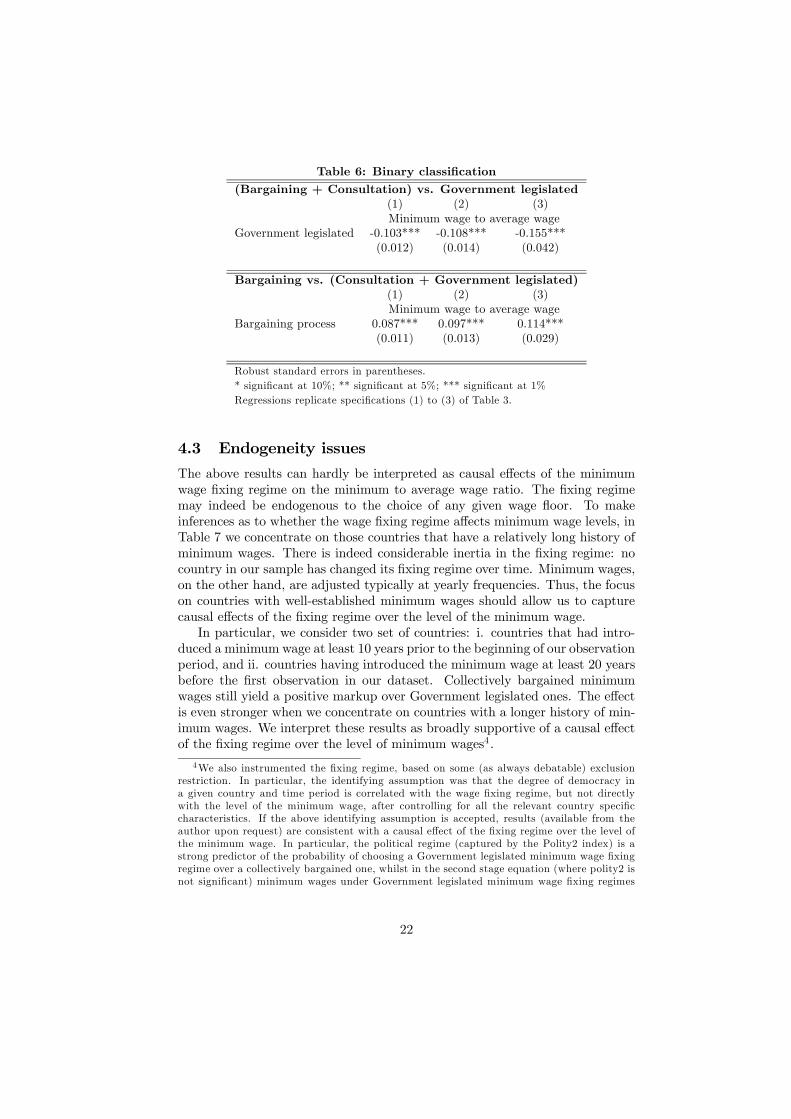
Table 6: Binary classification
(Bargaining + Consultation) vs. Government legislated
(1) (2) (3)
Minimum wage to average wage
Government legislated -0.103*** -0.108*** -0.155***
(0.012) (0.014) (0.042)
Bargaining vs. (Consultation + Government legislated)
(1) (2) (3)
Minimum wage to average wage
Bargaining process 0.087*** 0.097*** 0.114***
(0.011) (0.013) (0.029)
Robust standard errors in parentheses.
* significant at 10%; ** significant at 5%; *** significant at 1%
Regressions replicate specifications (1) to (3) of Table 3.
4.3 Endogeneity issues
The above results can hardly be interpreted as causal effects of the minimum
wage fixing regime on the minimum to average wage ratio. The fixing regime
may indeed be endogenous to the choice of any given wage floor. To make
inferences as to whether the wage fixing regime affects minimum wage levels, in
Table 7 we concentrate on those countries that have a relatively long history of
minimum wages. There is indeed considerable inertia in the fixing regime: no
country in our sample has changed its fixing regime over time. Minimum wages,
on the other hand, are adjusted typically at yearly frequencies. Thus, the focus
on countries with well-established minimum wages should allow us to capture
causal effects of the fixing regime over the level of the minimum wage.
In particular, we consider two set of countries: i. countries that had intro-
duced a minimum wage at least 10 years prior to the beginning of our observation
period, and ii. countries having introduced the minimum wage at least 20 years
before the first observation in our dataset. Collectively bargained minimum
wages still yield a positive markup over Government legislated ones. The effect
is even stronger when we concentrate on countries with a longer history of min-
imum wages. We interpret these results as broadly supportive of a causal effect
of the fixing regime over the level of minimum wages4.
4We also instrumented the fixing regime, based on some (as always debatable) exclusion
restriction. In particular, the identifying assumption was that the degree of democracy in
a given country and time period is correlated with the wage fixing regime, but not directly
with the level of the minimum wage, after controlling for all the relevant country specific
characteristics. If the above identifying assumption is accepted, results (available from the
author upon request) are consistent with a causal effect of the fixing regime over the level of
the minimum wage. In particular, the political regime (captured by the Polity2 index) is a
strong predictor of the probability of choosing a Government legislated minimum wage fixing
regime over a collectively bargained one, whilst in the second stage equation (where polity2 is
not significant) minimum wages under Government legislated minimum wage fixing regimes
22
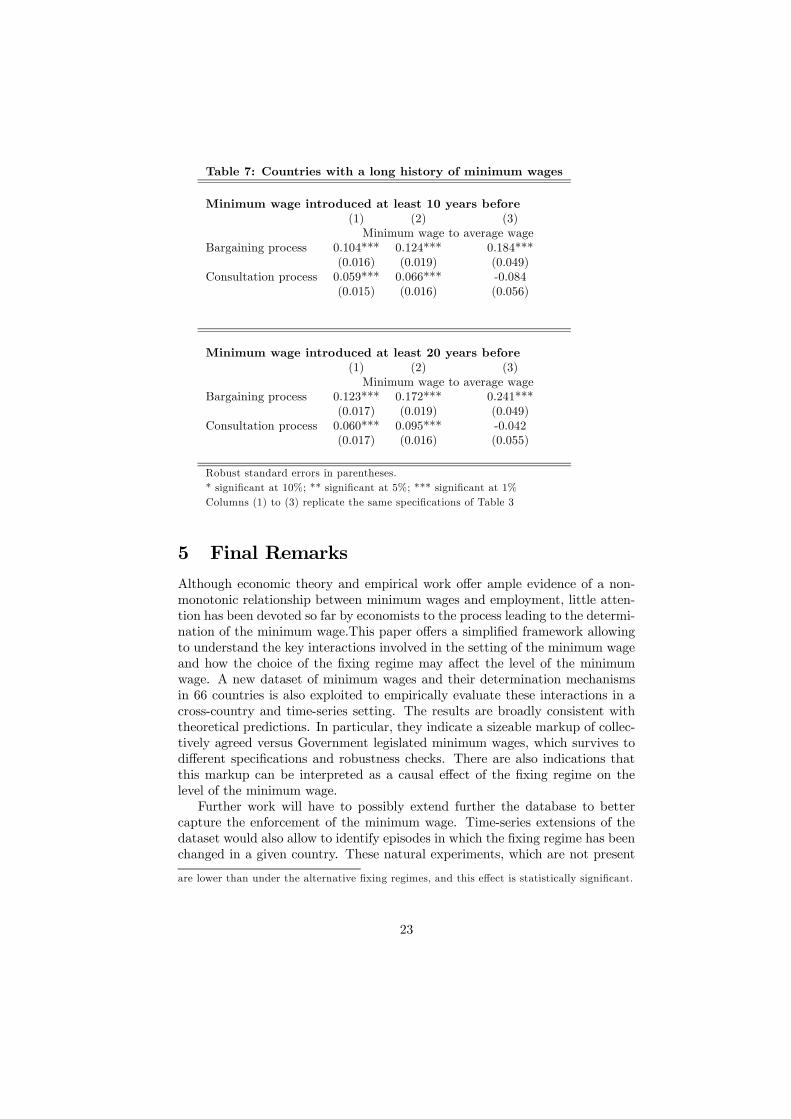
Table 7: Countries with a long history of minimum wages
Minimum wage introduced at least 10 years before
(1) (2) (3)
Minimum wage to average wage
Bargaining process 0.104*** 0.124*** 0.184***
(0.016) (0.019) (0.049)
Consultation process 0.059*** 0.066*** -0.084
(0.015) (0.016) (0.056)
Minimum wage introduced at least 20 years before
(1) (2) (3)
Minimum wage to average wage
Bargaining process 0.123*** 0.172*** 0.241***
(0.017) (0.019) (0.049)
Consultation process 0.060*** 0.095*** -0.042
(0.017) (0.016) (0.055)
Robust standard errors in parentheses.
* significant at 10%; ** significant at 5%; *** significant at 1%
Columns (1) to (3) replicate the same specifications of Table 3
5 Final Remarks
Although economic theory and empirical work offer ample evidence of a non-
monotonic relationship between minimum wages and employment, little atten-
tion has been devoted so far by economists to the process leading to the determi-
nation of the minimum wage.This paper offers a simplified framework allowing
to understand the key interactions involved in the setting of the minimum wage
and how the choice of the fixing regime may affect the level of the minimum
wage. A new dataset of minimum wages and their determination mechanisms
in 66 countries is also exploited to empirically evaluate these interactions in a
cross-country and time-series setting. The results are broadly consistent with
theoretical predictions. In particular, they indicate a sizeable markup of collec-
tively agreed versus Government legislated minimum wages, which survives to
different specifications and robustness checks. There are also indications that
this markup can be interpreted as a causal effect of the fixing regime on the
level of the minimum wage.
Further work will have to possibly extend further the database to better
capture the enforcement of the minimum wage. Time-series extensions of the
dataset would also allow to identify episodes in which the fixing regime has been
changed in a given country. These natural experiments, which are not present
are lower than under the alternative fixing regimes, and this effect is statistically significant.
23

in the period covered by our data, would enable implementation of difference-
in-differences estimators.
24
6 References
Algan, Y. and Cahuc, P. (2007), "Social Attitudes and Economic Development:
An Epidemiological Approach", CEPR DP 6403.
Ashenfelter, O. and Card, D. (1985), "Using the Longitudinal Structure of
earnings to Estimate the Effect of Training Programs," Review of Economics
and Statistics, 67: 648-60.
Bertola, G. and Boeri, T. (2002), "EMU Labour Markets Two Years On:
Microeconomic Tensions and Institutional Evolution", in Buti, M. and Sapir,
A. (eds.) EMU and Economic Policy in Europe, Edward Elgar.
Blais, A., Cousineau, J. and McRoberts, K (1989) "The determinants of
minimum wage rates", Public Choice
Boeri, t. and Burda, M. (2009), "Preferences for Collective vs. Individual-
ized Wage Setting", The Economic Journal, forthcoming.
Boeri, T. and Macis, M. (2009), "Do Unemployment Benefits Promote or
Hinder Job Reallocation?", Journal of Development Economics, forthcoming.
Brown, W. (2009), "The Process of Fixing the British National MinimumWage,
1997—2007", British Journal of Industrial Relations, 1467-8543.2009.
Calmfors, L. and Driffil (1988), "Bargaining Structure, Corporatism, and
Macroeconomic Performance", Economic Policy, 6:12-61.
Coughlin, P. (1992), Probabilistic Voting Theory, Cambridge University Press.
Flinn, C. (2007), "MinimumWage Effects on Labor Market Outcomes Under
Search, Matching, and Endogenous Contact Rates", Econometrica 74 (4): 1013-
62.
Hosios, A.J. (1990). "On the Efficiency of Matching and Related Models
of Search and Unemployment", Review of Economic Studies, vol. 57(2), pp.
279-298.
Labartino, G. (2008) "Tax Wedge and the Effect on Labour Market Out-
comes: Evidence from a Novel Dataset", Bocconi University, mimeo.
Manning, A.(2003) Monopsony in Motion, Princeton, NJ: Princeton Univer-
sity Press.
Neumark, D. and Wascher, W. (2007), "MinimumWages and Employment",
Foundations and Trends in Microeconomics, 2007, Vol. 3, Nos. 1-2, pp. 1-182.
Rodrik, D. (1999) "Democracies Pay Higher Wages", Quarterly Journal of
Economics, MIT Press, Vol. 114(3), pp. 707-738.
Silbermann, J. and Durden, G. (1976) "Determinining Legislative Prefer-
ences on the Minimum Wage: An Economic Approach", Journal of Political
Economy, Vol. 84(2), pp. 317-329.
25
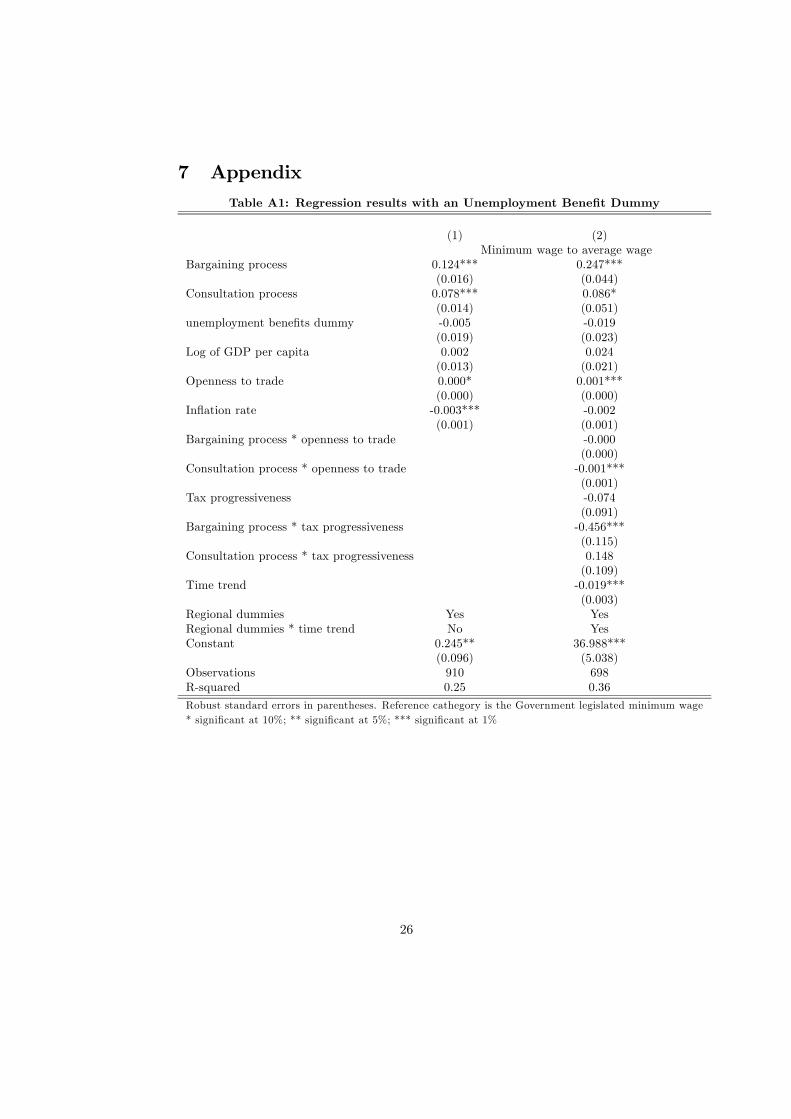
7 Appendix
Table A1: Regression results with an Unemployment Benefit Dummy
(1) (2)
Minimum wage to average wage
Bargaining process 0.124*** 0.247***
(0.016) (0.044)
Consultation process 0.078*** 0.086*
(0.014) (0.051)
unemployment benefits dummy -0.005 -0.019
(0.019) (0.023)
Log of GDP per capita 0.002 0.024
(0.013) (0.021)
Openness to trade 0.000* 0.001***
(0.000) (0.000)
Inflation rate -0.003*** -0.002
(0.001) (0.001)
Bargaining process * openness to trade -0.000
(0.000)
Consultation process * openness to trade -0.001***
(0.001)
Tax progressiveness -0.074
(0.091)
Bargaining process * tax progressiveness -0.456***
(0.115)
Consultation process * tax progressiveness 0.148
(0.109)
Time trend -0.019***
(0.003)
Regional dummies Yes Yes
Regional dummies * time trend No Yes
Constant 0.245** 36.988***
(0.096) (5.038)
Observations 910 698
R-squared 0.25 0.36
Robust standard errors in parentheses. Reference cathegory is the Government legislated minimum wage
* significant at 10%; ** significant at 5%; *** significant at 1%
26
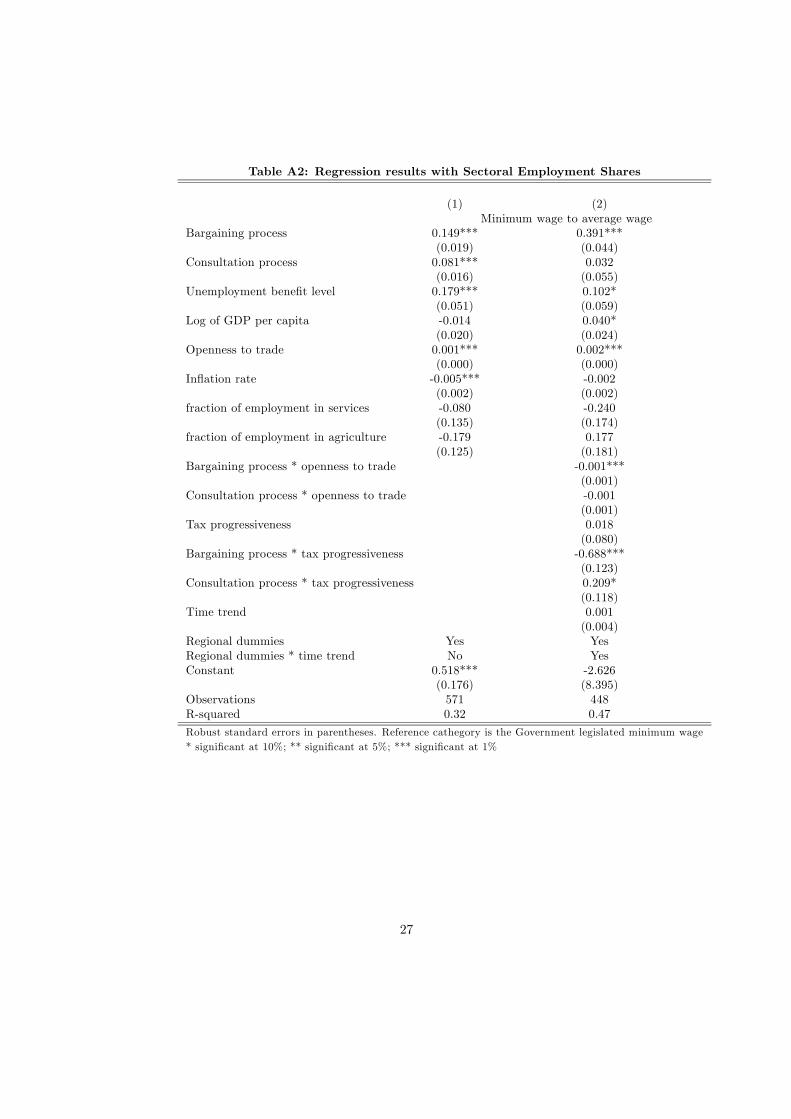
Table A2: Regression results with Sectoral Employment Shares
(1) (2)
Minimum wage to average wage
Bargaining process 0.149*** 0.391***
(0.019) (0.044)
Consultation process 0.081*** 0.032
(0.016) (0.055)
Unemployment benefit level 0.179*** 0.102*
(0.051) (0.059)
Log of GDP per capita -0.014 0.040*
(0.020) (0.024)
Openness to trade 0.001*** 0.002***
(0.000) (0.000)
Inflation rate -0.005*** -0.002
(0.002) (0.002)
fraction of employment in services -0.080 -0.240
(0.135) (0.174)
fraction of employment in agriculture -0.179 0.177
(0.125) (0.181)
Bargaining process * openness to trade -0.001***
(0.001)
Consultation process * openness to trade -0.001
(0.001)
Tax progressiveness 0.018
(0.080)
Bargaining process * tax progressiveness -0.688***
(0.123)
Consultation process * tax progressiveness 0.209*
(0.118)
Time trend 0.001
(0.004)
Regional dummies Yes Yes
Regional dummies * time trend No Yes
Constant 0.518*** -2.626
(0.176) (8.395)
Observations 571 448
R-squared 0.32 0.47
Robust standard errors in parentheses. Reference cathegory is the Government legislated minimum wage
* significant at 10%; ** significant at 5%; *** significant at 1%
27
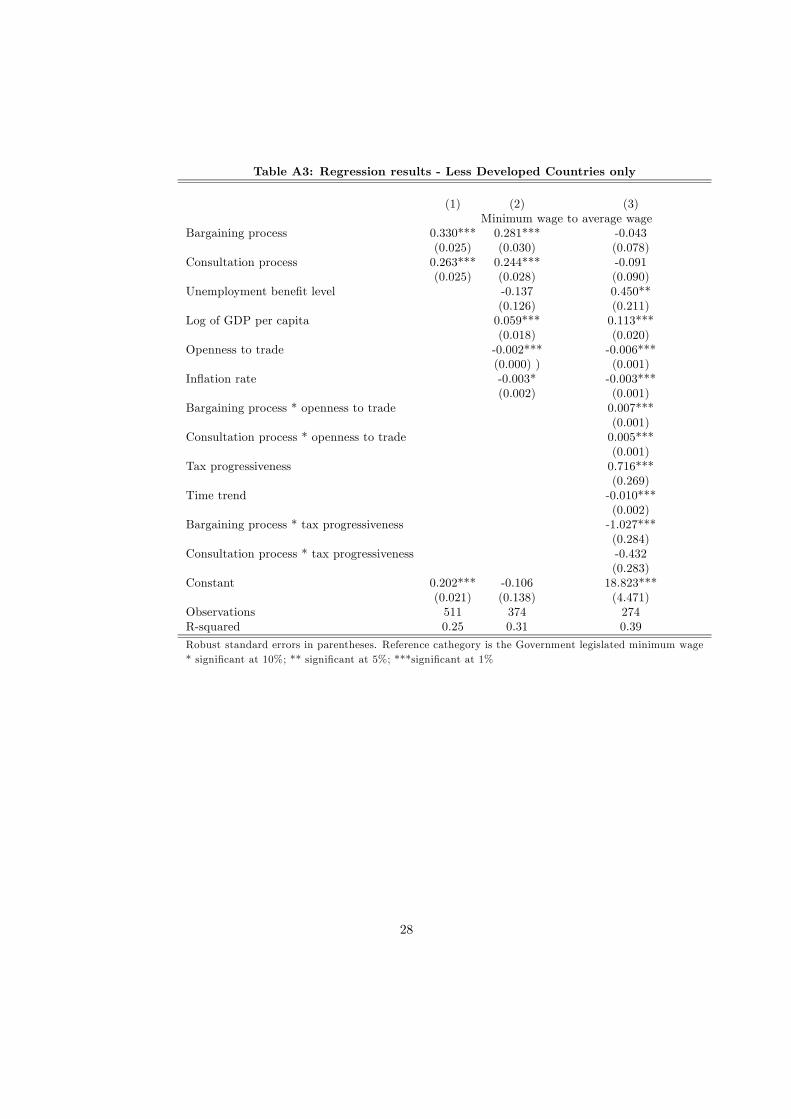
Table A3: Regression results - Less Developed Countries only
(1) (2) (3)
Minimum wage to average wage
Bargaining process 0.330*** 0.281*** -0.043
(0.025) (0.030) (0.078)
Consultation process 0.263*** 0.244*** -0.091
(0.025) (0.028) (0.090)
Unemployment benefit level -0.137 0.450**
(0.126) (0.211)
Log of GDP per capita 0.059*** 0.113***
(0.018) (0.020)
Openness to trade -0.002*** -0.006***
(0.000) ) (0.001)
Inflation rate -0.003* -0.003***
(0.002) (0.001)
Bargaining process * openness to trade 0.007***
(0.001)
Consultation process * openness to trade 0.005***
(0.001)
Tax progressiveness 0.716***
(0.269)
Time trend -0.010***
(0.002)
Bargaining process * tax progressiveness -1.027***
(0.284)
Consultation process * tax progressiveness -0.432
(0.283)
Constant 0.202*** -0.106 18.823***
(0.021) (0.138) (4.471)
Observations 511 374 274
R-squared 0.25 0.31 0.39
Robust standard errors in parentheses. Reference cathegory is the Government legislated minimum wage
* significant at 10%; ** significant at 5%; ***significant at 1%
28


