
Department of Energy and Environment CHALMERS UNIVERSITY OF TECHNOLOGY Gothenburg, Sweden 2014
Signal box optimisation at the Swedish railway Master’s Thesis within the Sustainable Energy Systems programme
PETRUS SIGVARDSSON


MASTER’S THESIS
Signal box optimisation at the Swedish railway
Master’s Thesis within the Sustainable Energy Systems programme
PETRUS SIGVARDSSON
Department of Energy and Environment
Division of Electric Power Engineering
UNIVERSITY OF TECHNOLOGY
Göteborg, Sweden

Signal box optimisation at the Swedish railway
Master’s Thesis within the Sustainable Energy Systems programme
© PETRUS SIGVARDSSON,
Examensarbete / Institutionen för energi och miljö,
Chalmers tekniska högskola
Department of Energy and Environment
Division of Electric Power Engineering
Chalmers University of Technology
SE-412 96 Göteborg
Sweden
Telephone: + 46(0)31 772 10 00
Cover:
Signal box 300. Photo: Petrus Sigvardsson.
Chalmers Reproservice
Göteborg, Sweden

CHALMERS, Energy and Environment, Master’s Thesis i
Signal box optimisation at the Swedish railway
Master’s Thesis within the Sustainable Energy Systems programme
PETRUS SIGVARDSSON
Department of Energy and Environment
Division of Electric Power Engineering
Chalmers University of Technology
ABSTRACT
The transport sector faces major challenges in meeting the increasing demands of
energy efficiency. Work is carried out to optimize energy consumption in the railway
signalling system. However, no studies have been made of what the actual power
requirement is for the signal boxes along the railway. This thesis has investigated if an
energy optimization can be done in three existing signal boxes of type 95 in Göteborg.
Type 95 signal boxes are computer based and control e.g. signals and railway
switches. Today, consultants relay on data sheets from suppliers during new design
and reinvestment. The result in this thesis is a new proposed method for optimization
that can be used on both existing signal boxes and signal boxes that will be build in
the future.
The developed model used in the optimization method tells the user the actual power
requirement for a certain setup of components in the signal box and has proven to give
good results. This was determined by comparing the model to earlier proposed
optimization results and by testing the model on different sizes of signal boxes.
The model uses maximum values both from the in depth power consumption analysis
of the railway switches, and the assumed values from output groups with no
measurements on. Thus, the energy optimisation can be improved with further work
in the future.
The conclusion of this thesis is that some of the signal boxes in Göteborg are
dimensioned to handle much higher power consumption then the actual power
consumption is in the signal boxes. Subscription rates can thus be lowered which
results in a financial benefit. Cable dimensions can be reduced in planned new signal
station and in that way reduce used material. The UPS could also, in some cases, be
made smaller and take less space due to lower power peaks. This is both cheaper and
reduces the resources needed to build the signal box.
Key words: Signal box type 95, Energy optimization, PSU 151, Railway switches,
Diversity factor, Cable dimensioning.

CHALMERS, Energy and Environment, Master’s Thesis ii
Optimering av signalkiosker hos den Svenska järnvägen
Examensarbete inom Mastersprogrammet Sustainable Energy Systems
PETRUS SIGVARDSSON
Institutionen för Energi och Miljö
Avdelningen för Elteknik
Chalmers tekniska högskola
SAMMANFATTNING
Transportsektorn står inför stora utmaningar i att möta de ökande kraven på
energieffektivitet. Arbete utförs för att optimera energiförbrukningen i järnvägens
signalsystem. Dock har inga studier gjorts av hur stor den faktiska
effektförbrukningen verkligen är i ställverk längs järnvägen. Detta examensarbete har
undersökt om en energioptimering kan göras på tre befintliga ställverk av typ 95 i
Göteborg. Typ 95 ställverk är databaserade och kontrollerar bland annat signaler och
spårväxlar. Idag använder konsulterna datablad från leverantörer då ny design av
ställverk skall göras eller vid återinvesteringar. Resultatet i detta examensarbete
föreslår en ny metod för energioptimering som kan tillämpas på både befintliga
ställverk och ställverk som planeras bli uppförda i framtiden.
Den utvecklade modellen som används i metoden för optimering talar om det faktiska
effektbehovet för användaren, då en viss konfiguration av komponenter i ställverket.
Modellen har visat sig ge goda resultat. Detta bestämdes genom att jämföra modellens
värden med tidigare föreslagna optimeringsresultat och genom att testa modellen på
olika storlekar av ställverk. Modellen använder maxeffekter både från den ingående
analysen av järnvägsväxlarnas beteende och antar maxeffekter på de utgående
effektgrupper i ställverket där inga mätningar utfördes. Således kan
energioptimeringen förbättras med ytterligare utfört arbete i framtiden.
Slutsatsen i examensarbetet är att en del av ställverken i Göteborg är dimensionerade
för en mycket högre effekt än den faktiska effekten verkligen är.
Abonnemangskostnaderna kan således minskas vilket resulterar i en ekonomisk
vinning. Kabeldimensionerna kan minskas i planerade ställverk och på så sätt minska
använt material. UPS-enheten kan också, i vissa fall, göras mindre och ta mindre plats
på grund av lägre effekttoppar. Detta är både billigare och minskar de resurser som
krävs för att bygga upp signalboxen.
Nyckelord: Ställverk 95, Energioptimering, PSU 151, Järnvägsväxlar,
Sammanlagringsfaktor, Kabeldimensionering.

CHALMERS, Energy and Environment, Master’s Thesis iii
Preface
This master thesis was carried out at former Vectura Consulting AB, current Sweco
rail AB. The thesis work is the final part in my MSc in Sustainable Energy Systems at
Chalmers University of Technology.
I would like to thank everyone that contributed and helped me with this thesis. Special
thanks go out to following people:
Christer Antonsson and Esko Svahn, my supervisors at Sweco rail AB for help
with measurements and expert advice in the subject.
Clas Larsson, technical director within electrical engineering at Sweco rail
AB, for help with the creation of this thesis and the opportunity for me to work
with it.
Ivan Sare, signal engineer at Sweco rail AB, for help with finding various
documents and drawings.
Magnus Svahn, signal engineer at Sweco rail AB, for expertise regarding the
operation of a railroad switch.
Mats H Lundström, signal engineer at Sweco rail AB, for help with the search
for old theses.
Hannu Björkenskär, system engineer at Trafikverket, for help with log files for
the railway switches.
Jimmy Ehnberg, my supervisor at Chalmers for help with the technical design
of the report
Last but not least my family for the support during the thesis work.
Göteborg, June 2014
Petrus Sigvardsson

CHALMERS, Energy and Environment, Master’s Thesis iv
Contents
ABSTRACT I
SAMMANFATTNING II
PREFACE III
CONTENTS IV
GLOSSARY VII
1 INTRODUCTION 1
1.1 Background 1
1.2 Aim 1
1.3 Objective 2
1.4 Delimitations 2
1.5 Outline 2
2 SYSTEM DESCRIPTION 3
2.1 Signal box 300 5
2.2 Signal box 500 6
2.3 Signal box 600 6
2.4 Vendor of UPS:s to signal box 95 7
3 THEORY 8
3.1 Traffic security within the railway system 8
3.2 Signal security installations 8 3.2.1 Station installations 9 3.2.2 Line installations 9
3.3 ATC och ERTCS 9
3.4 Traffic control 10 3.4.1 ERTMS level 0 10 3.4.2 ERTMS level 1 10 3.4.3 ERTMS level 2 10
3.4.4 ERTMS level 3 10
3.5 UPS 11
3.6 Railroad Switch 12 3.6.1 Block section for a switch 13
3.7 Dimensioning of cables 15

CHALMERS, Energy and Environment, Master’s Thesis v
3.8 Fuses 16
3.9 Diversity factor 17
4 METHOD 18
4.1 Data collection and inventory of the system 18
4.2 Measurements 19 4.2.1 Measurement equipment 20 4.2.2 Measurement software 21
4.3 Analysis of measurements 21
4.3.1 Different graph shapes for switching movement 22
4.4 Construction of the model 24
4.5 Energy optimisation 25
4.5.1 Cable dimensioning in the software EL-Vis 10.1.0 25
5 RESULTS 26
5.1 Measurements results from signal box 300 26
5.2 Measurements results from signal box 500 28
5.3 Measurements results from signal box 600 30
5.4 Calculated power consumption for different kind of switches 32
5.5 Incoming power from measurements and model with PSU 151 excluded 33 5.5.1 Incoming power from measurements with PSU 151 excluded 33
5.5.2 Incoming power from model with PSU 151 excluded 33
5.6 Incoming power from PSU 151 model 35
5.7 Dimensioning power 37
5.7.1 Dimensioning power from measurements 37 5.7.2 Dimensioning power from model 37
5.8 Optimisation 38
5.8.1 Optimisation signal box 300 38
5.8.2 Optimisation signal box 500 38 5.8.3 Optimisation signal box 600 39
6 DISCUSSION 40
6.1 Assumptions and estimated parameters 40
6.2 Modelling approach 40
6.3 Discussion around optimisation results 42
7 CONCLUSION 44
7.1 Future work 44
8 REFERENCES 45
CHALMERS, Energy and Environment, Master’s Thesis vi
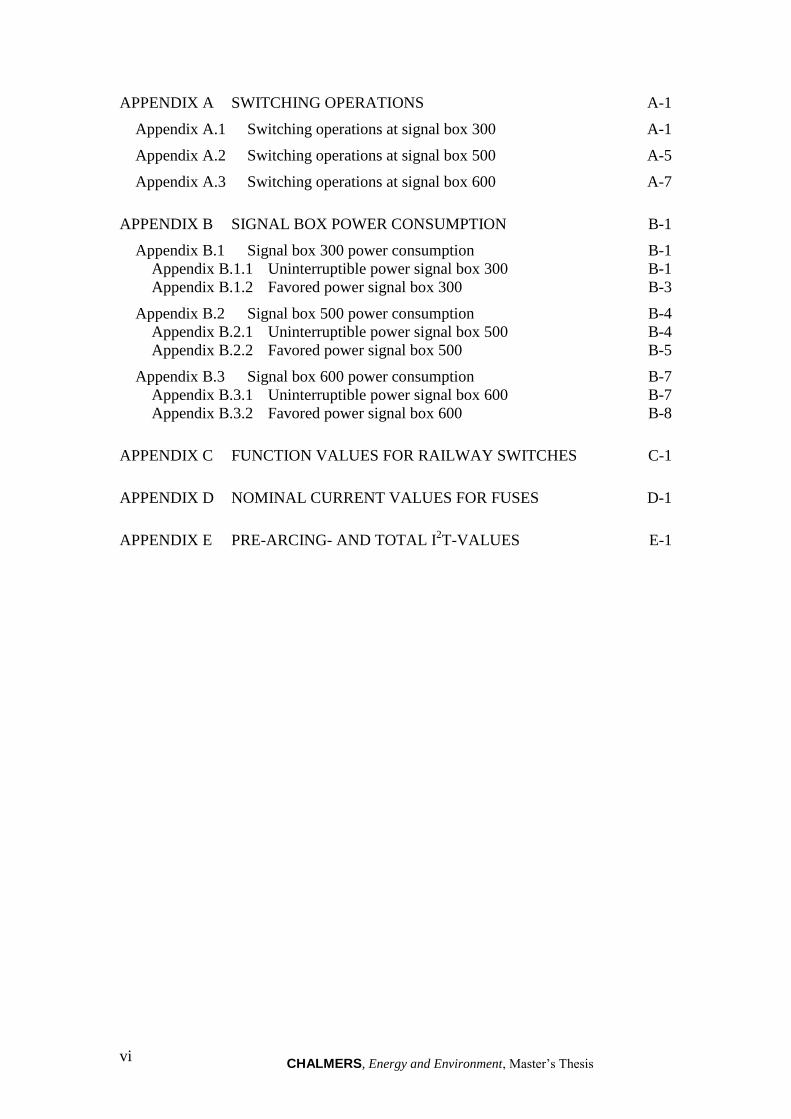
APPENDIX A SWITCHING OPERATIONS A-1
Appendix A.1 Switching operations at signal box 300 A-1
Appendix A.2 Switching operations at signal box 500 A-5
Appendix A.3 Switching operations at signal box 600 A-7
APPENDIX B SIGNAL BOX POWER CONSUMPTION B-1
Appendix B.1 Signal box 300 power consumption B-1 Appendix B.1.1 Uninterruptible power signal box 300 B-1 Appendix B.1.2 Favored power signal box 300 B-3
Appendix B.2 Signal box 500 power consumption B-4 Appendix B.2.1 Uninterruptible power signal box 500 B-4 Appendix B.2.2 Favored power signal box 500 B-5
Appendix B.3 Signal box 600 power consumption B-7 Appendix B.3.1 Uninterruptible power signal box 600 B-7 Appendix B.3.2 Favored power signal box 600 B-8
APPENDIX C FUNCTION VALUES FOR RAILWAY SWITCHES C-1
APPENDIX D NOMINAL CURRENT VALUES FOR FUSES D-1
APPENDIX E PRE-ARCING- AND TOTAL I2T-VALUES E-1

CHALMERS, Energy and Environment, Master’s Thesis vii
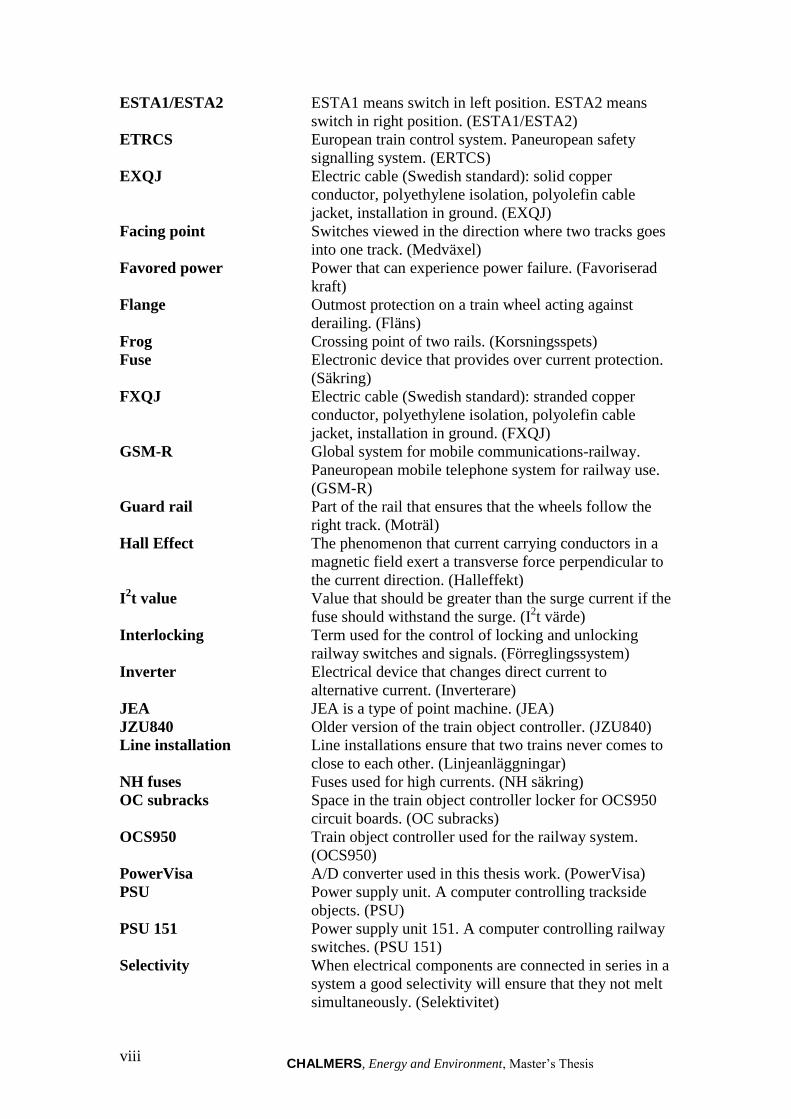
Glossary
Glossary with words related to this thesis with Swedish translation within brackets.
A/D converter Device for converting analogue signal to digital signal.
(A/D-omvandlare)
AC Alternative current (växelström)
Ampacity The maximum electrical current a device can carry
without damaging the device. (Märkström)
Amperage Strength of an electric current. (Strömstyrka)
ATC Automatic train control. Protection system for the train
operator. (ATC)
AXQJ Electric cable (Swedish standard): aluminium
conductor, polyethylene isolation, polyolefin cable
jacket, installation in ground. (AXQJ)
Banverket Swedish rail administration. Became “Trafikverket”
after 2010. (Eng: Swedish rail administration)
BKE Type of railway switch motor. (BKE)
Block section A part of the track, when it is occupied by a train,
blocks control operation of switches or derailer.
(Blockeringssträcka)
Bombardier Multinational railway equipment manufacturer.
(Bombardier)
Caching point Switch on refudge siding. (Skyddsväxel)
CCU Communication control unit. Handles data transmission
and reception between components and communication
network. (Kommunikationsstyrenhet)
CTC Centralized traffic control. Consists of train dispatchers
that controls rail traffic flows. (Driftledningscentral)
DC Direct current. (Likström)
Distribution board Electrical component that divides electrical power into
several circuits while providing protective fuse or
circuit breaker for each circuit. (Gruppcentral)
Dranetz Company within energy and power measurement.
(Dranetz)
Dranview Professional Measurement software reading data from PowerVisa.
(Dranview Professional)
D-type fuse Fuses with ceramic body ranging between 2A to 100A.
(D-säkring)
Diversity factor Sum of individual max power demand/max power
demand for station. (Sammanlagringsfaktor)
Eaton Company within power management solutions. (Eaton)
EL-Vis Software for cable dimensioning. (EL-Vis)
EMC Electromagnetic compatibility. Ensuring electronic
devices don’t interfere with each other through EMI.
(Elektromagnetisk kompatibilitet)
EMI filter Device to decrease electromagnetic interference. (EMI-
filter)
ERTMS European rail traffic management system. Paneuropean
train control system with purpose to get interoperability
across national borders. (ERTMS)
CHALMERS, Energy and Environment, Master’s Thesis viii
ESTA1/ESTA2 ESTA1 means switch in left position. ESTA2 means
switch in right position. (ESTA1/ESTA2)
ETRCS European train control system. Paneuropean safety
signalling system. (ERTCS)
EXQJ Electric cable (Swedish standard): solid copper
conductor, polyethylene isolation, polyolefin cable
jacket, installation in ground. (EXQJ)
Facing point Switches viewed in the direction where two tracks goes
into one track. (Medväxel)
Favored power Power that can experience power failure. (Favoriserad
kraft)
Flange Outmost protection on a train wheel acting against
derailing. (Fläns)
Frog Crossing point of two rails. (Korsningsspets)
Fuse Electronic device that provides over current protection.
(Säkring)
FXQJ Electric cable (Swedish standard): stranded copper
conductor, polyethylene isolation, polyolefin cable
jacket, installation in ground. (FXQJ)
GSM-R Global system for mobile communications-railway.
Paneuropean mobile telephone system for railway use.
(GSM-R)
Guard rail Part of the rail that ensures that the wheels follow the
right track. (Moträl)
Hall Effect The phenomenon that current carrying conductors in a
magnetic field exert a transverse force perpendicular to
the current direction. (Halleffekt)
I2t value Value that should be greater than the surge current if the
fuse should withstand the surge. (I2t värde)
Interlocking Term used for the control of locking and unlocking
railway switches and signals. (Förreglingssystem)
Inverter Electrical device that changes direct current to
alternative current. (Inverterare)
JEA JEA is a type of point machine. (JEA)
JZU840 Older version of the train object controller. (JZU840)
Line installation Line installations ensure that two trains never comes to
close to each other. (Linjeanläggningar)
NH fuses Fuses used for high currents. (NH säkring)
OC subracks Space in the train object controller locker for OCS950
circuit boards. (OC subracks)
OCS950 Train object controller used for the railway system.
(OCS950)
PowerVisa A/D converter used in this thesis work. (PowerVisa)
PSU Power supply unit. A computer controlling trackside
objects. (PSU)
PSU 151 Power supply unit 151. A computer controlling railway
switches. (PSU 151)
Selectivity When electrical components are connected in series in a
system a good selectivity will ensure that they not melt
simultaneously. (Selektivitet)

CHALMERS, Energy and Environment, Master’s Thesis ix
Signal box Facility that controls the railway traffic within a station.
(Ställverk)
Signal box 95 Computer based signal box used for control and
monitoring of operation sites with conventional
signalling and ERTMS. (Ställverk 95)
SJ Swedish government owned passenger train operator.
(Statens järnvägar)
Slip current Maximum current that the motor operates within.
(Slirström)
Standard fuse Automatic fuses. (Normsäkring)
Station installation Station installation controls signals, switches and
possible barriers. (Stationsanläggningar)
Buffer stop Physical object preventing trains from going past the
end of a track. (Stoppbock)
Surge current Maximum input current needed for an electric device
when turned on. (Startström)
Switch/point Section of the track with moving parts allowing trains to
change track. (Växel)
Switching Motion to move trains between tracks. (Växling)
Refuge siding Part of the track leading to a buffer stop.
(Säkerhetsspår)
TN-C system Earthing system where PEN (protective earth and
neutral) is combined. (4 ledarsystem)
TN-S system Earthing system where PE and N (protective earth and
neutral) are separated. (5 ledarsystem)
Track coil Transponder that transmits information between the
track and the train. (Balis)
Traffic planning system H Traffic planning system based on the existence of signal
cabin and block system on the line. (System H)
Traffic planning system M Traffic planning system based on that the line is
supervised by two movements inspectors. (System M)
Trafikverket Swedish transport administration.
Trailing point Switches viewed in the direction where a track branches
of into two tracks. (Motväxel)
Train object controller A part of the signal box where trackside objects such as
switches and signalling objects are connected. (Utdel)
Trigger condition Calculation that a fuse blows correctly.
(Utlösningsvillkor)
Uninterruptible power Power fed online from a battery pack (Avbrottsfri kraft)
UPS Electrical device providing uninterruptible power if
main power fails. (UPS)
Vectura Technology consulting firm within transport
infrastructure. Vectura is a part of Sweco since July
2013. (Vectura)
Västlänken Planned railway tunnel under Gothenburg.

CHALMERS, Energy and Environment, Master’s Thesis x

CHALMERS, Energy and Environment, Master’s Thesis 1
1 Introduction
This chapter will give an introduction to the thesis. A more in depth system
background will be given in the next chapter. The introduction starts with a short
background followed by aim and objective. Delimitations are thereafter stated. The
introduction ends with an outline.
1.1 Background
The railway system has been a part of Sweden’s transportation system since the
middle of the 1800s. This was late compared to some other countries in Europe. In the
beginning there were a lot of opponents that Sweden should have a railway system at
all. The opponents were worried about the costs and that the expansion of the railway
system would lead to an undesirable industrialization. Despite the opponents the
railway system expanded until the year 1938 when people started to get cars. At the
same time the Swedish state owned railways, SJ, started to take over the privately
owned railways. The state owned railways were in the beginning small parts of the
total railway network but will for now on become nearly exclusively state owned [1].
At the year 1988 the management of the railway system changed a lot when the task
of managing and maintaining the tracks was moved to the newly formed state
administration, Banverket. Banverket would later (2010) become a part of the state
administration, Trafikverket [2].
Approximately 80 % of the 14700 km railway network Trafikverket administrate is
electrified. This makes Swedish railway one of to the most electrified in Europe [3].
The transport sector faces major challenges in meeting the increasing demands of
energy efficiency. Changes in the transport sector are needed in order for these
requirements to get fulfilled. Transportation by train in Sweden is one of the best
environmental options as the largest part of the Swedish railway system is electrified
and the majority of the energy supply coming from sustainable sources, like hydro
power. Work is carried out to optimize the energy consumption in the railway
signalling system. Among other things by educate train drivers to drive more energy
efficient. However, no studies have been made of what the actual power requirement
is for the railway signalling system and whether it is possible to optimize it. Signalling
boxes stands under large amount of regulations. This drives consultants to rely on data
sheets from suppliers during new design and reinvestment. This often results in, at
least what experienced consultants think, in oversized facilities. An earlier test
measurement performed by Vectura indicates over dimensioned signalling boxes. All
together this results in higher cost for investment, operation and maintenance. Only
maintenance and reinvestment of signal installations cost 280 million SEK per year
for the Swedish Transport Administration (Trafikverket) [4].
1.2 Aim
The aim of this thesis is to create a model for evaluating the actual power requirement
in a signal box and use it for optimizing its component setup.

CHALMERS, Energy and Environment, Master’s Thesis 2
1.3 Objective
The objectives of this thesis are to
Measure and record currents and voltages in some existing signaling control
boxes for the railway system in Gothenburg in order to collect actual power
patterns and peaks in the system.
Create a model which easily evaluates the dimensioned uninterruptible and
favorable power requirement, i.e. energy optimization1, for a railway signal
system.
Use result from the model to propose how to optimize the component setup in
the signal box that steers the railway signal system.
1.4 Delimitations
The measurements in this project are only performed in some selected signalling
boxes in Gothenburg. The power supply studied is just to the Swedish transport
Administration’s signalling boxes. Thus this does not, for example, include power
supply for heating of switches or power supply to the overhead line systems that
operates the trains. Most of the components in an existing signal box cannot be
replaced. However a better knowledge about the actual power use of the components
could still be retrieved. The measurements took place in the spring and autumn in
2013. The change of the power demand due to seasonal variations is not included in
this thesis due to limited time. The limited time will also affect the quantity and length
of measurements. The project will only include existing signalling boxes, but the
analysis and the resulting data can be used for future planning.
1.5 Outline
The report is divided into the main chapters; theory, method, results, discussion and
conclusion. The theory chapter contains necessary theory needed to understand the
rest of the report. The theory is quite in depth in order for the inexperienced reader
could follow the rest of the report. The method begins with a data collection followed
by measurements and analysis of measurements. The second part of the method
consists of creating a model that describes the system and an attempt in energy
optimisation. A more detail description of the methodology is found in chapter 4. The
results from the method will thereafter be presented and discussed. A conclusion will
summarize findings and recommendation of further investigations will be presented.
1 The optimisation in this thesis is seen from a resources point of view. A better understanding
of the actual power requirement in the signal box can lead to a component setup that is better
adapted to the actual power requirement. Less use of resources leads indirectly to an energy
optimisation as discussed in the discussion.
CHALMERS, Energy and Environment, Master’s Thesis 3
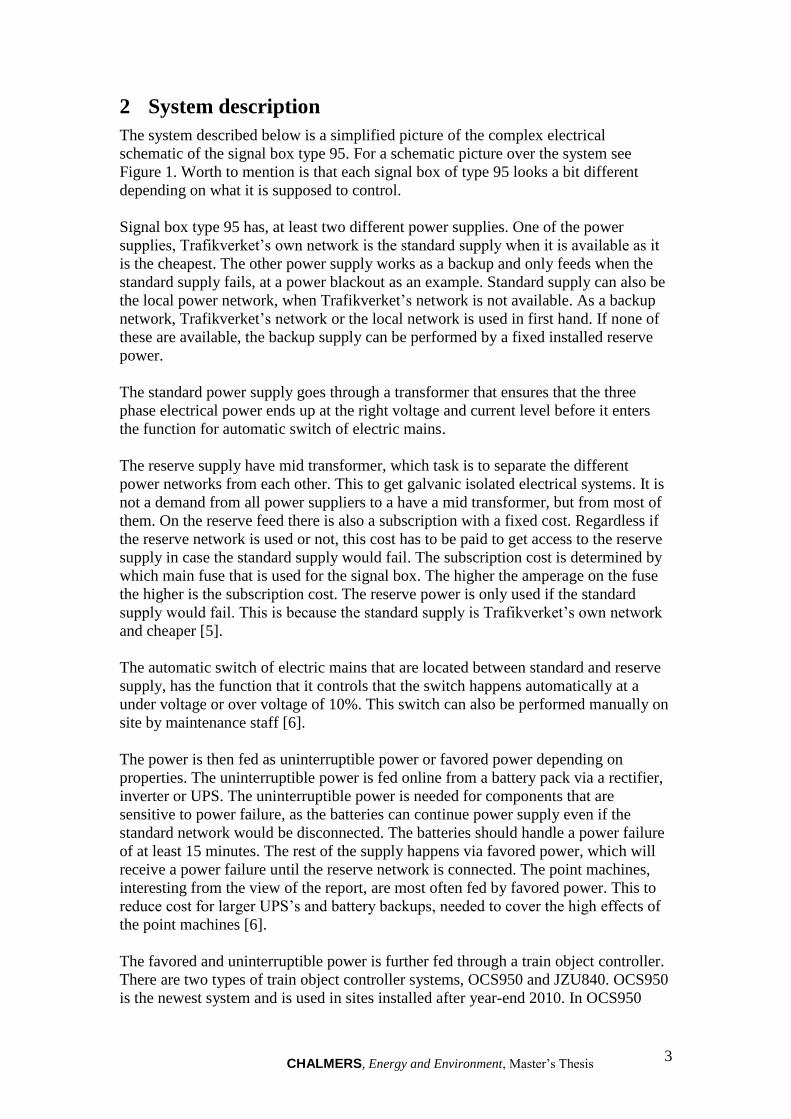
2 System description
The system described below is a simplified picture of the complex electrical
schematic of the signal box type 95. For a schematic picture over the system see
Figure 1. Worth to mention is that each signal box of type 95 looks a bit different
depending on what it is supposed to control.
Signal box type 95 has, at least two different power supplies. One of the power
supplies, Trafikverket’s own network is the standard supply when it is available as it
is the cheapest. The other power supply works as a backup and only feeds when the
standard supply fails, at a power blackout as an example. Standard supply can also be
the local power network, when Trafikverket’s network is not available. As a backup
network, Trafikverket’s network or the local network is used in first hand. If none of
these are available, the backup supply can be performed by a fixed installed reserve
power.
The standard power supply goes through a transformer that ensures that the three
phase electrical power ends up at the right voltage and current level before it enters
the function for automatic switch of electric mains.
The reserve supply have mid transformer, which task is to separate the different
power networks from each other. This to get galvanic isolated electrical systems. It is
not a demand from all power suppliers to a have a mid transformer, but from most of
them. On the reserve feed there is also a subscription with a fixed cost. Regardless if
the reserve network is used or not, this cost has to be paid to get access to the reserve
supply in case the standard supply would fail. The subscription cost is determined by
which main fuse that is used for the signal box. The higher the amperage on the fuse
the higher is the subscription cost. The reserve power is only used if the standard
supply would fail. This is because the standard supply is Trafikverket’s own network
and cheaper [5].
The automatic switch of electric mains that are located between standard and reserve
supply, has the function that it controls that the switch happens automatically at a
under voltage or over voltage of 10%. This switch can also be performed manually on
site by maintenance staff [6].
The power is then fed as uninterruptible power or favored power depending on
properties. The uninterruptible power is fed online from a battery pack via a rectifier,
inverter or UPS. The uninterruptible power is needed for components that are
sensitive to power failure, as the batteries can continue power supply even if the
standard network would be disconnected. The batteries should handle a power failure
of at least 15 minutes. The rest of the supply happens via favored power, which will
receive a power failure until the reserve network is connected. The point machines,
interesting from the view of the report, are most often fed by favored power. This to
reduce cost for larger UPS’s and battery backups, needed to cover the high effects of
the point machines [6].
The favored and uninterruptible power is further fed through a train object controller.
There are two types of train object controller systems, OCS950 and JZU840. OCS950
is the newest system and is used in sites installed after year-end 2010. In OCS950

CHALMERS, Energy and Environment, Master’s Thesis 4
there are a number of different power units that supplies power to components like
receivers like signals, electronics and switches. The fed voltage goes to the power unit
via cables mounted on sockets in the distribution board and converts in the power unit
to AC/DC that are demanded from the receivers. The power units each have their own
numbered socket in the distribution board [7]. The power units are delivered from
Bombardier in both one phase and three phases. Three phases is the most common
and occurs in four different models depending on use (point machines, signal light
bulbs and LED units, OC sub-racks with internal logic voltage 24V, external logic
system via OCS 950). For every power unit there is also an EMI filter installed to
fulfil the demands on EMC for OCS950 [7]. The power units have one or more
receivers consisting of a number computer boards mounted in a rack that feed the
power further via object sockets to the objects. For one or more receivers there is a
communication control unit installed. This takes care of data transfer and data
reception in a ”duplex communication path”. The CCU is therefore an important part
for the communication [8].
Figure 1 Simplified model over how the system for signal box type 95 is connected.

CHALMERS, Energy and Environment, Master’s Thesis 5
2.1 Signal box 300
Signal box 300 is situated in Olskroken. All the three analysed signalling stations
have one single UPS placed in each station. This is not always the case for signal
boxes type 95. E.g. the power supply to signal boxes in Malmö is structured with a
centralized placed UPS at 160 kVA which feeds all the signalling stations around. The
UPS in signal box 300 in Göteborg doesn’t need to be as big since it only requires
covering the power demand for the signal box own interruptible power supply. There
are pros and cons with a UPS placed in each signalling station. The major benefits are
that potential errors on the UPS only concerns one station. The error will then be less
severe than a centralized UPS. The error will at the same time be easier to locate.
Another benefit from having a UPS in every station is that the total cable length
needed will be decreased. The negative aspects with a UPS in every station are mainly
the high cost. It requires more components due to more UPS:s and batteries and also
more space. Moreover there is a need for more energy subscriptions and backup
networks with a UPS in every station.
Signal box 300 is installed with a UPS of size 30 kVA with 63 amperes fuses for
incoming power to the station. The signalling station is dimensioned with a 25 metre
incoming cable of type EXQJ 4x10/10 from a-side of the network and a 90 metre
cable type FXQJ 4x16/16 from the b-side of the network, see Figure 1. Signal box 300
is the largest of the three stations measurements took place on. The station controls 21
switches see Table 1 below. There is bit unclear if an attempt to optimise the station
can be done. This due to that the stations power requirements will increase when
“Västlänken” appears in the future. How much the power supply has to be increased is
today unclear. Measurements took place anyway at signal box 300 as the number of
switches would give a wide data collection.
Table 1 Type of switch mechanism for switches belonging to station 300.
Switch number Type of switch Switch number
cont.
Type of switch cont.
387 2512 jea73 170 427 2512 jea73 170
388 2512 jea73 170 429 2501 jea72 170
394 2512 jea73 170 468 2512 jea73 170
395 2512 jea73 170 469 2512 jea73 170
398 2512 jea73 170 477 2512 jea73 170
409 2512 jea72 170 480 2512 jea73 170
410 2512 jea72 170 481 2512 jea73 170
411 2512 jea72 94 483 2512 jea73 170
419 2512 jea73 170 484 2512 jea72 170
426 2512 jea73 170 485 2512 jea72 170
427 2512 jea73 170 486 2512 jea73 170

CHALMERS, Energy and Environment, Master’s Thesis 6
2.2 Signal box 500
Station 500 is also located in Olskroken. This signal box is a lot smaller compared to
signal box 300. It has an UPS of 8 kVA and the fuses are at 35 A for incoming power.
The station controls six switches according to Table 2 below. The station is
dimensioned with a 520 metre incoming cable of type AXQJ 4x95/29 from the a-side
of the network. From the b-side the station is fed directly from a network station
(T474/2) with favoured power. There are no known changes that will take place to the
incoming power to the signal box today [9].
Table 2 Type of switch mechanism for switches belonging to station 500.
Switch number Type of switch
461 2512 jea73 170
462 2512 jea73 170
463 2512 jea73 170
547 2512 jea73 170
550 2512 jea72 170
551 2512 jea72 170
2.3 Signal box 600
Signal box 600 is located in Kville. It has an UPS of 15 kVA and fuses at 63 A for
incoming power. The station controls ten switches according to Table 3 below. The
station is dimensioned with a 130 metre incoming cable of type FXQJ 4x16/16 from
the a-side of the network. The incoming cable from the b-side of the network is of the
same type and length. There are no known changes that will take place to the
incoming power to the signal box today [9].
Table 3 Type of switch mechanism for switches belonging to station 600.
Switch number Type of switch
607 2501 jea73 170
608 2501 jea72 170
614 2512 jea52 170
617 2512 jea52 170
618 2501 jea52 170
621 2512 jea73 170
623 2501 jea52 170
624 2501 jea73 170
625 2501 jea73 170
626 2501 jea52 170
CHALMERS, Energy and Environment, Master’s Thesis 7
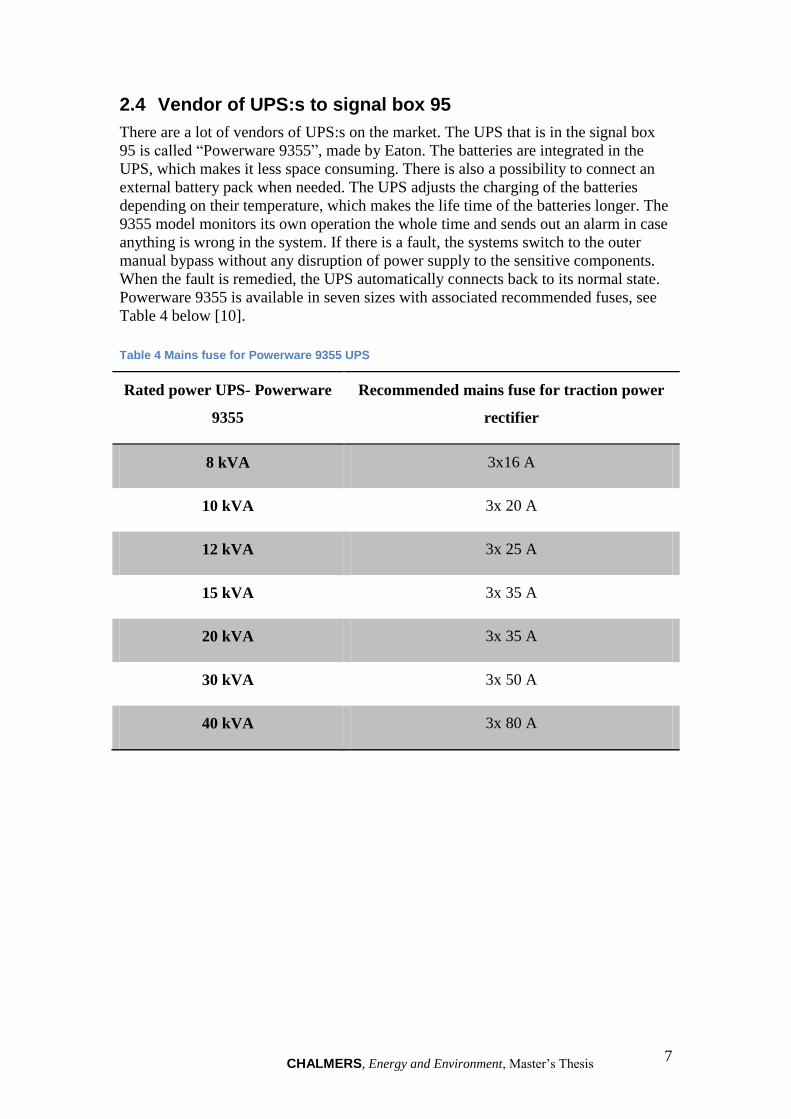
2.4 Vendor of UPS:s to signal box 95
There are a lot of vendors of UPS:s on the market. The UPS that is in the signal box
95 is called “Powerware 9355”, made by Eaton. The batteries are integrated in the
UPS, which makes it less space consuming. There is also a possibility to connect an
external battery pack when needed. The UPS adjusts the charging of the batteries
depending on their temperature, which makes the life time of the batteries longer. The
9355 model monitors its own operation the whole time and sends out an alarm in case
anything is wrong in the system. If there is a fault, the systems switch to the outer
manual bypass without any disruption of power supply to the sensitive components.
When the fault is remedied, the UPS automatically connects back to its normal state.
Powerware 9355 is available in seven sizes with associated recommended fuses, see
Table 4 below [10].
Table 4 Mains fuse for Powerware 9355 UPS
Rated power UPS- Powerware
9355
Recommended mains fuse for traction power
rectifier
8 kVA 3x16 A
10 kVA 3x 20 A
12 kVA 3x 25 A
15 kVA 3x 35 A
20 kVA 3x 35 A
30 kVA 3x 50 A
40 kVA 3x 80 A

CHALMERS, Energy and Environment, Master’s Thesis 8
3 Theory
This underlying theory will provide foundation for the report. The theory is quite in
depth in order for the inexperienced reader within railway theory will understand the
results in this thesis.
3.1 Traffic security within the railway system
A train could reach very high speed, which makes it hard for the train driver to stop
within his distance of visibility. It is also impossible for the train to swerve for objects
on the track. The combination of the high speed of the train and its heaviness can lead
to release of very large amounts of energy, when the train is retarded uncontrolled. An
eventual crash with another train or other heavy vehicles will end in a disaster. To
prevent this there is s need of information and control systems that secures that the
track is free from obstacles, for the train to travel safely. Such systems can include
rules, work routines and plans, on technical equipments or a combination of all of
them [11].
In simple terms one could say that the task of the security system is to prevent the
trains from making unexpected movements, while the traffic control system steers the
train into a free track section in the right point of time. This is very simplistic, since
the systems are very tightly integrated in reality. For the security systems to work as
designed it is vital that the trains and the railway system is maintained, which is done
by rules and control programs [11].
The basic principle for railway traffic control is that only one train set at every time
can be present on a block section. A block section is a delimited section with a power
supply that is shorted, if another train is present on the same block section. If the
block section is occupied by another train, main signals are showing a stop signal for
all traffic on the section. All main signals are also complemented with pre-signals,
placed ahead of the main signal. The pre-signals show status of the main signal at
least breaking distance ahead of the main signal. This type of control is called
automatic block system. The length of the block section can vary, but the trains are
usually driven with a couple of kilometers in between each other on a double track.
On a single track it is often the whole section between two stations that represents the
block section [12].
In the main part of the railway system the security system is design in the way that no
go signal could be shown before all conditions for “go” is fulfilled. The section the
train is going into have to be free from all vehicles and a protection distance from
these, as well as all switch blades should close tightly and be in locked state, for the
train not to derail in the switch. If not all conditions are fulfilled the signal always
shows stop. Stop signal is also the normal state for security equipments according to
the errors principle. For example causes a power failure in a signal circuit that it is
impossible to show go, instead stop is shown [12].
3.2 Signal security installations
The task for the signal security installations are to monitor so that trains are not
colliding with other trains or other obstacles on the track, as well as monitor to high

CHALMERS, Energy and Environment, Master’s Thesis 9
speed and not driving too far. When the signal securities have secured the section to
being free from obstacles it gives the possibility to give go signal for the section. The
older signal security systems are divided into two; station and line installations,
depending on which function they provide. In the newer signal boxes of model 95,
which this report analysis, includes both station and line installations [12].
3.2.1 Station installations
The station installations’ assignment is to control signals, switches and possible
barriers. Stations were the places where it was most crowdy in the beginning with
most train at the same time and most switches for shifting track for the trains. The
stations were at that time equipped with mechanical interlocking cabin that consisted
of a set of different locks that was dependent of each other. When it came more and
more switches to take care of, the mechanical interlocking cabins were displaced with
all-relay interlocking box. Only a few of the mechanical interlocking cabins are in use
in Sweden today. The big advantage of electrifying the interlocking cabins was the
automatic control that was given and that they could be remotely controlled, so called
centralized traffic control. The all-relay interlocking boxes also had the possibility to
control if the section was free or taken by a train, which wasn’t possible with the
mechanical interlocking cabins. Since the 80-ties the new signal boxes have IT-
technology in them, where software programs controls the functions of the signal box.
They are built up accordingly to the same principle as before. They also have two
independent software programs, which have to show the same result, for the signal to
give a go signal. This is done due to improved safety. The computerized signal boxes
can also give pre-programmed train routes, through automatic readout of the number
of the train [12].
3.2.2 Line installations
The assignment of the line installations is to ensure that two trains never come to
close to each other. There are different ways to regulate this. The oldest regulation,
traffic planning system M, is still used on less traffic loaded routes in the railway
system and on single track with only one train in motion between every station. This
control system consists of block per telephone between movement inspectors between
the stations to control that the section is free. To be able to drive trains with shorter
distance between each other than the distance between stations, another type of
control system was needed. This was where automatic line blocking came in; see 3.1
Traffic security within the railway system. Automatic line blocking together with
distance controlled blocking (Centralized Traffic Control, CTC) and the system ATC
(Automatic Train Control) forms traffic planning system H [12].
3.3 ATC och ERTCS
For the signals to be of any use, they have to be followed. Even an experienced train
driver can read the signals wrong due to the human factor. To ensure that no such
mistakes are happening large parts of the railway network is equipped with a system
called ATC (Automatic Train Control) or another system called ERTCS (European
Railway Traffic Control System). For ATC to be able to check if the signals are
followed by the driver there are track coils placed along the tracks. These track coils
are transponders mounted to the track that transfer information about the section and

CHALMERS, Energy and Environment, Master’s Thesis 10
signals to the ATC system in the train. The ATC system is showing the same
information to the driver as the signals, if he should have missed them. If the driver
not follows the message to be within a certain speed, the ATC system starts to warn
the driver. If the warnings not are followed by the driver, the train automatically starts
to brake according to a calculated brake curve, for the train to be able to stop before a
stop signal, as an example. The message from the track coil group is valid until the
next track coil group. ATC is developed in Sweden and will be replaced in due time
by ERTMS/ERTCS (European Railway Traffic Management System/ European Train
Control System) in accordance with a European Union directive [13].
3.4 Traffic control
The control of the railway traffic on the network is normally managed automatically
by the signal security installations. Often the traffic needs to be adjusted for the train
to be able to be in time. The train traffic punctuality is very seldom 100 % according
to statistics from Trafikverket. From July 2012 to June 2013 the punctuality was only
68.8 %2 in the worst case for the fast trains and 88.9 % at its best [14]. This is where
traffic control comes in and manages when the already delayed train has to be passed
by another train. This is easiest managed in traffic planning system H, which also is
the dominating system in use. The contact to the train is taken through the
internationally standardized communication system GSM-R. Important to know is
that the GSM-R system is only for guidance to the driver, the final decision is taken
through the ATC system. Implementation of the combined signal and security system
ERTMS is standard for all new track constructed. This is to make it easier for
transboundary rail traffic. The ERTMS system can be divided into several levels,
whereof level two will be the one mainly used in Sweden [15].
3.4.1 ERTMS level 0
Level 0 is a track section with no ERTMS system implemented [13].
3.4.2 ERTMS level 1
Level 1 is similar to the ATC system that is in use in the Swedish railway network
today. Namely that level 1 is equipped with signals, track circuits and track coils [13].
3.4.3 ERTMS level 2
In level 2 the optical signals are taken away from the sections in the network. Basic
information is given from traffic control via GSM-R. All other necessary information,
like speed and signals are shown to the train driver in the cabin. Track coils are giving
the positioning and track circuits controls that there is no obstacles on the section [13].
3.4.4 ERTMS level 3
Level 3 is like level 2, with the big difference that the track circuits have been taken
away. The train reports its position itself to the traffic control. The block section then
becomes a moving section instead of a fixed section, which can increase capacity on
the network [13].
2 A train start to count as delayed when it is more than 15 minutes later than planed

CHALMERS, Energy and Environment, Master’s Thesis 11
3.5 UPS
To be able to receive continuous power supply, which is demanded for the
components in the signaling box sensitive for power blackouts, a so called UPS is
used. UPS stands for Uninterruptible Power Supply and is an electrical component
that delivers uninterruptible power, when the regular power supply disappears and
before the backup power supply network is connected. Many UPS, especially those
used in the signal boxes, can help to take away power problems that can appear in the
electrical system. That could be power problems like current spikes, high frequenze
transients and instability in network frequenze [16].
There are three main categories of UPS:s depending on how they are designed. These
are online UPS, line-interactive UPS and standby UPS. The online UPS, which has
best performance and best protection from disturbance of the three categories, is used
for Signal box 95. This is necessary while the signaling box includes components that
are very sensitive for power failure. In the online UPS, the incoming alternating
current (AC) is rectified to direct current (DC) before it passes the rechargeable
batteries. Then the DC is inverted into regulated AC to deliver uninterrupted power
(B4 in the figure below) to the components. No power switches are needed in the
system, since the batteries always are connected to the inverter. At normal operation,
the largest load is taken care of by the inverter. When there is a power failure, the
inverter is dropped out of the circuit and the batteries are carrying the load. The
uninterruptable power to the components is during this process consistent and
unchanged [17].
Figure 2 Circuit diagram for online UPS [18]
For the online UPS there is also an outer manual by-pass that can be connected during
maintenance of the UPS. The load is then temporarily provided by favorized power
from the regular power network until the switch is in normal state again. In this way,
there is no influence on the components with uninterruptible power from other
components connected to the UPS during the maintenance [18].
CHALMERS, Energy and Environment, Master’s Thesis 12
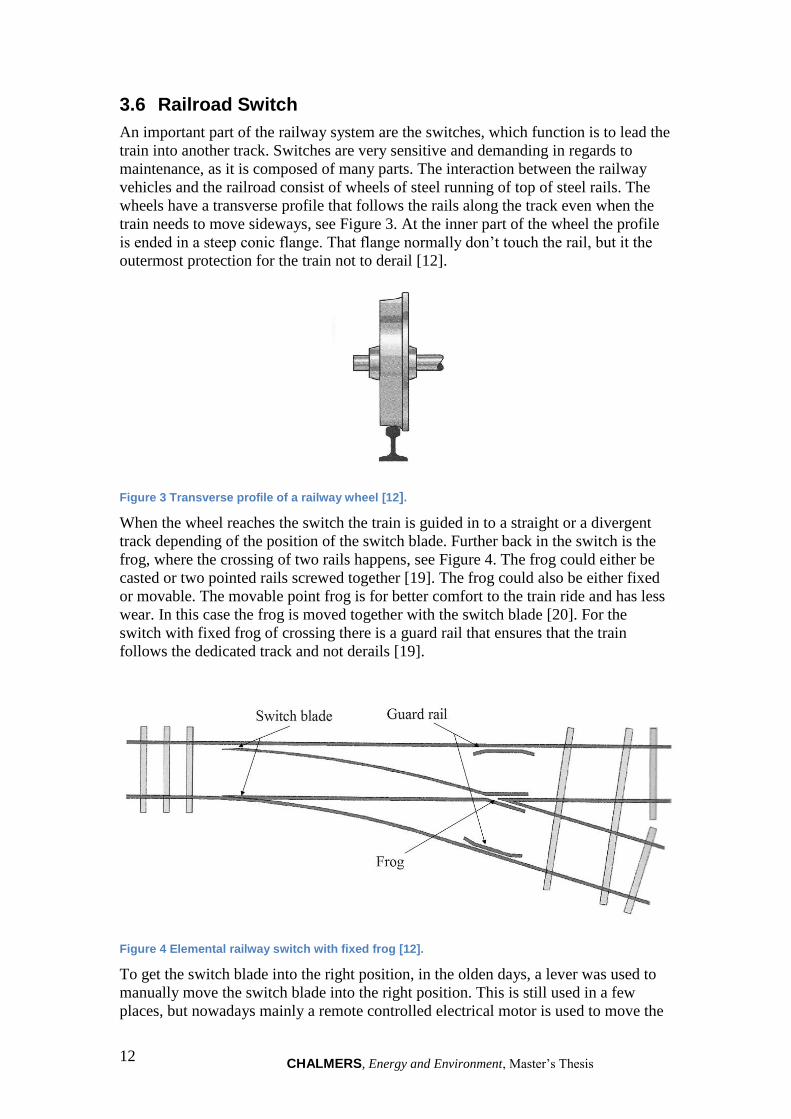
3.6 Railroad Switch
An important part of the railway system are the switches, which function is to lead the
train into another track. Switches are very sensitive and demanding in regards to
maintenance, as it is composed of many parts. The interaction between the railway
vehicles and the railroad consist of wheels of steel running of top of steel rails. The
wheels have a transverse profile that follows the rails along the track even when the
train needs to move sideways, see Figure 3. At the inner part of the wheel the profile
is ended in a steep conic flange. That flange normally don’t touch the rail, but it the
outermost protection for the train not to derail [12].
Figure 3 Transverse profile of a railway wheel [12].
When the wheel reaches the switch the train is guided in to a straight or a divergent
track depending of the position of the switch blade. Further back in the switch is the
frog, where the crossing of two rails happens, see Figure 4. The frog could either be
casted or two pointed rails screwed together [19]. The frog could also be either fixed
or movable. The movable point frog is for better comfort to the train ride and has less
wear. In this case the frog is moved together with the switch blade [20]. For the
switch with fixed frog of crossing there is a guard rail that ensures that the train
follows the dedicated track and not derails [19].
Figure 4 Elemental railway switch with fixed frog [12].
To get the switch blade into the right position, in the olden days, a lever was used to
manually move the switch blade into the right position. This is still used in a few
places, but nowadays mainly a remote controlled electrical motor is used to move the

CHALMERS, Energy and Environment, Master’s Thesis 13
switch blade in the switch. The electrical motor, paired via a friction clutch to rods,
that are connected to the switch blade is called point machine. One switch can have
one or more point machines depending on the switch curve radius. Larger curve
radius on switches is used at higher permitted speed and demands more point
machines. There are a lot of different types of point machines. The point machines
this report is focusing on are called JEA 52, JEA 72 and JEA 73. Reason being that
these are the types of point machines used in the signal boxes, where the
measurements took place. In the point machine there is a built in locking system that
send a signal to the signal box when the switch is locked in the right position. When
this has happened the trains are allowed to pass in on the block section and pass the
switch [19], [21].
The description so far is around what happens in a trailing point switch, a switch seen
from the direction where a track is branching into two tracks. The trains can also go
facing point, which is the switch seen from the direction where two tracks goes into
one through a switch. In this case it is not always the case that the switch blade has to
be moved into the right position for a train to be able to pass. It is depending on if the
switch is trailable or not. At non-trailable point machines the switch blades have to be
in the right position, otherwise they will be damaged. For a trailing point switch, the
attachment point for the rods to the switch blade is done in a way that they will break
when a train passes. At passage, the wheels force the switch blades to the right
position without them being damaged. The point machines JEA 52 and JEA 72 are
trailable, while JEA 73 is not [22].
At an operation of a switch blade the motor in the point machine gets a high start
current from the signal box. How big this current is will be analysed later on in this
report. The friction clutch will then adjust to the force needed to move the switch
blades to the right position. If there is an obstacle in the way or if the switch is badly
maintained, the switch can demand a higher current and as a result the clutch will slip.
How big this slip current can be can be found in Appendix C [21].
3.6.1 Block section for a switch
There are rules on how the block section (Sb) is to be determined for a switch. The
block section consist of the movable part of the track switch is as well as the part
before the switch in facing point switch direction (Sbf), see Figure 5 below. The length
of section Sbf shall be sufficient enough, for a train with a velocity of 30 km/h, from it
goes into the block section, cannot reach the nose of the switch before the switch
throwing is performed. The time required to throw the switch is then a required
variable, which consists of two parts;
The signaling system’s time of reaction, from the time a train has entered the
block section until the status is changed to occupied, tr.
Time for a switch to throw, tv.
Sbf is calculated according the formula:
For signal box 95, the normal values tr=3.0 s and tv=2.7 s are used for point machines
of type JEA 72/73, which gives a block section of 48 meter.

CHALMERS, Energy and Environment, Master’s Thesis 14
If there is a signal or a diverging switch within Sbf, then the block section is defined
up to that object [23].
Figure 5 Block section for a railway switch [23].

CHALMERS, Energy and Environment, Master’s Thesis 15
3.7 Dimensioning of cables
According to Swedish Standard (SS 424 14 24 – translated) the cable area is
determined from the following factors, the cables…:
“…Not assumes damaging temperature during normal operation conditions.
…Not are harmed thermal at a short circuit.
..Not are harmed mechanically due to a short circuit “ [24]
From an owner/operator perspective the cost of the cable is also an important factor.
Larger areas on the cable are giving less resistance and are at the same time more
expensive.
The meaning of the first factor is to dimension the cable with respect to load capacity,
so the cable is protected for overload. The condition that needs to be fulfilled is that
the design load current must be less than the load capacity. In case the condition not is
fulfilled, the allowed operational temperature will be exceeded and the cable will get
damaged [24].
The second factor is about choosing the right short circuit protection. The overcurrent
in the circuit cause a so called surge current according to I2∙t. The short circuit
protection shall at a short circuit or ground fault, ensure protection for this surge
current, so the cable isn’t damaged thermally. It is also important to ensure that the
short circuit protection not only protects against thermal impact, but also that it trigger
fast enough, i.e. the trigger condition needs to be fulfilled [24]. According to EL-Vis
(software solution for cable dimensioning), the control of the trigger condition is
usually about designing in the way that it doesn’t take too long time for short circuit
protection to trigger. To ensure that the short circuit protection trigger fast enough it is
important that the circuit doesn’t have too high impedance and that the design cable is
not too long [25].
The last factor only needs to be looked at when non-current delimiting circuit breakers
are used. The condition that should be fulfilled is that the largest surge current that
arise not overrides the highest surge current the cable can handle. If the surge current
is higher than the condition for the cable it is mechanically damaged. The mechanical
impact only happens for really heavy cables and when the current is very high
(several kA) [24].
It is also is important to control in the cable is that the voltage drop isn’t too high in
the cable. The cable needs to be dimensioned, so the voltage drop not exceeds the
nominal current more than four percentages, which is the limit used today by Sweco
Rail. This voltage drop doesn’t include the voltage drop that arises when the point
machines start to operate [26].
The current that arises when a cable is loaded will always give a drop in voltage as the
cable can be said to have a series inductance and series resistant [27]. While the cable
length already is decided, it could be demanded that the cable area needs to be
increased if voltage drop percentage is outside of the reasonable limit.

CHALMERS, Energy and Environment, Master’s Thesis 16
3.8 Fuses
It is hard to do electrical installations around the rail network. Interference in the form
of traction from the trains together with interference from relay circuits may influence
function of the electronics. One has to try to build stations as electromagnetic shielded
as possible [28]. The power supply to the stations goes through a TN-S system. A TN-
S system consists of the three phases, protective earth and neutral. This increases the
security and lower interferences compared to a TN-C system that only consists of the
three phases and neutral [27]. In the distribution board the fuses are connected to
every phase. The different outgoing groups can have different sized fuses, seen from a
three phase view, depending on the load for the group. Located prior to the
distribution board there are the mains fuses for incoming power to the whole station.
The mains fuses are the fuses that affect the incoming cable dimensioning for the
station.
The fuse acts as a sacrificial device and interrupts the current at a specific cable or
device when the current becomes too high. There are a lot of different fuses to choose
from. At lower current a so called D-type fuse is used (diazed fuse with ceramic
body). The D-type fuses are available in two different sizes depending on amperage.
Size DII can be found at 6A, 10A, 16A, 20A and 25A. Size DIII on the thread can be
found in size 35A, 50A and 63A. There are standard fuses (automatic fuses). They are
found in more amp sizes (smaller interval between the sizes). At higher amperage
than 63A so called NH fuses are used. These fuses are not relevant for this thesis [5].
The fuses will not interrupt the current directly at its given amperage. There are
instead different melting curves for fuses at different ampacity. A fuse marked with
20A will melt after 5 seconds when the load is 57A. The same fuse will melt after just
0.4 seconds if the load instead is 100A. More information about nominal currents for
fuses at different melting points could be seen in Table D-1 in Appendix D.
To get a good service continuity in the station it is important with a good selectivity.
When electrical components are connected in series in a system a good selectivity will
ensure that they not will melt simultaneously but instead only the component situated
directly upstream the fault [29]. The selectivity is generated by choosing fuses with
different ampacity. Two electrical devices both with fuses at 16A risks to melt
simultaneously due to that the fuses are not selective with each other. If the devices in
series instead would be with a 16A and 20A then only the first fuse (16A) will melt
during a fault. I.e. a 16 ampere fuse is fully selective with a 20A fuse. But it is
however not given that a fuse with higher ampacity is selective with a fuse with lower
ampacity. This depends in if the total I2t value for the fuse with lower ampacity is
smaller than the melting-I2t value for the fuse with higher ampacity, otherwise the
smaller fuse will melt and interrupt the current. These ratios between different fuses
are presented in Figure E-1 in Appendix E.

CHALMERS, Energy and Environment, Master’s Thesis 17
3.9 Diversity factor
Electric cables cannot withstand too high currents. The cables therefore need to be
dimensioned to cope with a maximum current. At the same time it is also not good to
oversize the cables seen from materials and cost perspective. Larger cables require
more material and are therefore more expensive. Here there is a need for estimation
on what the maximum current is seen from a probability perspective.
A cable can handle overload for short periods. So it may be acceptable to allow a
given maximum to be exceeded if the probability of this happening is low. If a power
supply is only connected to one outtake point, the maximum current through the cable
is equal to the maximum outlet. This changes when more outlets are added to the
power source. The probability is then less that all outlet points achieve their maximum
at the same time. This is where the concept diversity factor becomes important. The
diversity factor takes the probability of the outlets points’ maximum into account
when the cables are dimensioned. This leads to that the cables become less oversized.
The diversity factor is one or less, depending on how many outlet points that are
connected to the power source. The more exit points the lower the diversity factor
[30].

CHALMERS, Energy and Environment, Master’s Thesis 18
4 Method
The method chapter is divided into five different subparts in order to structure the
thesis. These parts are all interrelated, so to get a clear result in the end it was
necessary that each subpart of the method was carefully analyzed. The method was
divided into the following parts; data collection and inventory of the system,
measurements, analysis of the measurements, a model and energy optimization. These
subparts are described more in detail in the following chapters below.
4.1 Data collection and inventory of the system
To be able, in a later stage, to describe behavior of measured data a collection of
necessary theories was needed. These data was later on structured in a way that
interaction between the components in the system could be described. One of many
difficulties in this project was to find relevant theories for the thesis. No similar
analyses on the same problem have been found. Found close to the subject was an
earlier thesis work from Chalmers by Anders Magnusson in 2004 [31]. His report
investigates the power requirements for signal box 85, but nothing on how the power
requirements can be optimized. Signal box 85 also differs in many ways from signal
box 95, e.g. different installed components. But the signalling boxes 85 and 95 are
also similar in other ways, e.g. both signalling boxes are computerized and can control
the same type of point switches and signals. Therefore it is not obvious if theories
from the existing thesis are applicable to this thesis.
Since this thesis does not measure on the power consumption for every individual
component in signal box 95, a good estimate of these components was needed. Here
data from Anders Magnusson’s thesis were utilized when making the estimates. This
thesis can thus be seen as an addition to Anders previous work as this thesis uses
power requirements in a model in trying to make an energy optimization.
Another thesis useful for this study was “Calculation method for powering a tramway
network” written by Jakob Ekstrand [32]. His thesis uses similar structure to this
thesis. Although trams and trains are two completely different things, inspiration
could be collected regarding the method from his work.
A lot of information described in this report is collected from Trafikverket’s
controlling and guiding documents. These documents are examined and updated
continuously and are in that way credible. A book about the Swedish railway written
by Bårström and Granbom has also been significant for the theoretical background.
Before any measurements could be done an inventory of the system was needed. An
overview how the system is linked could be constructed by using Vecturas own
documents over circuit diagrams and blueprints. This system is very complex and
differs from signal box to signal box. An overall description of the system could
however be done and can be found in the chapter 2 System description.
It was decided that measurements should take place in relatively new signal boxes as
described in the scope. These new signal boxes are categorized as type 95.
Measurements on newer signal boxes will facilitate the implementations from this
study to new projections and is likely to resemble the future developed signal boxes.

CHALMERS, Energy and Environment, Master’s Thesis 19
4.2 Measurements
In the Gothenburg region there are several signal boxes of model 95. Measuring every
signal box in the area would take too long time. After an overview of the available
signal boxes, three was chosen to carry out measurements on. These signal boxes was
also interesting from the perspective that they are relatively new (2011-2012).
Measurements on newer signal boxes are most likely more energy effective, as
development occurs constantly. Measurements on these newer signal boxes will get a
clearer result on improvements that can be made on the current technical design. The
three chosen signal boxes also had easier access which facilitated the measurements.
One of the signal boxes, number 600, has at earlier measurements performed by
Vectura, shown sign of over dimensioning.
The first thing to measure was the incoming power for the whole signal box. This is
the total power needed to control all of the components in the signal box, both
uninterruptible power and favored power. The measuring instrument was connected
according to three phase Y, see Figure 6. The measurement instrument was connected
in a similar way later on when the PSU 151 was measured, with the difference that the
incoming cables for the PSU 151 was twinned doubled to get a better uptake from the
current probes. This is not affecting the measuring result, as the instrument was set to
halving the current. Both probes and the conductor where electrically isolated to
reduce the risk for an electrical chock. The probe only has a fault in measurement of
+/- 1% when the conductor is placed in the middle of the probe [33].
Figure 6 3 phase, four wire wye circuit connection for the A/D converter [33].
When an analog signal is measured by a digital measurement instrument one have to
sample with enough frequency to reflect the analog signal. A too high sampling
frequency gives too much measured data, which is not necessary and will quickly fill
up the memory card. To resolve this issue the instrument was set to sample at a higher

CHALMERS, Energy and Environment, Master’s Thesis 20
frequency when the current passed a certain threshold value. In this way it was
possible to clearer recreate the analog signal at events worthwhile to analyze.
4.2.1 Measurement equipment
In order to collect and save relevant data from the measurements, an A/D converter
was needed for the project. The equipment would also have to have a storage device
in order for later analysis of the measured data. The equipment will measure both
three-phase voltage and three-phase current at the same time thus the required
minimum for the equipment is to have 6 differential channels (three for current and
three for voltage). The measured data will then be transferred to a laptop with
measurement software for easier analysis. In order to measure the current, a current
probe compatible with the A/D converter was needed. The same applied when
measuring the voltage. The current probe clamps around the conductor allowing it to
take measurements without having to disconnect the circuit. A crocodile clip was used
when measuring the voltage creating an electrical connection.
4.2.1.1 A/D converter
The converter used in this study was a portable, power quality analyser manufactured
by Dranetz called PowerVisa, see Figure 7. The instrument can record and measure
data on four voltage channels and four current channels simultaneously. The
instrument has a colour touch screen and a lightweight design using a detection
system telling the user if the instrument is connected successfully to the device under
test. The measurements are saved to a four gigabyte compact flash memory card
which can be removed. PowerVisa also includes troubleshooting, data logging, power
quality surveys, energy and load balancing [34].
Figure 7 Front view of the Dranetz-BMI PowerVisa [34].

CHALMERS, Energy and Environment, Master’s Thesis 21
4.2.1.2 Current probe
The compatible clamp on probe used for the PowerVisa was of model TR-2550A and
could measure a current in the interval 1A-100A. This interval was considered the
best suitable for this project when examining the test measurements made by the
supervisors before the project start. The probe is built on the Hall Effect and can
measure both AC and DC current in the frequency interval from 10 Hz to 40 kHz
[35].
4.2.2 Measurement software
The software used for analysing the data is called Dran-View Professional. After
installation on a computer the software reads the .DBB file format saved to the flash
drive in A/D converter. The file contains advanced analysis of sample points recorded
and saved by the PowerVisa and are presented in the software as time plots event lists
and event detail/waveform. The time plots and event detail/waveform graphs can also
be zoomed in to get more detailed information. Date and time for the time plots was
taken from an internal clock in the PowerVisa. The internal clock was set according to
the railway system time in order for easier analyses in the later stages of the project.
4.3 Analysis of measurements
Measurements of voltage and current were loaded directly onto the memory card in
the instrument. This card could then be read by the measurement software in the
computer. The measurements could be plotted against time because of the internal
clock in the measuring instrument. The graphs are characterized as horizontal lines
with temporary current spikes according to Figure 8 below. This current spikes
represents switching movements from the railway switches. A clearer view of this
process could be obtained by zooming in on the spikes in the computer software.
Figure 8 Current spikes viewed in Dran-View Professional
CHALMERS, Energy and Environment, Master’s Thesis 22
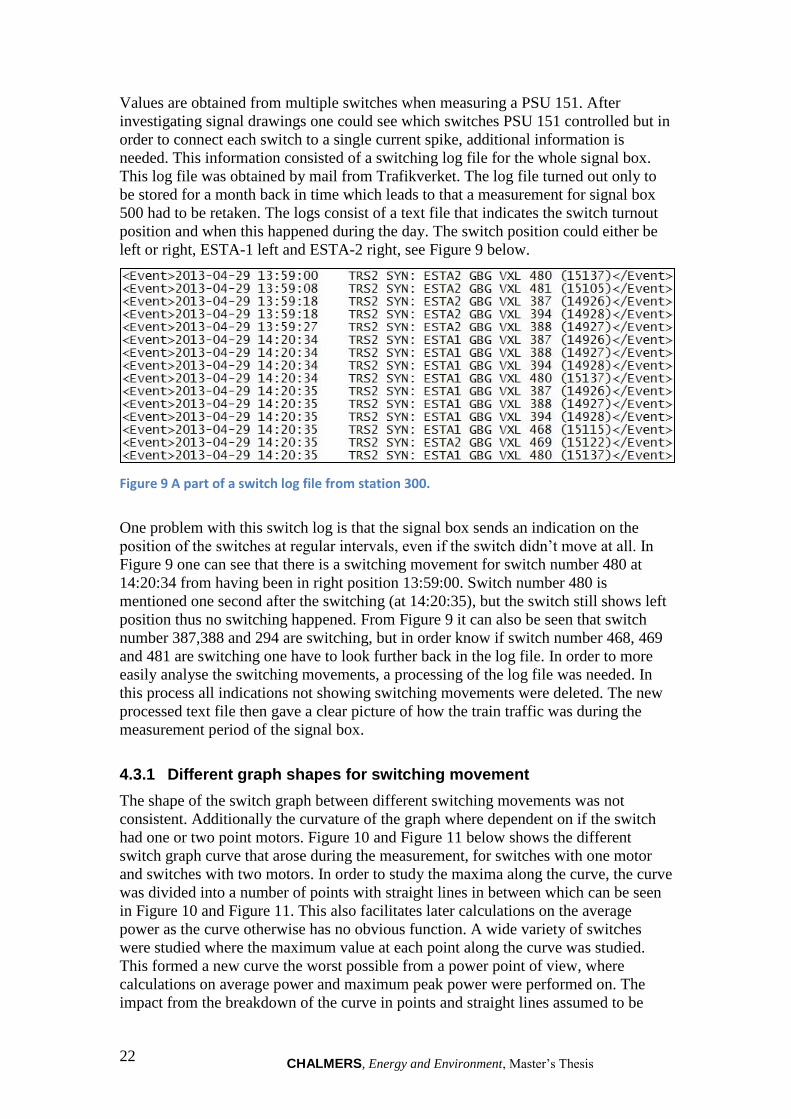
Values are obtained from multiple switches when measuring a PSU 151. After
investigating signal drawings one could see which switches PSU 151 controlled but in
order to connect each switch to a single current spike, additional information is
needed. This information consisted of a switching log file for the whole signal box.
This log file was obtained by mail from Trafikverket. The log file turned out only to
be stored for a month back in time which leads to that a measurement for signal box
500 had to be retaken. The logs consist of a text file that indicates the switch turnout
position and when this happened during the day. The switch position could either be
left or right, ESTA-1 left and ESTA-2 right, see Figure 9 below.
Figure 9 A part of a switch log file from station 300.
One problem with this switch log is that the signal box sends an indication on the
position of the switches at regular intervals, even if the switch didn’t move at all. In
Figure 9 one can see that there is a switching movement for switch number 480 at
14:20:34 from having been in right position 13:59:00. Switch number 480 is
mentioned one second after the switching (at 14:20:35), but the switch still shows left
position thus no switching happened. From Figure 9 it can also be seen that switch
number 387,388 and 294 are switching, but in order know if switch number 468, 469
and 481 are switching one have to look further back in the log file. In order to more
easily analyse the switching movements, a processing of the log file was needed. In
this process all indications not showing switching movements were deleted. The new
processed text file then gave a clear picture of how the train traffic was during the
measurement period of the signal box.
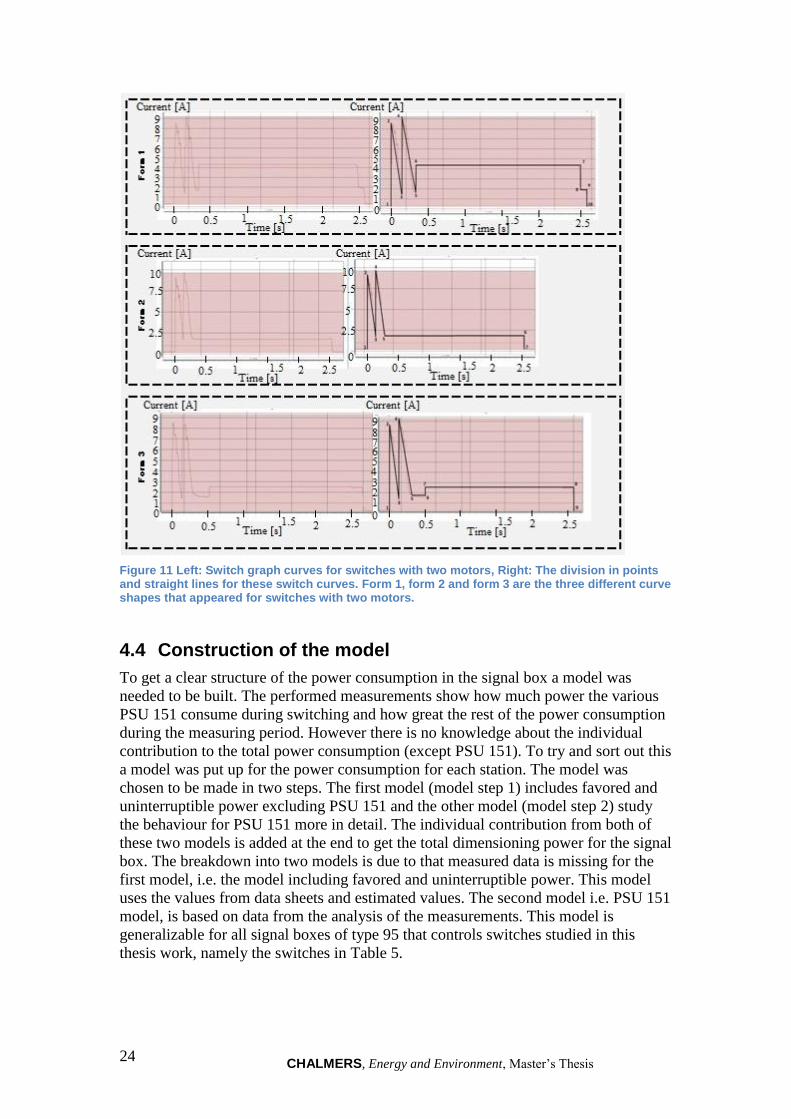
4.3.1 Different graph shapes for switching movement
The shape of the switch graph between different switching movements was not
consistent. Additionally the curvature of the graph where dependent on if the switch
had one or two point motors. Figure 10 and Figure 11 below shows the different
switch graph curve that arose during the measurement, for switches with one motor
and switches with two motors. In order to study the maxima along the curve, the curve
was divided into a number of points with straight lines in between which can be seen
in Figure 10 and Figure 11. This also facilitates later calculations on the average
power as the curve otherwise has no obvious function. A wide variety of switches
were studied where the maximum value at each point along the curve was studied.
This formed a new curve the worst possible from a power point of view, where
calculations on average power and maximum peak power were performed on. The
impact from the breakdown of the curve in points and straight lines assumed to be

CHALMERS, Energy and Environment, Master’s Thesis 23
negligible as the lines follows the curve almost exactly. In Figure 10 and Figure 11
one can see that the high inrush current at the start of the graph curve and at the end
the so called slip current occurs, see chapter 3.6 Railroad Switch for more information
about this phenomena. The average power is higher the earlier this slip current occurs.
When the worst possible curve was constructed the slip current was added directly
after the inrush current and set slipping all the way to the end of the cycle.
Figure 10 Left: Switch graph curves for switches with one motor, Right: The division in points and straight lines for these switch curves. Form 1 and form 2 are the two different curve shapes that appeared for switches with one motor.
CHALMERS, Energy and Environment, Master’s Thesis 24
Figure 11 Left: Switch graph curves for switches with two motors, Right: The division in points and straight lines for these switch curves. Form 1, form 2 and form 3 are the three different curve shapes that appeared for switches with two motors.
4.4 Construction of the model
To get a clear structure of the power consumption in the signal box a model was
needed to be built. The performed measurements show how much power the various
PSU 151 consume during switching and how great the rest of the power consumption
during the measuring period. However there is no knowledge about the individual
contribution to the total power consumption (except PSU 151). To try and sort out this
a model was put up for the power consumption for each station. The model was
chosen to be made in two steps. The first model (model step 1) includes favored and
uninterruptible power excluding PSU 151 and the other model (model step 2) study
the behaviour for PSU 151 more in detail. The individual contribution from both of
these two models is added at the end to get the total dimensioning power for the signal
box. The breakdown into two models is due to that measured data is missing for the
first model, i.e. the model including favored and uninterruptible power. This model
uses the values from data sheets and estimated values. The second model i.e. PSU 151
model, is based on data from the analysis of the measurements. This model is
generalizable for all signal boxes of type 95 that controls switches studied in this
thesis work, namely the switches in Table 5.
CHALMERS, Energy and Environment, Master’s Thesis 25
4.5 Energy optimisation
The last part of the method was to make an energy optimisation of the system. The
maximum value of the incoming power was retrieved from the model of the power
consumption of the system. Important to mention is that it is not always the incoming
power that dimensions incoming cables. It can also be the selective rules that
determine the size of the incoming cables, see chapter 3.8 Fuses. For example, if there
is an outgoing power group that requires 20 amp fuse, then the incoming cable must
be secured with at least 25 A, even if the power demand requires only 10 amps.
The UPS in the signal boxes always had the highest rated fuse. Important for energy
optimisation was then to see if this UPS could be reduced in size and thus get a lower
fuse, especially if the power consumption required lower fuse than the UPS.
An energy optimisation was done both based on the measurement maximum values
and the maximum values obtained from the model. The maximum values from the
measurements gives an optimisation based on how the power requirements are in
reality. However, it is not clear if the maximum power occurred during the
measurement period. To sort out uncertainties the other part of the optimisation was
based on the maximum values from the model.
4.5.1 Cable dimensioning in the software EL-Vis 10.1.0
The dimensioning software EL-Vis was used since it is present in the Sweco’s
software database, as well as being the most popular solution on the market [36]. The
software calculates load capacity, trigger conditions and voltage drop according to
Swedish standard (SS 4141424).
An alternative to the EL-Vis software is to use different tables and associated equation
calculations. By using the software, the risk for faults during calculation is reduced, as
well as the time for the dimensioning process.
CHALMERS, Energy and Environment, Master’s Thesis 26
5 Results
In the following sections, results from the measurements and the energy optimization
model will be presented. To notice: when mentioning that switches are switching at
the same time, it means that they start exactly at the same time with no delay in
between. The graph curves will then be projected onto each other.
5.1 Measurements results from signal box 300
The first measurement took place at incoming power in order to get an overview of
the power consumption for the whole signal box 300. This measurement was
connected according to chapter 4.2 Measurements. The power consumption in the
signal box depends a lot on how intense the train traffic was during the measurement
period. Optimally the measurement would have been taken place when the train traffic
is at its highest during the year, but this is not possible since the thesis work is carried
out during a limited period. The measurement was instead performed during a
Monday to Friday (3:00pm–7:00am). How large the maximum power consumption is
in the signal box depends mostly on how many switches that operates at the same
time. By using the method described in 4.3 Analysis of measurements, a pie chart
could be created based on how frequent different kinds of switches are operated at the
same time, see Figure 12.
Figure 12 Amount of switches in operation at the same time for signal box 300.
In Figure 12 it can be seen that about half of the time only one switch is operating at a
time. The probability that more switches will operate at the same time decreases the
more switches that are operating at the same time. During the measurement there were
up to 6 switches that were operating at the same time. This happened only once during
the measurement period, which corresponds to about 2.55 seconds of 16 hours.
The consumption from the switches also depends on which type of point machine that
controls the switch and how many of them. Which type of point machine every switch
have is mentioned further back in the report in chapter 2 System description.
49%
20%
18%
8%
4% 1%
Amount of switches in operation at the same time
Total 1 switch
Total 2 switches
Total 3 switches
Total 4 switches
Total 5 switches
Total 6 switches

CHALMERS, Energy and Environment, Master’s Thesis 27
In Figure 13 switch number 395, 398, 480 and 481 operates most frequent. All these
switches are located on the same street railway. A clearer view over when the
different kind of switches are operating and whether they are operating at the same
time as other switches can be found in Appendix A.1-Switching operations at signal
box 300 From there it can be seen that switch number 395, 398, 480 and 481 often are
involved when multiple switches operates. Switch number 411, 419, 426 and 427
directs the trains into a train depot which explains why only a few of these switches
were operating during the measurement period.
Figure 13 Number of switching operations for switches belonging to signal box 300
At the second measurement the instrument was connected to a single PSU 151 at
signal box 300. This was done to study the PSU 151 as well as to exclude the
possibility that other favored power groups are operating at the same time as the
switches and thus get the correct power consumption value for the switches. The PSU
151 that was measured controlled four different switches, switch number 387, 388,
394 and 481. During the measurement period there were only up to 3 switches that
operated at the same time, see Figure 14.
Figure 14 Number of switching operations for switches belonging to a specific PSU 151 in signal box 300.
387 388 394 395 398 409 410 411 419 426 427 429 468 469 477 480 481 483 484 485 486
Total 6 10 12 25 27 7 14 0 3 0 0 0 4 9 10 33 18 0 4 2 1
0
5
10
15
20
25
30
35
Nu
mb
er
of
swit
chin
g o
pe
rati
on
s
Switching operations in signal box 300
0
1
2
3
Nu
mb
er
of
swit
chin
g o
pe
rati
on
s
Time
PSU 151

CHALMERS, Energy and Environment, Master’s Thesis 28
5.2 Measurements results from signal box 500
In the same way as for signal box 300, measurement was performed on signal box
500. The measurement was done on a Monday (11.00 am–12:00pm). The pie chart
below shows how frequent different kinds of switches are operated at the same time,
see Figure 15.
Figure 15 Amount of switches in operation at the same time for signal box 500
Figure 15 has similar structure as signal box 300. Where the probability decreases the
more switches are operating at the same time. Signal box 500 had at most four
switches that operated at the same time. This happened three times during the
measurement period, which only represents approximately 7.65 seconds out of 13
hours.
Unlike signal box 300, signal box 500 controls several switches that are controlled by
two point motors. The switches that are controlled by two point motors are switch
number 462, 463,547 and 551. Figure 16 below shows how often these switches
operated. Figure 16 also includes how often the other two switches, with only one
point motor, operated.
Figure 16 Number of switching operations for switches belonging to signal box 500
51% 37%
11%
1%
Amount of switches in operation at the same time
Total 1 switch
Total 2 switches
Total 3 switches
Total 4 switches
461 462 463 547 550 551
Total 16 48 6 6 47 46
0
10
20
30
40
50
Nu
mb
er
of
swit
ch o
pe
rati
on
s
Switching operations in signal box 500
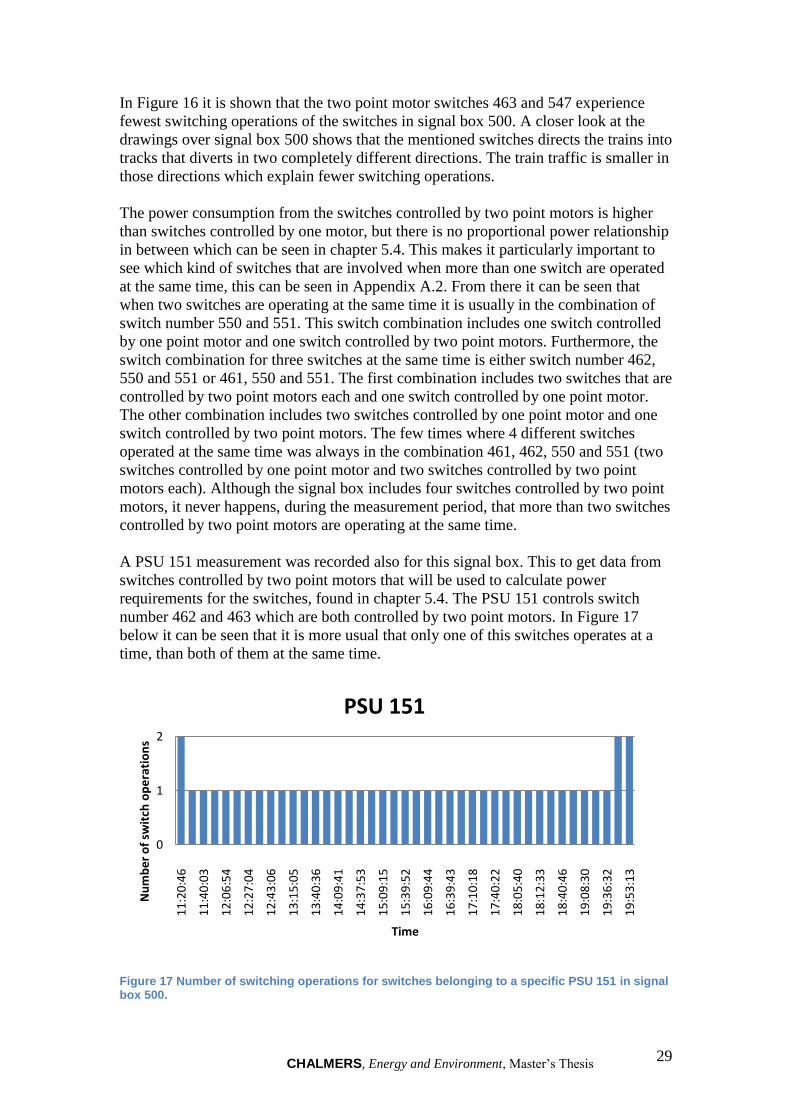
CHALMERS, Energy and Environment, Master’s Thesis 29
In Figure 16 it is shown that the two point motor switches 463 and 547 experience
fewest switching operations of the switches in signal box 500. A closer look at the
drawings over signal box 500 shows that the mentioned switches directs the trains into
tracks that diverts in two completely different directions. The train traffic is smaller in
those directions which explain fewer switching operations.
The power consumption from the switches controlled by two point motors is higher
than switches controlled by one motor, but there is no proportional power relationship
in between which can be seen in chapter 5.4. This makes it particularly important to
see which kind of switches that are involved when more than one switch are operated
at the same time, this can be seen in Appendix A.2. From there it can be seen that
when two switches are operating at the same time it is usually in the combination of
switch number 550 and 551. This switch combination includes one switch controlled
by one point motor and one switch controlled by two point motors. Furthermore, the
switch combination for three switches at the same time is either switch number 462,
550 and 551 or 461, 550 and 551. The first combination includes two switches that are
controlled by two point motors each and one switch controlled by one point motor.
The other combination includes two switches controlled by one point motor and one
switch controlled by two point motors. The few times where 4 different switches
operated at the same time was always in the combination 461, 462, 550 and 551 (two
switches controlled by one point motor and two switches controlled by two point
motors each). Although the signal box includes four switches controlled by two point
motors, it never happens, during the measurement period, that more than two switches
controlled by two point motors are operating at the same time.
A PSU 151 measurement was recorded also for this signal box. This to get data from
switches controlled by two point motors that will be used to calculate power
requirements for the switches, found in chapter 5.4. The PSU 151 controls switch
number 462 and 463 which are both controlled by two point motors. In Figure 17
below it can be seen that it is more usual that only one of this switches operates at a
time, than both of them at the same time.
Figure 17 Number of switching operations for switches belonging to a specific PSU 151 in signal box 500.
0
1
2
11
:20
:46
11
:40
:03
12
:06
:54
12
:27
:04
12
:43
:06
13
:15
:05
13
:40
:36
14
:09
:41
14
:37
:53
15
:09
:15
15
:39
:52
16
:09
:44
16
:39
:43
17
:10
:18
17
:40
:22
18
:05
:40
18
:12
:33
18
:40
:46
19
:08
:30
19
:36
:32
19
:53
:13
Nu
mb
er
of
swit
ch o
pe
rati
on
s
Time
PSU 151

CHALMERS, Energy and Environment, Master’s Thesis 30
5.3 Measurements results from signal box 600
The measurement of incoming power for signal box 600 was also performed during a
Monday, here between 11:00 am and 10:00 pm. A pie chart was created from this
measurement which below shows how frequent different kinds of switches are
operated at the same time, see Figure 18.
Figure 18 Amount of switches in operation at the same time for signal box 600
The structure of the pie chart is different from those in signal box 300 and 500. In this
case it is more usual that two switches are operating at the same time than that one
switch operates at a time. Although the signal box controls ten different switches, only
a maximum of four switches operating at the same time was recorded during the
measurement period, which represents only approximately 2.55 seconds of 11 hours.
Signal box has one switch that is controlled by two point motors, switch number 607.
The rest of the switches are controlled by one point motor. Below in Figure 19 shows
how often the switches controlled by signal box 600 are operating.
Figure 19 Number of switching operations for switches belonging to signal box 600
37%
45%
17%
1%
Amount of switches in operation at the same time
Total 1 switch
Total 2 switches
Total 3 switches
Total 4 switches
607 608 614 617 618 621 623 624 625 626
Total 2 2 0 15 0 38 38 38 0 0
0
10
20
30
40
Nu
mb
er
of
swit
ch o
pe
rati
on
s
Switching operations in signal box 600

CHALMERS, Energy and Environment, Master’s Thesis 31
In Figure 19 it can be seen that the two point motor switch 607 and one point motor
switch 608 operated significantly less times than other switches that moved during the
same period. When three switches operated at the same time it was only in the
combination 621,623 and 624 and when four switches operated at the same time it
was in the combination 617,621,623 and 624, see Appendix B.3. Switches
621,623,624 often operate in combination with each other which can explain why the
number of switching operations was the same for these switches during the measuring
period. When studying drawings over signal box 600 it can be seen that switch
number 621 and 623 can direct the train into a refudge siding. A refudge siding is a
short track that ends with a buffer stop. These catching points have a task of leading
the trains into a security track if the train passes a stop signal where the diverted line
leads out to a main line [37].
Switches 614, 625 and 626 direct the trains into industrial railway that is not used as
often as commercial trains, which can explain why no switching operation was
recorded during the measurement period. Switch number 618 has less train traffic to
diverging track hence no switching operation either for that switch.
A measurement recording of a PSU 151 was also made here but it registered too few
switching operations in order to be analysed more in detail.
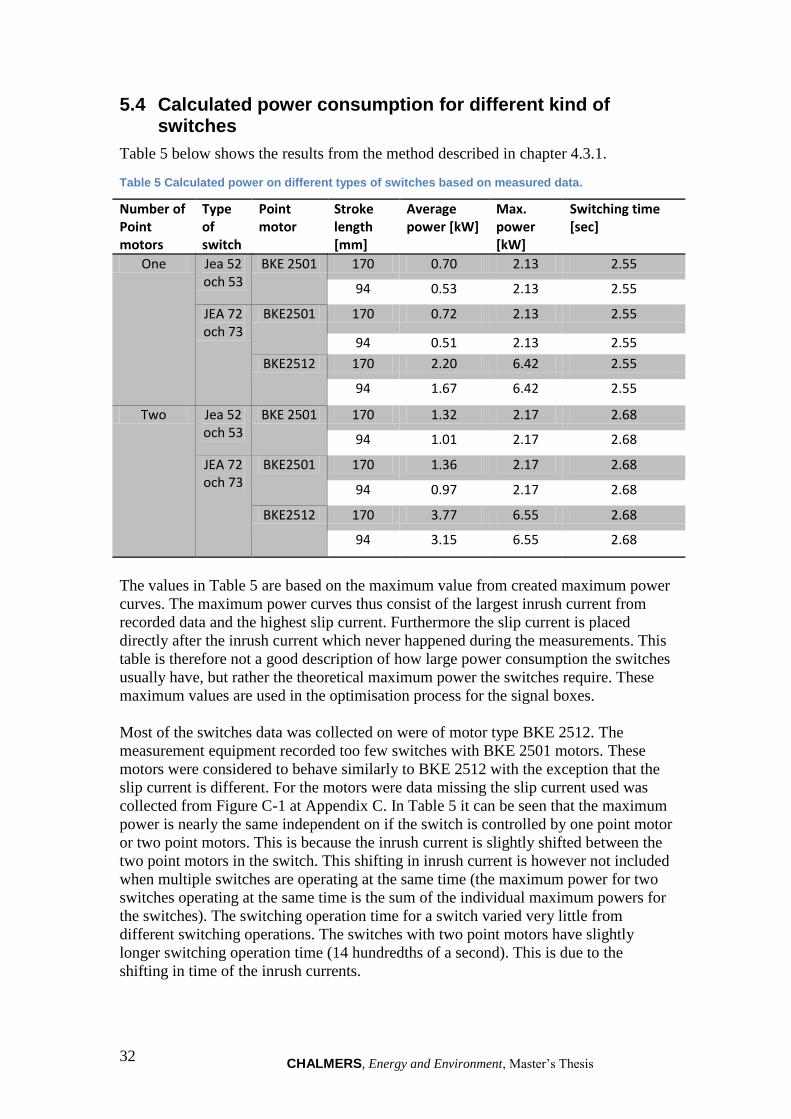
CHALMERS, Energy and Environment, Master’s Thesis 32
5.4 Calculated power consumption for different kind of switches
Table 5 below shows the results from the method described in chapter 4.3.1.
Table 5 Calculated power on different types of switches based on measured data.
Number of Point motors
Type of switch
Point motor
Stroke length [mm]
Average power [kW]
Max. power [kW]
Switching time [sec]
One Jea 52 och 53
BKE 2501 170 0.70 2.13 2.55
94 0.53 2.13 2.55
JEA 72 och 73
BKE2501 170 0.72 2.13 2.55
94 0.51 2.13 2.55
BKE2512 170 2.20 6.42 2.55
94 1.67 6.42 2.55
Two Jea 52 och 53
BKE 2501 170 1.32 2.17 2.68
94 1.01 2.17 2.68
JEA 72 och 73
BKE2501 170 1.36 2.17 2.68
94 0.97 2.17 2.68
BKE2512 170 3.77 6.55 2.68
94 3.15 6.55 2.68
The values in Table 5 are based on the maximum value from created maximum power
curves. The maximum power curves thus consist of the largest inrush current from
recorded data and the highest slip current. Furthermore the slip current is placed
directly after the inrush current which never happened during the measurements. This
table is therefore not a good description of how large power consumption the switches
usually have, but rather the theoretical maximum power the switches require. These
maximum values are used in the optimisation process for the signal boxes.
Most of the switches data was collected on were of motor type BKE 2512. The
measurement equipment recorded too few switches with BKE 2501 motors. These
motors were considered to behave similarly to BKE 2512 with the exception that the
slip current is different. For the motors were data missing the slip current used was
collected from Figure C-1 at Appendix C. In Table 5 it can be seen that the maximum
power is nearly the same independent on if the switch is controlled by one point motor
or two point motors. This is because the inrush current is slightly shifted between the
two point motors in the switch. This shifting in inrush current is however not included
when multiple switches are operating at the same time (the maximum power for two
switches operating at the same time is the sum of the individual maximum powers for
the switches). The switching operation time for a switch varied very little from
different switching operations. The switches with two point motors have slightly
longer switching operation time (14 hundredths of a second). This is due to the
shifting in time of the inrush currents.
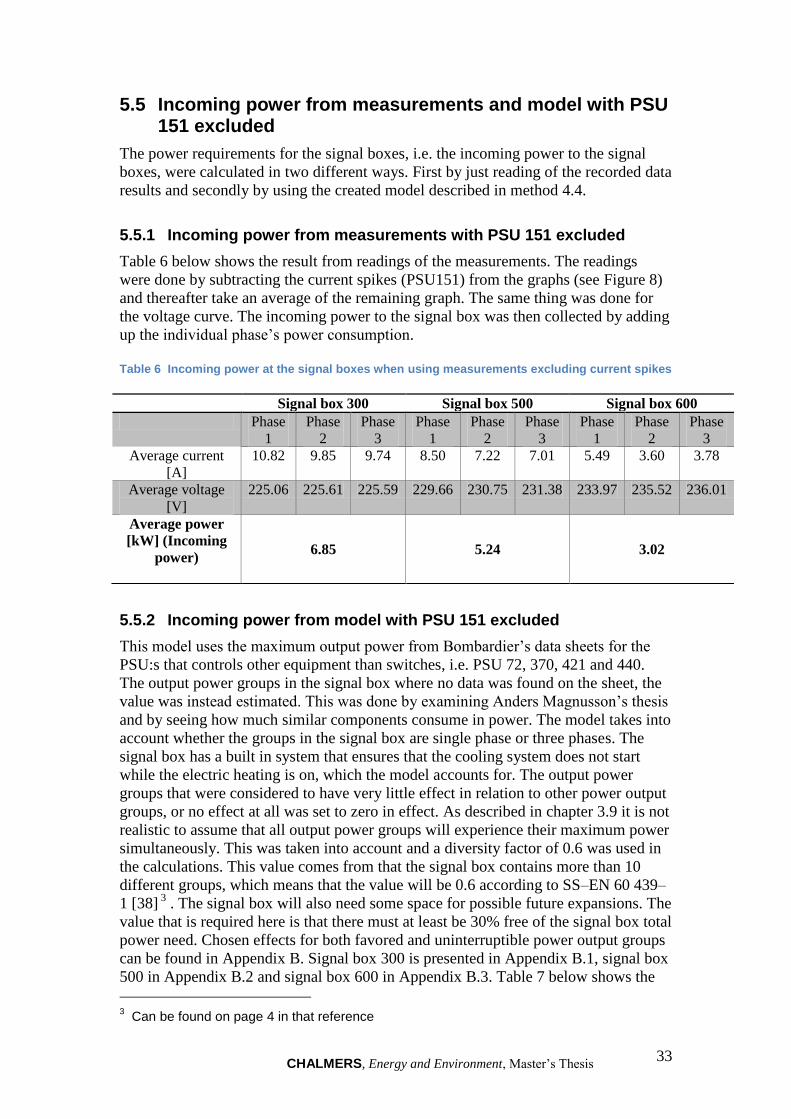
CHALMERS, Energy and Environment, Master’s Thesis 33
5.5 Incoming power from measurements and model with PSU 151 excluded
The power requirements for the signal boxes, i.e. the incoming power to the signal
boxes, were calculated in two different ways. First by just reading of the recorded data
results and secondly by using the created model described in method 4.4.
5.5.1 Incoming power from measurements with PSU 151 excluded
Table 6 below shows the result from readings of the measurements. The readings
were done by subtracting the current spikes (PSU151) from the graphs (see Figure 8)
and thereafter take an average of the remaining graph. The same thing was done for
the voltage curve. The incoming power to the signal box was then collected by adding
up the individual phase’s power consumption.
Table 6 Incoming power at the signal boxes when using measurements excluding current spikes
5.5.2 Incoming power from model with PSU 151 excluded
This model uses the maximum output power from Bombardier’s data sheets for the
PSU:s that controls other equipment than switches, i.e. PSU 72, 370, 421 and 440.
The output power groups in the signal box where no data was found on the sheet, the
value was instead estimated. This was done by examining Anders Magnusson’s thesis
and by seeing how much similar components consume in power. The model takes into
account whether the groups in the signal box are single phase or three phases. The
signal box has a built in system that ensures that the cooling system does not start
while the electric heating is on, which the model accounts for. The output power
groups that were considered to have very little effect in relation to other power output
groups, or no effect at all was set to zero in effect. As described in chapter 3.9 it is not
realistic to assume that all output power groups will experience their maximum power
simultaneously. This was taken into account and a diversity factor of 0.6 was used in
the calculations. This value comes from that the signal box contains more than 10
different groups, which means that the value will be 0.6 according to SS–EN 60 439–
1 [38] 3 . The signal box will also need some space for possible future expansions. The
value that is required here is that there must at least be 30% free of the signal box total
power need. Chosen effects for both favored and uninterruptible power output groups
can be found in Appendix B. Signal box 300 is presented in Appendix B.1, signal box
500 in Appendix B.2 and signal box 600 in Appendix B.3. Table 7 below shows the
3 Can be found on page 4 in that reference
Signal box 300 Signal box 500 Signal box 600
Phase
1
Phase
2
Phase
3
Phase
1
Phase
2
Phase
3
Phase
1
Phase
2
Phase
3
Average current
[A]
10.82 9.85 9.74 8.50 7.22 7.01 5.49 3.60 3.78
Average voltage
[V]
225.06 225.61 225.59 229.66 230.75 231.38 233.97 235.52 236.01
Average power
[kW] (Incoming
power) 6.85 5.24 3.02

CHALMERS, Energy and Environment, Master’s Thesis 34
results from the generated power model. Here a voltage of 231 V has been assumed
for the phases.
Table 7 Incoming power at the signal boxes when using the model with PSU 151 excluded
Signal box 300 Signal box 500 Signal box 600
Phase
1
Phase
2
Phase
3
Phase
1
Phase
2
Phase
3
Phase
1
Phase
2
Phase
3
Average current
[A]
15.44 12.12 13.94 10,85 7,51 9,86 6,66 8,93 6,32
Average voltage
[V]
231 231 231 231 231 231 231 231 231
Average power
[kW] (Incoming
power) 9.58 6.52 5.06

CHALMERS, Energy and Environment, Master’s Thesis 35
5.6 Incoming power from PSU 151 model
The power consumption of a PSU 151 depends on a variety of parameters. For
instance how many switches that is connected to the PSU 151 and which type of
switches the PSU 151 controls. How often the railway switches are operated depends
on where in the railway network they are located. Switches that are placed between
two tracks with high intense traffic will operate more than switches located in the
railway network between two tracks with less traffic. The method described in chapter
4.3 resulted in how often different type of switches operated and its power
consumption, where detailed results can be found in Appendix A. These results were
used when building up the PSU 151 model.
Fuses can handle an overload more than its ampacity for a short time, see chapter 3.8
Fuses. Therefore, it was not always the maximum number of switches that gave the
dimensioning power consumption for the PSU 151.
The model first divides up the switches in how often they are operated. Switches
belonging to a signal box that does not represent over a certain percent of the total
switching in the signal box are highlighted. How high this percentage limit is depends
on how many switches that are connected to the signal box according to Table 8
below.
Table 8 Switches are highlighted which does not meet the requirements in the table.
For example, a switch that operates nine times when the signal box experience 100
switching operations during the same time will represent 9 % of the total. This switch
is highlighted in a signal box that has between 21 and 30 switches but is not
highlighted in a signal box that contains fewer switches.
Next step in the model is to apply this thinking when multiple switches are operating
at the same time. If X4 number of switches are operating at the same time and they
represent less than 5 % of the total number of switches in the signal box, no switch in
X can be highlighted (see Table 9) in order for the X number of switches to be
dimensioning power. For example in Figure 12, six switches operating at the same
time are representing approximately 1 % of the total. If any of the six switches are
highlighted according to Table 8 above, then six switches operating at the same time
will not become dimensioning power. Number of allowed highlighted switches in X
number of switches operated at the same will change when X represent a higher
percentage of the total than 5 %. If X number of switches represent a percentage
higher than 5 but lower than 10 of the total then 1 highlighted switch is allowed in X
for it to become dimensioning power. At higher percentages, the number of allowed
highlighted switches in X number of switches will follow Table 9 below.
4 X is an integer from 1 and upwards.
Number of switches belonging to the
signal box
Percentage limit
1 to 10 ≤15%
11-20 ≤10%
21-30 ≤5%
31-40 ≤2.5%

CHALMERS, Energy and Environment, Master’s Thesis 36
Table 9 Determines if X number of switches operating at the same time will become dimensioning power.
X number of switching operation in
percentage of the total.
Number of switches that can be
highlighted in X
0–5.00 % 0 highlighted switches
5.01–10.00 % 1 highlighted switch
10.01–15.00 % 2 highlighted switches
15.01–20.00 % 3 highlighted switches
20.01–30.00 % 4 highlighted switches
If the signal box has maximum X switches operating at the same time and this meet
the requirements above, then the model will also test other combinations (X-1, X-2,
X-3...). The maximum power from these combinations that satisfies all requirements
will become dimensioning power. This is due to that fewer switches that operate at
the same time can have higher power consumption than more switches operating at
the same time. For example if two switches operate at the same time and both of them
are driven by two point motors. Then the average power for two switches will become
higher than if three switches driven by one point motor operate at the same time.
Since the two switches then have four point motors and the three switches have only
three point motors in total.
This method was applied to the signal boxes and the result is shown in Table 10
below. Two different power consumption are shown in the table: one that is based on
using average power from PSU 151 and one power consumption that is based on the
maximum power from PSU 151 (from inrush current). In Signal box 300, 5 switches
at the same time (all driven by one point motor) became dimensioning power for PSU
151 according to the model above. For signal box 500, 3 switches at the same time
(two switches driven by two point motors and one driven by one point motor) became
dimensioning power for PSU 151. In signal box 600, 3 switches at the same time (all
driven by one point motor) became dimensioning power for PSU 151.
Table 10 Dimensioning power from PSU 151 model at the signal boxes.
Signal box 300 Signal box 500 Signal box 600
Power from
PSU 151 model
[kW]
11 average
32.1 max.
9.74 average
19.52 max.
3.62 average
10.68 max.

CHALMERS, Energy and Environment, Master’s Thesis 37
5.7 Dimensioning power
Here model step one (chapter 5.5.2) and step two (chapter 0) are added and the
dimensioning power is showed. The dimensioned power from the model is also
compared to the dimensioned power based on measurements (chapter 5.5.1 and
chapter 0).
5.7.1 Dimensioning power from measurements
Table 11 below shows the resulting power consumption for signal boxes when the
model for PSU 151 is added to Table 6. The table can then be seen as the total power
required for the signal box. Two different dimensioning power consumption are
shown in the table: One power consumption that is based on using average power
from PSU 151 and one power consumption that is based on the maximum power from
PSU 151 (from inrush current).
Table 11 Signal boxes dimensioning power when using measurements and the model for PSU 151.
5.7.2 Dimensioning power from model
Table 12 shows the resulting power consumption for signal boxes when the model for
PSU 151 is added to Table 7. The table can then be seen as the total power required
for the signal box. Two different dimensioning power consumption are shown in the
table: One power consumption that is based on using average power from PSU 151
and one power consumption that is based on the maximum power from PSU 151
(from inrush current).
Table 12 Signal boxes dimensioning power when using the model.
Signal box 300 Signal box 500 Signal box 600
Dimensioned
power [kW] 17.85 ; (38.95) 14.98 ; (24.76) 6.64 ; (13.7)
Signal box 300 Signal box 500 Signal box 600
Dimensioned
power [kW] 20.58 ; (41.68) 16.26 ; (26.04) 8.68 ; (15.74)

CHALMERS, Energy and Environment, Master’s Thesis 38
5.8 Optimisation
Below are results from the optimisations performed on the three different signal boxes
studied in this thesis. The optimisation was done in the cable sizing program EL-Vis
described in chapter 4.5.1. Input data to EL-Vis was taken from the system
description in chapter 2 and the dimensioned power in Table 11 and Table 12 with
the difference that 30 % has been added to dimensioned power for possible future
expansion, which is a requirement from Trafikverket.
5.8.1 Optimisation signal box 300
Table 13 below shows the results from the optimisation for signal box 300 with
dimensioned power from measurements and dimensioned power from the model.
Today the signal box has a main fuse at 63 ampere for incoming power on the a-side
and the b-side. The optimisation results are slightly different depending on if the
dimensioned power is taken from the model or from the measurements. The
dimensioned power from the model results in 40 ampere fuse for incoming power.
The incoming cable in signal box 300 could also have been decreased from 10 mm to
2.5 mm on the a-side and from 16 mm to 10 mm on the b-side, if the signal box would
have been a new installation. Now when the signal box already is installed there are
no incentives to replace the cable as a smaller cable will have higher voltage drop.
A 40 ampere fuse will however not work according to selectivity as the highest fuse in
the signal box is at 35 ampere, see Appendix E. The nearest fuse that is selective to
the 35 ampere fuse is the 63 ampere fuse. The highest fuse in the signal box belongs
to the UPS. Thus, this UPS will have to be replaced with a smaller one in order get the
40 ampere fuse selective, but since there are great uncertainties if 30 % is sufficient
for expansions in the future this will not be recommended. Consequently no change
will be recommended to happen to signal box 300.
Table 13 Fuse and cable dimension for incoming cable to signal box 300. The dimensioned power is taken from measurements and model separately.
5.8.2 Optimisation signal box 500
The power supply to signal box 500 is a bit different from the power supply to signal
box 300 as the b-side in signal box 500 is fed directly from a network station. In Table
14 it can be seen that fuse became 32 ampere both for incoming power based on the
measurements and based on the model. The existing cable (AXQJ 4x95/29) is not
included in the EL-Vis program. The dimensioned cable became instead AXQJ
4x95/57. This is because the smaller size on the cable will have a voltage drop that
lies on the upper limit recommended. The highest fuse in the signal box is at 16
ampere. This makes the 32 ampere fuse selective according to Appendix E. The
existing fuse at 35 ampere can thus be replaced with a 32 ampere fuse.
A-side B-side
Fuse
Cable
dimension
Voltage
drop [%] Fuse
Cable
dimension
Voltage
drop [%]
Dimensioned power
from measurements
(average)
35 EKKJ
4x2.5/2.5 2.69 35
EKKJ
4x10/10 2.39
Dimensioned power
from model (average) 40
EKKJ
4x2.5/2.5 3.1 40
EKKJ
4x10/10 2.76

CHALMERS, Energy and Environment, Master’s Thesis 39
Table 14 Fuse and cable dimension for incoming cable to signal box 500. The dimensioned power is taken from measurements and model separately.
5.8.3 Optimisation signal box 600
Signal box is equipped with a main fuse at 63 ampere on both a- and b-side and cable
FXQJ 4x16/16 on both sides. In Table 15 below, the cable size can be decreased to
4x6/6 on the a-side and 4x6/6 on the b-side. The fuse can also be replaced to as low as
20 ampere. However the UPS needs to be decreased in size in order to get the 20
ampere fuse selective. After a closer look at Table B-8 in Appendix B.3.1 it can be
seen that the highest current is 11.27. The UPS could thus be decreased in size to 8
kVA and then have a fuse size of 16 ampere (instead of 25 before). The recommended
fuse size of 20 ampere then becomes selective according to Appendix E.
Table 15 Fuse and cable dimension for incoming cable to signal box 500. The dimensioned power is taken from measurements and model separately
A-side B-side
Fuse
Cable
dimension
Voltage
drop [%] Fuse
Cable
dimension
Voltage
drop [%]
Dimensioned
power from
measurements
(average)
13 EKKJ
4x4/4 3.24 13
EKKJ
4x4/4 3.24
Dimensioned
power from
model (average)
20 EKKJ
4x6/6 2.83 20
EKKJ
4x6/6 2.83
A-side B-side
Fuse
Cable
dimension
Voltage
drop [%] Fuse
Dimensioned power
from measurements
(average)
32 AXQJ
4x50/29 4 32
Dimensioned power
from model (average) 32
AXQJ
4x95/57 2.2 32

CHALMERS, Energy and Environment, Master’s Thesis 40
6 Discussion
In the following chapter there will be a discussion around the reliability of the results
based on the objectives in this thesis. This will be done by questioning the
assumptions made and chosen method for this thesis. The discussion is divided into
three parts, namely: assumptions and estimated parameters, modeling approach and
discussion around optimization results.
6.1 Assumptions and estimated parameters
Many assumptions have been made in this thesis in order to come to results within a
reasonable time period. If more time had been available, the measurements would
contain more output power groups instead of being estimated. Seasonal variations
could also have been taken into account. The estimates are based on other literature
articles and datasheets from companies. Even if more measurements would have been
done, the problem still remaining when the power output groups operate relative to
other power output groups in the signal box. The optimal method would have been an
instrument that could measure all output groups individually at the same time. This is
not very realistic as there may be over 40 outgoing power groups in the signal box and
some of them are three phase supplied. With more time a closer study could have
been conducted around when in time the rail traffic is most intense. Measure that
period and thus optimise the signal box from a known maximum power value.
Uncertainties remain with this method; whether this really is the greatest maximum
power value that can arise in the signal box or the future may prove that wrong. As
described in this thesis a model was created around this in order to analyse the railway
traffic more in detail. An uncertainty in the constructed model is the diversity factor
used. This is not a problem that only this model has, but is out in most electrical
installations. In order to see how great impact the diversity factor has on the results
some other values on the diversity factor were studied. The results can be seen in
chapter 6.3.
6.2 Modelling approach
The constructed model is based on data from three different signal boxes, namely:
signal box 300, signal box 500 and signal box 600. The signal boxes are various in
sizes from signal box 500 operating only 6 switches to signal box 300 operating 21
switches. The model could then be tested if it the results are consistent even if the
sizes on the signal box vary. The dimensioned power used as an input in the EL-Vis
software is based on the average power. As the fuses can handle a higher current for a
shorter time (current spikes will only last for approximately ten hundredths of a
second). Additionally, the current spikes should have been shifted in time from each
other according to Anders Magnusson’s thesis and signal engineers at Sweco Rail.
However, this was not the case for the data recorded during the measurement periods.
The shift in time between current spikes could only be found in switching operations
at switches controlled by two point switch motors.
Worth mentioning is that the built up PSU 151 model is based on measurements taken
in this thesis work. The measurements then represent how intense the railway traffic is
today. Train routes can be changed and added which may alter the input data to the
PSU 151 model and thus also alter the results.

CHALMERS, Energy and Environment, Master’s Thesis 41
Today the optimisation is done with help of different kind of data sheets. If this
approach compared to the approach taken in this thesis, one can find both advantages
and disadvantages with respective method. The disadvantages to continue to use the
approach today can be many. For instance, the power mentioned in the data sheets
does not always have to be the actual power the components consume. The actual
power may just be a fraction of the power requirement written in the data sheets. The
suppliers may deliberately set a higher power value in order to be on the safe side.
This causes among other things; thicker cables, higher subscription rate and bigger
UPS installations than really needed. The advantages to stay with today’s approach
are for example that it is known and it works. An unknown method can take time to
learn and it will also take time to perform accurate measurements on all existing
components in the signal box. Dedicating time to this can in the beginning be a loss in
terms of cost but will likely to be paid back in the longer run. Furthermore the
approach used today conflicts with Trafikverket’s vision: “Alla kommer fram smidigt,
grönt och tryggt” [39], which in English can be translated to something like
“Everyone should arrive easy, green and safely”. Where green refers to sustainability
and it is not that sustainable to have over dimensioned signal boxes.
The optimization performed in this thesis does not only lead to a financial gain.
Resource savings results in less material used in the manufacturing processes of e.g.
UPS and power cables. Seen from a bigger perspective, energy needed in all stages of
these components life cycles is reduced. The components have thus the same function
at a lower energy input. According to International Energy Agency energy efficiency
results in e.g. reduced investment in energy infrastructure, improved welfare and
reduction of greenhouse gases emissions. [40]

CHALMERS, Energy and Environment, Master’s Thesis 42
6.3 Discussion around optimisation results
To see if the dimensioned power from the model was credible, it was compared to the
dimensioned power from the measurements. In Table 11 the dimensioned power
became: 17.85 kW in signal box 300, 14.98 in signal box 500 and 6.64 in signal box
600. The dimensioned power from the model ( Table 12): 20.58 in signal box 300,
16.26 in signal box 500 and 8.68 in signal box 600. The model sorts the signal boxes
in the same power size order as the measurements. Moreover, the values from the
model are not very different to the measurements, (between 1.28 kW to 2.73kW). This
indicates that the model provides credible results. The earlier performed measurement
that Vectura did in signal box 600 was 7.7 kW which also is not that different to the
model’s 8.68 kW. The final optimisation results differ somewhat depending if the
power used is taken from the model or from the measurements even if the difference
between the power requirements isn’t that huge. To be on the safe side the
optimisation was in the end based on the dimensioned power from the model. The
result from this is presented in Table 16 , Table 17 and Table 18 below. The values
marked with red in the tables are the optimisation result taken from chapter 5.8.
The diversity factor may have an impact on the optimisation results, as discussed in
chapter 6.1. In order to study this, other values for the diversity factor was used in the
model. The values tested for the diversity factor ranged from 0.4 to 1 with interval of
0.1.
Table 16 shows how the optimisation results are affected with changed diversity
factor. As there is an uncertainty about how high the power requirement will be in the
future for signal box 300, it was chosen that no changes should happen to signal box
300. This means that the signal box should still have its fuse at 63 ampere.
The diversity factor does not need to be taken into account according to the table at
that fuse size.
Table 16 Fuse and cable dimension for incoming cable to signal box 300 for different diversity factors. The dimensioned power is taken from the model.
In Table 17 it can be seen that the recommended cable size for signal box 500 stands a
higher diversity factor. At higher diversity factor than 0.8 the fuse becomes higher
than the already installed fuse in the signal box today. Signal box 500 was proven to
be the already best optimised signal box out of the three studied. However it can still
be recommended to be optimised one step lower in fuse size as the model is built on
worst case scenario for the railway switches.
Diversity
factor A-side B-side
Fuse Cable
dimension
Voltage
drop [%] Fuse
Cable
dimension
Voltage
drop [%]
0.4 35 EKKJ 4x2.5/2.5 2.62 35 EKKJ 4x6/6 3.92
0.5 40 EKKJ 4x2.5/2.5 2.86 40 EKKJ 4x10/10 2.54
0.6 40 EKKJ 4x2.5/2.5 3.1 40 EKKJ 4x10/10 2.76
0.7 50 EKKJ 4x4/4 2.08 50 EKKJ 4x10/10 2.97
0.8 50 EKKJ 4x4/4 2.23 50 EKKJ 4x10/10 3.19
0.9 50 EKKJ 4x4/4 2.38 50 EKKJ 4x10/10 3.4
1 63 EKKJ 4x4/4 2.53 63 EKKJ 4x10/10 3.62
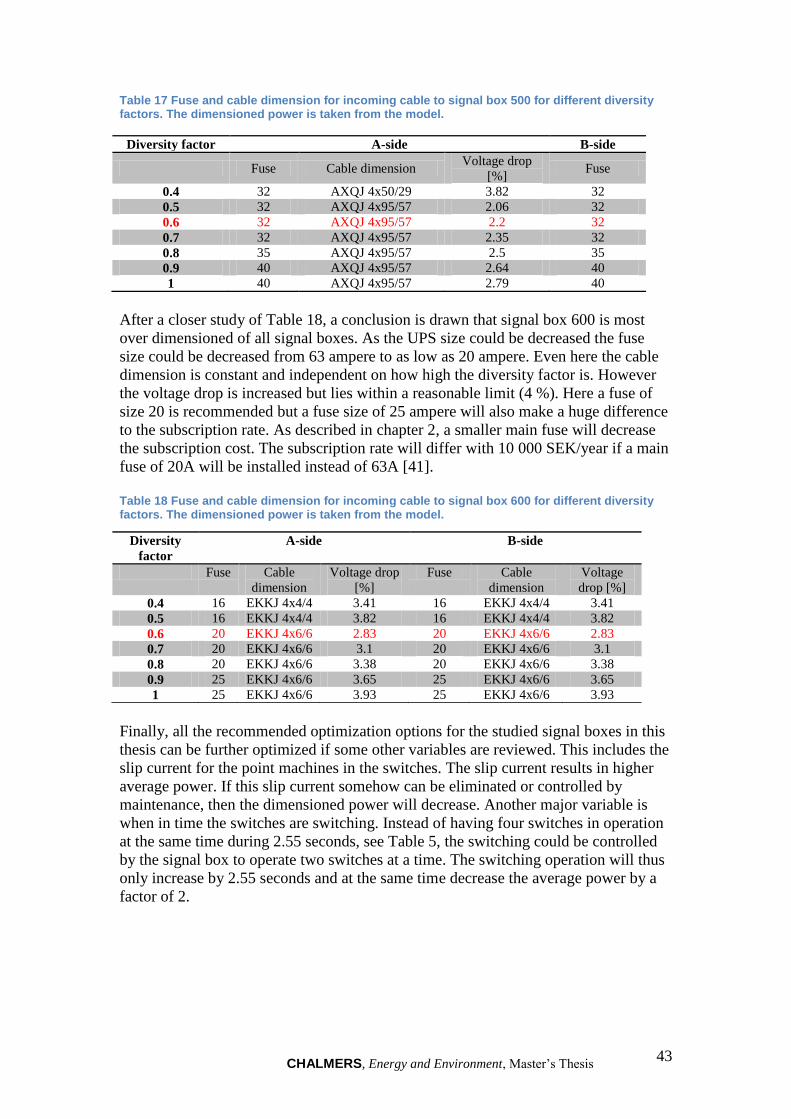
CHALMERS, Energy and Environment, Master’s Thesis 43
Table 17 Fuse and cable dimension for incoming cable to signal box 500 for different diversity factors. The dimensioned power is taken from the model.
After a closer study of Table 18, a conclusion is drawn that signal box 600 is most
over dimensioned of all signal boxes. As the UPS size could be decreased the fuse
size could be decreased from 63 ampere to as low as 20 ampere. Even here the cable
dimension is constant and independent on how high the diversity factor is. However
the voltage drop is increased but lies within a reasonable limit (4 %). Here a fuse of
size 20 is recommended but a fuse size of 25 ampere will also make a huge difference
to the subscription rate. As described in chapter 2, a smaller main fuse will decrease
the subscription cost. The subscription rate will differ with 10 000 SEK/year if a main
fuse of 20A will be installed instead of 63A [41].
Table 18 Fuse and cable dimension for incoming cable to signal box 600 for different diversity factors. The dimensioned power is taken from the model.
Finally, all the recommended optimization options for the studied signal boxes in this
thesis can be further optimized if some other variables are reviewed. This includes the
slip current for the point machines in the switches. The slip current results in higher
average power. If this slip current somehow can be eliminated or controlled by
maintenance, then the dimensioned power will decrease. Another major variable is
when in time the switches are switching. Instead of having four switches in operation
at the same time during 2.55 seconds, see Table 5, the switching could be controlled
by the signal box to operate two switches at a time. The switching operation will thus
only increase by 2.55 seconds and at the same time decrease the average power by a
factor of 2.
Diversity factor A-side B-side
Fuse Cable dimension Voltage drop
[%] Fuse
0.4 32 AXQJ 4x50/29 3.82 32
0.5 32 AXQJ 4x95/57 2.06 32
0.6 32 AXQJ 4x95/57 2.2 32
0.7 32 AXQJ 4x95/57 2.35 32
0.8 35 AXQJ 4x95/57 2.5 35
0.9 40 AXQJ 4x95/57 2.64 40
1 40 AXQJ 4x95/57 2.79 40
Diversity
factor
A-side B-side
Fuse Cable
dimension
Voltage drop
[%]
Fuse Cable
dimension
Voltage
drop [%]
0.4 16 EKKJ 4x4/4 3.41 16 EKKJ 4x4/4 3.41
0.5 16 EKKJ 4x4/4 3.82 16 EKKJ 4x4/4 3.82
0.6 20 EKKJ 4x6/6 2.83 20 EKKJ 4x6/6 2.83
0.7 20 EKKJ 4x6/6 3.1 20 EKKJ 4x6/6 3.1
0.8 20 EKKJ 4x6/6 3.38 20 EKKJ 4x6/6 3.38
0.9 25 EKKJ 4x6/6 3.65 25 EKKJ 4x6/6 3.65
1 25 EKKJ 4x6/6 3.93 25 EKKJ 4x6/6 3.93

CHALMERS, Energy and Environment, Master’s Thesis 44
7 Conclusion
In this thesis, a model based on measurements and datasheets was successfully
developed with a purpose of optimising different signal boxes of type 95. The
proposed method of optimisation is based both on the created model and
measurements separately. The two different results are discussed and a
recommendation on optimisation is given from these results.
The model created in this study makes it possible to investigate both uninterruptible
power and favored power and in the end a combination of them both. The
performance of the model was determined by comparing it to earlier proposed
optimization measurements and by testing the model on different sizes of signal
boxes.
The goal of the proposed method was to see if the signal boxes could be optimised.
The proposed method revealed that all the signal boxes were over dimensioned.
However, no recommendations on optimisations were conducted on signal box 300
due to uncertainties about future development. Signal box 500 could be equipped with
one smaller step in fuse size and the fuse size in signal box 300 could be decreased
drastically from 63 ampere to 20 ampere, lowering the subscription cost with 10 000
SEK/year.
7.1 Future work
Study the uninterruptible power closer with the goal to see if the UPS could be
decreased even further.
Measure several outgoing power groups simultaneously and thus get a clearer
picture on the power consumption in the signal box.
Investigate if the slip current could be reduced or eliminated and thus decrease
the average power from the switches.
Implement software that keeps down the number of switching operations that
could be conducted at the same time.

CHALMERS, Energy and Environment, Master’s Thesis 45
8 References
[1] Jarnvag.net. (n.d.). Kort svensk järnvägshistoria. Retrieved April 8, 2014, from Jarnvag.net:
http://www.jarnvag.net/index.php/banguide/historia.
[2] Trafikverket. (2012, April 2). Vem gör vad av myndigheterna inom transportområdet?
Retrieved April 8, 2014, from Trafikverket: http://www.trafikverket.se/Om-
Trafikverket/Trafikverket/Vem-gor-vad-av-myndigheterna-inom-transportomradet/.
[3] Trafikverket. (2014, January 27). Sveriges järnvägsnät. Retrieved April 8, 2014, from
Trafikverket: http://www.trafikverket.se/Privat/Vagar-och-jarnvagar/Sveriges-jarnvagsnat/.
[4] Trafikverket. (2011, September 2). Underhålls- och reinvesteringsbehov signalställverk.
Retrieved April 8, 2014, from Trafikverket:
http://www.trafikverket.se/PageFiles/65047/rapport_underhalls_och_reinvesteringsbehov_sig
nalstallverk_20110902_version_1_0.pdf.
[5] Antonsson, C. (2013, September 12). (P. Sigvardsson, Interviewer).
[6] Trafikverket. (2013, May 10). Elkraftanläggningar. Retrieved April 8, 2014, from
Trafikverket:
http://ida8iext.banverket.se/bvdok_extern/ViewPdfDoc.aspx?docGUID=300a24e0-db55-
4eb9-9baf-2e10ebe99af4.
[7] Trafikverket. (2012, May 18). Grundläggande projekteringsregler för Ebilock 950 anpassad
för Trafikverket. Retrieved April 8, 2014, from Trafikverket:
http://www.trafikverket.se/PageFiles/57735/projekteringsregler_CBSS_BV_ATC_L1_120620
.pdf.
[8] Toshiharu, M. (1992). Patent No. US5175730 A. Japan.
[9] Svahn, E. (2013, September 12). (P. Sigvardsson, Interviewer).
[10] Eaton. (2009, July). Eaton 9355 UPS. Retrieved April 8, 2014, from Eaton:
http://powerquality.eaton.in/Products-services/Backup-Power-
UPS/9355.aspx?cx=36&GUID=DDB5DC59-5174-4925-855B-21F5C1A1C282.
[11] Stenström, C. (2012). Maintenance performance measurement of railway infrastructure with
focus on the swedish network. Luleå: Luleå University of Technology.
[12] Bårström, S., & Granbom, P. (2012). Den svenska järnvägen. Borlänge: Trafikverket.
[13] Trafikverket. (2012, Mars 15). ERTMS i Sverige - Nuläge och viktiga vägval. Retrieved April
8, 2014, from
Trafikverket: http://www.trafikverket.se/PageFiles/68345/ertms_sverige_20120315_ny.pdf.
[14] Trafikverket. (2014, Mars 6). Statistik för punktlighet. Retrieved April 8, 2014, from
Trafikverket: http://www.trafikverket.se/Om-Trafikverket/Trafikverket/Manatlig-
trafikrapport/Transport-pa-jarnvag-i-ratt-tid/Statistik-for-punktlighet/.
[15] Järnvägsstyrelsen. (2008, April 18). GSM-R-installationer i fordon. Retrieved April 8, 2014,
from Transportstyrelsen:
http://www.transportstyrelsen.se/Global/Jarnvag/Vagledning/Godkannande/vagledning_gsm_r
_installationer_i_fordon_v01.pdf.
[16] ELFA. (2007). Faktasidor. Retrieved April 8, 2014, from ELFA:
https://www1.elfa.se/data1/wwwroot/webroot/Z_STATIC/sv/pdf/fakta.pdf.

CHALMERS, Energy and Environment, Master’s Thesis 46
[17] EMERSON Network Power. (2000, November). High-availability power system, part 1: UPS
internal topology. Retrieved April 8, 2014, from EMERSON Network Power:
http://www.emersonnetworkpower.com/documentation/en-
us/brands/liebert/documents/white%20papers/high-
availability%20power%20systems,%20part%20i_ups%20internal%20topology.pdf.
[18] Sweco Rail. (n.d.). Säkringsdimensionering av Eaton-Powerware UPS 0.7 – 500 VA.
Retrieved April 14, 2014, from Sweco Rail.
[19] Trafikverket. (2013, April 15). Spårväxel definition, benämning och förkortning. Retrieved
April 8, 2014, from ida8iext.banverket:
http://ida8iext.banverket.se/bvdok_extern/viewpdfdoc.aspx?docGUID=ac8c59e1-1b92-46ed-
803d-40313f3527b5.
[20] Trafikverket. (2012, November 30). Spårväxel med fast och rörlig korsningsspets. Retrieved
April 8, 2014, from Trafikverket: http://www.trafikverket.se/PageFiles/93755/bvs_1522.pdf.
[21] Statens järnvägar. (2009, April 10). Omläggningsanordning för växlar. Retrieved April 8,
2014, from ekeving: http://www.ekeving.se/t/sthb/SH_35-57.pdf.
[22] Svahn, M. (2013, November 8). (P. Sigvardsson, Interviewer).
[23] Trafikverket. (2009, September 30). Spårväxlar och spårspärrar grundläggande
signaleringskrav. Retrieved April 8, 2014, from Trafikverket:
http://www.trafikverket.se/PageFiles/15448/BVS544.98025.pdf.
[24] SEK svenska elekriska kommissionen. (2005, January 10). Svensk standard SS 424 14 24 .
Retrieved April 8, 2014, from enav-sis-se.proxy.lib.chalmers: https://enav-sis-
se.proxy.lib.chalmers.se/sv/Sok/?q=SS+4241424+&fpPublisher_SS=on&fd1=off.
[25] ELinfo. (n.d.). Beräkna spänningsfallet. Retrieved April 8, 2014, from EL-Vis 10.1.0
(software).
[26] SEK svensk elstandard. (2010). Svensk standard SS 436 40 00 + R1. Retrieved April 8, 2014,
from EL-Vis 10.1.0 (software).
[27] Institutionen för Elteknik. (2008). Elteknik. Göteborg: Chalmers Tekniska Högskola.
[28] Banverket. (2008, May 1). Signalställverk modell 85 och 95 - installation av skåp, kurar och
kiosker. Retrieved April 8, 2014, from ida8iext.banverket:
http://ida8iext.banverket.se/bvdok_extern/ViewPdfDoc.aspx?docGUID=d9975502-f899-
4952-816e-f6702c1cb678.
[29] Schneider Electric. (2010). Tabellsamling säkringsfri teknik 2010. Retrieved April 8, 2014,
from engineering.schneider-electric: http://www.engineering.schneider-
electric.se/Attachments/ed/guide/Tabellsamling2010%5B1%5D.pdf.
[30] Wallnerström, J. C. (2005). Algoritm för uppskattning av den maximala effekten i
eldistributionsnät. Stockholm: KTH - Kungliga Tekniska Högskolan.
[31] Magnusson, A. (2004). Utredning av effektbehovet för signalsäkerhetsutrustningar vid den
svenska järnvägen. Göteborg: Chalmers.
[32] Edstrand, J. (2012). Calculation method for powering a tramway network. Göteborg:
Chalmers.
[33] Dranetz - BMI. (2005). PowerVisa User Guide. Edison, New Jersey, USA.
[34] Dranetz. (n.d.). PowerVisa. Retrieved April 8, 2014, from Dranetz:
http://dranetz.com/portable/powervisa.

CHALMERS, Energy and Environment, Master’s Thesis 47
[35] Dranetz. (n.d.). Current Probes. Retrieved April 8, 2014, from Dranetz:
http://dranetz.com/accessories/current-probes.
[36] El Info. (n.d.). EL-Vis kabel. Retrieved April 8, 2014, from EL-info: http://el-
info.se/produkter/el-vis-kabel/.
[37] Smith, M. (n.d.). Refuge Sidings Exchange Sidings and Marshalling Yards. Great Britain.
[38] Svensk standard SS EN 60 431-1. (1998, May). ABB LV Systems. Retrieved April 8, 2014,
from ABB:
http://www05.abb.com/global/scot/scot209.nsf/veritydisplay/33890c8ca6e39a6cc1256af00036
4282/$file/1tsc906019d3401.pdf.
[39] Malm, G. (2014, Mars 29). Vision. Retrieved April 8, 2014, from Trafikverket:
http://www.trafikverket.se/Om-Trafikverket/Trafikverket/.
[40] International Energy Agency. (n.d.). Energy efficiency. Retrieved April 27, 2014, from
International Energy Agency: http://www.iea.org/topics/energyefficiency/.
[41] Sweco Rail. (2012). Effektmätning av signalanläggningar. Retrieved April 24, 2014, from
Sweco Rail.
[42] Banverket. (2004, Mars 10). Funktionsvärden för signalteknisk utrustning. Retrieved April 8,
2014, from ida8iext.banverket:
http://ida8iext.banverket.se/bvdok_extern/ViewPdfDoc.aspx?docGUID=79408fc6-9355-42ad-
b750-5679e53322ce.
[43] Sweco Rail. (n.d.). Nominella strömvärden för IFÖ NH-säkringar vid olika smälttider.
Retrieved April 14, 2014, from Sweco Rail.
[44] Sweco Rail. (n.d.). Smält-och totala I2t-värden. Retrieved April 14, 2014, from Sweco Rail.

CHALMERS, Energy and Environment, Master’s Thesis A-1
Appendix A Switching operations
Appendix A.1 Switching operations at signal box 300
3-4 pm
4-5pm
5-6 pm
6-7 pm
7-8 pm
8-9 pm
9-10 pm
10-11 pm
11-12 pm
0-1 am
1-2 am
2-3 am
3-4 am
4-5 am
5-6 am
6-7 am
486 0 0 0 0 0 0 0 0 0 0 0 0 0 0 0 0
485 0 0 0 0 0 0 1 0 0 0 0 0 0 0 0 0
484 0 2 0 0 0 0 0 2 0 0 0 0 0 0 0 0
483 0 0 0 0 0 0 0 0 0 0 0 0 0 0 0 0
481 0 0 0 0 1 0 0 0 0 0 2 0 0 0 0 1
480 1 1 0 1 1 1 1 0 0 2 3 4 0 1 0 0
477 0 1 0 0 0 0 0 1 0 0 0 0 0 0 0 0
469 0 0 0 0 1 0 1 0 0 0 0 0 0 1 0 1
468 0 0 0 0 0 1 0 2 0 0 0 0 0 0 0 0
429 0 0 0 0 0 0 0 0 0 0 0 0 0 0 0 0
427 0 0 0 0 0 0 0 0 0 0 0 0 0 0 0 0
426 0 0 0 0 0 0 0 0 0 0 0 0 0 0 0 0
419 0 0 0 0 0 0 0 0 0 0 0 0 0 0 0 0
411 0 0 0 0 0 0 0 0 0 0 0 0 0 0 0 0
410 0 1 0 0 1 0 1 0 0 0 0 0 0 4 0 1
409 0 0 0 0 0 0 1 0 0 0 0 0 0 0 0 0
398 0 0 0 0 0 0 0 0 0 0 0 0 0 0 0 0
395 0 0 0 0 0 0 0 0 0 0 0 0 0 0 0 0
394 0 0 0 0 0 0 0 0 0 0 2 0 0 0 0 0
388 0 0 0 0 0 0 0 0 0 0 0 0 0 0 0 0
387 0 0 0 0 0 0 0 0 0 0 0 0 0 0 0 0
0
1
2
3
4
5
6
7
Nu
mb
er
of
swit
chin
g o
pe
rati
on
s
1 Switch
Figure A-1 Switching operations in signal box 300 when only one switch operates at a time.

CHALMERS, Energy and Environment, Master’s Thesis A-2
Figure A-2 Switching operations in signal box 300 when only one switch operates at a time.
3-4 pm
4-5pm
5-6 pm
6-7 pm
7-8 pm
8-9 pm
9-10 pm
10-11 pm
11-12 pm
0-1 am
1-2 am
2-3 am
3-4 am
4-5 am
5-6 am
6-7 am
477,480 0 0 0 0 1 0 0 1 0 0 0 0 0 0 0 0
469,477 1 0 0 0 0 0 0 0 0 0 0 0 0 0 0 0
410,419 0 0 0 0 0 0 1 0 0 0 0 0 0 0 0 0
409,485 0 1 0 0 0 0 0 0 0 0 0 0 0 0 0 0
409,410 1 0 0 0 0 0 0 0 0 0 0 0 0 1 0 0
395,398 2 0 0 0 1 2 0 2 0 0 1 1 0 1 0 0
394,481 0 0 0 0 0 0 0 0 0 0 0 1 0 0 0 0
0
1
2
3
4 N
um
be
r o
f sw
itch
ing
op
era
ton
s (2
at
the
sam
e t
ime
) 2 Switches

CHALMERS, Energy and Environment, Master’s Thesis A-3
Figure A-3 Switching operations in signal box 300 when three switches operate at the same time.
Figure A-4 Switching operations in signal box 300 when four switches operate at the same time.
3-4 pm
4-5pm
5-6 pm
6-7 pm
7-8 pm
8-9 pm
9-10 pm
10-11 pm
11-12 pm
0-1 am
1-2 am
2-3 am
3-4 am
4-5 am
5-6 am
6-7 am
486,409,410 0 0 0 0 0 0 0 0 0 0 0 0 0 1 0 0
409,410,419 0 0 0 0 1 0 0 0 0 0 0 0 0 0 0 1
395,398,480 1 1 0 0 0 0 1 0 0 0 0 0 0 0 0 0
395,398,477 0 1 0 0 0 0 0 0 0 0 0 0 0 0 0 0
395,398,469 0 1 0 0 0 0 0 0 0 0 0 0 0 0 0 0
394,480,481 0 0 0 0 0 0 0 0 0 0 1 0 0 0 0 0
394,477,480 0 0 0 0 0 0 0 0 0 0 0 0 0 0 0 1
388,398,481 0 0 1 0 0 0 0 0 0 0 0 0 0 1 0 0
388,395,481 0 0 0 1 0 0 0 0 0 0 0 0 0 0 0 0
387,388,481 0 0 1 0 0 0 0 0 0 0 0 0 0 0 0 0
387,388,394 0 0 0 0 2 0 0 0 0 0 0 0 0 0 0 0
0
1
2
3
Nu
mb
er
of
swit
chin
g o
pe
rati
on
s (3
at
the
sam
e t
ime
) 3 Switches
3-4 pm
4-5pm
5-6 pm
6-7 pm
7-8 pm
8-9 pm
9-10 pm
10-11 pm
11-12 pm
0-1 am
1-2 am
2-3 am
3-4 am
4-5 am
5-6 am
6-7 am
395,398,480,481 0 0 0 0 1 0 0 0 0 0 0 0 0 0 0 0
395,398,477,480 0 1 0 0 0 0 0 0 0 0 0 0 0 0 0 0
395,398,469,480 0 0 0 0 0 0 0 1 0 0 0 0 0 0 0 0
395,398,468,480 0 0 0 0 0 1 0 0 0 0 0 0 0 0 0 0
394,395,398,481 0 0 0 0 1 0 0 0 0 0 0 0 0 0 0 0
388,469,480,481 0 0 0 0 1 0 0 0 0 0 0 0 0 0 0 0
388,395,398,481 0 0 1 0 0 0 0 0 0 0 0 0 0 0 0 0
0
1
2
3
Nu
mb
er
of
swit
chin
g o
pe
rati
on
s (4
at
the
sam
e
tim
e)
4 Switches
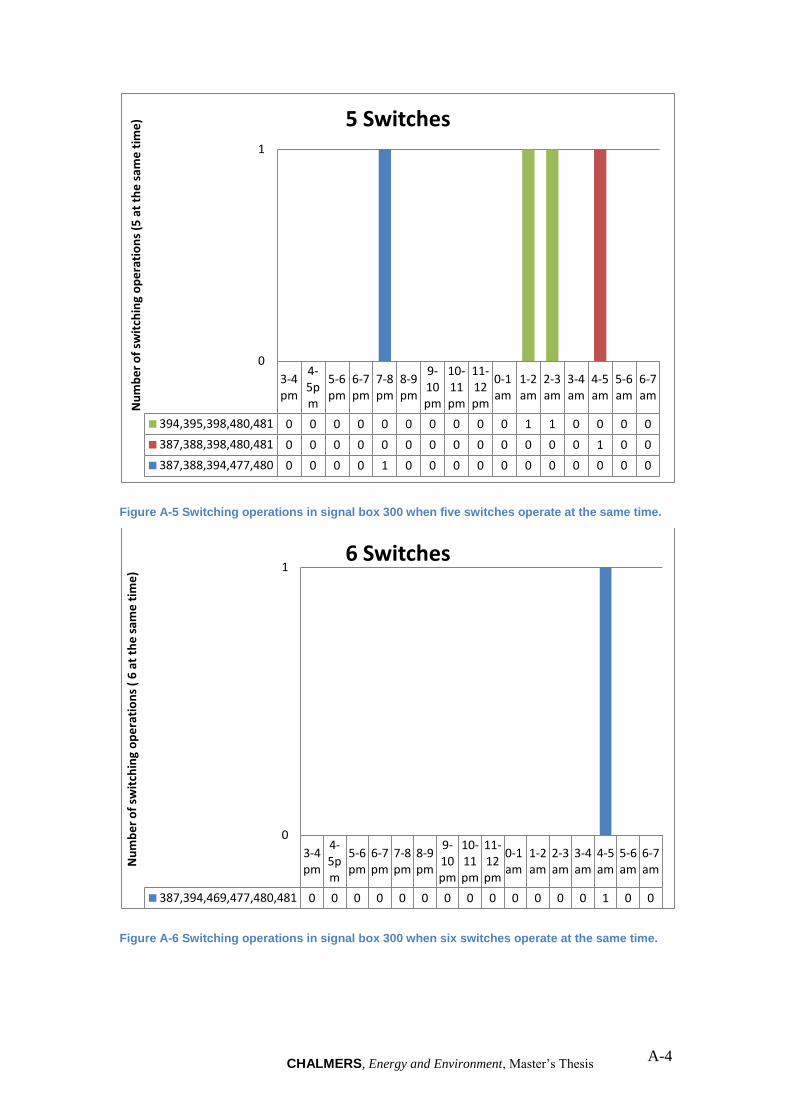
CHALMERS, Energy and Environment, Master’s Thesis A-4
Figure A-5 Switching operations in signal box 300 when five switches operate at the same time.
Figure A-6 Switching operations in signal box 300 when six switches operate at the same time.
3-4 pm
4-5pm
5-6 pm
6-7 pm
7-8 pm
8-9 pm
9-10 pm
10-11 pm
11-12 pm
0-1 am
1-2 am
2-3 am
3-4 am
4-5 am
5-6 am
6-7 am
394,395,398,480,481 0 0 0 0 0 0 0 0 0 0 1 1 0 0 0 0
387,388,398,480,481 0 0 0 0 0 0 0 0 0 0 0 0 0 1 0 0
387,388,394,477,480 0 0 0 0 1 0 0 0 0 0 0 0 0 0 0 0
0
1 N
um
be
r o
f sw
itch
ing
op
era
tio
ns
(5 a
t th
e s
ame
tim
e) 5 Switches
3-4 pm
4-5pm
5-6 pm
6-7 pm
7-8 pm
8-9 pm
9-10 pm
10-11 pm
11-12 pm
0-1 am
1-2 am
2-3 am
3-4 am
4-5 am
5-6 am
6-7 am
387,394,469,477,480,481 0 0 0 0 0 0 0 0 0 0 0 0 0 1 0 0
0
1
Nu
mb
er
of
swit
chin
g o
pe
rati
on
s (
6 a
t th
e s
ame
tim
e)
6 Switches

CHALMERS, Energy and Environment, Master’s Thesis A-5
Appendix A.2 Switching operations at signal box 500
Figure A-7 Switching operations in signal box 500 when only one switch operates at a time.
Figure A-8 Switching operations in signal box 500 when two switches operate at the same time.
11-12 am
12 am-1 pm
1-2 pm
2-3 pm
3-4 pm
4-5 pm
5-6 pm
6-7 pm
7-8 pm
8-9 pm
9-10 pm
10-11 pm
11-12 pm
551 0 0 0 0 0 1 1 0 0 0 0 0 0
550 1 0 0 0 0 0 0 0 0 0 0 0 0
547 0 0 0 0 4 0 0 0 0 0 1 1 0
463 1 0 0 0 0 0 0 0 0 0 0 1 1
462 2 5 4 4 3 2 2 6 2 4 1 1 0
461 1 3 0 0 0 1 0 0 1 0 0 0 0
0 1 2 3 4 5 6 7 8
Nu
mb
er
of
swit
chin
g o
pe
rati
on
s 1 Switch
11-12 am
12 am-1 pm
1-2 pm
2-3 pm
3-4 pm
4-5 pm
5-6 pm
6-7 pm
7-8 pm
8-9 pm
9-10 pm
10-11 pm
11-12 pm
461,550 0 0 0 0 0 1 0 0 0 0 0 0 0
462,463 1 0 0 0 0 0 0 0 2 0 0 0 0
461,462 0 0 0 0 1 0 0 0 1 0 0 0 0
550,551 3 0 1 4 3 4 3 4 3 4 2 2 0
0
1
2
3
4
5
6
Nu
mb
er
of
swit
chin
g o
pe
rati
on
s (2
at
the
sam
e
tim
e)
2 Switches

CHALMERS, Energy and Environment, Master’s Thesis A-6
Figure A-9 Switching operations in signal box 500 when three switches operate at the same time.
Figure A-10 Switching operations in signal box 500 when four switches operate at the same time.
11-12 am
12 am-1 pm
1-2 pm
2-3 pm
3-4 pm
4-5 pm
5-6 pm
6-7 pm
7-8 pm
8-9 pm
9-10 pm
10-11 pm
11-12 pm
462,550,551 0 1 0 0 0 1 1 0 1 0 1 0 0
461,550,551 1 0 0 1 2 0 1 0 0 0 1 0 0
0
1
2 N
um
be
r o
f sw
itch
ing
op
era
tio
ns
(3 a
t th
e s
ame
tim
e) 3 Switches
11-12 am
12 am-
1 pm
1-2 pm
2-3 pm
3-4 pm
4-5 pm
5-6 pm
6-7 pm
7-8 pm
8-9 pm
9-10 pm
10-11 pm
11-12 pm
461,462,550,551 0 0 0 0 0 1 0 0 0 0 0 0 0
0
1
Nu
mb
er
of
swit
chin
g o
pe
rati
on
s (4
at
th
e s
ame
tim
e)
4 Switches

CHALMERS, Energy and Environment, Master’s Thesis A-7
Appendix A.3 Switching operations at signal box 600
Figure A-11 Switching operations in signal box 600 when only one switch operates at a time.
11-12 am
12 am-1 pm
1-2 pm
2-3 pm
3-4 pm
4-5 pm
5-6 pm
6-7 pm
7-8 pm
8-9 pm
9-10 pm
626 0 0 0 0 0 0 0 0 0 0 0
625 0 0 0 0 0 0 0 0 0 0 0
624 0 0 0 1 0 0 0 0 0 0 0
623 1 0 0 5 2 4 2 1 1 1 1
621 0 0 0 1 0 0 0 0 0 0 0
618 0 0 0 0 0 0 0 0 0 0 0
617 0 0 0 2 3 0 0 0 0 1 1
614 0 0 0 0 0 0 0 0 0 0 0
608 0 0 0 0 0 0 0 0 0 0 0
607 0 0 0 0 0 0 0 0 0 0 0
0
1
2
3
4
5
6
7
8
9
Nu
mb
er
of
swit
chin
g o
pe
rati
on
s
1 Switch
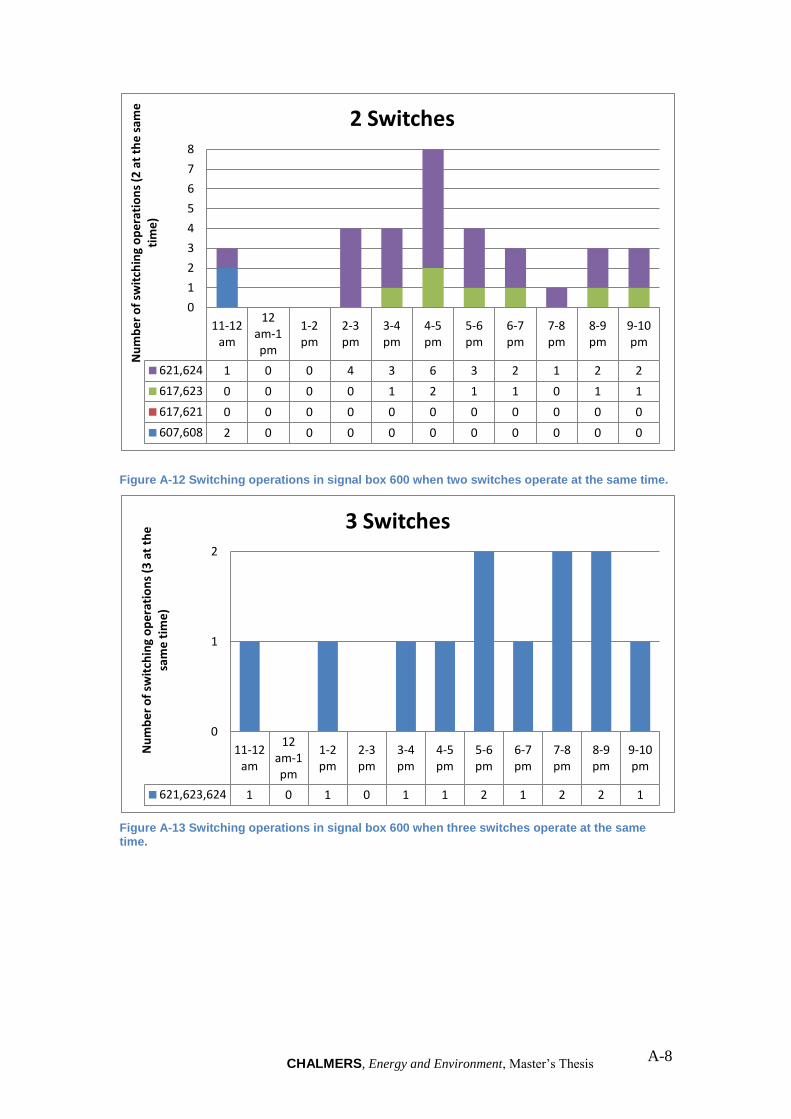
CHALMERS, Energy and Environment, Master’s Thesis A-8
Figure A-12 Switching operations in signal box 600 when two switches operate at the same time.
Figure A-13 Switching operations in signal box 600 when three switches operate at the same time.
11-12 am
12 am-1 pm
1-2 pm
2-3 pm
3-4 pm
4-5 pm
5-6 pm
6-7 pm
7-8 pm
8-9 pm
9-10 pm
621,624 1 0 0 4 3 6 3 2 1 2 2
617,623 0 0 0 0 1 2 1 1 0 1 1
617,621 0 0 0 0 0 0 0 0 0 0 0
607,608 2 0 0 0 0 0 0 0 0 0 0
0
1
2
3
4
5
6
7
8 N
um
be
r o
f sw
itch
ing
op
era
tio
ns
(2 a
t th
e s
ame
ti
me
)
2 Switches
11-12 am
12 am-1 pm
1-2 pm
2-3 pm
3-4 pm
4-5 pm
5-6 pm
6-7 pm
7-8 pm
8-9 pm
9-10 pm
621,623,624 1 0 1 0 1 1 2 1 2 2 1
0
1
2
Nu
mb
er
of
swit
chin
g o
pe
rati
on
s (3
at
the
sa
me
tim
e)
3 Switches

CHALMERS, Energy and Environment, Master’s Thesis A-9
Figure A-14 Switching operations in signal box 600 when four switches operate at the same time.
11-12 am
12 am-1 pm
1-2 pm
2-3 pm
3-4 pm
4-5 pm
5-6 pm
6-7 pm
7-8 pm
8-9 pm
9-10 pm
617,621,623,624 0 0 0 0 0 0 0 0 0 0 1
0
1
Nu
mb
er
of
swit
chin
g o
pe
rati
on
s (4
at
the
sa
me
tim
e)
4 Switches

CHALMERS, Energy and Environment, Master’s Thesis B-1
Appendix B Signal box power consumption
Appendix B.1 Signal box 300 power consumption
Appendix B.1.1 Uninterruptible power signal box 300
Table B-1 Uninterruptible power for different outgoing power groups in signal box 300
Plinth Group index
Ampacity
(W)
Voltage
(one phase/
3-phase)
Phase
L1/L2/L3
or 3-phase
Min. current
need (A)
Proposed
fuse (A)
F50
Yard object
Distribution box
=N1A17/+455 1000 3-phase 3-phase 1,443375673 25
F51 Free
3-phase 3-phase 0 0
F52 Free
3-phase 3-phase 0 0
F53 Free
3-phase 3-phase 0 0
F54
Distribution box
=N1A3/+455 0 3-phase 3-phase 0 16
F55 Distribution box
=N1A4/+455 1080 3-phase 3-phase 1,558845727 20
F56
Distribution box
=N1A5/+455 0 3-phase 3-phase 0 16
F57 Lighting 500 3-phase 3-phase 0,721687836 6
F58 Free
3-phase 3-phase 0 0
F59
OBC1.H7.11 Power
supply unit PSU72 540 One phase L1 2,347826087 10
F60 OBC1.H7.21 Power supply unit PSU72 540 One phase L2 2,347826087 10
F61
OBC1.H7.31 Power
supply unit PSU370 540 One phase L3 2,347826087 10
F62 OBC1.A3.11 Power supply unit PSU440 96 One phase L1 0,417391304 10
F63 Free
One phase L2 0 0
F64 Free
One phase L3 0 0
F65 OBC2.H7.11 Power supply unit PSU72 540 One phase L1 2,347826087 10
F66
OBC2.H7.21 Power
supply unit PSU72 540 One phase L2 2,347826087 10
F67 OBC2.H7.31 Power supply unit PSU370 540 One phase L3 2,347826087 10
F68 Free
One phase L1 0 0
F69 Free
One phase L2 0 0
F70 Free
One phase L3 0 0
F71
OBC3.H7.11 Power
supply unit PSU72 540 One phase L1 2,347826087 10
F72 OBC3.H7.21 Power supply unit PSU72 540 One phase L2 2,347826087 10
F73
OBC3.H7.31 Power
supply unit PSU370 540 One phase L3 2,347826087 10
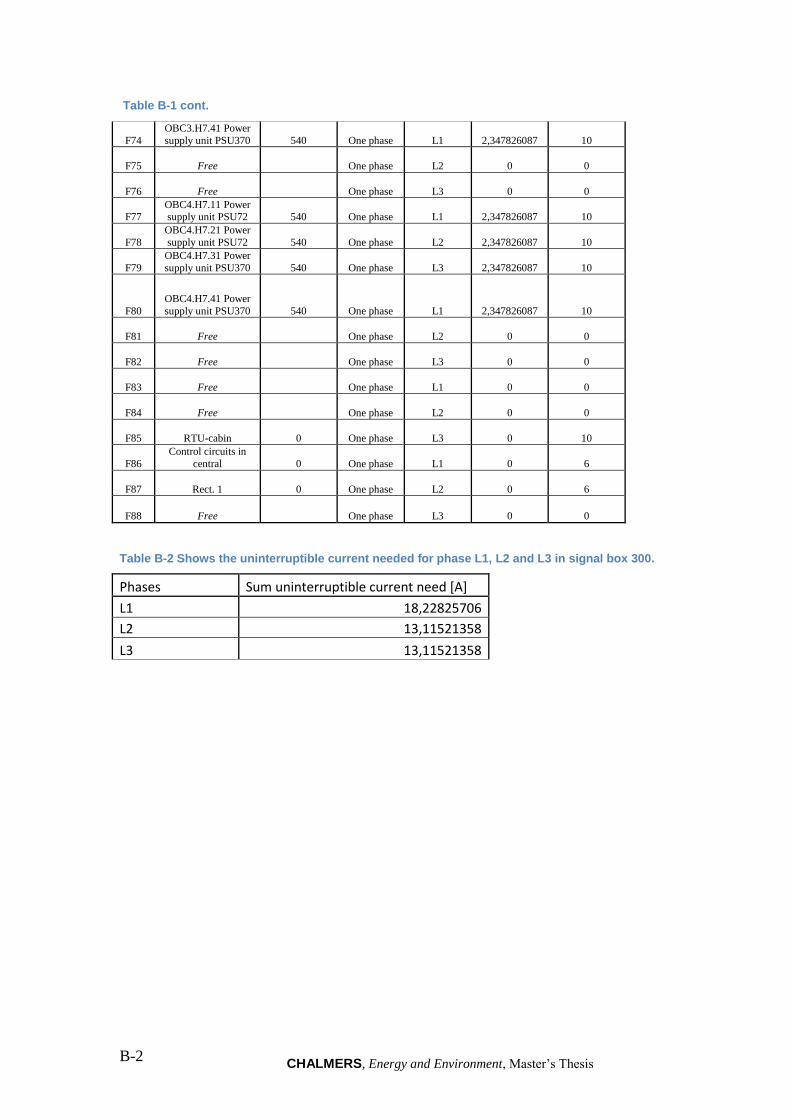
CHALMERS, Energy and Environment, Master’s Thesis B-2
Table B-1 cont.
F74
OBC3.H7.41 Power
supply unit PSU370 540 One phase L1 2,347826087 10
F75 Free
One phase L2 0 0
F76 Free
One phase L3 0 0
F77 OBC4.H7.11 Power supply unit PSU72 540 One phase L1 2,347826087 10
F78
OBC4.H7.21 Power
supply unit PSU72 540 One phase L2 2,347826087 10
F79
OBC4.H7.31 Power
supply unit PSU370 540 One phase L3 2,347826087 10
F80
OBC4.H7.41 Power
supply unit PSU370 540 One phase L1 2,347826087 10
F81 Free
One phase L2 0 0
F82 Free
One phase L3 0 0
F83 Free
One phase L1 0 0
F84 Free
One phase L2 0 0
F85 RTU-cabin 0 One phase L3 0 10
F86
Control circuits in
central 0 One phase L1 0 6
F87 Rect. 1 0 One phase L2 0 6
F88 Free
One phase L3 0 0
Table B-2 Shows the uninterruptible current needed for phase L1, L2 and L3 in signal box 300.
Phases Sum uninterruptible current need [A]
L1 18,22825706
L2 13,11521358
L3 13,11521358
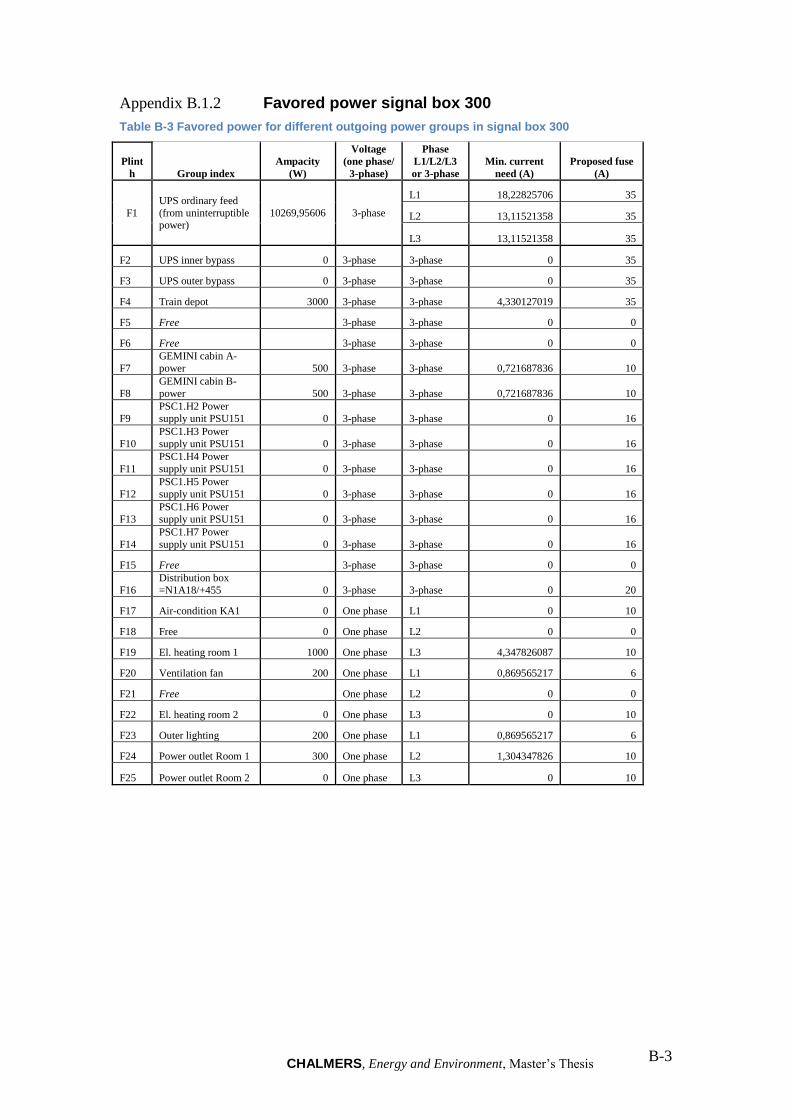
CHALMERS, Energy and Environment, Master’s Thesis B-3
Appendix B.1.2 Favored power signal box 300
Table B-3 Favored power for different outgoing power groups in signal box 300
Plint
h Group index
Ampacity
(W)
Voltage
(one phase/
3-phase)
Phase
L1/L2/L3
or 3-phase
Min. current
need (A)
Proposed fuse
(A)
F1
UPS ordinary feed
(from uninterruptible power)
10269,95606 3-phase
L1 18,22825706 35
L2 13,11521358 35
L3 13,11521358 35
F2 UPS inner bypass 0 3-phase 3-phase 0 35
F3 UPS outer bypass 0 3-phase 3-phase 0 35
F4 Train depot 3000 3-phase 3-phase 4,330127019 35
F5 Free 3-phase 3-phase 0 0
F6 Free 3-phase 3-phase 0 0
F7
GEMINI cabin A-
power 500 3-phase 3-phase 0,721687836 10
F8
GEMINI cabin B-
power 500 3-phase 3-phase 0,721687836 10
F9
PSC1.H2 Power
supply unit PSU151 0 3-phase 3-phase 0 16
F10
PSC1.H3 Power
supply unit PSU151 0 3-phase 3-phase 0 16
F11
PSC1.H4 Power
supply unit PSU151 0 3-phase 3-phase 0 16
F12
PSC1.H5 Power
supply unit PSU151 0 3-phase 3-phase 0 16
F13
PSC1.H6 Power
supply unit PSU151 0 3-phase 3-phase 0 16
F14
PSC1.H7 Power
supply unit PSU151 0 3-phase 3-phase 0 16
F15 Free 3-phase 3-phase 0 0
F16
Distribution box
=N1A18/+455 0 3-phase 3-phase 0 20
F17 Air-condition KA1 0 One phase L1 0 10
F18 Free 0 One phase L2 0 0
F19 El. heating room 1 1000 One phase L3 4,347826087 10
F20 Ventilation fan 200 One phase L1 0,869565217 6
F21 Free One phase L2 0 0
F22 El. heating room 2 0 One phase L3 0 10
F23 Outer lighting 200 One phase L1 0,869565217 6
F24 Power outlet Room 1 300 One phase L2 1,304347826 10
F25 Power outlet Room 2 0 One phase L3 0 10
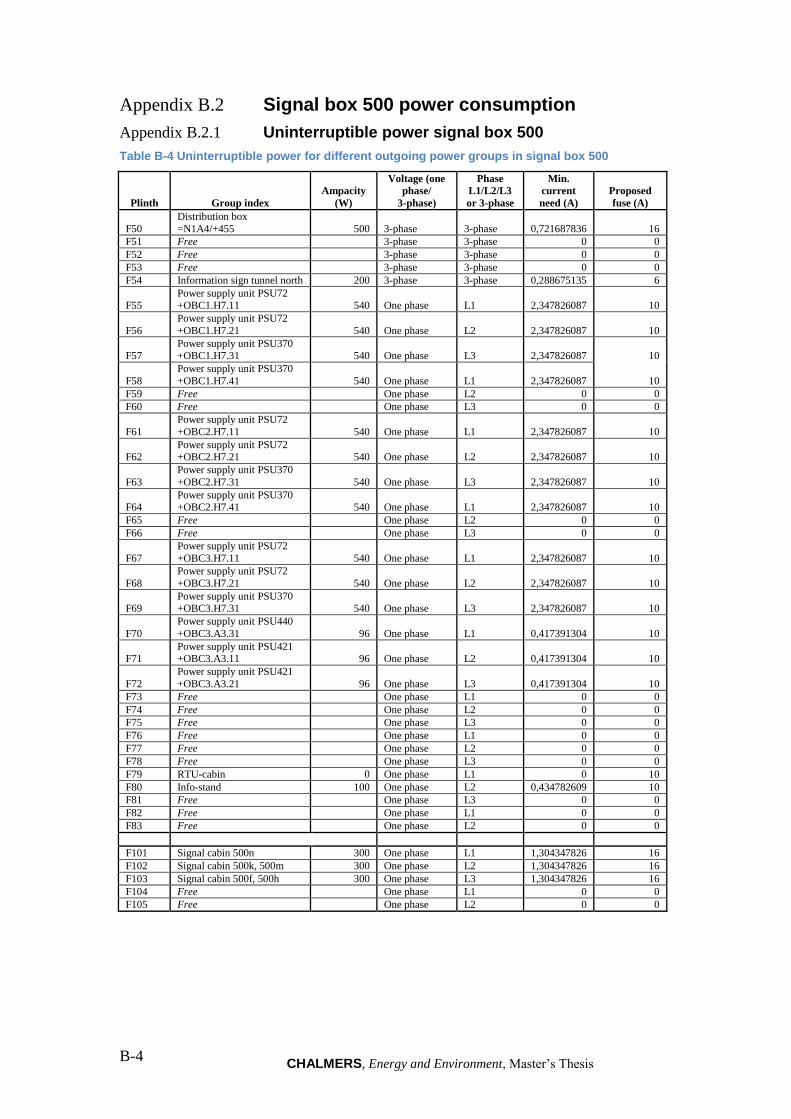
CHALMERS, Energy and Environment, Master’s Thesis B-4
Appendix B.2 Signal box 500 power consumption
Appendix B.2.1 Uninterruptible power signal box 500
Table B-4 Uninterruptible power for different outgoing power groups in signal box 500
Plinth Group index
Ampacity
(W)
Voltage (one
phase/
3-phase)
Phase
L1/L2/L3
or 3-phase
Min.
current
need (A)
Proposed
fuse (A)
F50
Distribution box
=N1A4/+455 500 3-phase 3-phase 0,721687836 16
F51 Free 3-phase 3-phase 0 0
F52 Free 3-phase 3-phase 0 0
F53 Free 3-phase 3-phase 0 0
F54 Information sign tunnel north 200 3-phase 3-phase 0,288675135 6
F55
Power supply unit PSU72
+OBC1.H7.11 540 One phase L1 2,347826087 10
F56
Power supply unit PSU72
+OBC1.H7.21 540 One phase L2 2,347826087 10
F57 Power supply unit PSU370 +OBC1.H7.31 540 One phase L3 2,347826087 10
F58
Power supply unit PSU370
+OBC1.H7.41 540 One phase L1 2,347826087 10
F59 Free One phase L2 0 0
F60 Free One phase L3 0 0
F61
Power supply unit PSU72
+OBC2.H7.11 540 One phase L1 2,347826087 10
F62 Power supply unit PSU72 +OBC2.H7.21 540 One phase L2 2,347826087 10
F63
Power supply unit PSU370
+OBC2.H7.31 540 One phase L3 2,347826087 10
F64
Power supply unit PSU370
+OBC2.H7.41 540 One phase L1 2,347826087 10
F65 Free One phase L2 0 0
F66 Free One phase L3 0 0
F67
Power supply unit PSU72
+OBC3.H7.11 540 One phase L1 2,347826087 10
F68
Power supply unit PSU72
+OBC3.H7.21 540 One phase L2 2,347826087 10
F69 Power supply unit PSU370 +OBC3.H7.31 540 One phase L3 2,347826087 10
F70
Power supply unit PSU440
+OBC3.A3.31 96 One phase L1 0,417391304 10
F71 Power supply unit PSU421 +OBC3.A3.11 96 One phase L2 0,417391304 10
F72
Power supply unit PSU421
+OBC3.A3.21 96 One phase L3 0,417391304 10
F73 Free One phase L1 0 0
F74 Free One phase L2 0 0
F75 Free One phase L3 0 0
F76 Free One phase L1 0 0
F77 Free One phase L2 0 0
F78 Free One phase L3 0 0
F79 RTU-cabin 0 One phase L1 0 10
F80 Info-stand 100 One phase L2 0,434782609 10
F81 Free One phase L3 0 0
F82 Free One phase L1 0 0
F83 Free One phase L2 0 0
F101 Signal cabin 500n 300 One phase L1 1,304347826 16
F102 Signal cabin 500k, 500m 300 One phase L2 1,304347826 16
F103 Signal cabin 500f, 500h 300 One phase L3 1,304347826 16
F104 Free One phase L1 0 0
F105 Free One phase L2 0 0
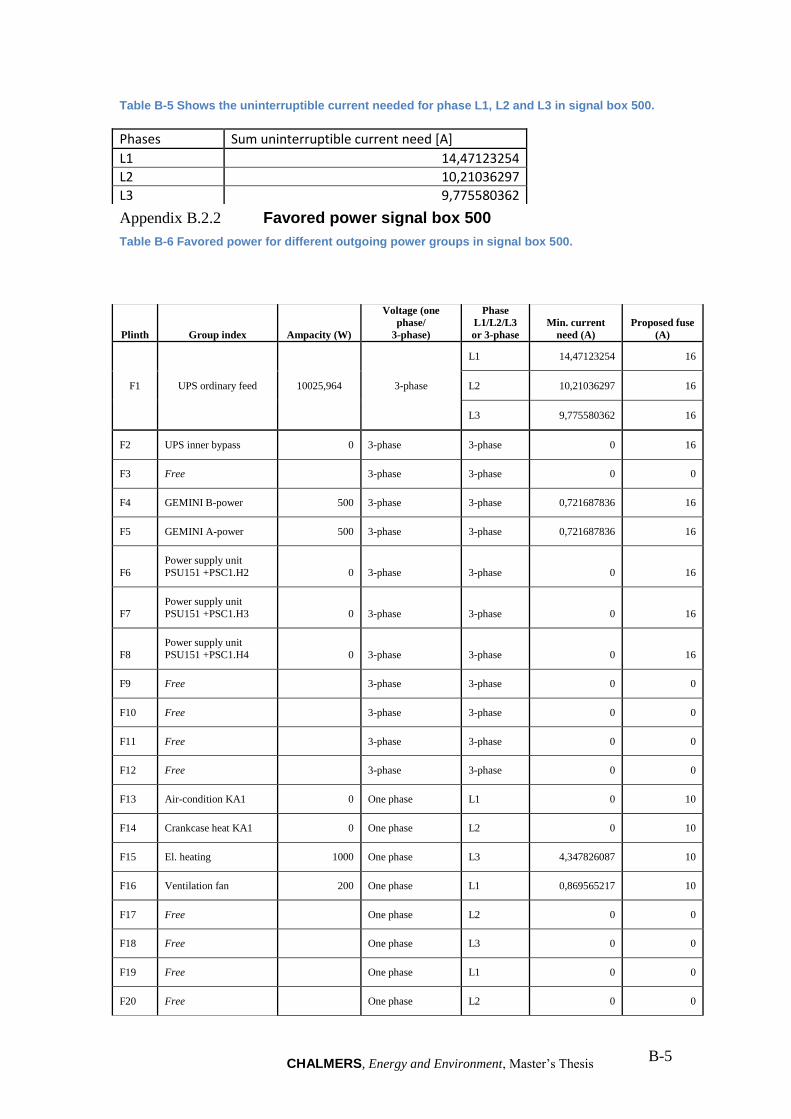
CHALMERS, Energy and Environment, Master’s Thesis B-5
Table B-5 Shows the uninterruptible current needed for phase L1, L2 and L3 in signal box 500.
Appendix B.2.2 Favored power signal box 500
Table B-6 Favored power for different outgoing power groups in signal box 500.
Phases Sum uninterruptible current need [A]
L1 14,47123254
L2 10,21036297
L3 9,775580362
Plinth Group index Ampacity (W)
Voltage (one
phase/
3-phase)
Phase
L1/L2/L3
or 3-phase
Min. current
need (A)
Proposed fuse
(A)
F1 UPS ordinary feed 10025,964 3-phase
L1 14,47123254 16
L2 10,21036297 16
L3 9,775580362 16
F2 UPS inner bypass 0 3-phase 3-phase 0 16
F3 Free 3-phase 3-phase 0 0
F4 GEMINI B-power 500 3-phase 3-phase 0,721687836 16
F5 GEMINI A-power 500 3-phase 3-phase 0,721687836 16
F6
Power supply unit
PSU151 +PSC1.H2 0 3-phase 3-phase 0 16
F7
Power supply unit
PSU151 +PSC1.H3 0 3-phase 3-phase 0 16
F8
Power supply unit
PSU151 +PSC1.H4 0 3-phase 3-phase 0 16
F9 Free 3-phase 3-phase 0 0
F10 Free 3-phase 3-phase 0 0
F11 Free 3-phase 3-phase 0 0
F12 Free 3-phase 3-phase 0 0
F13 Air-condition KA1 0 One phase L1 0 10
F14 Crankcase heat KA1 0 One phase L2 0 10
F15 El. heating 1000 One phase L3 4,347826087 10
F16 Ventilation fan 200 One phase L1 0,869565217 10
F17 Free One phase L2 0 0
F18 Free One phase L3 0 0
F19 Free One phase L1 0 0
F20 Free One phase L2 0 0

CHALMERS, Energy and Environment, Master’s Thesis B-6
Table B-6 cont.
F21 Control circuits in central 0 One phase L3 0 10
F22 by JF1 0 One phase L1 0 0
F23
Power outlet and outer
lighting by JF2 200 One phase L2 0,869565217 10
F24 Lighting 200 One phase L3 0,869565217 10
F25 Power outlet room 2 300 One phase L1 1,304347826 10
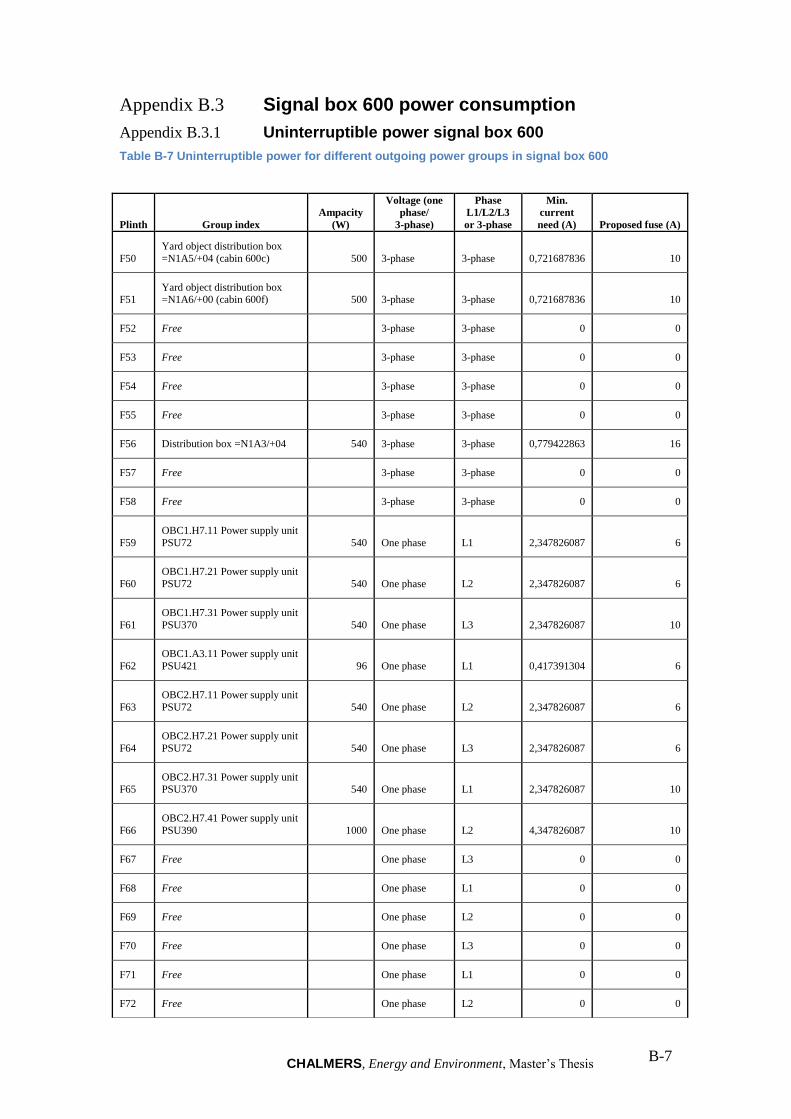
CHALMERS, Energy and Environment, Master’s Thesis B-7
Appendix B.3 Signal box 600 power consumption
Appendix B.3.1 Uninterruptible power signal box 600
Table B-7 Uninterruptible power for different outgoing power groups in signal box 600
Plinth Group index
Ampacity
(W)
Voltage (one
phase/
3-phase)
Phase
L1/L2/L3
or 3-phase
Min.
current
need (A) Proposed fuse (A)
F50
Yard object distribution box
=N1A5/+04 (cabin 600c) 500 3-phase 3-phase 0,721687836 10
F51 Yard object distribution box =N1A6/+00 (cabin 600f) 500 3-phase 3-phase 0,721687836 10
F52 Free 3-phase 3-phase 0 0
F53 Free 3-phase 3-phase 0 0
F54 Free 3-phase 3-phase 0 0
F55 Free 3-phase 3-phase 0 0
F56 Distribution box =N1A3/+04 540 3-phase 3-phase 0,779422863 16
F57 Free 3-phase 3-phase 0 0
F58 Free 3-phase 3-phase 0 0
F59
OBC1.H7.11 Power supply unit
PSU72 540 One phase L1 2,347826087 6
F60
OBC1.H7.21 Power supply unit
PSU72 540 One phase L2 2,347826087 6
F61
OBC1.H7.31 Power supply unit
PSU370 540 One phase L3 2,347826087 10
F62
OBC1.A3.11 Power supply unit
PSU421 96 One phase L1 0,417391304 6
F63
OBC2.H7.11 Power supply unit
PSU72 540 One phase L2 2,347826087 6
F64
OBC2.H7.21 Power supply unit
PSU72 540 One phase L3 2,347826087 6
F65 OBC2.H7.31 Power supply unit PSU370 540 One phase L1 2,347826087 10
F66
OBC2.H7.41 Power supply unit
PSU390 1000 One phase L2 4,347826087 10
F67 Free One phase L3 0 0
F68 Free One phase L1 0 0
F69 Free One phase L2 0 0
F70 Free One phase L3 0 0
F71 Free One phase L1 0 0
F72 Free One phase L2 0 0

CHALMERS, Energy and Environment, Master’s Thesis B-8
Table B-7 cont.
Table B-8 Shows the uninterruptible current needed for phase L1, L2 and L3 in signal box 600.
Appendix B.3.2 Favored power signal box 600
Table B-9 Favored power for different outgoing power groups in signal box 600
F73 Free One phase L3 0 0
F74 Free One phase L1 0 0
F75 RTU-cabin 0 One phase L2 0 10
F76 Free One phase L3 0 0
F77
Control circuits in central page.
30 0 One phase L1 0 6
F78 rec. 1 page. 30 0 One phase L2 0 6
F79 Lighting 200 One phase L3 0,869565217 10
Phases Sum uninterruptible current need [A]
L1 7,335842015
L2 11,2662768
L3 7,788015928
Plinth Group index Ampacity (W)
Voltage (one
phase/
3-phase)
Phase
L1/L2/L3
or 3-phase
Min. current need
(A)
Proposed
fuse (A)
F1 UPS ordinary feed 5082,420434 3-phase
L1 7,335842015 25
L2 11,2662768 25
L3 7,788015928 25
F2 UPS inner bypass 0 3-phase 3-phase 0 25
F3 UPS outer bypass 0 3-phase 3-phase 0 25
F4 Free 3-phase 3-phase 0 0
F5 Free 3-phase 3-phase 0 0
F6 Free 3-phase 3-phase 0 0
F7
GEMINI cabin A-
power 500 3-phase 3-phase 0,721687836 10
F8
GEMINI cabin B-
power 500 3-phase 3-phase 0,721687836 10

CHALMERS, Energy and Environment, Master’s Thesis B-9
Table B-9 cont.
F9
PSC1.H2 Power supply unit
PSU151 0 3-phase 3-phase 0 16
F10
PSC1.H3 Power
supply unit PSU151 0 3-phase 3-phase 0 16
F11
PSC1.H4 Power
supply unit PSU151 0 3-phase 3-phase 0 16
F12 Free 3-phase 3-phase 0 0
F13 Free 3-phase 3-phase 0 0
F14 Free 3-phase 3-phase 0 0
F15 Free 3-phase 3-phase 0 0
F16 Free 3-phase 3-phase 0 0
F17
Air-condition
KA1 1000 3-phase L1 1,443375673 10
F18
Crankcase heater
KA1 500 One phase L2 2,173913043 6
F19 El. heater 0 One phase L3 0 10
F20 Ventilation fan 200 One phase L1 0,869565217 6
F21 Free One phase L2 0 0
F22 Free One phase L3 0 0
F23 Free One phase L1 0 0
F24 Free One phase L2 0 10
F25
Power outlet and
outer lighting 300 One phase L3 1,304347826 10

CHALMERS, Energy and Environment, Master’s Thesis C-1
Appendix C Function values for railway switches
Figure C-1 Function values for traction and slip current for different kind of switches. English from left to right: type of switch, motor, stroke length, traction during slip, slip current [42].

CHALMERS, Energy and Environment, Master’s Thesis D-1
Appendix D Nominal current values for Fuses
Table D-1 Nominal current values for Hicap Eco gG 6-100A 500 V~ at different melting times [43]
Rated current
Meltind times
0,01 sec.
0,04 sec.
0,08 sec.
0,1 sec.
0,4 sec.
1 sec.
2 sec.
3 sec.
5 sec.
10 sec.
20 sec.
30 sec.
50 sec. 1 h
6A 84A 52A 42A 40A 29A 24A 20A 19A 17A 16A 14A 13A 13A 10A
10A 162A 102A 83A 77A 54A 43A 37A 34A 31A 28A 25A 24A 22A 16A
16A 234A 147A 120A 113A 80A 65A 56A 51A 46A 40A 36A 34A 32A 23A
20A 302A 189A 152A 141A 100A 82A 70A 64A 57A 51A 45A 42A 40A 29A
25A 421A 257A 206A 192A 128A 102A 87A 79A 71A 63A 57A 53A 50A 36A
32A 566A 338A 266A 248A 166A 131A 112A 102A 92A 82A 74A 69A 64A 46A
35A 620A 381A 305A 280A 185A 147A 124A 113A 102A 90A 81A 76A 72A 51A
40A 736A 456A 357A 338A 217A 173A 146A 132A 119A 105A 94A 88A 83A 58A
50A 982A 593A 469A 438A 292A 233A 199A 180A 163A 144A 129A 120A 112A 75A
63A 1127A 701A 564A 516A 258A 293A 253A 232A 290A 187A 164A 154A 141A 94A
80A 1547A 1032A 856A 802A 564A 452A 380A 352A 314A 276A 247A 226A 207A 119A
100A 2047A 1363A 1126A 1053A 732A 585A 498A 445A 395A 344A 300A 276A 253A 142A

CHALMERS, Energy and Environment, Master’s Thesis E-1
Appendix E Pre-arcing- and total I2t-values
Figure E-1 Pre-arcing- and total I2t-values for fuses type Hicap Eco gG 6-800 A [44].

CHALMERS, Energy and Environment, Master’s Thesis E-2


